Article

Risk Assessment of Irrigation-Related Soil Salinization and Sodification in Mediterranean Areas

1
Escola Superior Agrária, Instituto Politécnico de Beja, R. Pedro Soares S/N, 7800-295 Beja, Portugal
2
GeoBioTec, Universidade Nova de Lisboa, Campus da Caparica, 2829-516 Caparica, Portugal
3
Instituto de Ciências da Terra (ICT), IIFA, Universidade de Évora, 7000-671 Évora, Portugal
4
LEAF—Centro de Investigação em Agronomia, Alimentos, Ambiente e Paisagem, Instituto Superior de Agronomia, Universidade de Lisboa, 1349-017 Lisboa, Portugal
5
Departamento de Física, Escola de Ciências e Tecnologia, Universidade de Évora, 7000-671 Évora, Portugal
6
Earth Remote Sensing Laboratory (EaRSLab), Universidade de Évora, 7000-671 Évora, Portugal
*
Author to whom correspondence should be addressed.
Water 2020, 12(12), 3569; https://doi.org/10.3390/w12123569
Submission received: 27 November 2020 / Revised: 15 December 2020 / Accepted: 16 December 2020 / Published: 19 December 2020

Abstract

:
Salinization and sodification are important processes of soil degradation affecting irrigated lands. A large proportion of the global irrigated area is affected by some degree of soil salinity or sodicity caused by the intensification of irrigation. The increase of the frequency of adverse climatic conditions, like high temperatures and variations in precipitation patterns caused by climate change, will potentially amplify these processes in arid, semi-arid, and Mediterranean areas. The use of integrated approaches for the spatial and temporal prediction of the risk of salinization and sodification in irrigated areas is of great value, helping in the decision-making regarding land uses and choice of more suitable agricultural practices. In this study, based on key criteria for the assessment of irrigation-related salinization processes (e.g., climate, topography, soil drainage, water quality for irrigation, and crop irrigation method), we developed a methodology for the prediction of soil salinity and sodicity risk in irrigated lands, using two composite indices, the Salinization Risk (RSA) index and the Sodification Risk (RSO) index. The application of these indices to a real scenario (a Mediterranean area in Southern Portugal) showed that 67% of the potentially irrigated area presented a low risk of salinity development, 68% had a moderate risk of sodification, and 16% was of high risk of sodicity development. Areas under moderate risk of salinization (26%) were mostly characterized by low slopes and fine-textured soils, like Luvisols and Vertisols, with limited drainage conditions. Areas with high risk of soil sodification presented a large incidence of low slope terrain, moderate-to-restricted soil drainage, in high clay content Luvisols, Vertisols and Cambisols, and land use dominated by annual crops irrigated with surface or sprinkler systems. These risk prediction tools have the potential to be used for resource use planning by policymakers and on-farm management decision by farmers, contributing to the sustainability of irrigated agriculture in Mediterranean regions.

Graphical Abstract

1. Introduction

Salinization and sodification are major processes of soil degradation threatening land productivity and global food security [1]. Salt-induced land degradation is common in arid and semi-arid regions, where rainfall is insufficient to maintain percolation of rainwater through the soil and irrigation is practiced without adequate drainage [2]. The growing development of irrigated agriculture in arid and semi-arid lands has been essential for the food supply demanded by a growing world population. Over the last 50 years, the world’s net cultivated area has grown 12%, and in the same period, the global irrigated area has doubled [3]. At present, about 20% of the world agricultural land is irrigated and this land produces 40% of the world food supply [4]. Although the undisputable contribution of irrigation for the increase in food production, in areas where precipitation is scarce or irregular, irrigated agriculture can cause a disharmony with the nature of dry regions’ ecology, negatively affecting the quality of soils and water [3,5,6,7]. At present, it is estimated that more than 20% of the global irrigated area is affected by salinization caused by irrigation; in some countries, salt-affected soils occur in more than half of the irrigated land [2]. In the Mediterranean area, 25% of irrigated cropland is affected by moderate-to-high salinization, leading to moderate soil degradation [8], and adverse climatic conditions, like temperature increase and changes in the regional precipitation patterns, are likely to enhance the problem of salinization [9,10,11,12].
According to Rengasamy [13], there are three types of salinity, based on the processes of salt accumulation: (i) groundwater-associated salinity, occurring in discharge areas of the landscape, where water tables are close to the surface and evaporation leads to the upward movement of water and salts; (ii) non-groundwater-associated salinity, that occurs in landscapes with deep water table and poor drainage, when salts introduced by rain, weathering, and aeolian deposits are stored within the soil solum; and (iii) irrigation-associated salinity, when salts are introduced by irrigation water and accumulate within the root zone due to insufficient leaching. Certain factors lead to the acceleration of irrigation-induced salinity, like the poor-quality irrigation water, low hydraulic conductivity of soil layers, as found in heavy clay soils, and sodic soils, under high evaporative conditions.
Whether it is of natural genesis or induced by human activities, the progressive nature of salt-affected soils is a constraint for its early detection, and, although there are several reclamation techniques, the prevention of salt accumulation is more advisable than soil desalinization [14,15]. According to Eckelmann et al. [16], the risk of salinization is defined as a measure of the probability and severity of the salinization/sodification due to human activities which adversely affects one or more soil functions. In agricultural regions, soil salinization varies widely, vertically, horizontally, and temporally, depending on conditions, such as the variation in soil texture, plant growth, irrigation water quality, hydraulic conductivity, and the irrigation system. In this sense, any risk assessment methodology must be based in meaningful indicators of soil and water quality, in order to assess whether or not a soil is potentially salt-affected [17].
Risk assessment methodologies can be performed at different levels of scale and related levels of information detail, in each case using different types of approaches, namely, a qualitative, quantitative, or model approach [17,18]. Simulation models that deal with the dynamic and transient condition of soil salinity [19,20] can predict the effect of multiple scenarios (e.g., climatic variables, quality and quantity of irrigation water, fertilization rates, soil properties) on soil salinization, computing water and salt balances in the soil and leaching requirements, supporting the optimization of agricultural practices and land management [19,20,21]. The complexity of some of these models, and the usual lack of input data, is a constraint to its application on large areas, and simple approaches are welcome to be used at national or regional scales [18,22]. Monitoring and assessment of soil salinity is decisive for effective adaptation and mitigation through land reclamation measures. At field level and at larger scales, mapping of salinity is required to establish the most appropriate irrigation and soil management practices, to delineate crop management zones, and for regional land management [23].
The appropriate assessment methods are directly related to the spatial scale of interest [22,23]. In a continental scale, Tóth et al. [24] generated a map of saline and sodic soils from the European Soil Database [25], for the delineation of areas in the European Union that are threatened by salinization or sodification. For large spatial scales, the use of remote sensing (RS) or geographic information systems (GIS) techniques has been reported in several studies, frequently in combination with physically based models, aiming to extend their prediction capabilities (for e.g., [15,26,27,28]). According to Zhou et al. [29], the use of risk indices or frameworks for soil salinity assessment may facilitate communication among scientists, policymakers, and practitioners by providing a basis for evaluating the environmental impact of agricultural practices and also government programs and policies. Frequently, these risk indices are GIS-based in order to ascertain priority areas, predict where it may occur in the future, and determine appropriate management options to mitigate salinity risk [30]. One of the earliest indices for the assessment of soil salinity risk was the Salinity Risk Index (SRI), proposed by Eilers et al. [31], later updated by Wiebe et al. [32] to evaluate the salinization risk trends on the Canadian Prairies. The SRI was composed of five risk factors: the current presence and extent of salinity, topography, soil drainage, aridity, and land use [31,32]. A four-component risk assessment framework for salinity prevention was proposed by Grundy et al. [33] for Queensland, Australia, where the components (current salinity stage, current land management, value of the assets under threat, and biophysical risk factors) interacted to give an overall salinity risk index. From this framework, Biggs et al. [30] developed a GIS-based system to assess the risk of salinity in the Condamine basin, Australia. Zhou et al. [29] presented a soil salinity risk assessment methodology by selecting a set of risk factors based on the conceptual Pressure–State–Response (PSR) sustainability framework of the Organisation for Economic Co-operation and Development (OECD) [34], where a set of fourteen risk factors were selected to develop a composite risk index for soil salinity in the Yinchuan Plain, China. Masoudi et al. [35] proposed a model for risk analysis of soil salinization for the Payab Basin, Iran, using GIS with the overlay of hazard maps of nine indicators as the causes of soil salinity (depth of water table, soil texture, slope, irrigation water quality, groundwater quality, efficacy of surface geology, climate, aridity index, status of soil salinity) to obtain a final risk map. Specifically for irrigated lands, similar salinization risk assessment methodologies were developed, using GIS, and considering irrigation water quality, soil properties, and climate indicators [15,24]. These methodologies have a dominant focus on the prediction of the development of saline soils, and the assessment of the risk of soil sodicity alone has generally received less attention [36]. Regardless of the modeling perspective or the soil deterioration problem to be predicted, the use of these integrated approaches evidenced its value for helping in decisionmaking regarding land resource management, allowing for the adoption of reclamation actions and the prediction of the spatial variation of irrigation-induced soil salinity and sodicity.
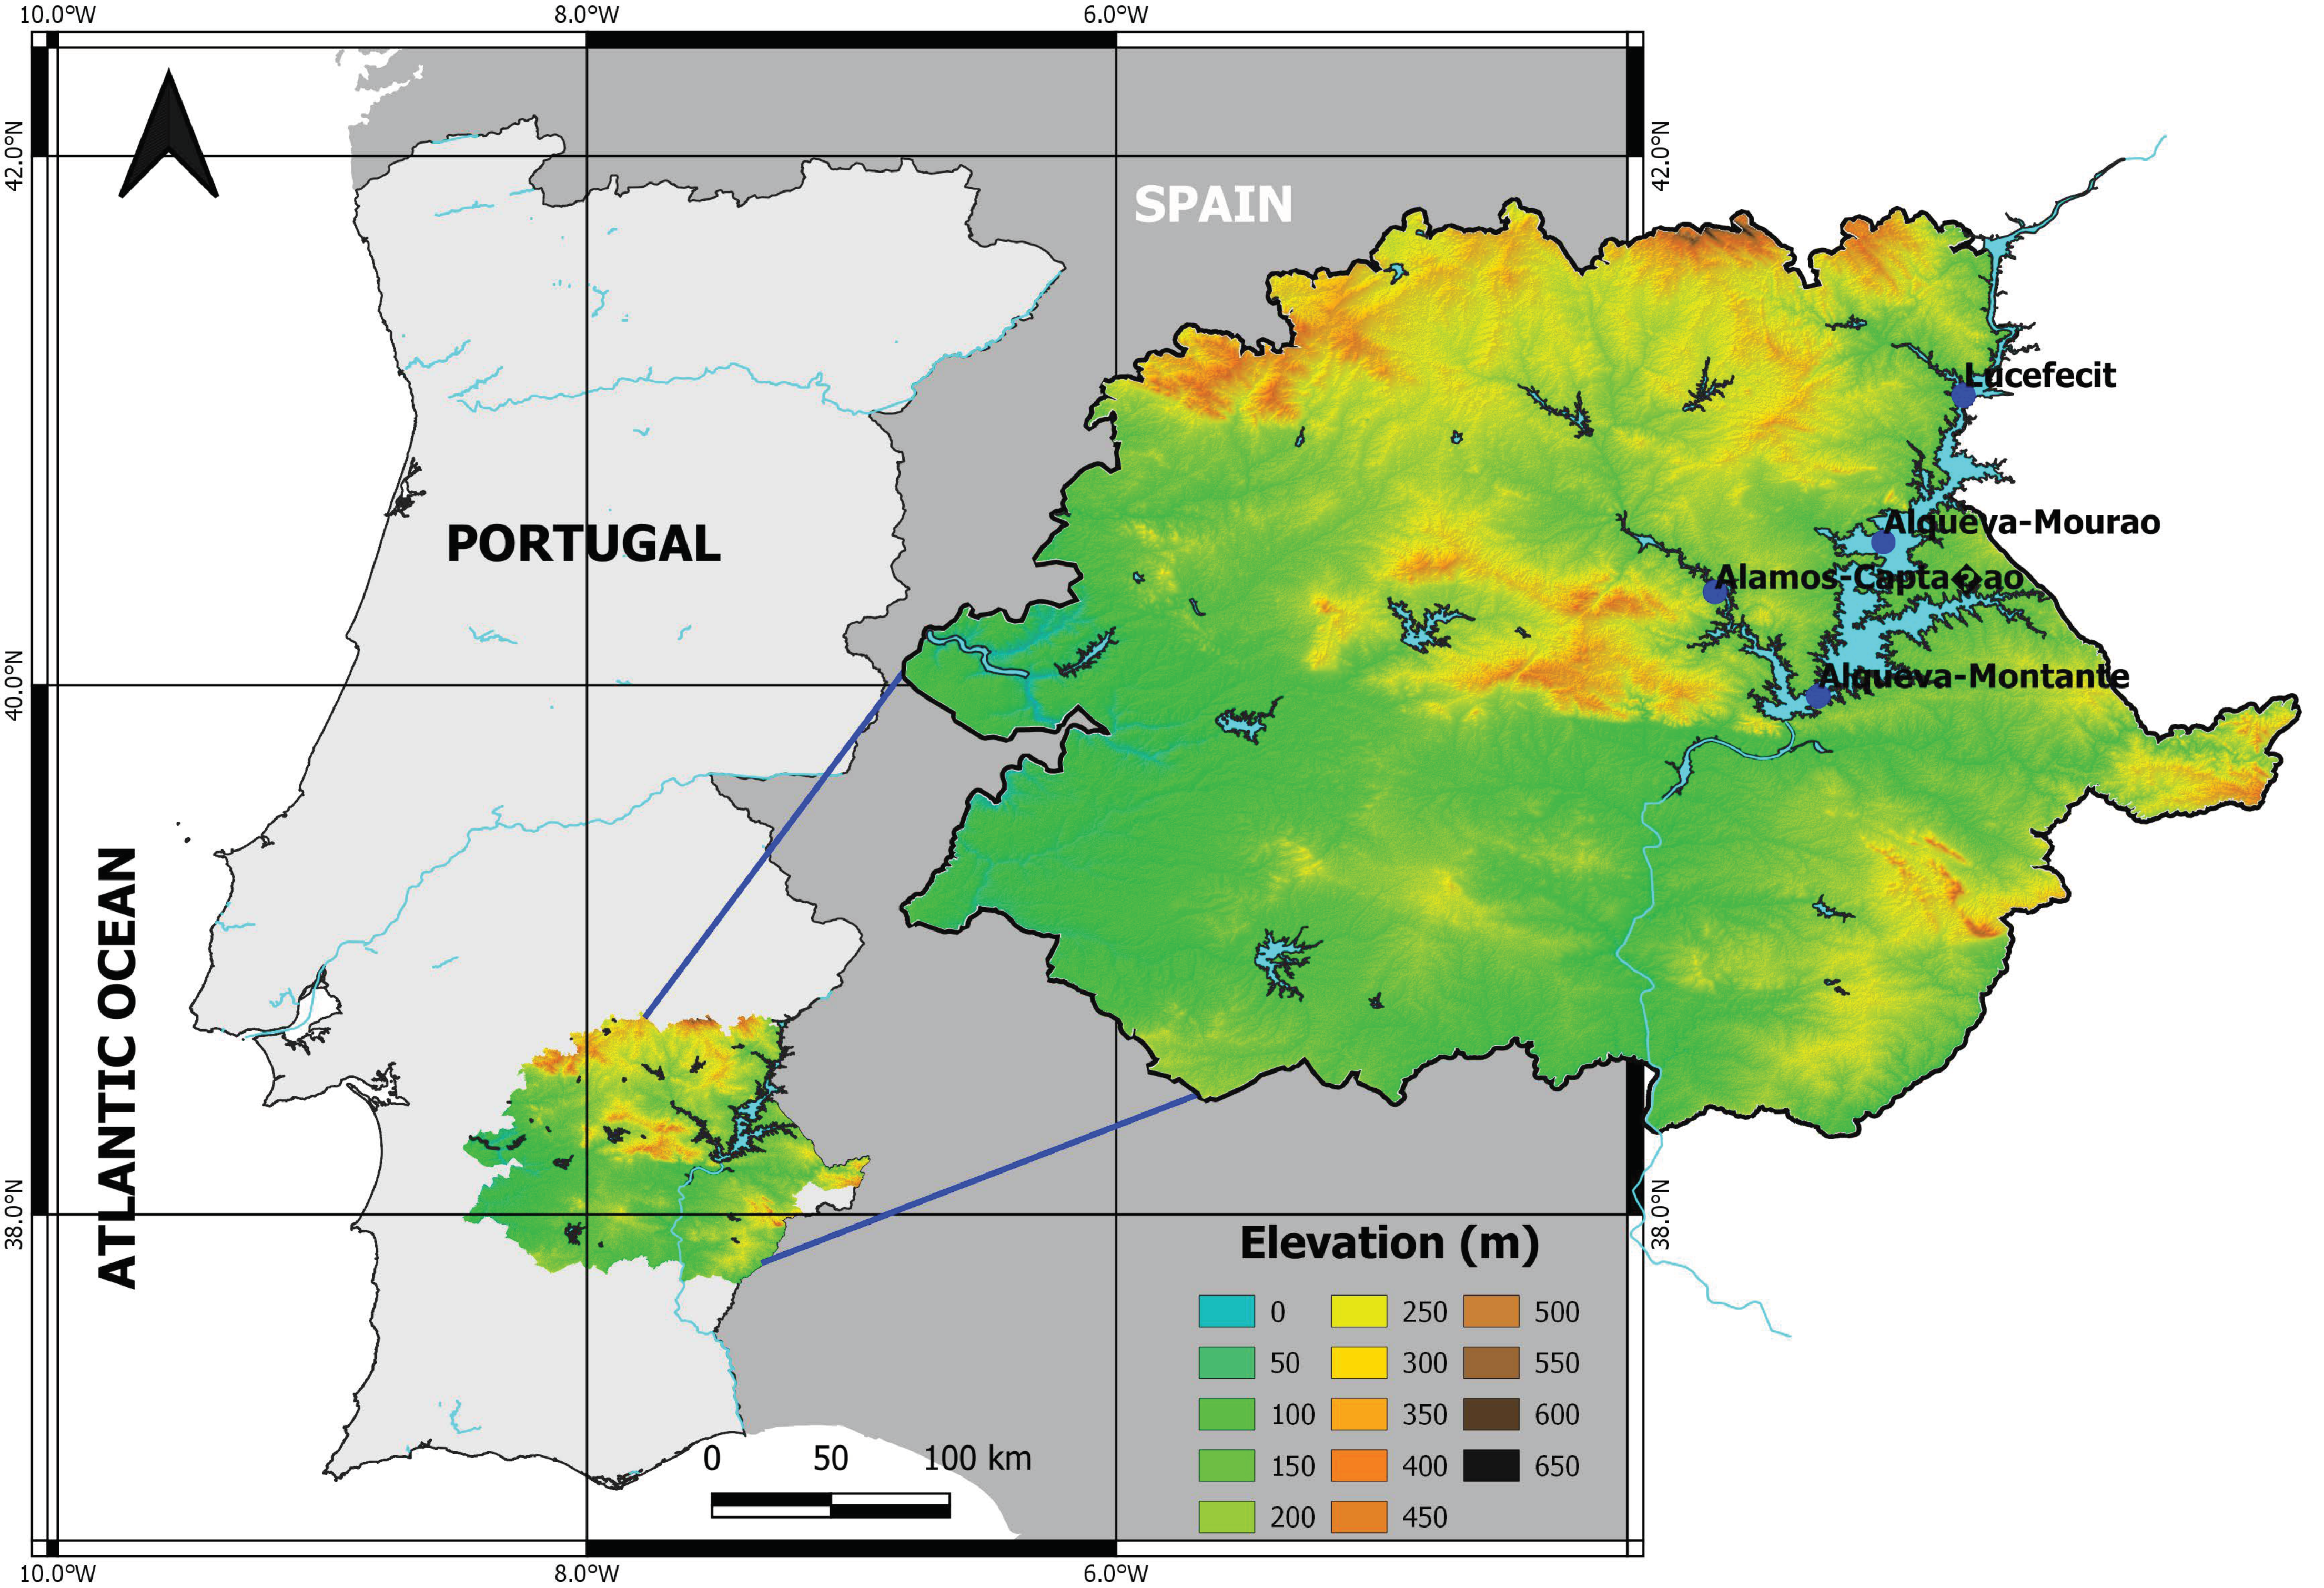
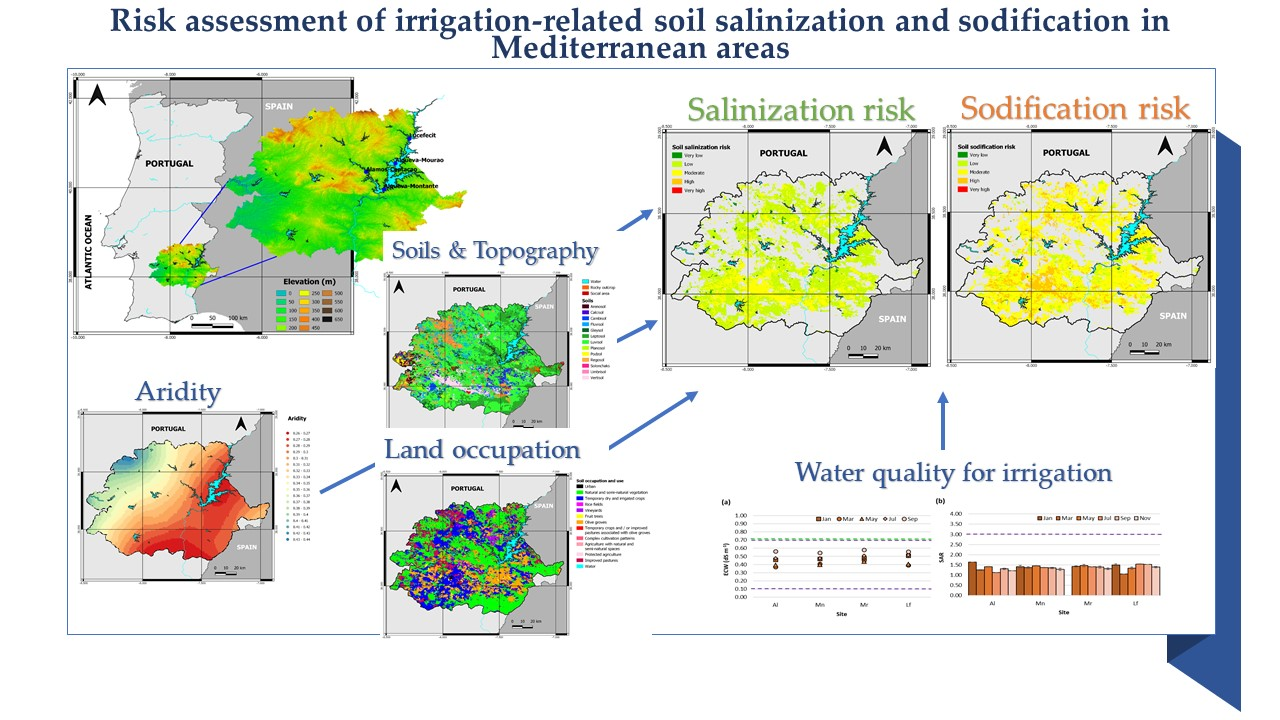
In this study, we aimed to: (i) present an overview of major criteria and respective indicators related with soil salinity and sodicity induced by irrigation; (ii) propose two composite risk indices, for soil salinization and soil sodification assessment in large areas, based on climate, irrigation water quality, soil information, and land-use data; (iii) present the risk indices when applied in a real scenario in a Mediterranean area in Southern Portugal.

2. Criteria and Indicators of Soil Salinization and Sodification

Indicators to predict soil salinization problems can be grouped following the common criteria for risk area identification according to soil threats [16] (Table 1), that considers a two-tiered approach, from a lower spatial resolution, less detailed and supported in available information, to a higher spatial resolution, requiring more detailed data and in situ measurements.
The most common soil salinity indicator is the electrical conductivity, usually measured in a saturation paste extract (ECe; dS m−1). Yield reduction of many crops can occur for ECe > 4 dS m−1, a condition that defines a saline soil [37]. In saline soils, the large osmotic potential values on soil solution hinder plant transpiration, diminishing water availability to plants, which results in physiological deteriorations. Crop salt tolerance is the ability of plants to survive and produce profitable yields under the adverse conditions caused by soil salinity [38]. Data of tolerance to salinity were first reported by Maas and Hoffman [39] for numerous crops, by quantifying salt tolerance using the threshold (or breakpoint) model, that can be presented in terms of percentage of the maximum yield, known as the relative production function Equation (1):
Y r = { 100 , i f E C e a 100 + b · ( E C e a ) , i f a < E C e < c 0 , i f E C e c ,
where Yr is the relative crop yield, with 100 being the maximum yield, a is the threshold (breakpoint) salinity (dS m−1), beyond which yield reduction will occur, ECe is the salinity of saturated soil extract, b is the slope, that represents the percentage of yield expected to be reduced for each unit of added salinity above the threshold salinity, and c is the level of soil salinity (dS m−1), above which the yield is zero. Values of a and b, and relative tolerance ratings for several crops, can be found in Maas and Grattan [40], indicating, e.g., that while wheat (Triticum aestivum L.) or olive (Olea europaea L.) are classified as moderately tolerant, grapevine (Vitis vinifera L.), almond (Prunus dulcis (Mill.) D.A. Webb) and a majority of vegetable crops are moderately sensitive to salinity, which increases the restrictions for their cultivation [41] and the need for appropriate irrigation management measures for these crops [42].
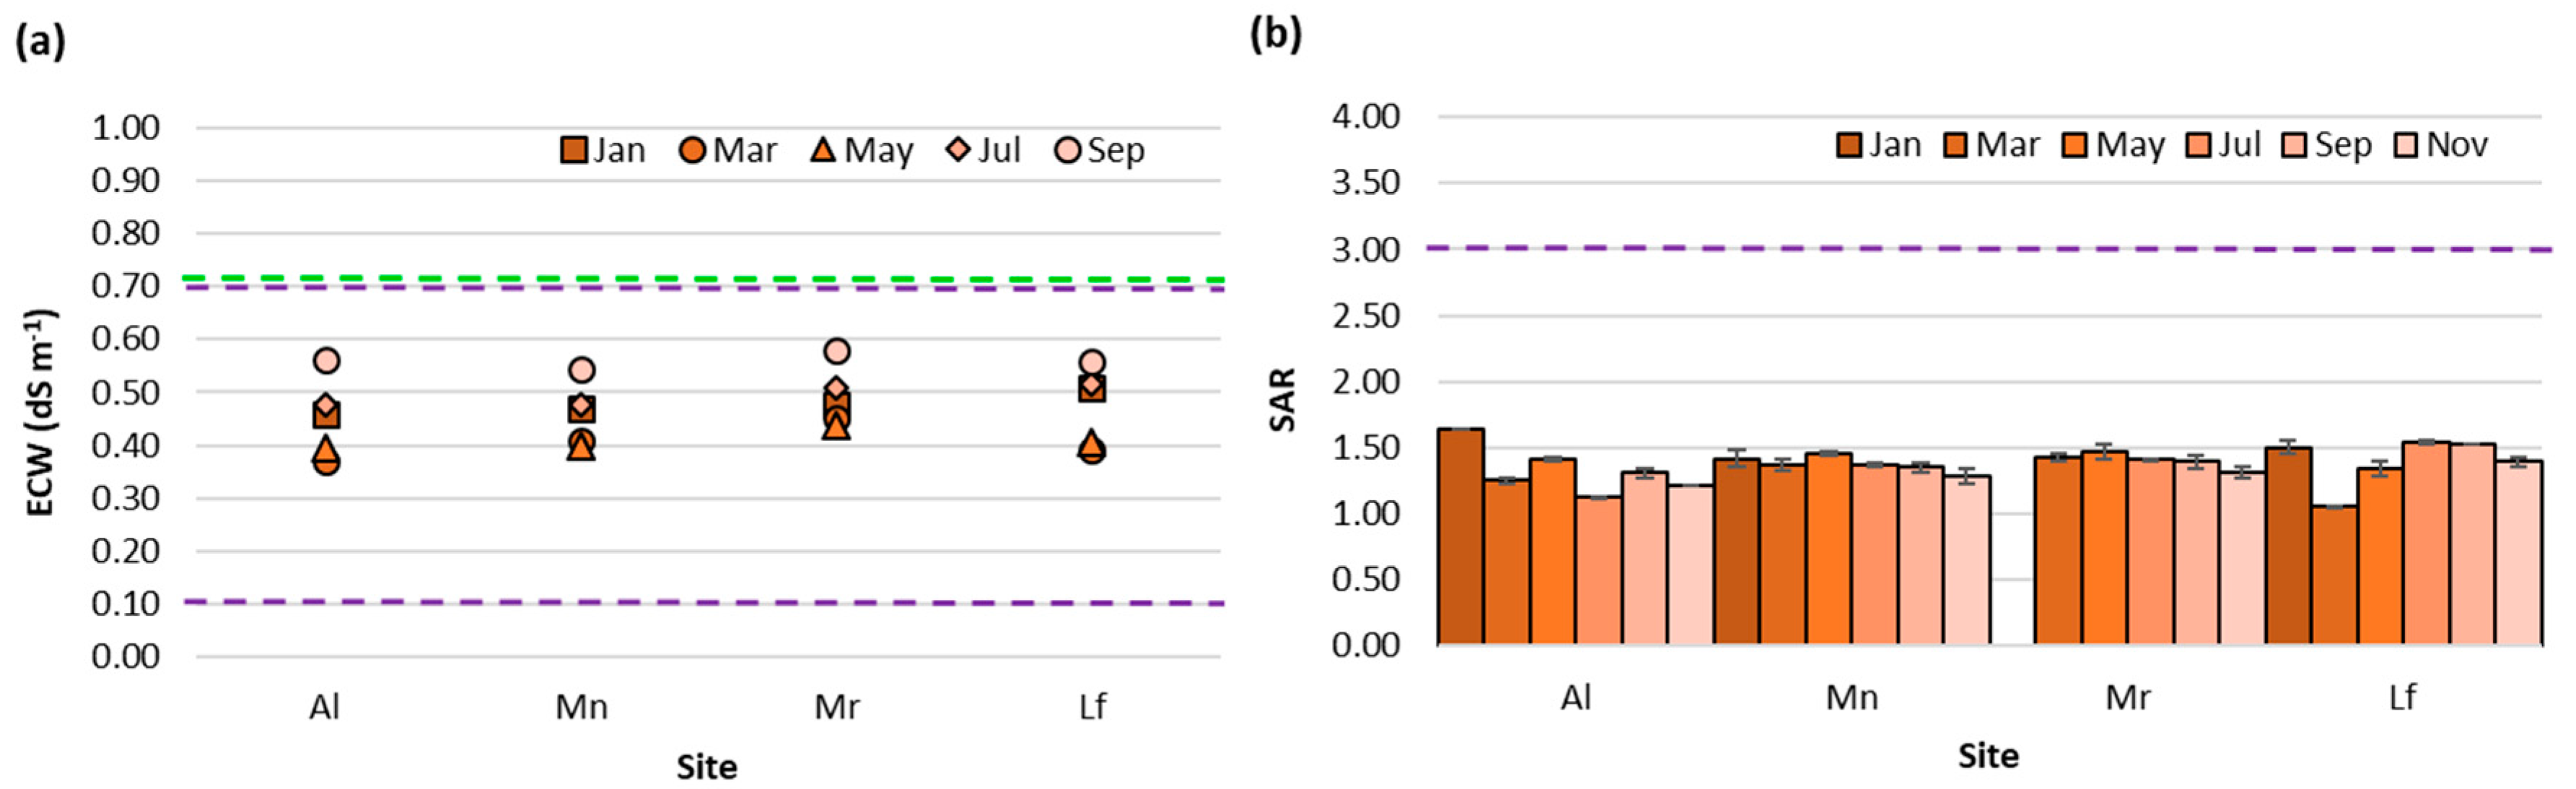
For sodic conditions, in addition to salinity diagnosis based upon ECe, the Sodium Adsorption Ratio (SAR) of the soil solution or of the irrigation water Equation (2) can be calculated [38]:
SAR = [ Na + ] [ Ca 2 + ] + [ Mg 2 + ] 2 ,
where [Na+], [Ca2+], and [Mg2+] are the concentrations (meq L−1) in the saturated soil paste extract or in the irrigation water. A sodic soil presents a SAR value of 13 or higher. When ECe > 4 dS m−1 and SAR > 13, the soil is classified as saline-sodic [37]. In sodic soils, the high exchangeable sodium in the soil complex causes dispersion of its colloids, structural destruction, and aggregate failure, resulting in unfavorable physical properties, like low infiltration rate and low hydraulic conductivity [9,13]. When the salinity of the soil water is insufficient to counteract the negative effects of adsorbed Na+ on soil structure, a “rainfall effect” [43] can occur. More specifically, the leaching of salts by precipitation or excess irrigation water reduces the salinity of the soil solution, while the reduction in exchangeable Na+ will be far smaller due to a buffer effect, performed by the exchangeable cations adsorbed in the soil matrix, causing, therefore, a reduction in the stabilizing effects of salinity on aggregate stability [5,22,44]. When dry, sodic soils become denser and structureless since natural aggregation is destroyed. At the soil surface, dispersed clay particles can act as adhesive, forming relatively dense crusts that impede seedling rooting and emergence. The degree of crusting depends on soil texture, the mineralogy of the clay, the exchangeable sodium content, the energy of raindrop impact, and the rate of drying [
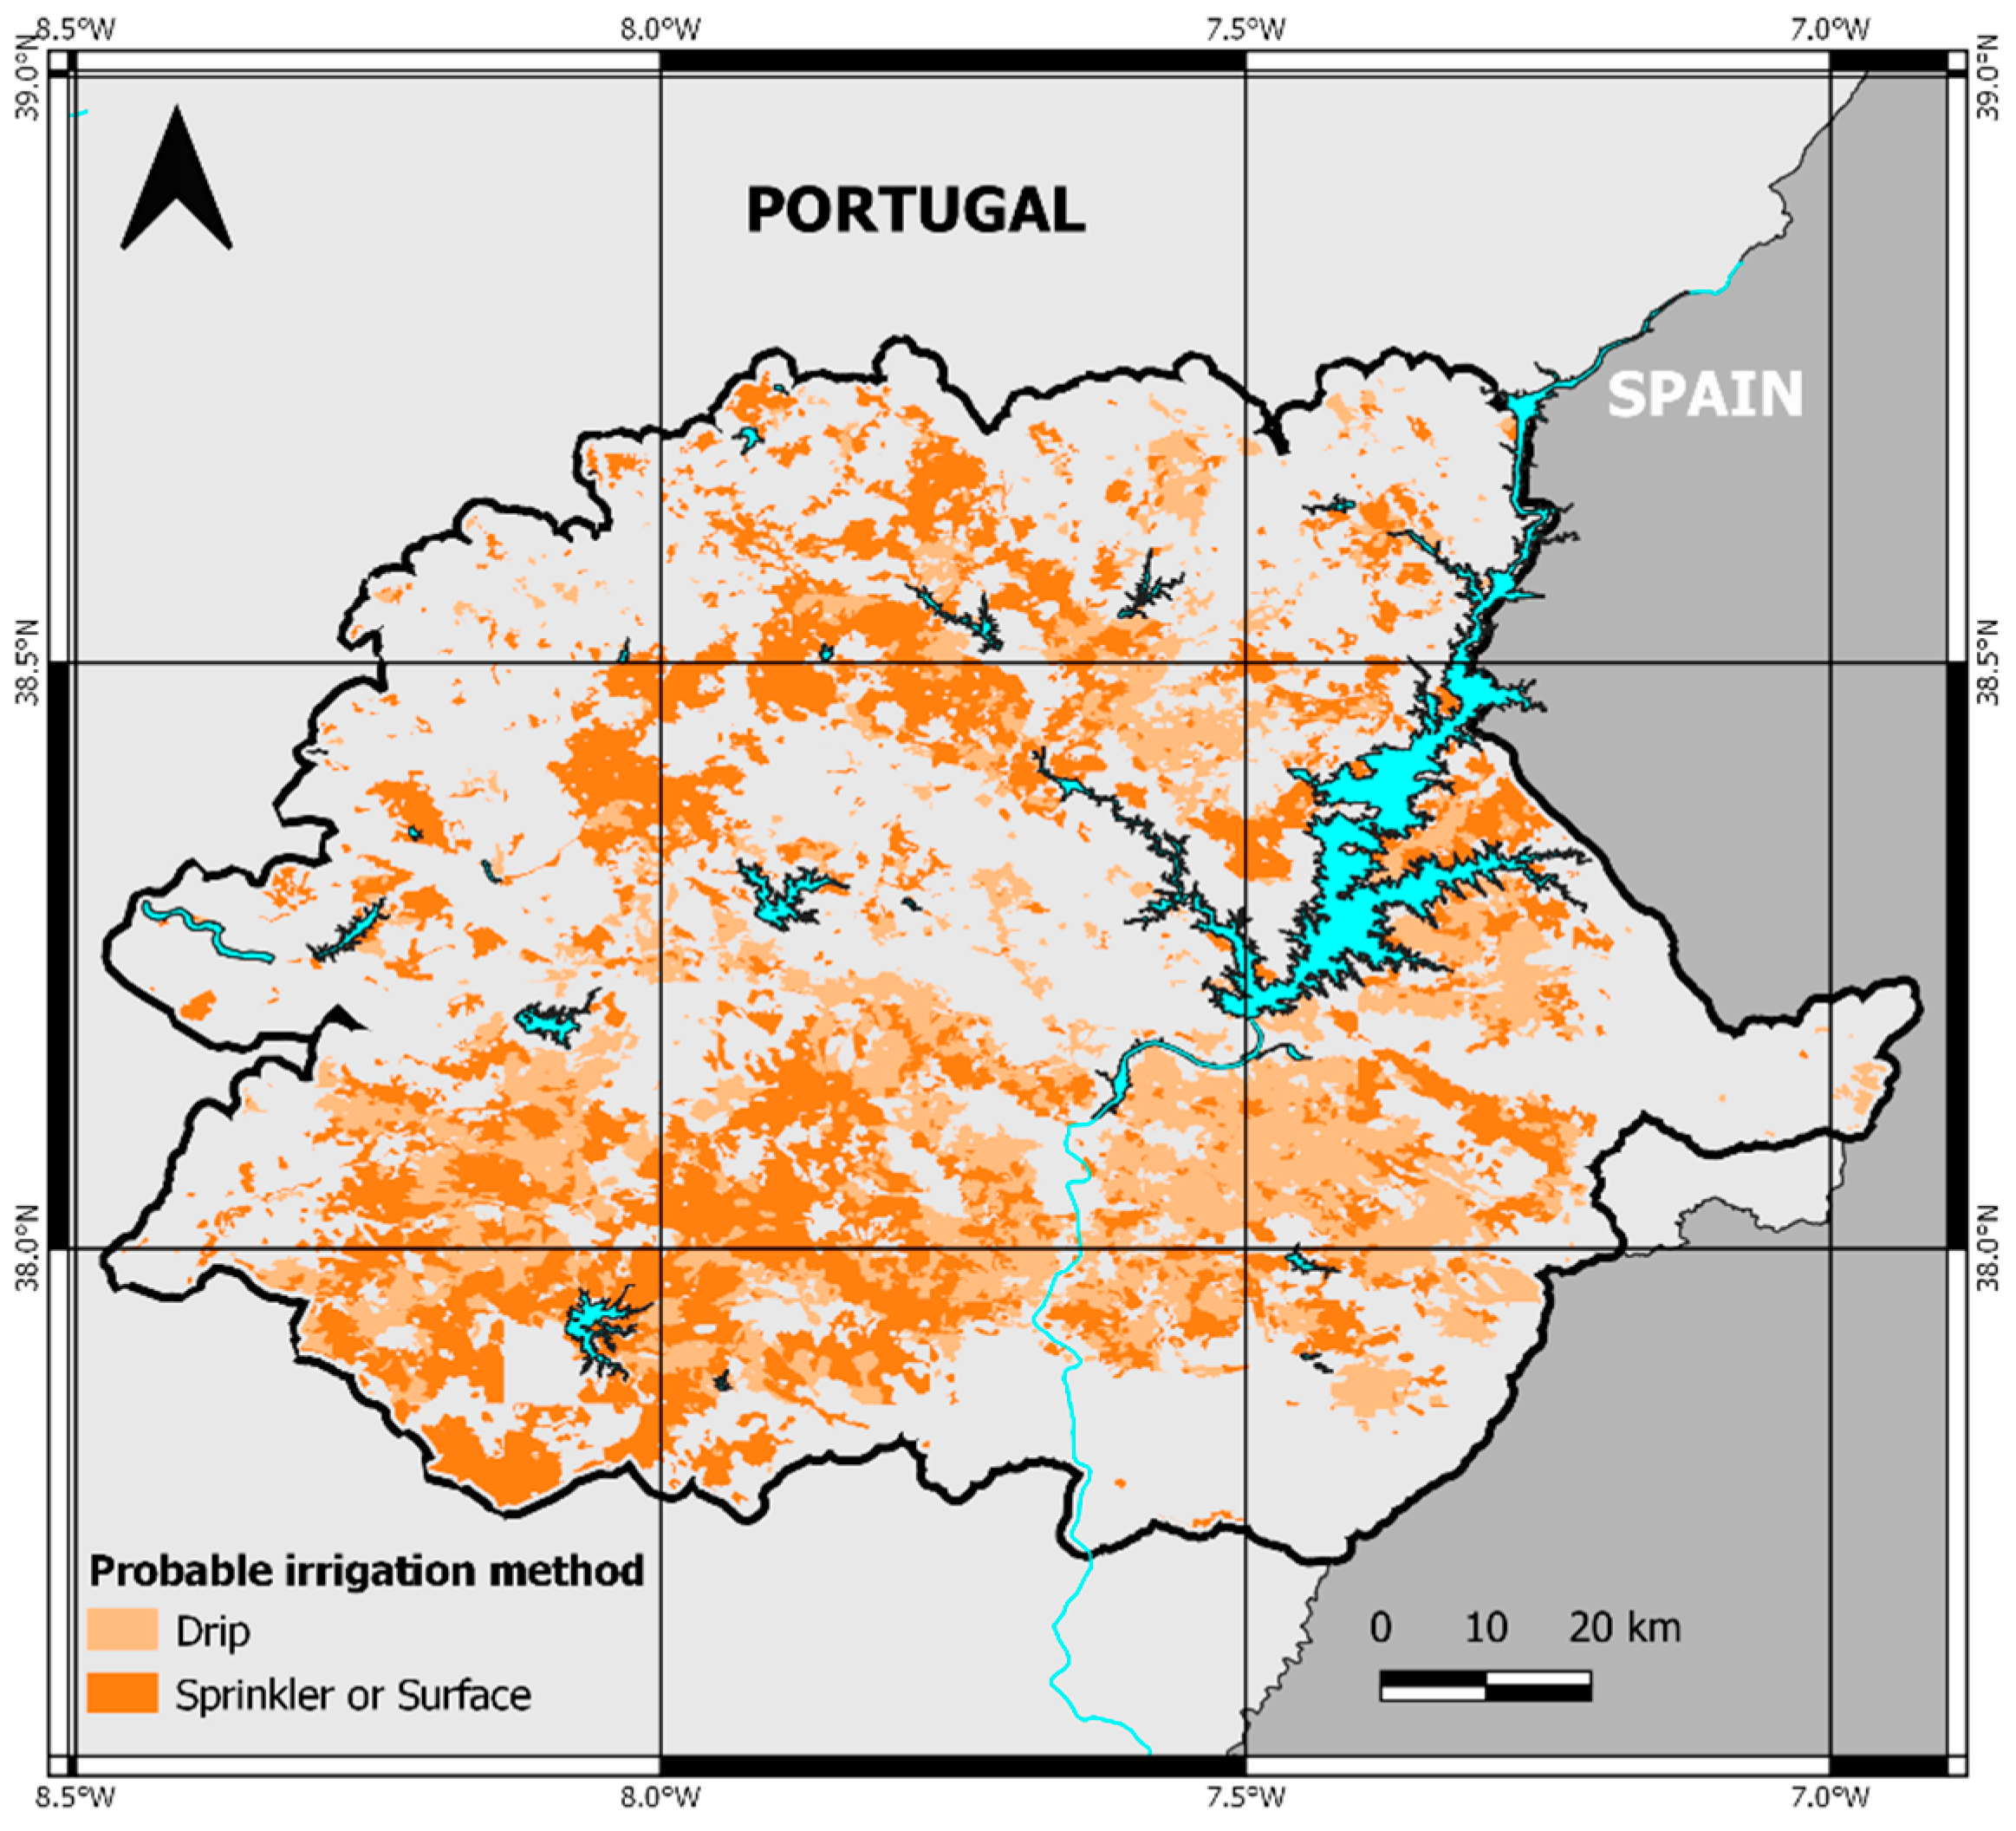
22]. At lower SAR levels, when chemical bonding is weakened, but no spontaneous dispersion takes place, inputs of energy are required for actual dispersion. While in drip irrigated fields this is hardly a problem, given the low flow rates of the drippers, the use of surface or sprinkler irrigation can increase the probability of soil structure degradation and surface crusting due to the physical disruption caused by runoff or by the water drops as they impact the soil surface aggregates [45].
In addition to soils that are classified as saline or sodic due to their genesis conditions, like Solonchaks and Solonetz, there are other soils whose characteristics make them more susceptible to the development of secondary salinization. This is the case of poorly drained soils (soils with permanent or temporary water table close to the surface) or soils with unfavorable hydrophysical properties (low permeability, low porosity, fine-textured layers or horizons). A systematized list of saline or saline prone soils, according to the World Reference Base of Soil Resources [46], was presented by Daliakopoulos et al. [22] (Table 2).
Many of the laboratory and field methods used to determine soil hydraulic properties are time-consuming, laborious, and limited to the sampling quantity and location, which restricts their use due to soil heterogeneity [47,48]. In fact, texture variability is one of the determining factors of this heterogeneity, and several methods have been proposed to establish a relation between soil texture and soil hydraulic properties [47,48,
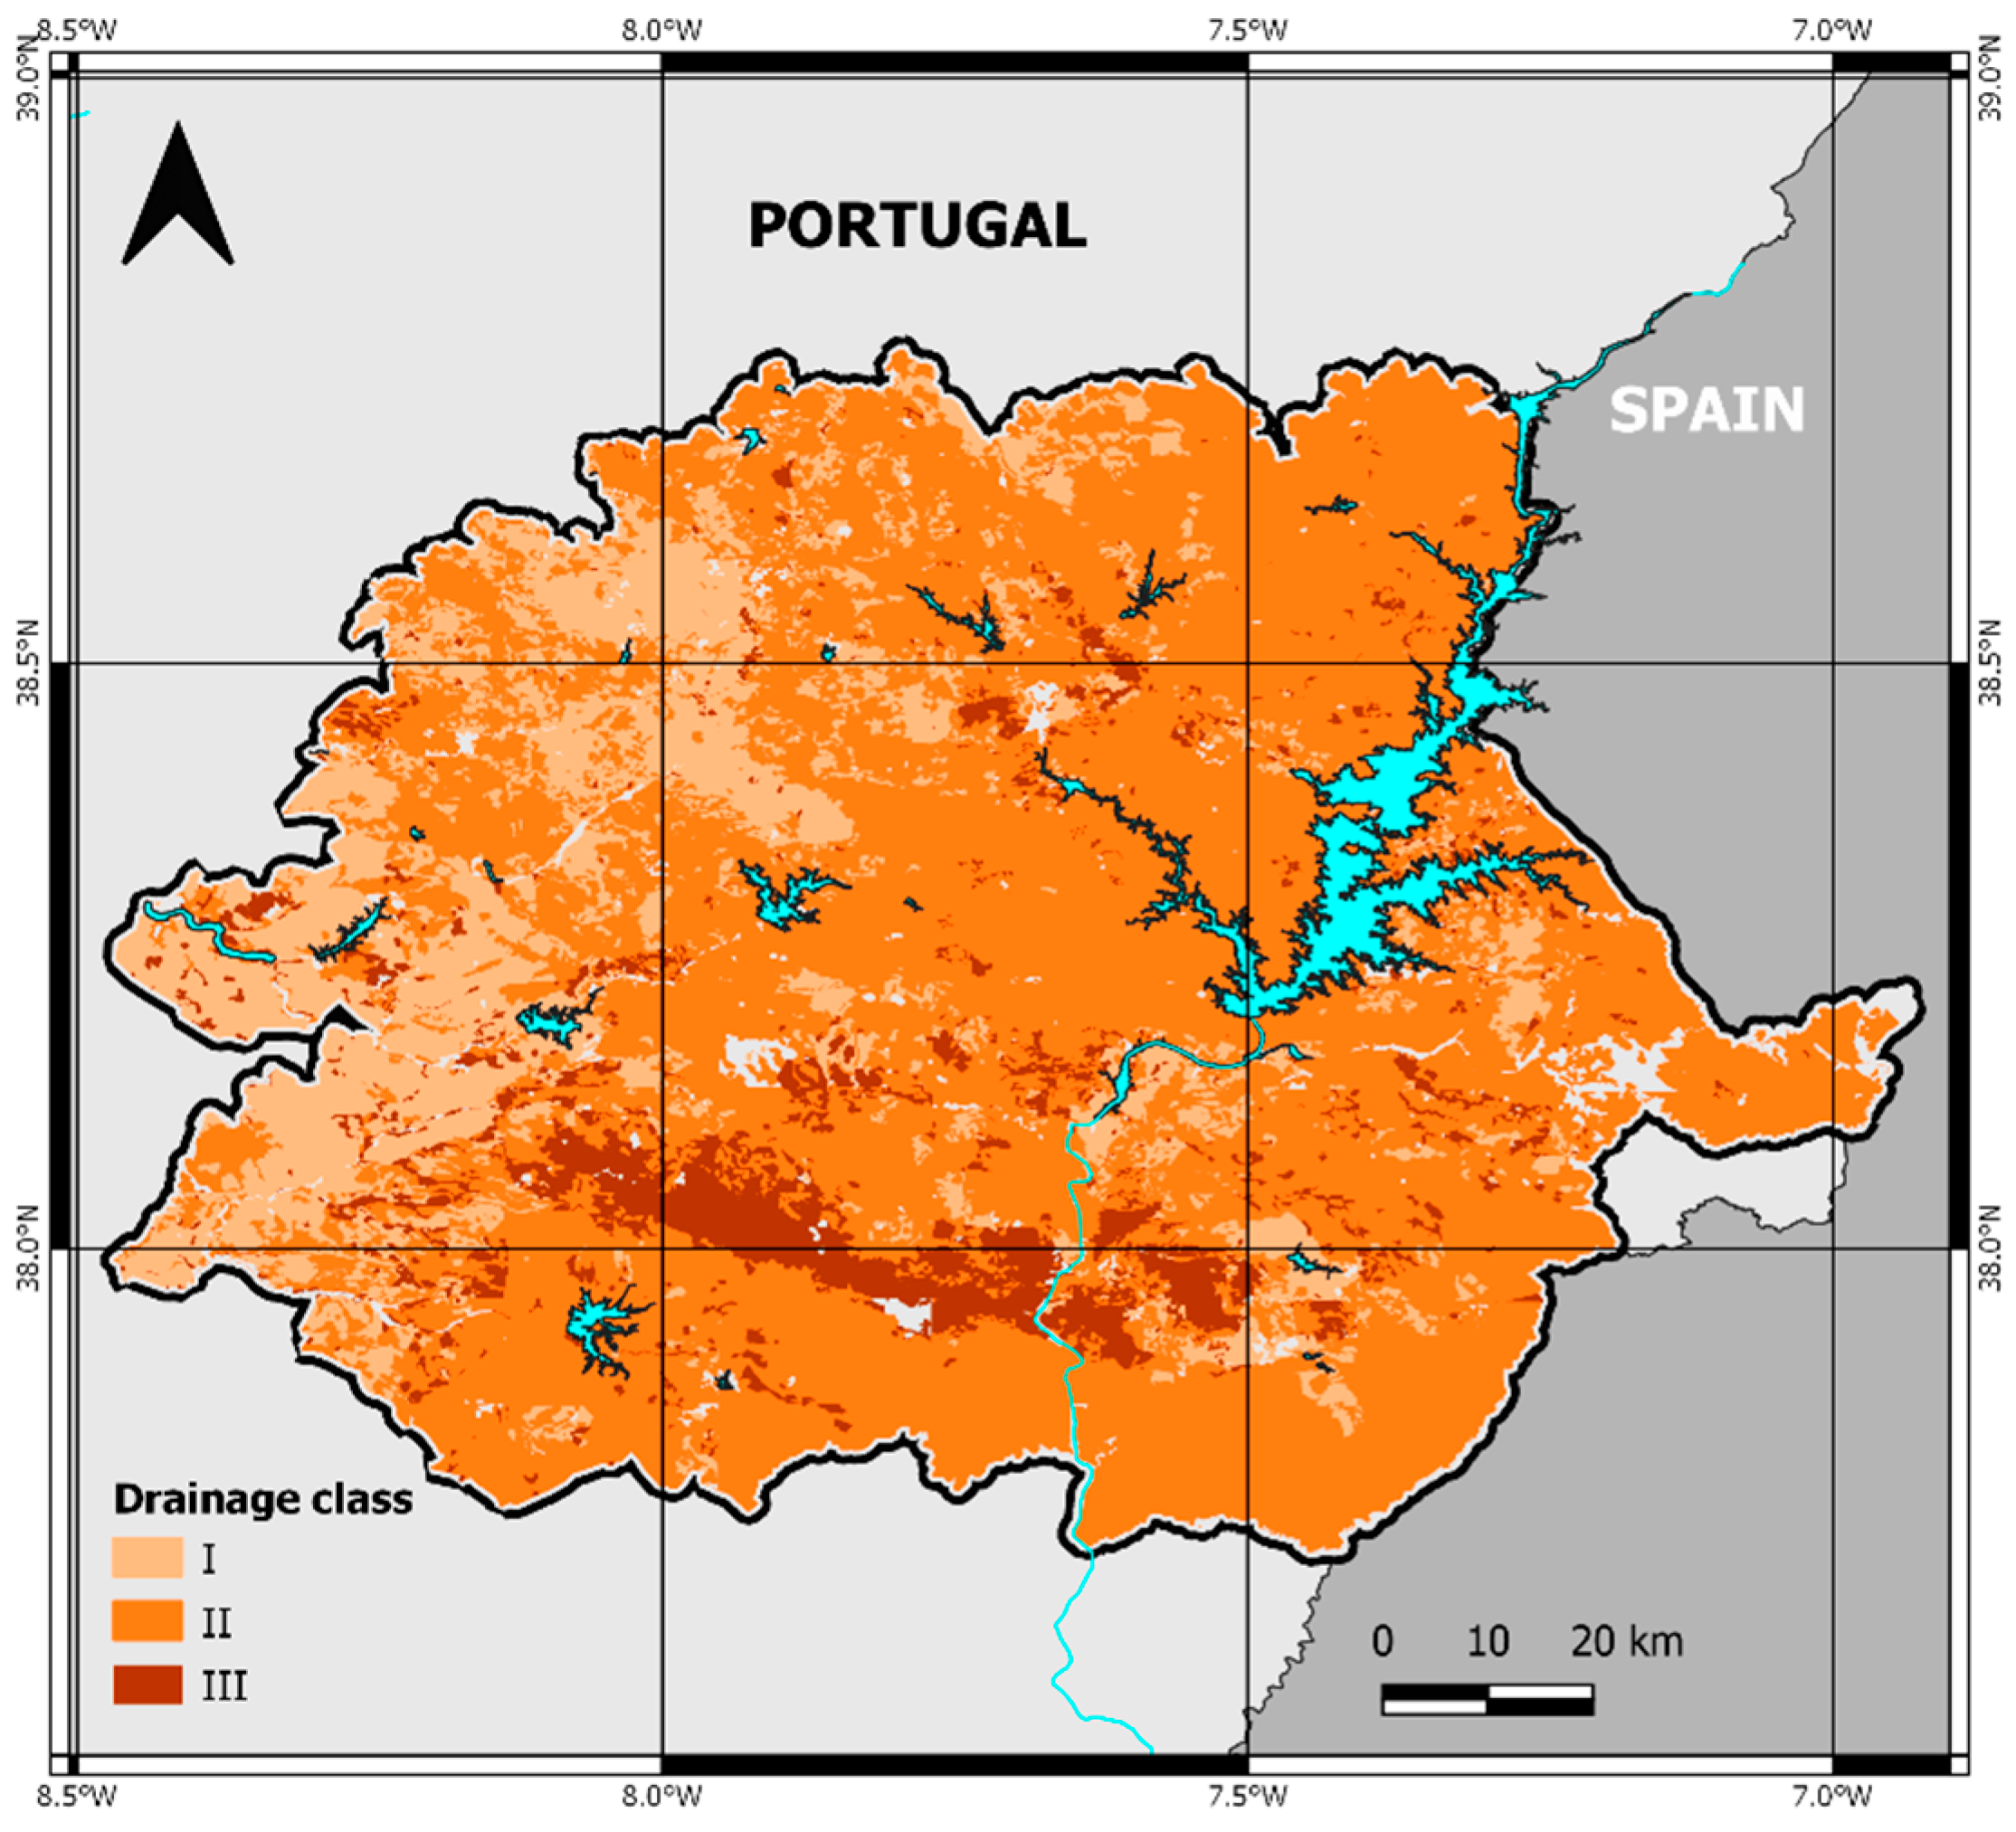
49]. Following a methodology similar to de Paz et al. [15], a classification of soil drainage can be made considering its relationship with textural classes (Table 3). Drainage conditions are also affected by groundwater levels. Areas of low relief and particularly closed depressions encourage lateral translocation in surface and groundwater and salt accumulation [50].
For the risk assessment of irrigation-induced salinization and sodification, the evaluation of irrigation water quality is of primary importance since it often constitutes the main source of salts. Some of the parameters used to evaluate soil salinization problems are the same that are used to evaluate the irrigation water quality, namely, electrical conductivity, in this case, Water Electrical Conductivity (ECW; dS m−1), Total Dissolved Salts (TDS; %), SAR, and the concentration of some specific ions that might cause toxicity to crops.
Although the suitability of a saline water for irrigation depends on different conditions of use, like crop, climate, soil, irrigation method, and management practices, only very tolerant crops can have satisfactory yields if irrigated with waters with EC that exceeds 10 dS m−1. In fact, few normally used irrigation waters exceed EC of about 2 dS m−1 [51]. It is consensual the use of the Food and Agriculture Organization of the United Nations (FAO) water quality guidelines for irrigation [52], which considers three levels of restriction for the use of an irrigation water: none, slight to moderate, and severe. In these guidelines, salinity is assessed from ECW, and sodicity (more specifically, infiltration rate of water in the soil) is assessed using ECW and SAR together (Table 4).
Irrigated agriculture develops primarily in areas where the interannual and seasonal quantity and distribution of precipitation and evapotranspiration are irregular. This leads to permanent (aridity) or temporary (drought) imbalances in water availability consisting in low average annual rainfall, with high spatial and temporal variability resulting in overall low moisture [53]. These features contribute to unfavorable salt balances, which can be intensified by irrigation with poor-quality water [
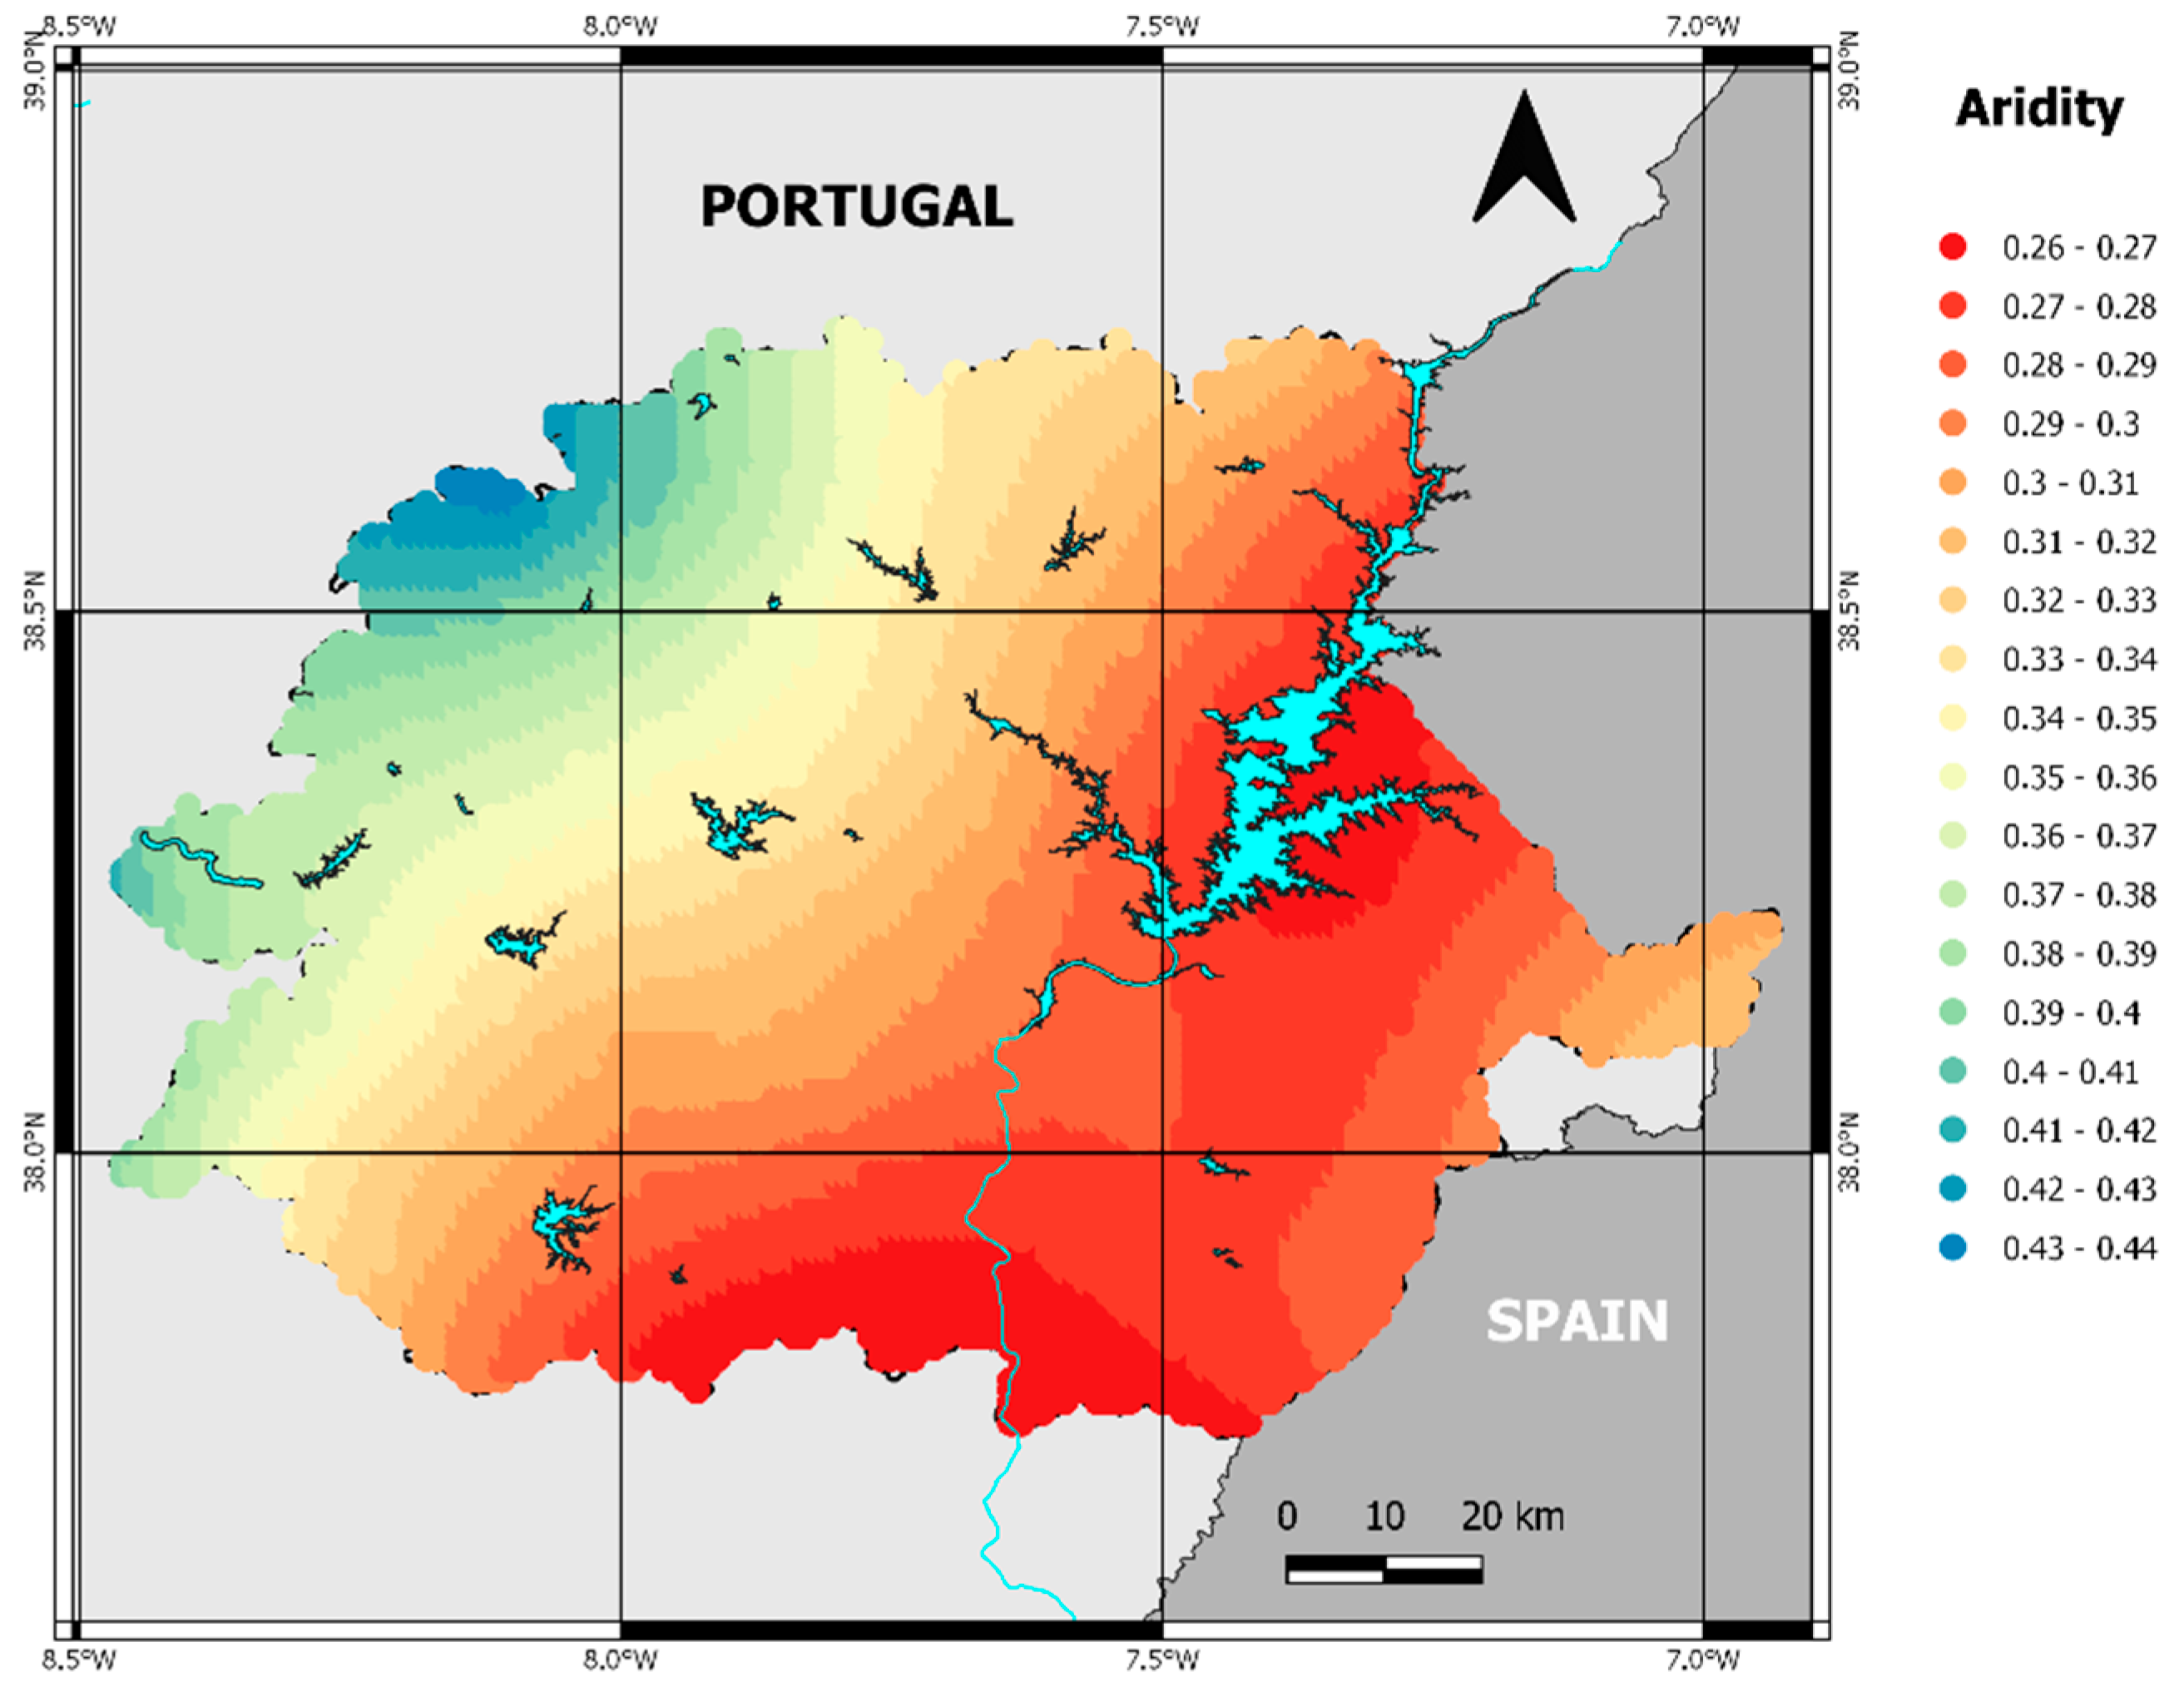
54]. Climate plays a key role in the process and, whenever data are available, should be considered when defining a set of indicators for salinization/sodification risk prediction. A well-known indicator used as a numerical expression of dryness for climate classification and for the identification of regional patterns of aridity is the United Nations Environmental Programme (UNEP) Aridity Index (AI) [55], a mean accumulated annual precipitation/potential evapotranspiration ratio (P/PET). Considering the AI scale, the classification of climate types is hyper-arid (<0.05), arid (0.05–0.2), semi-arid (0.2–0.5), dry sub-humid (0.5–0.65), and humid (≥0.65). For dryland climate subtypes, AI values are below 0.65, and, according to Schofield and Kirkby [50], values between 0.05 and 1 (arid to moist sub-humid) describe climatic conditions suitable for salinization to occur.

3. Materials and Methods

3.1. Study Area

The study region selected for this work, which we will refer to as Inland Alentejo, is part of a province in Southern Portugal, with a Mediterranean-type climate, named Alentejo (Figure 1). The region has a total area of 11,260 km2, of which 10,114 km2 are predominantly of agriculture and/or agroforestry use (excluding urban areas, artificial zones and rocky terrain). Large areas of traditional rainfed agriculture, conditioned by water availability constraints, have been gradually replaced by irrigated agriculture [56]. While there are some private irrigation systems, the main source of irrigation water is public. In this area, small public irrigation schemes with a total area of approximately 30,000 ha in operation in 2018 [57] were implemented in the last century. However, the largest public scheme, which started to operate in 2002, is the Alqueva irrigation plan, that presently covers nearly 120,000 ha and is expected to expand to 170,000 ha by 2022, totaling 15% of the study area. The irrigation plan is a part of the Alqueva Multi-Purpose Development Project (EFMA—Emprendimento de Fins Múltiplos de Alqueva). The EFMA is centered in the Alqueva reservoir (Guadiana River Basin), the largest artificial lake in the Iberian Peninsula, with a total storage capacity of 4150 hm3, providing water for public supply, irrigation, industry uses, energy production, and tourism. Studies carried out in the water and sediments of this reservoir have reported ecotoxicological risk to aquatic organisms, induced mostly by pesticide and metal pollution, an increment over time of organic matter and nutrients in the water body, and of trace elements in the sediments [58,59,60,61]. More recently, a temporal trend of degradation in water quality for irrigation was reported [11,12], that could be attributed to the expansion of the irrigation area, with the concomitant intensification of agriculture, and to the increase of drier conditions resulting from climate change. These studies pointed to a potential increased risk of soil infiltration problems and of salinity-induced yield reductions in sensitive crops, especially in drought years, and during periods of high atmosphere evaporative demands.
The climate in the region is classified as temperate with hot and dry summer (Csa in Köppen Classification), with a small area of mid-latitude steppe (Bsk). The long-term means for the period 1981–2010 of annual precipitation and annual mean temperature are, respectively, 558 mm and 16.9 °C, for Beja, a main town located approximately in the center of the study area [62]. During 2018, the annual precipitation in Beja was 653 mm, mean temperature was 16.2 °C, and reference annual evapotranspiration totaled 1193 mm [63].
Predominant soils in the study area (approximately 81% of total area) are Luvisols, Leptosols, Regosols and Vertisols. For the purpose of this study, a map of Reference Soil Groups (RSG) was built for the study region, based on the World Reference Base for soil resources [46] and on previous studies [64,65] (Figure S1).
The chart of Land Use and Occupation (COS—Carta de Uso e Ocupação do Solo) produced in 2018 for Continental Portugal, made available from the Portuguese Directorate General for Territory (DGT—Direcção-Geral do Território) [66], was used to obtain the land occupation and use map of the study area (Figure S2). The minimum cartographic unit of COS is of 1 ha, with a minimum distance between lines of 20 m, and it comprises 83 classes, from which 11 distinguish different agricultural types. According to COS, the main agricultural land uses in the region in 2018 were temporary rainfed and irrigated crops, and olive groves, respectively 22% and 15% of the study area. When considering only the Alqueva irrigation area, the main irrigated crops grown in 2018 were (by descending order of importance): olive; fruit trees, mainly nuts like almond and walnut (Juglans regia L.), but also pear (Pyrus communis L.) or peach (Prunus persica (L.) Batsch); grapevine; maize (Zea mays L.); forage crops; oil crops; horticultural crops; cereals other than maize [67]. The non-irrigated land is occupied mostly by rainfed crops, pastures and agroforestry systems of holm oak and cork oak.
Given the importance of the EFMA irrigation area in the study region, the water quality data used for the study were collected in the Alqueva reservoir at four sampling sites in floating platforms, as shown in Figure 1: Álamos-Captação (Al; 38°20′30.00″ N, 7°34′40.00″ W), Alqueva-Montante (Mn; 38°12′55″ N, 7°29′28″ W), Alqueva-Mourão (Mr; 38°23′60.00″ N, 7°23′25.80″ W), and Lucefécit (Lf; 38°33′6.32″ N, 7°17′52.86″ W). The Al site was chosen because it was near the Álamos pumping station, an inlet where water is elevated to part of the EFMA conveyance network. The Mn site was selected to ensure representativeness of the reservoir area. Mr and Lf sites were chosen considering previous results for the reservoir water quality assessment [12,58].

3.2. Data Collection and Mapping Methodology

In order to compute a spatial distribution of the Aridity Index, ERA5 dataset of monthly mean averages values was used. ERA5 [68] is the fifth-generation reanalysis product provided by the European Centre for Medium-Range Weather Forecasts (ECMWF). Reanalysis combines observations and a numerical weather prediction model to produce complete atmospheric fields over a regular 3D atmospheric grid. In the present study, the monthly mean values of total precipitation, 2 m air temperature (T2m; °C), and 2 m dew-point temperature (d2m; °C) for the 30 year period 1990–2019 were downloaded from the ERA5-Land monthly averaged dataset with a horizontal resolution of 0.1° (~10 km) [69]. The monthly accumulated PET values were computed using Equation (3), the practical and well-known formulation of Romanenko [70]:
P E T = 0.0018 ( 25 + T a ) 2 ( 100 + R H ) ,
where Ta (°C) is the monthly mean air temperature and RH (%) is the monthly mean relative humidity calculated from the ERA-5 T2m and d2m values. Finally, the 30 years (1990–2019) mean annual PET and P were computed for the study area to access the AI as defined by the UNEP [55].
The map with the Reference Soil Groups (RSG) in the study area is presented in Figure S1. Slope classes were obtained based on the slope of the predominant soil units [71].
From the textural classes of the surface horizons/layers of the predominant soil units [72], a map with drainage classes was built after the classification presented in Table 3, with the addition of a restricted drainage classification whenever soil use capacity was severely to very severely limited due to excess water.
Within the study area, a potentially irrigated area was established for the application of the risk indices. For this purpose, the following crops/type of crops from the COS classes were considered as possibly irrigated: a-temporary dry and irrigated crops; b-vineyards; c-orchards; d-olive groves; e-complex cultivation patterns. A most likely irrigation method was assigned to each crop/group of crops as follows: I—Drip irrigation, in the case of b, c, and d; II—Surface or Sprinkler irrigation, in the case of a and e.
The study covered six water sampling campaigns in 2018, performed in January (Jan), March (Mar), May, July (Jul), September (Sep), and November (Nov). At each sampling location, 2 L of surface water were collected, at a depth of 50 cm, using a Van Dorn bottle. The water samples were stored in polyethylene bottles and transported to the laboratory, in a cooler at 4 °C, where they were conserved and stored, following the requisites for water conservation for each parameter [73]. The concentrations of Ca2+, Mg2+, and Na+, were determined by ionic chromatography methodology adapted from APHA [73]. Water ECW was measured in situ on the same dates (except November due to a temporary equipment failure) at a 50 cm depth using a multiparametric probe YSI 6820 MPS probe®. Values of SAR were calculated using Equation (2). For the purpose of this work, ECW and SAR were evaluated after the FAO guidelines presented in Table 4.

3.3. Risk Indices

To obtain the composite risk indices of salinization and sodification, two sets of indicators were adopted, based on a tier 2 approach [16], previously presented in Table 1, and based on Masoudi et al. [35]. The Salinization Risk (RSA) index includes a set of four criteria and respective indicators, represented in classes (I to V or I to III, depending on the range of values or the classes considered), to which a rating score (1 to 5) was assigned (Table 5):
(i)
Climate, quantified with the AI scale from [55];
(ii)
Topography, represented by slope intervals obtained from the Portuguese soil and land-use capacity map [71];
(iii)
Soil drainage, characterized by drainage classes according to Table 3;
(iv)
Irrigation water quality, from in situ measurements, classified according to the degrees of restriction to its use with respect to salinity, as presented in Table 4.
The Sodification Risk (RSO) index comprises a set of five criteria, and respective indicators, to which a rating score (1 to 5) was assigned (Table 6):
(i) to (iii) equal to the ones considered in the RSA index;
(iv) crop, represented by a most likely irrigation method, considering two classes (I—drip irrigation and II—surface or sprinkler irrigation);
(v) Irrigation water quality, from in situ measurements and sample analyses, classified according to the degrees of restriction to its use with respect to infiltration, as presented in Table 4.
The RSA and RSO indices incorporated the effect of the indicators in each set, obtained by their score sum, using Equations (4) and (5):
RSA = i = 1 4 S i = S A I + S S l o p e + S S o i l d r a i n a g e + S E C w ,
RSO = i = 1 5 S i = S A I + S S l o p e + S S o i l d r a i n a g e + S I r r i g a t i o n m e t h o d + S E C w S A R ,
where S i is the rating score assigned to each of the indicators class.
From the RSA and RSO values, five risk classes were considered (Very Low, Low, Moderate, High and Very High), each corresponding to a level of management practice recommendation (Table 7), an adaptation of the classification described in Wiebe et al. [32]. In the case of RSA, a condition was added to assign a Very High risk class (RSA > 18) whenever soils were Solonchaks, regardless of the remaining indicators scores. Likewise, in the case of RSO, a condition was added to assign a Very High risk class (RSA > 22) whenever soils were Solonetz, regardless of the remaining indicators scores.

4. Results and Discussion

4.1. Climate, Topography, Drainage, and Irrigation Method

As observed in Figure 2, there was a clear positive gradient of aridity with continentality and from higher to lower latitudes, with a relative minimum over the Guadiana valley, where a large proportion of irrigated land is located. The AI calculated for the study area (period 1990–2019) varied between 0.26 and 0.44; hence, all the region is found within the same climate class, Semi-arid (III, with a rating score of 3). An Aridity Index of 0.415 was reported by Paulo et al. [74] for the period 1941–2006 in Beja.
A study by Valverde et al. [75], evaluating climate change potential impacts on irrigated agriculture in the Guadiana River Basin, projected a general increase in crop irrigation requirements, questioning the sustainability of irrigation area expansion in the region. Godinho et al. [76] reported the risk of increased aridity in the area resulting from changes in land surface albedo and land surface temperature caused by land cover transformations, such as deforestation to promote agricultural lands.
In relation to the topography criterion, more than half of the area (60%) presented slopes < 8%; thus, was grouped in slope classes II and III (Figure 3). Considering the drainage class, 73% of the area was in class II and 7% in class III, which related with the prevalence of medium-to-fine textured soils in the region (Figure 4). According to the assumptions of the model, the potentially irrigated area totaled 401,408 ha, corresponding to about 40% of the agricultural and forestry land. In this area, 43% is most likely irrigated with drip systems and the remaining with sprinkler or surface systems (Figure 5).
When considering only the potential irrigated area, some of the percentages previously presented had some significant variation: (i) the percentage of Leptosols varied from 17% in the total area to 3% in the potentially irrigated area, indicating a low agricultural, and accordingly, low irrigation aptitude of this reference soil group; (ii) slopes assigned to class II and III increased, respectively, from 46% to 49% and from 14% to 17%; (iii) the areas with restricted drainage (class III) increased from 7% to 12%; (iv) temporary crops and olive groves remained the predominant COS classes but with higher occupation within the potentially irrigated area of 57% and 37%, respectively. However, it may be that the percentage of temporary crops was overestimated since the COS class includes rainfed and irrigated crops and, from the information reported in EDIA (Empresa de Desenvolvimento e Insfraestruturas do Alqueva) [67], olive groves occupy a large proportion of the irrigated lands in the region.

4.2. Water Quality for Irrigation

The temporal variation observed for ECW and SAR for the four sampling sites is presented in Figure 6a,b. In the case of ECW, the highest average values were measured in September (0.56 ± 0.015 dS m−1) and July (0.49 ± 0.020 dS m−1), during the dry season. As for SAR, the highest values were registered at Álamos in January (1.64 ± 0.000), which was probably due to the 2017 and early 2018 drought that lead to low water storage and, possibly, reduced salt dissolution. The lowest SAR value occurred at the same site in July (1.12 ± 0.010). There were no relevant differences between sites.
According to the methodology of salinization and sodification risk prediction presented, the irrigation water quality indicators fall in the same classes for every date and site. ECW values showed no degree of restriction of use, thus were grouped in class I (Table 5). The combined assessment of ECW and SAR showed a slight-to-moderate degree of restriction of use in all water samples analyzed. Therefore, these sodification indicators fall within class II for every date and site (Table 6). In this case, low-salt water may reduce infiltration even for a low SAR, given that the salinity of the applied water is insufficient to counteract the negative effects of adsorbed sodium on soil structure [51,52,77].

4.3. Salinization Risk Areas

The risk map of soil salinization in the potentially irrigated lands of Inland Alentejo shows that there was a predominance of low (67%) and moderate risk (26%) areas and that there were no areas within the higher risk classes (Figure 7).
Moderate risk of salinization was predominantly related to low slope areas (Figure 8a).
Also, moderate and restricted soil drainage, a characteristic of fine-textured soils, like Luvisols or Vertisols, (Figure 8b,c) lead to the augmentation of soil salinization risk. Similar relationships between slope and salinization-prone areas were obtained by other authors [78] when mapping the irrigation salinity risk in an arid region. Seydehmet et al. [78] found high salinization risk associated with flat and low terrain, high salt content in the subsoil, high salinity of groundwater and small depth of the water table. The development of soil salinity as a consequence of poor drainage conditions, fine texture and low saturated soil hydraulic conductivity was reported by de Paz et al. [15] and Bouksila et al. [79], in their works about salinization risk in semi-arid irrigated land. The influence of soil water storage capacity was referred to as the most important soil indicator affecting soil salinization by Kairis et al. [80], indicating that moderately fine and fine-textured soils were more likely to be affected by salinization.
As expected, the main types of land use where this level of risk appeared were olive groves and annual crops (Figure 8d), which was mainly a consequence of their extensive distribution in the area. In the case of irrigated high-density olive groves, largely grown in the region, Ramos et al. [81] found that the long-term (30 years) impact of current irrigation practices (including deficit irrigation, i.e., seasonal irrigation volumes corresponding to a fraction of the seasonal crop evapotranspiration) showed reduced risks of soil salinization, with simulated average root zone salinity values at the end of the irrigation seasons (normally, late summer or early autumn) remaining below the salinity threshold limit for olive groves. Additionally, these authors stated that the use of deficit irrigation practices in olive groves has the potential to improve soil salinity management by a better control of rising water tables and by a reduction in the import of salts by irrigation water, but it does not provide the same degree of leaching as full irrigation.

4.4. Sodification Risk Areas

The results obtained for the RSO index showed that most of the potentially irrigated area in Inland Alentejo is classified as moderate risk (68%), followed by high risk (16%) and low risk (10%) of sodification (Figure 9). Predictions were decidedly influenced by the indicators slope, drainage, water quality, and irrigation method. Moderate risk areas comprised mainly medium slopes (Figure 10a), moderate drainage soils included in the Luvisols RSG (Figure 10b,c), annual crops irrigated by surface or sprinkler systems and, to a lesser extent, olive orchards irrigated by drip systems (Figure 10d,e).
The analysis of the relationships between the RSO index and its indicators in high-risk areas showed a strong prevalence of flat and low slope terrain (Figure 11a), moderate-to-restricted soil drainage in Luvisols, Vertisols and Cambisols (Figure 11b,c), and annual crops irrigated with surface or sprinkler systems (Figure 11d,e). The results were in accordance with Sentís [36], who, in their study to evaluate the development of secondary sodicity in the surface soil, found that it was strongly affected by inadequate drainage and inefficient irrigation. This risk prediction could indicate that even non-sodic soils with ESP (or SAR) < 3 can have a tendency for swelling, aggregate failure, and increase in dispersion rates, thus behaving like sodic soils at very low electrolyte concentration [82]. As a consequence, soil infiltration rates decline and surface crust formation problems can occur, conditions that may worsen due to the physical disruption of soils particles caused by the use of sprinkler irrigation systems. Although clay soils are more affected by sodicity, it should be considered that there are some soil properties, other than texture, that are significant in influencing the behavior of soils under sodification risk, namely, depth and thickness of the sodic horizons and clay mineralogy. For instance, the presence of high-activity clay minerals, like smectite, is likely to increase the soil susceptibility to sodification [83].

5. Conclusions

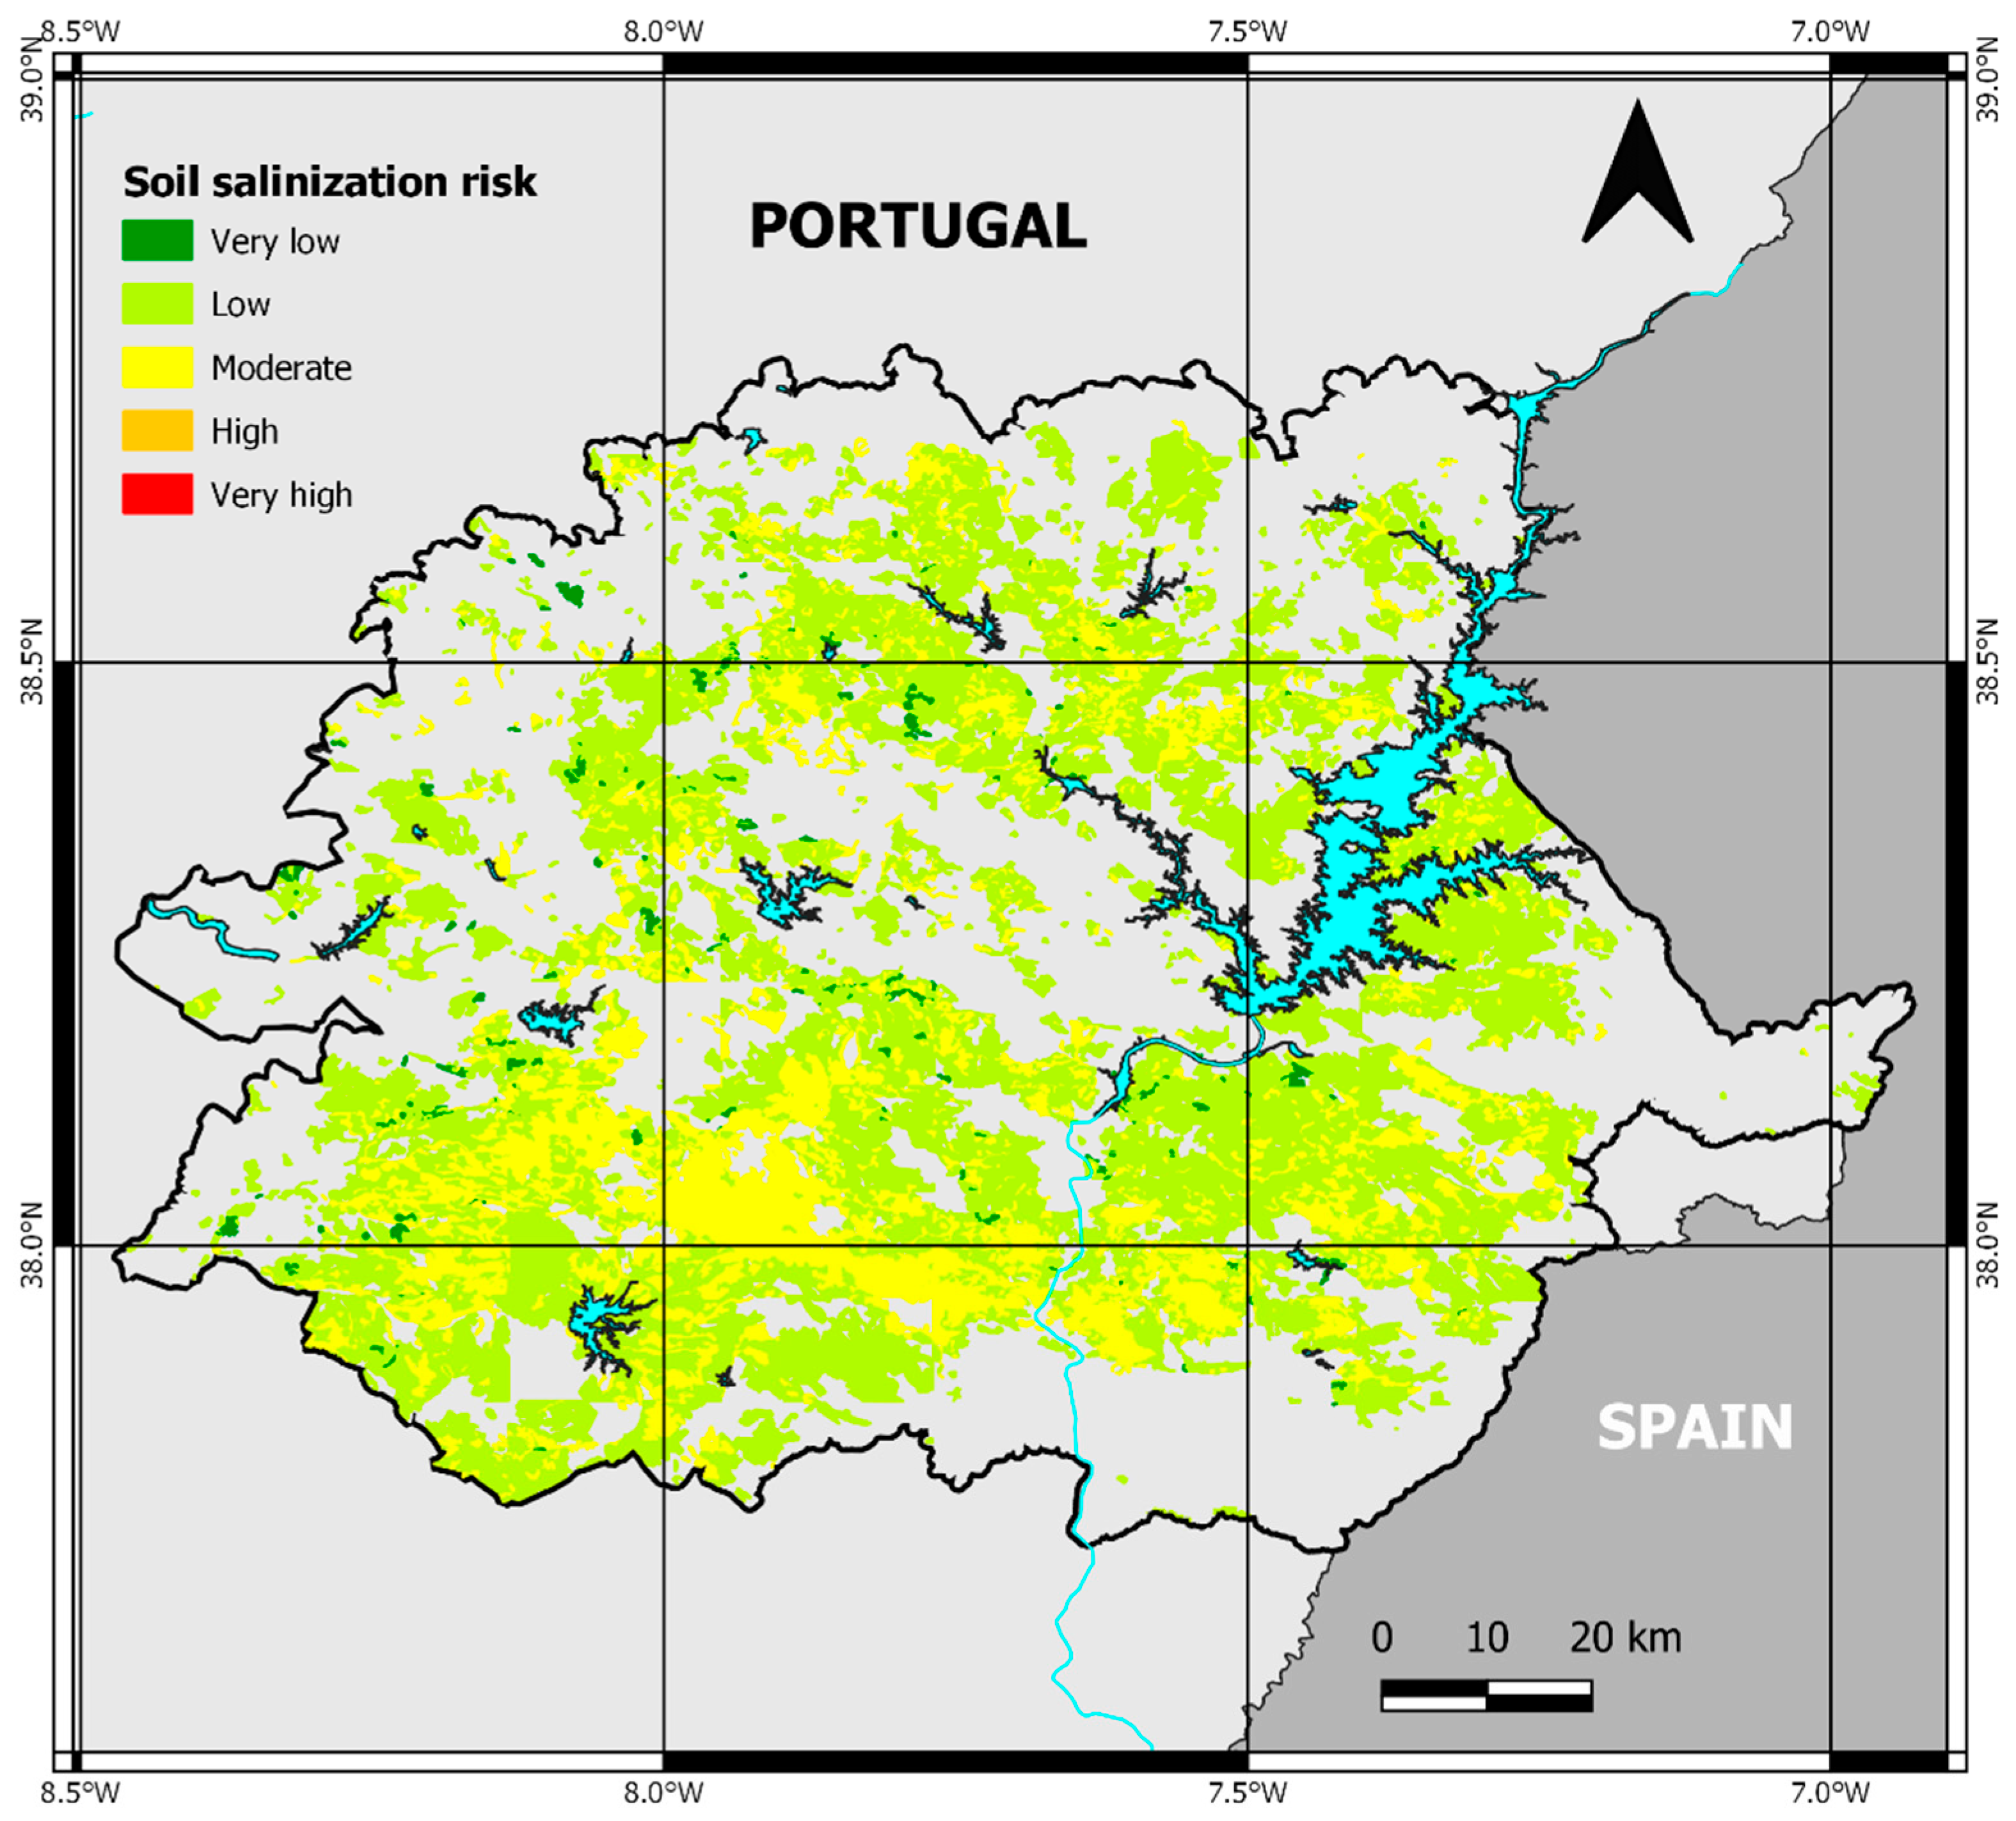
Negative impacts of soil salinity and sodicity in Mediterranean regions include decreased food production, deteriorating water quality in surface streams and groundwater, loss of biodiversity, and increased risk of flooding and desertification. The present study aimed to develop two risk indices for better prediction of soil salinity and sodicity in large areas, in order to provide farmers, rural planners, and resource managers with a tool to help identify susceptible areas, to apply appropriate agronomical strategies and management options and to avoid soil degradation in irrigated lands.
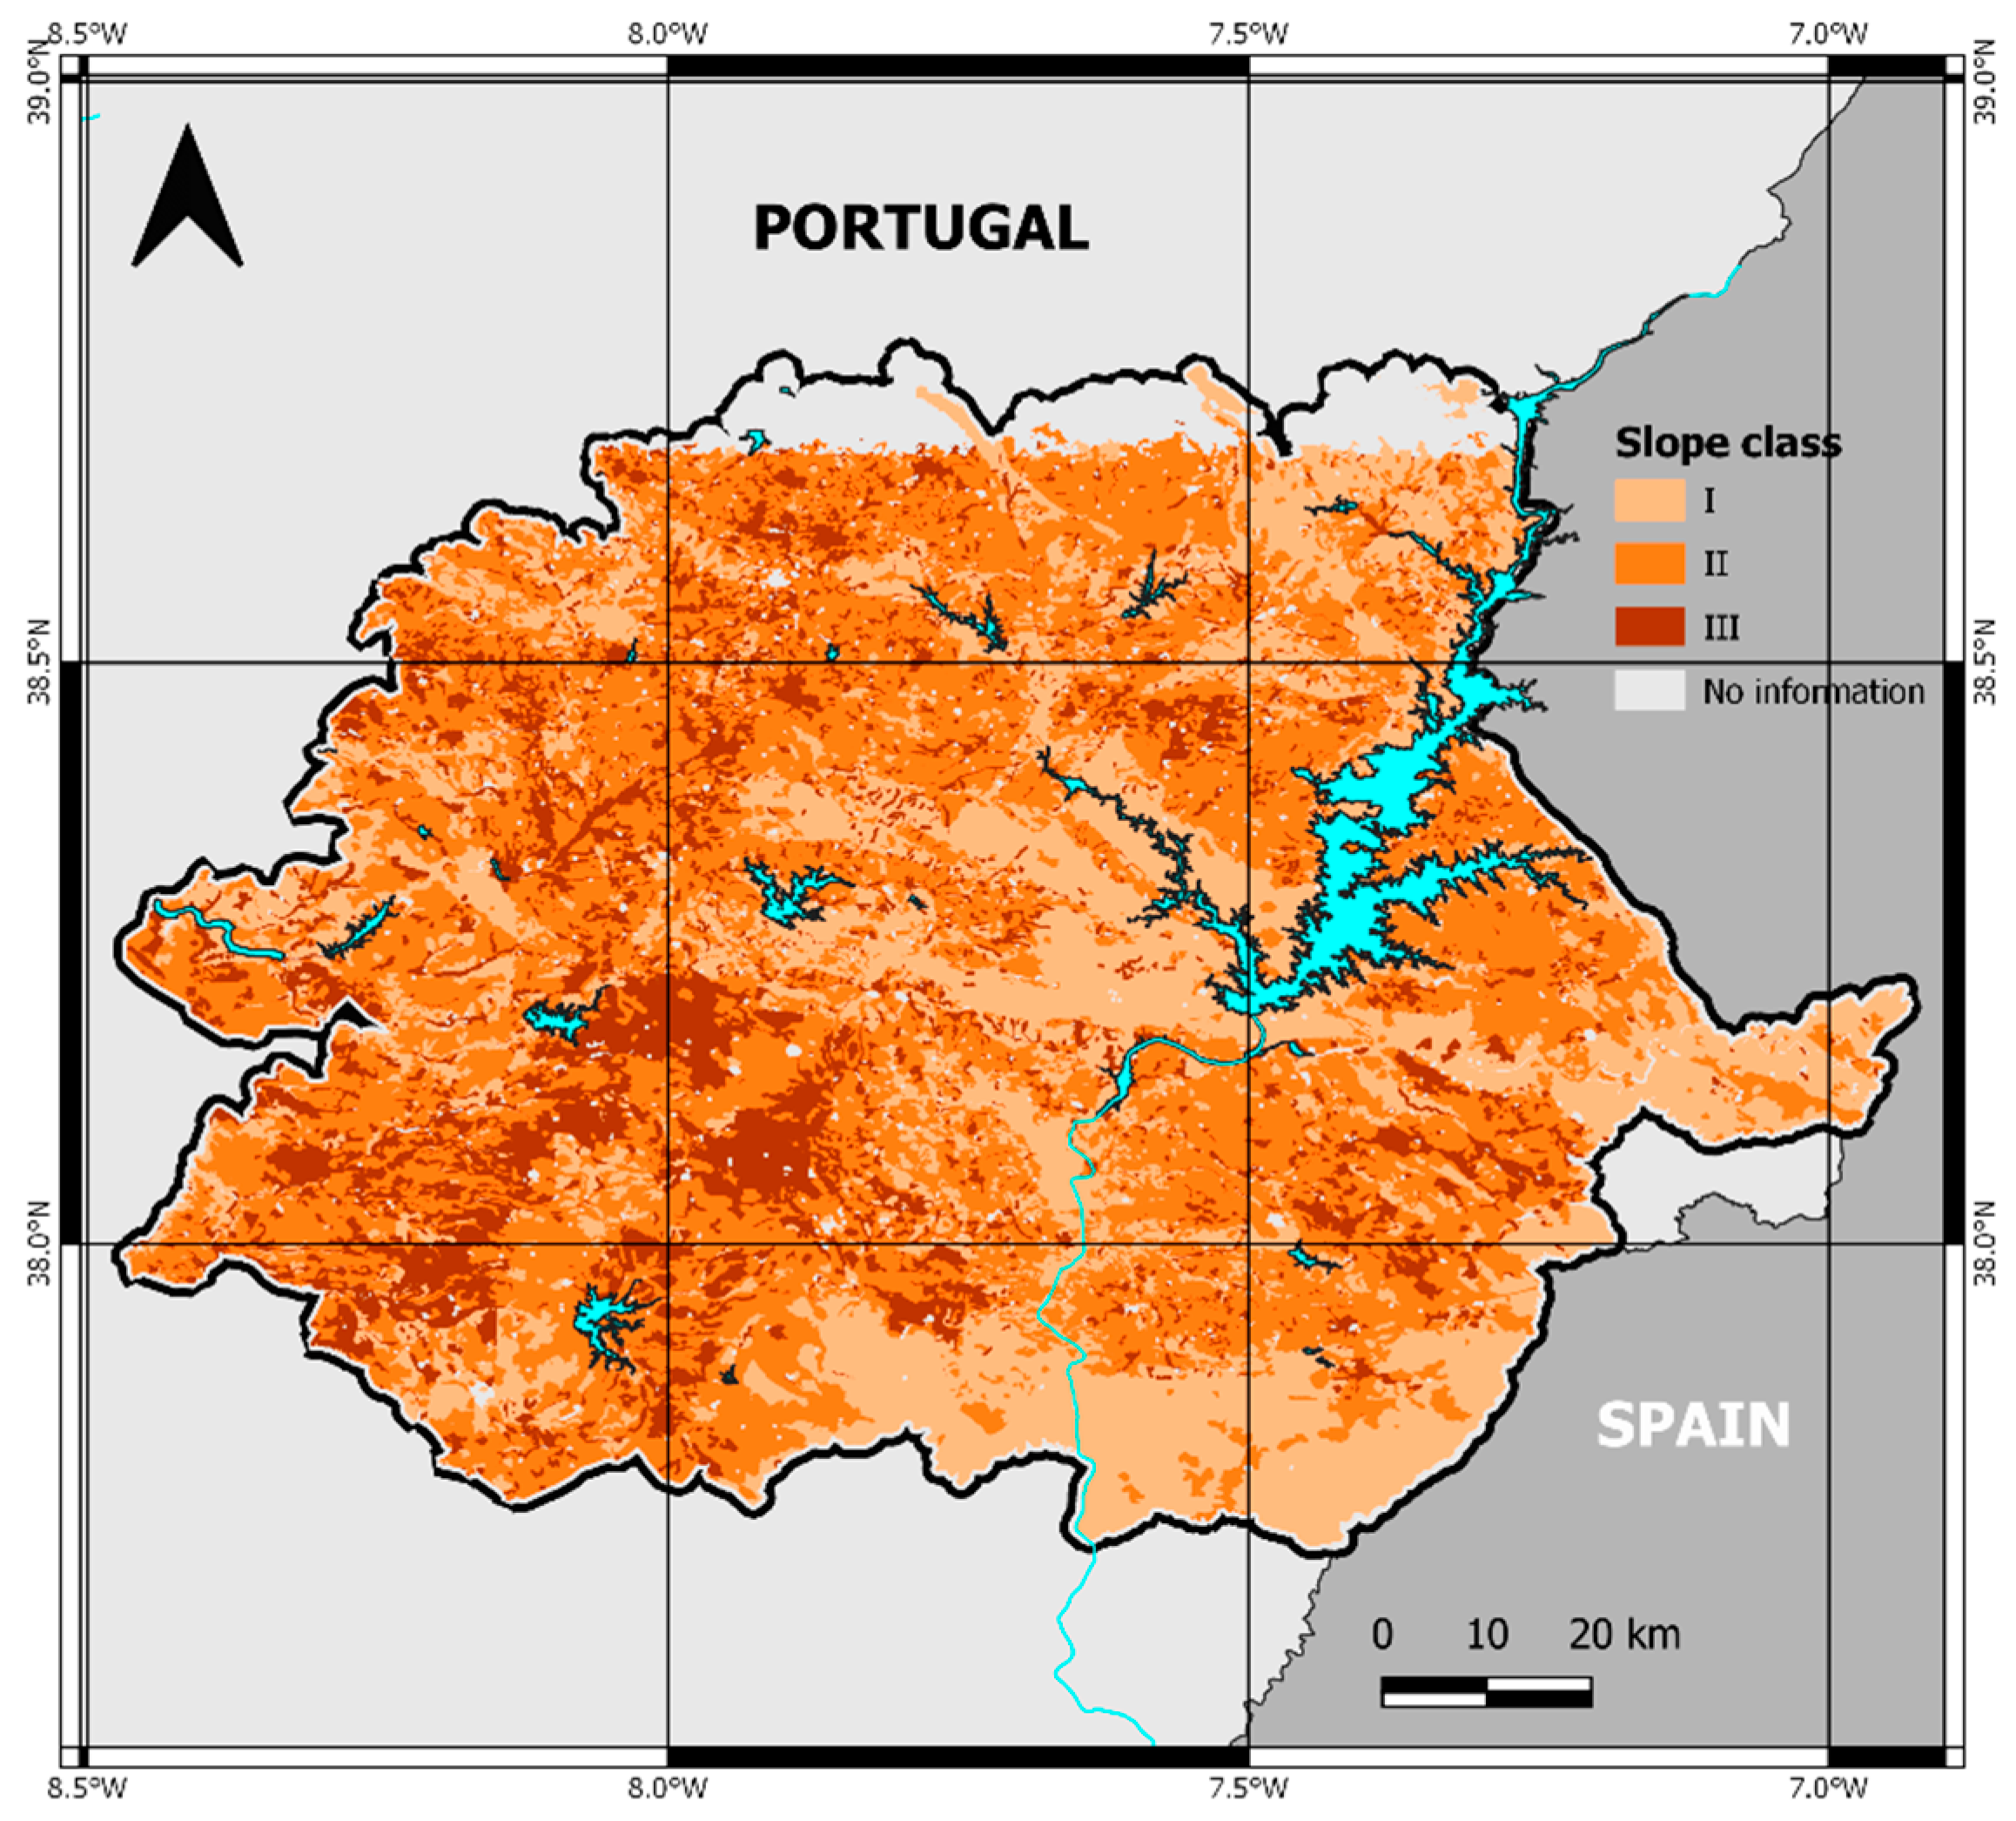
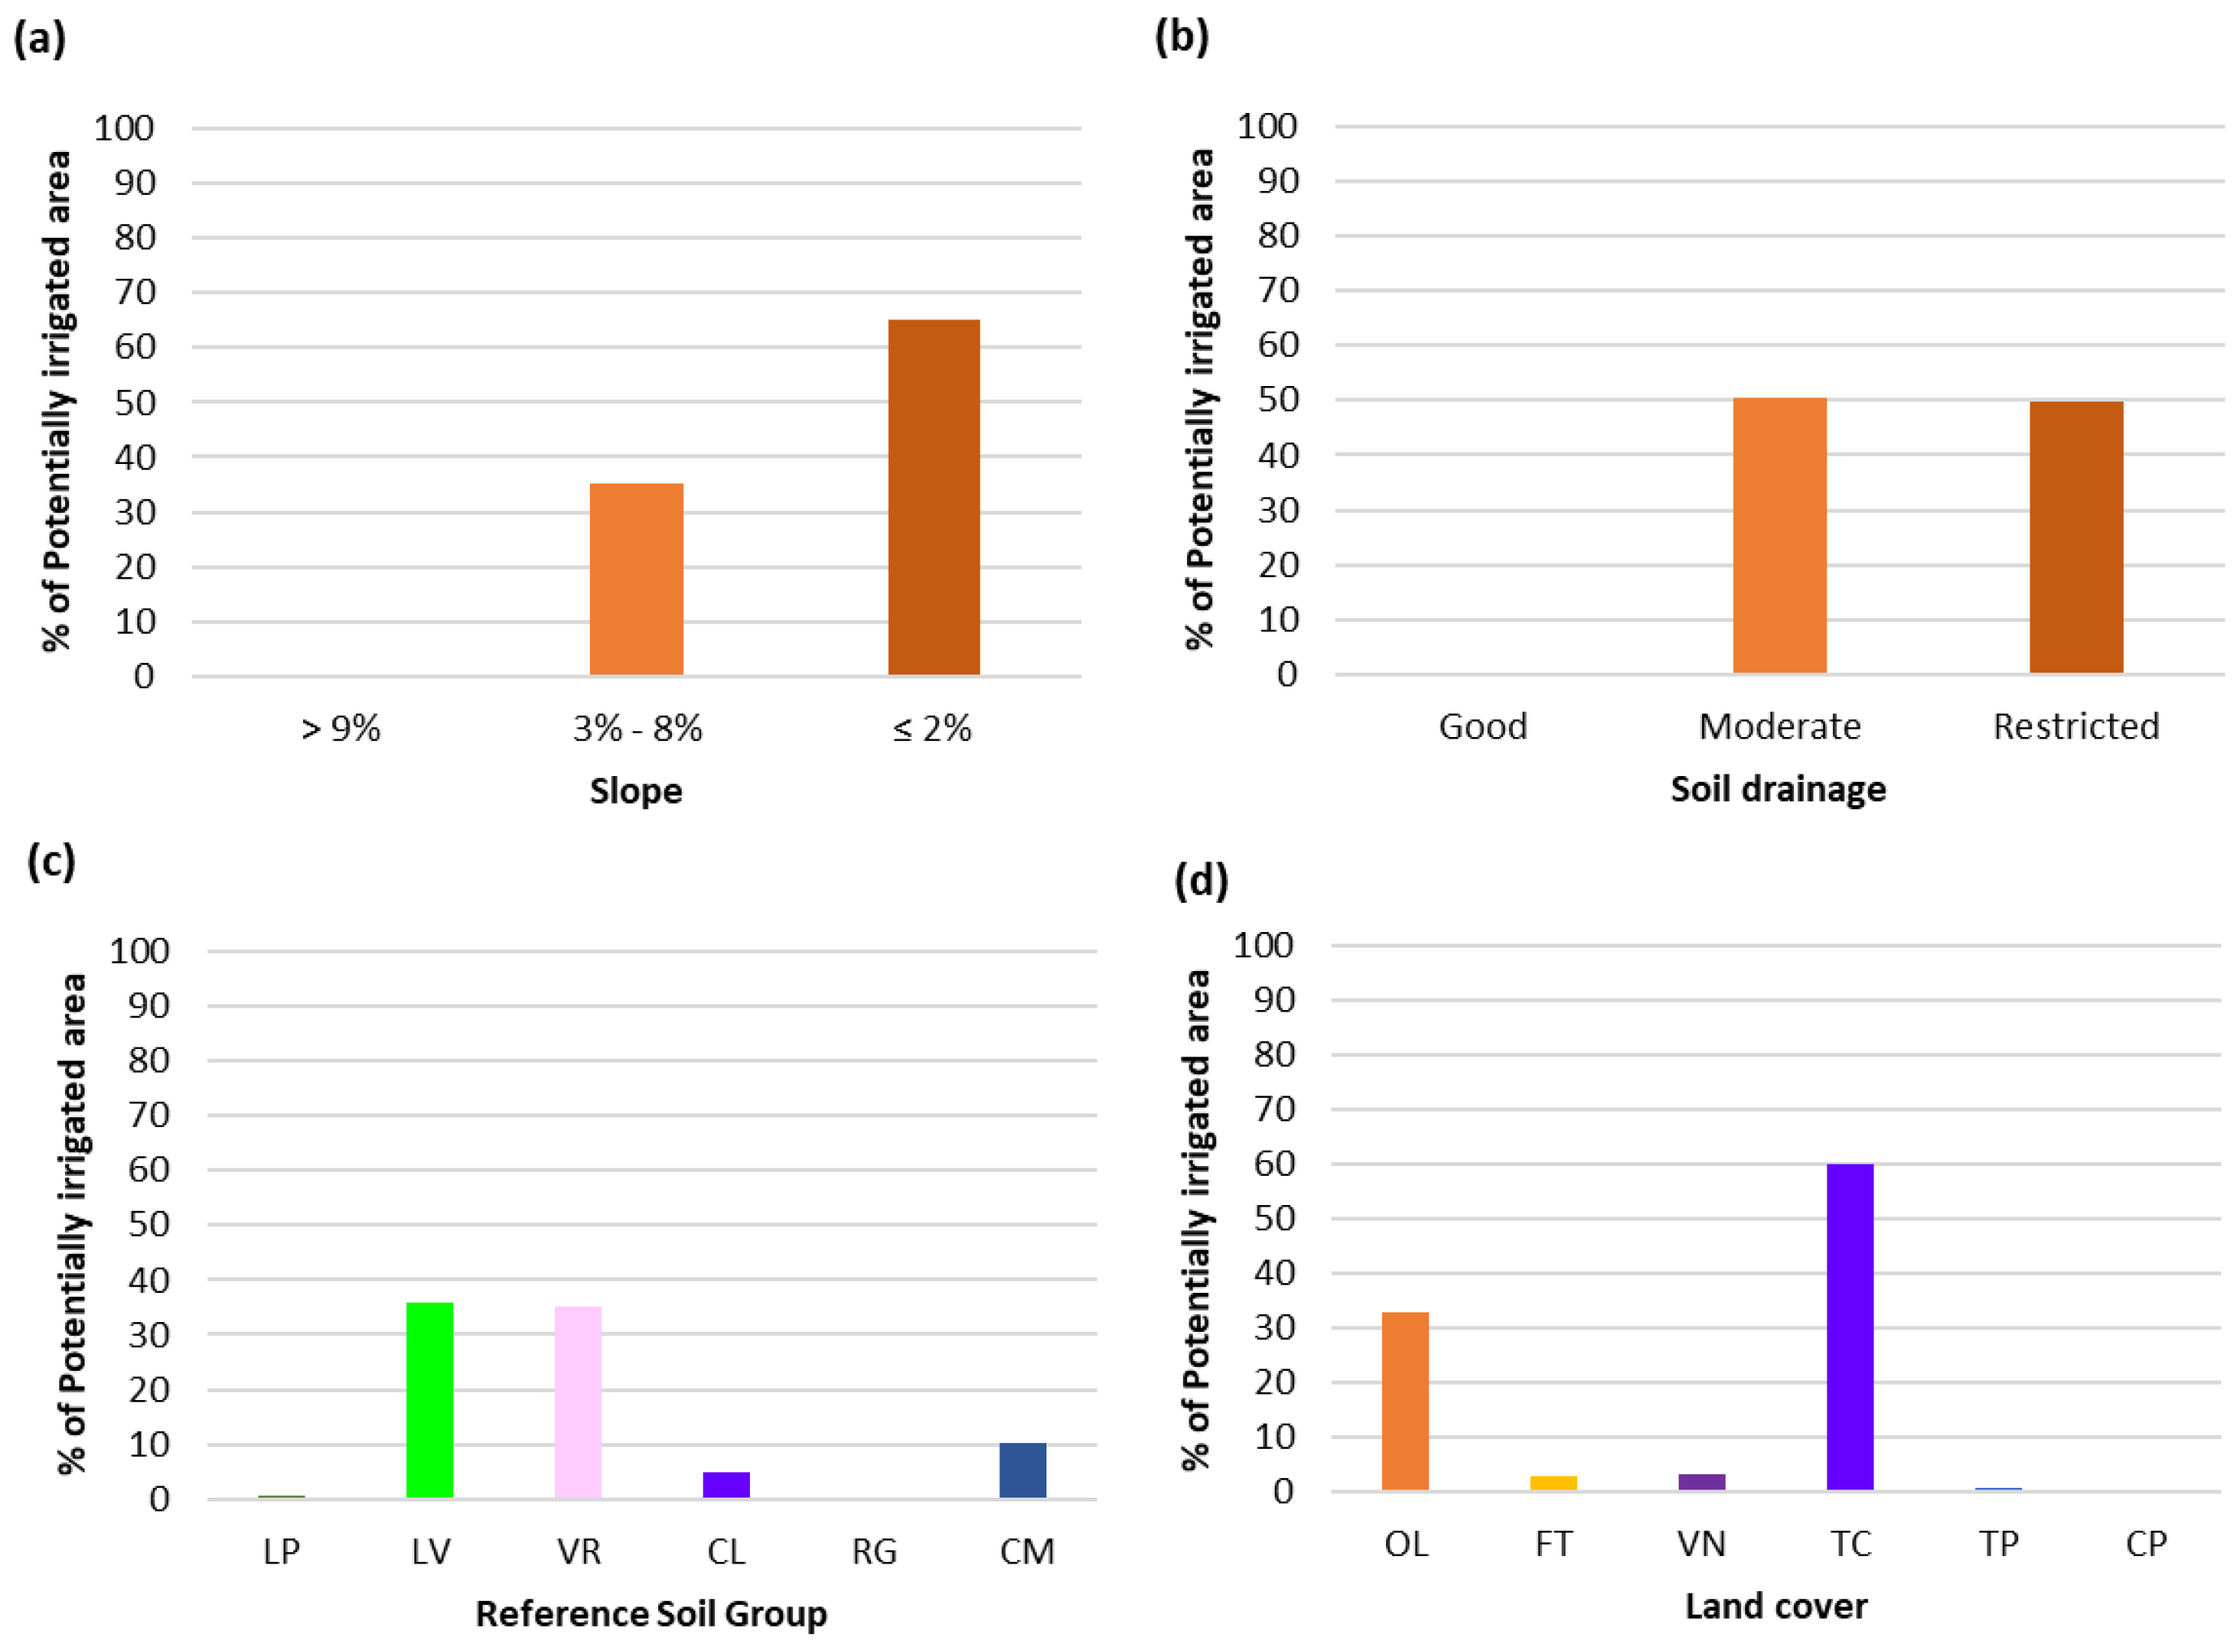
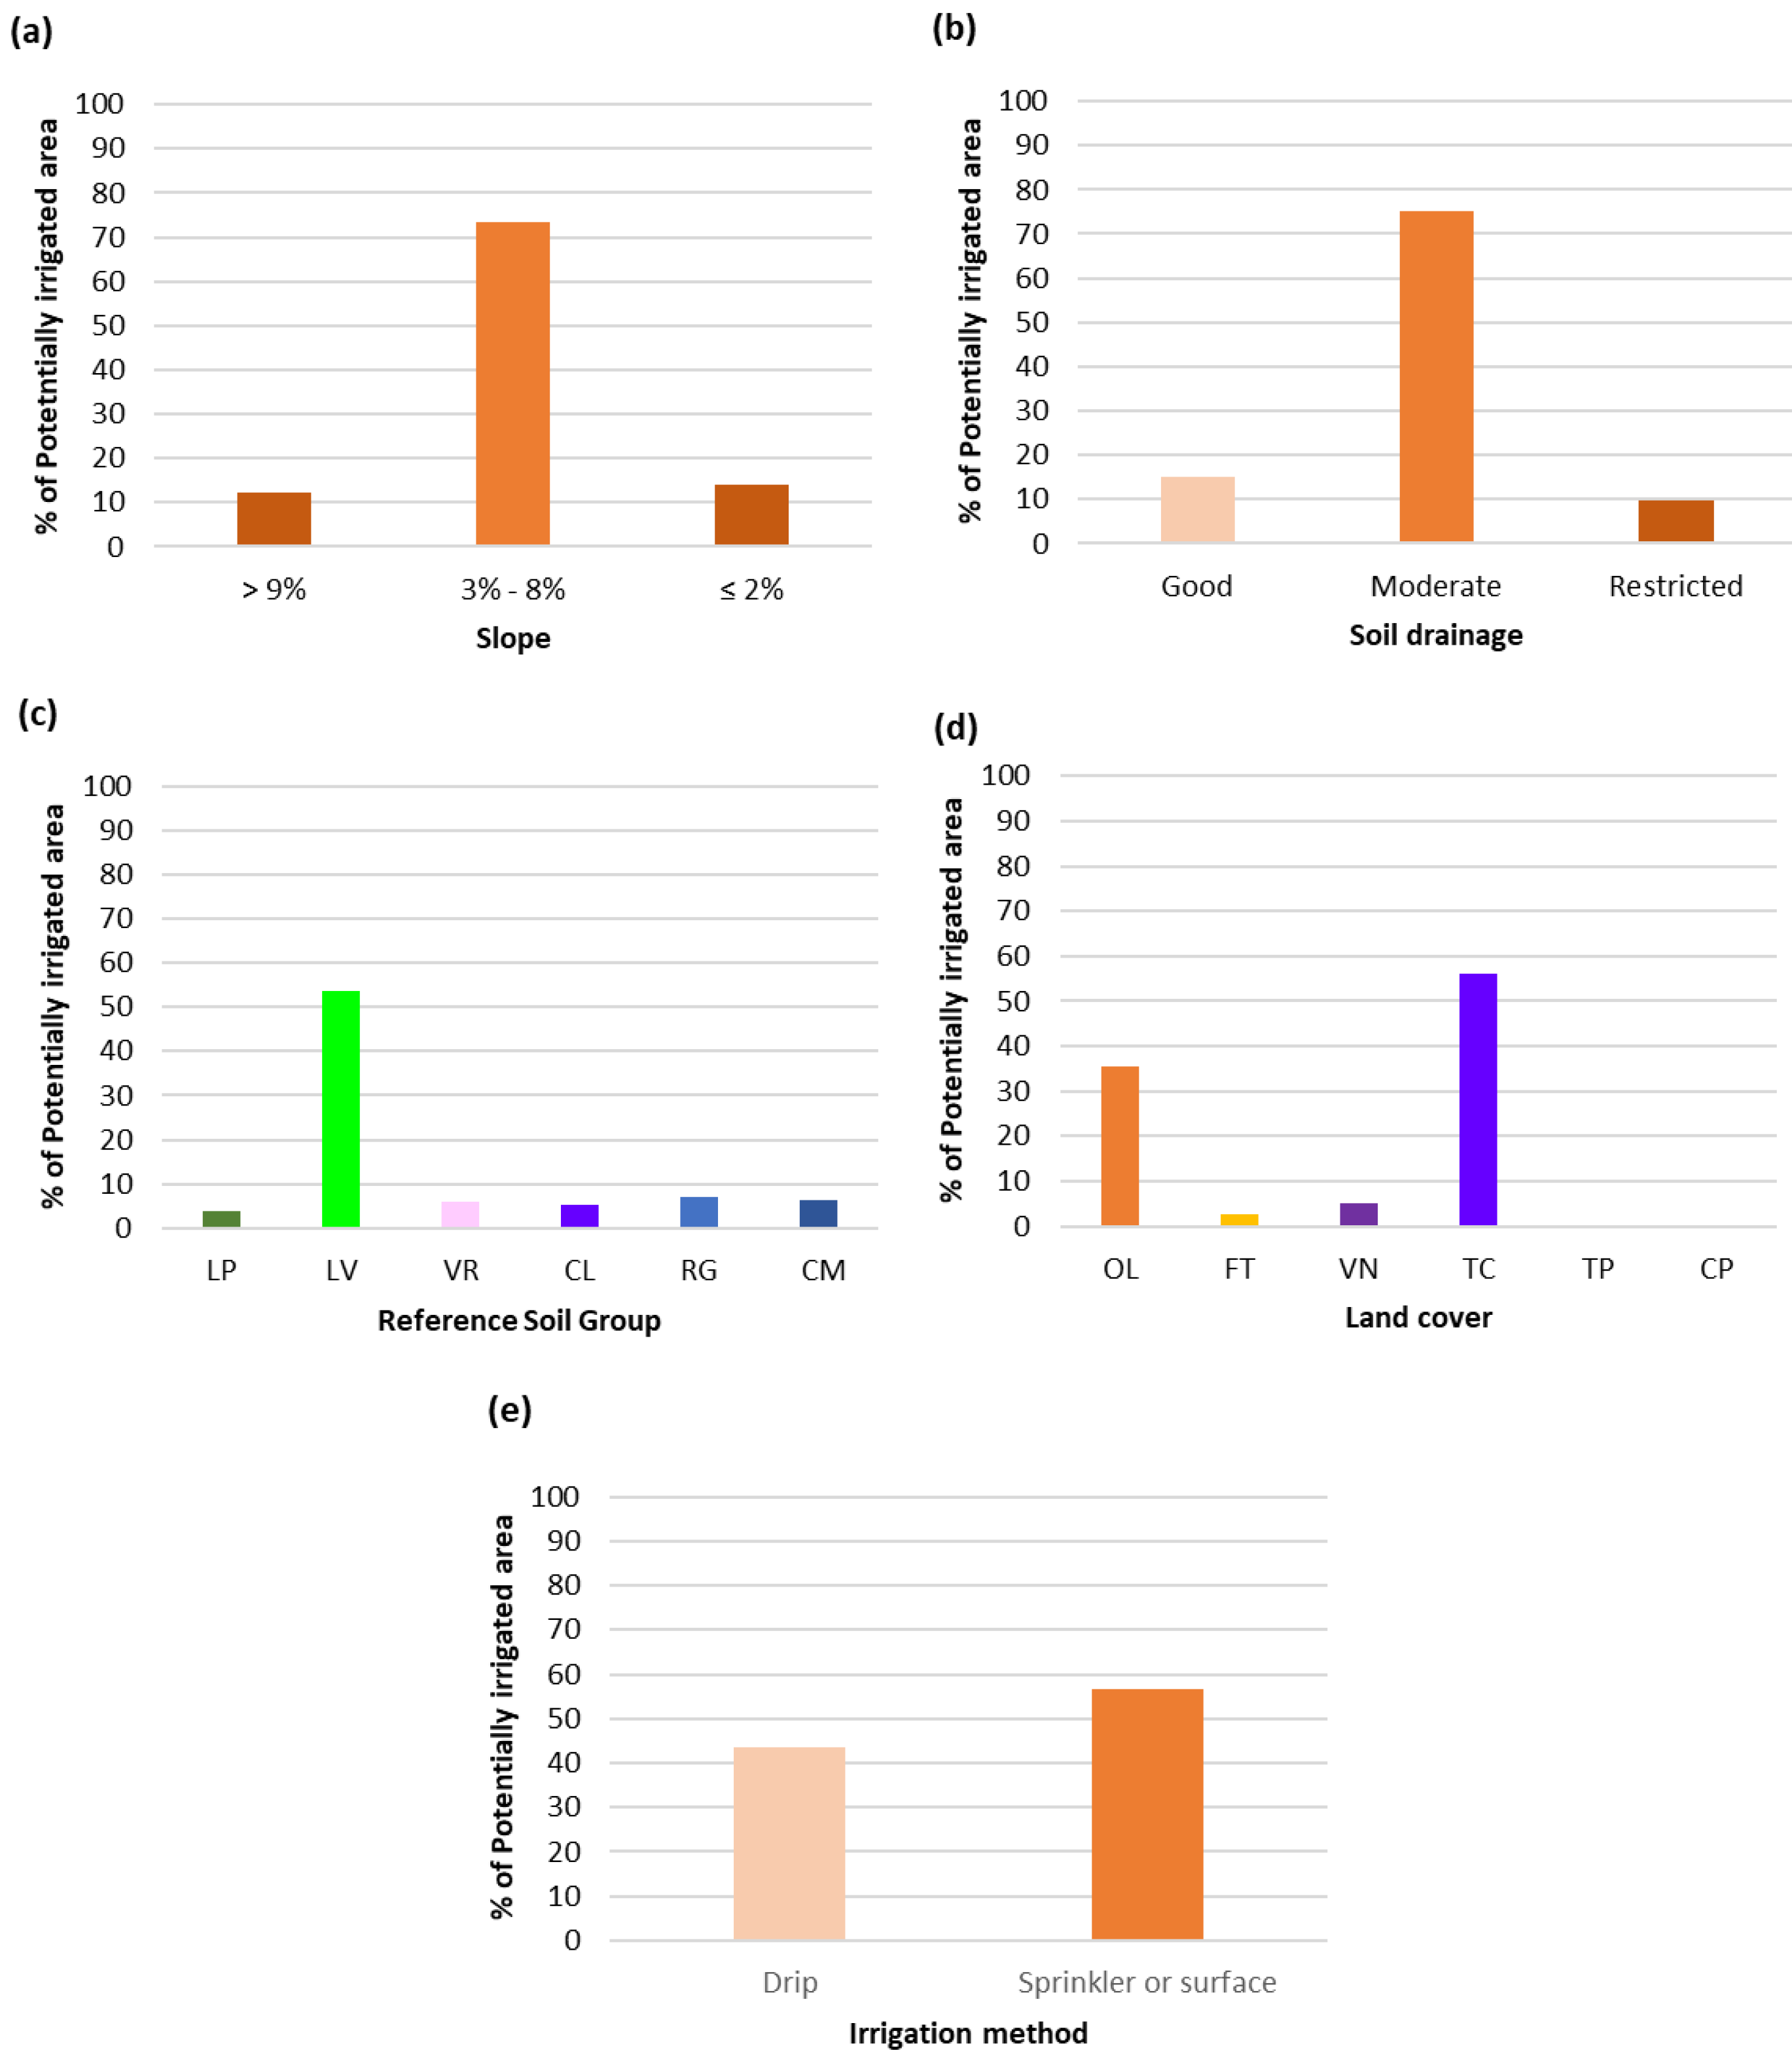
The application of the Salinization Risk (RSA) index to Inland Alentejo indicated that areas under moderate risk, where land-use practices should be monitored carefully, showed a prevalence of low slopes and fine-textured soils like Luvisols and Vertisols with limited drainage conditions.
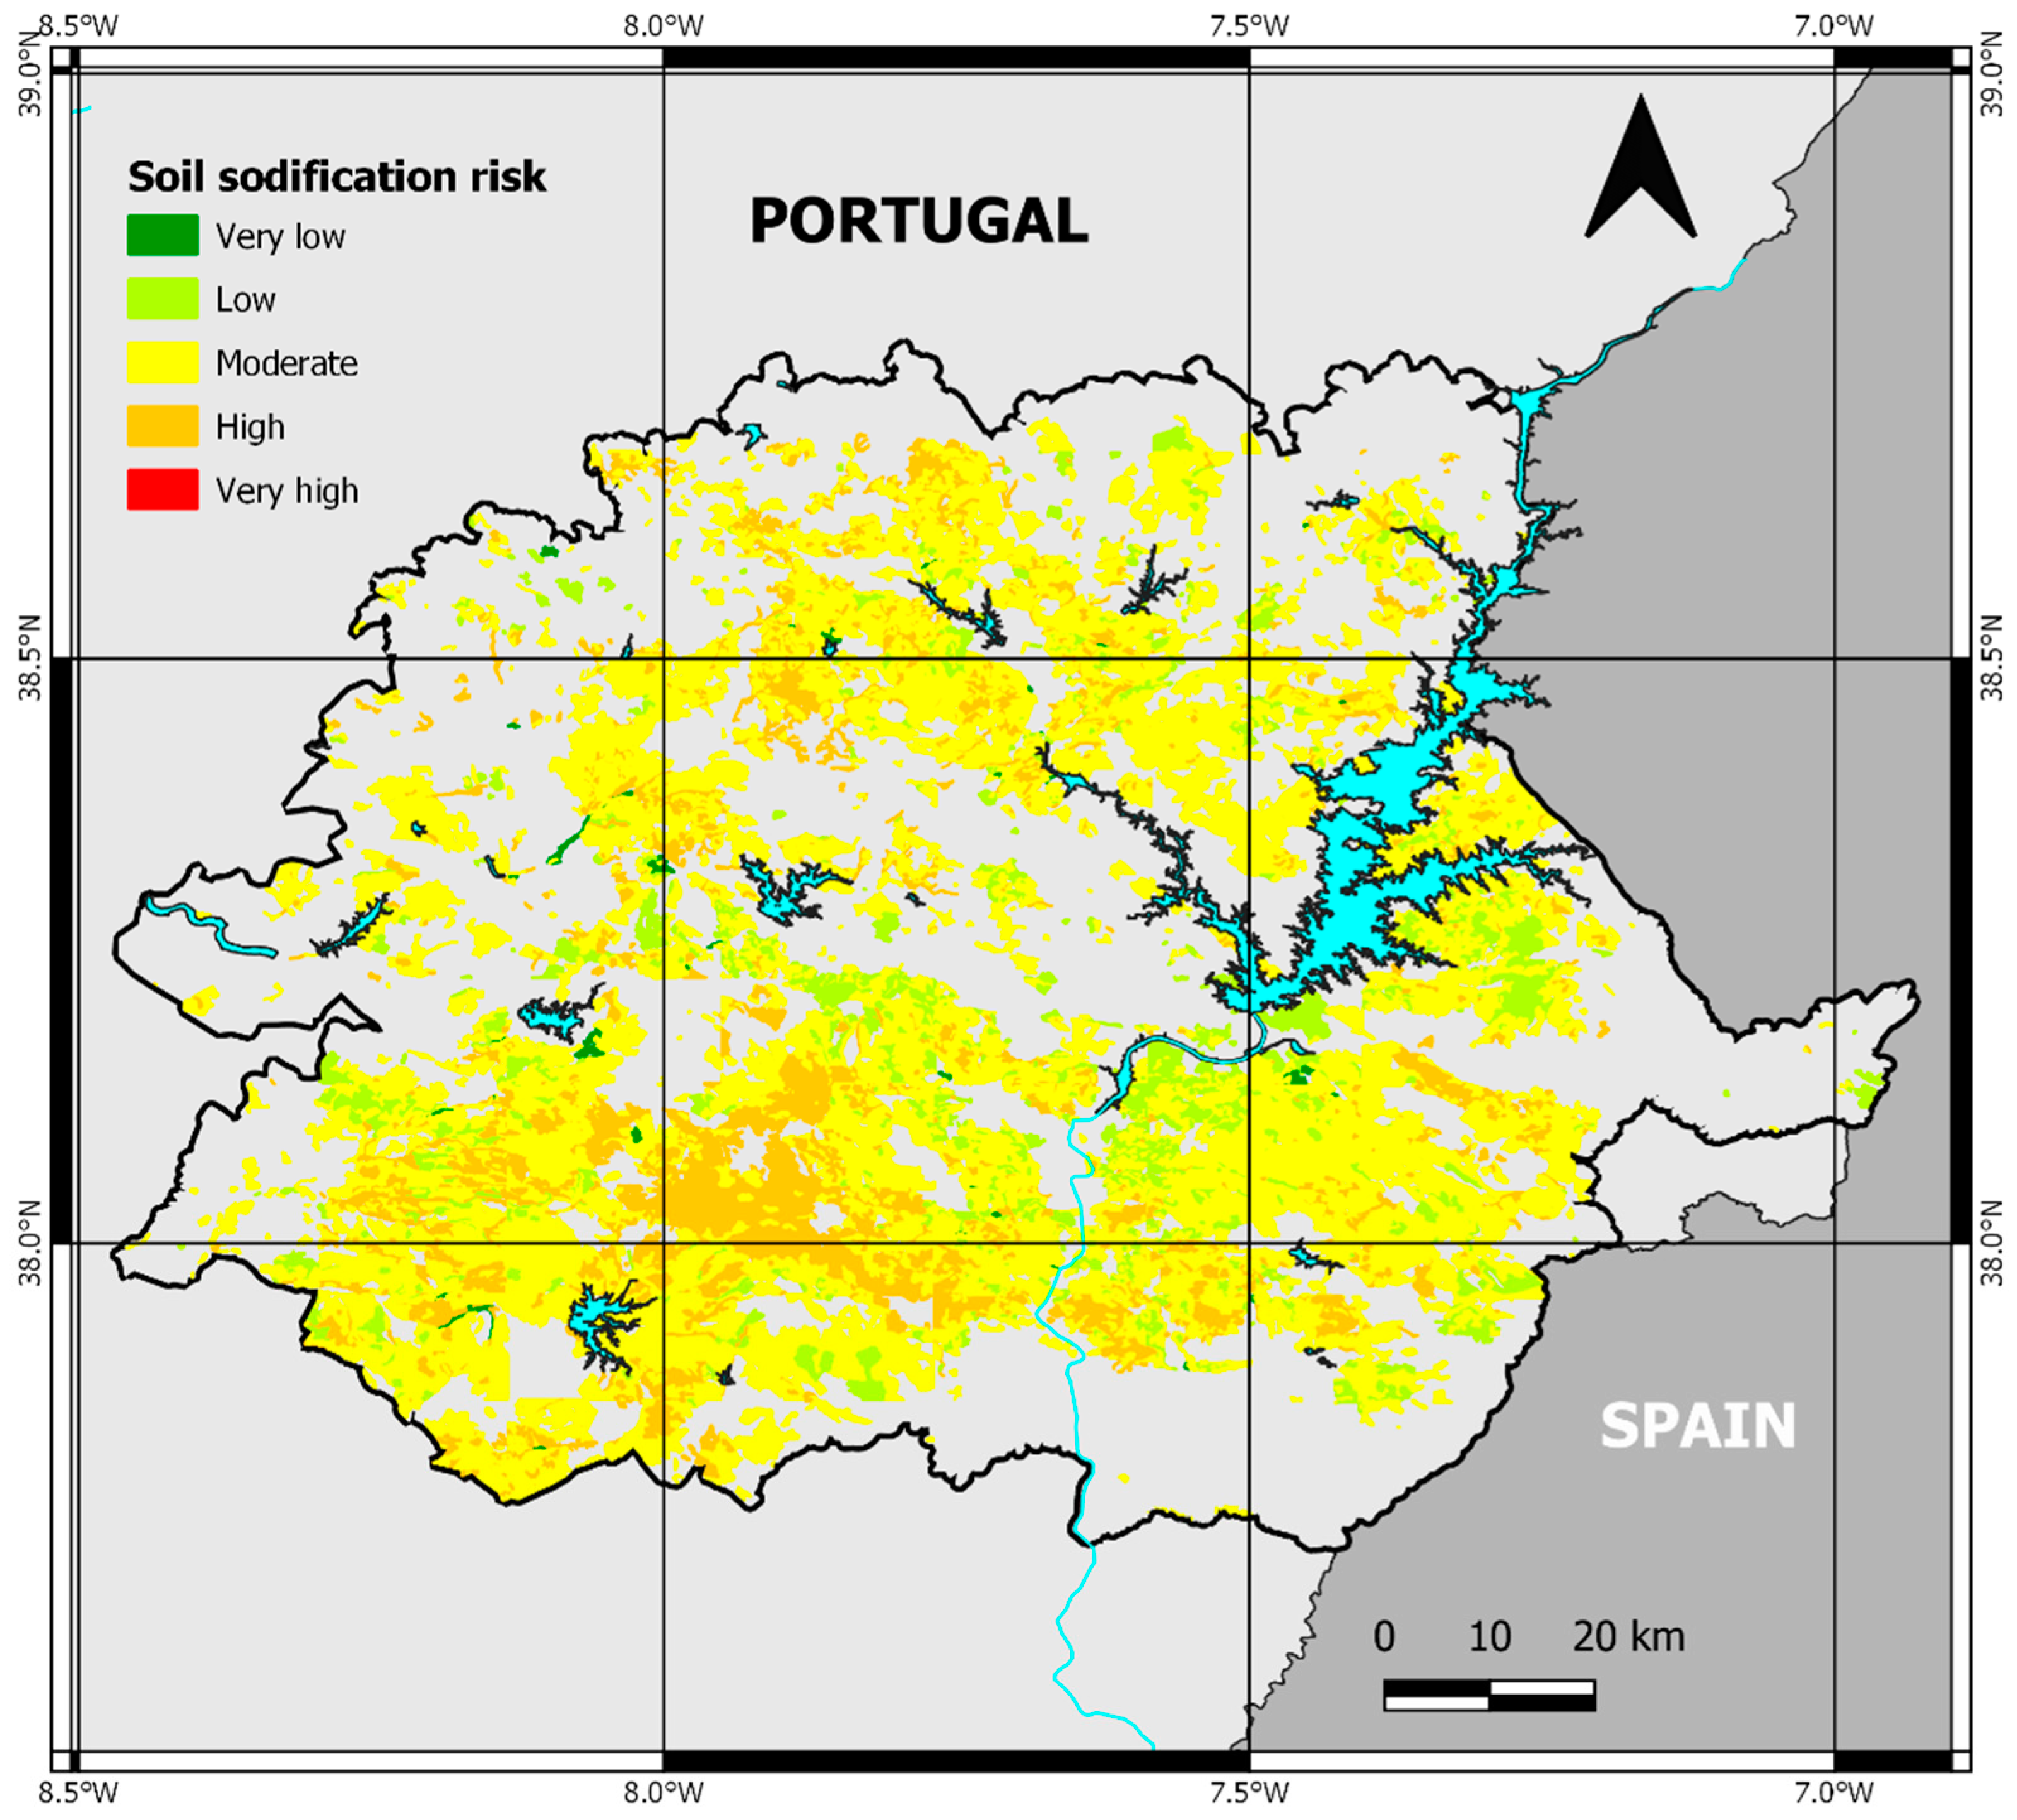
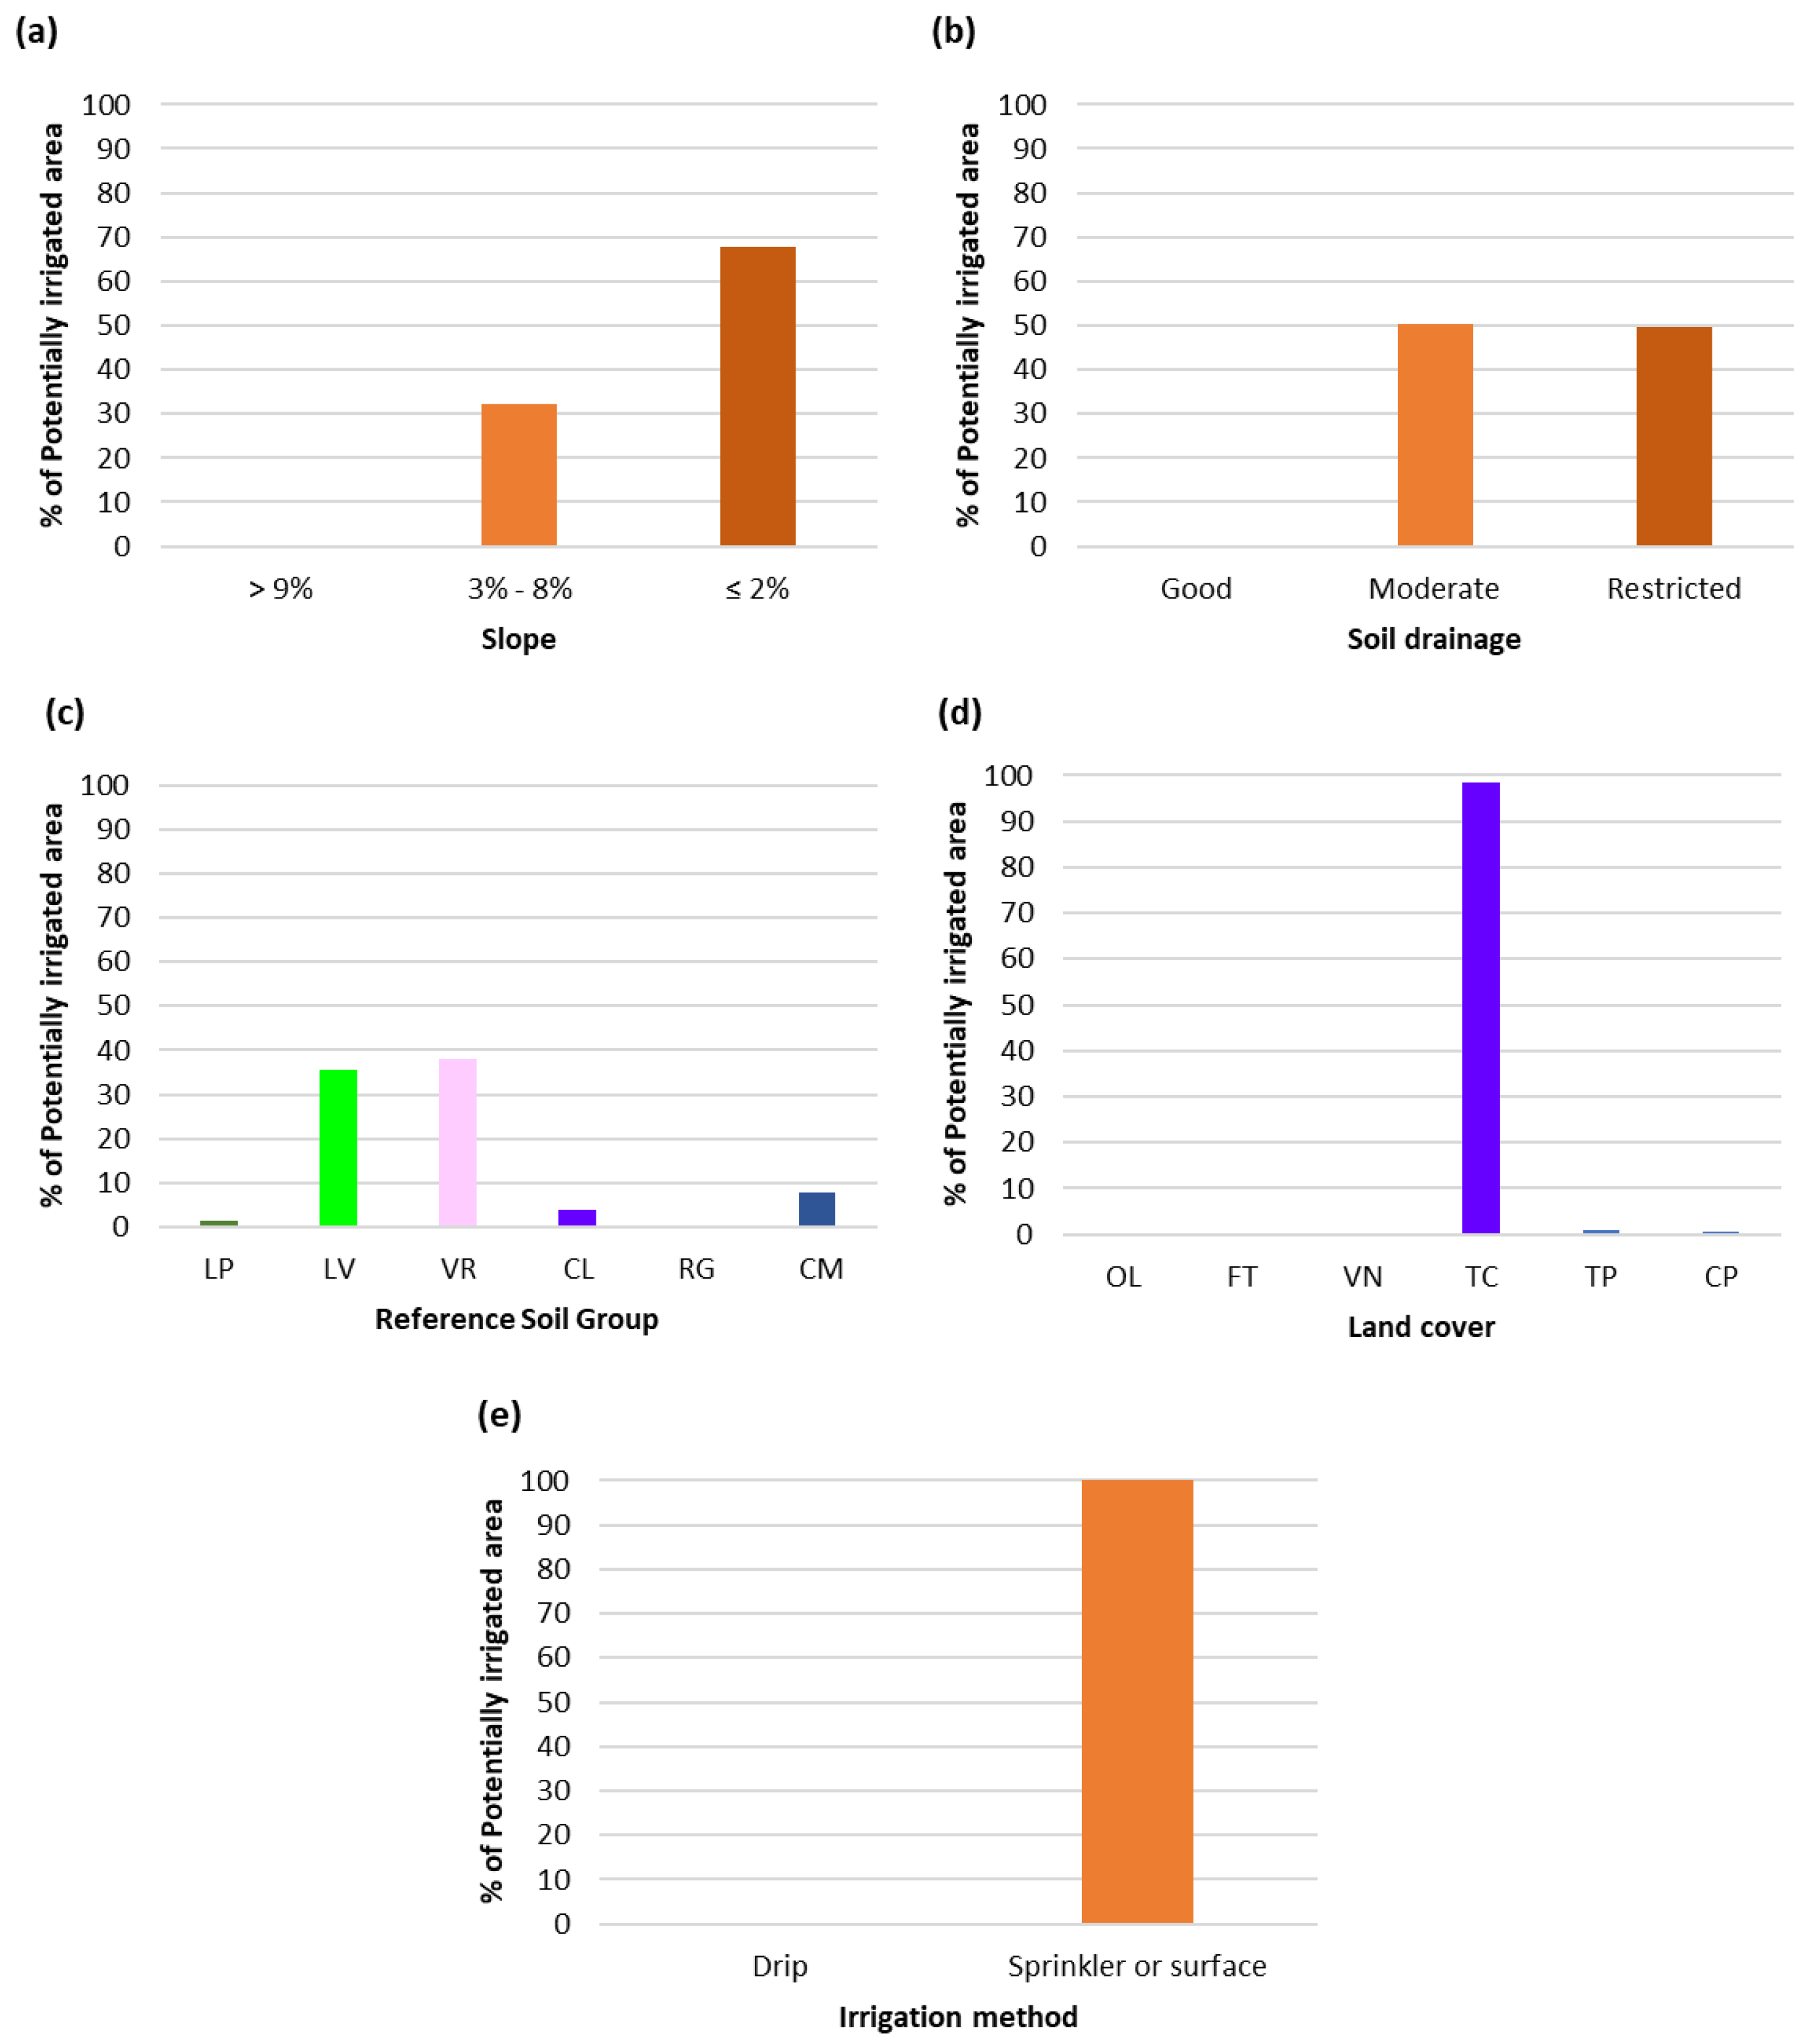
The Sodification Risk (RSO) index calculations estimated a predominance of moderate- and high-risk potentially irrigated lands, corresponding to management practices which leave land exposed to agri-environmental degradation or are conductive to agri-environmental degradation. High-risk areas had a large incidence of low slope terrain, moderate-to-restricted soil drainage in high clay content Luvisols, Vertisols and Cambisols, and annual crops irrigated with surface or sprinkler systems.
Although the RSA and RSO indices have been proposed for a risk prediction purpose, and despite the fact that their validation with soil sampling or with in situ measurements with proximal sensors was outside the scope of this work, more precise knowledge is very important, especially in areas identified as of moderate and high risk. In this sense, it is our goal to develop work to validate the methodology presented in order to identify assumptions that must be adjusted or to integrate indicators of the current state of soil salinity and sodicity. Further possible developments of this methodology also include the application of these indices to different climate change scenarios, assessing the impact of expected increased aridity and decreased irrigation water quality on the risk of development of soil salinization and sodification processes in irrigated Mediterranean areas.
The proposed risk indices integrated climate, topography, soil, water quality, and crop indicators that are easily available for large scale assessments and territorial planning but can be applied at the farm level scale, encouraging farmers to get to know their land better, implement soil monitoring and adopt agronomic strategies that contribute to the sustainability of irrigated agriculture.

Supplementary Materials

The following are available online at https://www.mdpi.com/2073-4441/12/12/3569/s1, Figure S1: Predominant soils of the study area. Figure S2: Land occupation and use of the study area, in 2018.

Author Contributions

Conceptualization, A.T.; investigation, A.T., P.P., S.F., A.L., M.J.C., P.A., M.P., and R.S.; writing—original draft preparation, A.T.; writing—review and editing, A.T., P.P., M.J.C., P.A., M.P., and R.S; supervision, A.T. and P.P.; Visualization, A.T. and M.J.C. All authors have read and agreed to the published version of the manuscript.

Funding

This research is co-funded by the European Union through the European Regional Development Fund, included in the COMPETE 2020 (Operational Program Competitiveness and Internationalization) through the ICT project (UIDB/04683/2020) with the reference POCI-01-0145-FEDER-007690, the ALOP project (ALT20-03-0145-FEDER-000004), and through Geobiotec (UIDP/04035/2020), funded by FCT—Fundação para a Ciência e a Tecnologia, Portugal.

Acknowledgments

The authors thank the General Directorate of Agriculture and Rural Development of Portugal (DGADR—Direção Geral de Agricultura e Desenvolvimento Rural) for providing the Portuguese soil maps and soil capacity maps in digital form used in this study.

Conflicts of Interest

The authors declare no conflict of interest.

References

  1. Butcher, K.; Wick, A.F.; DeSutter, T.; Chatterjee, A.; Harmon, J. Soil Salinity: A Threat to Global Food Security. Agron. J. 2016, 108, 2189–2200. [Google Scholar] [CrossRef]
  2. Qadir, M.; Quillérou, E.; Nangia, V.; Murtaza, G.; Singh, M.; Thomas, R.J.; Drechsel, P.; Noble, A.D. Economics of salt-induced land degradation and restoration. Nat. Resour. Forum 2014, 38, 282–295. [Google Scholar] [CrossRef]
  3. FAO. The State of the World’s Land and Water Resources for Food and Agriculture (SOLAW) – Managing Systems at Risk; Food and Agriculture Organization of the United Nations: Rome and Earthscan: London, UK, 2011; ISBN 978-92-5-106614-0. [Google Scholar]
  4. UNESCO. WWDR2014 The United Nations World Water Development Report 2014: Water and Energy; Facts and Figures; The United Nations World Water Development Report; UNESCO: Paris, France, 2014. [Google Scholar]
  5. Weil, R.R.; Brady, N.C. The Nature and Properties of Soils, 15th ed.; Pearson: Columbus, OH, USA, 2016; ISBN 978-0-13-325448-8. [Google Scholar]
  6. Zalidis, G.; Stamatiadis, S.; Takavakoglou, V.; Eskridge, K.; Misopolinos, N. Impacts of agricultural practices on soil and water quality in the Mediterranean region and proposed assessment methodology. Agric. Ecosyst. Environ. 2002, 88, 137–146. [Google Scholar] [CrossRef]
  7. Aragüés, R.; Urdanoz, V.; Çetin, M.; Kirda, C.; Daghari, H.; Ltifi, W.; Lahlou, M.; Douaik, A. Soil salinity related to physical soil characteristics and irrigation management in four Mediterranean irrigation districts. Agric. Water Manag. 2011, 98, 959–966. [Google Scholar] [CrossRef] [Green Version]
  8. Mateo-Sagasta, J.; Burke, J. Agriculture and Water Quality Interactions: A Global Overview; SOLAW Background Thematic Report-TR08; Food and Agriculture Organization of the United Nations: Rome, Italy, 2010. [Google Scholar]
  9. Stolte, J.; Tesfai, M.; Øygarden, L.; Kværnø, S.; Keizer, J.; Verheijen, F.; Panagos, P.; Ballabio, C.; Hessel, R. Soil Threats in Europe; Publications Office: Luxembourg, 2015; ISBN 978-92-79-54018-9. [Google Scholar]
  10. Yeo, A. Predicting the interaction between the effects of salinity and climate change on crop plants. Sci. Hortic. 1998, 78, 159–174. [Google Scholar] [CrossRef]
  11. Tomaz, A.; Palma, P.; Alvarenga, P.; Gonçalves, M.C. Chapter 13—Soil salinity risk in a climate change scenario and its effect on crop yield. In Climate Change and Soil Interactions; Prasad, M.N.V., Pietrzykowski, M., Eds.; Elsevier: Amsterdam, The Netherlands, 2020; pp. 351–396. ISBN 978-0-12-818032-7. [Google Scholar]
  12. Tomaz, A.; Palma, P.; Fialho, S.; Lima, A.; Alvarenga, P.; Potes, M.; Salgado, R. Spatial and temporal dynamics of irrigation water quality under drought conditions in a large reservoir in Southern Portugal. Environ. Monit. Assess. 2020, 192, 93. [Google Scholar] [CrossRef]
  13. Rengasamy, P. Soil processes affecting crop production in salt-affected soils. Funct. Plant Biol. 2010, 37, 613. [Google Scholar] [CrossRef]
  14. Hillel, D. Salinity Management for Sustainable Irrigation: Integrating Science, Environment, and Economics; The World Bank: Washington, DC, USA, 2000; ISBN 978-0-8213-4773-7. [Google Scholar]
  15. de Paz, J.M.; Visconti, F.; Zapata, R.; Sánchez, J. Integration of two simple models in a geographical information system to evaluate salinization risk in irrigated land of the Valencian Community, Spain. Soil Use Manag. 2004, 20, 333–342. [Google Scholar] [CrossRef]
  16. Eckelmann, W.; Baritz, R.; Bialousz, S.; Bielek, P.; Carre, F.; Houskova, B.; Jones, R.J.A.; Kibblewhite, M.; Kozak, J.; le Bas, C.; et al. Common Criteria for Risk Area Identification According to Soil Threats; Office for Official Publications of the European Communities: Luxembourg, 2006. [Google Scholar]
  17. Bloem, E.; van der Zee, S.E.A.T.M.; Tóth, T.; Hagyo, A. Risk Assessment methods of Salinity; Publications Office of the European Union: Luxembourg, 2008. [Google Scholar]
  18. Shahid, S. Developments in Soil Salinity Assessment, Modeling, Mapping, and Monitoring from Regional to Submicroscopic Scales. In Developments in Soil Salinity Assessment and Reclamation; Shahid, S., Abdelfattah, M., Taha, F., Eds.; Springer: Dordrecht, The Netherlands, 2013; pp. 3–43. ISBN 978-94-007-5683-0. [Google Scholar]
  19. Corwin, D.L.; Rhoades, J.D.; Šimůnek, J. Leaching requirement for soil salinity control: Steady-state versus transient models. Agric. Water Manag. 2007, 90, 165–180. [Google Scholar] [CrossRef]
  20. Letey, J.; Feng, G. Dynamic versus steady-state approaches to evaluate irrigation management of saline waters. Agric. Water Manag. 2007, 91, 1–10. [Google Scholar] [CrossRef]
  21. Castanheira, N.; Paz, A.; Farzamian, M.; Paz, M.C.; Santos, F.; Fernandes, M.; Pires, F.; Gonçalves, M. Modelling of soil water and salt dynamics and prediction of salinity risks in Lezíria (Portugal) in response to different qualities of irrigation water. Rev. Cienc. Agrarias 2020, 43, 161–173. [Google Scholar] [CrossRef]
  22. Daliakopoulos, I.N.; Tsanis, I.K.; Koutroulis, A.; Kourgialas, N.N.; Varouchakis, A.E.; Karatzas, G.P.; Ritsema, C.J. The threat of soil salinity: A European scale review. Sci. Total Environ. 2016, 573, 727–739. [Google Scholar] [CrossRef] [PubMed]
  23. Thompson, R.; Amezketa, E.; Nuñez, M.; Falsone, G.; Toth, T.; Paz, A.; Gonçalves, M.; Castanheira, N.; Gould, I.; Tamvakidis, S. EIP-AGRI Focus Group Soil salinisation: Final Report. MINIPAPER: Measuring, Mapping and Monitoring of Soil Salinity; The European Innovation Partnership: Brussels, Belgium, 2020. [Google Scholar]
  24. Toth, G.; Montananella, L.; Rusco, E. Threats to Soil Quality in Europe; EUR Scientific and Technical Research Series; Office for Official Publications of the European Communities: Luxembourg, 2008; ISBN 978-92-79-09529-0. [Google Scholar]
  25. ESDB. The European Soil Database Distribution Version 2.0, European Commission and the European Soil Bureau Network, CD-ROM, EUR 19945 EN. 2004.
  26. Odeh, I.O.A.; Onus, A. Spatial Analysis of Soil Salinity and Soil Structural Stability in a Semiarid Region of New South Wales, Australia. Environ. Manag. 2008, 42, 265–278. [Google Scholar] [CrossRef]
  27. Echeverri-Sanchez, A.; Facundo-Péres, C.F.; Angulo-Rojas, P.; Urrutia-Cobo, N. A Methodological Approach for Assessing Soil Salinity Hazard in Irrigated Areas. Case Study: The Rut Irrigation District, Colombia. Rev. Ing. Univ. Medellin 2016, 15, 13–26. [Google Scholar] [CrossRef] [Green Version]
  28. El Harti, A.; Lhissou, R.; Chokmani, K.; Ouzemou, J.E.; Hassouna, M.; Bachaoui, E.M.; El Ghmari, A. Spatiotemporal monitoring of soil salinization in irrigated Tadla Plain (Morocco) using satellite spectral indices. Int. J. Appl. Earth Obs. Geoinf. 2016, 50, 64–73. [Google Scholar] [CrossRef]
  29. Zhou, D.; Lin, Z.; Liu, L.; Zimmermann, D. Assessing secondary soil salinization risk based on the PSR sustainability framework. J. Environ. Manag. 2013, 128, 642–654. [Google Scholar] [CrossRef] [PubMed]
  30. Biggs, A.J.W.; Searle, R.D.; Watling, K.M.; Secombe, K.E.; Larkin, L.M. Implementation of an adaptive salinity risk framework in the Condamine catchment, Queensland Murray-Darling Basin, Australia. Int. J. Geogr. Inf. Sci. 2009, 23, 441–456. [Google Scholar] [CrossRef]
  31. Eilers, R.G.; Eilers, W.D.; Fitzgerald, M.M. A Salinity Risk Index for Soils of the Canadian Prairies. Hydrogeol. J. 1997, 5, 68–79. [Google Scholar] [CrossRef]
  32. Wiebe, B.H.; Eilers, R.G.; Eilers, W.D.; Brierley, J.A. Application of a risk indicator for assessing trends in dryland salinization risk on the Canadian Prairies. Can. J. Soil Sci. 2007, 87, 213–224. [Google Scholar] [CrossRef]
  33. Grundy, M.; Silburn, D.; Chamberlain, T. A risk framework for preventing salinity. Environ. Hazards 2007, 7, 97–105. [Google Scholar] [CrossRef]
  34. OECD. OECD Environmental Indicators. Development, Measure and Use; Organization for Economic Co-Operation and Development; OECD Environment Directorate; Environmental Performance and Information Division: Paris, France, 2003; p. 37. [Google Scholar]
  35. Masoudi, M.; Patwardhan, A.M.; Gore, S.D. A new methodology for producing of risk maps of soil salinity, Case study: Payab Basin, Iran. J. Appl. Sci. Environ. Mgt. 2006, 10, 9–13. [Google Scholar] [CrossRef] [Green Version]
  36. Sentís, I.P. Advances in the prognosis of soil sodicity under dryland irrigated conditions. Int. Soil Water Conserv. Res. 2014, 2, 50–63. [Google Scholar] [CrossRef] [Green Version]
  37. Richards, L.A. Diagnosis and Improvement of Saline and Alkali Soils; Agriculture Handbook; USDA: Washington, DC, USA, 1954; Volume 60.
  38. Bresler, E.; McNeal, B.L.; Carter, D.L. Saline and Sodic Soils. Principles-Dynamics-Modeling; Advanced Series in Agricultural Sciences; Springer: Berlin, Germany, 1982; Volume 10, ISBN 978-3-642-68326-8. [Google Scholar]
  39. Maas, E.V.; Hoffman, G.J. Crop Salt Tolerance-Current Assessment. J. Irrig. Drain. Div. 1977, 103, 115–134. [Google Scholar]
  40. Maas, E.V.; Grattan, S.R. Crop Yields as Affected by Salinity. In Agricultural Drainage; Agronomy Monograph; American Society of Agronomy, Crop Science Society of America, Soil Science Society of America: Madison, WI, USA, 1999; pp. 55–108. ISBN 978-0-89118-230-6. [Google Scholar]
  41. Zörb, C.; Geilfus, C.-M.; Dietz, K.-J. Salinity and crop yield. Plant Biol. 2019, 21, 31–38. [Google Scholar] [CrossRef] [PubMed]
  42. Machado, R.; Serralheiro, R. Soil Salinity: Effect on Vegetable Crop Growth. Management Practices to Prevent and Mitigate Soil Salinization. Horticulturae 2017, 3, 30. [Google Scholar] [CrossRef]
  43. Compton, A. A Review of Rationale for EC and SAR Standards; Water Quality Planning Bureau, Water Quality Standards Section; Montana Department of Environmental Quality: Helena, MT, USA, 2011.
  44. Pisinaras, V.; Tsihrintzis, V.A.; Petalas, C.; Ouzounis, K. Soil salinization in the agricultural lands of Rhodope District, northeastern Greece. Environ. Monit. Assess. 2010, 166, 79–94. [Google Scholar] [CrossRef]
  45. Tanji, K.K.; Kielen, N.C. Agricultural Drainage Water Management in Arid and Semi-Arid Areas; FAO irrigation and drainage paper; Food and Agriculture Organization of the United Nations: Rome, Italy, 2002; ISBN 978-92-5-104839-9. [Google Scholar]
  46. IUSS Working Group WRB. World Reference Base for Soil Resources 2014: International Soil Classification System for Naming Soils and Creating Legends for Soil Maps. Update 2015; World Soil Resources Report; Food and Agriculture Organization of the United Nations; FAO: Rome, Italy, 2015; ISBN 978-92-5-108369-7. [Google Scholar]
  47. Ramos, T.; Gonçalves, M.C.; Martins, J.C.; Pires, F.; Pereira, L.S. Propriedades hidráulicas do solo para as diferentes classes texturais. Rev. Ciências Agrárias 2011, 34, 252–264. [Google Scholar]
  48. Rawls, W.J.; Brakensiek, K.; Saxton, K.E. Estimation of soil water properties. Trans. Am. Soc. Agric. Eng. 1982, 25, 305–316. [Google Scholar] [CrossRef]
  49. Freeze, R.A.; Cherry, J.A. Groundwater; Prentice-Hall, Inc.: Englewood Cliffs, NJ, USA, 1979; ISBN 0-13-365312-9. [Google Scholar]
  50. Schofield, R.V.; Kirkby, M.J. Application of salinization indicators and initial development of potential global soil salinization scenario under climatic change. Glob. Biogeochem. Cycles 2003, 17. [Google Scholar] [CrossRef]
  51. Rhoades, J.D.; Kandiah, A.; Mashali, A.M. The Use of Saline Waters for Crop Production; FAO irrigation and drainage paper; Food and Agriculture Organization of the United Nations: Rome, Italy, 1992; ISBN 978-92-5-103237-4. [Google Scholar]
  52. Ayers, R.S.; Westcot, D.W. Water Quality for Agriculture; FAO irrigation and drainage paper; Food and Agriculture Organization of the United Nations: Rome, Italy, 1985; ISBN 978-92-5-102263-4. [Google Scholar]
  53. Pereira, L.; Cordery, I.; Iacovides, I. Coping with Water Scarcity: Addressing the Challenges; Springer: Dordrecht, The Netherlands, 2009; ISBN 978-1-4020-9578-8. [Google Scholar]
  54. Pla Sentis, I. Soil salinisation and land desertification. In Soil Degradation and Desertification in Mediterranean Environments; Rubio, J.L., Calvo, A., Eds.; Geoforma: Logroño, Spain, 1996; pp. 105–129. [Google Scholar]
  55. UNEP. World Atlas of Desertification; The United Nations Environmental Programme: London, UK, 1993. [Google Scholar]
  56. Tomaz, A.; Patanita, M.; Guerreiro, I.; Dôres, J.; Boteta, L.; Palma, J. Efficient use of water and nutrients in irrigated cropping systems in the Alqueva region. Span. J. Soil Sci. 2018, 8, 12–23. [Google Scholar] [CrossRef]
  57. DGADR Sistema de Informação do Regadio. Available online: http://sir.dgadr.gov.pt/expl-alentejo (accessed on 6 September 2020).
  58. Palma, P.; Alvarenga, P.; Palma, V.L.; Fernandes, R.M.; Soares, A.M.; Barbosa, I.R. Assessment of anthropogenic sources of water pollution using multivariate statistical techniques: A case study of the Alqueva’s reservoir, Portugal. Environ. Monit. Assess. 2010, 165, 539–552. [Google Scholar] [CrossRef] [PubMed]
  59. Palma, P.; Ledo, L.; Soares, S.; Barbosa, I.R.; Alvarenga, P. Spatial and temporal variability of the water and sediments quality in the Alqueva reservoir (Guadiana Basin; southern Portugal). Sci. Total Environ. 2014, 470–471, 780–790. [Google Scholar] [CrossRef] [PubMed]
  60. Palma, P.; Köck-Schulmeyer, M.; Alvarenga, P.; Ledo, L.; Barbosa, I.R.; López de Alda, M.; Barceló, D. Risk assessment of pesticides detected in surface water of the Alqueva reservoir (Guadiana basin, southern of Portugal). Sci. Total Environ. 2014, 488–489, 208–219. [Google Scholar] [CrossRef] [PubMed]
  61. Palma, P.; Ledo, L.; Alvarenga, P. Assessment of trace element pollution and its environmental risk to freshwater sediments influenced by anthropogenic contributions: The case study of Alqueva reservoir (Guadiana Basin). CATENA 2015, 128, 174–184. [Google Scholar] [CrossRef] [Green Version]
  62. IPMA Climate Normals-1981–2010–Beja. Available online: https://www.ipma.pt/en/oclima/normais.clima/1981-2010/002/ (accessed on 6 July 2019).
  63. COTR SAGRA—Sistema Agrometeorológico para a Gestão da Rega no Alentejo (Agrometeorological System for Irrigation Management in Alentejo). Available online: http://www.cotr.pt/servicos/sagranet.php (accessed on 30 September 2020).
  64. Madeira, M.; Monteiro, F. A Base de Referência para os Solos do Mundo e a Classificação dos Solos de Portugal. Rev. Cienc. Agrárias 2004, 27, 13–23. [Google Scholar]
  65. Lopes, R.; Madeira, M.; Arsénio, P. Mapping of land units and land capability classification in Portugal. The case of Lourinhã Municipality. Finisterra 2017, 52, 103–127. [Google Scholar] [CrossRef] [Green Version]
  66. DGT Carta de Uso e Ocupação do Solo (COS2018); Direção Geral do Território: Lisboa, Portugal, 2018.
  67. EDIA. Anuário Agrícola de Alqueva 2019; Empresa de Desenvolvimento e Infraestruturas do Alqueva (Alqueva Development and Infrastructures Company): Beja, Portugal, 2019. [Google Scholar]
  68. Hersbach, H.; Dee, D. ERA5 reanalysis is in production. In ECMWF Newsletter 147; European Centre for Medium-Range Weather Forecasts: Reading, UK, 2016. [Google Scholar]
  69. ECMWF ERA5. Available online: https://cds.climate.copernicus.eu/cdsapp#!/dataset/reanalysis-era5-land-monthly-means?tab=overview (accessed on 3 November 2020).
  70. Romanenko, V.A. Computation of the autumn soil moisture using a universal relationship for a large area. Proc. Ukr. Hydrometeorol. Res. Inst. 1961, 3, 12–25. [Google Scholar]
  71. SROA/CNROA/IEADR Cartas de Solos e Capacidade de Uso. Available online: https://www.dgadr.gov.pt/cartografia/cartas-solos-cap-uso-digital (accessed on 15 May 2020).
  72. DGADR Nota explicativa da Carta de Solos de Portugal e da Carta de Capacidade de Uso do Solo. Available online: https://www.dgadr.gov.pt/nota-explicativa (accessed on 22 April 2020).
  73. APHA. Standard Methods for the Examination of Water and Wastewater, 12th ed.; American Public Health Association, American Water Works Association and Water Environmental Federation: Washington, DC, USA, 1998. [Google Scholar]
  74. Paulo, A.A.; Rosa, R.D.; Pereira, L.S. Climate trends and behaviour of drought indices based on precipitation and evapotranspiration in Portugal. Nat. Hazards Earth Syst. Sci. 2012, 12, 1481–1491. [Google Scholar] [CrossRef]
  75. Valverde, P.; Serralheiro, R.; de Carvalho, M.; Maia, R.; Oliveira, B.; Ramos, V. Climate change impacts on irrigated agriculture in the Guadiana river basin (Portugal). Agric. Water Manag. 2015, 152, 17–30. [Google Scholar] [CrossRef] [Green Version]
  76. Godinho, S.; Gil, A.; Guiomar, N.; Costa, M.J.; Neves, N. Assessing the role of Mediterranean evergreen oaks canopy cover in land surface albedo and temperature using a remote sensing-based approach. Appl. Geogr. 2016, 74, 84–94. [Google Scholar] [CrossRef]
  77. Hanson, B.R.; Grattan, S.R.; Fulton, A. Agricultural Salinity and Drainage; Division of Agriculture and Natural Resources Publication; University of California Irrigation Program: Davis, CA, USA, 2006; Volume 3375. [Google Scholar]
  78. Seydehmet, J.; Lv, G.-H.; Abliz, A.; Shi, Q.-D.; Abliz, A.; Turup, A. Irrigation Salinity Risk Assessment and Mapping in Arid Oasis, Northwest China. Water 2018, 10, 966. [Google Scholar] [CrossRef] [Green Version]
  79. Bouksila, F.; Bahri, A.; Berndtsson, R.; Persson, M.; Rozema, J.; Van der Zee, S.E. Assessment of soil salinization risks under irrigation with brackish water in semiarid Tunisia. Environ. Exp. Bot. 2013, 92, 176–185. [Google Scholar] [CrossRef]
  80. Kairis, O.; Kosmas, C.; Karavitis, C.H.; Ritsema, C.; Salvati, L.; Acikalin, S.; Alcalá, M.; Alfama, P.; Atlhopheng, J.; Barrera, J.; et al. Evaluation and Selection of Indicators for Land Degradation and Desertification Monitoring: Types of Degradation, Causes, and Implications for Management. Environ. Manag. 2014, 54, 971–982. [Google Scholar] [CrossRef]
  81. Ramos, T.B.; Darouich, H.; Šimůnek, J.; Gonçalves, M.C.; Martins, J.C. Soil salinization in very high-density olive orchards grown in southern Portugal: Current risks and possible trends. Agric. Water Manag. 2019, 217, 265–281. [Google Scholar] [CrossRef] [Green Version]
  82. Minhas, P.S.; Qadir, M.; Yadav, R.K. Groundwater irrigation induced soil sodification and response options. Agric. Water Manag. 2019, 215, 74–85. [Google Scholar] [CrossRef]
  83. Alexandre, C.; Borralho, T.; Durão, A. Evaluation of salinization and sodification in irrigated areas with limited soil data: Case study in southern Portugal. Span. J. Soil Sci. 2018. [Google Scholar] [CrossRef]
Figure 1. Map showing the location of Inland Alentejo, the Alqueva reservoir, and the sampling sites in floating platforms (Alamos-Captação, Alqueva-Montante, Alqueva-Mourão, and Lucefécit).
Water 12 03569 g001
Figure 2. Aridity Index map of the study area, according to UNEP classification [55]: hyper-arid (<0.05); arid (0.05–0.2); semi-arid (0.2–0.5); dry sub-humid (0.5–0.65); humid (≥0.65).
Water 12 03569 g002
Figure 3. Slope classes of the study area. I—>9%; II—3% to 8%; III—0% to 2%.
Water 12 03569 g003
Figure 4. Drainage classes of the study area. I—Good; II—Moderate; III—Restricted.
Water 12 03569 g004
Figure 5. Most likely irrigation method in the potentially irrigated study area.
Water 12 03569 g005
Figure 6. Spatial and temporal variation of ECW (a) and SAR (b), during 2018, at the Alqueva reservoir. Dots represent single in situ measurements. Bars represent mean and whiskers represent the standard deviation for three repetitions Dashed lines correspond to the limit values from FAO water quality standards, as presented in Table 4 (green dashed line is the limit value for salinity problems and purple lines are the limit values for infiltration problems). Al—Álamos; Mn—Montante; Mr—Mourão; Lf—Lucefécit. Jan—January; Mar—March; Jul—July; Sep—September; Nov—November.
Water 12 03569 g006
Figure 7. Salinization risk of the potentially irrigated area in the Inland Alentejo region based on the Salinization Risk index (RSA). Very Low risk: RSA < 7; Low risk: 7 ≤ RSA ≥ 10; Moderate risk: 11 ≤ RSA ≥ 14; High risk: 15 ≤ RSA ≥ 18; Very-High risk: RSA > 18.
Water 12 03569 g007
Figure 8. Percentages of Moderate Risk of Salinization areas per slope class (a), drainage class (b), soil reference group (c) and land cover (d). LP—Leptosols; LV—Luvisols; VR—Vertisols; CL—Calcisols; RG—Regosols; CM—Cambisols. OL—Olive groves; FT—Fruit trees; VN—Vineyards; TC—Temporary crops; TP—Temporary crops and/or improved pastures; CP—Complex crop patterns.
Water 12 03569 g008
Figure 9. Sodification risk of the potentially irrigated area in the Inland Alentejo region based on the Sodification Risk index (RSO). Very Low risk: RSO < 8; Low risk: 8 ≤ RSO ≥ 12; Moderate risk: 13 ≤ RSO ≥ 17; High risk: 18 ≤ RSO ≥ 22; Very-High risk: RSO > 22.
Water 12 03569 g009
Figure 10. Percentages of Moderate Risk of Sodification areas per slope class (a), drainage class (b), soil reference group (c), land occupation (d) and irrigation method (e). LP—Leptosols; LV—Luvisols; VR—Vertisols; CL—Calcisols; RG—Regosols; CM—Cambisols. OL—Olive groves; FT—Fruit trees; VN—Vineyards; TC—Temporary crops; TP—Temporary crops and/or improved pastures; CP—Complex crop patterns.
Water 12 03569 g010
Figure 11. Percentages of High Risk of Sodification areas per slope class (a), drainage class (b), soil reference group (c), land occupation (d) and irrigation method (e). LP—Leptosols; LV—Luvisols; VR—Vertisols; CL—Calcisols; RG—Regosols; CM—Cambisols. OL—Olive groves; FT—Fruit trees; VN—Vineyards; TC—Temporary crops; TP—Temporary crops and/or improved pastures; CP—Complex crop patterns.
Water 12 03569 g011
Table 1. Common criteria for risk area identification according to soil threats considering a two-tiered approach (Tier 1 for National/Continental level; Tier 2 for regional level) (adapted from [16]).
CriteriaIndicatorData Source/Type of Information
Tier 1Tier 2
Soil typological unitEuropean or National databasesEurope, NationalRegional
Soil textureTexture class; sand, silt and clay contentTexture classParticle size distribution; Porosity
Soil chemical propertiesSalt content, expressed in Total Dissolved Salts (TDS) or electrical conductivity (EC), and profile distribution; ion composition; pH; Cation exchange capacity (CEC); Exchangeable sodium percentage (ESP)Not requiredNational soil profile database; Soil inventory/mapping
Soil hydraulic propertiesInfiltration rate; Hydraulic conductivity; Water retention curves; DrainageNot requiredNational soil profile database; Soil inventory/mapping
Irrigation areas and chemical properties of irrigation waterIrrigated area; Irrigation intensity; Salt content, pH and Sodium Adsorption Ratio (SAR) of irrigation waterNational registriesRegional registries
Groundwater informationDepth; Salt content, pH and SAREuropean/National groundwater databaseRegional database
Climate/AridityAnnual rainfall; Annual potential evapotranspirationNational weather stations Regional weather stations
Table 2. Saline soils and saline-prone soils, and their main characteristics, according to the World Reference Base [46] (adapted from [22]).
Saline or Saline-Prone TypeSoil TypeCodeMain Characteristics
SalineSolonchakSCHigh concentration of soluble salts
SolonetzSNHigh content of exchangeable Na
Saline-proneAcrisolACLow-activity clays and low base saturation
AlisolALHigh-activity clays and low base saturation
CalcisolCLAccumulation of secondary calcium carbonates
DurisolsDUAccumulation of, and cementation by, secondary silica
FluvisolFLStratified fluviatile, marine, and lacustrine sediments
GleysolGLGroundwater-affected, underwater and in tidal areas
GypsisolsGYAccumulation of secondary gypsum
LuvisolLVHigh-activity clays and high base saturation
VertisolVRAlternating wet–dry conditions, shrink–swell clays
Table 3. Drainage classes in relation with textural class and saturated hydraulic conductivity (systematized after [15] and [47,48,49]).
Textural Class 1)Saturated Hydraulic Conductivity (mm h−1) 2)Drainage Class 2)
S, LS>50Good
SL, SCL, L, CL, SiCL, SiL, Si5–50Moderate
SC, SiC, C<5Restricted
1) S—Sand; LS—Loamy Sand; SL—Sandy Loam; SCL—Sandy Clay Loam; L—Loam; CL—Clay Loam; SiCL—Silty Clay Loam; SiL—Silty Loam; Si—Silt; SC—Sandy Clay; SiC—Silty Clay; C—Clay; 2) Classification after de Paz et al. [15].
Table 4. Excerpt of the FAO guidelines for interpretation of water quality for irrigation (adapted from Ayers and Westcot [52]).
Potential Irrigation ProblemUnitsDegree of Restriction on Use 1)
NoneSlight to ModerateSevere
Salinity 2)
ECWdS m−1<0.70.7–3.0>3.0
Infiltration 3)dS m−1
SAR 0–3 and ECW>0.70.7–0.2<0.2
SAR 3–6 and ECW>1.21.2–0.3<0.3
SAR 6–12 and ECW>1.91.9–0.5<0.5
SAR 12–20 and ECW>2.92.9–1.3<1.3
SAR 20–40 and ECW>5.05.0–2.9<2.9
1) Based on [52]: None—no soil or cropping problems are experienced; Slight to moderate - gradually increasing care in selection of crop and management alternatives is required if full yield potential is to be achieved; Severe—there will be soil and cropping problems or reduced yields, but even with cropping management designed especially to cope with poor quality water, a high level of management skill is essential for acceptable production; 2) Affects crop water availability; 3) Affects infiltration rate of water into the soil.
Table 5. Criteria, indicators, class limits, and their rating score to evaluate the risk of soil salinization in irrigation areas in the Salinization Risk index (RSA).
CriteriaIndicatorClass and Respective Interval of Values
IIIIIIIVV
Climate(1) AI≥0.65 (Humid)0.50–0.65 (Dry sub-humid)0.20–0.50 (Semi-arid)0.05–0.20 (Arid)<0.05 (Hyper-arid)
Rating score12345
Topography 1)(2) Slope (%)>9 3–8 0–2
Rating score1 3 5
Soil drainage 2)(3) Soil drainage classGood Moderate Restricted
Rating score1 3 5
Irrigation water quality (salinity) 3)(4) ECW (dS m−1)No restriction Slight-to-moderate restriction Severe restriction
Rating score1 3 5
AI—Aridity Index; ECW—Irrigation water electrical conductivity. 1) According to the Portuguese soil and land-use capacity map [71]. 2) According to Table 3. 3) According to Table 4.
Table 6. Criteria, indicators, class limits and their rating score to evaluate the risk of soil sodification in irrigation areas in the Sodification Risk index (RSO).
CriteriaIndicatorClass and Respective Interval of Values
IIIIIIIVV
Climate(1) AI≥0.65 (Humid)0.50–0.65 (Dry sub-humid)0.20–0.50 (Semi-arid)0.05–0.20 (Arid)<0.05 (Hyper-arid)
Rating score12345
Topography 1)(2) Slope (%)>9 3–8 0–2
Rating score1 3 5
Soil drainage 2)(3) Soil drainage classGood Moderate Restricted
Rating score1 3 5
Crop(4) Irrigation methodDrip Surface or Sprinkler
Rating score1 5
Irrigation water quality (infiltration) 3)(5) SAR and ECW (dS m−1)No restriction Slight-to-moderate restriction Severe restriction
Rating score1 3 5
AI—Aridity Index; ECW—Irrigation water electrical conductivity; SAR—Sodium Adsorption Ratio. 1) According to the Portuguese soil and land-use capacity map [71]. 2) According to Table 3. 3) According to Table 4.
Table 7. Risk classes of soil salinization (from RSA values) and soil sodification (from RSO values), classes description, and assessment of land-use practices (adapted from Wiebe et al. [32]).
RSA ValueRSO ValueRisk ClassClass DescriptionAssessment of Land-Use Practices
<7<8Very LowCurrent land management practices are compatible with agri-environmental sustainabilitySustainable
7–108–12LowManagement practices occasionally impact agri-environmental sustainabilityAcceptable
11–1413–17ModerateManagement practices leave land exposed to agri-environmental degradationShould be monitored carefully
15–1818–22HighManagement practices conductive to agri-environmental degradationChange should be considered
>18>22Very HighManagement practices directly expose land to agri-environmental degradationChanges are required
Publisher’s Note: MDPI stays neutral with regard to jurisdictional claims in published maps and institutional affiliations.

