Building ANN-Based Regional Multi-Step-Ahead Flood Inundation Forecast Models


1
Department of Water Resources and Environmental Engineering, Tamkang University, New Taipei City 25137, Taiwan
2
Water Resources and Climatic Change Research Centre, National Hydraulic Research Institute of Malaysia, Selangor 43300, Malaysia
3
Department of Bioenvironmental Systems Engineering, National Taiwan University, Taipei 10617, Taiwan
*
Authors to whom correspondence should be addressed.
Water 2018, 10(9), 1283; https://doi.org/10.3390/w10091283
Submission received: 4 July 2018
/
Revised: 30 August 2018
/
Accepted: 13 September 2018
/
Published: 19 September 2018
(This article belongs to the Special Issue Flood Forecasting Using Machine Learning Methods)
Abstract
:A regional inundation early warning system is crucial to alleviating flood risks and reducing loss of life and property. This study aims to provide real-time multi-step-ahead forecasting of flood inundation maps during storm events for flood early warnings in inundation-prone regions. For decades, the Kemaman River Basin, located on the east coast of the West Malaysia Peninsular, has suffered from monsoon floods that have caused serious damage. The downstream region with an area of approximately 100 km2 located on the east side of this basin is selected as the study area. We explore and implement a hybrid ANN-based regional flood inundation forecast system in the study area. The system combines two popular artificial neural networks—the self-organizing map (SOM) and the recurrent nonlinear autoregressive with exogenous inputs (RNARX)—to sequentially produce regional flood inundation maps during storm events. The results show that: (1) the 4 × 4 SOM network can effectively cluster regional inundation depths; (2) RNARX networks can accurately forecast the long-term (3–12 h) regional average inundation depths; and (3) the hybrid models can produce adequate real-time regional flood inundation maps. The proposed ANN-based model was shown to very quickly carry out multi-step-ahead forecasting of area-wide inundation depths with sufficient lead time (up to 12 h) and can visualize the forecasted results on Google Earth using user devices to help decision makers and residents take precautionary measures against flooding.
1. Introduction
Floods are the most common natural disasters, and the increasing trend of flood occurrence has been frequently reported worldwide over the last few decades [1,2,3]. As climate change continues and extensive urbanization worsens, the situation will persist in the vicinities of rivers [4]. Asia and the Pacific Region are the most disaster-prone areas in the world, where floods are the most frequent disasters and have large economic impacts on the region [5]. Recent disasters in Southeast Asia—Typhoon Haiyan (Yolanda) in Philippines (2013) and massive floods in Thailand (2011)—have necessitated the demand for effective flood management schemes, as annual damage estimates far outstretch current management expenditure. The societal cost-benefit analysis of a flood forecasting scheme, compared to a flood management scheme, is different from site to site. Early flood warnings with sufficient lead time offer authorities as well as residents precautions and preventive measures to alleviate consequences and minimize negative impacts. Consequently, there is the increasing need for flood forecasting with lead-times long enough to allow for flood mitigation actions. Additionally, a real-time flood inundation map showing inundated areas and the corresponding inundating depths could convey a clear message about the flood’s scope and severity, thus enabling decision makers and residents to take adequate countermeasures. Subject to various influential factors like rainfall, soil moisture, river-stage conditions, and geomorphological characteristics, as well as a lack of sequential flood inundation datasets during storm events, real-time urban flood inundation forecasting is a great challenge [6].
Several studies have been devoted to developing flood inundation simulation models suitable for urban flood management and providing sequential high-resolution inundation depths responsive to storm events [7,8,9]. Nevertheless, these models required substantial computational efforts in order to deliver iterative solutions and thus could not effectively make real-time inundation forecasts. Practically, hydrologists need to deal with the limited response time to flash flood disasters in urban areas, and therefore multi-step-ahead flood inundation forecasting could be very helpful in managing contingencies and alleviating flood risks. Researches have now moved on from mathematical simulation modelling or physical-based flood forecasting methods to collaboration between methodologies focusing on data-mining approaches and/or physical-based modellers [10,11]. In the last two decades, many studies have developed and/or implemented machine-learning techniques, e.g., artificial neural networks (ANNs) for typhoon flood forecasting [12], runoff forecasting [13,14], real-time multi-step-ahead water level forecasting [15], classification of regional groundwater variations and inter-relations among variables [16], and building multi-relations between fish species and water quality [17]; support vector machines for river flow prediction [18]; fuzzy logic for flow forecasting [19], real-time flood forecasting [20], and water level forecasting [21]; extreme learning machine for stream-flow forecasting [22]; and non-dominated sorting genetic algorithm-II for optimizing water utilization and hydropower output without minimizing flood risks [23]. ANNs generalize relationships between input and output patterns without requiring the physical mechanism behind the process, which is suitable for effectively handling regional rainfall-inundation datasets [24,25,26,27]. However, we notice that most of the previous works focused on one-dimensional processes and only very limited studies attempted two-dimensional flood inundation forecasts due to highly dynamic complex spatio-temporal processes involved. Thus, there is a continuous need to conduct in-depth research in regional flood inundation disaster management using the latest scientific tools such as machine learning techniques.
This study aims at establishing a flood early warning system for inundation-prone regions of the Kemaman River Basin in Malaysia. The study basin and its vicinities have frequently suffered from monsoon floods, impacting the socio-economic, agricultural and sub-urban areas of the settlement. We propose an integrated methodology that couples flood inundation simulation and machine learning models to create real-time multi-step-ahead flood inundation maps during storm events. The forecasted regional flood inundation map can be shown on Google Earth to help decision-makers and residents take necessary countermeasures against flooding.
2. Study Area and Materials
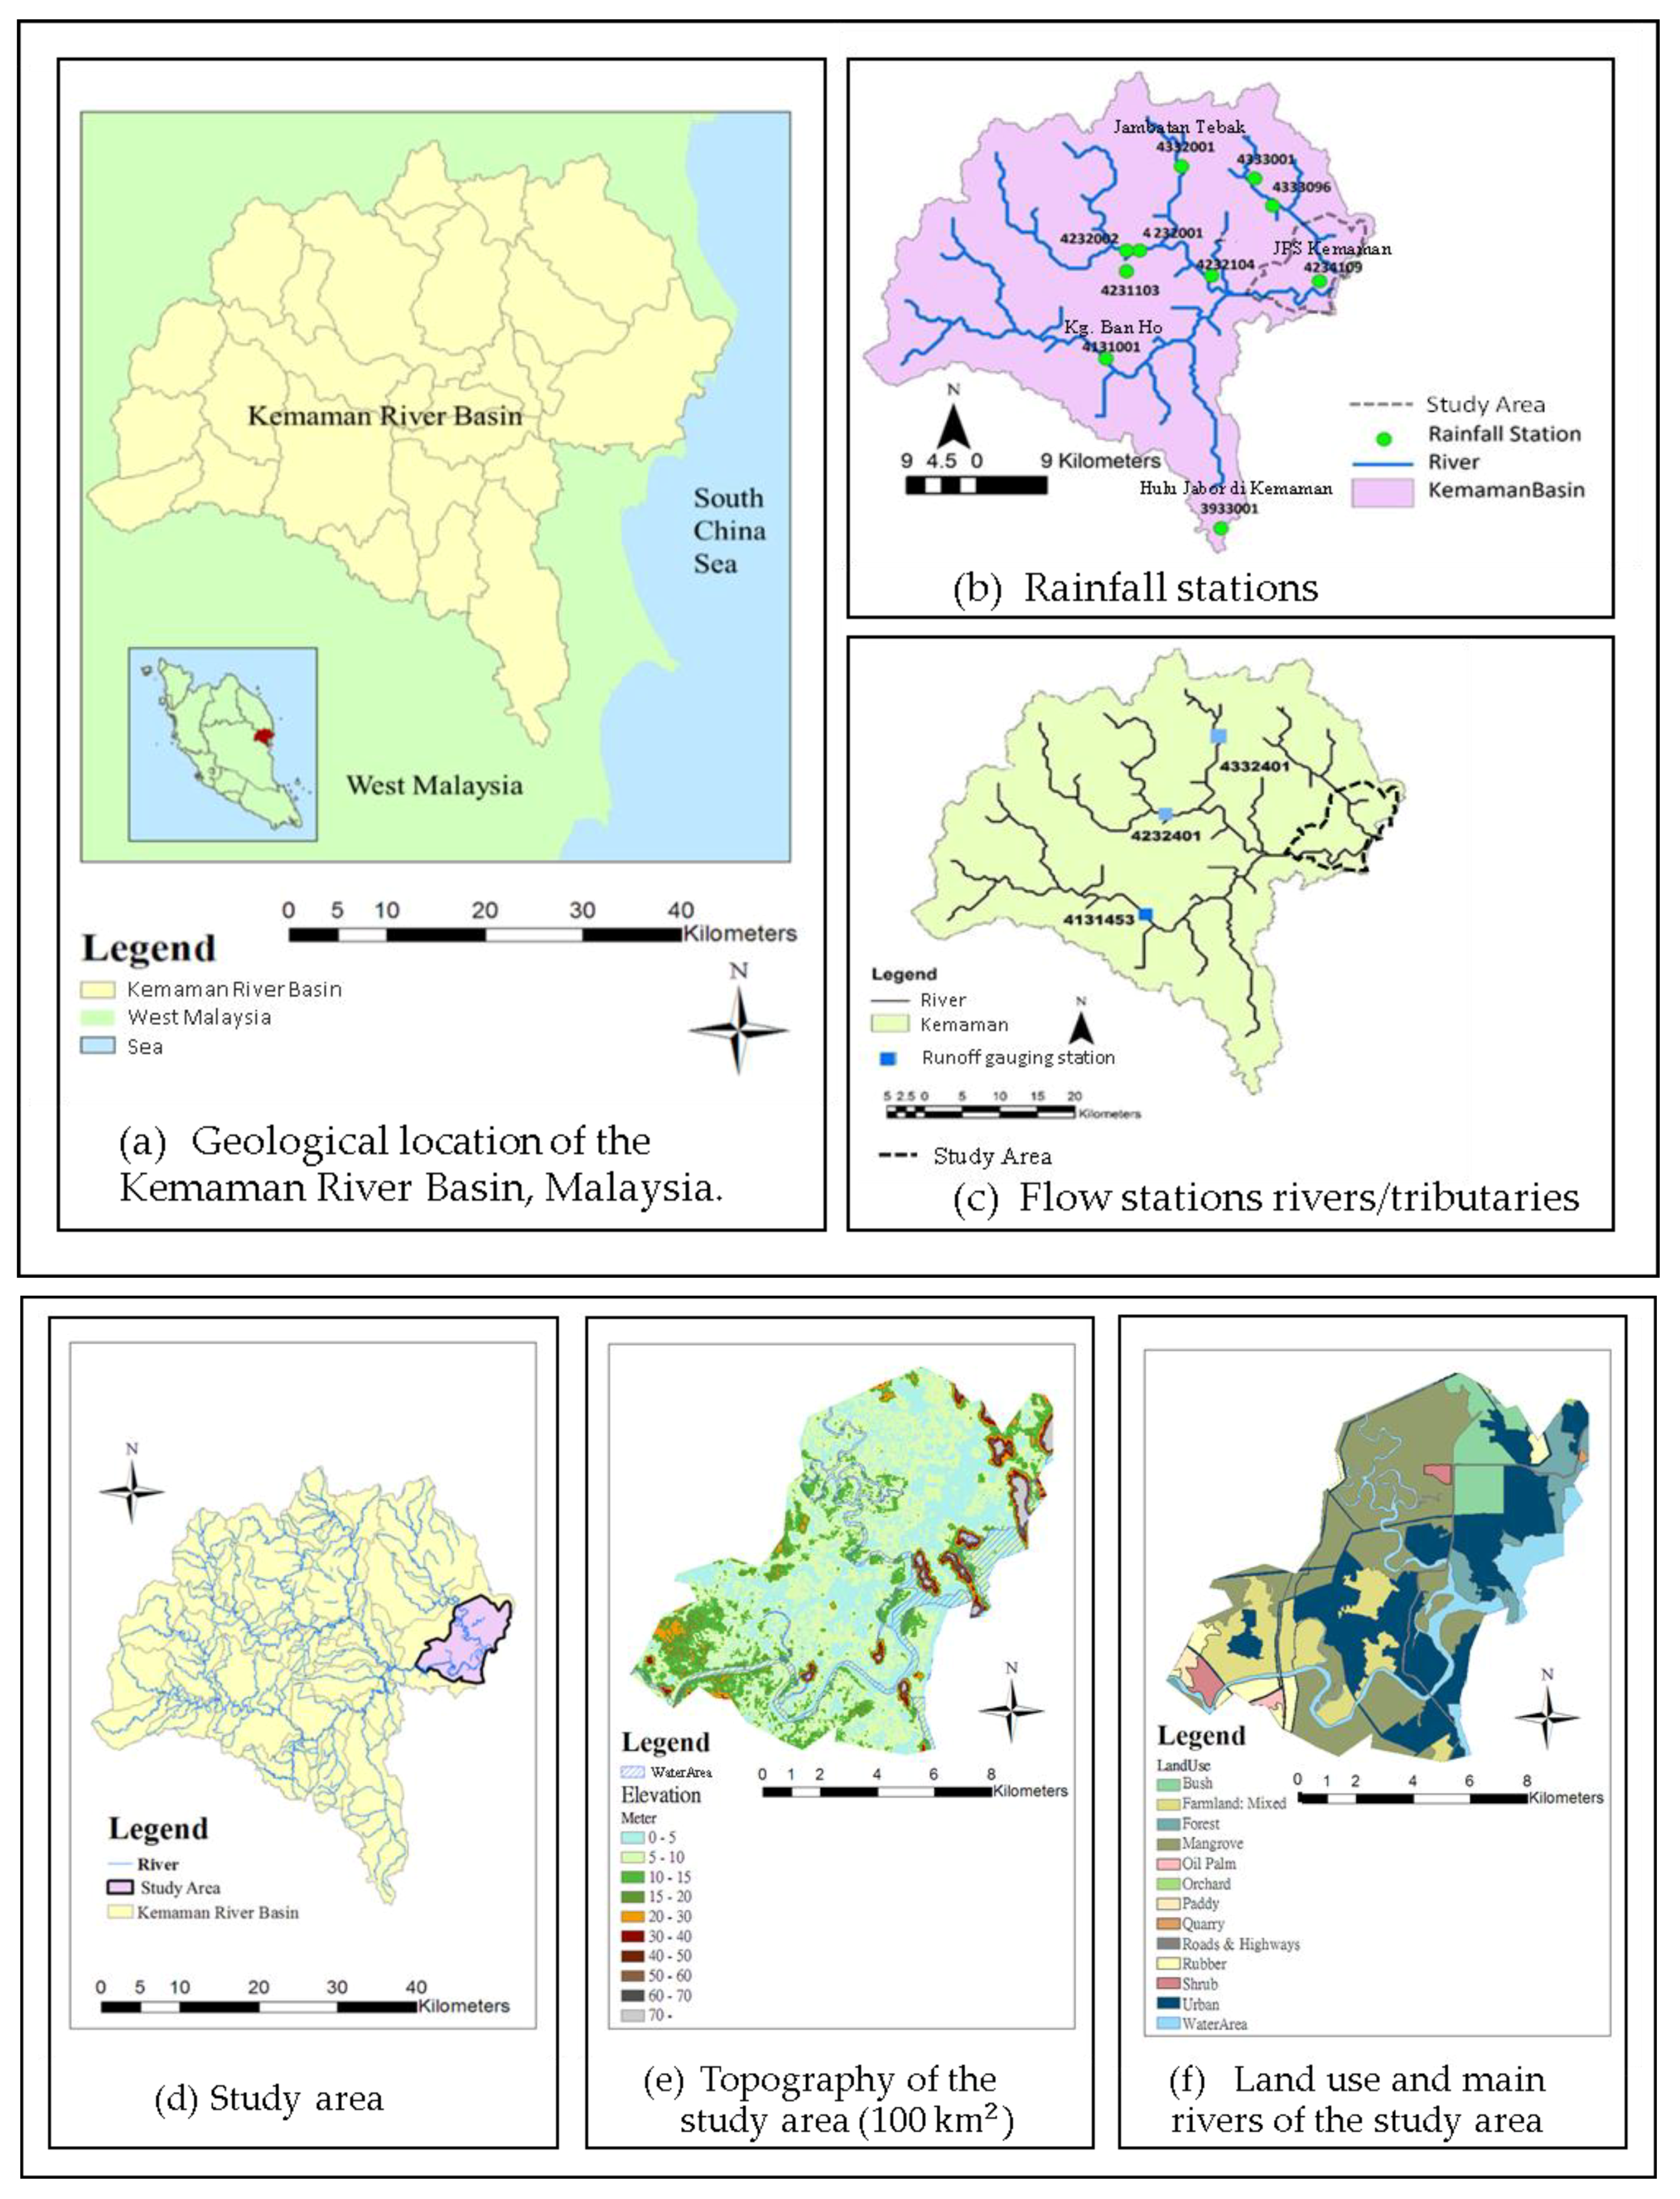
Floods in Malaysia have great social-economic impacts, and are considered threatening. Being located in the southern part of Terengganu on the east coast of West Malaysia (Figure 1a), the Kemaman River Basin is a region that experiences frequent and severe floods. Flooding has been a major issue in the study catchment since the early 1990s. Storm events result in flooding with short concentration times and a rise in the power and speed of the river flow, causing severe damage to settlements and infrastructures, especially in downstream regions. For instance, the concentration time for Event 7 was less than 12 h and the maximum flow rate reached 1142 m3/s (Table 1). Therefore, the downstream region that covers an area of approximately 100 km2 located on the east side of the Kemaman River Basin is selected as the study area for building real-time regional multi-step-ahead flood inundation forecast models (Figure 1e,f).
The climate of the study basin is generally tropical monsoonal—uniform temperature around 26 °C, high humidity (70–95%) and average annual rainfall of 2770 mm. Historical rainfall and water level data of 10 rainfall and three runoff gauge stations spreading over the study area were collected from the Department of Irrigation and Drainage (DID) of Malaysia; they were used for model calibration and verification. Based on the availability of rainfall and discharge data, eight recent extreme flood events occurring between 2000 and 2015 were selected for this study, as shown in Table 1. The rainfall and river flow stations in the Kemaman River Basin are illustrated in Figure 1b,c, respectively.
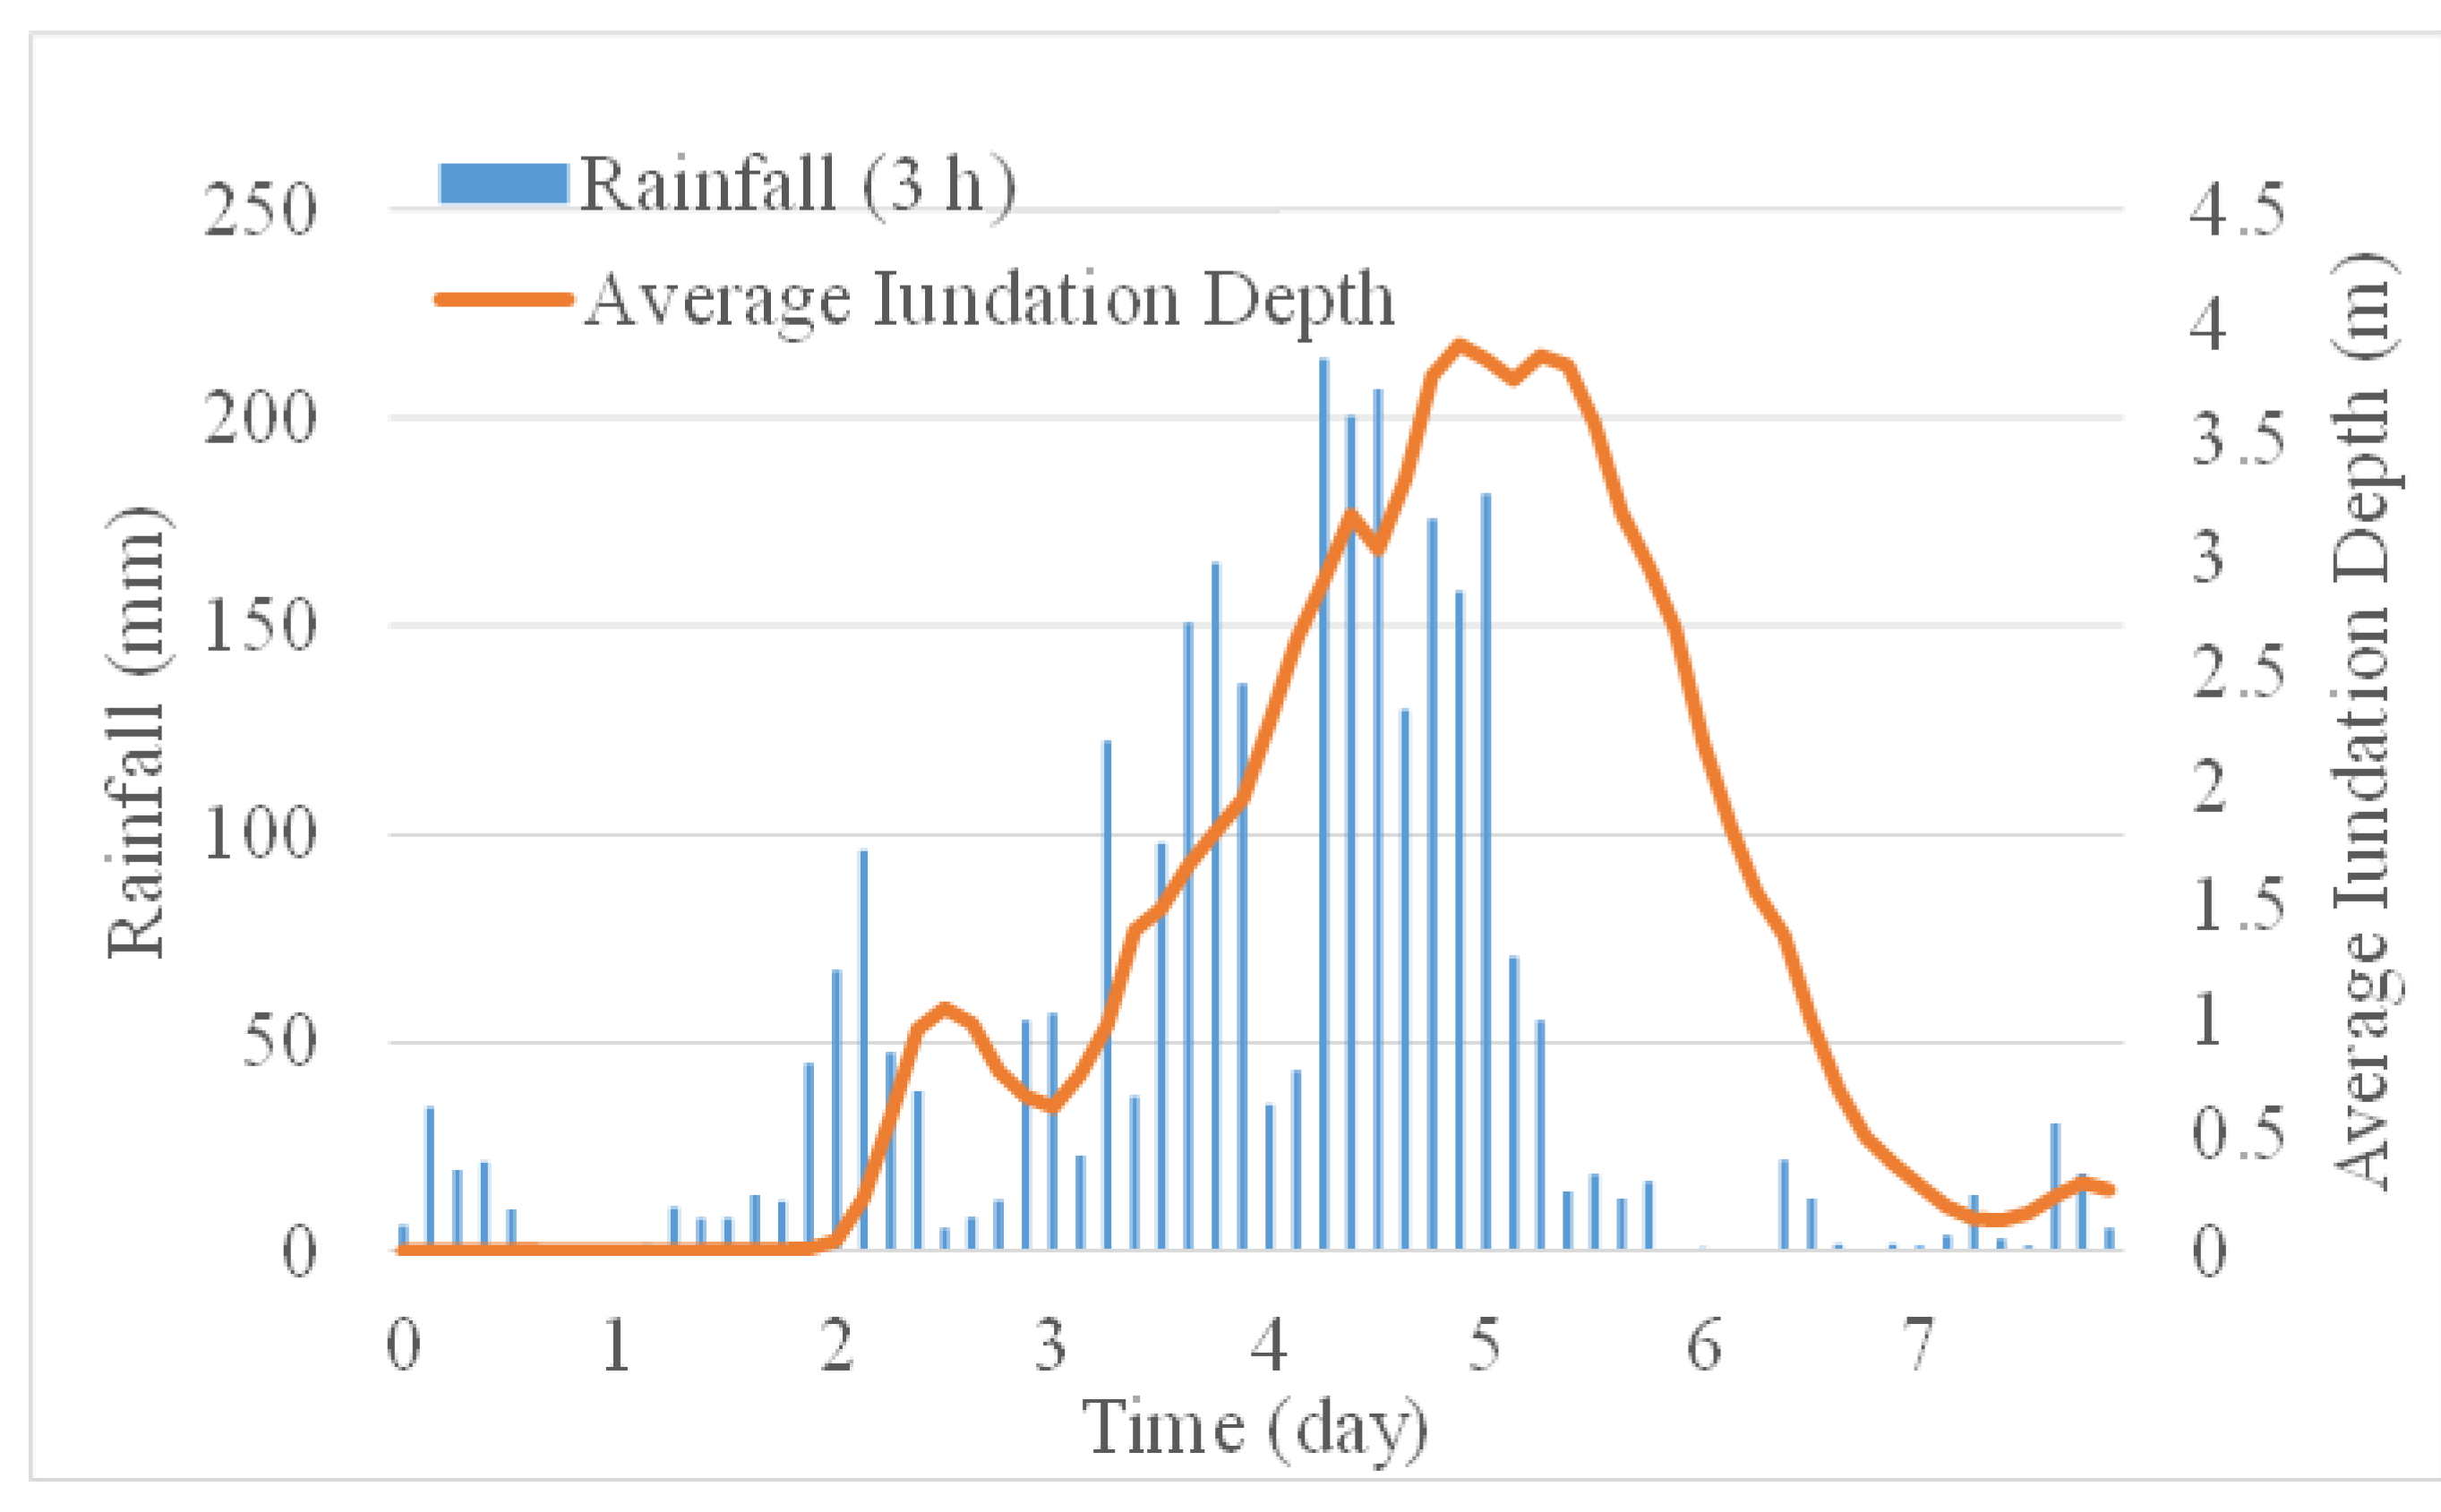
The ranges of event duration, maximum average inundation depth, and accumulated average rainfall were recorded as 150 h, 744 h; 1.48 m, 4.17 m; and 255 mm, 1653 mm, respectively. The highest accumulated flood depth (4.17 m) occurred in Event 7, where the accumulated average rainfall reached 996 mm and the maximum flow achieved 1142 m3/s. In this study, rainfall in a flood depth hydrograph denotes the average rainfall of each sub-catchment at a time-step of 3 h.
Taking Event 7 as an example, Figure 2 illustrates the rainfall histogram and the average inundation depth hydrograph of Event 7.
3. Forecast Models
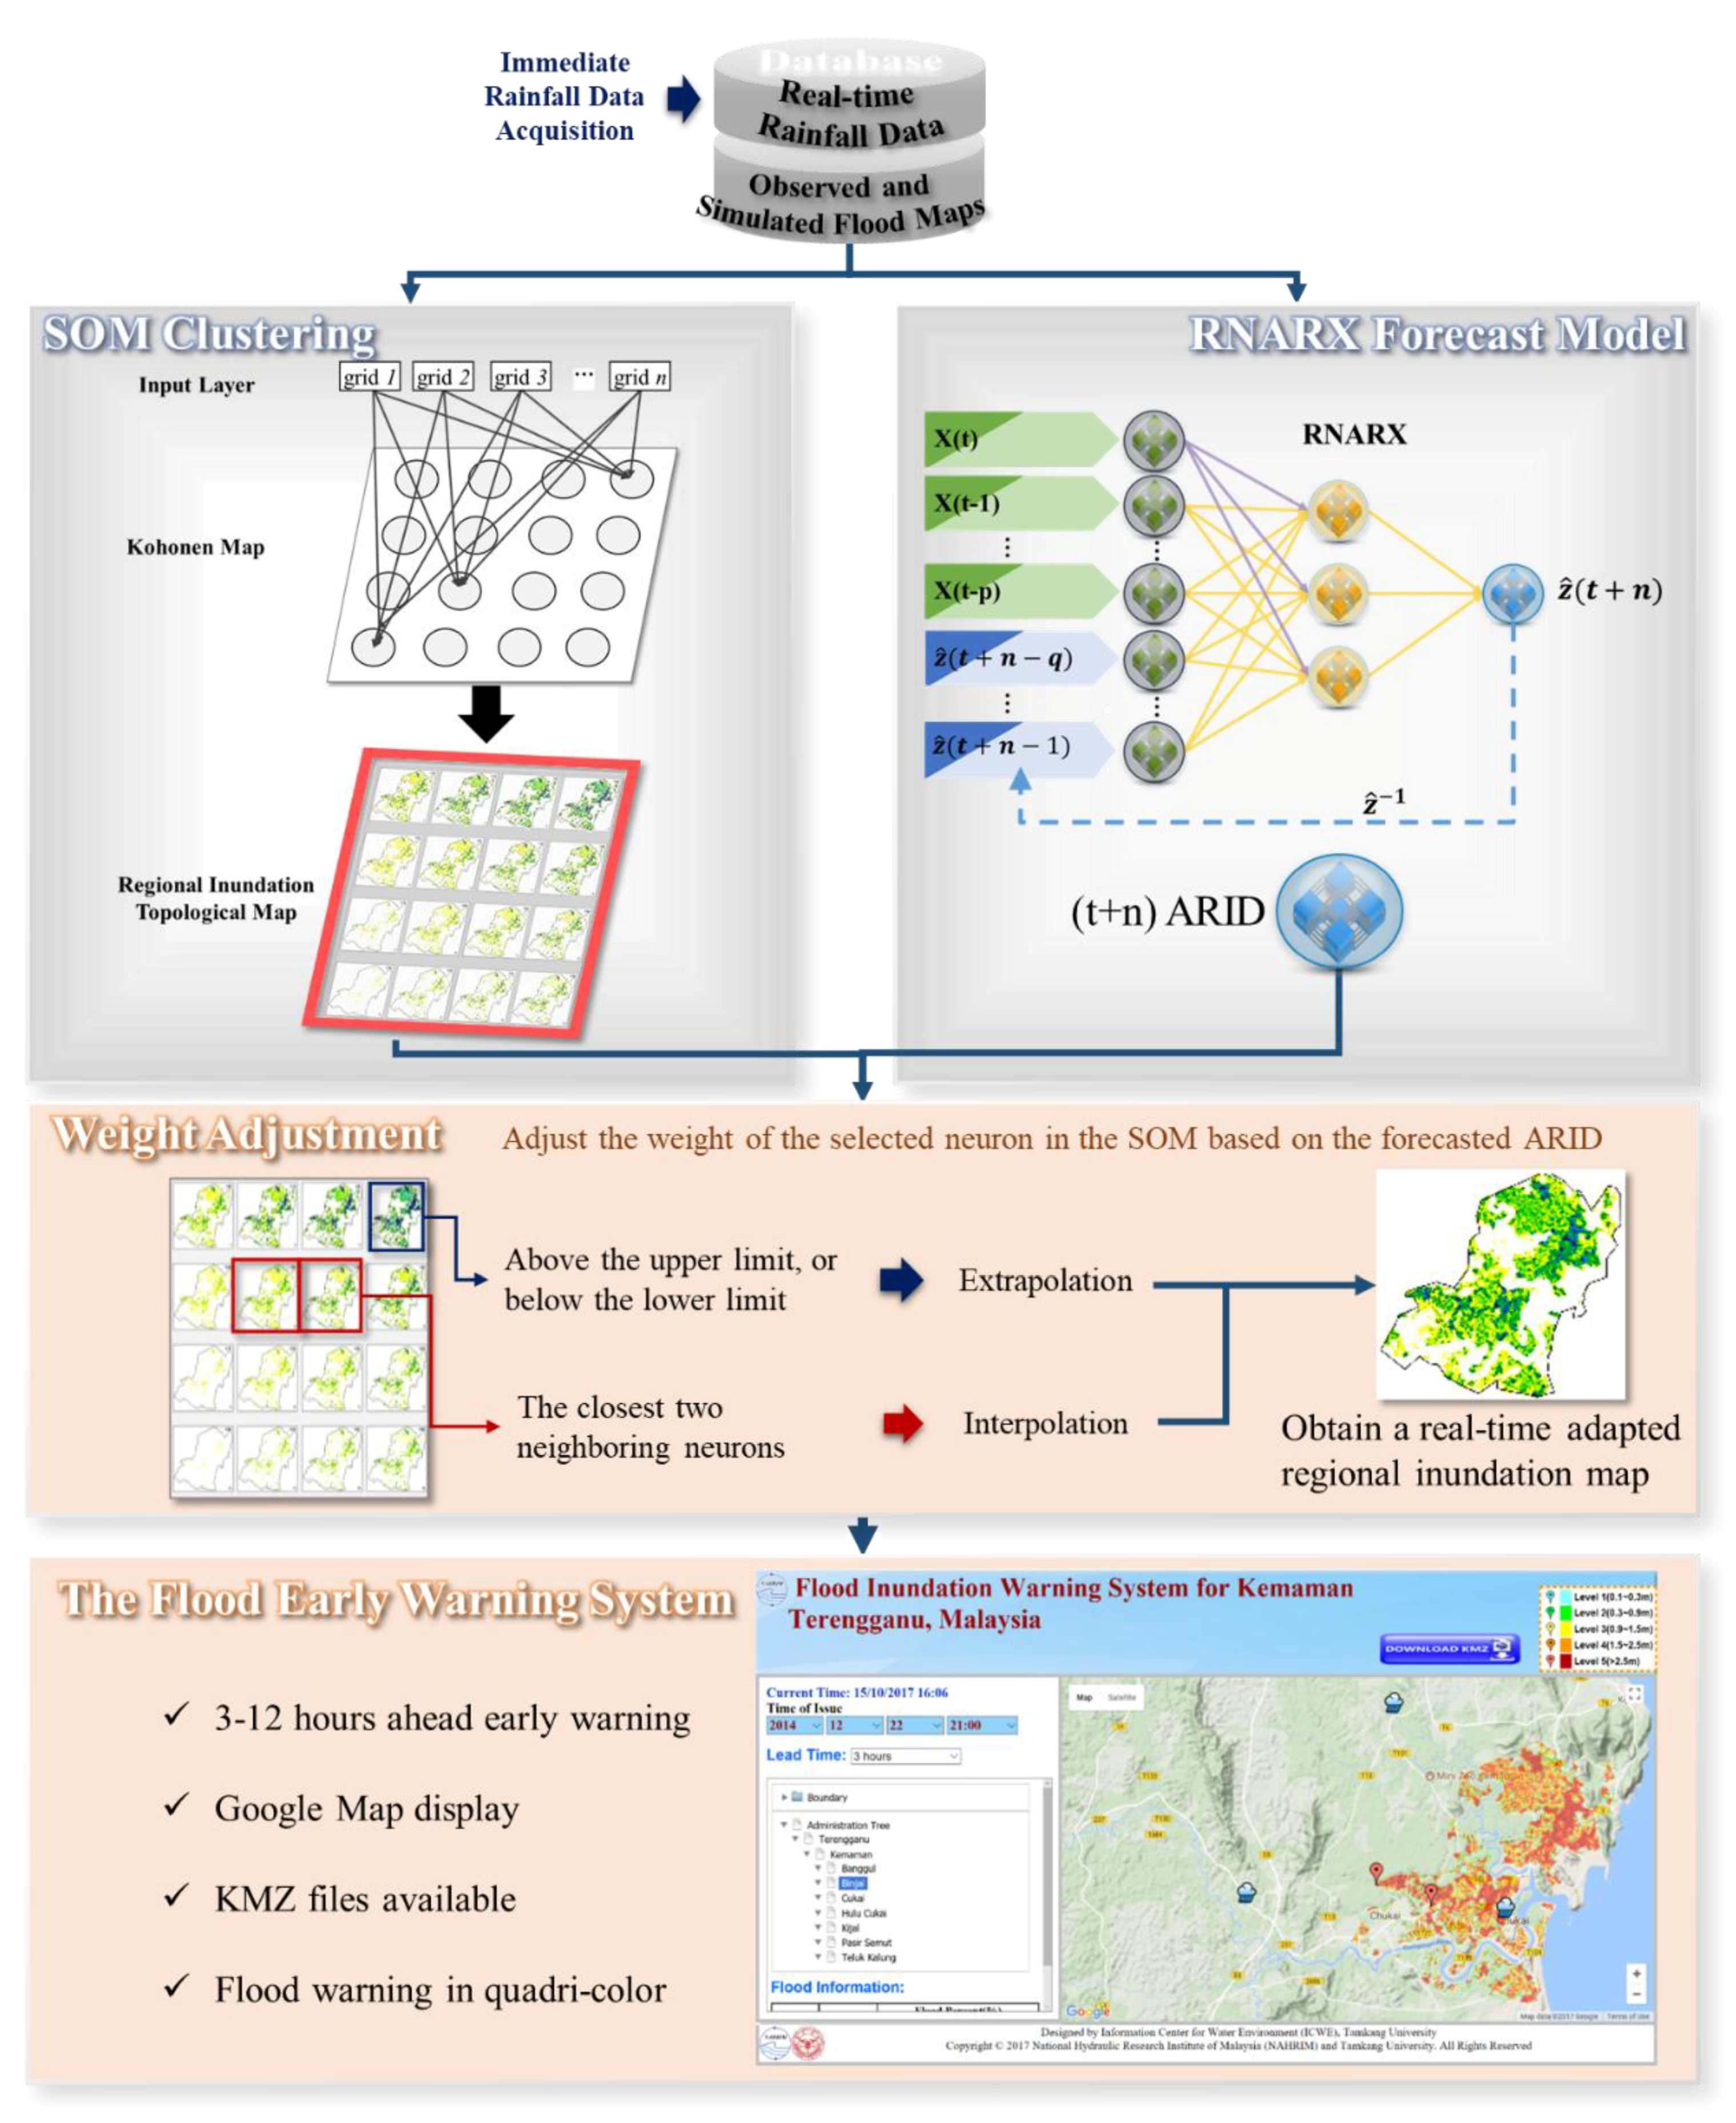
To establish a flood early warning system, we propose an integrated methodology that couples flood inundation simulation models and machine learning-based forecast models to provide multi-step-ahead flood inundation maps during storm events. The hybrid modelling process explored in this study consists of five stages: (1) dividing the study area (100 km2) into 10,744 grids (75 m × 75 m); (2) synthesizing the sequential regional inundation depths for real and designed events by using a two-dimensional flood routing simulation model; (3) clustering regional inundation maps by using the self-organizing map (SOM) algorithm; (4) building a forecast model by using the recurrent nonlinear autoregressive with exogenous inputs (RNARX) for obtaining the average regional inundated depth (ARID) under rainy conditions; and (5) adjusting the weight of the selected neuron in the SOM based on the forecasted ARID to obtain a real-time adapted regional inundation map. It is noted that we removed the cells covering river channels and the cells with highest observed inundation depths less than 10 cm (for example, inundation did not occur at cells at relatively high elevations). Consequently, about 40% of the cells were removed, i.e., the number of grids reduced from 17,778 to 10,740. Thus, the input dimension (number of grids) of the SOM largely reduced, such that the model (SOM) is easier to train and converge. Besides, because the study area is located downstream (estuary) and its terrain in general is relatively flat, we consider the designed grid size (i.e., 75 m × 75 m) suitable for presenting flood inundation variation during storm periods.
The average regional inundation depth (ARID) is calculated by the following equation:
These models are briefly introduced in the following subsections.
3.1. Simulation Model
Historical observed data of inundation depths are rarely available, such that there are almost no historical hydrographs of regional inundation depths of historical storm events. Hydraulic models, in general, are a more physical-based approach to modeling the motion of a water body through its geo-morphological environment, taking into account the effects of gravity and friction at the water/bed interface to produce flood levels at various locations along the river and the flood plain [28]. Therefore, the flood routing simulation model would be the best alternative for generating the synthetic hydrographs of flood depths for various storm events; it will help understand the induced flood hazards and identify the responses of mitigation measures. InfoWorks ICM (ICM Suite upgrade, HR Wallingford Asia Sdn Bhd, Kuala Lumpur, Malaysia), a commercial software package and an advance of Infoworks RS, is a two-dimensional flood routing simulation tool that combines an advanced flow simulation engine, hydrological and hydraulic models, GIS, and database in a single environment [28]. This model relies profoundly on the accuracy of topographical data [29]. InfoWorks ICM (RS) has been satisfactorily utilized to develop flood risk maps for Northern Ireland [30] and Malaysia’s River Basin [31]. This tool offers explanations for the effects of varying runoff rates from sub-catchments and forms a tight-coupling of GIS functionality and hydrodynamic flow simulation.
In this study, InfoWorks ICM is implemented to mimic the effects of flood mitigation measures under various real and synthetic events. The main components of the InfoWorks ICM consist of an ISIS flow simulation engine, a geographic information system (GIS), and a database. The model carries out two-dimensional flood routing simulation in consideration of hydraulic facilities/modeling [32,33]. The two-dimensional (2D) hydrodynamic model routes water over in the Digital Elevation Model (DEM) forced by upstream boundary conditions such as a meteorological forcing, or a hydrograph and downstream boundary conditions of water levels. The model generates accurate and reproducible flood extent maps, which not only show the extent and depth of a flood, but can also be animated to show the progression of a flood event. The scenario setting for simulating events was designed and described as follows.
- (1)
- Observed distribution: 8 real events (rainfall data).
- (2)
- Synthetic distribution: a total of 12 designed events were generated, based on different combinations of rainfall durations (12, 24, 48 and 72 h) and return periods (20, 50 and 100 years) at main gauge stations.
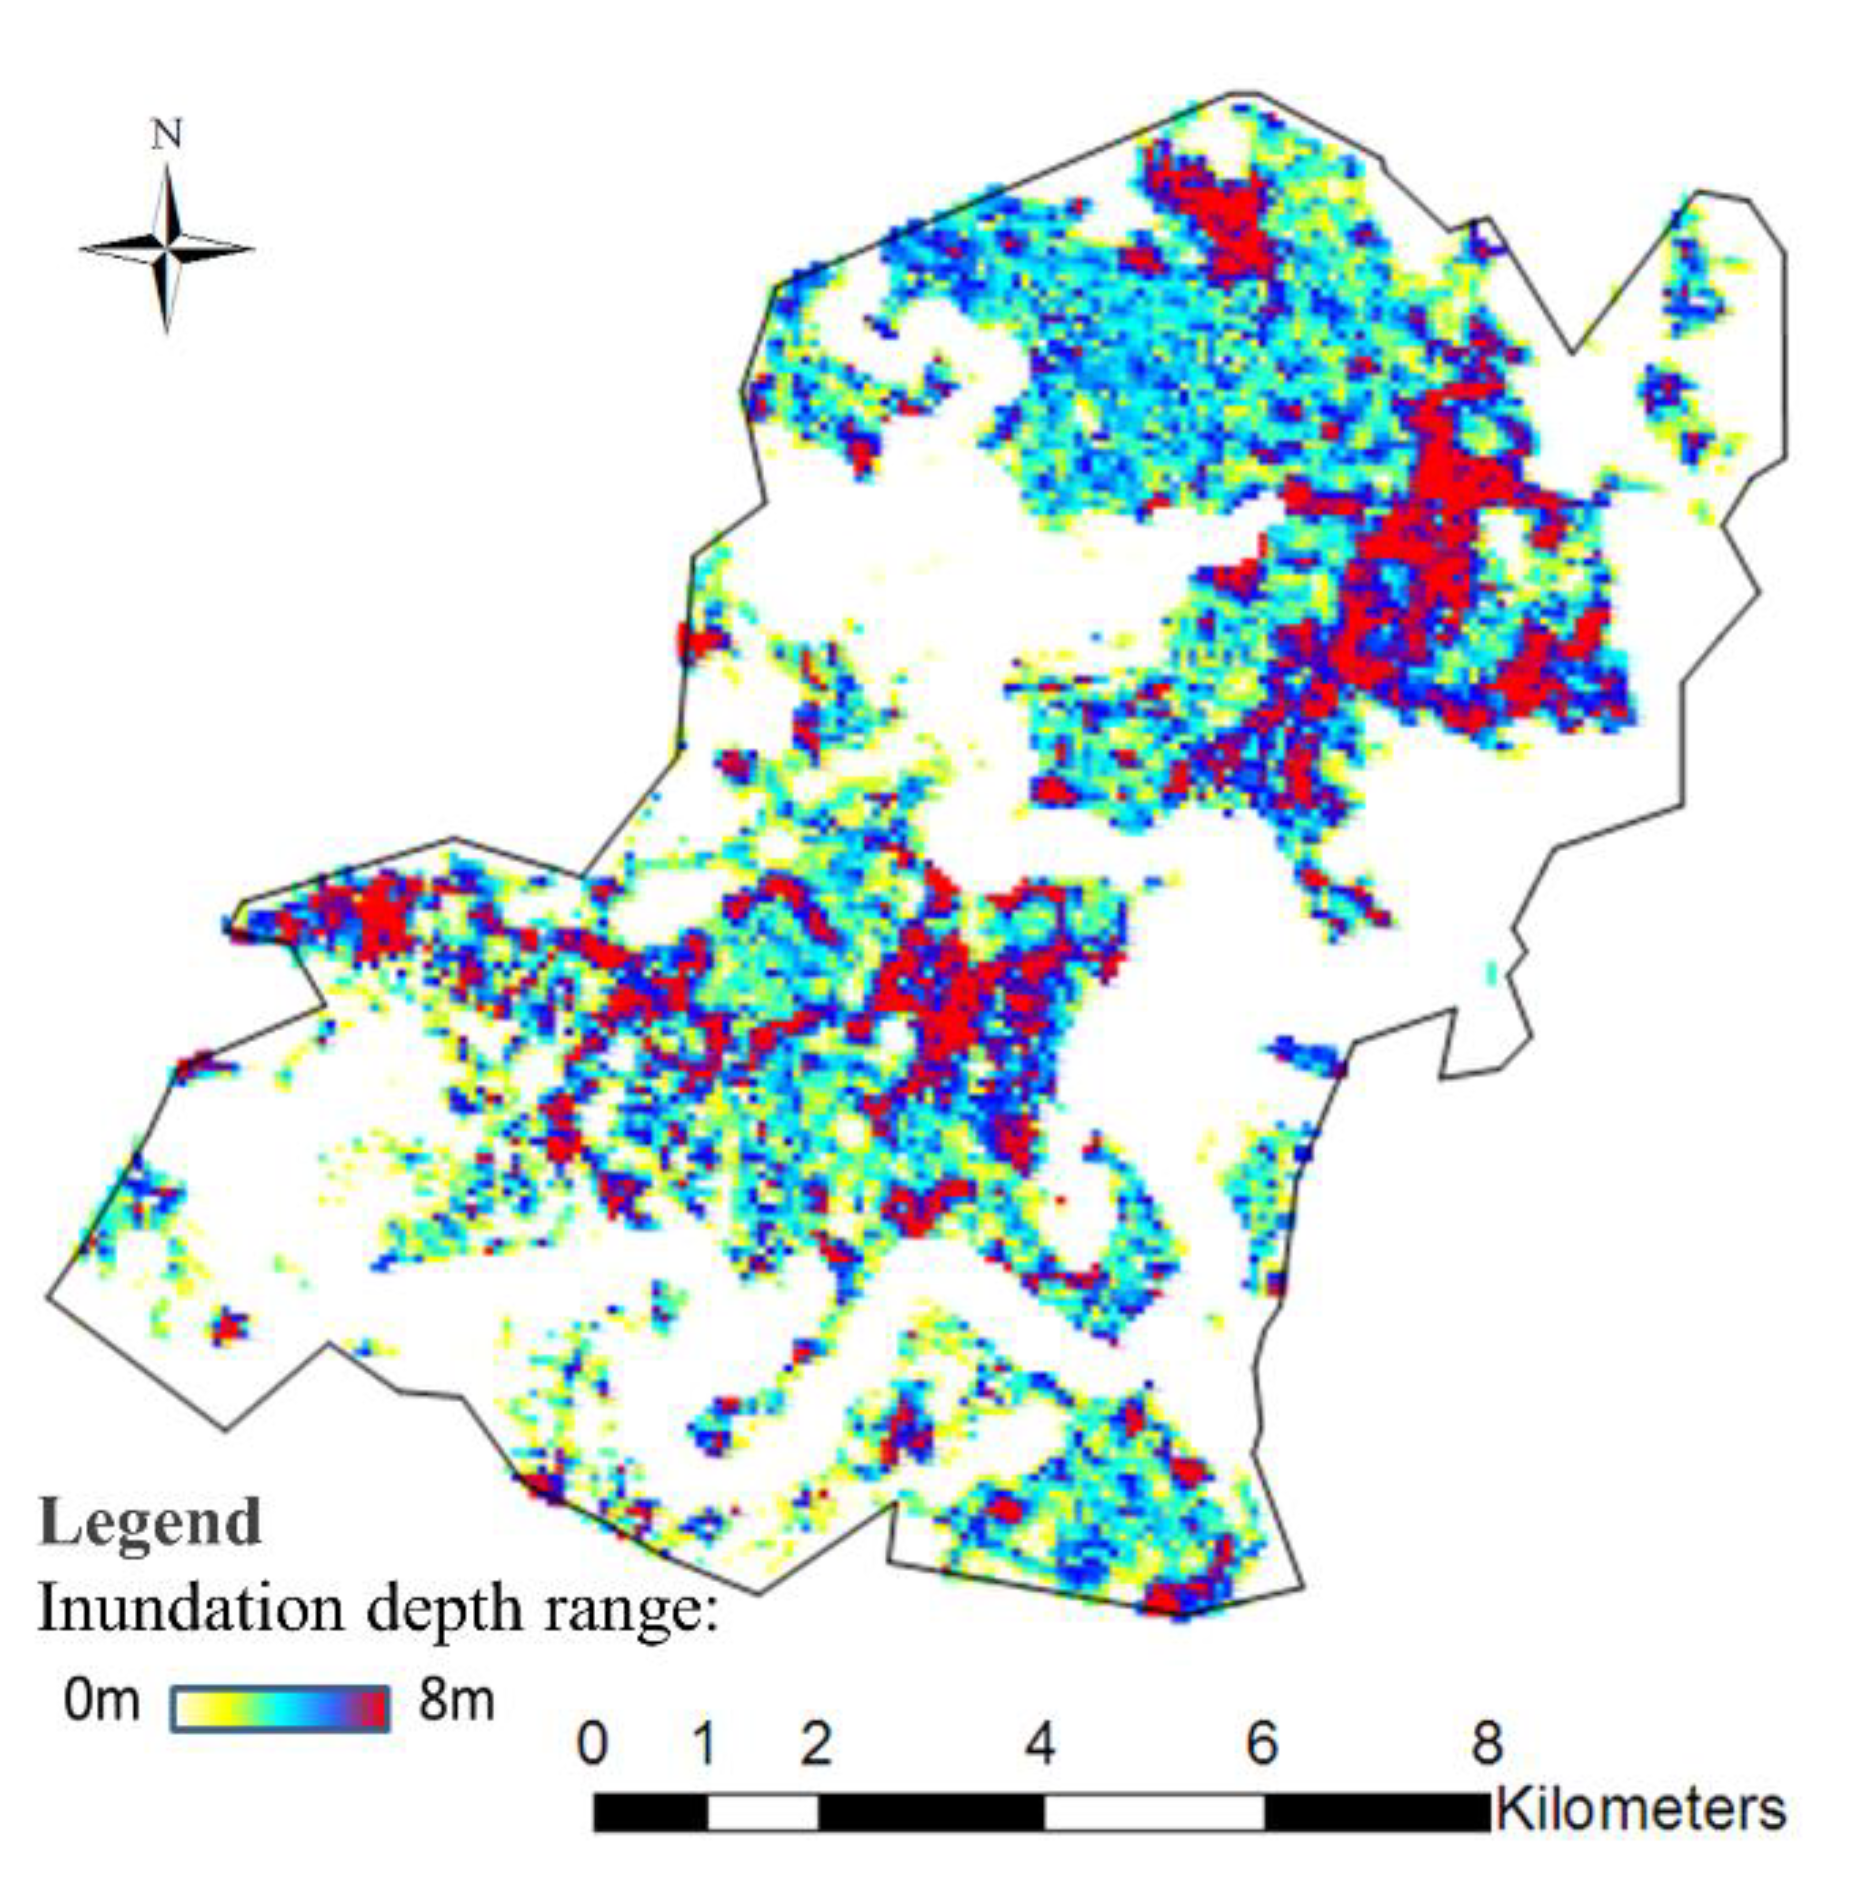
Figure 3 shows the maximum simulated flood map derived from the 2D flood model (InfoWorks ICM) based on a 5 m resolution digital elevation and rainfall information of a storm event (a cumulated rainfall of 1653 mm in December 2014). We note that this simulation model may not necessarily yield the exact flood depths but can provide the magnitudes of water depths and flood extents. Consequently, the simulation model (InfoWorks ICM) with designed rainfall hyetographs are implemented to generate the regional inundation maps and provide the inundation depth of each grid element for all scenarios. The generated inundation maps could then be used to train and validate ANN-based models.
Coupling the observed and simulated datasets, the RNARX firstly makes 3 h-up to 12 h-ahead forecasts (ARID); next, the forecasted ARID can be mapped onto the SOM topological map to select the best matched cluster in the SOM, and then all the weights in the matched cluster can be adjusted using linear interpolation to obtain a 3 h- (or, 6 h-, 9 h-, 12 h-) ahead regional flood inundation map.
3.2. ANN-Based Models
In this study, we explore a hybrid SOM−RNARX model that integrates the SOM and the RNARX to sequentially forecast regional multi-step-ahead flood inundation maps. The key idea is to integrate the essence of both ANNs to produce two-dimensional visible regional flood inundation maps.
3.2.1. Self-Organizing Map (SOM)
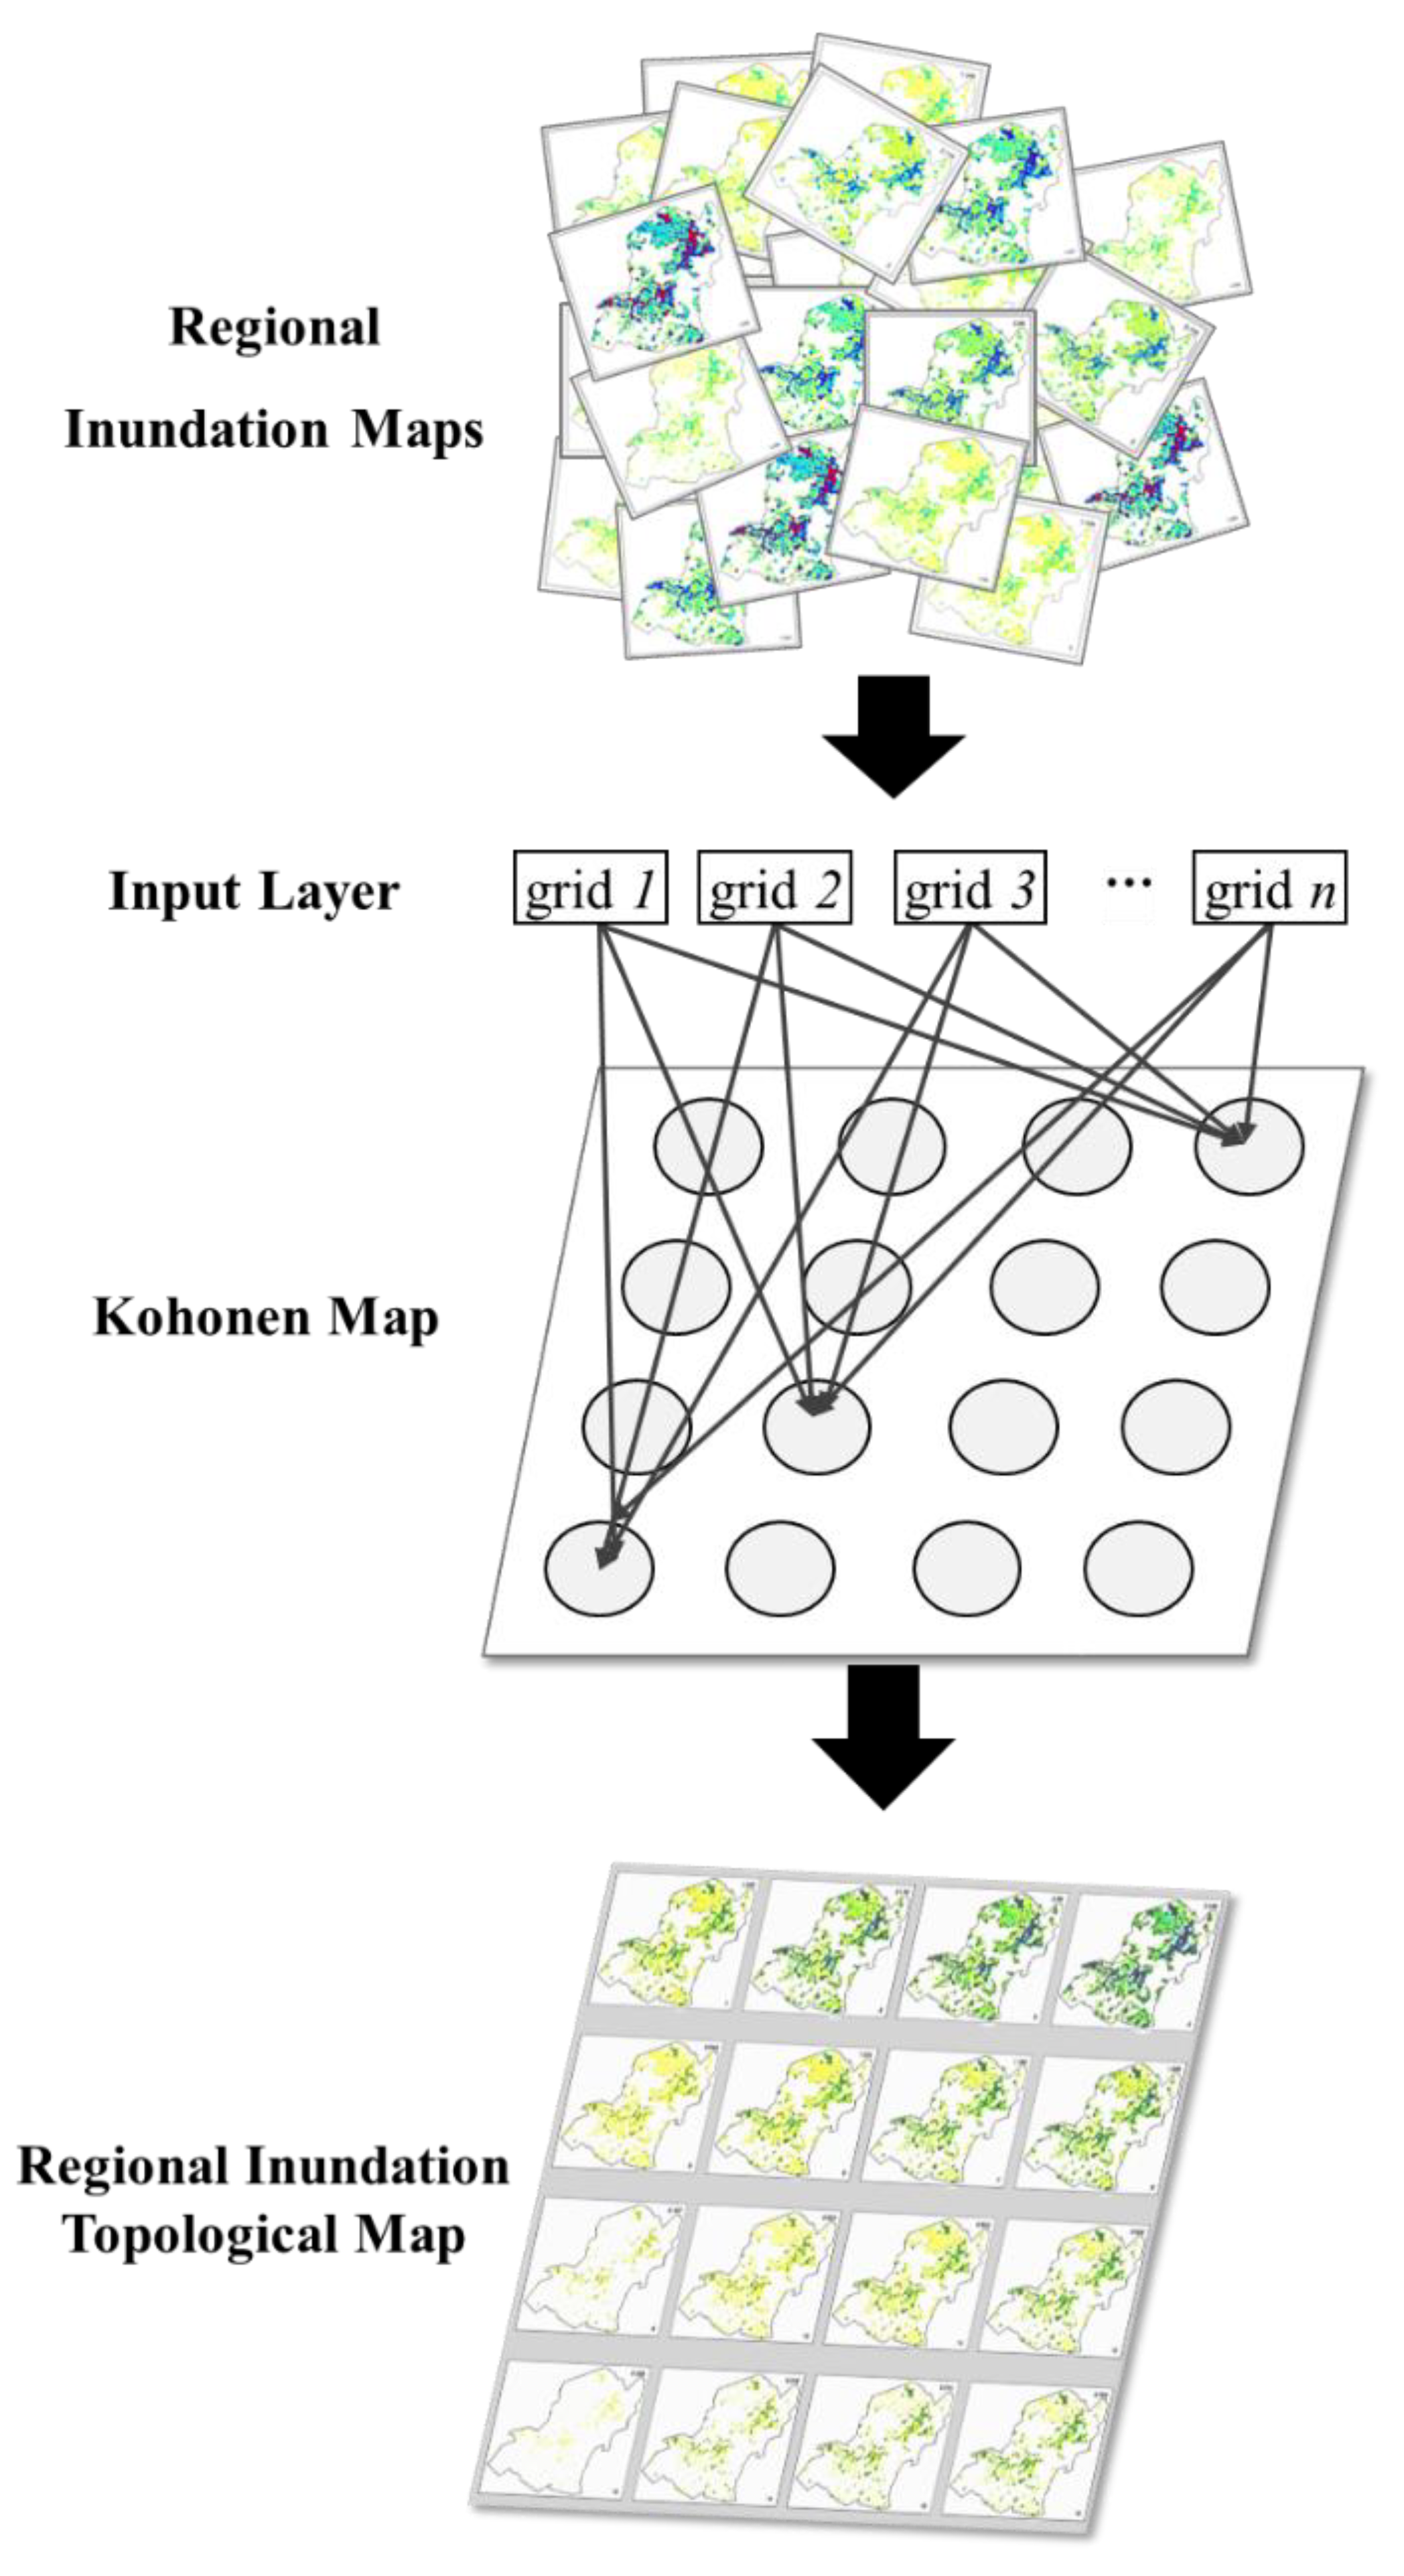
The SOM is an effective clustering method that can classify high-dimensional datasets to form a meaningful topological map; it offers the advantages of information extraction and visualization [34]. For instance, the SOM was implemented as a clustering tool to classify inundation maps [35], groundwater levels [36,37], fishery data [17,38], and river flow stations [39]. The SOM consists of an input layer and a clustering layer with nodes distributed over a two-dimensional map. Bearing in mind its clustering capability and visual interpretation, the SOM in this study is implemented to form a two-dimensional topological map that presents the main features of regional flood inundation depths and extends under various hydrological conditions during storm events (Figure 4). The map size of the SOM must be determined, which is usually done by trial-and-error procedures, because there are no theoretical guidelines to determine optimal map size [40]. Due to the large input dimension (i.e., 10,744 grids) and relatively stable variations of regional inundation depths, we only try three different map sizes (i.e., 3 × 3, 4 × 4, and 5 × 5) to form regional inundation topological maps in this study case.
3.2.2. Recurrent Configuration of Nonlinear Autoregressive with Exogenous Inputs (RNARX)
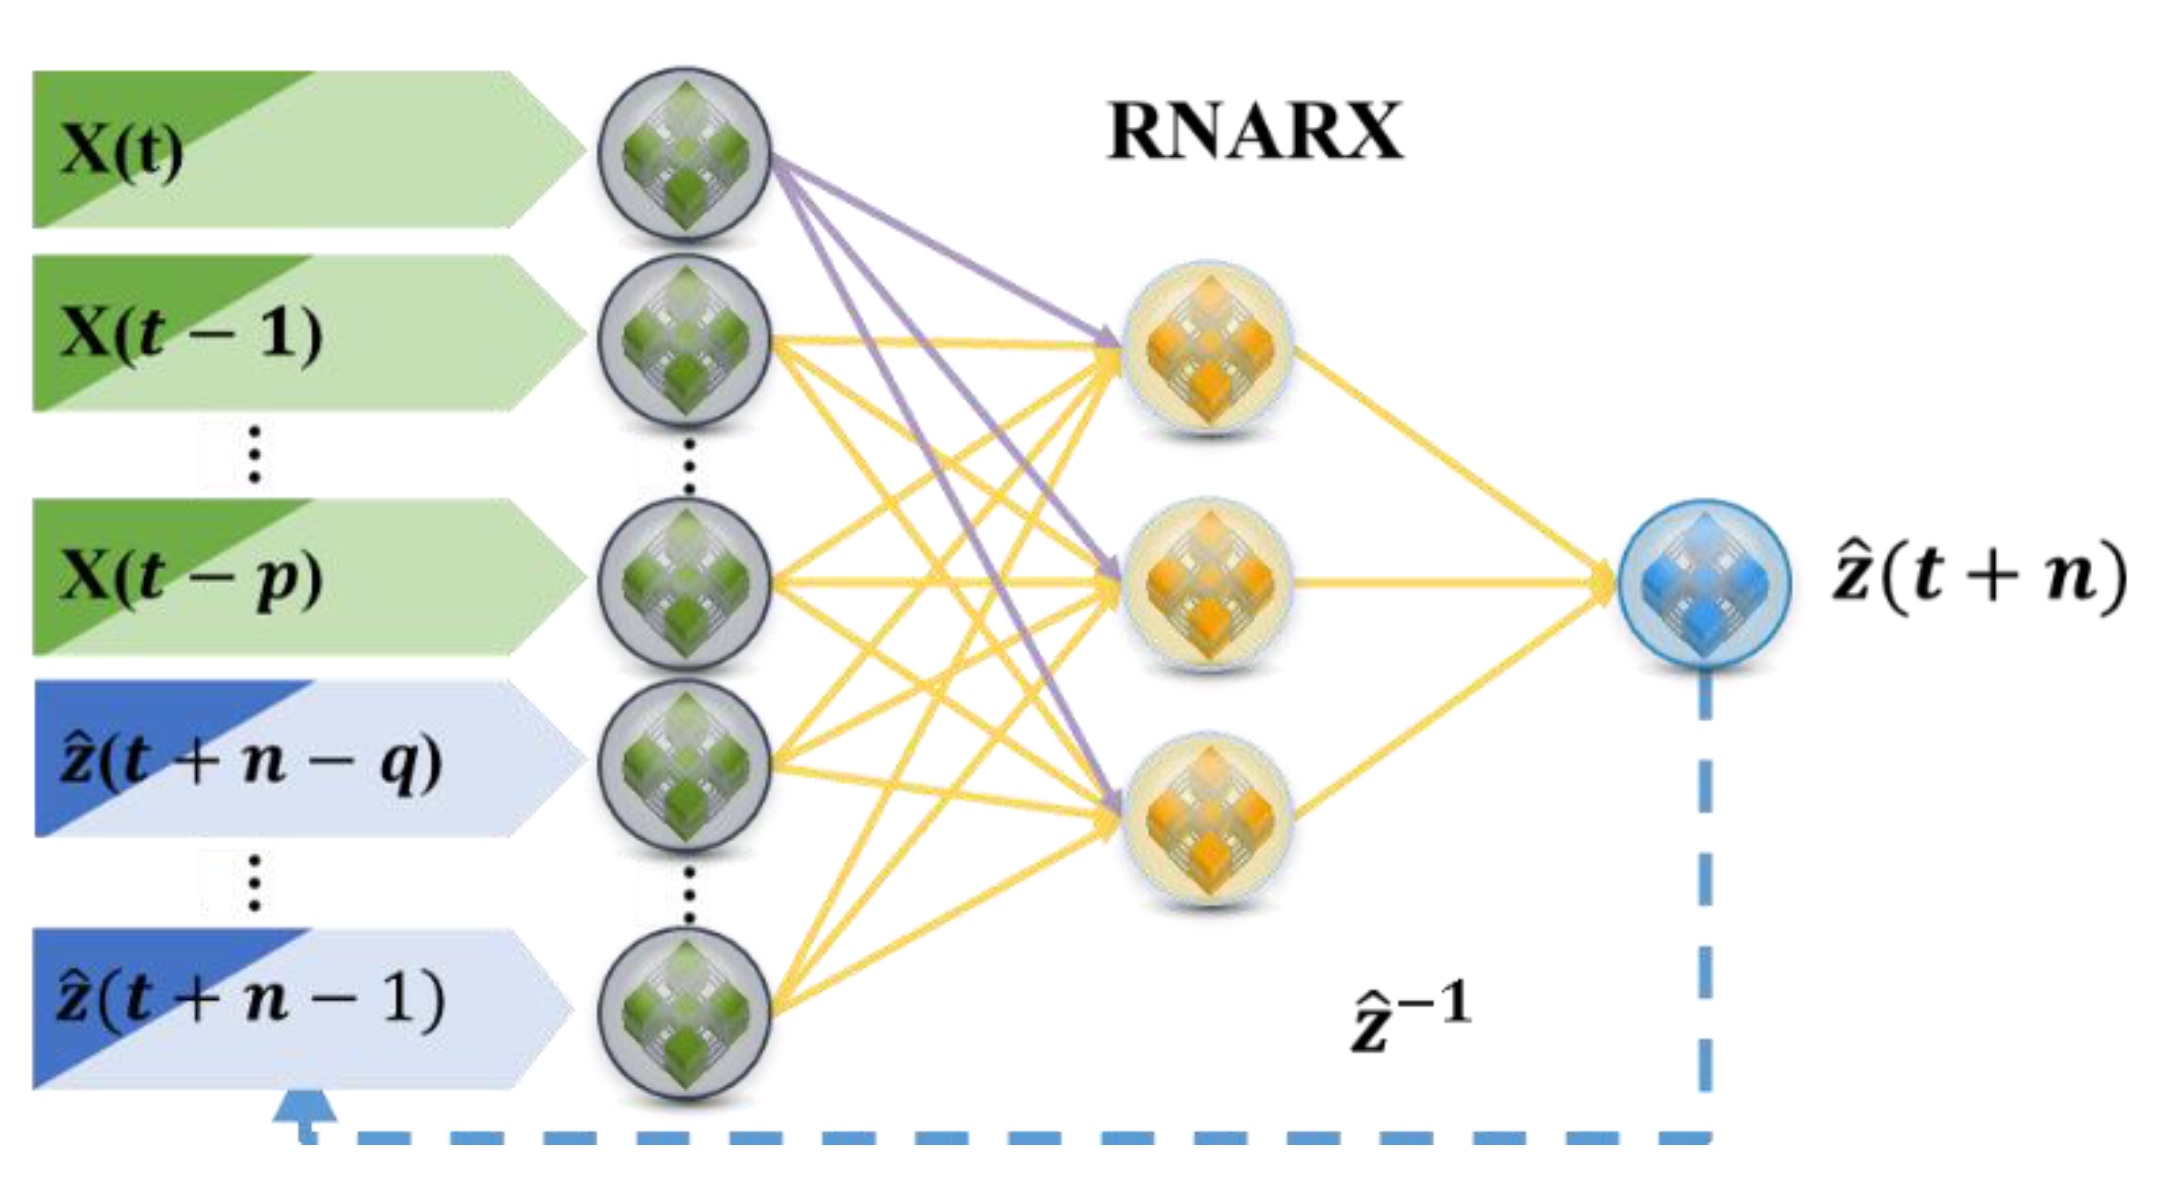
The nonlinear autoregressive with exogenous input (NARX) network is a powerful dynamic model for time series prediction [41]. Several studies have demonstrated that the recurrent configuration of the RNARX network (RNARX) could suitably forecast time series with long-range dependence present in data [42,43,44,45]. Besides, there is a common lack of real-time observed inundation depths, which is a great challenge for building a reliable real-time model. To solve the problem, the RNARX network offers the advantage of using model outputs as parts of inputs to train the model and use the configured model for real-time forecasting in test (or real) cases. To tackle the problem of no actual real-time observations available during model construction, the recurrent scheme of the RNARX network utilizes model outputs as parts of model inputs in training, validation and testing stages. That is to say, this recurrent network could be trained with imperfect information but similar characteristics of input-output patterns in all three phases (i.e., training, validation and testing phases), such that the configured network would maintain a similar forecasting capability in all phases. The constructed network and its synaptic weights would be fixed in the validation and testing phases to evaluate its reliability with new events. For multi-step-ahead forecasting tasks, current forecast values could be sequentially fed back to the input layer to provide one-step further forecasts.
Assuming the unit time delay and the output-memory order are given, this nonlinear function of the RNARX can be expressed by Equation (2):
where U(t) and z(t) are the input vector and output value at a time step t, respectively, and f[·] is the nonlinear function, q denotes the number of time steps.
The RNARX is commonly trained in two modes: parallel (P) and series-parallel (SP) modes. In the P mode, the forecasted outputs (z (t − i), i = 1 − q) are fed back into the input layer, represented by Equation (2). In the SP mode, the output regressor in the input layer is formed by observational values (d (t − i), i = 1 − q), as shown in Equation (3):
The architecture of the RNARX model is illustrated in Figure 5.
In this study, we implement the RNARX for flood forecasting. The RNARX model is configured by using model outputs as parts of model inputs, and its weights are adjusted by using the conjugate gradient back-propagation learning algorithm to search for the minimum errors during network training.
3.3. ANNs-Based Regional Inundation Depth Forecasting
We next discuss how to integrate the SOM and the RNARX for forecasting regional flood inundation maps. The hybriding process consist of three major schemes (Figure 6). The first scheme involves clustering regional inundation maps using the SOM. The second scheme involves building a forecast model using the RNARX to obtain the ARID under rainy conditions. The third scheme involves adjusting the weight of the selected neuron in the SOM based on the forecasted ARID to obtain a real-time adapted regional inundation map. To be more specific, the ARID of a neuron in the SOM can be obtained by weightedly summing (averaging) the inundation depths in all grids of the neuron, and then the neuron with a value that is the closest to the forecasted value is selected as the best matched (selected) neuron. The ARID of the selected (winning) neuron can be further modified by a linear interpolation method to adjust all the regional inundation depths in the neuron. Using this approach, the regional inundation maps stored in the SOM can be instantly updated during storm events, and the accuracy of the forecasted inundation map will significantly increase. We would like to note that real-time rainfall information might be the only information available for modelling in real applications, and therefore the proposed methodology does provide an effective and promising way for real-time forecasting regional flood inundation maps and their extents. The proposed methodology can be repeatedly implemented for obtaining multi-step-ahead forecasts.
3.4. Evaluation Indexes
The performance of the proposed approach is evaluated by the coefficient of determination (R2) and the root mean square error (RMSE), as shown below:
where Di and Yi are the forecasted value and the observed (simulated) value of the ith data, respectively. and are the mean values of the forecasted values and the observed values, respectively.
4. Results and Discussion
4.1. SOM Clustering
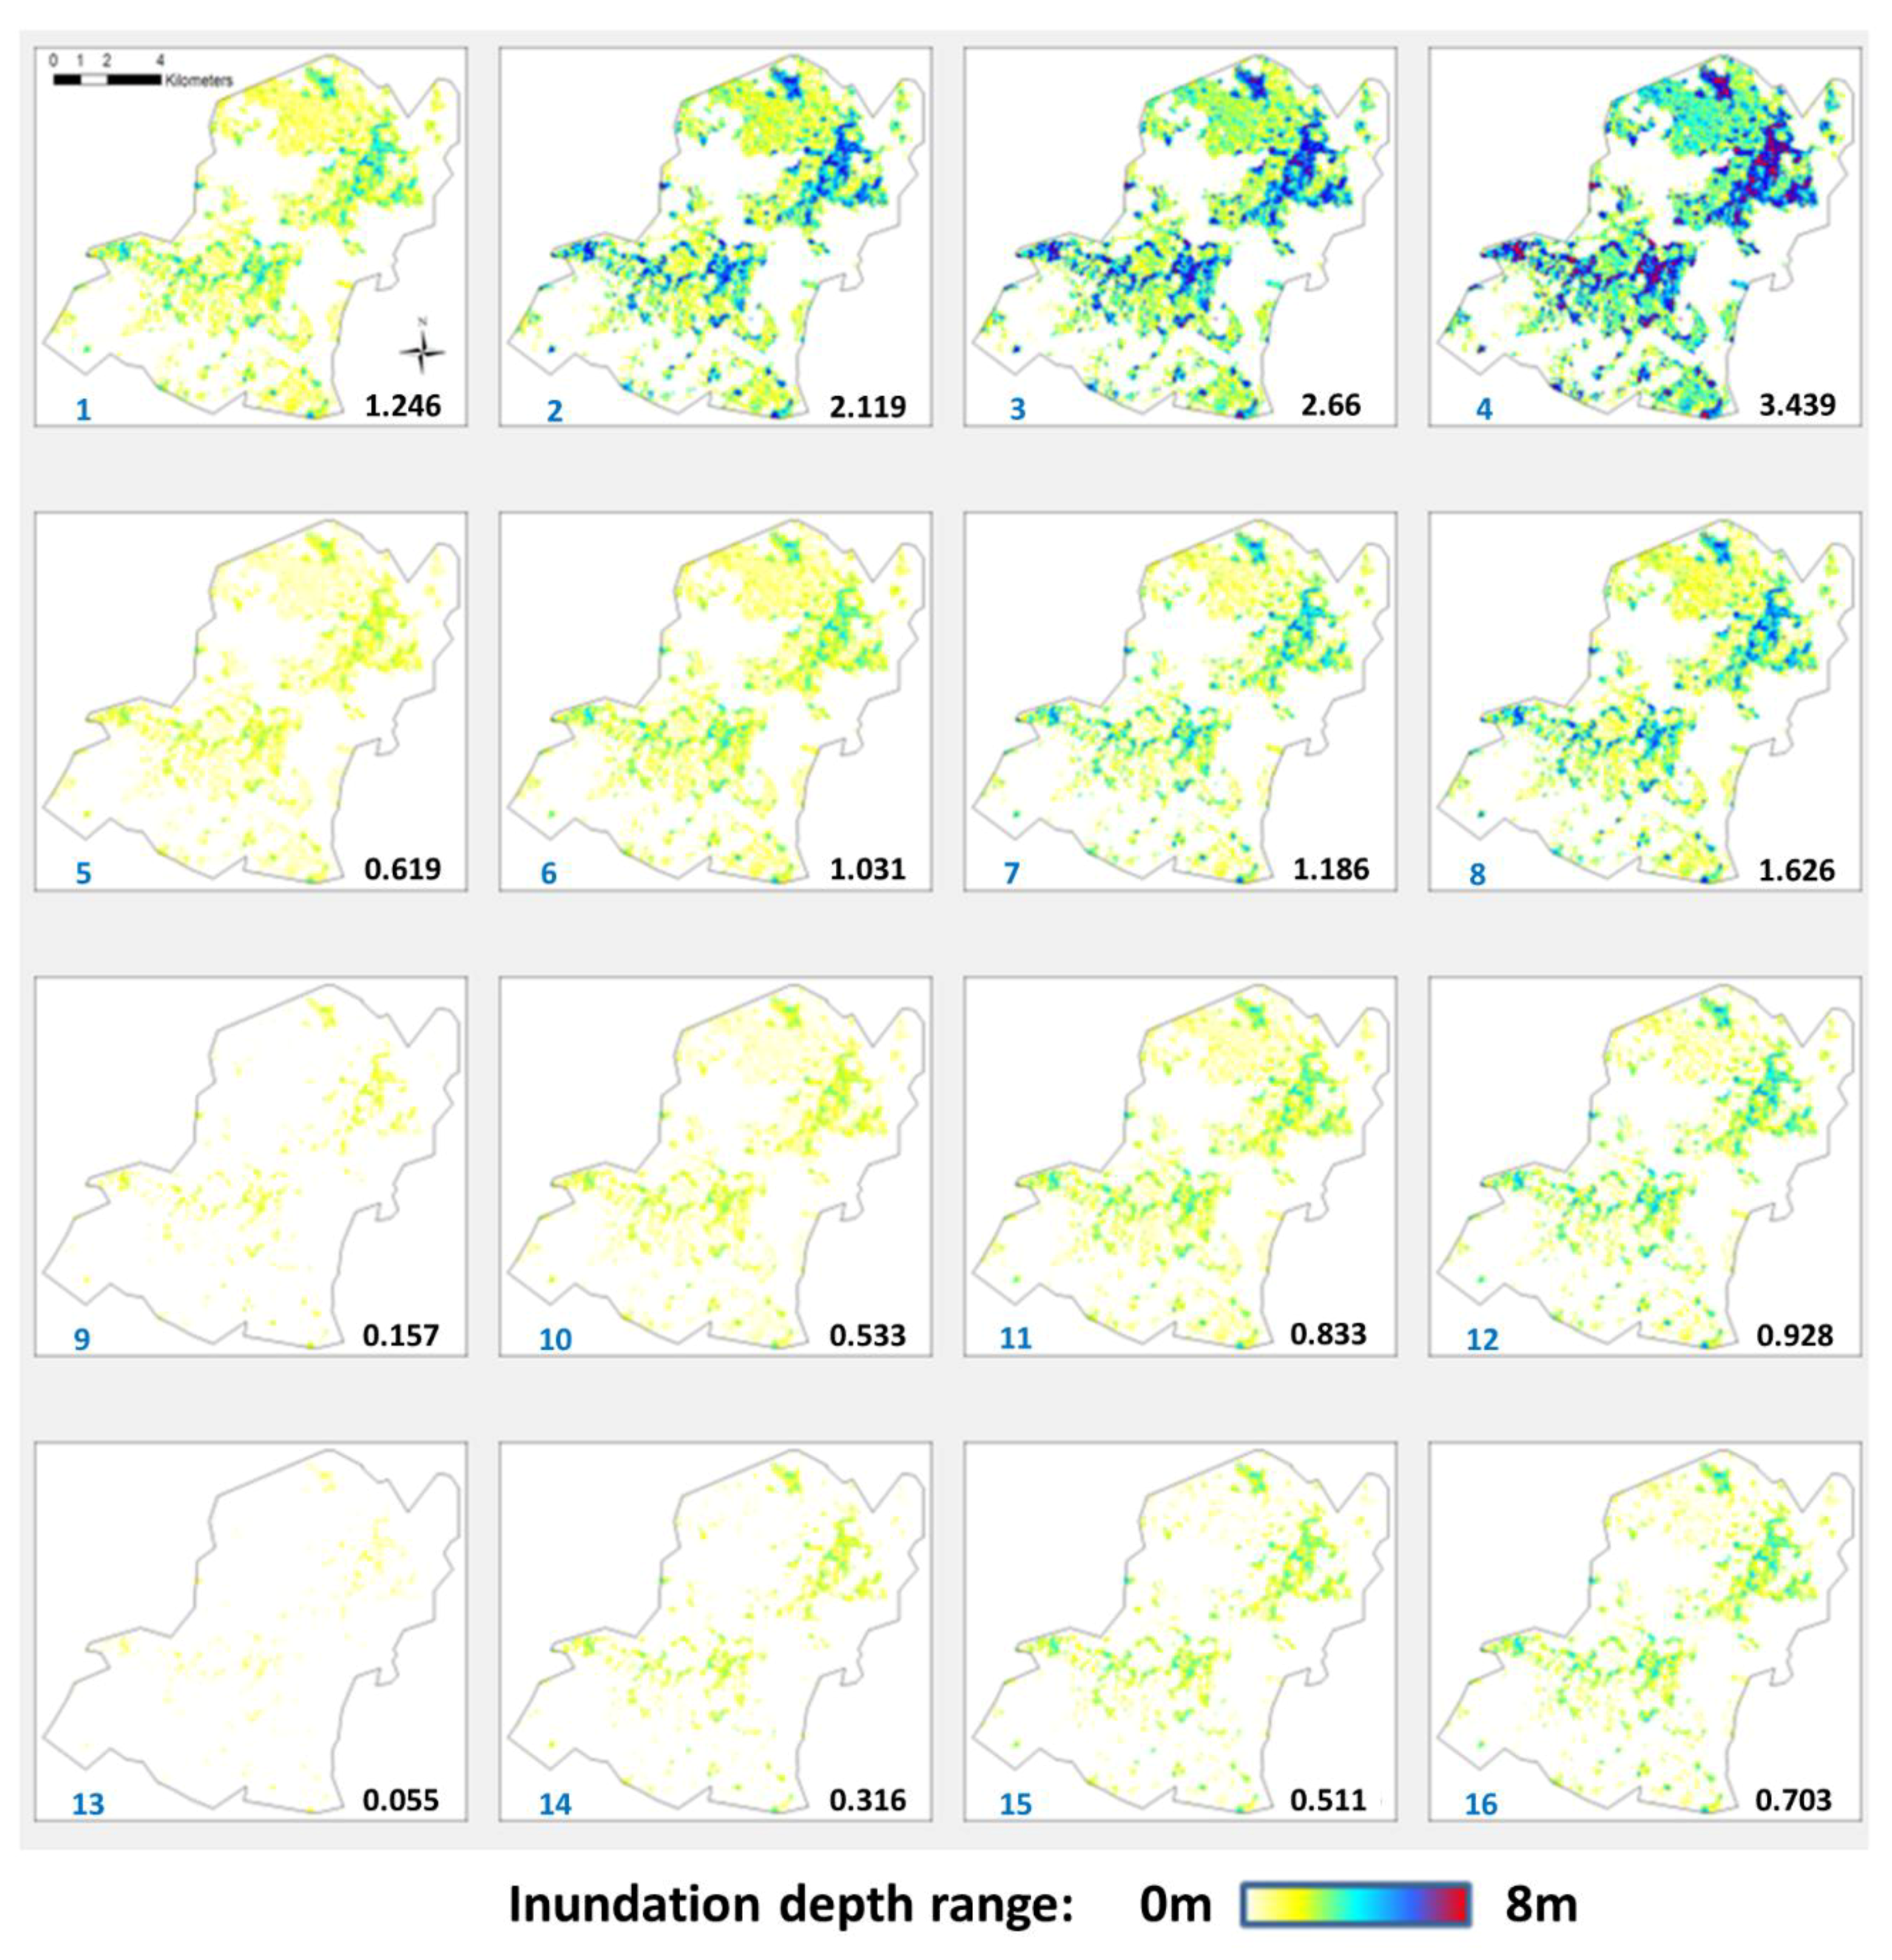
There are 225 (relevant to Events 1, 3, 5 and 7) datasets (i.e., regional inundation depths) to be classified into the neurons of the SOM in the training phase. Each neuron in the SOM contains 10,774 grids distributed over the study area. The classification results of the spatial distributions of inundation maps are shown in Figure 7. We find that the SOM networks with map sizes of 4 × 4 can produce well the clustering topology of regional inundation depths. The two-dimensional (4 × 4) topological map clearly presents the overall results of the neurons, which exhibits the variation trend of regional inundation depths ranging from [0–1 m] to [0–over 7 m]. The topological relationships between individual neurons and their neighboring neurons are visible and distinguishable. In Figure 7, the ARID of each neuron is shown at the top right corner of the neuron. The bottom-left section of each neuron is light yellow in color, showcasing the lowest input values (ARID = 0.055 m), while the top-right section of each neuron is dark blue in color, denoting the highest input values (ARID = 3.439 m).
The constructed topological map can easily display the difference between these two corners (bottom-left neuron and top-right neuron); moreover, the topological images of the neurons nearby each of these two corners are quite similar. These figures show that the SOM network can effectively cluster high-dimensional (10,744 grids) data to extract (and present) meaningful topological structures.
4.2. Forecasting Average Regional Inundation Depths (ARID)
Four ARID forecasting models are individually constructed for three- up to twelve-hour-ahead forecasting by using RNARX networks based on a large number of rainfall-total inundated volume patterns. There are 7 real events and 12 designed events used to build and/or test the forecast models. Data allocation for model construction is shown in Table 2. The inputs consist of the current observed three-hour rainfall of three sub-catchments and the recurrently forecasted ARIDs at time step of T + n − 1 while the output is the n-step-ahead (T + n) ARID. Table 3 shows the input combinations of the RNARX models at various time steps. For instance, the input dimension is 4 (three observed values and one recurrent forecasted value) and the output dimension is only 1 for T + 4 (12 h-ahead). After implementing an intensive trial-and-error procedure based on the training and validation datasets, the most suitable RNARX network is identified to have only one hidden layer with five nodes, which would in general produce admirable forecast performances.
Table 4 shows the summarized RNARX results for 3 h-up to 12 h-ahead forecasting of ARID in terms of RMSE and R2. The R2 values of 3–9 h ahead forecasting are greater than 0.90 in these three phases, which indicate that the constructed models can well forecast ARIDs with very high correlation, while those of 12 h-ahead forecasting are also greater than 0.87. It appears that the models can forecast ARIDs accurately and reliably. We notice that the 3 h-ahead, 6 h-ahead and 9 h-ahead forecasting models produce very similar results because these three models have the same inputs and parameters.
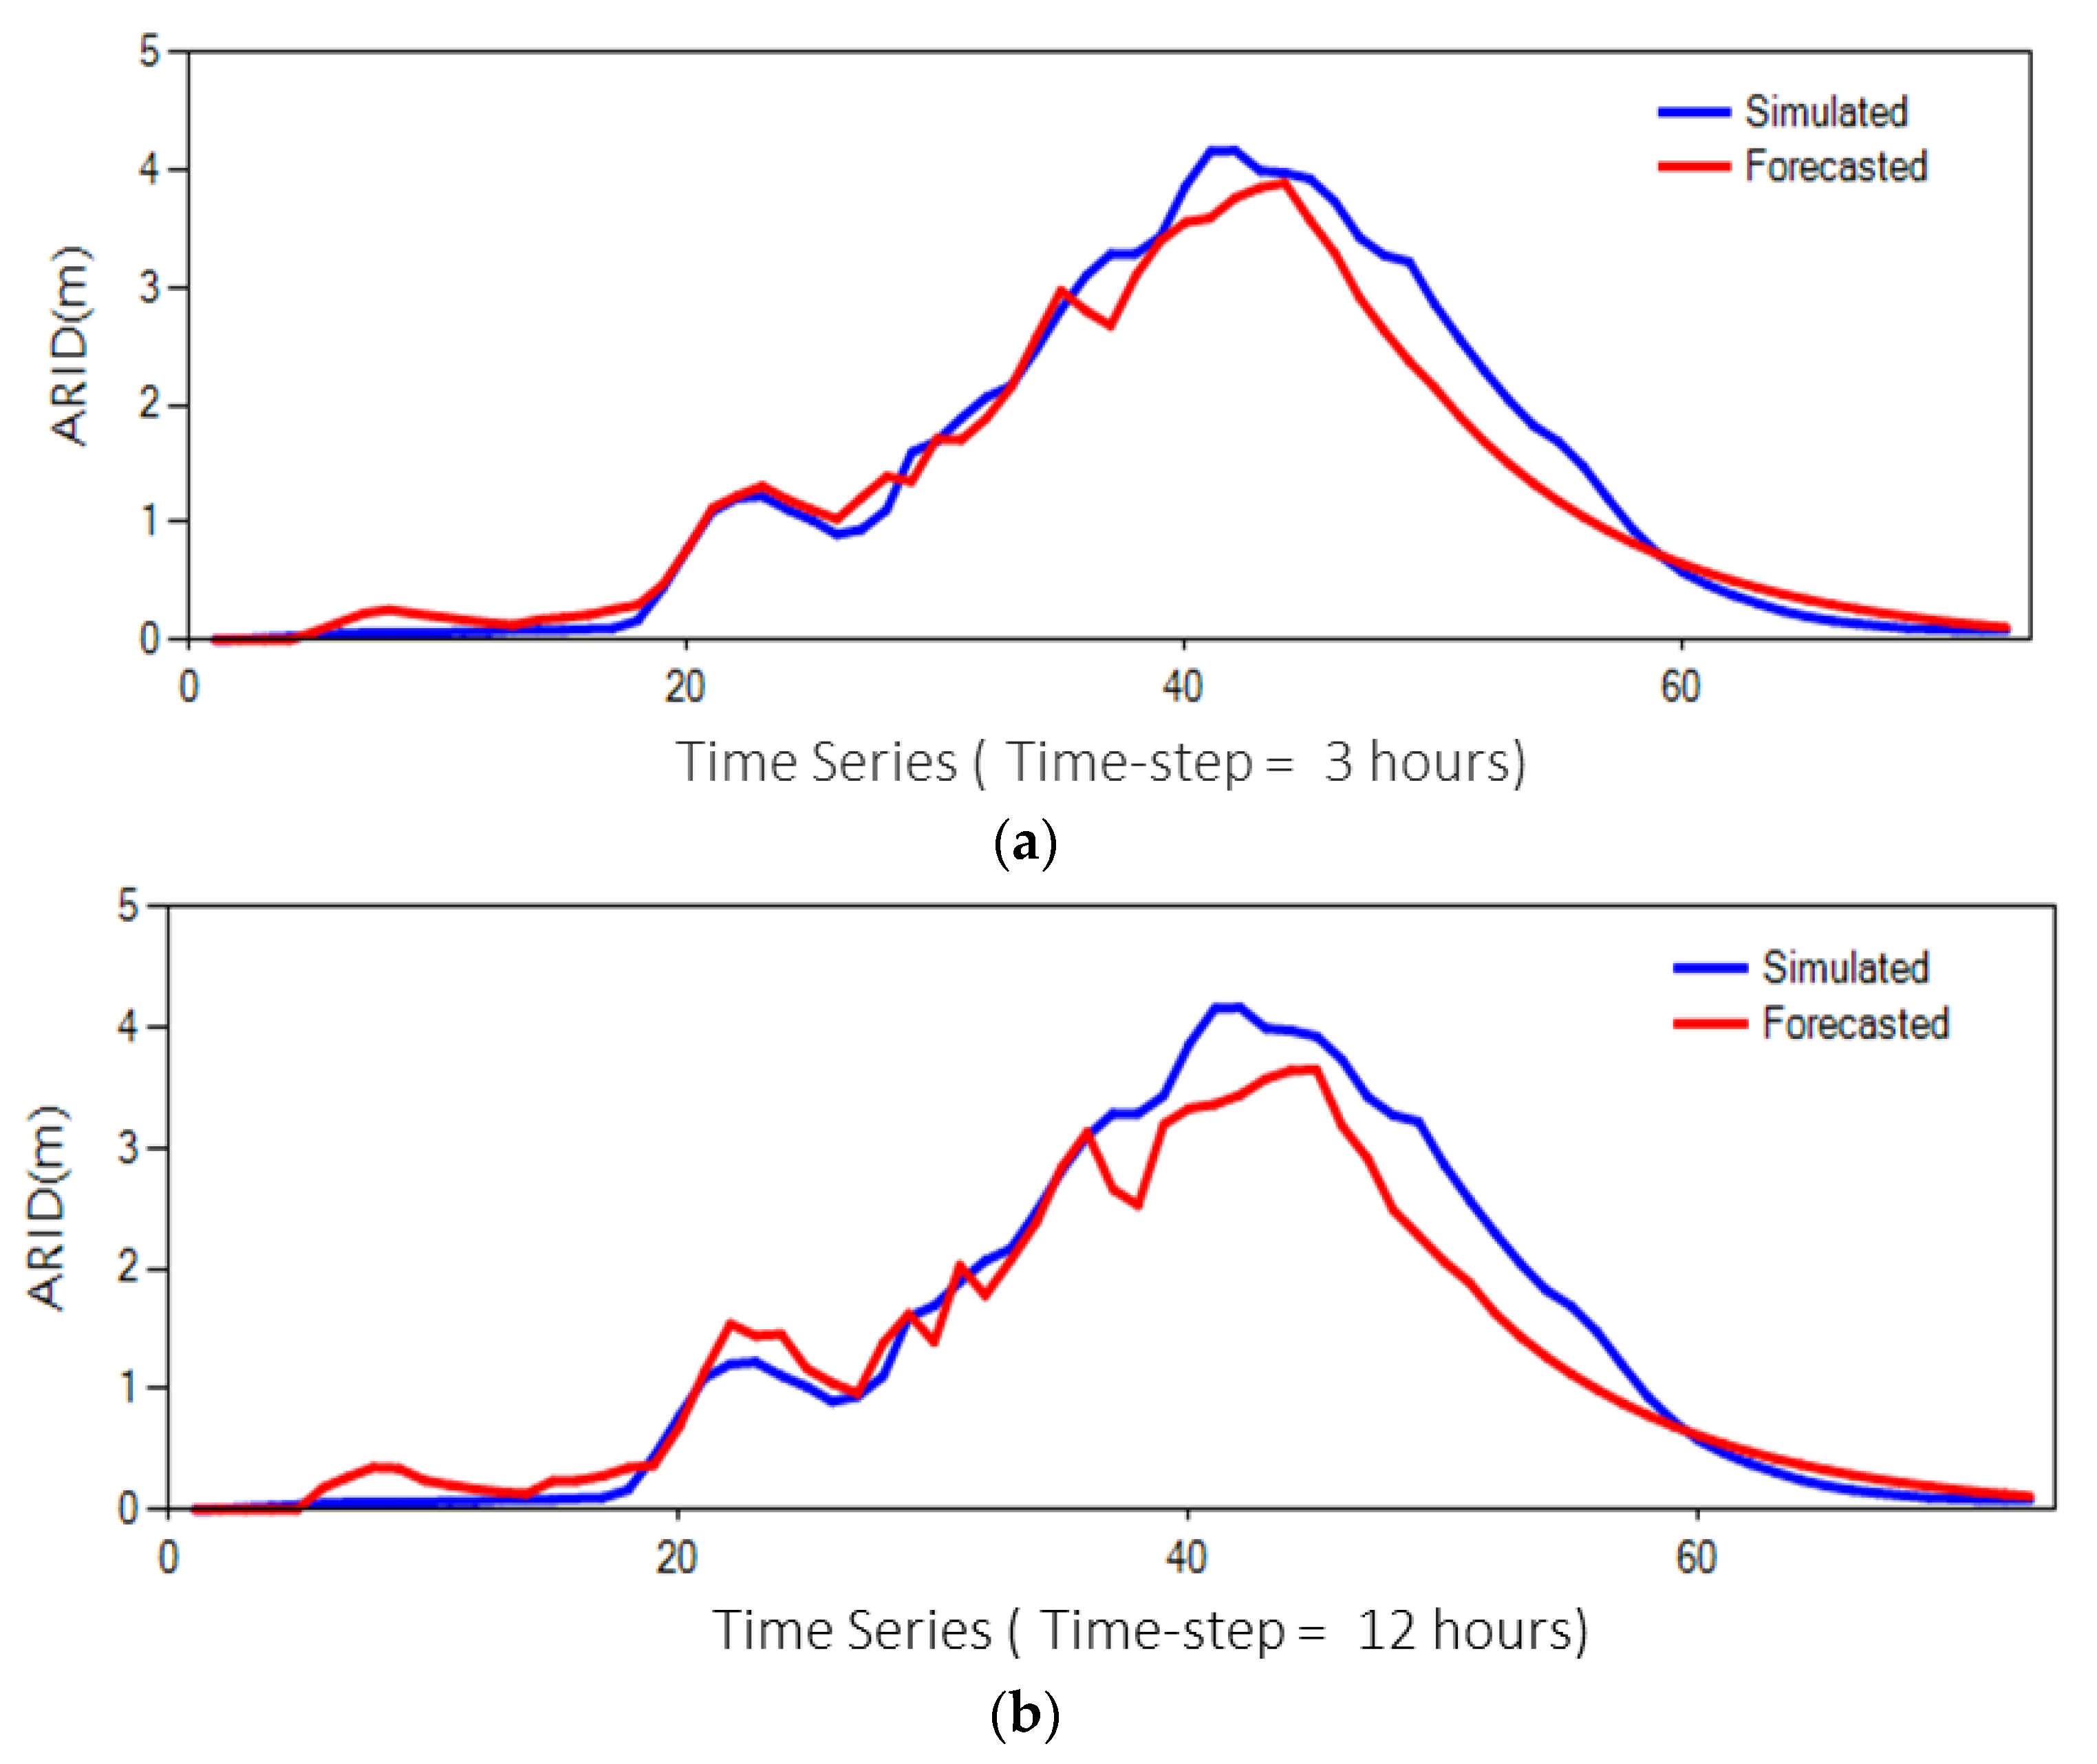
Figure 8 illustrates the simulated and forecasted ARIDs obtained from the RNARX model at two different horizons for Event 7. The results indicate that the RNARX perform well at both shorter forecast horizon (3 h) and longer forecast horizon (12 h). Therefore, it is suitable to use the RNARX to make forecasts on ARIDs.
4.3. ANNs-Based Models for Forecasting Regional Inundation Maps
In this hybrid stage, the forecasted ARID of the RNARX network is used to adjust the selected SOM neuron whose ARID is the closest to the forecasted ARID of the RNARX network. Table 5 shows the results of the simulation model for Event 7 in the study area (10,744 grids) with respect to different inundation depths (i.e., All, 0–1 m, 1–2 m, 2–3 m, and >3 m) and time steps ranging from the beginning of flooding at T = 75 to the end of flooding at T = 120. As shown, when T = 75 and T = 81, more than half of the grids have small inundation depths (i.e., 0–1 m) and the numbers of grids for higher inundation depths (i.e., 2–3 m and over 3 m peak) gradually increase over time. When T = 105, almost half the grids have inundation depths exceeding 3 m, and ARIDs reach the maximum at T = 120 and then decrease toward the end of flooding.
Table 6 shows the forecast performance ( and RMSE) of the hybrid SOM−RNARX model with respect to different inundation depths over time for Event 7, taking the simulation model as a benchmark. We find that the forecast model in general can provide very accurate and reliable results, in terms of small RMSE values and very high values.
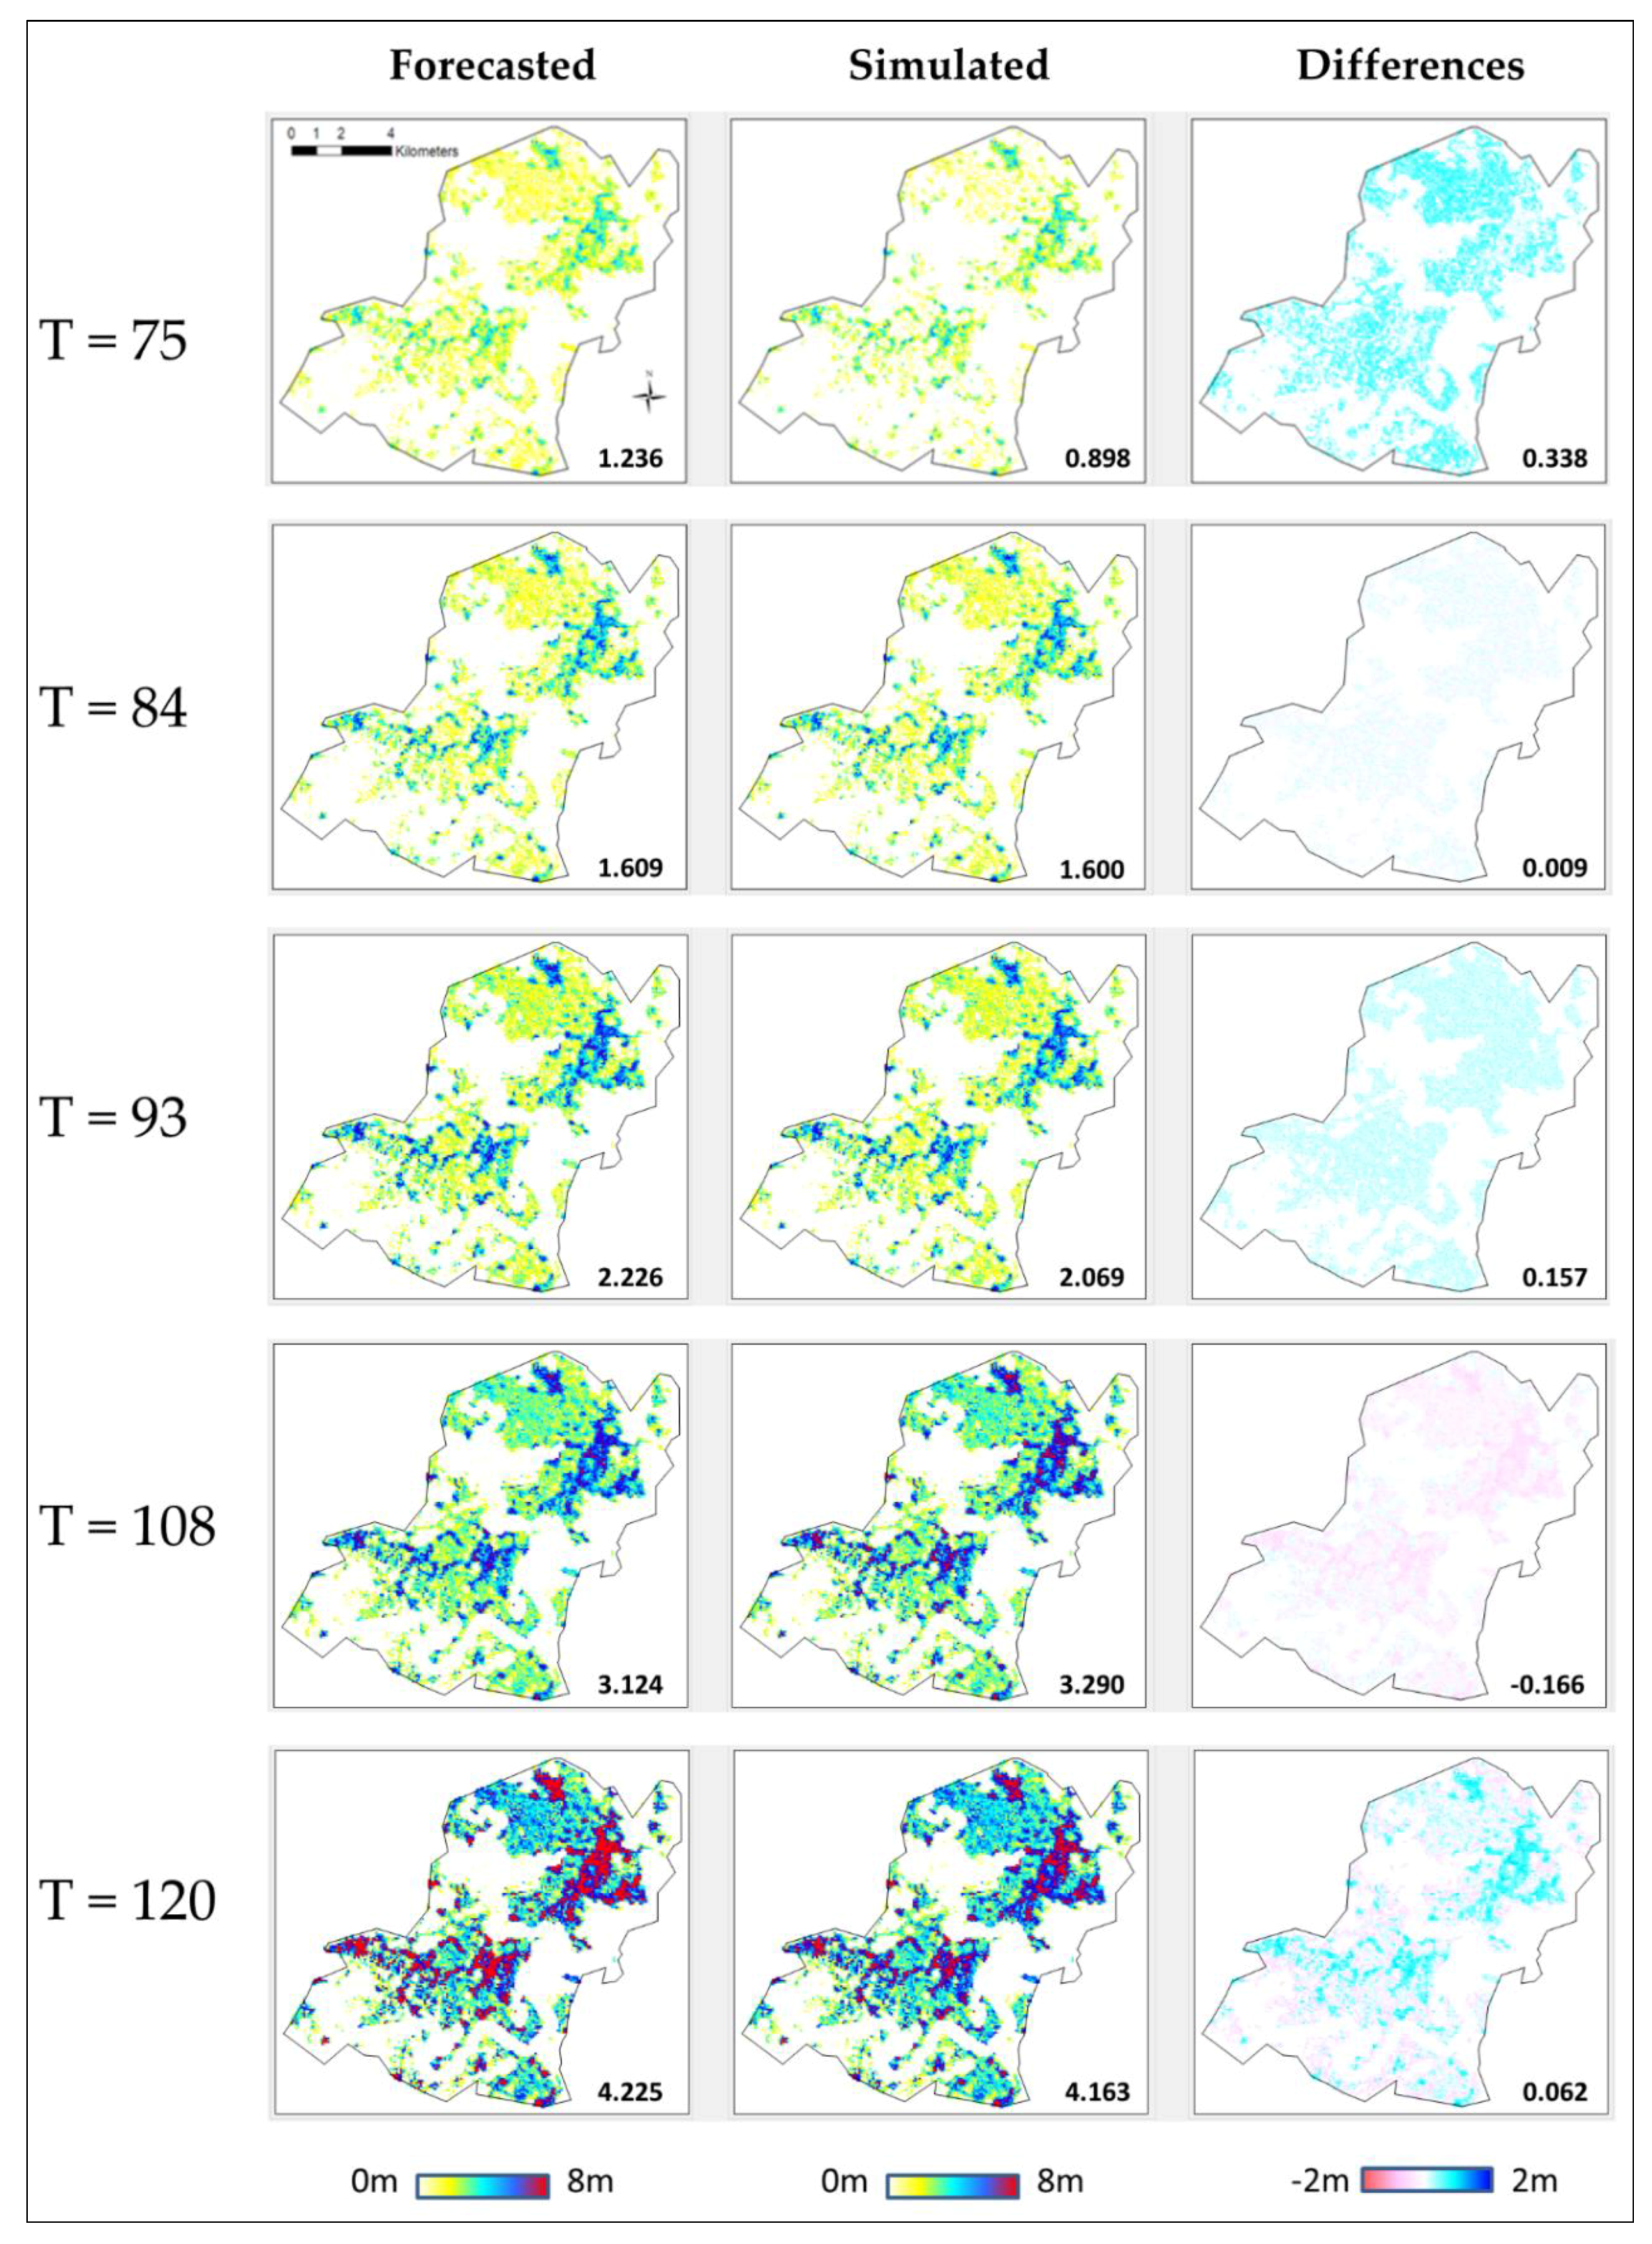
Figure 9 shows the regional flood inundation depths over time (from T = 75 to T = 120) for Event 7 in consideration of (1) forecasted results, (2) simulated results, and (3) differences between the forecasted and simulated results. We can find that the inundation depths range from low value (T = 75) to high value (T = 120) and the forecasted results agree with the simulated results. It appears that the proposed model could perform well because the differences in all the grids of the region are relatively small (less than 0.3 meter in most regions and time-steps). We conclude that the constructed models can produce suitable and reliable multi-step-ahead inundation forecasts and can be used to build a flood early warning system for the study area. We also notice that the proposed methodology can very quickly carry out multi-step-ahead (3 h up to 12 h) forecasting of area-wide inundation depths, with computation time less than few seconds, and thereby leading to real-time regional flood inundation forecasting.
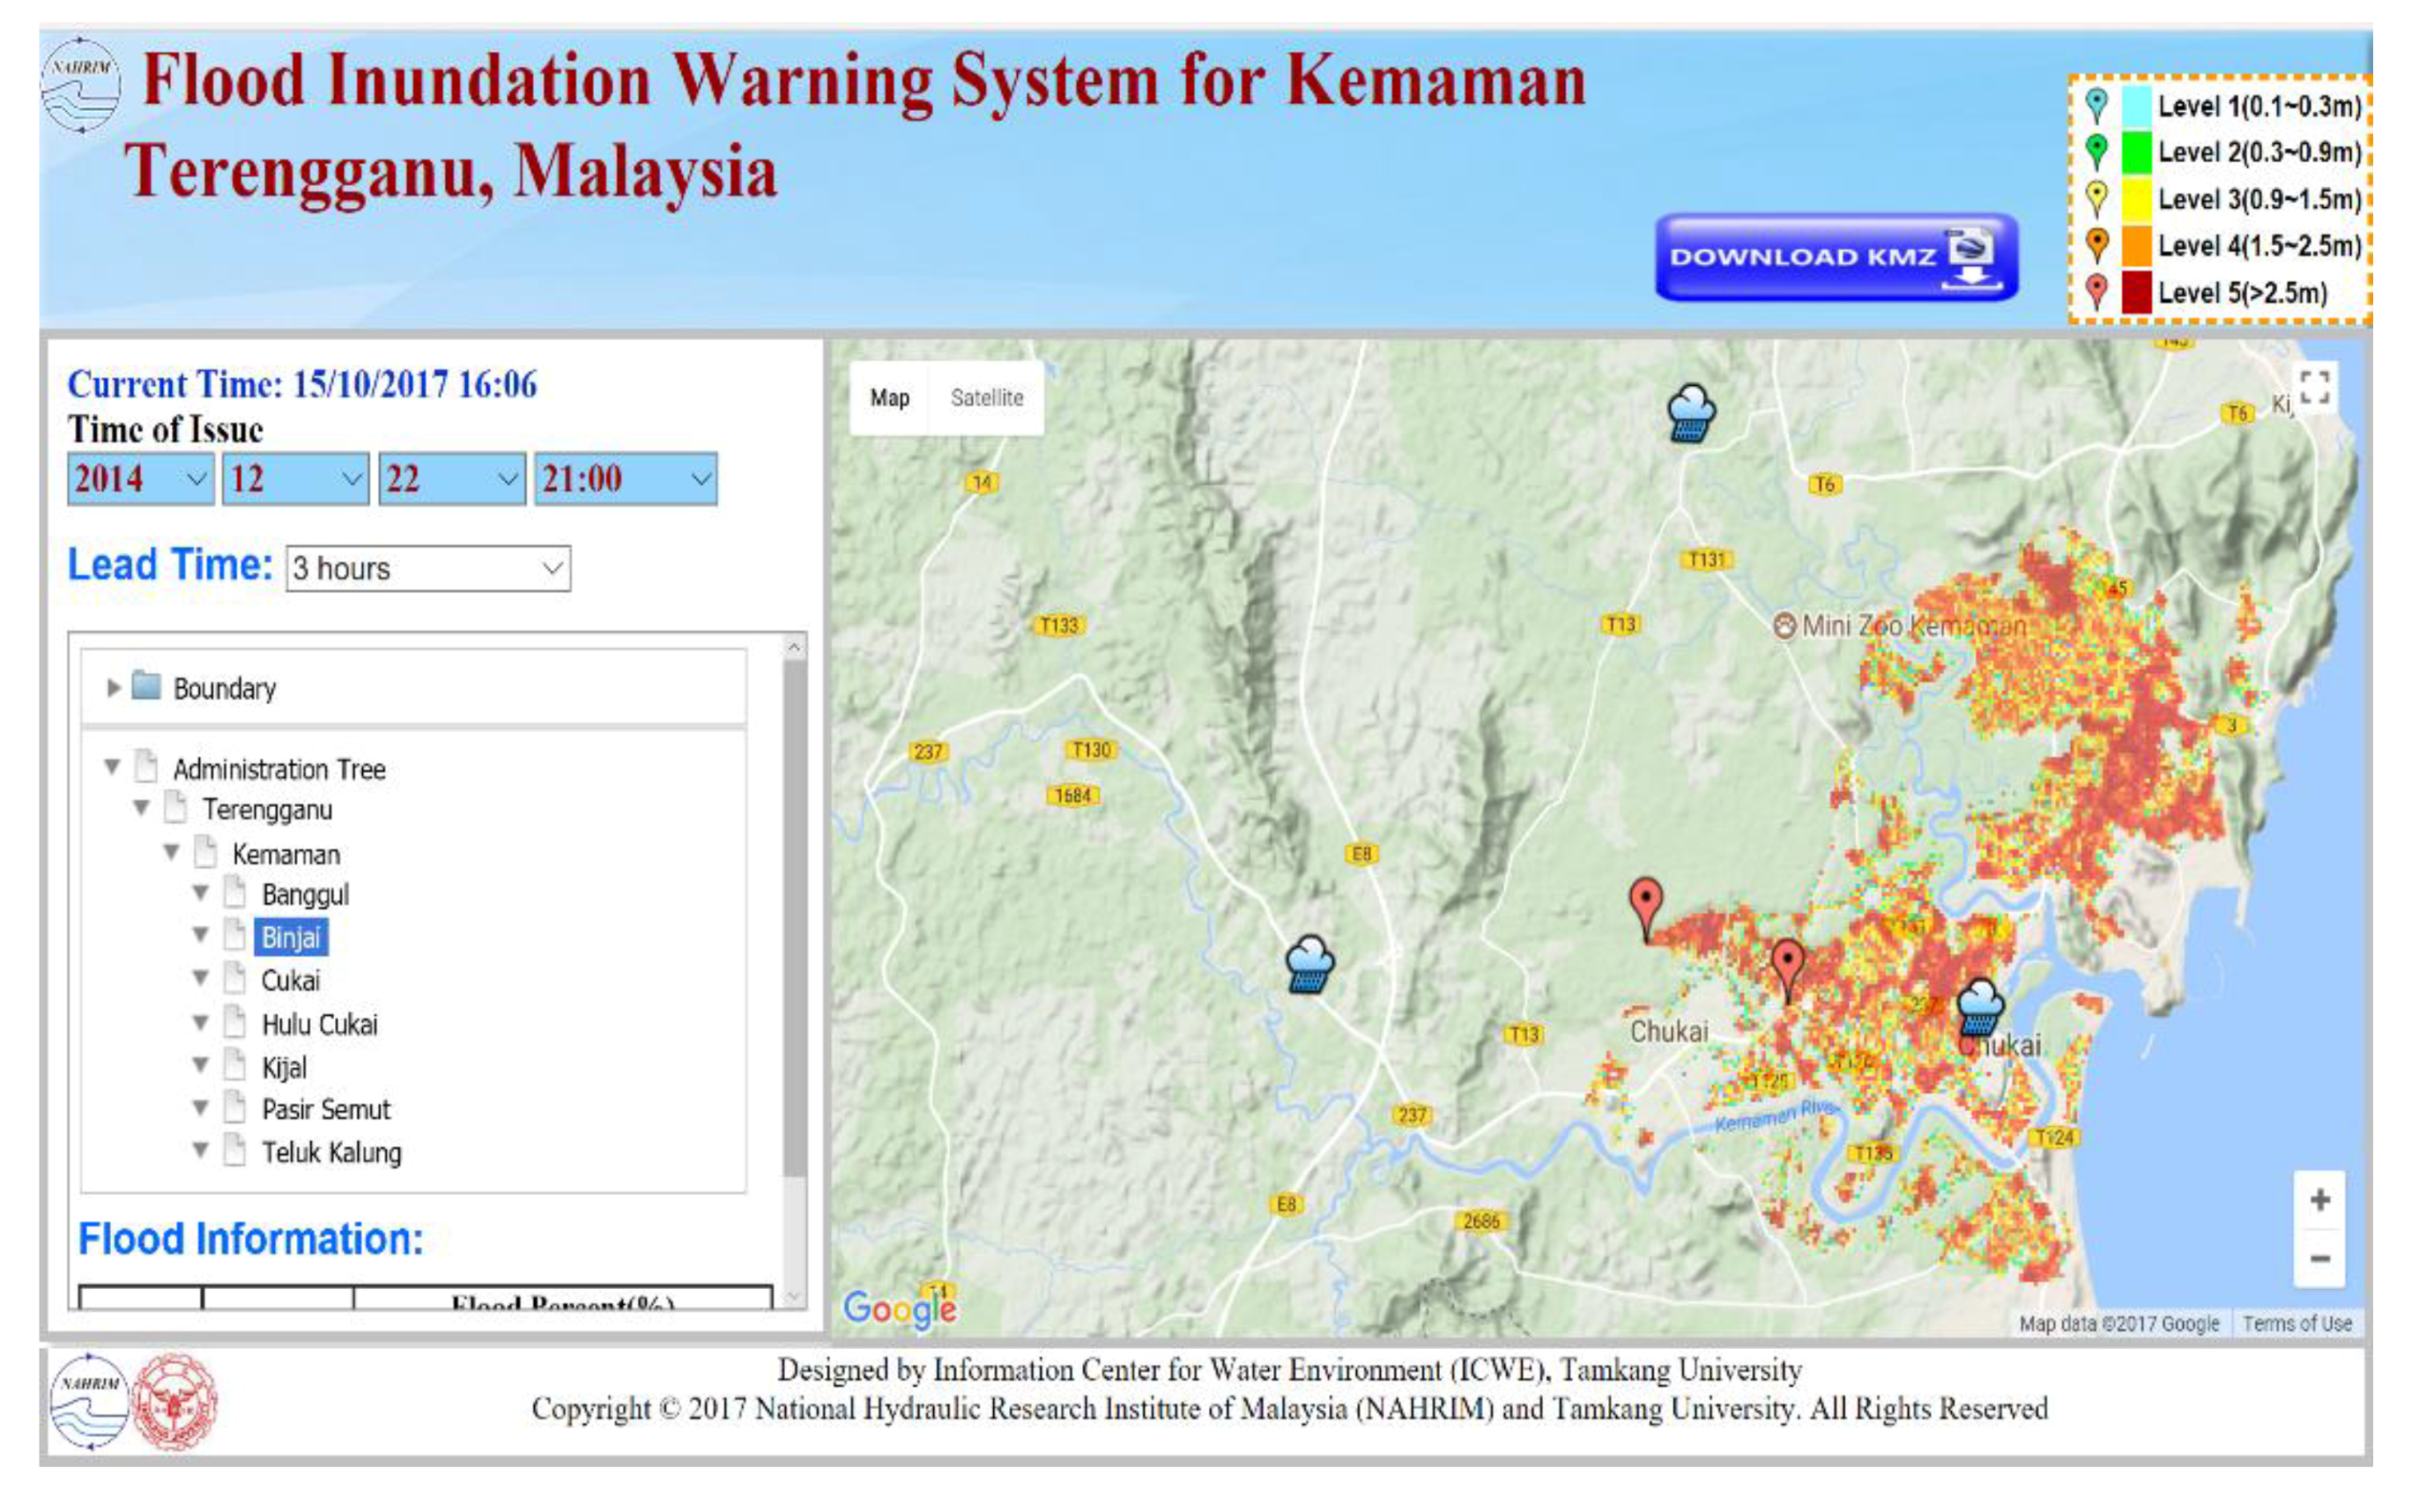
4.4. Development of the Flood Early Warning System
The final output of this study is the display of the on-line real-time flood early warning system, where the inundation status in the study area can be visualized online. The system display embeds Google Map in the webpage of this system and provides Keyhole Markup Language (KMZ) files for download. Users can see the regional flood inundation depths and quickly find a location’s inundation depth. Figure 10 shows the real-time regional flood inundation forecasting results displayed on the Web. It consists of three parts: Header, Main Page, and Footer. The header composes of the title of the system, the legend and the KMZ download button, which visualize the forecasted results on Google Earth in user devices. The left portion of the main page includes time of issue, lead time, tree views of boundary and administration for selecting the forecasted results of interest on Google Map. The rest of the main page is partitioned into two sub-parts: control panel and Google Map. The legend of the flood inundation level is shown in the upper left corner (Figure 10). A quadri-color flood warning system is built in this study, where blue denotes a warning of Level 1 indicating 0.1–0.3 m flood depths; green denotes a warning of Level 2 indicating 0.3–0.9 m flood depths; yellow denotes a warning of Level 3 indicating 0.9–1.5 m flood depths; orange denotes a warning of Level 4 indicating 1.5–2.5 m flood depths; and red denotes a warning of Level 5 indicating flood depths exceeding 2.5 m. The main function of the display interface is to show the inundation area over Google Map, to display the maximum inundation depth with its location in each sub-district, and to provide a KMZ file download of results that can be browsed on Google Earth.
5. Conclusions
This study aims at exploring an inundation forecasting approach for future forecast horizons based on the combination of a clustering technique (SOM) of a set of high-resolution inundation maps and an inundation depth forecasting model based on an artificial neural network (RNARX). We then establish a web-based (online) flood early warning system that enables the issuing of an advanced warning of possible flash floods and/or regional inundation depth. We propose a novel hybrid SOM−RNARX model for real-time forecasting of the spatial distribution of flood inundation in the study area of the Kemaman River Basin in Malaysia. We demonstrate that the regional inundation maps stored in the SOM can be instantly updated during storm invasion periods and the accuracy of the forecasted inundation maps can be significantly increased through real-time ARID forecasts obtained from the RNARX network. The proposed methodology and the primary results are summarized as follows:
- (1)
- The input datasets for the SOM consist of high-dimensional spatial inundation depths (with a grid resolution of 75 m × 75 m) of the study area obtained from the 2-D simulation model based on a number of real storm events. The main features of the spatial inundation distributions can be well distinguished by an SOM with 4 × 4 neurons to obtain a distinguishable topology. The SOM network can effectively cluster the high-dimensional (10,744 grids) inundation depths to extract and present their topological structures.
- (2)
- The results suggest that the RNARX network configured with current regional rainfall information and the model’s recurrent output can well capture the main features of the input-output patterns to provide stable and reliable forecasts of ARIDs.
- (3)
- The proposed model integrates the favorable essence of both networks (SOM & RNARX) and fuses their corresponding results to provide real-time visible regional multi-step-ahead flood inundation maps with high resolution; their nowcasts are reliable and adequate (with small RMSE and high R2 values).
- (4)
- Regarding the execution efficiency of the developed system for the study area, the system can very quickly (in just a few seconds) carry out three to twelve-hour-ahead forecasting of area-wide inundation maps and thereby lead to real-time flood forecasting.
Author Contributions
Conceptualization, F.-J.C., L.-C.C. and M.Z.M.A.; Methodology, L.-C.C., F.-J.C. and M.Z.M.A.; Software, L.-C.C., M.Z.M.A. and S.-N.Y.; Validation, L.-C.C. and M.Z.M.A.; Formal Analysis, F.-J.C., L.-C.C., M.Z.M.A. and S.-N.Y.; Investigation, L.-C.C. and M.Z.M.A.; Resources, F.-J.C., L.-C.C. and M.Z.M.A.; Data Curation, L.-C.C., M.Z.M.A. and S.-N.Y.; Writing-Original Draft Preparation, F.-J.C. and L.-C.C.; Writing-Review & Editing, F.-J.C., L.-C.C. and M.Z.M.A.; Visualization, L.-C.C.; Supervision, F.-J.C. and M.Z.M.A.; Project Administration, L.-C.C. and M.Z.M.A.; Funding Acquisition, M.Z.M.A. and L.-C.C.
Funding
This research was funded by Ministry of Water, Land and Natural Resources Malaysia (formerly known as Ministry of Natural Resources and Environment Malaysia through National Hydraulic Research Institute of Malaysia (NAHRIM) in collaboration with Tamkang University of Taiwan.
Acknowledgments
The authors are grateful to the National Hydraulic Research Institute of Malaysia (NAHRIM) for supporting and facilitating this study and providing hydrological data and analysis, and performed 2D hydrodynamics modeling as well as produced 2D riverine simulated flood inundation datasets. The authors would like to thank the Editors and anonymous Reviewers for their valuable and constructive comments related to this manuscript.
Conflicts of Interest
The authors declare no conflict of interest.
References
- Doocy, S.; Daniels, A.; Murray, S.; Kirsch, T.D. The Human Impact: A Historical Review of Events and Systematic Literature Review. PLoS Curr. Disasters 2013, 1, 1–32. [Google Scholar]
- Guha-Sapir, D.; Hoyois, P.; Below, R. Annual Disaster Statistical Review 2014: The Numbers and Trends; CRED, Université Catholique de Louvain: Brussels, Belgium, 2015. [Google Scholar]
- Guha-Sapir, D.; Hoyois, P.; Below, R.; Vanderveken, A. Annual Disaster Statistical Review 2015: The Numbers and Trends; CRED, Université Catholique de Louvain: Brussels, Belgium, 2016. [Google Scholar]
- Balica, S.F.; Popescu, I.; Beevers, L.; Wright, N.G. Parametric and physically based modelling techniques for flood risk and vulnerability assessment: A comparison. Environ. Model. Softw. 2013, 41, 84–92. [Google Scholar] [CrossRef] [Green Version]
- ESCAP IDD, United Nations. Disasters in Asia and the Pacific: 2015 Year in Review. Available online: https://www.unescap.org/sites/default/files/2015_Year%20in%20Review_final_PDF_1.pdf (accessed on 1 December 2017).
- Gourley, J.; Clark, R., III. Real-time flash flood forecasting. In Oxford Encyclopedia of Natural Hazard Science; Oxford University Press: Oxford, UK, 2018. [Google Scholar]
- Bates, P.D.; Horritt, M.S.; Fewtrell, T.J. A simple inertial formulation of the shallow water equations for efficient two-dimensional flood inundation modelling. J. Hydrol. 2010, 387, 33–45. [Google Scholar] [CrossRef]
- Han, S.; Coulibaly, P. Bayesian flood forecasting methods: A review. J. Hydrol. 2017, 551, 340–351. [Google Scholar] [CrossRef]
- Neal, J.C.; Odoni, N.A.; Trigg, M.A.; Freer, J.E.; Garcia-Pintado, J.; Mason, D.C.; Wood, M.; Bates, P.D. Efficient incorporation of channel cross-section geometry uncertainty into regional and global scale flood inundation models. J. Hydrol. 2015, 529, 169–183. [Google Scholar] [CrossRef] [Green Version]
- Abrahart, R.J.; See, L.M.; Solomatine, D.P. Practical Hydroinformatics: Computational Intelligence and Technological Developments in Water Applications; Springer: Berlin/Heidelberg, Germany, 2008. [Google Scholar]
- Mount, N.J.; Maier, H.R.; Toth, E.; Elshorbagy, A.; Solomatine, D.; Chang, F.J.; Abrahart, R.J. Data-driven modelling approaches for social-hydrology: Opportunities and challenges within the Panta Rhei Science Plan. Hydrol. Sci. J. 2016, 61, 1192–1208. [Google Scholar]
- Jhong, Y.D.; Chen, C.S.; Lin, H.P.; Chen, S.T. Physical Hybrid Neural Network Model to Forecast Typhoon Floods. Water 2018, 10, 632. [Google Scholar] [CrossRef]
- Badrzadeh, H.; Sarukkalige, R.; Jayawardena, A.W. Hourly runoff forecasting for flood risk management: Application of various computational intelligence models. J. Hydrol. 2015, 529, 1633–1643. [Google Scholar] [CrossRef]
- Yu, Y.; Zhang, H.; Singh, V.P. Forward prediction of runoff data in data-scarce basins with an improved ensemble empirical mode decomposition (EEMD) model. Water 2018, 10, 388. [Google Scholar] [CrossRef]
- Chang, F.J.; Chen, P.A.; Lu, Y.R.; Huang, E.; Chang, K.Y. Real-time multi-step-ahead water level forecasting by recurrent neural networks for urban flood control. J. Hydrol. 2014, 517, 836–846. [Google Scholar] [CrossRef]
- Chang, F.J.; Huang, C.W.; Cheng, S.T.; Chang, L.C. Conservation of groundwater from over-exploitation—Scientific analyses for groundwater resources management. Sci. Total Environ. 2017, 598, 828–838. [Google Scholar] [CrossRef] [PubMed]
- Chang, F.J.; Tsai, W.P.; Chen, H.K.; Tam, R.S.W.; Herricks, E.E. A self-organizing radial basis network for estimating riverine fish diversity. J. Hydrol. 2013, 476, 280–289. [Google Scholar] [CrossRef]
- Ghorbani, M.A.; Zadeh, H.A.; Isazadeh, M.; Terzi, O. A comparative study of artificial neural network (MLP, RBF) and support vector machine models for river flow prediction. Environ. Earth Sci. 2016, 75, 476. [Google Scholar] [CrossRef]
- Ashrafi, M.; Chua, L.H.C.; Quek, C.; Qin, X. A fully-online Neuro-Fuzzy model for flow forecasting in basins with limited data. J. Hydrol. 2017, 545, 424–435. [Google Scholar] [CrossRef]
- Lohani, A.K.; Goel, N.K.; Bhatia, K.K.S. Improving real time flood forecasting using fuzzy inference system. J. Hydrol. 2014, 509, 25–41. [Google Scholar] [CrossRef]
- Nguyen, P.K.T.; Chua, L.H.C.; Talei, A.; Chai, Q.H. Water level forecasting using neuro-fuzzy models with local learning. Neural Comput. Appl. 2018, 30, 1877–1887. [Google Scholar] [CrossRef]
- Yaseen, Z.M.; Jaafar, O.; Deo, R.C.; Kisi, O.; Adamowski, J.; Quilty, J.; El-Shafie, A. Stream-flow forecasting using extreme learning machines: A case study in a semi-arid region in Iraq. J. Hydrol. 2016, 542, 603–614. [Google Scholar] [CrossRef]
- Zhou, Y.; Guo, S.; Chang, F.J.; Liu, P.; Chen, A.B. Methodology that improves water utilization and hydropower generation without increasing flood risk in mega cascade reservoirs. Energy 2018, 143, 785–796. [Google Scholar] [CrossRef]
- Chang, F.J.; Chiang, Y.M.; Ho, Y.H. Multi-step-ahead flood forecasts by neuro-fuzzy networks with effective rainfall-runoff patterns. J. Flood Risk Manag. 2015, 8, 224–236. [Google Scholar] [CrossRef]
- Chang, F.J.; Tsai, M.J. A nonlinear spatio-temporal lumping of radar rainfall for modeling multi-step-ahead inflow forecasts by data-driven techniques. J. Hydrol. 2016, 535, 256–269. [Google Scholar] [CrossRef]
- Zhong, Y.; Guo, S.; Ba, H.; Xiong, F.; Chang, F.J.; Lin, K. Evaluation of the BMA probabilistic inflow forecasts using TIGGE numeric precipitation predictions based on artificial neural network. Hydrol. Res. 2018. [Google Scholar] [CrossRef]
- Zhou, J.; Peng, T.; Zhang, C.; Sun, N. Data Pre-Analysis and Ensemble of Various Artificial Neural Networks for Monthly Streamflow Forecasting. Water 2018, 10, 628. [Google Scholar] [CrossRef]
- Seng Mah, D.Y.; Lai, S.H.; Chan, R.A.; Putuhena, F.J. Investigative modelling of the flood bypass channel in Kuching, Sarawak, by assessing its impact on the inundations of Kuching-Batu Kawa-Bau Expressway. Struct. Infrastruct. Eng. 2012, 8, 705–714. [Google Scholar] [CrossRef] [Green Version]
- Benito, G.; Lang, M.; Barriendos, M.; Llasat, M.C.; Frances, F.; Ouarda, T.; Thorndycraft, V.R.; Enzel, Y.; Bardossy, A.; Coeur, D.; et al. Use of systematic, palaeoflood and historical data for the improvement of flood risk estimation. Review of scientific methods. Nat. Hazards 2004, 31, 623–643. [Google Scholar]
- Wallingford Software. InfoWorks RS Forms Basis for Flood Map of Northern Ireland. User Case Studies. Available online: http://www.wallingfordsoftware.com/casestudies/fullarticle.asp?ID¼870 (accessed on 28 November 2009).
- Hassan, A.J. River and Floodplain Modelling: A Practical Approach; National Hydraulic Research Institute of Malaysia (NAHRIM): Kuala Lumpur, Malaysia, 2009. [Google Scholar]
- Adnan, M.S.; Yuliarahmadila, E.; Norfathiah, C.A.; Kasmin, H.; Rosly, N. Flood Simulation Using Rainfall-Runoff for Segamat River Basin, Advances in Civil, Architectural, Structural and Constructional Engineering; Kim, J.S., Ed.; Taylor & Francis Group: London, UK, 2016; ISBN 978-1-138-02849-4. [Google Scholar]
- Othman, F.; Amin, M.; Farahain, N.; Mi Fung, L.; Elamin, M.; Eldin, A. Utilizing GIS and Infoworks RS in Modelling the Flooding Events for a Tropical River Basin. Appl. Mech. Mater. 2013, 353–356, 2281–2285. [Google Scholar] [CrossRef]
- Kohonen, T. Self-organized formation of topologically correct feature maps. Biol. Cybern. 1982, 43, 59–69. [Google Scholar] [CrossRef]
- Chang, L.C.; Shen, H.Y.; Chang, F.J. Regional flood inundation nowcast using hybrid SOM and dynamic neural networks. J. Hydrol. 2014, 519, 476–489. [Google Scholar] [CrossRef]
- Chang, F.J.; Chang, L.C.; Huang, C.W.; Kao, I.F. Prediction of monthly regional groundwater levels through hybrid soft-computing techniques. J. Hydrol. 2016, 541, 965–976. [Google Scholar] [CrossRef]
- Chen, I.T.; Chang, L.C.; Chang, F.J. Exploring the spatio-temporal interrelation between groundwater and surface water by using the self-organizing maps. J. Hydrol. 2018, 556, 131–142. [Google Scholar] [CrossRef]
- Tsai, W.P.; Huang, S.P.; Cheng, S.T.; Shao, K.T.; Chang, F.J. A data-mining framework for exploring the multi-relation between fish species and water quality through self-organizing map. Sci. Total Environ. 2017, 579, 474–483. [Google Scholar] [CrossRef] [PubMed]
- Agarwal, A.; Maheswaran, R.; Kurths, J.; Khosa, R. Wavelet Spectrum and self-organizing maps-based approach for hydrologic regionalization-a case study in the western United States. Water Res. Manag. 2016, 30, 4399–4413. [Google Scholar] [CrossRef]
- Kalteh, A.M.; Hjorth, P.; Berndtsson, R. Review of the self-organizing map (SOM) approach in water resources: Analysis, modelling and application. Environ. Model. Softw. 2008, 23, 835–845. [Google Scholar] [CrossRef]
- Leontaritis, I.J.; Billings, S.A. Input–output parametric models for nonlinear systems. Int. J. Control 1985, 41, 303–344. [Google Scholar] [CrossRef]
- Chen, P.A.; Chang, L.C.; Chang, F.J. Reinforced Recurrent Neural Networks for Multi-Step-Ahead Flood Forecasts. J. Hydrol. 2013, 497, 71–79. [Google Scholar] [CrossRef]
- Chang, F.J.; Chen, P.A.; Chang, L.C.; Tsai, Y.H. Estimating spatio-temporal dynamics of stream total phosphate concentration by soft computing techniques. Sci. Total Environ. 2016, 562, 228–236. [Google Scholar] [CrossRef] [PubMed]
- Chai, L.; Qu, Y.; Liang, S.; Wang, J. Estimating time-series leaf area index based on recurrent nonlinear autoregressive neural networks with exogenous inputs. Int. J. Remote Sens. 2012, 33, 5712–5731. [Google Scholar] [CrossRef]
- Eugen, D. Prediction of chaotic time series with NARX recurrent dynamic neural networks. In Proceedings of the 9th WSEAS International Conference International Conference Automation and Information, Bucharest, Romania, 24–26 June 2008; pp. 248–253. [Google Scholar]
Figure 1.
Information of Kemaman River Basin in Malaysia: (a) geological location, (b) rainfall stations and (c) river flow stations (St.), (d) study area, (e) topology of the study area, and (f) land use and main rivers.
Figure 1.
Information of Kemaman River Basin in Malaysia: (a) geological location, (b) rainfall stations and (c) river flow stations (St.), (d) study area, (e) topology of the study area, and (f) land use and main rivers.

Figure 2.
Rainfall histogram and average inundation depth hydrograph for Event 7.

Figure 3.
Maximum simulated flood map derived from the 2D flood model (a rainfall of 1653 mm in December 2014).
Figure 3.
Maximum simulated flood map derived from the 2D flood model (a rainfall of 1653 mm in December 2014).

Figure 4.
Cluster the spatial distributions of inundation maps by the SOM (4 × 4 neurons).

Figure 5.
Architecture of the RNARX network. X and denote observed and forecasted values, respectively.
Figure 5.
Architecture of the RNARX network. X and denote observed and forecasted values, respectively.

Figure 6.
Methodology of the hybrid SOM–RNARX model.

Figure 7.
Topology of 4 × 4 clustering maps.

Figure 8.
Simulated and forecasted ARIDs obtained from the RNARX model for Event 7. (a) 3 h-ahead simulated and forecasted ARIDs; (b) 12 h-ahead simulated and forecasted ARIDs.
Figure 8.
Simulated and forecasted ARIDs obtained from the RNARX model for Event 7. (a) 3 h-ahead simulated and forecasted ARIDs; (b) 12 h-ahead simulated and forecasted ARIDs.

Figure 9.
Regional flood inundation depths at different time steps ranging from T = 75 (beginning) to T = 120 (ending) for Event 7 in consideration of (1) forecasted results, (2) simulated results, and (3) differences between the forecasted and simulated results, respectively.
Figure 9.
Regional flood inundation depths at different time steps ranging from T = 75 (beginning) to T = 120 (ending) for Event 7 in consideration of (1) forecasted results, (2) simulated results, and (3) differences between the forecasted and simulated results, respectively.

Figure 10.
Regional flood inundation information on the designed Web.


Table 1.
Real storm events and their characterization.
| Event | Beginning (yy/mm/dd) | Ending (yy/mm/dd) | Duration (h) | Maximum Flow (m3/s) | Accumulated Average Rainfall (mm) | Maximum Average Inundation Depth (m) | ||
|---|---|---|---|---|---|---|---|---|
| St*. #4131453 | St. #4232401 | St. #4332401 | ||||||
| 1 | 2001/12/20, 5:00 a.m. | 2001/12/27, 9:00 a.m. | 172 | 731 | 814 | 84 | 453 | 1.70 |
| 2 | 2003/12/5, 12:00 p.m. | 2003/12/12, 9:00 a.m. | 165 | 554 | 433 | 183 | 396 | 1.67 |
| 3 | 2006/12/20, 2:15 a.m. | 2006/12/26, 8:30 a.m. | 150 | 534 | 207 | 87 | 268 | 1.48 |
| 4 | 2008/12/31, 19:30 a.m. | 2009/1/8, 7:30 a.m. | 180 | 478 | 487 | 96 | 390 | 1.74 |
| 5 | 2012/1/10, 7:15 a.m. | 2012/1/17, 4:00 p.m. | 177 | 453 | 506 | 39 | 255 | 1.70 |
| 6 | 2012/12/13, 0:15 a.m. | 2013/1/13, 0:00 a.m. | 744 | 509 | 920 | 75 | 973 | 3.28 |
| 7 | 2013/11/28 9:30 p.m. | 2013/12/6, 9:30 p.m. | 192 | 745 | 1142 | 63 | 996 | 4.17 |
| 8 | 2014/12/13, 12:00 p.m. | 2015/1/1, 4:00 p.m. | 460 | 634 | 801 | 57 | 1653 | 3.35 |
* River flow station.
Table 2.
Dataset allocation for constructing RNARX models.
| Dataset | Real Events | Designed Events |
|---|---|---|
| Training | Event 3 Event 5 Event 6 Event 7 | 100yearreturnperiod_12hourRainfall 50yearreturnperiod_24hourRainfall 20yearreturnperiod_48hourRainfall 50yearreturnperiod_48hourRainfall 20yearreturnperiod_72hourRainfall 100yearreturnperiod_72hourRainfall |
| Validation | Event 2 Event 4 | 20yearreturnperiod_12hourRainfall 20yearreturnperiod_24hourRainfall 100yearreturnperiod_48hourRainfall |
| Testing | Event 8 | 50yearreturnperiod_12hourRainfall 100yearreturnperiod_24hourRainfall 50yearreturnperiod_72hourRainfall |
Table 3.
Input combinations for the RNARX model.
| Input Factors | Kemaman River Average Rainfall | Cherul River Average Rainfall | Flood Depth | |
|---|---|---|---|---|
| Forecast Time-Step | ||||
| T + 1 (3 h-ahead) | T − 2 | T − 2 | - | |
| T + 2 (6 h-ahead) | T − 1 | T − 1 | - | |
| T + 3 (9 h-ahead) | T | T | - | |
| T + 4 (12 h-ahead) | T | T | T + 3 | |
Table 4.
Performance of 3 h-up to 12 h-ahead forecasting of ARID using RNARX based on 7 real events and 12 designed events.
Table 4.
Performance of 3 h-up to 12 h-ahead forecasting of ARID using RNARX based on 7 real events and 12 designed events.
| Forecasting Time-Step | RMSE (m) | |||||
|---|---|---|---|---|---|---|
| Training | Validation | Testing | Training | Validation | Testing | |
| 3 h-ahead | 0.28 | 0.30 | 0.34 | 0.92 | 0.90 | 0.90 |
| 6 h-ahead | 0.28 | 0.30 | 0.34 | 0.92 | 0.90 | 0.90 |
| 9 h-ahead | 0.29 | 0.30 | 0.33 | 0.91 | 0.90 | 0.90 |
| 12 h-ahead | 0.31 | 0.34 | 0.35 | 0.90 | 0.87 | 0.89 |
Table 5.
Numbers of grids with respect to different inundation depths obtained from the simulation model over time for Event 7.
Table 5.
Numbers of grids with respect to different inundation depths obtained from the simulation model over time for Event 7.
| Time (h) | All | 0–1 m | 1–2 m | 2–3 m | >3 m |
|---|---|---|---|---|---|
| T = 75 | 10,744 | 7274 | 1361 | 1231 | 908 |
| T = 81 | 10,744 | 6530 | 1617 | 1376 | 1251 |
| T = 87 | 10,744 | 4488 | 2176 | 1964 | 2146 |
| T = 93 | 10,744 | 3466 | 2053 | 2452 | 2803 |
| T = 108 | 10,744 | 1400 | 1195 | 2473 | 5706 |
| T = 120 | 10,744 | 614 | 780 | 1707 | 7673 |
Table 6.
Performances of the SOM−RNARX model (time step = 3 h) with respect to different inundation depths over time for Event 7, taking the simulation model as a benchmark.
Table 6.
Performances of the SOM−RNARX model (time step = 3 h) with respect to different inundation depths over time for Event 7, taking the simulation model as a benchmark.
| Time (h) | Time Step | All | 0–1 m | 1–2 m | 2–3 m | >3 m | |
|---|---|---|---|---|---|---|---|
| RMSE * | R2 | RMSE | RMSE | RMSE | RMSE | ||
| T = 75 | T + 1 (=3 h) | 0.45 | 0.94 | 0.52 | 0.38 | 0.16 | 0.09 |
| T + 2 (=6 h) | 0.44 | 0.94 | 0.51 | 0.36 | 0.14 | 0.10 | |
| T + 3 (=9 h) | 0.45 | 0.94 | 0.52 | 0.38 | 0.17 | 0.09 | |
| T + 4 (=12 h) | 0.49 | 0.94 | 0.55 | 0.45 | 0.25 | 0.17 | |
| T = 81 | T + 1 | 0.65 | 0.97 | 0.53 | 0.79 | 0.81 | 0.84 |
| T + 2 | 0.64 | 0.97 | 0.52 | 0.77 | 0.79 | 0.81 | |
| T + 3 | 0.66 | 0.97 | 0.53 | 0.79 | 0.82 | 0.85 | |
| T + 4 | 0.68 | 0.97 | 0.54 | 0.81 | 0.85 | 0.90 | |
| T = 87 | T + 1 | 0.38 | 0.99 | 0.36 | 0.45 | 0.40 | 0.34 |
| T + 2 | 0.37 | 0.99 | 0.35 | 0.43 | 0.39 | 0.31 | |
| T + 3 | 0.39 | 0.99 | 0.36 | 0.45 | 0.41 | 0.35 | |
| T + 4 | 0.08 | 1 | 0.06 | 0.08 | 0.08 | 0.12 | |
| T = 93 | T + 1 | 0.19 | 1 | 0.16 | 0.2 | 0.2 | 0.19 |
| T + 2 | 0.19 | 1 | 0.10 | 0.16 | 0.19 | 0.19 | |
| T + 3 | 0.19 | 1 | 0.16 | 0.21 | 0.21 | 0.19 | |
| T + 4 | 0.12 | 1 | 0.09 | 0.12 | 0.13 | 0.12 | |
| T = 108 | T + 1 | 0.25 | 1 | 0.11 | 0.07 | 0.12 | 0.32 |
| T + 2 | 0.25 | 1 | 0.11 | 0.07 | 0.12 | 0.32 | |
| T + 3 | 0.24 | 1 | 0.11 | 0.07 | 0.11 | 0.31 | |
| T + 4 | 0.18 | 1 | 0.12 | 0.08 | 0.08 | 0.23 | |
| T = 120 | T + 1 | 0.42 | 1 | 0.48 | 0.57 | 0.34 | 0.42 |
| T + 2 | 0.42 | 1 | 0.48 | 0.57 | 0.34 | 0.42 | |
| T + 3 | 0.42 | 1 | 0.48 | 0.57 | 0.34 | 0.42 | |
| T + 4 | 0.34 | 1 | 0.49 | 0.61 | 0.43 | 0.34 | |
* Unit: m.
© 2018 by the authors. Licensee MDPI, Basel, Switzerland. This article is an open access article distributed under the terms and conditions of the Creative Commons Attribution (CC BY) license (http://creativecommons.org/licenses/by/4.0/).
Share and Cite
MDPI and ACS Style
Chang, L.-C.; Amin, M.Z.M.; Yang, S.-N.; Chang, F.-J. Building ANN-Based Regional Multi-Step-Ahead Flood Inundation Forecast Models. Water 2018, 10, 1283. https://doi.org/10.3390/w10091283
AMA Style
Chang L-C, Amin MZM, Yang S-N, Chang F-J. Building ANN-Based Regional Multi-Step-Ahead Flood Inundation Forecast Models. Water. 2018; 10(9):1283. https://doi.org/10.3390/w10091283
Chicago/Turabian StyleChang, Li-Chiu, Mohd Zaki M. Amin, Shun-Nien Yang, and Fi-John Chang. 2018. "Building ANN-Based Regional Multi-Step-Ahead Flood Inundation Forecast Models" Water 10, no. 9: 1283. https://doi.org/10.3390/w10091283
Note that from the first issue of 2016, this journal uses article numbers instead of page numbers. See further details here.