1. Introduction
In recent years, due to the fast development of economy, more frequent incidents in water pollution occur in China, for instance, the 2005 Songhua River serious water pollution incident, the Taihu lake water pollution incident in 2007, Changzhi, Shanxi aniline leakage in 2012 [
1]. Although these sudden incidents occur at low probability, it can cause irreparable consequences due to its sudden strong destructive characteristics at large scale. This together with its characteristics of multiple sources and receptors makes it very difficult to research.
There are two definitions of risk [
2]. The first is defined as the product of the probability of occurrence of an event and the result or consequence of the event [
3,
4], and it is used for risk assessment in insurance, security fields in most cases [
5,
6], and also used for environmental risk sources, such as enterprises, construction projects, which is called “accident risk” [
7,
8,
9]. The second is defined as the combination of hazard and vulnerability [
10,
11,
12]. We construct environmental risk assessment model or system for environmental risk assessment of regional or watershed scale according to the second definition [
13,
14,
15,
16,
17].
There are many types of basic units in risk zoning. The grid is used as the basic units [
15], and all the risk evaluation indexes need to be obtained by interpolation. Administrative districts can also be used as basic units [
10]. The social economic evaluation index can be obtained directly, but due to the existence of several scattered reaches in the basic unit the regional natural factors are not fully considered in the region.
There is a little study on risk assessment and regionalization of sudden water pollution events in the basin scale. Paul, et al. (2004) used 2-D surface water flow model CE-QUAL-W2 Version 3.1 to effectively study the risks associated with accidental or intentional releases of a hazardous material into an inland waterway [
18]. Liu, et al. (2012) use a fuzzy fault tree model and the comprehensive influence index model to carry out sudden water pollution risk assessment in the region, which is lack of data, and establish multi-scale evaluation model to the river unit of the whole region [
19]. In this study, the water function area is examined as an index of the receptor, but the interaction of the environmental risk between the upstream and downstream units of the river is not considered. Mehmet, et al. (2013) used modified pollution indices to evaluate the pollution status in the middle section of the Lower Seyhan River Basin and the water quality index (WQI) was utilized to evaluate water pollution levels [
20]. Zhang, et al. (2014) introduced relative risk model (RRM) to quantify model evaluation factors, and undertook risk assessment to the old river basin. This study treats the sub basin as an evaluation unit, taking full account of the natural features of the watershed [
21]. Most importantly, these studies have identified “Zoning units”, and the risk of the units are evaluated, but it is not made in the true sense of the “risk zoning”, because the zoning unit should satisfy the maximum risk similarity in the unit, while the risk difference is the biggest between the units [
22].
Luanhe River Basin belongs to Haihe River basin, China, and Luanhe River is the second largest river into the Bohai Sea of north China, and belongs to typical semi-arid and seasonal wind climate region. It is an important natural barrier and drinking water resource for Beijing, Tianjin and Tangshan Region with more than 50 million populations. In the past, most researches were focused on the temporal and spatial distributions of water and sediment yield in the Luanhe River Basin [
23] and landscape ecological risk response to land use change in the basin [
24]. Little attention is paid to assess the risk of Luanhe River basin in sudden water pollution incidents. So this paper aims to improve the current risk assessment method and apply this new method to study the risk of the upper and middle reaches of Luanhe River Basin in sudden water pollution incidents in view of increasingly sudden water pollution incidents.
2. Research Area
The upper and middle reaches of Luanhe River Basin is the local basin in front of the dam of Daheiting Resivior, which is mainly across two provinces (autonomous regions): The Inner Mongolia Autonomous Region and Hebei Province, 18 counties/cities/districts/banners (CD County means Chengde County, FN County means Fengning County, KC County means Kuancheng County, LH County means Longhua County, LP County means Luanping County, PQ County means Pingquan County, Sl district means Shuangluan district, SQ district means Shuangqiao District, YSYZ Mining District means Yingshouyingzi Mining District, WC County means Weichang County, XL County means Xinglong County, QX County means Qianxi County, DL County means Duolun County, GY County means Guyuan County) (
Figure 1).
3. Research Method
3.1. Data Source
Digital Elevation Model (DEM) data comes from the United States Geological Survey (USGS), the resolution is 90 m × 90 m, and the Albert equal projection, and GCS_Bejing_1954 geographic coordinate system is used. The data of the basin landform, water function areas, the environmental risk sources and regional natural economic and social information are obtained through the statistical yearbook, literature search, field investigation, visiting to relevant departments and expert consultation.
3.2. Water Function Area and Control Units
Water function area is the waters delimited according to its dominant function and carried out the corresponding water environment quality standard, which is based on natural conditions and development and utilization of water resources, comprehensive river basin planning, water resources and water ecosystem protection and economic and social development requirements to meet the demand of rational development, utilization, saving, and protection of water resources.
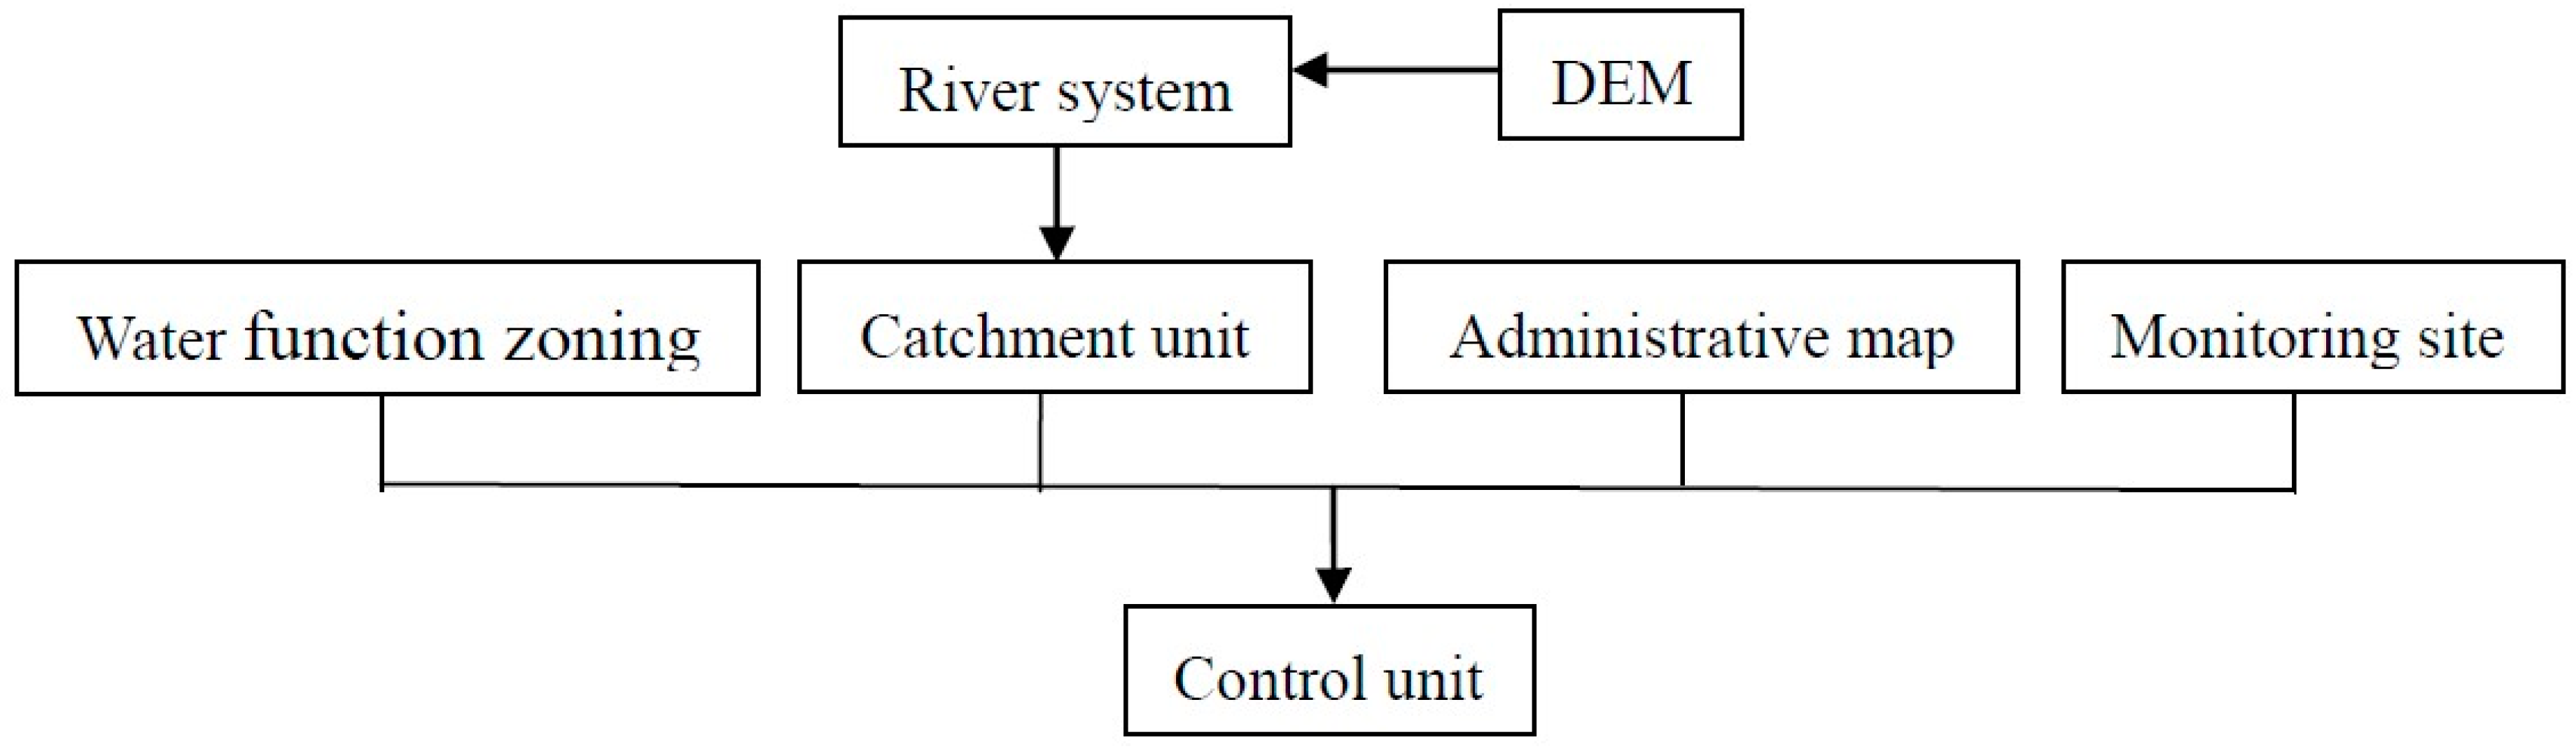
Control unit is obtained by superimposing the spatial data of the catchment area, water system distribution and its flow direction, boundary of water function area, control section distribution, administrative boundary and other indexes on a digital map, which is based on the principle of division of pollution control unit.
The relationship between the water functional area and control unit: (1) The water function area is the premise and basis for dividing the control unit, which is combined with three other elements (see
Figure 2) to obtain a control unit; and (2) The water function area includes only the water area, and the control unit comprises the water area and the corresponding land area.
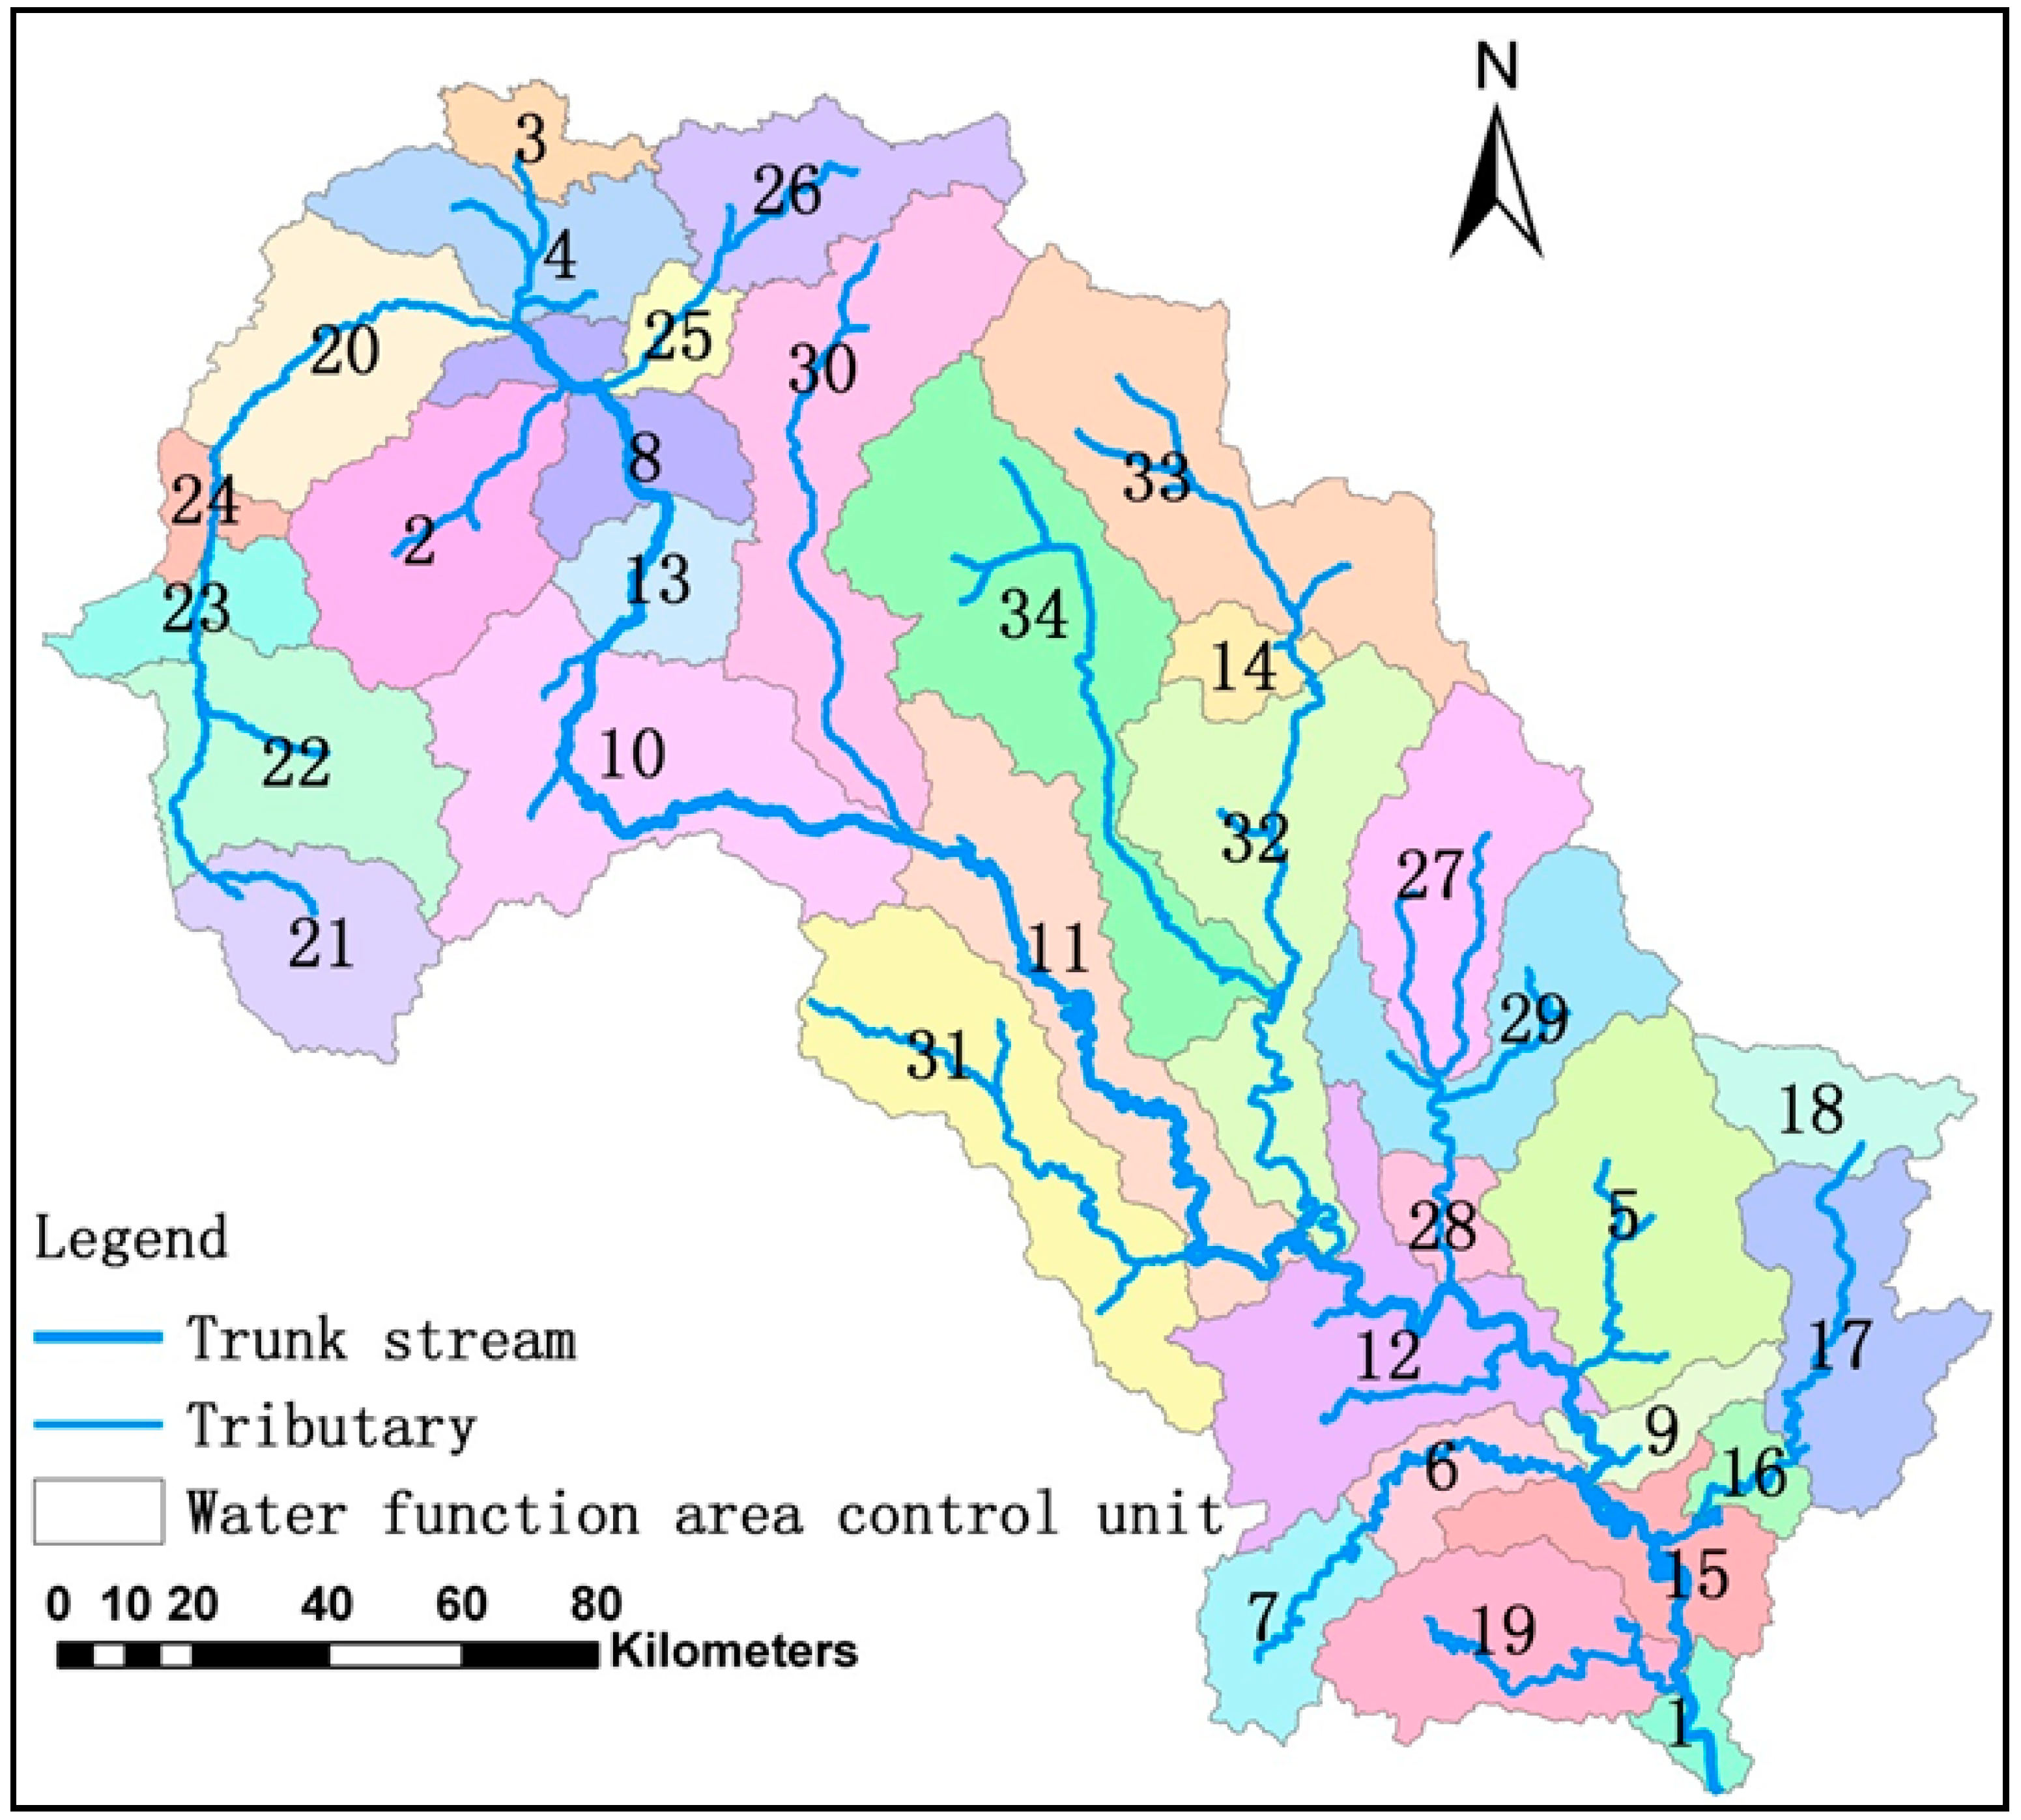
According to the control unit division method for water function areas, the upper-middle reaches of Luanhe River Basin includes 34 water function areas, and the corresponding control units, as shown in
Figure 3 and
Table 1.
3.3. The Division of Working Units and its Advantages
Each sub basin within the water function area control unit is defined as a working unit for risk assessment transition units based on the water function area control units, which are determined by the river basin management institution. All indexes are represented on the working units, and the indexes that are not in the working unit need to be interpolated to the working units. The advantages are that: (1) The risk assessment indexes associated with rivers within the working unit are complete, and there is no artificial cutting water bodies; (2) it is generally believed that once a sudden water pollution event occurs, the pollutant will diffuse in the sub basin where the environmental risk source lies and transmit through the river to the downstream; and (3) it is consistent with the current water management unit in China and easy to manage.
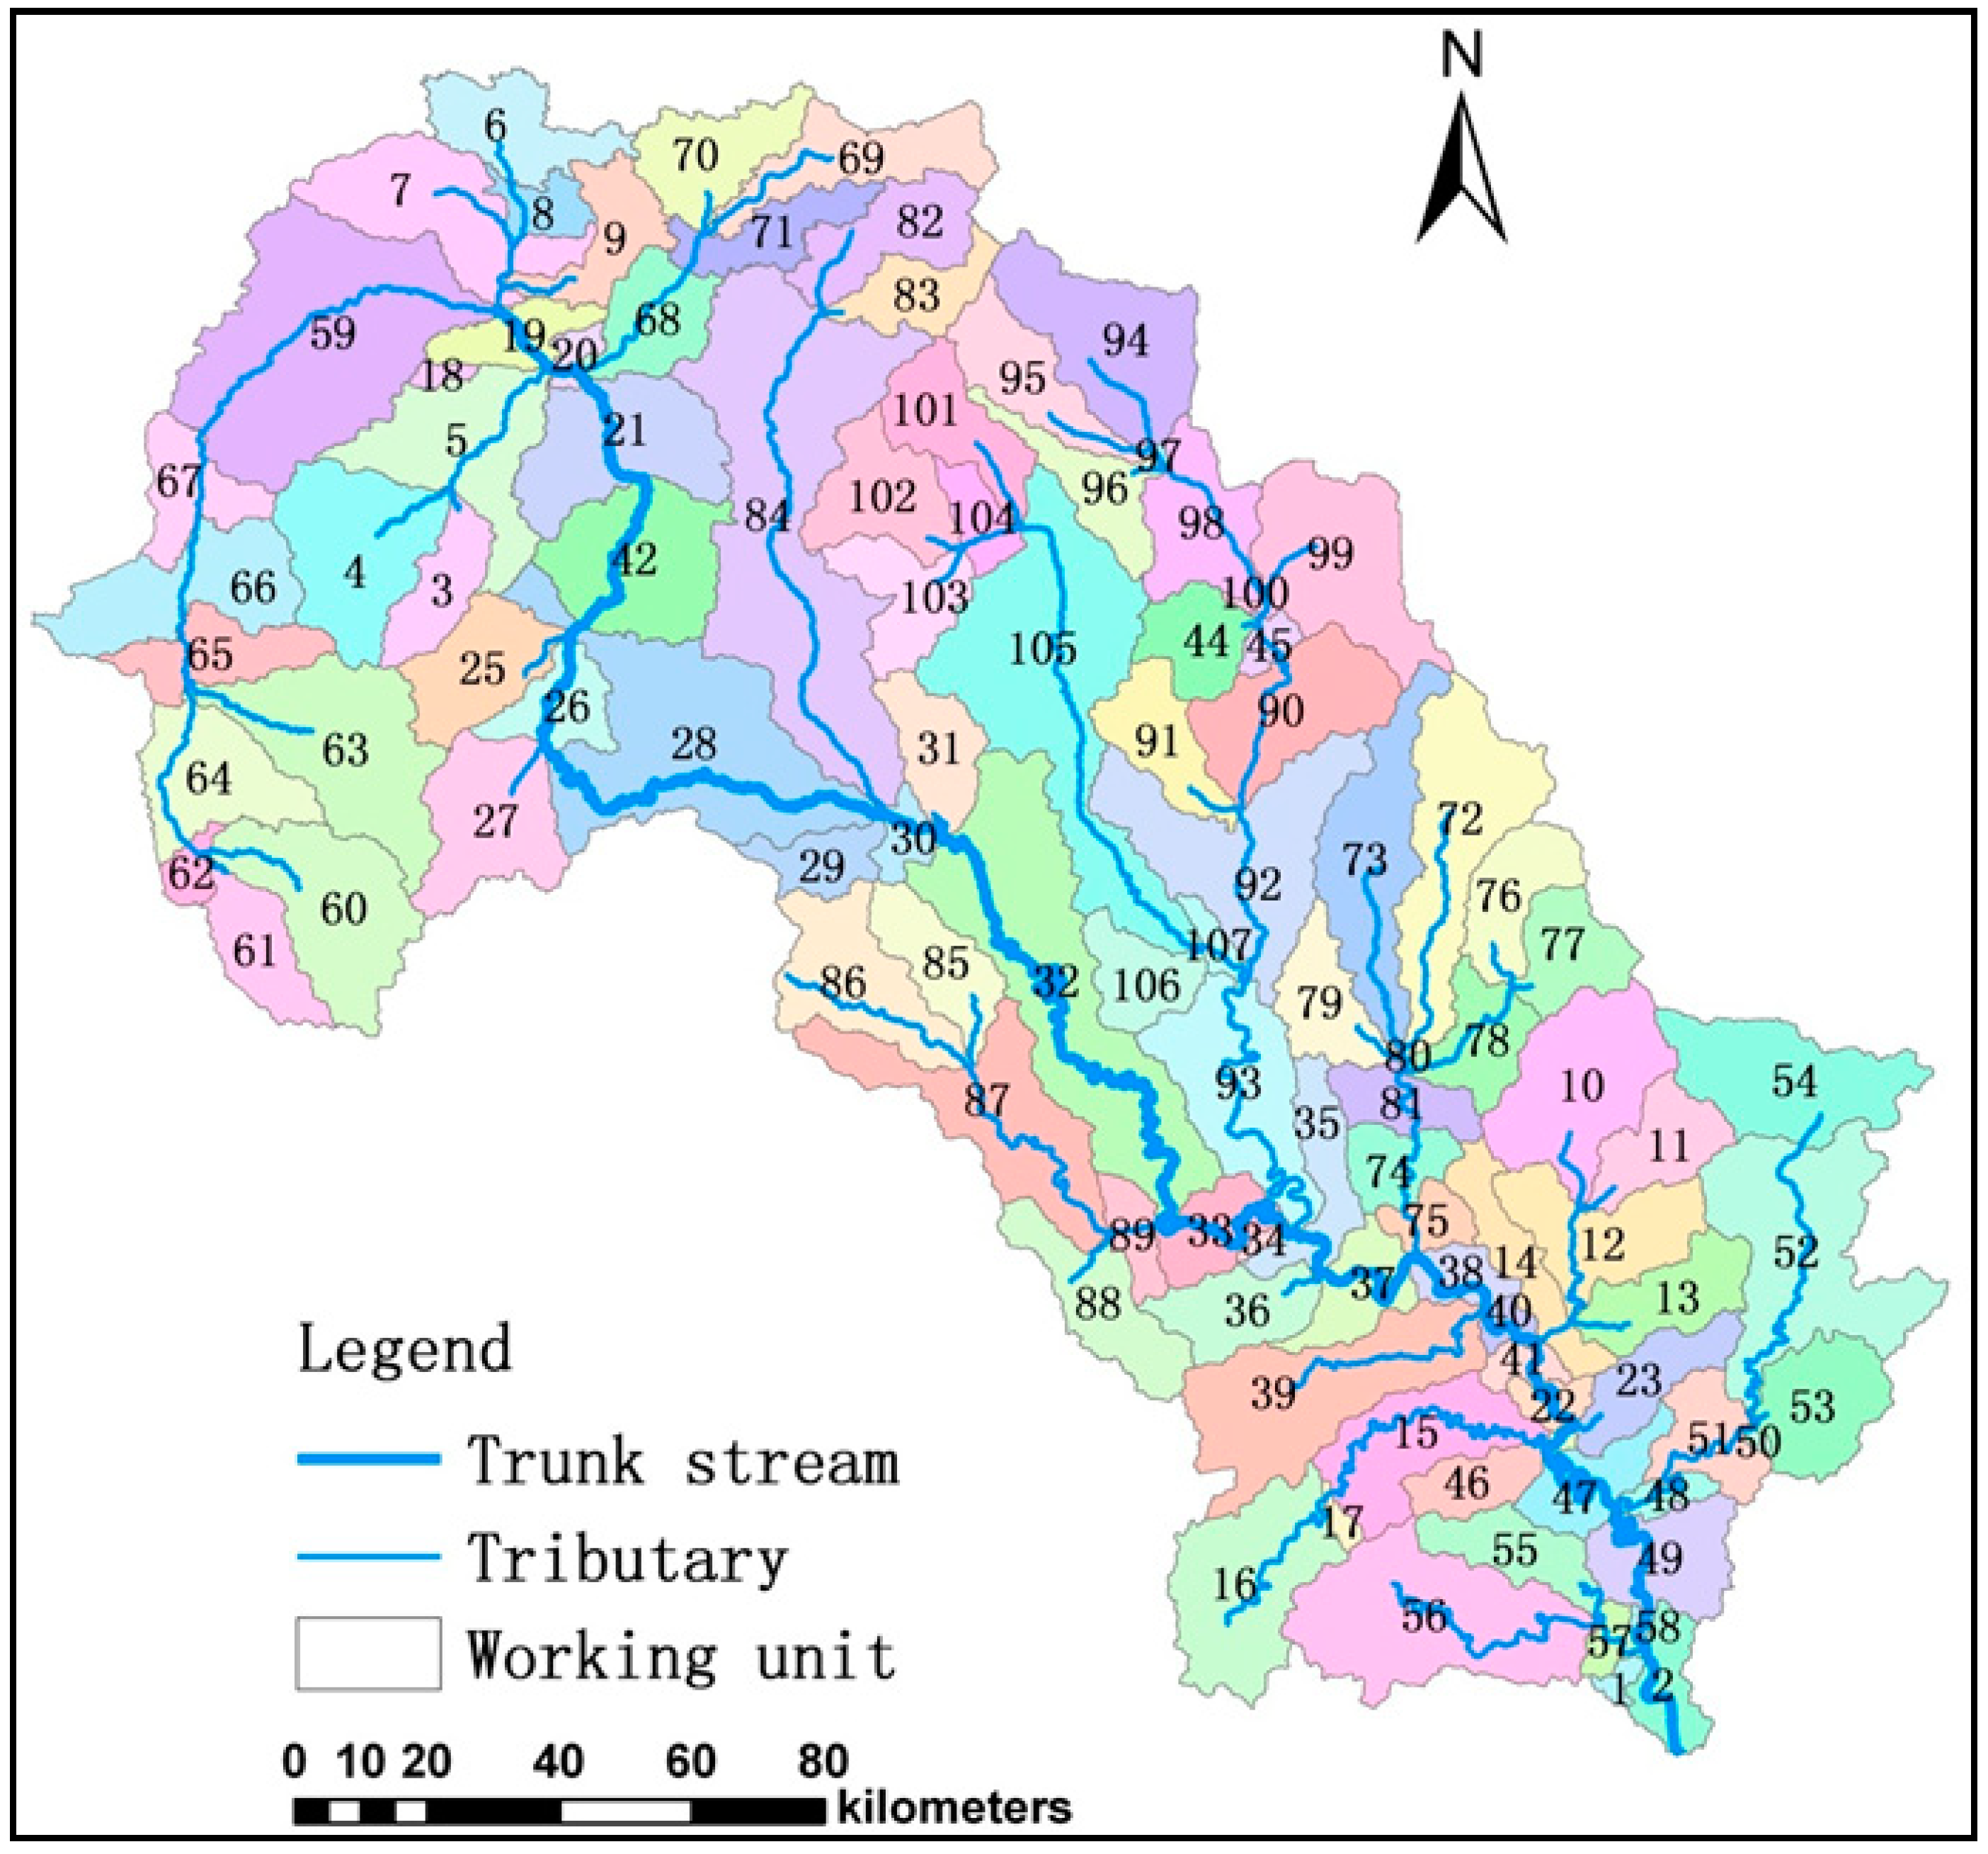
The upper, middle reaches of Luanhe River Basin are obtained by entering the DEM and using the ArcGIS hydrological analysis model and they are divided into 107 working units by combining the water function area control unit with the sub basin, as shown in
Figure 4.
3.4. Environmental Risk Sources Hazard Grade Assessment
The environmental risk sources of sudden water pollution incidents are divided into four grades: Major risk sources, big risk sources, general risk sources and slight risk sources by referring to the
National Emergency Plan for Environmental Emergencies [
25]. Environmental risk source hazard assessment is identified through environmental risk source identification, hazard index system construction, quantification, index weight determination and grade calculation.
3.4.1. Establishing Environmental Risk Sources Hazard Index System
Environmental risk source data are obtained through the establishment of questionnaires, field research and visiting relevant departments. Referring to previous work [
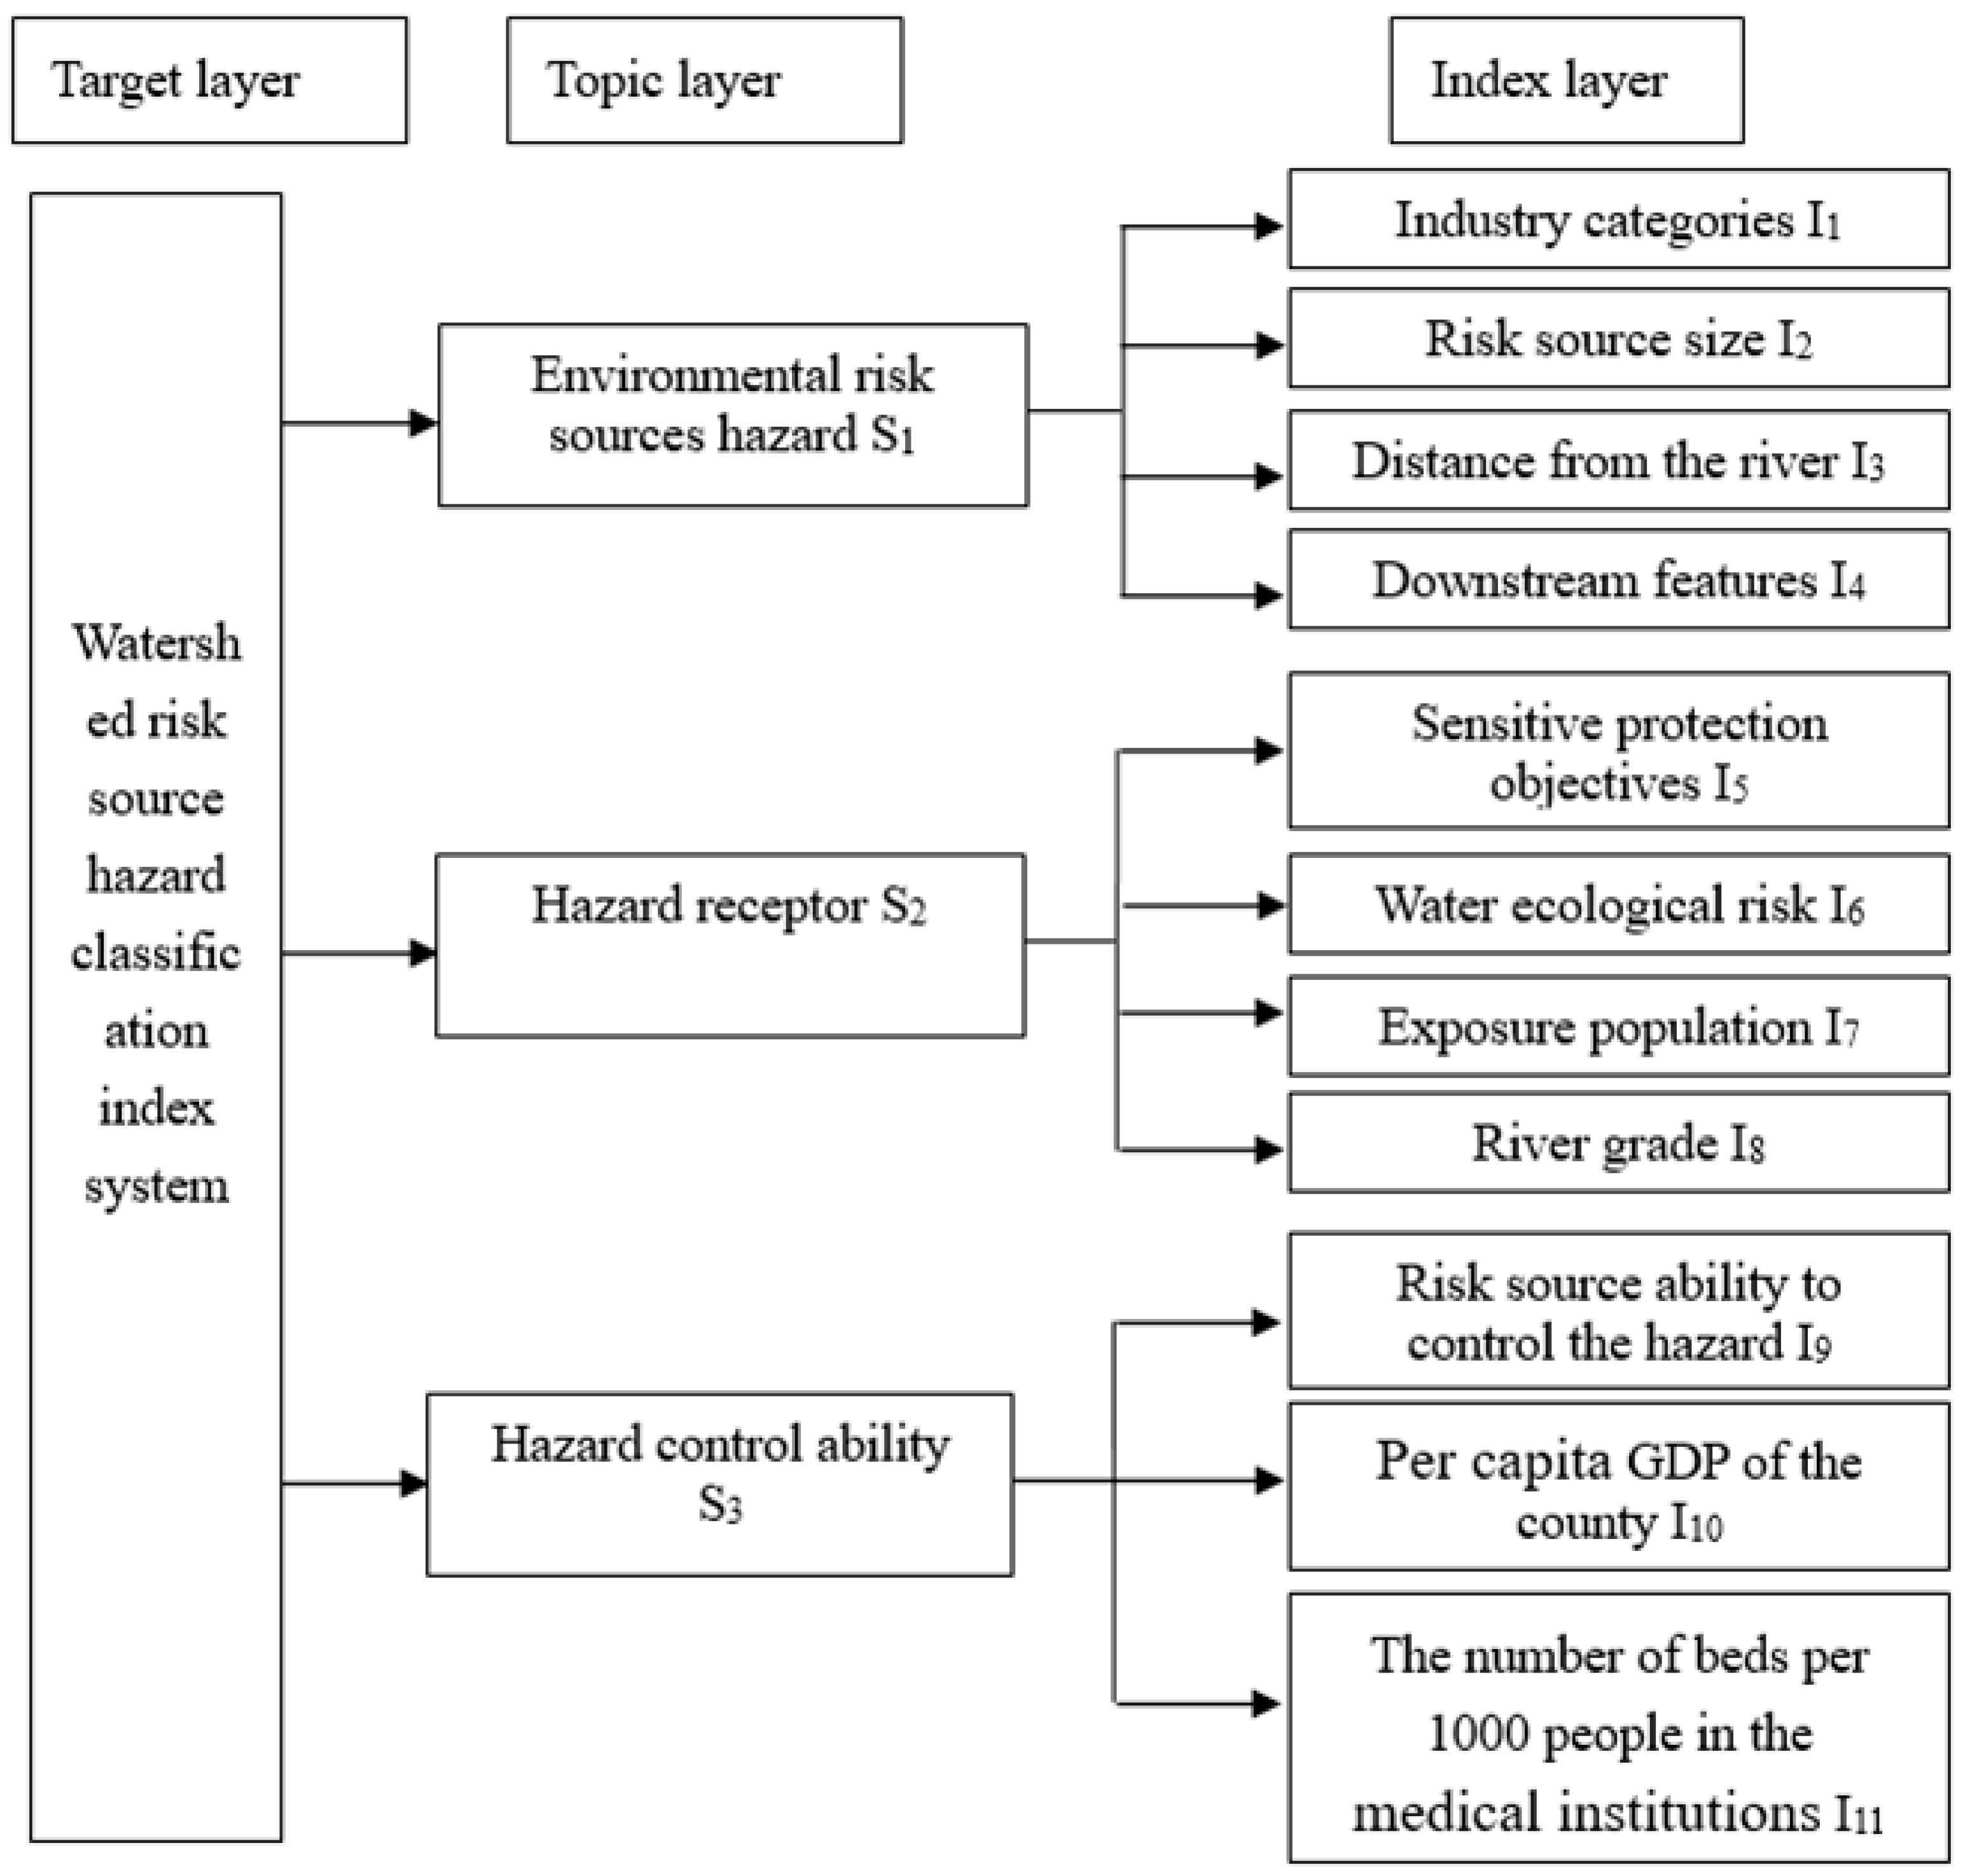
26], the pressure state response (PSR) environment analysis model is adopted, and the environmental risk sources hazard evaluation index system is constructed from three aspects: (1) Environmental risk sources hazard (pressure), (2) hazard receptor (state), and (3) risk control ability (response). As shown in
Figure 5, it includes target, topic and index layers.
3.4.2. Quantifying Environmental Risk Sources Hazard Index System
As the target, it consists of three topics, as shown in
Figure 5, and they are Environmental risk sources hazard S
1, Hazard Receptor S
2 and Hazard Control Ability S
3. Following is an explanation about the system.
A Environmental Risk Sources Hazard S1
A1. Industry Categories I1
Risk sources in different industry categories have varying degrees of hazard. For example, “chemical raw materials and chemical products manufacturing” and petroleum processing, coking and nuclear fuel processing” have a higher score of 0.8; and “the food manufacturing industry”, “water production and supply industry” and “beverage manufacturing industry” have a low score of 0.2. Corresponding to the four grades of the risk sources, this paper divides the risk sources into four grades, and determines quantitative standards as listed in
Table 2.
A2. Risk Source Size I2
Generally, the bigger the size of the risk sources, the higher the risk. Because most companies’ employees, sales and total assets that can measure risk sources size can’t be known, and the scale of the enterprise has a good correlation with the risk sources of “registered capital”, the registered capital is used as a measure of risk sources index scale, and the grades are established according to [
22] and [
26], as shown in
Table 2.
A3. Distance from the River I3
In general, the closer the risk sources to the river, the easier the pollutant entering the river and polluting the water environment, and the higher the hazard of the risk sources. Based on Arc-GIS software, a distance measurement (near) tool is used to obtain the nearest distance of each risk sources to the river. The grades are established according to [
26], as shown in
Table 2.
A4. Downstream Features I4
Referring to the influence of the pollutant produced by the risk sources to the downstream working units through river transportation and diffusion, we consider the two aspects: The distances between the risk source and the downstream working units, and the importance of the downstream working units. The more important the downstream working units (score based on the water function area characteristics of the working units shown in
Table 3, and the shorter the distance between the risk source and the downstream working units, the greater the hazard. The following equation is used to describe I
4:
where
is the score of downstream features; j is a number;
represents the number of risk sources flowing through the working units;
stands for the score of the risk sources flowing through the working units, showing in
Table 3;
is the distance between the risk sources and the working units (10 km).
B Hazard Receptor S2
B1. Sensitive Protection Objectives I5
Two aspects are considered: Whether the water function area to, which the working units belongs are the drinking water source and its population [
27], as well as whether there are natural reserves, and their grades are shown in
Table 3.
B2. Water Ecological Risk I6
Water ecology means the water effects on biology and the adaptation of biology to various water conditions [
28]. When water bodies contain certain characteristic pollutants, they may have different hazards to the water environment. According to the Comprehensive Wastewater Discharge Standards and Sanitary Standards for Drinking Water, the characteristic pollutants are used for grading, as shown in
Table 3, and the standard is listed in
Table 2.
B3. Exposure Population I7
Use population size of the working units as the exposure population of risk sources. The standard is referred National Emergency Plan for Environmental Emergencies, as shown in
Table 2.
B4. River Grade I8
It is generally believed that the higher the river grade that the risk sources pollutant flows into, the greater the possibility of pollutant transport and diffusion, and the greater the influences of the possibility on low-grade rivers. According to the study of [
29], river grades are shown in
Table 3, and the standard is in
Table 2.
C Hazard Control Ability S3
The ability to control the hazard of sudden environmental incidents in a region can be evaluated from two aspects: The hazard control ability of the area and the hazard control ability of the risk sources. The regional hazard control ability is evaluated by the number of beds per 1000 people in the medical institutions where the risk sources lie and the per capita Gross Domestic Product (GDP) in the county. The risk sources ability to control the hazard is evaluated by the superposition of several factors as follows.
C1. Risk Source Ability to Control the Hazard I9
It is superimposed by the following factors, such as Pollution source category, whether to sign the letter of environmental protection undertaking et al. as shown in
Table 3.
C2. Per Capita GDP of the County I10
Per capita GDP of the county to which the risk source belongs represents the level of economic development in the region to a certain extent [
13]. Generally speaking, the higher the per capita GDP, when the sudden water pollution accidents occur in the region, the more dangerous control capability, the lower corresponding risk grade is, as shown in
Table 2.
C3. The Number of Beds per 1000 People in the Medical Institutions
According to the “Standard of Medical Institutions (Trial)”, the more the number of beds per 1000 people in medical institutions means the better health care in the area. Once the sudden water pollution accidents occur, hazard control ability is stronger, and the lower the hazard grade [
22], as shown in
Table 2.
3.4.3. Determination of Weights of Environmental Risk Sources Hazard Assessment Indexes and Calculation of Results
An improved analytic hierarchy process (AHP) is adopted to determine the weight of the index through expert investigation, and the fuzzy comprehensive evaluation method is used to calculate the hazard grade of the environmental risk source [
26].
3.5. Working Unit Hazard Assessment
Most previous work has considered that the working unit hazard grades are equal to the risk sources hazard grade in the unit [
19,
21]. The present research differs from that. Because once the upstream risk sources release a lot of pollutants in a short period of time and cause the sudden water pollution, leaked dangerous substances will flow through river systems and spread to the downstream, impacting on the downstream working units. Apparently, the downstream working unit hazard grade will be affected by upstream risk sources.
Due to the influence of upstream risk sources on downstream units, the working unit hazard grade is divided into two parts, as shown in Equation (2), one part is the greatest hazard grade of the risk sources in the unit, and the other part is the influence of the upstream risk sources on it.
where F is the total hazard scores of the working unit; G
MAX is the largest hazard value of each risk sources score in the working unit (because the sudden water pollution is generally caused by only one risk source although there may be several risk sources in the unit);
is the effect of one upstream risk source on the working unit through rivers;
m is the total number of upstream working units of the working unit under consideration.
The hazard grade of the risk source can be used as a generalized substance or pollutant, such as water quality index BOD or COD. Due to extremely shortage of data, and for simplification purposes, the effect of the upstream risk source on a downstream working unit through rivers is approximated to one-dimensional exponential decay river model as
where
is the influence of upstream risk sources on the working unit through rivers;
is longitudinal distance along the river;
is the upstream risk source grade;
is the mean velocity (m/s) of the channel under design flow;
is the comprehensive attenuation coefficient of pollutants (1/s).
As indicated above, probabilities that pollutant coincides with all risk sources in a working unit are quite low and usually there exists only one risk source of practical pollution, and hence the highest value of risk grade scores of all risk sources in a working unit is considered. Hazard grades and corresponding scores are shown in
Table 4.
3.6. Working Unit Vulnerability Assessment
Vulnerability refers to the extent to which something is vulnerable or injured [
30]. Corresponding to the hazard grade, the study divides the vulnerability into four grades, which are higher vulnerability, high vulnerability, moderate vulnerability and low vulnerability. Working unit vulnerability needs to be identified through vulnerability index system construction, quantification, index weight determination and grade calculation.
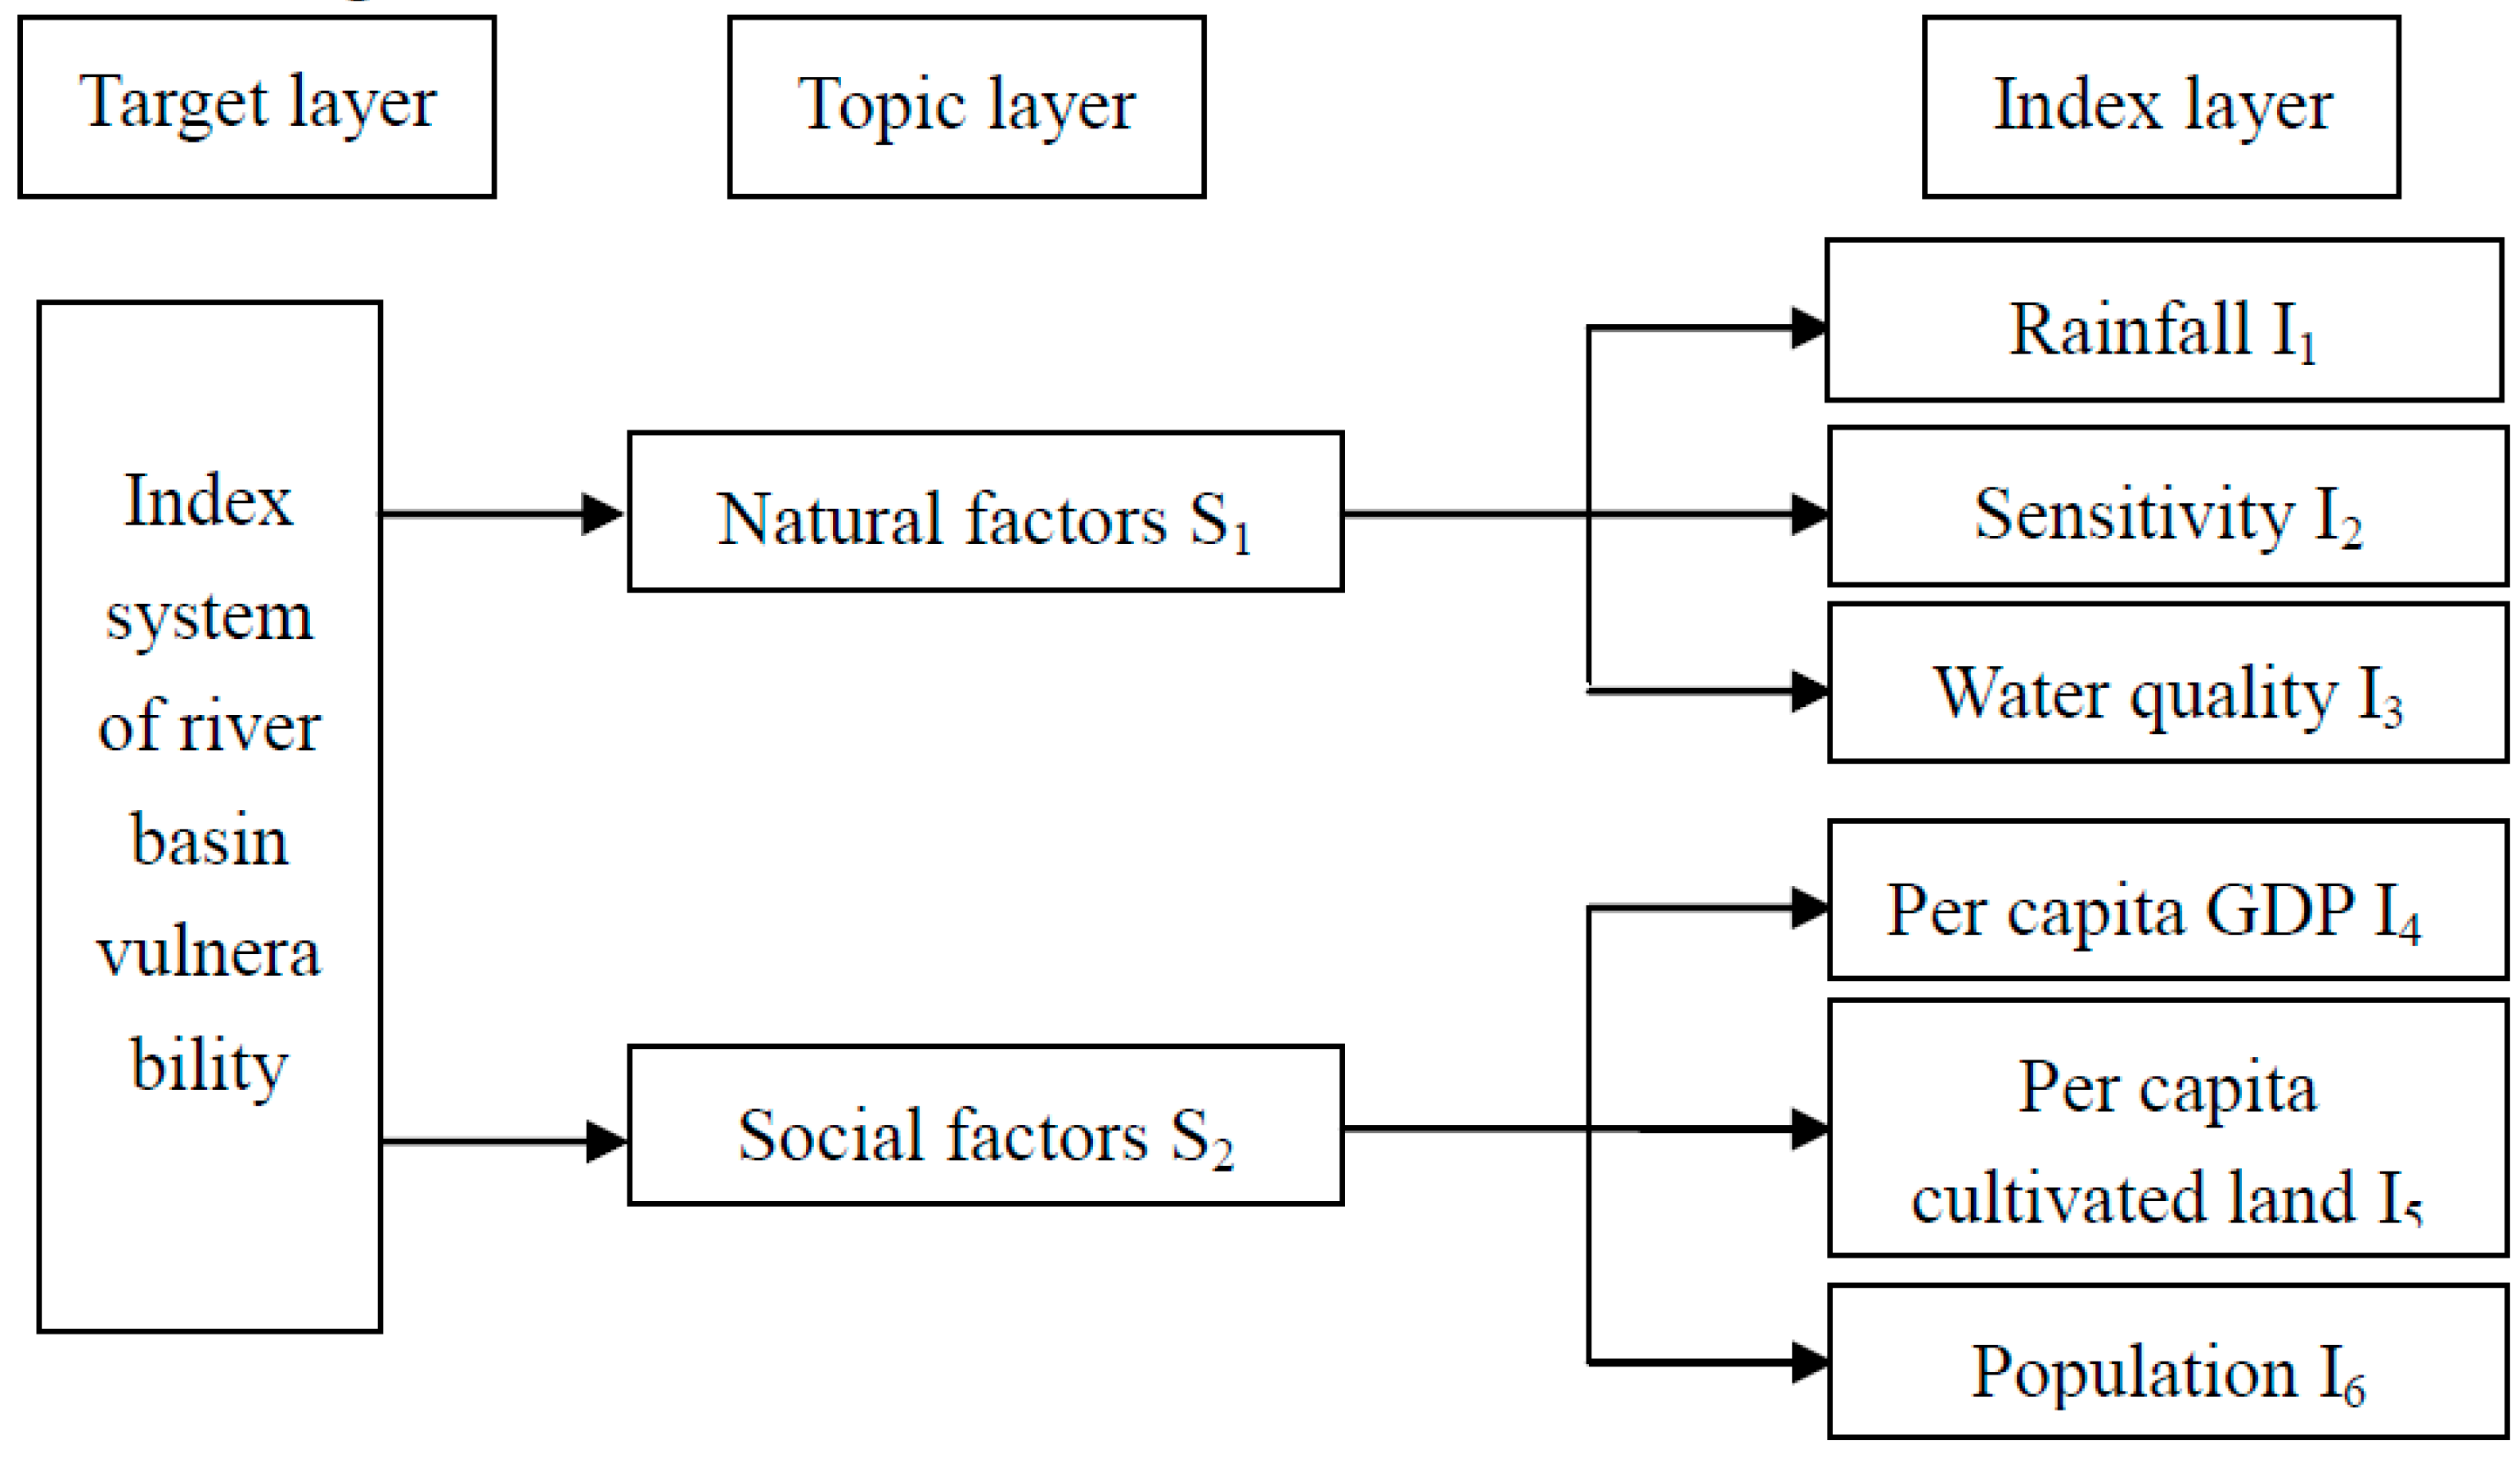
3.6.1. Establishment of Vulnerability Index System for Working Units
The index system of vulnerability is divided into three layers: Target, topic, and index layers, as in
Figure 6.
3.6.2. Working Unit Vulnerability Index System Quantification
3.6.3. Working Unit Vulnerability Index Weight Determination and Result Calculation
An improved analytic hierarchy process (AHP) is adopted through expert investigation to determine the weight of the index, and the fuzzy comprehensive evaluation method is used to calculate the working unit vulnerability [
26].
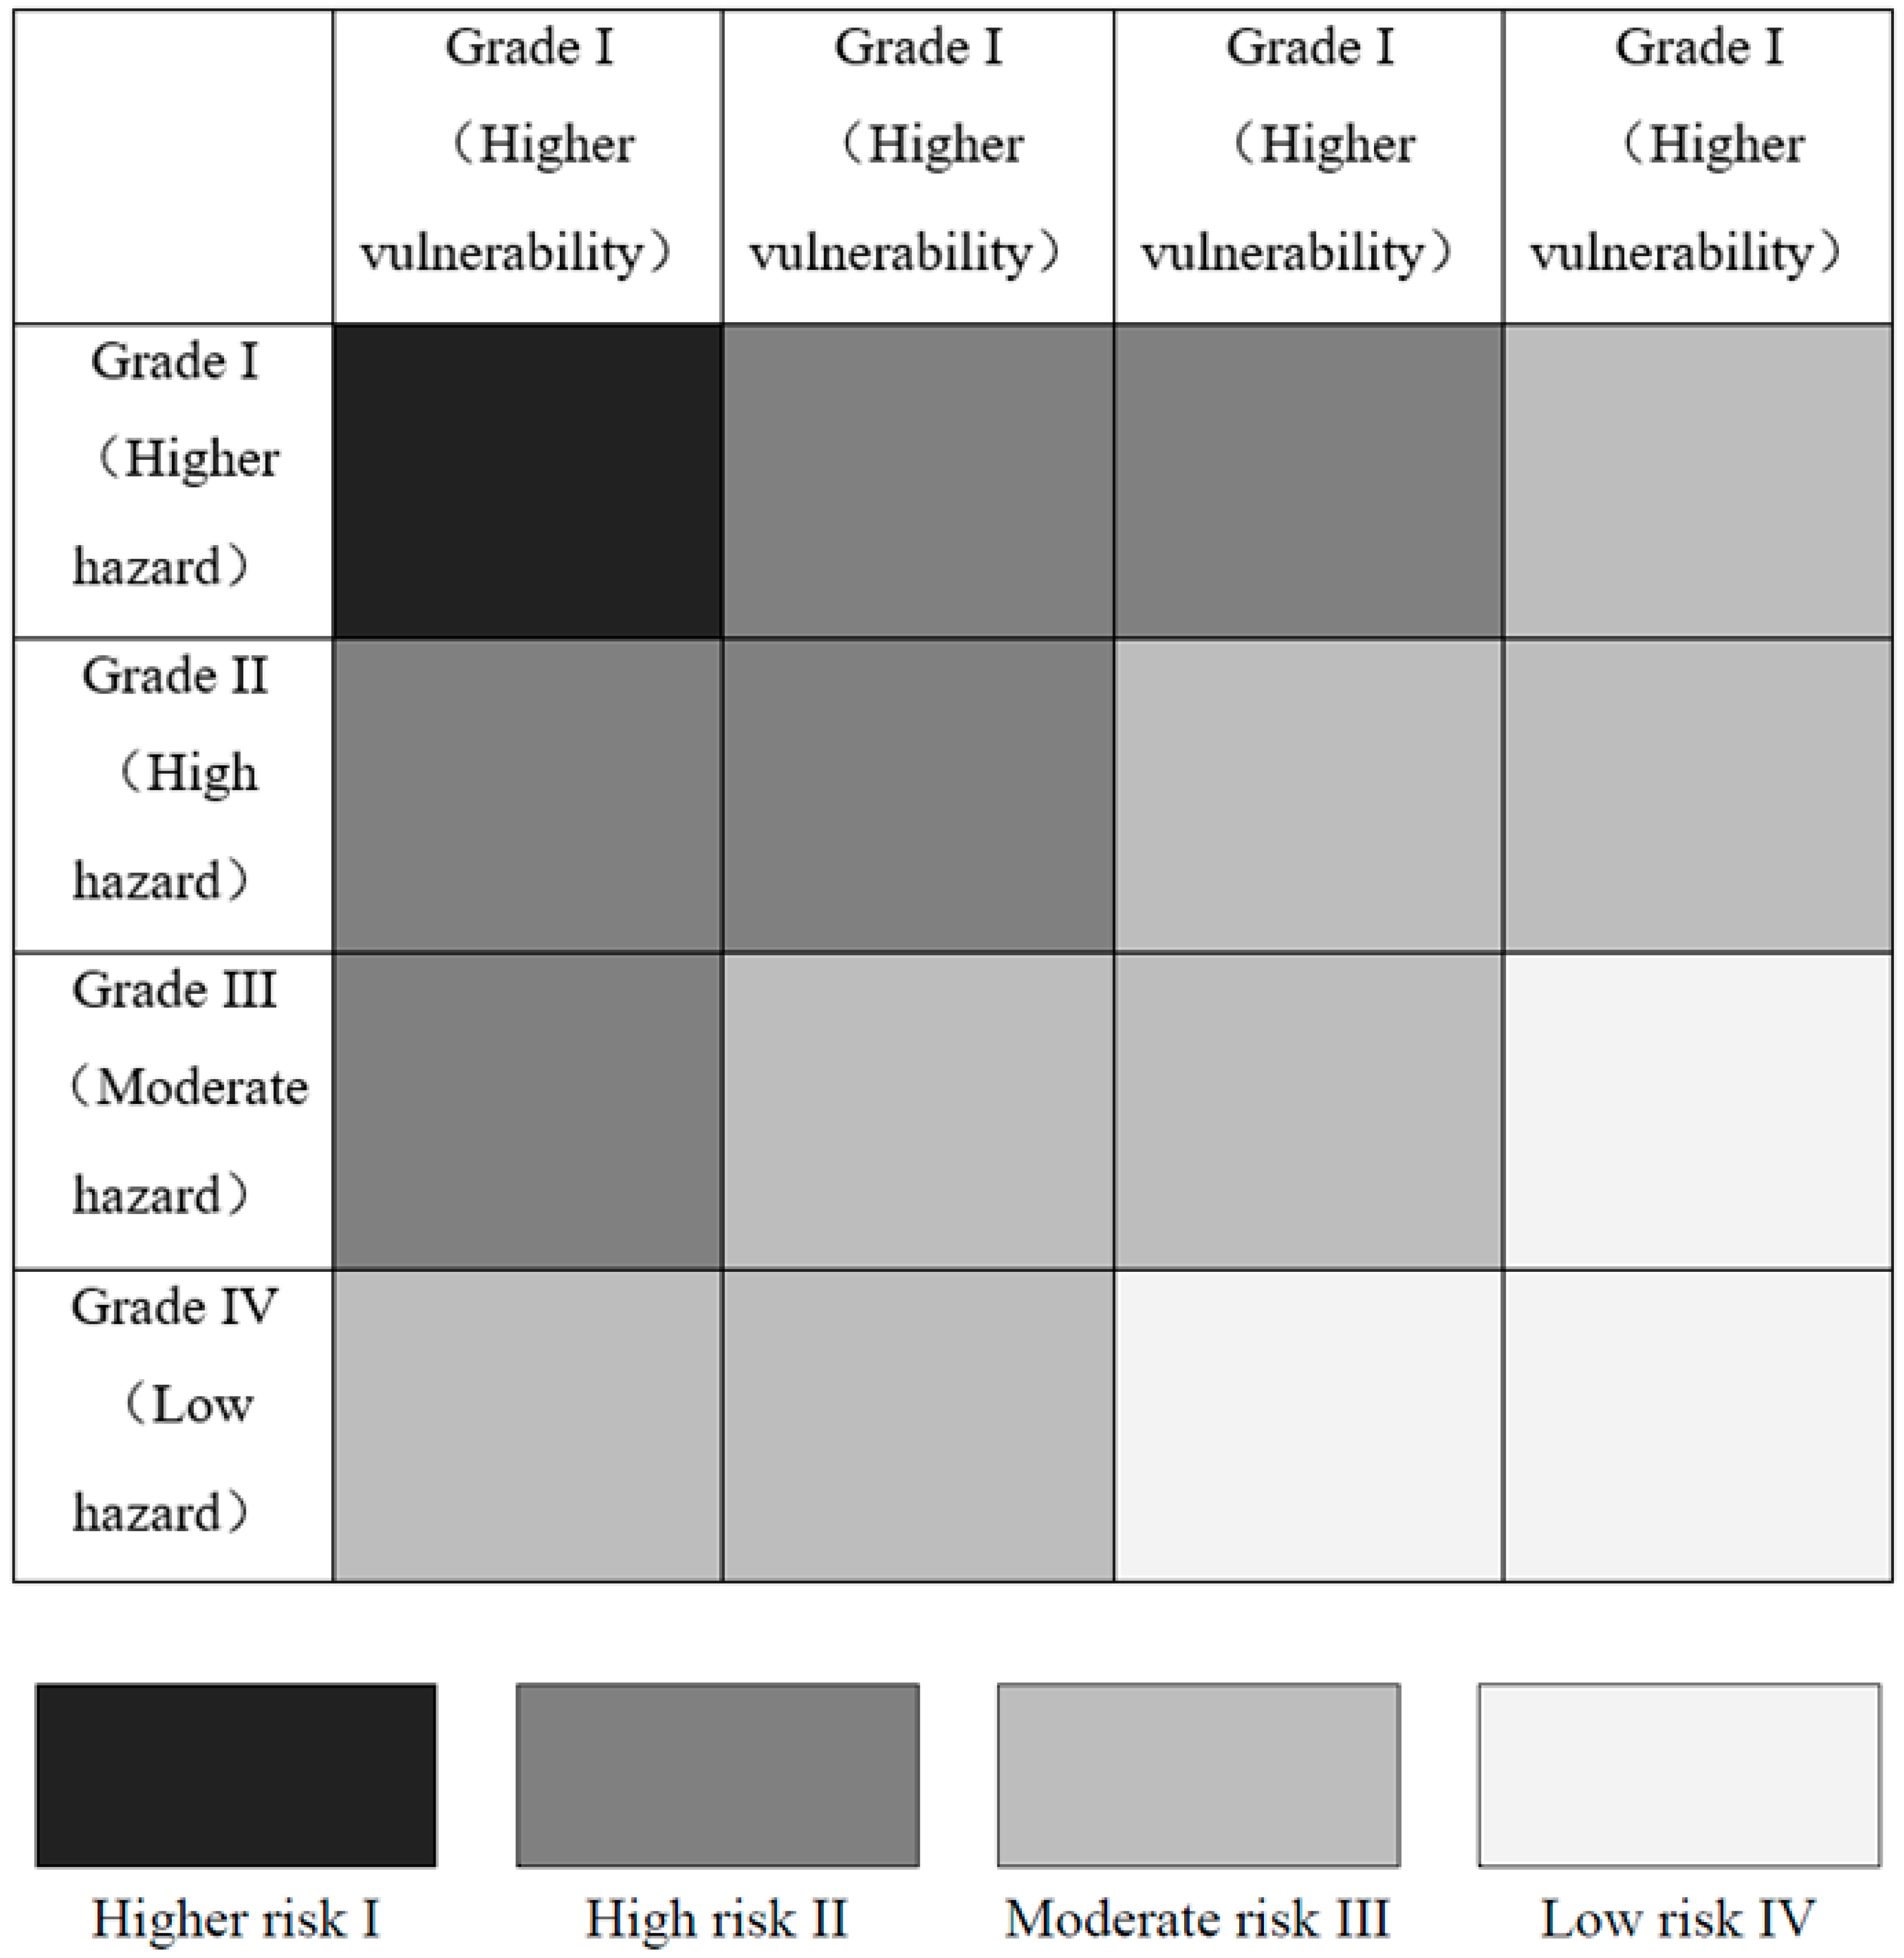
3.7. Risk Assessment
The risk grade of each working unit can be obtained from the risk grade matrix [
32], which is based on the evaluation of working units hazard grade and vulnerability grade, as shown in
Figure 7.
According to the environmental risk zoning theory [
22], the adjacent working units belong to the same water function control unit and the same risk grade are merged, and the watershed risk zoning is obtained.
4. Results Analysis
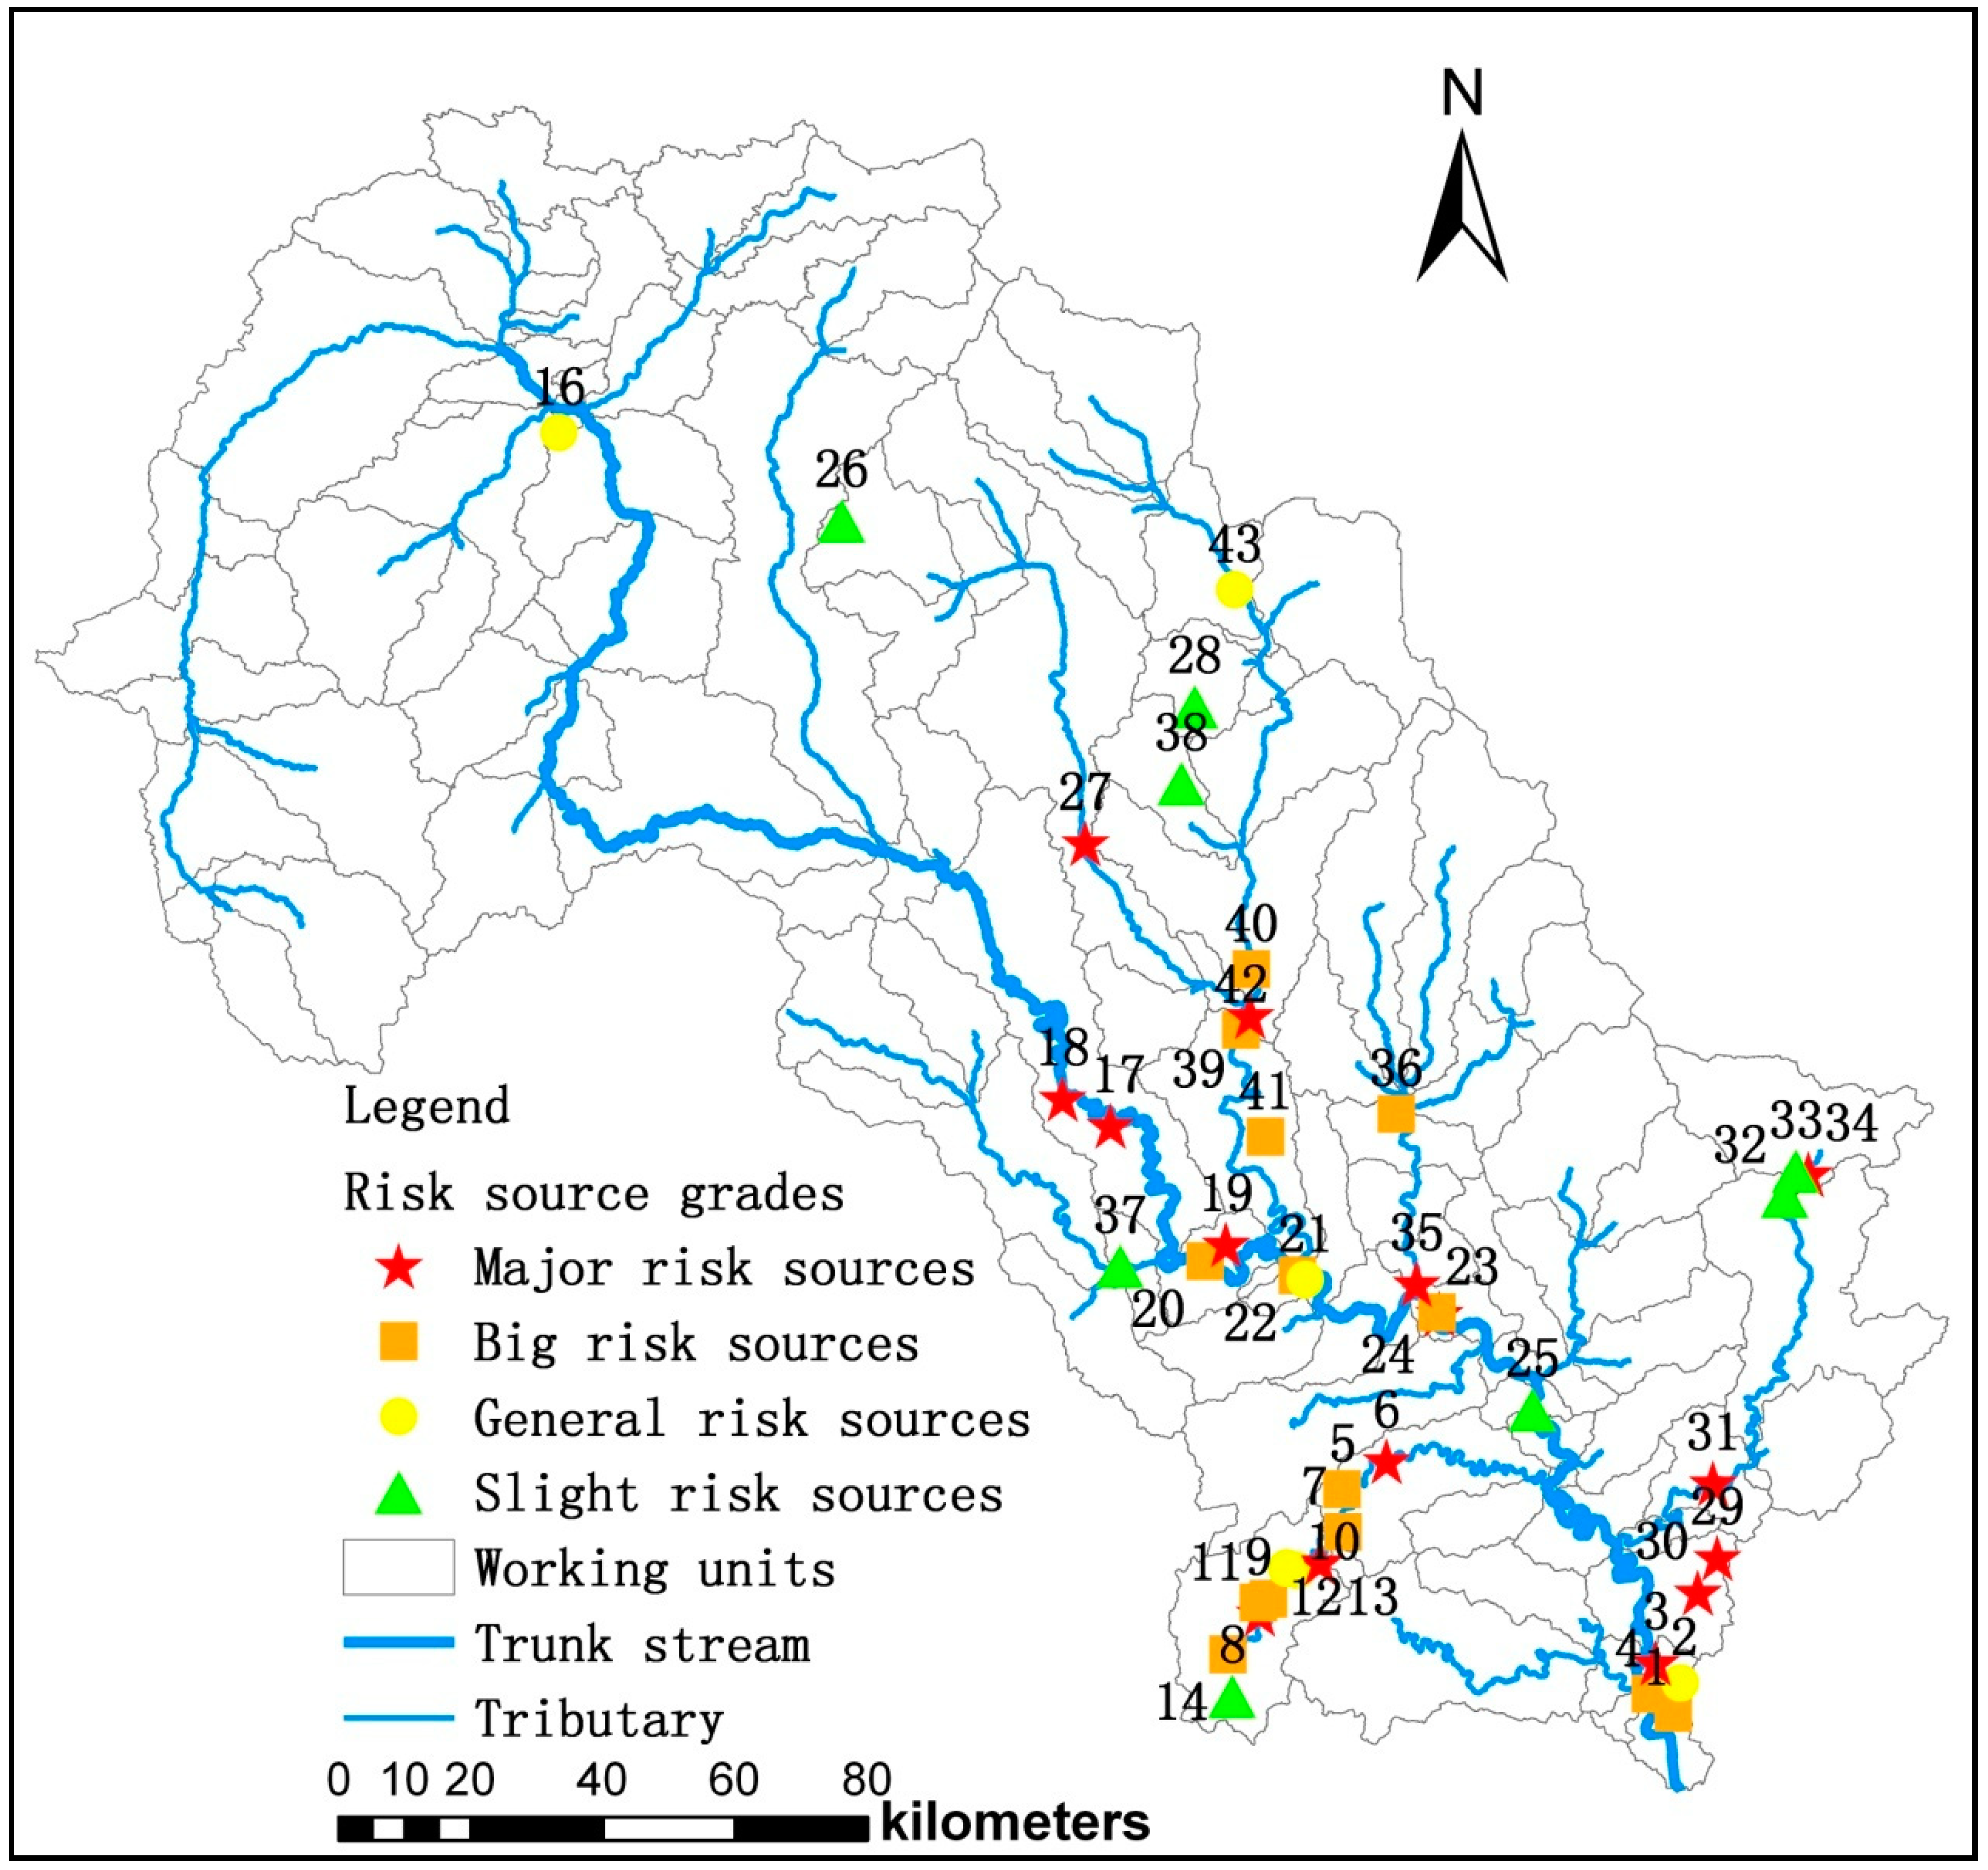
4.1. Environmental Risk Sources Hazard Assessment Result
Combined with the standard in
Table 2 and the fuzzy comprehensive evaluation method, the environmental risk sources risk grade results of the upper-middle reaches of the Luanhe River are obtained. Risk sources evaluation results are shown in
Figure 8 and
Table 7. There are 43 risk sources that have 15 major risk sources, 14 big risk sources, six general risk sources and eight slight risk sources. From the point of view of the risk level, most risky sources belong to the larger risk. From
Figure 8 we can see that in the upper-middle reaches of the Luanhe River, risk sources distribution is concentrated, mainly distributed in the middle and lower segment of the study area.
4.2. Working Units Hazard Assessment Result
Combining the environmental risk sources risk assessment result in
Section 4.1 with the calculation method in
Section 3.3 the conclusion of hazard assessment of 107 working units in the upper reaches of Luanhe River is obtained, as shown in
Figure 9. Most working units in the study area have low grade hazard, i.e., 75 are low hazard working units, eight moderate hazard working units, five high hazard working units, and 19 higher hazard working units, and hence the overall hazard is low.
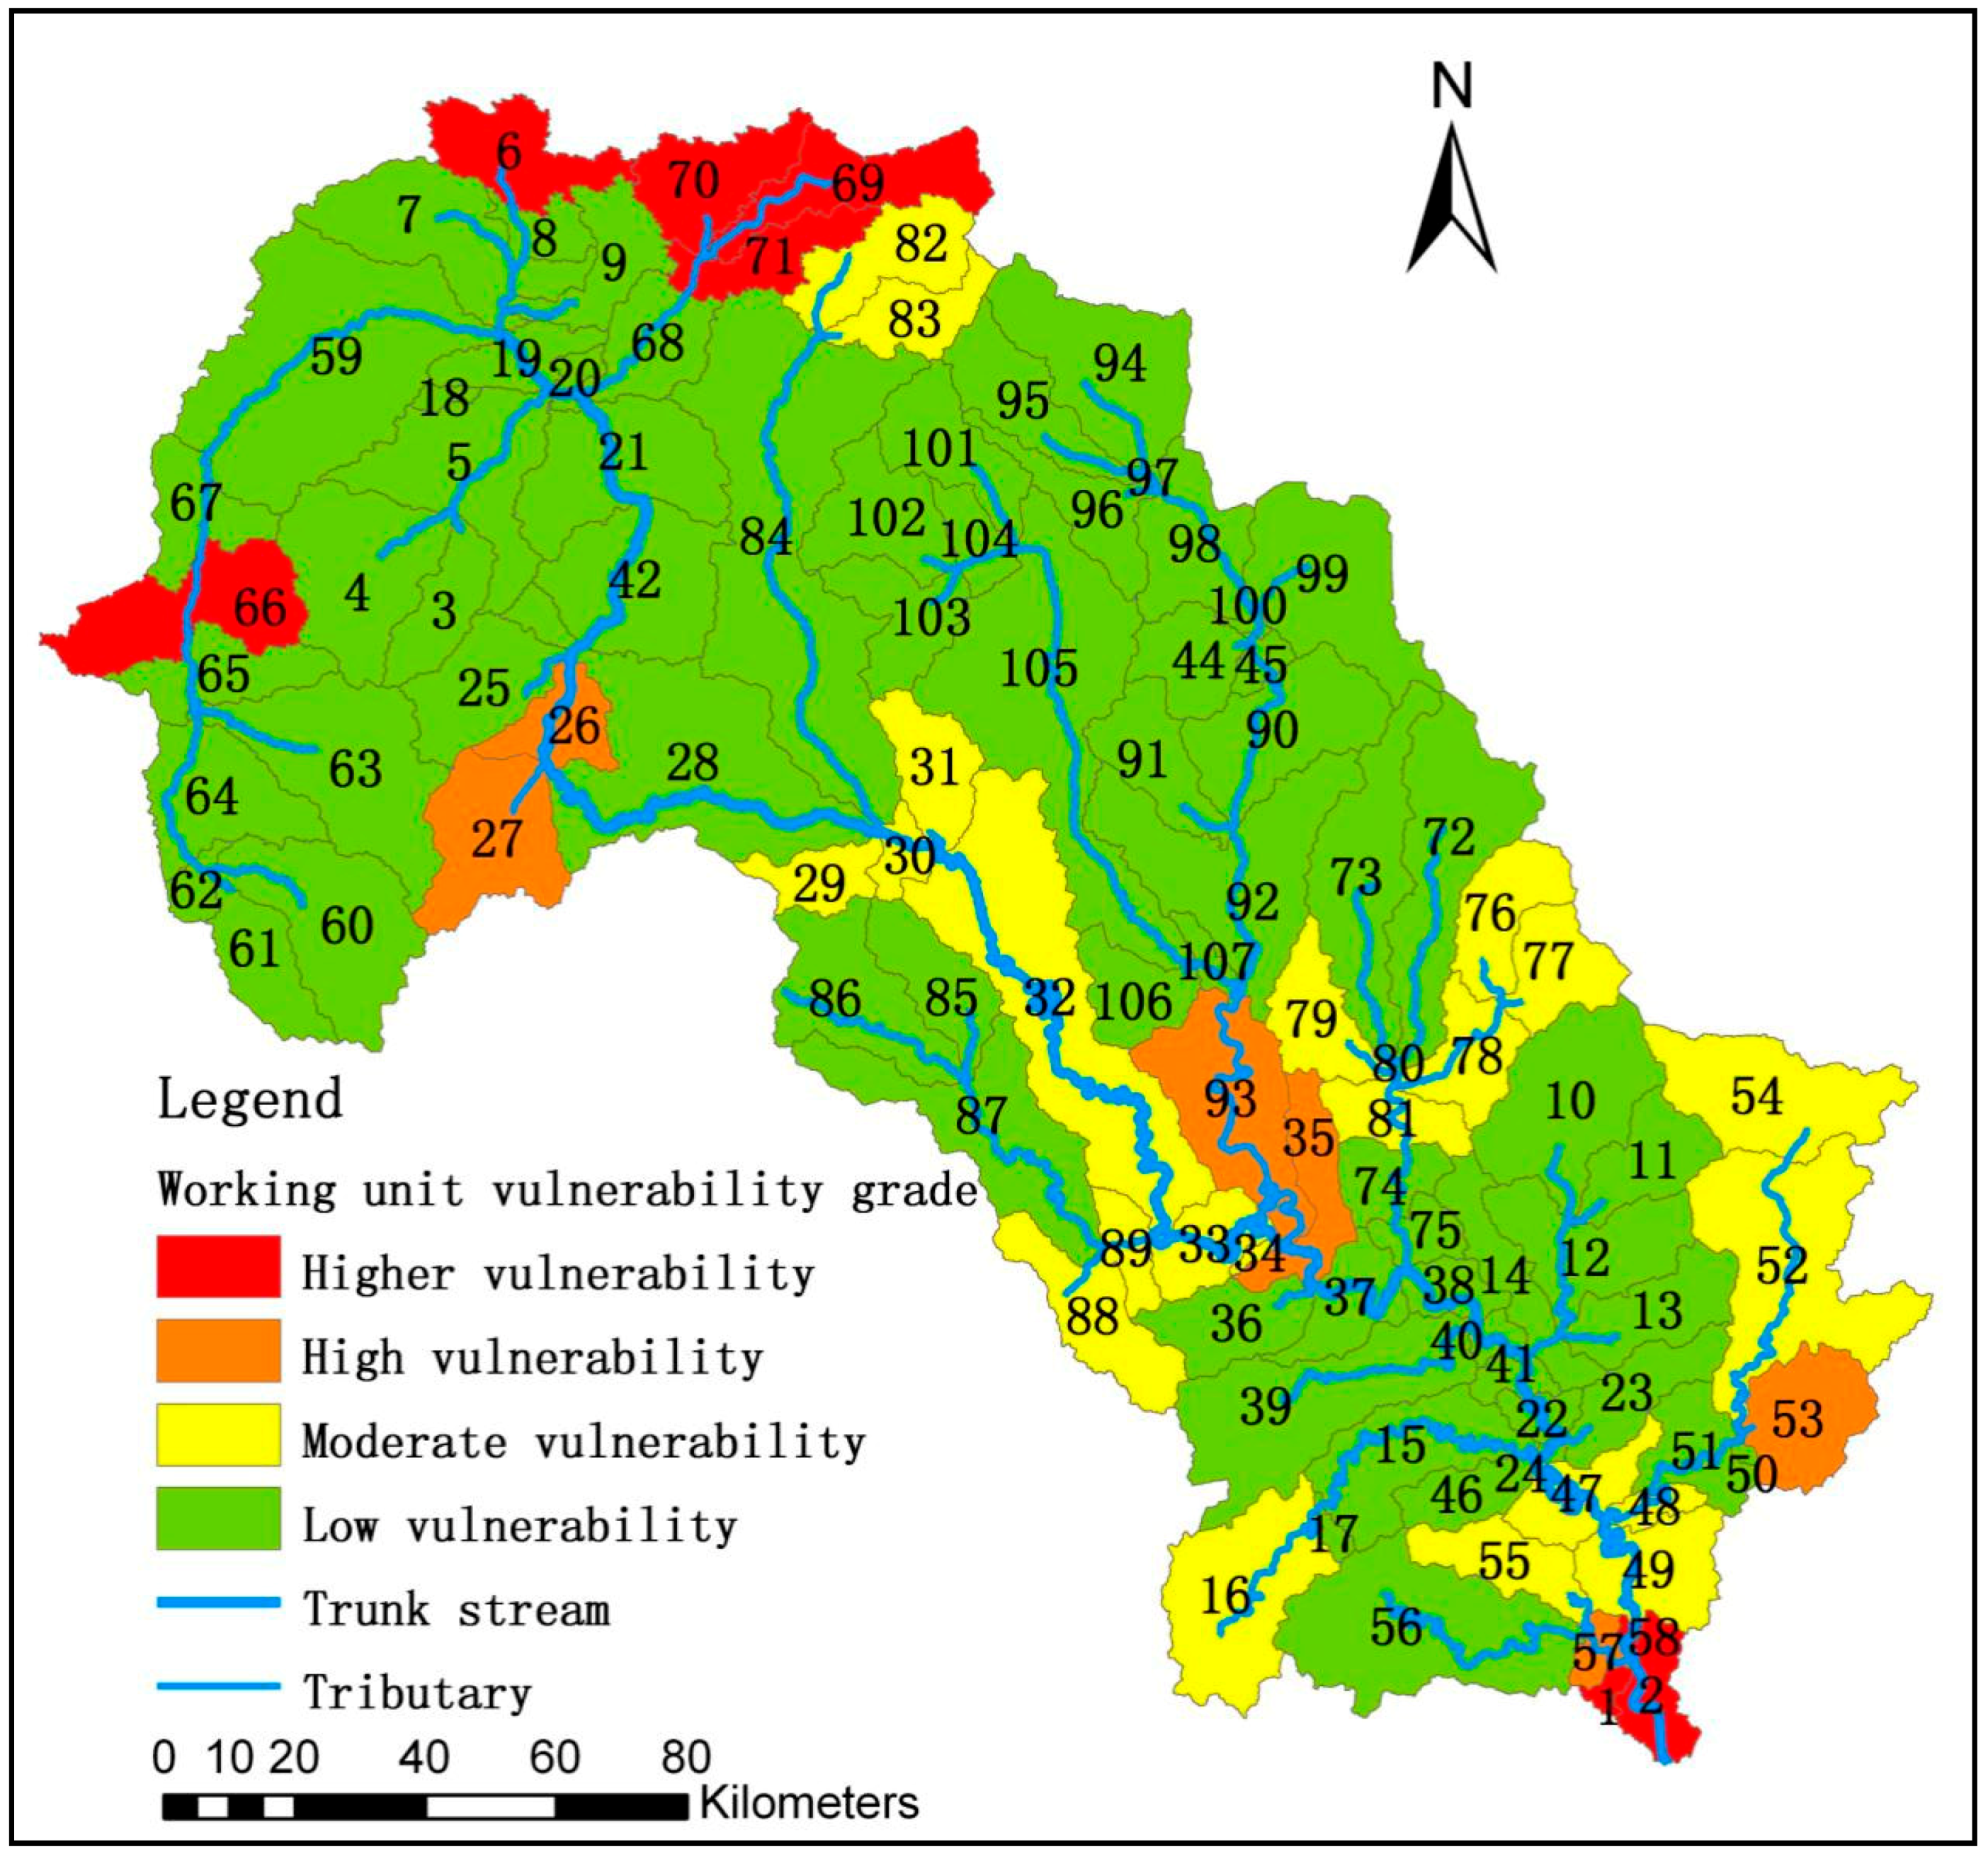
4.3. Working Units Vulnerability Assessment Result
Combined with the standard in
Table 5 and the fuzzy comprehensive evaluation method, the vulnerability assessment results are shown in
Figure 10. This shows that there are eight higher vulnerability working units, six high vulnerability working units, 22 moderate vulnerability working units and 71 low vulnerability working units in the upper-middle reaches of Luanhe River Basin, indicating that the study area is overall in lowest vulnerability and the upper-middle reaches of Luanhe River Basin have strong ability to resist risks. High vulnerability areas are mainly located in the upper part of the study area, due to their fragile ecosystem and high sensitivity scores. It is worth noting that the working units for Daheiting reservoir is in high vulnerability, which needs to focus on investigation into protection.
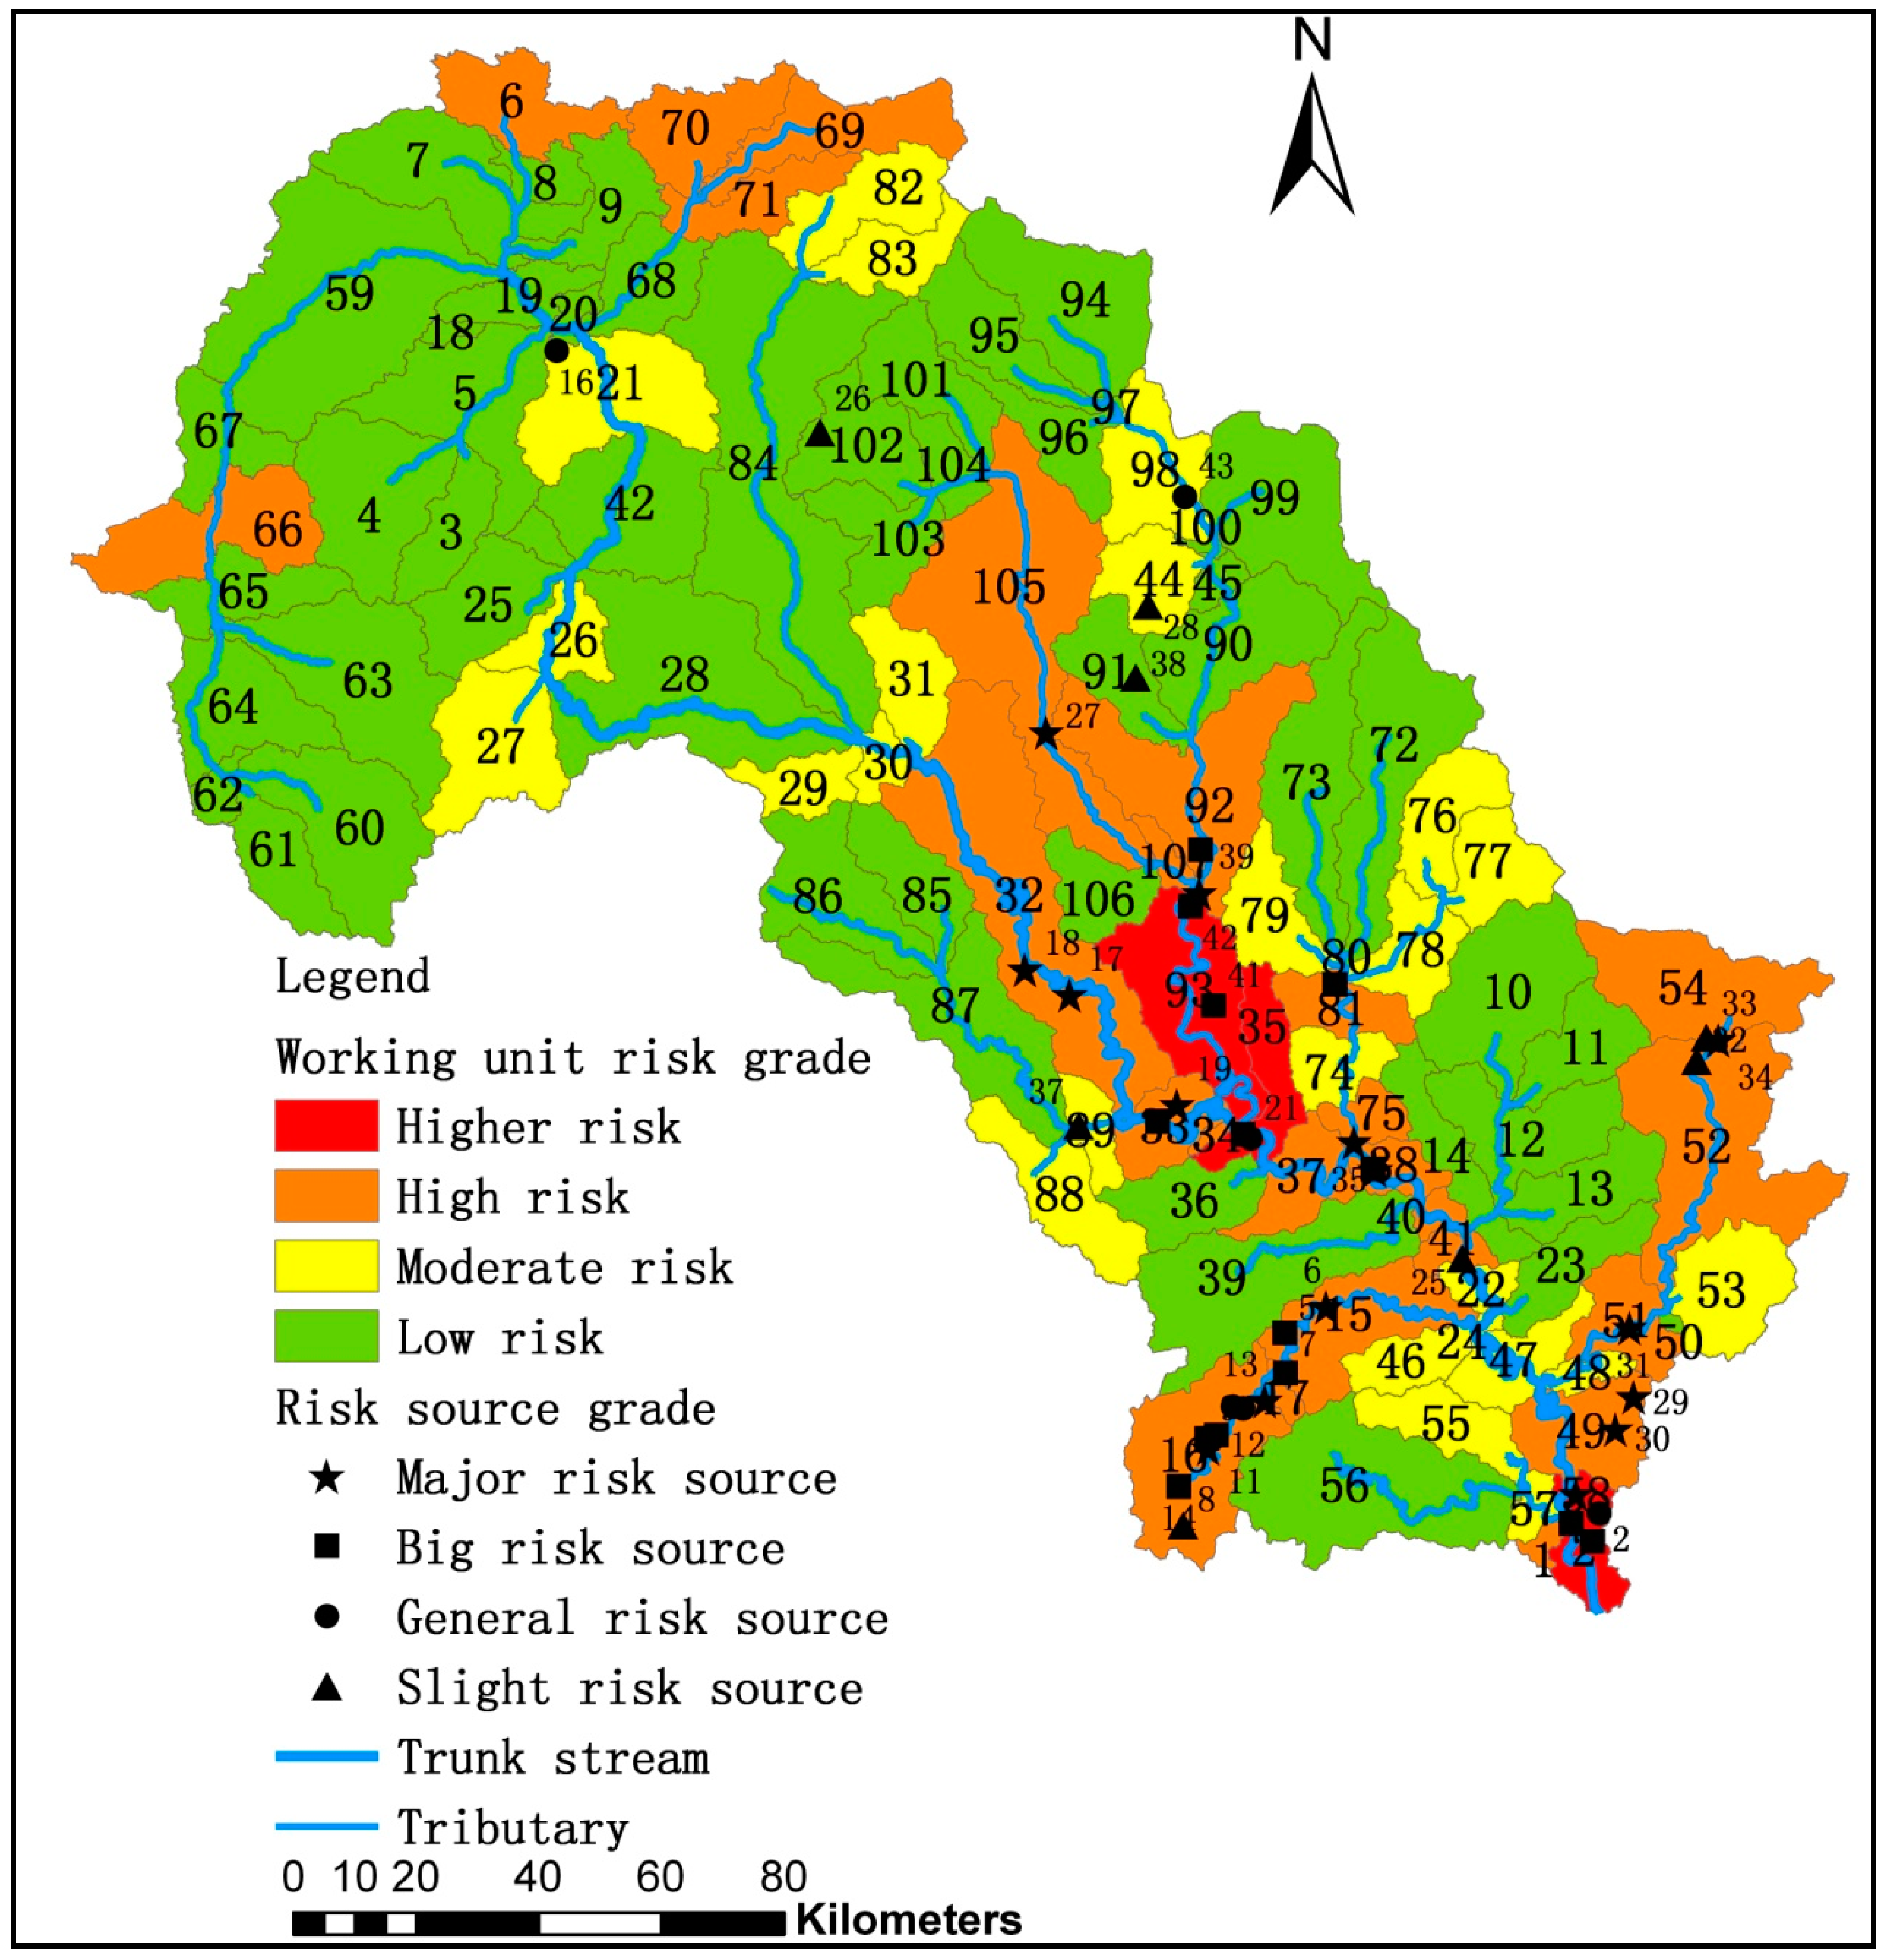
4.4. Working Units Risk Assessment Result
The risk grade of working units can be obtained by evaluating the hazard and vulnerability grade of the working units with the risk matrix.
Figure 11 shows that the study area is at low risk (53 units), followed by moderate risk (25 units) and high risk (25 units), least for higher risk (four units), indicating overall low risk in the upper-middle reaches of Luanhe river.
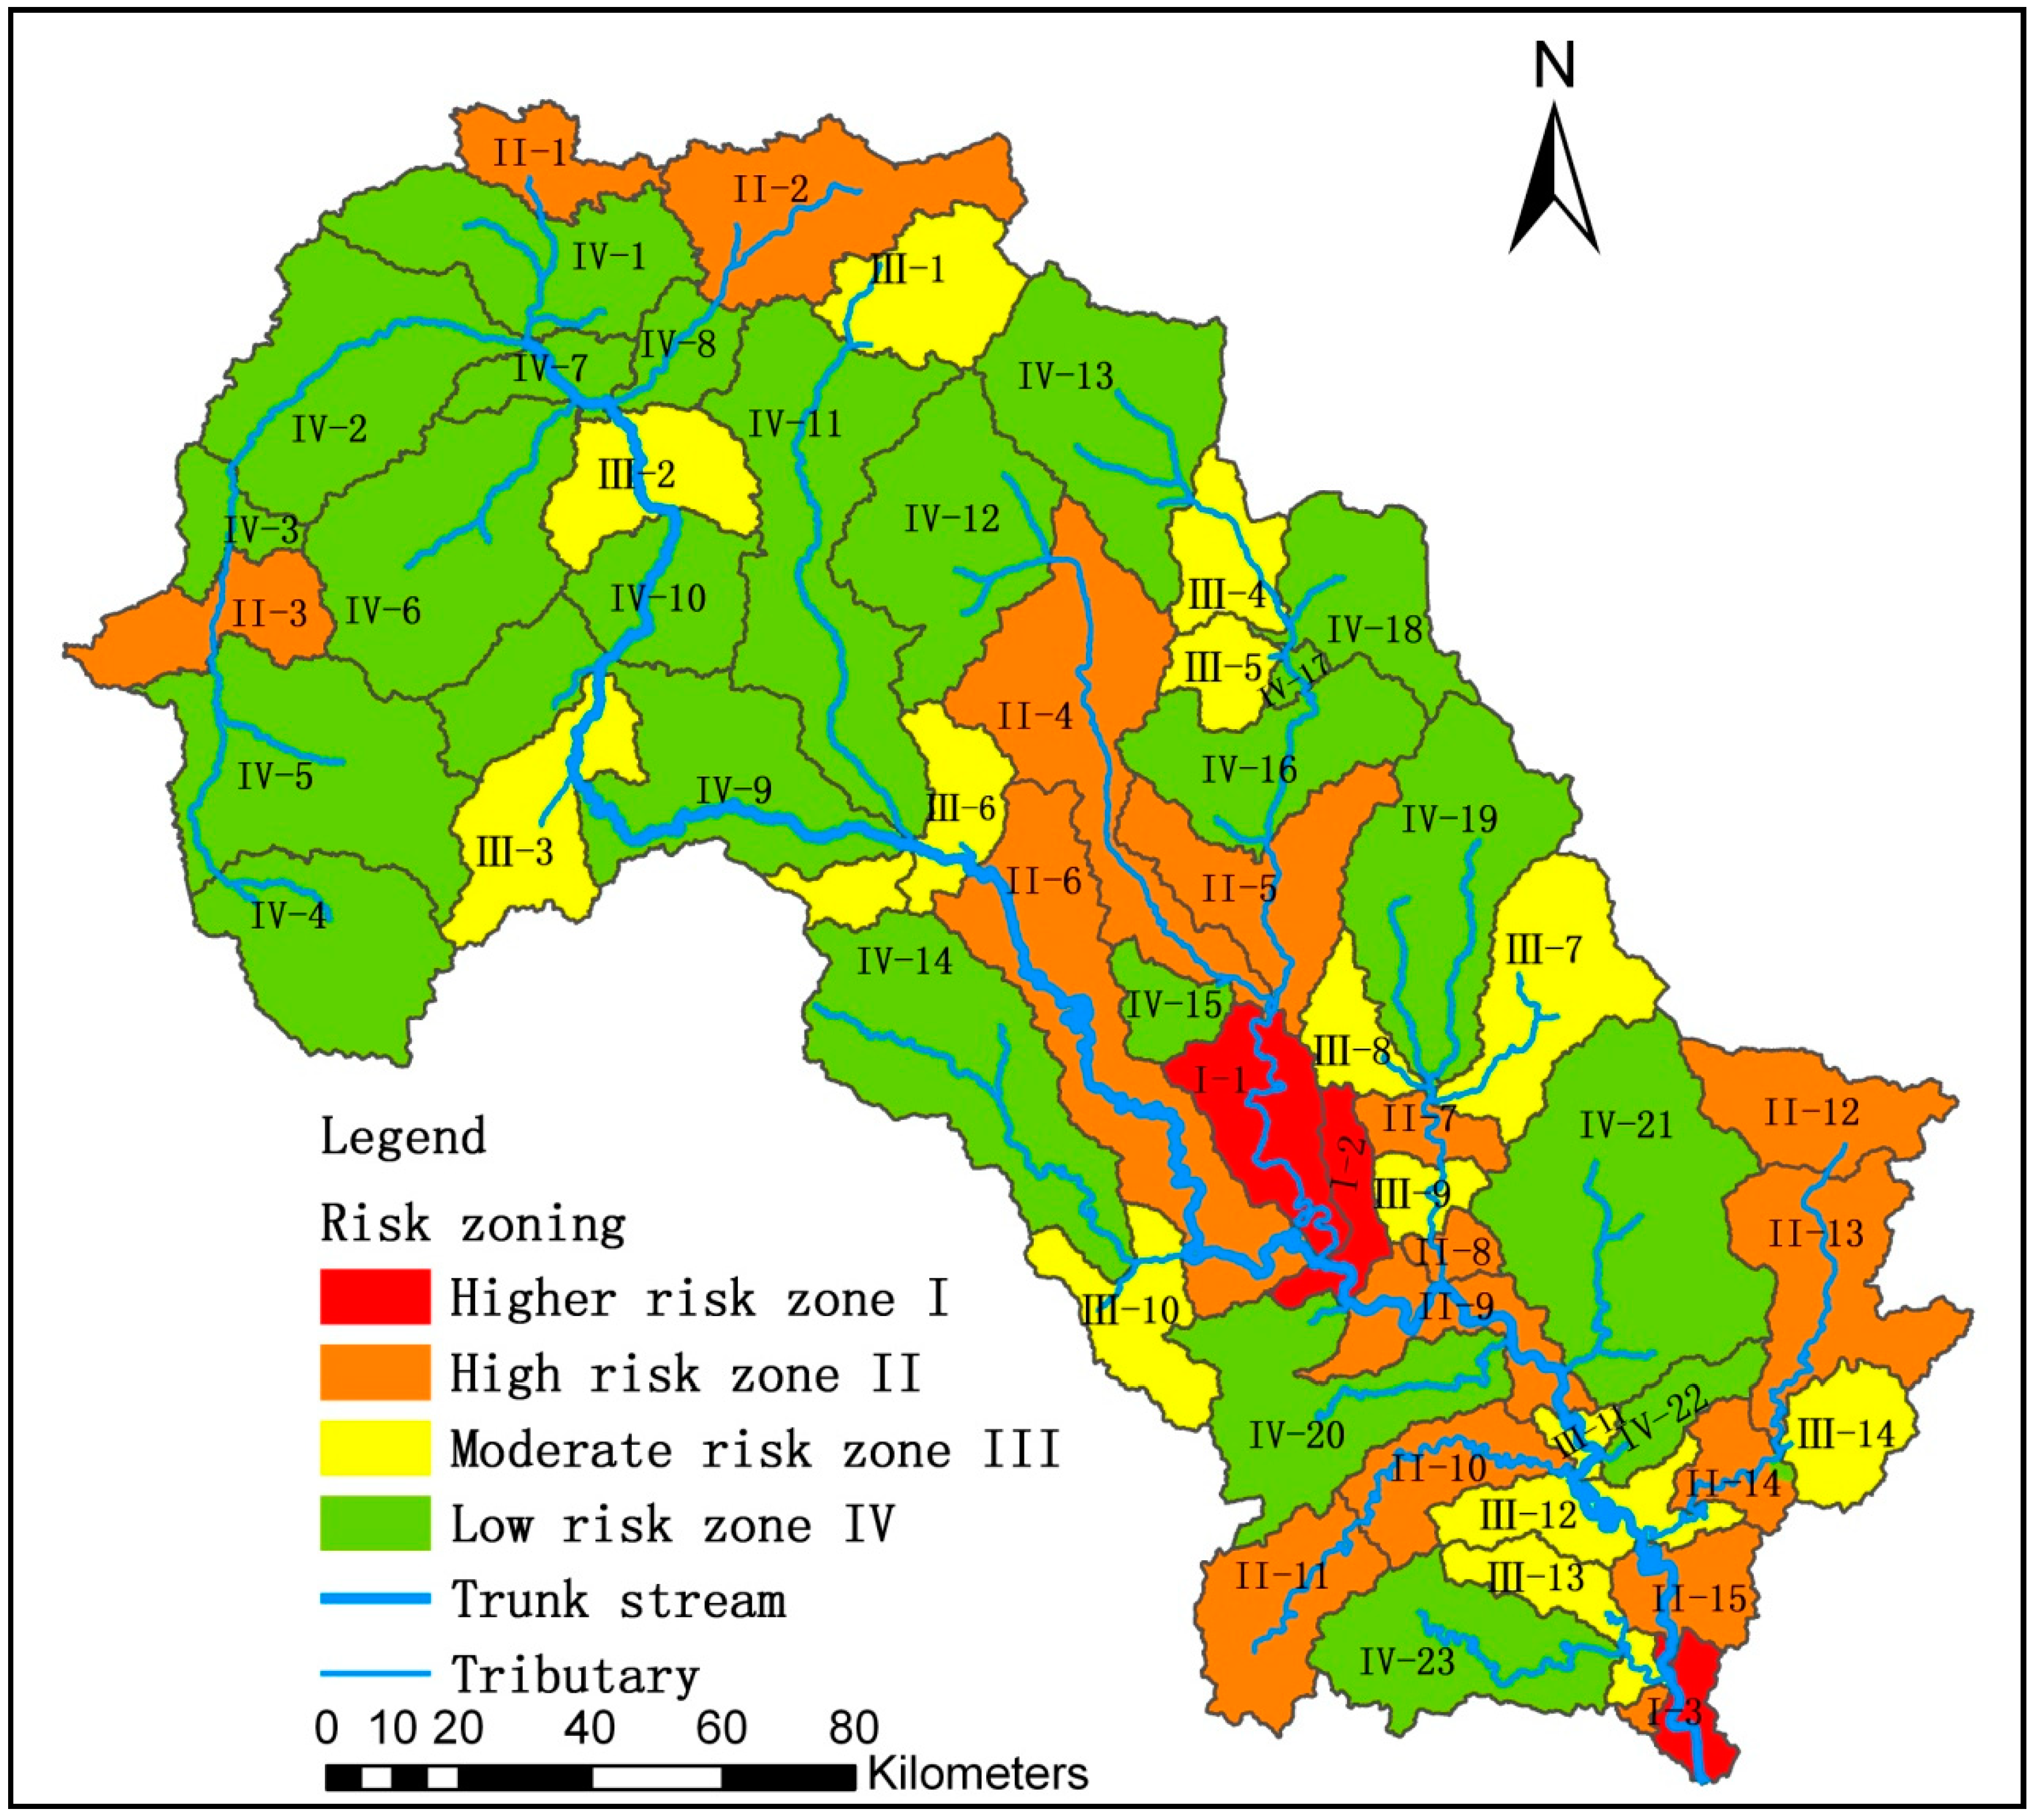
4.5. Risk Zoning Results Based on Water Function Area Control Unit
After obtaining the working units risk grade, according to the environmental risk zoning theory, merging the working units with the same risk grade in a water function area, four risk grades zones are obtained, and they are higher risk zone I, high risk zone II, moderate risk zone III and low risk zone IV, as shown in
Figure 12. The risk zoning is scattered distribution in the upper-middle reaches of the Luanhe River, and there are three higher risk zones I, 15 high risk zones II, 14 moderate risk zones III, and 23 low risk zones IV, which illustrate that the risk in the upper reaches of Luanhe River is generally low.
5. Discussion
The risk zoning results for the upper-middle reach of the Luanhe River from sudden water pollution incidents have been recognized by the relevant departments and they apply the methods to practical works. For example, the major risk source “Chengde iron and Steel Group Co., Ltd.”, which is located in Daheiting reservoir and near the drinking water source are identified by the relevant departments and has been shut down.
When studying the downstream features I4 for a very large river basin area, the risk sources hazard upstream to downstream working units generally requires a coupled one-dimensional, two-dimensional or three-dimensional hydrodynamic and water quality model. In particular, in the study area the Panjiakou Reservoir belongs to deep water reservoir and a three-dimensional numerical simulation model is necessary; the Daheiting reservoir is wide with a relatively small water depth and a two-dimensional numerical simulation model is appropriate; and between these two reservoirs, there is a narrow river and a one-dimensional river network model is sufficient. At the same time, the coefficients in those equations need to be determined through actual observations and experiments.
The information about the distribution of water conservancy infrastructures in the study area fails to fully investigate and obtain. For example, a dam may have a hysteresis effect to mitigate the adverse effects of water pollution incidents, including interception, temporary storage, by impounding water when sudden water pollution incidents occur. Therefore, the quantity, quality and distribution of the dam in the area can be used as an index of environmental risk source in hazard control capability. Similarly, the role of other structures can be considered. For instance, tailings dams actually exist in the Luanhe River Basin and it should be taken as risk sources. However, detailed data of tailings dams, such as distribution and quantities in the Luanhe River Basin are not available, and thus the present analysis cannot take them as the environmental risk sources into account.
After identification and obtaining the risk zoning results of sudden water pollution incidents in the upper and middle reaches of Luanhe River Basin, the prevention and control technical measures and schemes of the sudden water pollution events in the upstream of Luanhe River could be proposed based on the national and local policies and regulations, the basic principles of water pollution control, the constituent factors of the risk level of risk zones and the actual situation. They are as follows: (A) Different management measures and schemes should be proposed according to different risk and vulnerability levels in the risk area; (B) mitigate risk levels through controlling risk sources; (C) control risks from multi-aspects, such as legal, social, economic, political and technological factors; and (D) strengthen the protection of risk receptors to reduce vulnerability. For high risk area, for example, because the hazard and vulnerability are in general very high, it is necessary to ban on the construction of new risk sources (e.g., new chemical plants and factories), to prohibit the introduction of new sensitive receptors, to shut down or move major risk sources out in the area, to establish strict and comprehensive environmental pollution monitoring system, to strengthen risk prevention and supervision, as well as to increase the construction of protective barriers for high sensitive receptors.
It is noteworthy to point out that the proposed risk assessment method is based on the water function area control unit, a Chinese and scientific concept and a practical tool in effectively managing water resources and fighting water pollution according to Chinese experience. We strongly believe that this concept could be applied and extended in many other countries and regions, especially with a water shortage and severe water pollution.
6. Conclusions
The risk of water pollution incidents of upper-middle reaches of Luanhe River Basin is assessed in the process of regionalization, leading to the following improvement: (1) Each sub basin within a water function area control unit is identified as a working unit, and taken as the transition unit of the risk assessment regionalization in a sudden water pollution event; (2) in environmental risk source hazard assessment index system, the risk source flows through the downstream different water function areas (working units) and it will affect the environmental risk source hazard grade itself, and thus increase the “Downstream features” of environmental risk sources index; (3) the calculation method of hazard from risk source to working unit is established and the working unit hazard grade is composed of two parts: The risk source hazard grade of the working unit and the influence of the upstream risk source to the downstream working unit hazard; and (4) the risk zoning theory is applied to combine the working units with the same risk grade in the same water function control unit for obtaining the final risk zoning unit.
In the upper-middle reaches of Luanhe River Basin area there are 34 control units. Combining with the sub basin, it is further divided into 107 working units. There are 43 environmental risk sources, among which 15 are the major risk sources, and 14 are the big risk sources which are concentrated and distributed in the middle and lower reaches of the study area. However, there are 75 low hazard working units and the overall hazard is low. Almost working units are in low vulnerability, which means that the upper-middle reaches of Luanhe River basin has the strong ability to resist risks. The risk grade of each working unit is obtained through risk matrix. Working units are combined with those of the same risk grades and the water function area control units, resulting in 55 risk zones, including three higher risk zone I, 15 high risk zone II, 14 moderate risk zone III, and 23 low risk zone IV. This indicates that the risk of the upper-middle reaches of Luanhe River Basin is low, and the corresponding management methods for the different risk zones are suggested. The Daheiting reservoir as one of drinking water sources of Tianjin belongs to the higher risk zone I, and its management is required, which includes separating and cutting off its risk sources, and at the same time increasing the protective barriers of its high-sensitivity receptors.
Author Contributions
Conceptualization, S.H. and Y.X.; Methodology, S.H. and Y.X.; Software, S.H., Y.X. and Y.L.; Validation, S.H., Y.X., F.K. and M.L.; Formal Analysis, S.H. and Y.X.; Investigation, S.H., Y.X. and F.K.; Resources, S.H., Y.X. and F.K.; Data Curation, S.H., Y.X., F.K., M.L. and Y.L.; Writing-Original Draft Preparation, Y.X.; Writing-Review & Editing, S.H. and J.Z.; Visualization, Y.X. and Y.L.; Supervision, S.H.; Project Administration, S.H.; Funding Acquisition, S.H.
Funding
This research was funded by [NSFC] Grant Number 11672139, [NSF of Tianjin] Grant number. 15JCYBJC22500 and the Fundamental Research Funds for the Central Universities of China.
Acknowledgments
The authors are grateful to the editors and the anonymous reviewers for their insightful comments and suggestions, which improved the paper greatly.
Conflicts of Interest
The authors declare no conflict of interest.
References
- Xu, X.; Zhu, J.; Li, Z.; Xie, J. An Overview of the Domestic and Foreign Research on Accidental Water Pollution Events. China Rural Water Hydropower 2015, 6, 1–5. [Google Scholar]
- Huang, C.; Liu, A.; Wang, Y. A discussion on basic definition of disaster risk. J. Nat. Disasters 2010, 19, 8–16. [Google Scholar]
- Orvos, D.R.; Cairns, J. Developing a risk assessment strategy for the Chesapeake Bay. Hydrobiologia 1991, 215, 189–203. [Google Scholar] [CrossRef]
- Blair, A.N.; Ayyub, B.M.; Bender, W.J. Fuzzy stochastic risk-based decision analysis with the mobile offshore base as a case study. Mar. Struct. 2001, 14, 69–88. [Google Scholar] [CrossRef]
- Mao, H. Discussion on Some Basic Rules and Concepts of Safety Science. China Saf. Sci. J. 2009, 19, 12–16. [Google Scholar]
- Xie, Z.; Zhou, J. Re-studying and Understanding the Fundamental Concept of Risk. Insur. Stud. 2013, 2, 101–108. [Google Scholar]
- Guo, L.; Yuan, P.; Song, Y.; Wang, L.; Peng, J. Environmental Risk Classification and Management for Chemical Industry Parks. J. Environ. Eng. Technol. 2011, 1, 403–408. [Google Scholar]
- Wei, K.; Song, Y.; Peng, J.; Yuan, P.; Wen, L.; Wa, Y. Environmental risk source and its classification. J. Saf. Environ. 2011, 10, 85–89. [Google Scholar]
- Hou, D.; Ge, X.; Huang, P.; Zhang, G.; Loáiciga, H. A real-time, dynamic early-warning model based on uncertainty analysis and risk assessment for sudden water pollution accidents. Environ. Sci. Pollut. Res. 2014, 21, 8878–8892. [Google Scholar] [CrossRef] [PubMed]
- Qu, C.; Bi, J.; Huang, L.; Li, F.; Yang, J. Dynamic Comprehensive Evaluation on Regional Environmental Risk. Acta Sci. Nat. Univ. Pekin. 2010, 46, 477–482. [Google Scholar]
- Xu, Y.; Ma, M.H.; Gao, J.F. The evaluation method of ecological risk assessment based on watershed scale—Take the Taihu watershed as example. China Environ. Sci. 2012, 32, 1693–1701. [Google Scholar]
- Salinas-Rodriguez, C.; Gersonius, B.; Zevenbergen, C.; Serrano, D.; Ashley, R. A semi risk-based approach for managing urban drainage systems under extreme rainfall. Water 2018, 10, 384. [Google Scholar] [CrossRef]
- Lan, D.; Liu, R.; Zeng, W. Technique to Regional Risk Zonation of Environmental Pollution Accident and Its Application. J. Basic Sci. Eng. 2009, 17, 82–91. [Google Scholar]
- Qu, C.; Bi, J.; Ge, Y. Optimization Management of Regional Environmental Risk Based on Risk System. Environ. Sci. Technol. 2009, 32, 169. [Google Scholar]
- Xue, P.L.; Zeng, W.H. Shanghai environmental accidents risk regionalization. China Environ. Sci. 2011, 31, 1743–1750. [Google Scholar]
- Ma, Y.; Peng, J.F.; Song, Y.; Wang, C. Study on the classification method of environmental risk for sudden accidents in drinking water sources. Acta Sci. Circumst. 2012, 32, 1211–1218. [Google Scholar]
- Liu, R.; Liu, J.; Zhang, Z.; Borthwick, A.; Zhang, K. Accidental Water Pollution Risk Analysis of Mine Tailings Ponds in Guanting Reservoir Watershed, Zhangjiakou City, China. Int. J. Environ. Res. Public Health 2015, 12, 15269–15284. [Google Scholar] [CrossRef] [PubMed]
- Martin, P.H.; LeBoeuf, E.J.; Daniel, E.B.; Dobbins, J.P.; Abkowitz, M.D. Development of a GIS-based Spill Management Information System. J. Hazard. Mater. 2004, 112, 239–252. [Google Scholar] [CrossRef] [PubMed]
- Liu, J.; Hu, J.; Chu, J.; Chu, J.; Gao, X. Multi-scale risk assessment of accidental water pollution events in ungauged river basins. J. Tsinghua Univ. Sci. Technol. 2012, 52, 830–835. [Google Scholar]
- Golge, M.; Yenilmez, F.; Aksoy, A. Development of pollution indices for the middle section of the Lower Seyhan Basin (Turkey). Ecol. Indic. 2013, 29, 6–17. [Google Scholar] [CrossRef]
- Zhang, K.; Liu, R.; Zhang, Z.; Hu, L.; Jia, Z.; Zhuo, Y. A Method of Environmental Risk Assessment for Abrupt Water Pollution Accidents in River Basin. J. Basic Sci. Eng. 2014, 4, 675–684. [Google Scholar]
- Zeng, W.; Song, Y.; Yao, X. Multi-Scale Environmental Pollution Emergency Risk Zoning; Science Press: Beijing, China, 2013; pp. 5–17. [Google Scholar]
- Li, Y.; Huang, S.; Joseph, D. Temporal and spatial distributions of water and sediment yield in the Luanhe River Basin, China. In Proceedings of the 3rd International Conference on Water Resource and Environment (WRE2017), Qingdao, China, 26–29 June 2017. [Google Scholar]
- Li, Y.; Huang, S. Landscape Ecological Risk Response to Land Use Change in the Luanhe River Basin, China. Sustainability 2015, 7, 16631–16652. [Google Scholar] [CrossRef]
- General Office of the State Council. National Emergency Plan for Environmental Emergencies. 2014. Available online: http://www.gov.cn/zhengce/content/2015-02/03/content_9450.htm (accessed on 19 December 2014).
- Chen, Y.; Qiu, X. Research of risk source recognition of water environment in typical river basin of northwest inland. J. Water Resour. Water Eng. 2014, 25, 188–190. [Google Scholar]
- Tang, X.; Liu, B.; You, H.; Li, E. New approach to attacking the unexpected water environmental pollution hazardszone-division. J. Saf. Environ. 2013, 13, 276–278. [Google Scholar]
- Zhang, X.; Zhu, J. Problem and Countermeasures of Water Ecology and Water Environment. Environ. Sci. Manag. 2012, 8, 7–9. [Google Scholar]
- Gao, P.; Song, Y.; Yang, C. Water function zoning and water environment capacity analysis on surface water in Jiamusi urban area. Procedia Eng. 2012, 28, 458–463. [Google Scholar]
- Jiang, Y.; Yuan, D.; Zhang, C.; Kuang, M.; Wang, J.; Xie, S.; Zhang, G.; He, R. Impact of Land Use Change on Soil Proper ties in a Typical Karst Agricultural Region: A Case Study of Xiaojiang Water shed, Yunnan. Acta Geogr. Sin. 2005, 60, 751–760. [Google Scholar]
- Seydehmet, J.; Lv, G.-H.; Abliz, A.; Shi, Q.-D.; Turup, A. Irrigation salinity risk assessment and mapping in arid oasis, Northwest China. Water 2018, 10, 966. [Google Scholar] [CrossRef]
- Du, J.; He, F.; Shi, P. Integrated flood risk assessment of Xiangjiang River Basin in China. J. Nat. Disasters 2006, 15, 38–44. [Google Scholar]
© 2018 by the authors. Licensee MDPI, Basel, Switzerland. This article is an open access article distributed under the terms and conditions of the Creative Commons Attribution (CC BY) license (http://creativecommons.org/licenses/by/4.0/).


