Effect of Aeration Rates and Filter Media Heights on the Performance of Pollutant Removal in an Up-Flow Biological Aerated Filter


1
State Key Laboratory of Eco-hydraulic in Northwest Arid Region, Xi’an University of Technology, Xi’an 710048, China
2
College of Computing, Georgia Institute of Technology, Atlanta, GA 30301, USA
*
Author to whom correspondence should be addressed.
Water 2018, 10(9), 1244; https://doi.org/10.3390/w10091244
Submission received: 24 August 2018
/
Revised: 6 September 2018
/
Accepted: 7 September 2018
/
Published: 14 September 2018
(This article belongs to the Section Wastewater Treatment and Reuse)
Abstract
:The biological aerated filter (BAF) is an effective biological treatment technology which removes the pollutants in municipal wastewater secondary treatment. However, we still know little about the interaction between the pollutants removal and microbes within the BAF. In this study, we used an up-flow BAF (UBAF) reactor to investigate the relationships between the pollutants removal and microbial community structure at different aeration rates and filter media heights. The microbial community of biofilm was analyzed by Illumina pyrosequencing. Our results showed that the UBAF achieved a better removal efficiency of chemical oxygen demand (COD), NH4+-N, NO3−-N, and total phosphorus (TP) at an aeration rate of 65 L/h. In addition, the COD and NH4+-N removal mainly occurred at 0–25 cm height of filter media. The microbial community structure in the UBAF demonstrated that the relative abundance of the Planctomycetes and Comamonadaceae at 10 cm height of filter media were 11% and 48.1%, respectively, proportions significantly higher than those under others treatments. Finally, the changes in relative abundance of Proteobacteria, Planctomycetes, and Nitrospirae likely explained the mechanism of nitrogen and phosphorus removal. Our results showed that suitable conditions could enhance the microbial community structure to achieve a high pollutants removal in the UBAF.
1. Introduction
During the past two decades, the biological aerated filter (BAF) began to substitute the traditional activated sludge process for the wastewater treatment in municipal wastewater [1,2]. The BAF exhibits a large number of advantages, such as filtration of solids, organic matter, and nutrient removal, which occur in the same reactor [1,2,3]. The BAF systems also enhance the biomass and pollutants loading capacity, reduce the biomass residence time, improve the environmental shock resistance, and reduce sludge production [1]. The BAF are relatively compact, easy to operate, and may be more efficient in carbonaceous and ammonia removal than activated sludge system [4]. Therefore, the BAF possesses broad application prospects in wastewater treatment.
The recent research on the BAF focuses mainly on optimizing of the removal efficiency and the mechanism of pollutants removal [3,5]. In that context, the aeration usually occupies half of the total energy consumption in the biological treatment process [6,7]. Moreover, it plays an essential role in BAF operation by controlling supply of oxygen for microbial degradation at low turbulence and, consequently, interferes in the microbial activity [8,9]. Thus, an appropriate aeration rate reduces the energy costs of the BAF [5,8,9,10]. Abu Hasan et al. [9] reported that the aeration rate also influenced ammonia removal and effective microbes in the BAF system. Tao et al. [5] optimized the reactor structure and explored the chemical oxygen demand (COD), total nitrogen (TN), and NH4+-N removal at different filter media heights by setting a non-aeration zone at the bottom of the reactor. Yang et al. [11] studied the pollutants removal using combined UAF–UBAF system, the COD and NH4+-N removal reached to 90% and 89.0% of removal, respectively. However, they failed to study the mechanism of phosphorus removal. Removal of biological nitrogen occurs in two stages of treatment: Aerobic nitrification and anoxic denitrification [4]. Polyphosphate bacteria absorbed the phosphorus and removed under aerobic conditions. Some researchers also used a combination of processes or methods including Fe2+ to effectively remove phosphorus [4,12,13]. In the BAF system, the biofilm plays an essential role in the mechanism of pollutants removal. To access and analyze the microbial community in wastewater, previous researches applied several methods, such as: Polymerase Chain Reaction, Denaturing Gradient Gel Electrophoresis (DGGE) [14], Terminal-Restriction Fragment Length Polymorphism (T-RFLP) [15], and pyrosequencing of 16S rRNA gene sequences [16]. Nowadays, many researchers analyzed the functional microbes structure using 454-pyrosequencing analysis [11,14]. The functional microbial community also helps to understand the mechanism of pollutants removal.
Several studies already investigated the pollutants removal efficiency and optimized the operation in the BAF [5,12]. However, few studies explored the effects of aeration rates and filter media heights on the pollutants removal and microbial community in the BAF system. Additionally, phosphorus removal has always been one of the critical restrictions to the application of BAF. Suitable aeration rates not only achieved higher nitrogen removal efficiency but also significantly increasing phosphorus removal. Moreover, in the BAF system, the study of pollutants removal at different filter media heights becomes increasingly important for the practical application of the BAF.
Based on that, we built an up-flow BAF (UBAF) reactor to investigate the relationships between the pollutants removal and microbial community structure at different aeration rates and filter media heights. Our study aimed (i) to assess the effect of aeration rates on COD, nitrogen, and phosphorus removal efficiency; (ii) to explore the pollutants removal mechanism at different filter media heights; (iii) to analyze the microbial community structure at different aeration rates and filter media heights using Illumina pyrosequencing; and (iv) understand the relationship of pollutants removal and microbial community in the UBAF reactor.
2. Materials and Methods
2.1 Description of the Up-Flow BAF System
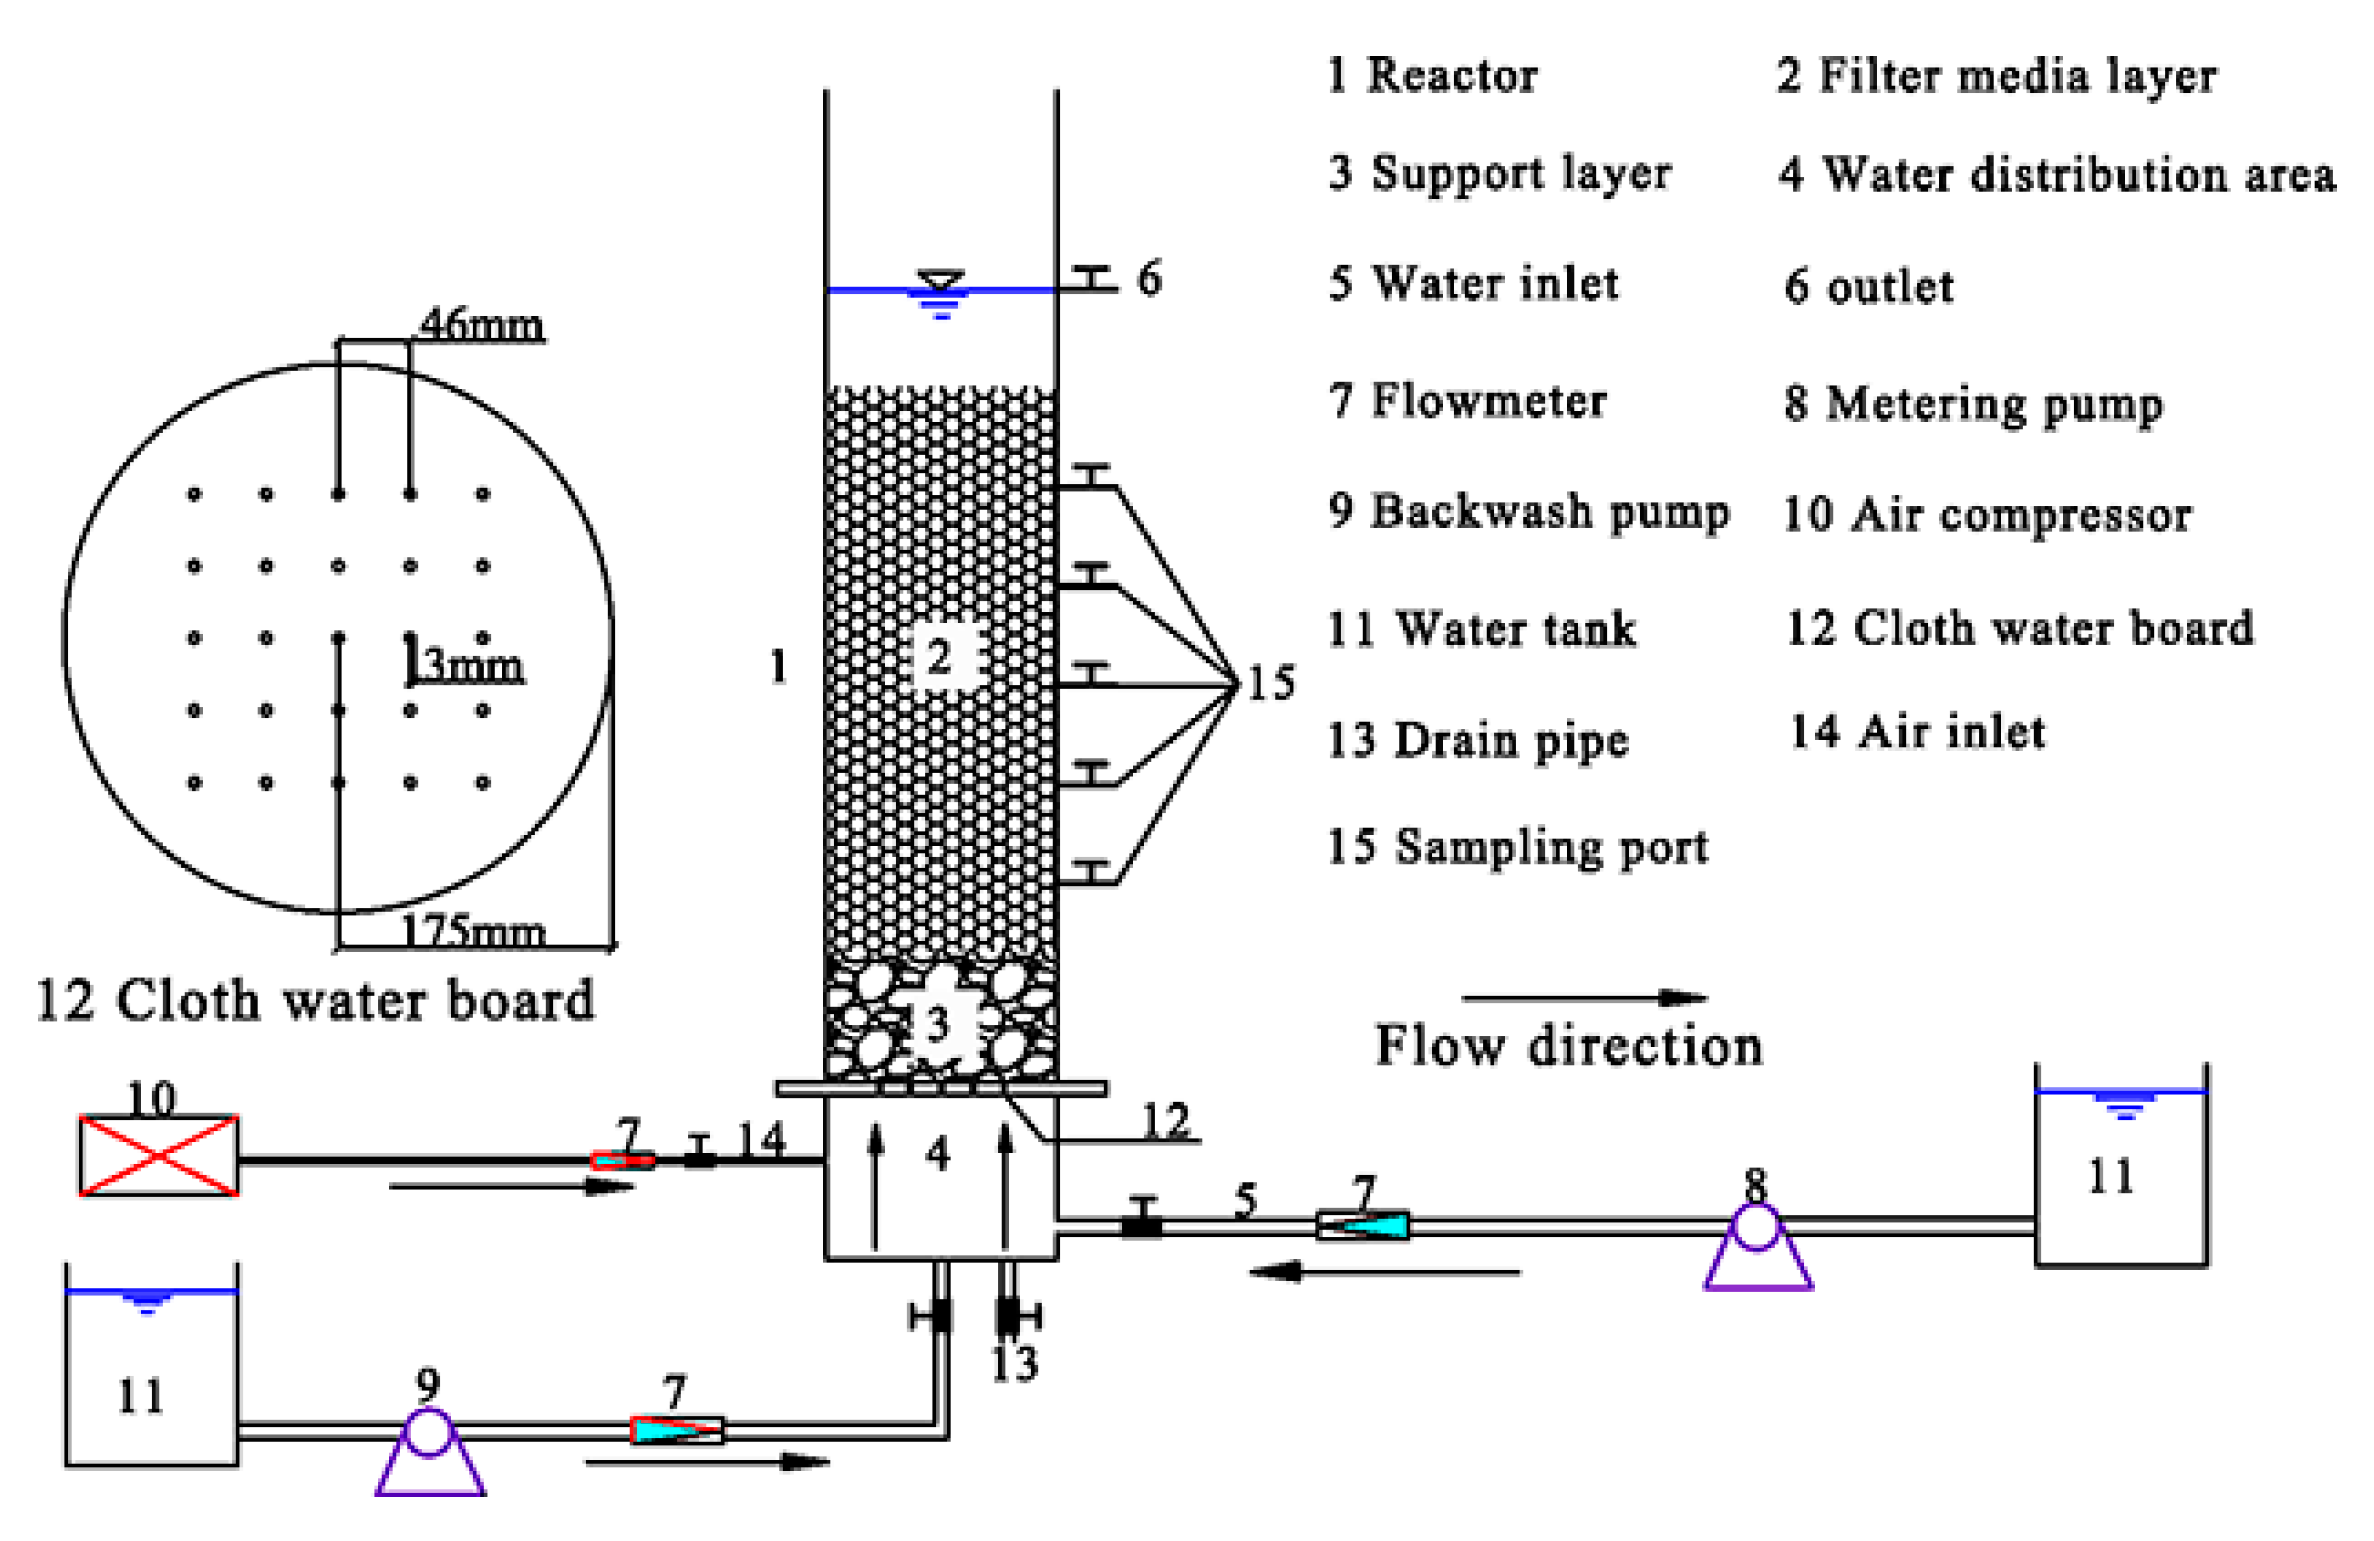
An up-flow BAF reactor is presented in Figure 1. The reactor was designed with a height of 1470 mm and a diameter of 350 mm. The UBAF reactor included a support zone of 200 mm, formed by an accumulation of cobble with a diameter of 10–30 mm and a height of 200 mm. The upper layer of the support zone consisted of ceramist material with an effective diameter of 3–5 mm and a void ratio of 0.43. The height of filter media layer was 850 mm. The perforated plate was used to ensure the distribution of the water and air inside the reactor at the bottom of the support zone. The top of filter media layer was set to a water zone of 150 mm. Six sampling ports were designed along the depth of the reactor at 100–150 mm intervals. The air was introduced into the reactor via air compressor, which was installed at a 150 mm depth. A flow meter (LZB-4, Yin Huan, Changzhou, China) was used to determine the aeration rate. A mechanical diaphragm pump (GM0090PR9 (6) MNN, Nan fang Pump, Hangzhou, China) was applied to pump the synthetic wastewater into the bottom of the reactor.
2.2 Inoculated Sludge and Synthetic Wastewater
The UBAF reactor received synthetic wastewater. The synthetic wastewater was composed of tap water with a mixed of C6H12O6 (carbon source), NH4Cl and KNO3 (nitrogen source), K3PO4.3H2O (phosphorus source), and Ca2+, Mg2+, Na+, and Fe3+ (trace elements source). Inoculated sludge was collected from the secondary sedimentation tank (Xi’an third wastewater plant, Xi’an). The activated sludge was cultivated after collection as following: Firstly, we cultivated sludge in a 60 L water tank fed with C6H12O6 (800 mg/L), NH4Cl (35 mg/L), KNO3 (8 mg/L), K3PO4 (8 mg/L), Ca2+ (20 mg/L), Mg2+ (25 mg/L), Na+ (110 mg/L), and Fe3+ (1.5 mg/L) at 20 ± 3 °C; then, aerated them with air compressor for 6 h every day to obtain the target object. Finally, the activated sludge was cultivated for one week with daily replacement of the nutrient medium.
During both phases of start-up and biofilm culture in the UBAF reactor, the ratio of carbon, nitrogen, and phosphorus source in the experimental wastewater was 100:5:1 (C: 200 mg/L; N: 15 mg/L; P: 3 mg/L). In order to analyze the performance of the UBAF reactor, the synthetic wastewater in the simulation of experimental phase was based on the contamination levels of domestic wastewater. The carbon, nitrogen and phosphorus concentrations of experimental wastewater were 200–300 mg/L, 34–48 mg/L (NH4+-N: 30–40 mg/L; NO3−-N: 4–8 mg/L), and 4–6 mg/L, respectively. The trace elements concentration of Ca2+, Mg2+, Na+, and Fe3+ in experimental wastewater were 20 mg/L, 25 mg/L, 110 mg/L, and 1.5 mg/L, respectively. The pH level in synthetic wastewater ranged between 7 and 9.
2.3 Operation of The Up-Flow BAF
The operation of the UBAF consisted of three phases: (i) Reactor start-up; (ii) biofilm culture; and (iii) simulation experiment. Firstly, the rapid method of activated sludge was used during the phases of reactor start-up and biofilm formation. The domesticated activated sludge (a week) was diluted to 5000 mg/L on MLSS and fed to the filter media above 30 cm in the UBAF reactor. Then, the reactor was let to stand for one day. Later on, the reactor operated at an aeration rate of 80 L/h for three days. At every night, the supernatant was drained from the system, and an equal volume of synthetic wastewater (C:N:P = 100:5:1) was fed to the UBAF reactor. Next, the reactor began to feed continuously at a small waterflow of 5 L/h and gradually reached the design flow rate (12 L/h) after a week. In addition, the reactor was continuously fed with synthetic wastewater (C:N:P = 100:5:1) until the COD, NH4+-N removal in the effluent achieved steady-state. Finally, the experiment was set up to studying the removal efficiency of pollutants at different aeration rates and filter media heights. The COD, NH4+-N, NO3−-N, and TP in samples were analyzed to study the pollutants removal in the UBAF reactor. The aeration rates were set at 40 L/h to 90 L/h, the waterflow rate was kept at 12 L/h, and the HRT was kept at 5 h. The reactor operated at room temperature (12 ± 3 °C).
2.4 Chemical Analysis
The samples were collected to analyze the pollutants removal at the influent, effluent, and different filter media height in the UBAF reactor. The DO, pH, and temperature in the water samples were detected with an HQ d Portable Meter (HQ30d, HACH, New York, NY, USA). Before conducting other measurements, the water samples were filtered through qualitative filter paper (Xinxingφ12.5cm, Hangzhou, China). The levels of NH4+-N and NO3−-N were determined using a UV spectrophotometer (DR5000, HACH, New York, NY, USA) at 420 nm for NH4+-N, 220 nm and 275 nm for NO3−-N according to standard methods. TP was measured using an ammonium molybdate spectrophotometric at 700 nm. COD was analyzed using the standard potassium dichromate method with a Speed Digester (DRB200, HACH, New York, NY, USA).
2.5 Microbial Community Analysis
Biofilm samples at the different aeration rates (40 L/h, 65 L/h, 90 L/h) and filter media heights (10 cm, 40 cm, 70 cm) were collected when the UBAF reactor had a relatively stable operation. The Power Biofilm™ DNA Isolation kit for biofilm (MOBIO, Carlsbad, CA, USA) was used to extract the DNA. The extracted steps reference the instructions of manufacturer. Biofilm samples were firstly weighed out 0.02 g to 0.2 g and place it into a 2 mL collection tube using a pipette tip so that removing excess liquid. Next, breaking the cell wall and DNA purification were carried out according to operation steps on the kit. Nano Drop Spectrophotometer (DC2000, Thermo Scientific, Waltham, MA, USA) and Electrophoresis (DYY-6C, Beijing, China) were used to detect the extracted DNA concentrations and purity. The DNA samples were stored at −20 °C until further analysis. Then, the gene amplification of DNA was performed via the polymerase chain reaction (PCR) (2720, ABI) using the primers 515F (5′-GCACCTAAYTGGGYDTAAAGNG-3′) and 907R (5′-TACNVGGGTATCTAATCC-3′) which corresponded to the V4 domain of bacterial 16S rRNA genes. After that, the amplified DNA was sequenced in Illumina Hiseq 2000 platform from Shanghai Personal Biotechnology Co., Ltd (Shanghai, China).
2.6 Statistical Analysis
SPSS 22.0 for Windows (SPSS Inc., Chicago, IL, USA) was used for statistical analyses. Pearson correlation analysis was performed to determine the relationships between the pollutants removal, aeration rates, and filter media heights. The significance levels used were p < 0.05 * and p < 0.01 **. R presented the correlation coefficient.
3. Results and Discussion
3.1. Performance of UBAF Reactor
3.1.1. The Effect of Aeration Rates of COD Removal
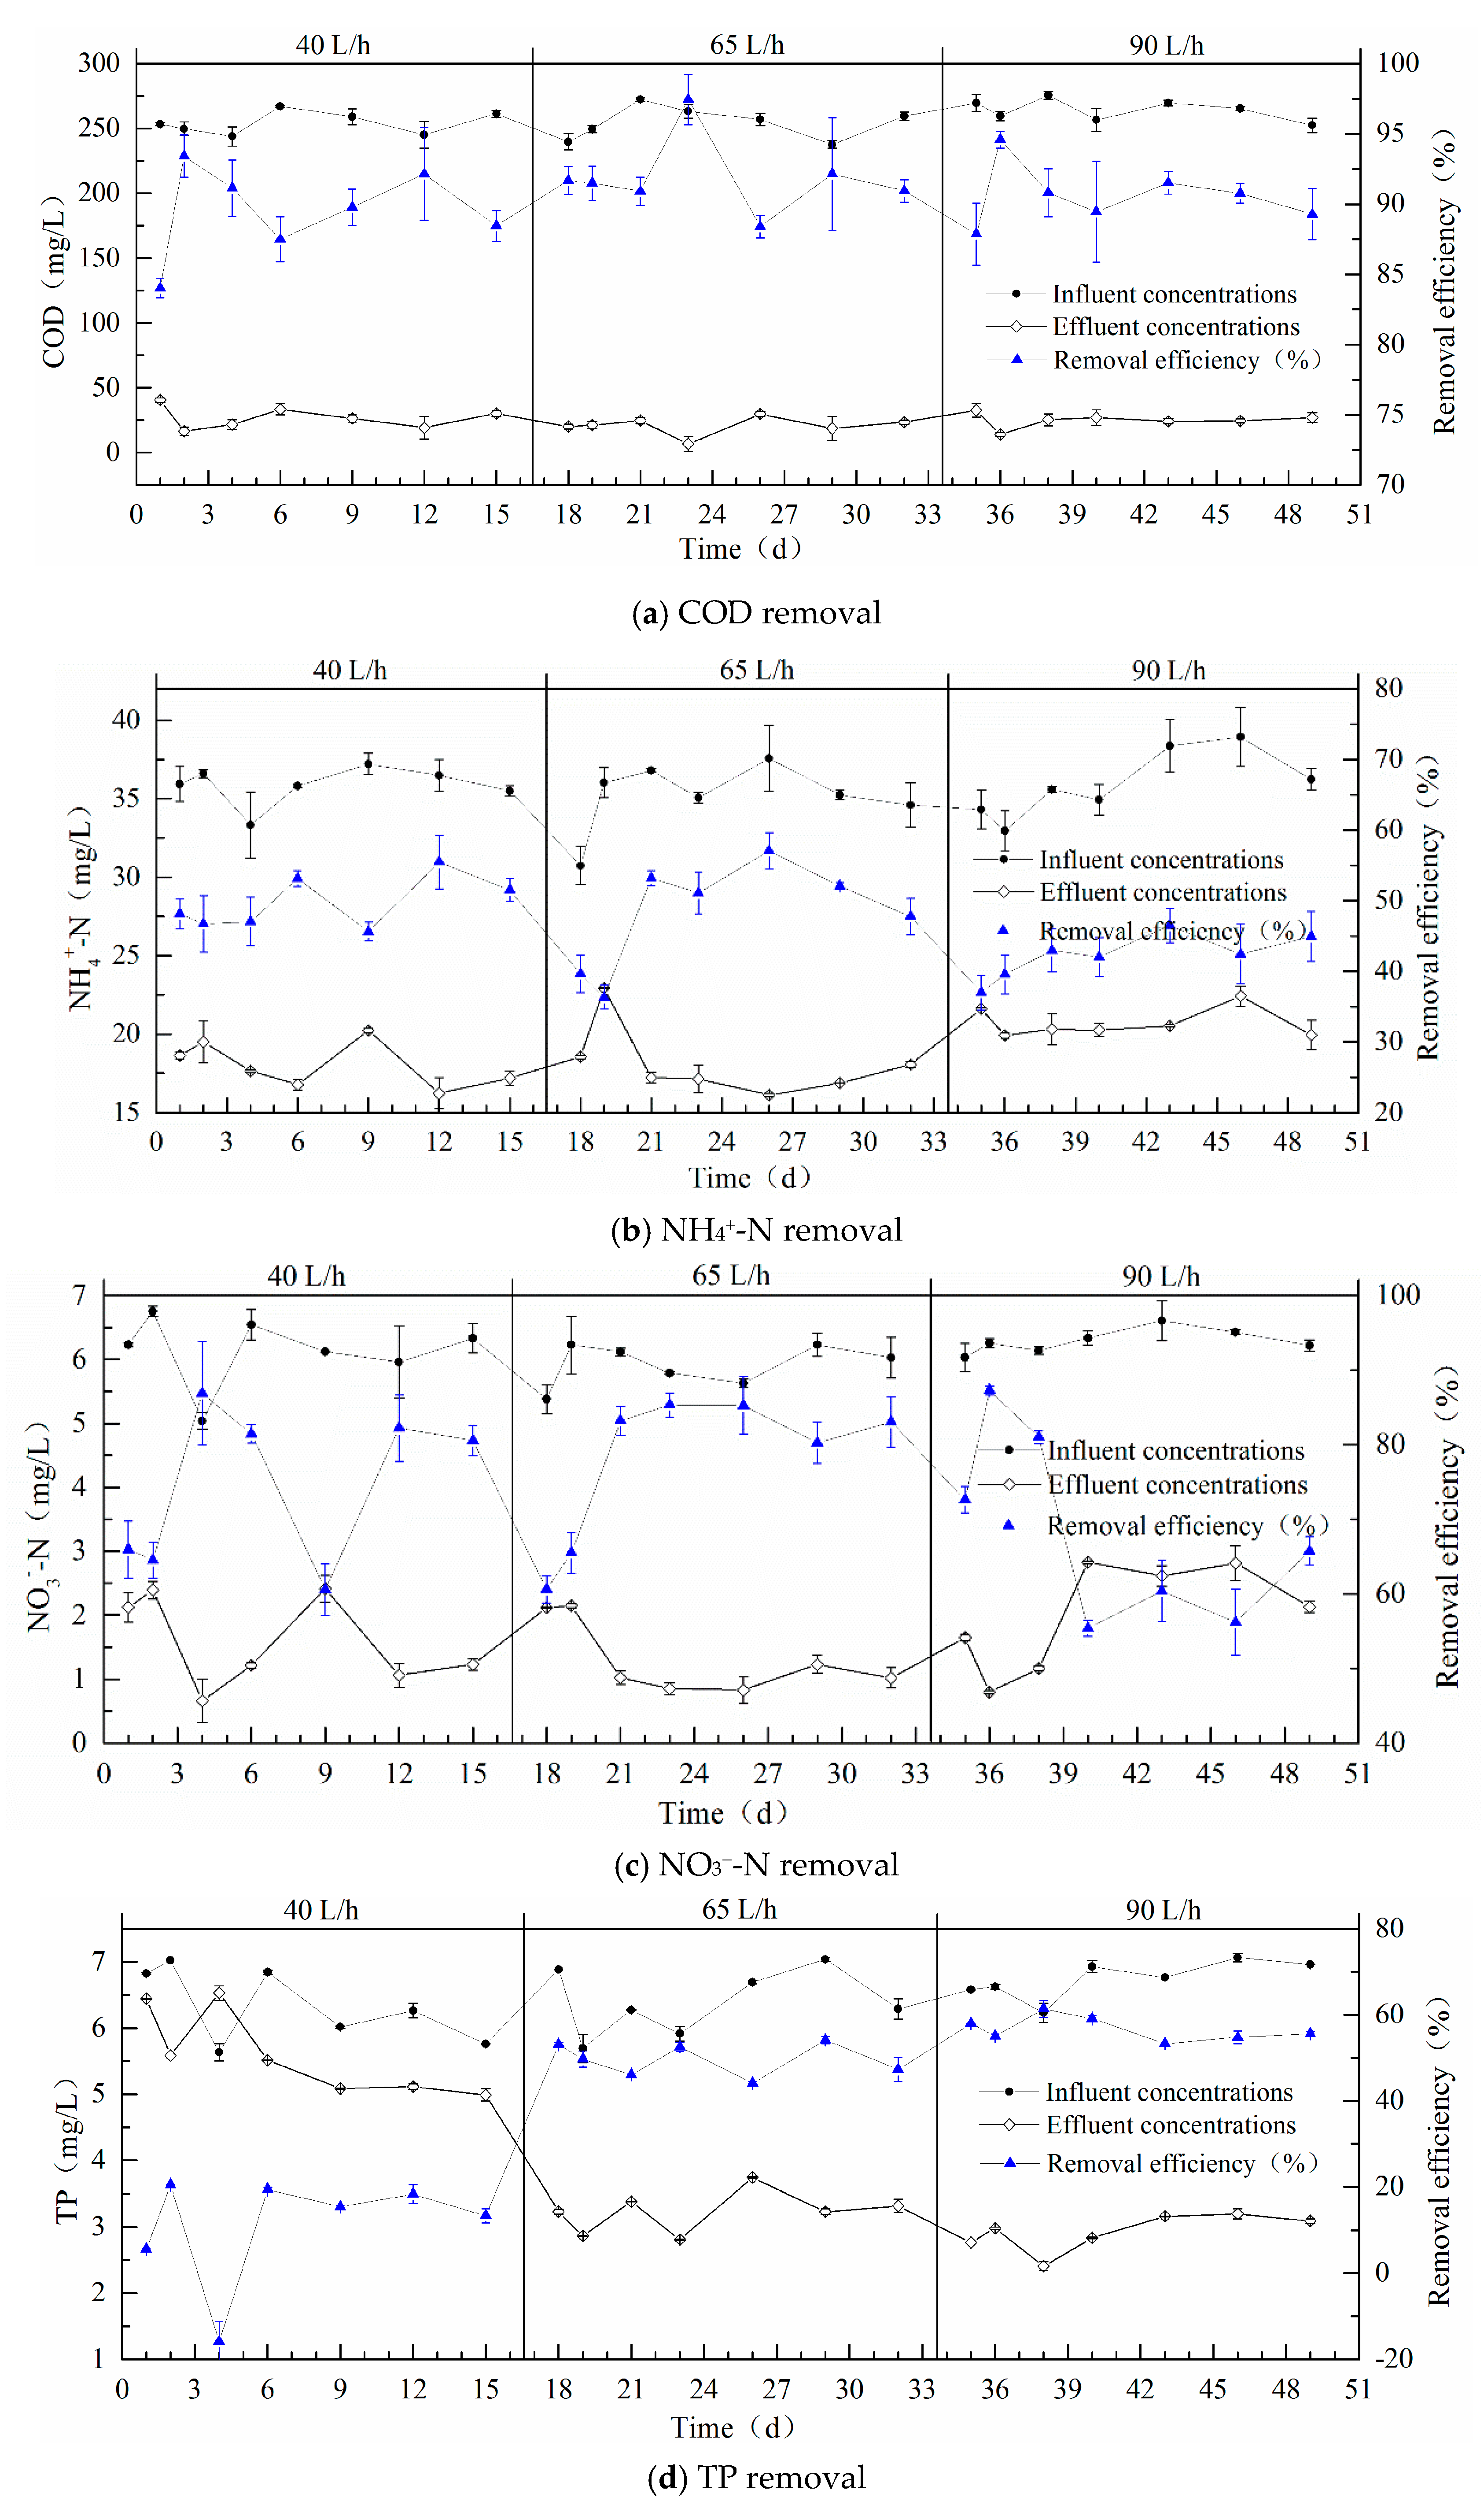
Figure 2 shows the levels of COD, NH4+-N, NO3−-N, and TP removal at various aeration rates in the UBAF reactor. In Figure 2a, the average concentration of COD in influent and effluent were 257.47 ± 17.99 mg/L and 23.38 ± 9.34 mg/L, respectively. The effluent concentration of COD was 50 mg/L based on the China standard limit. The COD removal efficiency did not show apparent fluctuations (R = 0.169, p = 0.464) with the increase in aeration rates (from 40 L/h to 90 L/h). The average removal efficiencies of COD at aeration rates of 40 L/h, 65 L/h and 90 L/h were 89.49%, 91.86%, and 90.61%, respectively. The small difference in COD removal efficiency could be interpreted simply by different degree of denitrification which consumes organic carbon. The result was consistent with previous research [3,5,8]. Tao et al. [5] found that COD removal efficiency reached to 89.38 ± 1.04% in the reactor. Hasan et al. [3,9] showed the insignificant effect of different aeration rates (Q ≥ 3 L/h). Thus, the UBAF reactor demonstrated a good treatment efficiency on COD removal.
3.1.2. The Effect of Aeration Rates of Nitrogen Removal
The values of NH4+-N and NO3−-N represent the main components of nitrogen and reflect the removal and transformation of nitrogen. In Figure 2b,c, the aeration rates had a negative correlation with the NH4+-N (R = −0.524, p = 0.014) and NO3−-N (R = −0.232, p = 0.312) removal. The removal efficiencies of NH4+-N and NO3−-N reached 55.48% and 86.89%, respectively, at lower aeration rate (40 L/h). The effluent concentrations of NH4+-N and NO3−-N were 18.03 mg/L and 1.59 mg/L, respectively. However, when we increased the aeration rate to 65 L/h, the average removal efficiencies of NH4+-N and NO3−-N changed little. At an aeration rate of 90 L/h, the removal efficiencies of NH4+-N and NO3−-N reduced to 46.48% and 59.43%, respectively, with effluent concentrations of 20.71 mg/L and 3.0 mg/L for these two components. NH4+-N removal presented lower values than those obtained from previous studies [3,5,9]. The nitrogen removal might be related to the biomass loss. Because the high aeration rate could result from the lower density of microbes in the reactor caused by the sludge run off in the BAF system. In the other hand, the microbial community structure determined the nitrogen removal efficiency.
3.1.3. The Effect of Aeration Rates of Phosphorus Removal
Obviously, the aeration rates had a significantly positive correlation (R = 0.873, p = 2.39 × 10⁻⁷) with TP removal efficiency in Figure 2d. The lower aeration rate removed 20.50% of TP. Under an aeration rate of 65 L/h, the TP removal significantly increased and reached 49.56 ± 5.45%. When the aeration rates increased to 90 L/h, The TP removal increased 56.74 ± 3.44% and was higher than at other aeration rates. Phosphorus removal mainly relates to the biomass production in the UBAF. The higher aeration rate might make more biomass split away off the ceramic surfaces and discharge with effluent water. Wang et al. [12] showed that the traditional BAF only achieved the phosphorus removal efficiency of 9.3%. Thus, TP removal in our study was higher than in previous research [12,13]. In addition, the TP concentrations in influent maintained at 6.50 ± 0.57 mg/L. The effluent concentrations were 5.61 ± 0.62 mg/L, 3.22 ± 0.42 mg/L, and 2.92 ± 0.51 mg/L at different aeration rates (from 40 L/h to 90 L/h), respectively. This TP concentration represented values in effluent higher than the standard discharge value (0.5 mg/L), as required by the Emission Standard of Pollutants, in China. Phosphorus hardly achieves this discharge standards by only relying on the traditional BAF process [12]. The result was consistent with previous research [12,17]. Then, to improve removal of phosphorus, some researchers achieved partial precipitation of phosphorus by dosing the Fe2+ or Fe3+ into the BAF [17]. In the future, we would further analyze the effect of aeration on the biomass suspension characteristics in order to understand the removal mechanism of TP.
3.2. Pollutants Removal at Different Filter Media Heights
3.2.1. The COD Removal at Different Filter Media Heights
Figure 3 shows the results of COD removal at different filter media heights. The COD removal had a significantly positive correlation (R = 0.910, p = 1.60 × 10⁻⁷) with the filter media heights. The COD removal mainly occurred at the bottom of filter media layer. COD removal efficiency at 0–25 cm height of filter media reached 81.9 ± 3.60%, 73.34 ± 1.46%, and 81.22 ± 3.41% at aeration rates of 40 L/h, 65 L/h, and 90 L/h, respectively. However, at 25–85 cm height of filter media, the removal efficiency only reached lower values, 7.59%, 18.52%, and 9.39% at aeration rates of 40 L/h, 65 L/h, and 90 L/h, respectively. These changes in removal efficiency likely reflected the differences in the organic matter concentration at different heights. The layer at 25–85 cm height concentrated lower levels of organic matter when compared with the bottom of filter media layer. The high organic matter condition might lead to the microorganism abundance increasing, similar to the findings in previous studies [11,18].
Table 1 shows the distribution of dissolved oxygen (DO) concentrations at different filter media heights. DO concentrations in influent and effluent were significantly higher those at the filter media layer, and distributed in the range of 8.0–9.21 mg/L. In addition, as the aeration rates increased, the DO concentration of the filter media layer presented a decreasing then increasing trend. The DO concentration was determined by oxygen diffusion from bubbles to water and oxygen consumption by microbes in the BAF. The lower DO concentrations at an aeration rate of 65 L/h could be interpreted by the higher abundance and activity of aerobic microbes under this condition. Thus, the COD removal at an aeration rate of 65 L/h was differed from the aeration rates of 40 L/h and 90 L/h. According to the results in Section 3.1, we found that the aeration rates could achieve a higher pollutants removal.
3.2.2. The Nitrogen Removal at Different Filter Media Heights
Figure 4 shows the results of NH4+-N and NO3−-N removal at different filter media heights. NH4+-N removal had a significantly positive correlation (R = 0.933, p = 1.73 × 10⁻⁸) with the filter media heights in Figure 4a. At 0–25 cm height of filter media, the filter removed more NH4+-N than those observed under other filters. At 25–85 cm height of filter media, when filter media heights increased by 15 cm, the rate of NH4+-N removal remained constant that were 5.02%, 4.15%, and 3.56% at different aeration rates, respectively. The results were mainly related to the supply of DO and the distribution of organic matter. However, the NO3−-N removal showed a significantly negative correlation (R = −0.817, p = 3.52 × 10⁻⁵) with the filter media heights and differed from the NH4+-N removal in Figure 4b. The removal efficiency of NO3−-N reached 94.85 ± 3.95% at filter media height of 0–10 cm. At 10–25cm height of filter media, NO3−-N removal efficiency did not change. NO3−-N removal tend to decrease at 25–85 cm height of filter media. The NO3−-N removal occurred as result of the biological denitrification process in the UBAF. The low DO concentrations (less than 0.5 mg/L) induced to the denitrification process [4]. Table 1 also showed that DO concentrations at the bottom of filter media remained lower than that observed under other layers. Therefore, the DO distribution likely explained the NO3−-N removal. In addition, aeration rate did not affect the removal of nitrogen at different filter media heights significantly. The aeration rates of 40 L/h and 65 L/h removed NH4+-N and NO3−-N more efficiently than the aeration rate of 90 L/h. Previous researches with BAF system also reported similar results of NH4+-N and NO3−-N removal [19].
3.2.3 The Phosphorus Removal at Different Filter Media Heights
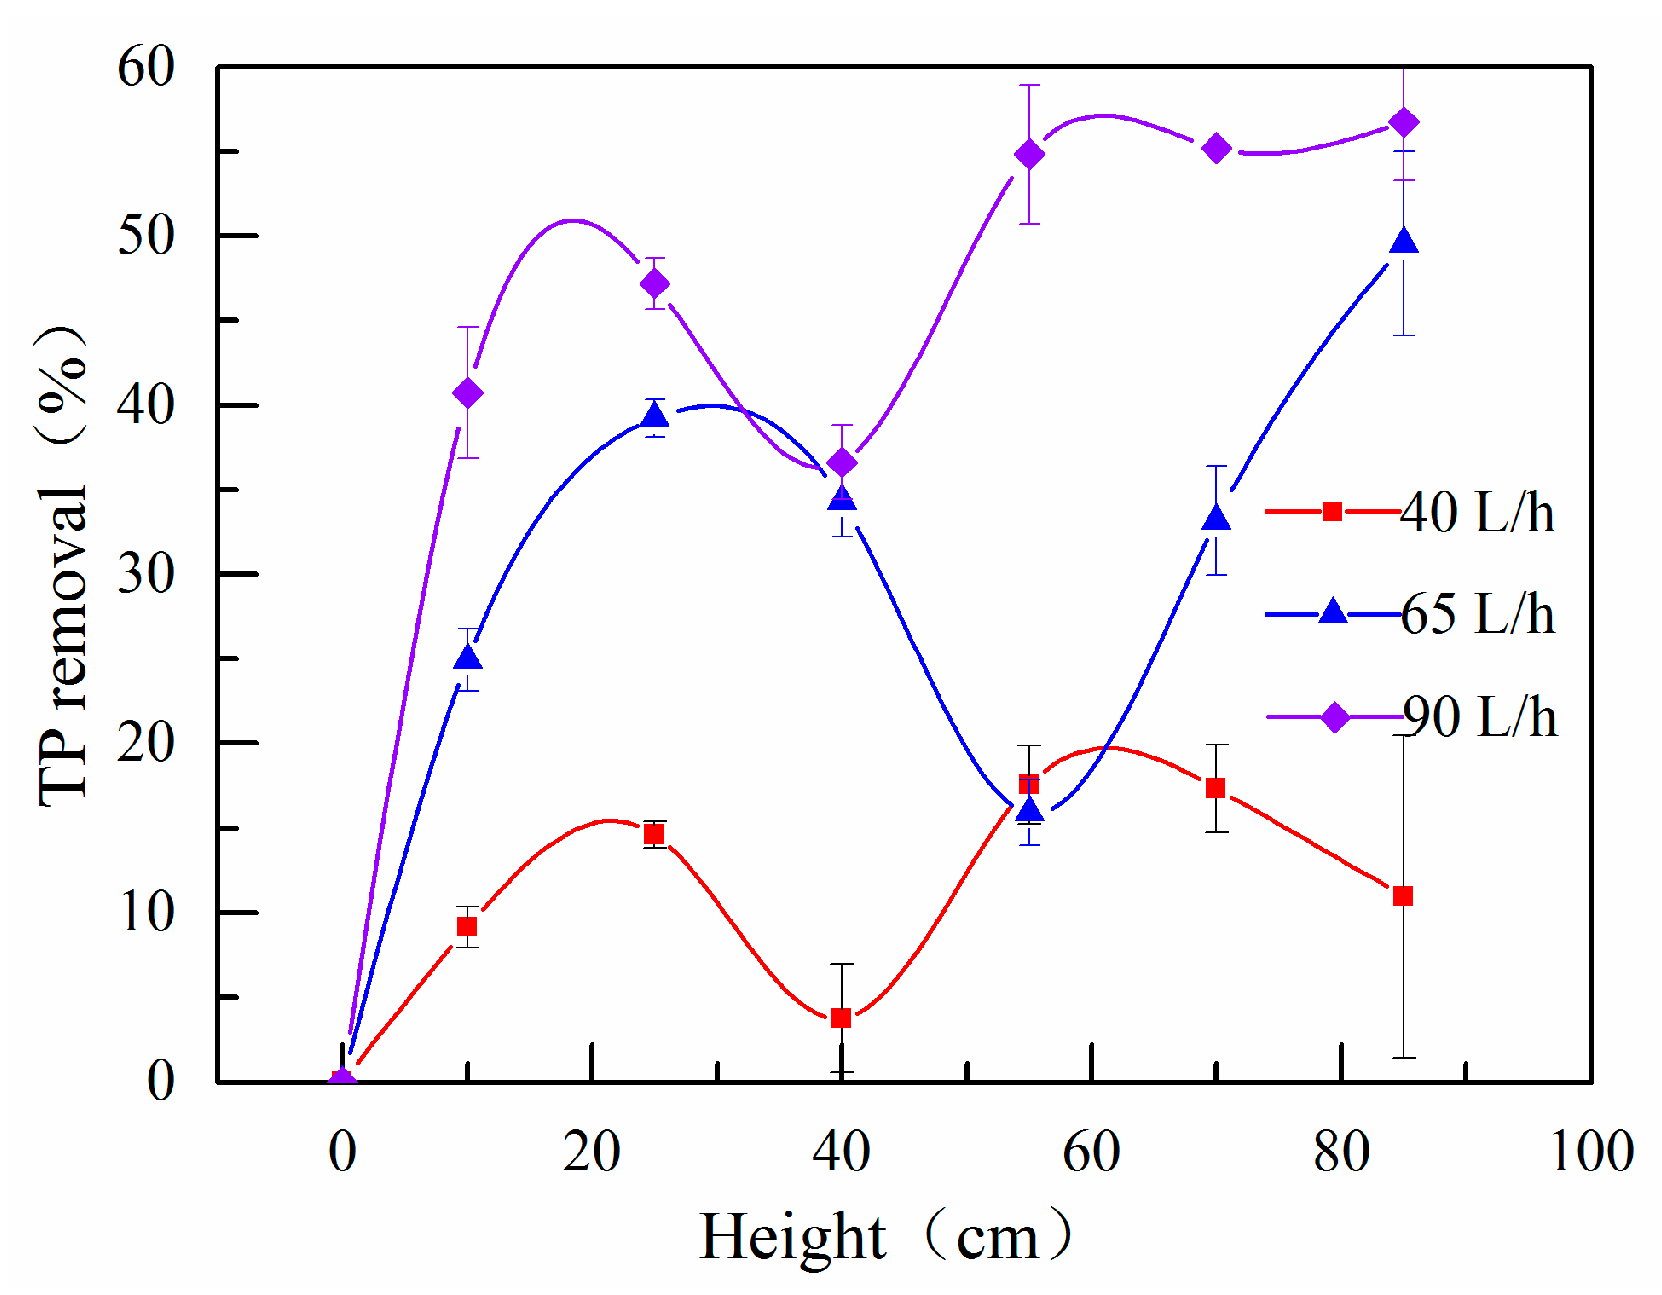
Figure 5 shows the TP removal at different filter media heights. The TP removal had a poor correlation (R = 0.231, p = 0.357) with the filter media heights. The amount of TP removal oscillated as the filter material increased, whereas, the removal efficiency at high aeration rates reached higher values. The result related to the biomass loss. The low aeration rate removed only 10.98 ± 9.53% of TP removal in effluent. The reduction of TP removal occurred at 25–45 cm and 55–85 cm heights of filter media. When the aeration rate increased to 65 L/h, TP removal significantly improved but reduced at 25–40 cm height of filter media. Under an aeration rate of 90 L/h, TP removal continued to increase. The removal efficiency essentially remained unchanged at 55-85 cm height of filter media. The highest removal efficiency reached 56.74 ± 3.44%. These results revealed that the higher aeration rate promoted TP removal, which suggested that the high aeration rate might reduce the microbial biomass loss. Therefore, we further investigated the diversity and evenness of the microbial community.
3.3. Diversity and Evenness of the Microbial Community
The diversity of the microbes for each sample are listed in Table 2. Libraries with samples were composed of 433 (40 L/h), 430 (65 L/h), 414 (90 L/h), 413 (10 cm), 476 (40 cm), and 458 (70 cm). The higher Chao1 and ACE index indicates a rich microbial community [20]. In addition, the Simpson and Shannon index informed both richness and evenness of microbial community [21]. Larger index values indicated higher evenness of microbial community. The total numbers of operational taxonomic units (OTUs) estimated by the Chao 1 estimator were 910 (40 L/h), 962 (65 L/h), and 895 (90 L/h), and the ACE estimator were 1340.01 (40 L/h), 1341.49 (65 L/h), and 1277.43 (90 L/h), indicating that the aeration rate of 65 L/h exhibited more the richness of microbial community. According to the Shannon index, the microbial community presented its highest evenness at an aeration rate of 65 L/h. The result verified the relevant inferences of nitrogen and phosphorus removal that were related to the biomass loss in high aeration rate. According to previous results, we found that the richness of microbial community at an aeration rate of 65 L/h might control removal efficiency of pollutants. In addition, diversity and evenness of microbial community at different filter media heights also differed significantly different at different aeration rates. Our findings also showed that at 70 cm height of filter media the microbial diversity reached its highest evenness, likely a consequence of the higher dissolved oxygen at the surface of filter media.
3.4. Comparative Analysis of Microbial Community
3.4.1. The Effect of Aeration Rates on Microbial Community
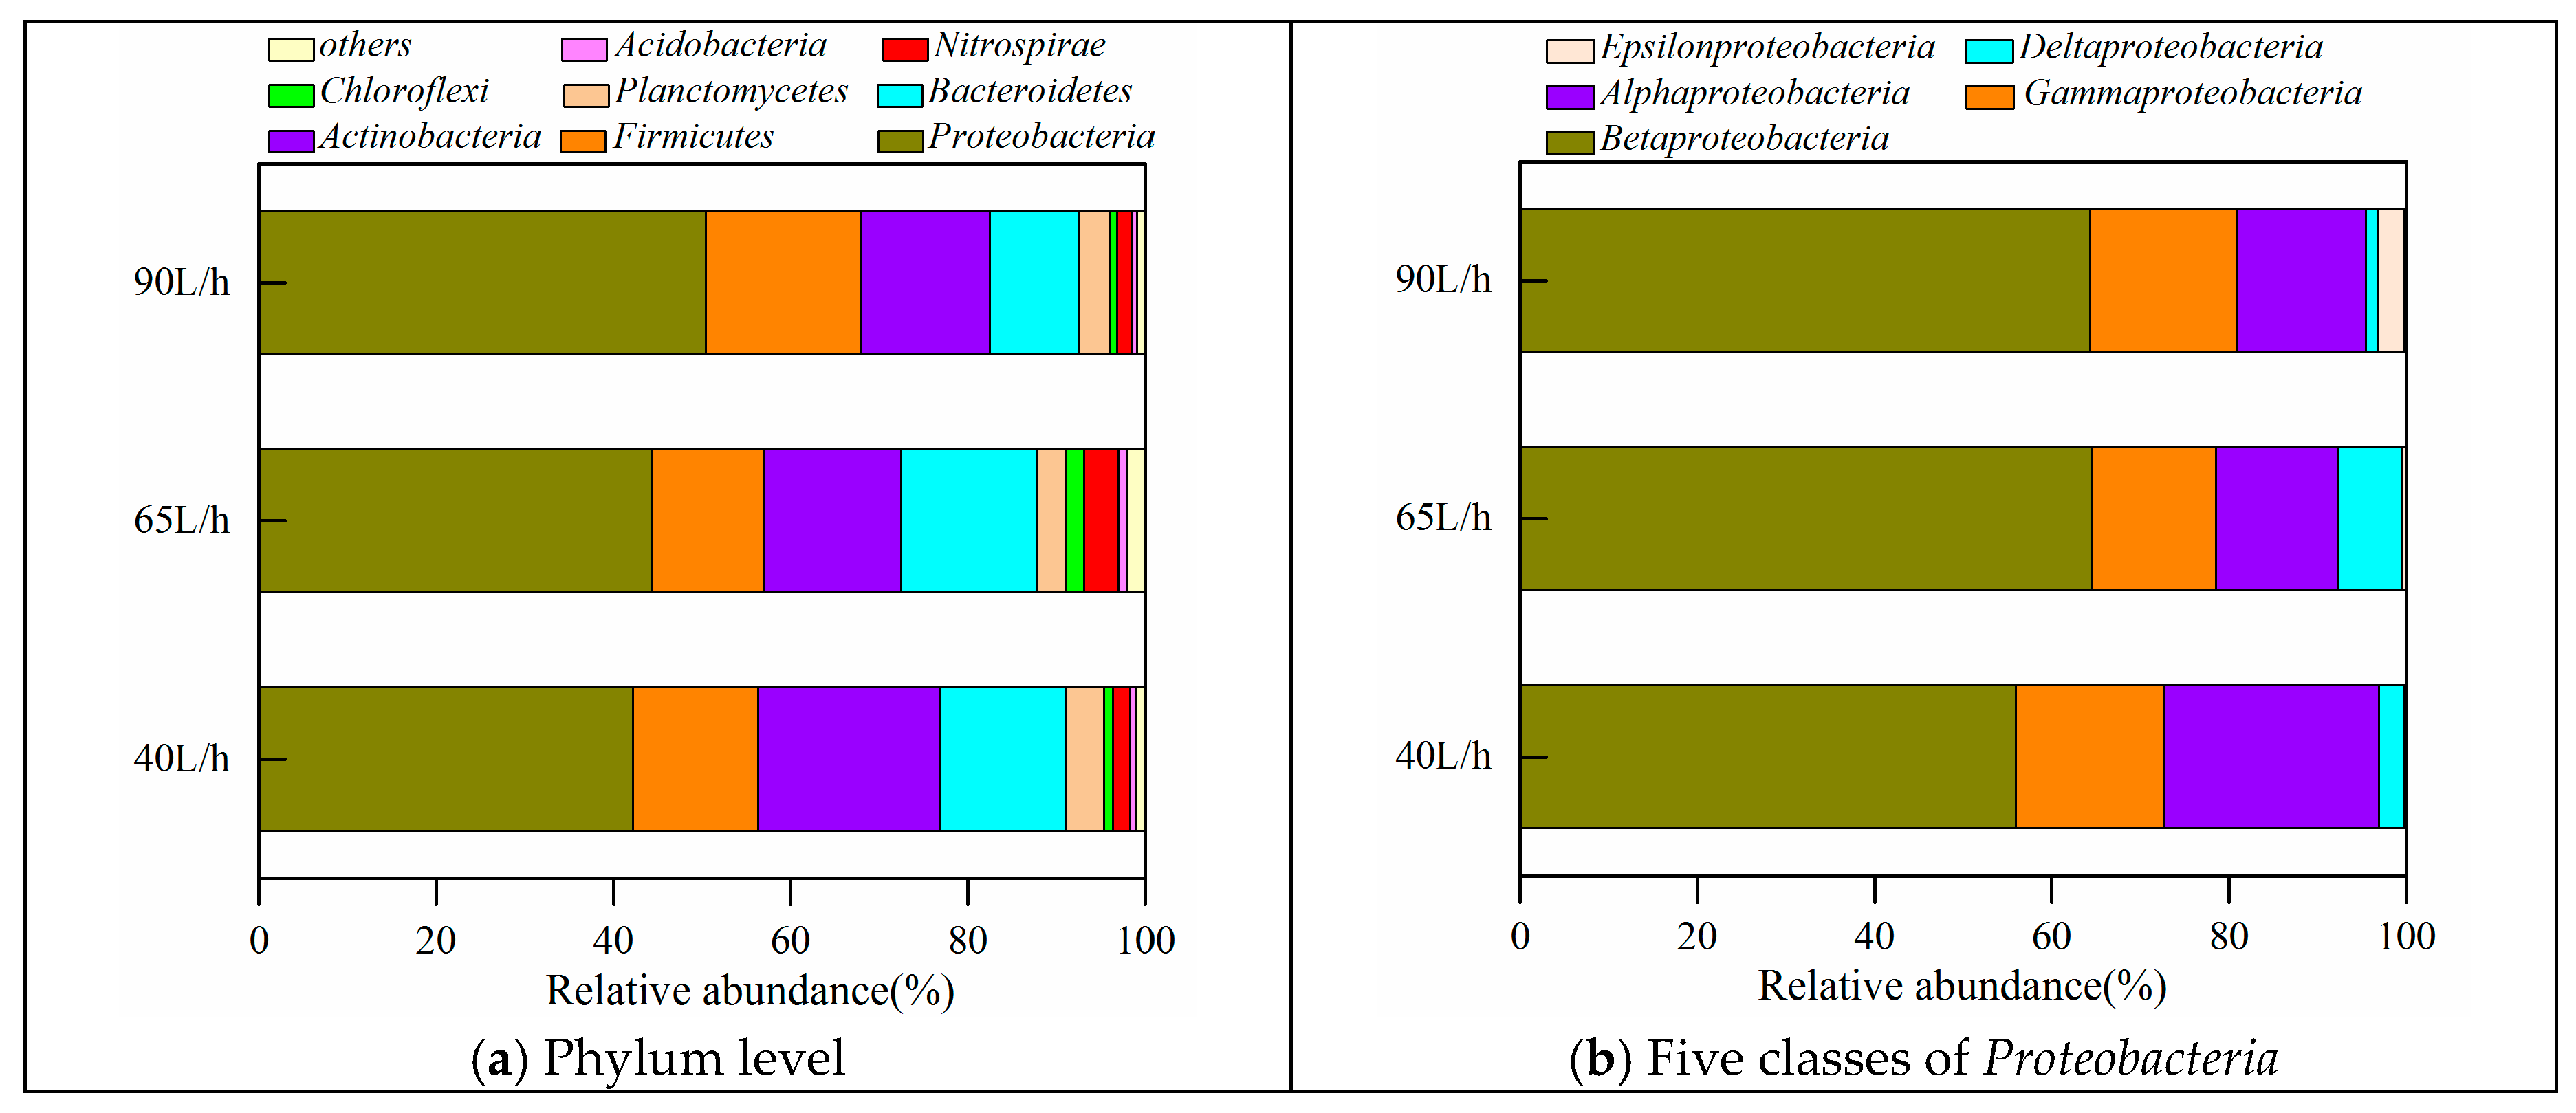
Figure 6 shows the relative abundance of microbial community at three taxonomic levels (phylum, class, and genus) at different aeration rates. Proteobacteria corresponded to the most abundant with abundance ranging between 42.2–50.4%, followed by Actinobacteria (14.5–20.5%), Firmicutes (12.7–17.6%), Bacteroidetes (10.0–15.3%), and Planctomycetes (3.3–4.4%) in Figure 6a. The aeration rates had an effect in the microbial community structure, indicating a microbial community structure more resistant to changes. Our study operated for 15 days at the same aeration rate, which might explain the similar distribution of microorganisms. The relative abundance of the Proteobacteria and Firmicutes increased following the changes in the aeration rates, likely compensated by the reduction of the Planctomycetes relative abundance. Previous research found that species of the Planctomycetes perform the anammox activity, which could convert directly NH4+-N into N2 [22]. However, these bacteria were more sensitive to the changing of dissolved oxygen. Under an aeration rate of 65 L/h, the relative abundance of Nitrospirae was 3.9%, higher abundance for this group. The presence of Nitrospirae indicated the existence of nitrite oxidizing bacteria (NOB) as they can oxidize nitrite to nitrate [23].
The Proteobacteria represents a dominant phylum, which can remove phosphorus and convert nitrite to nitrate in the wastewater biological treatment [5,16]. Therefore, we performed a further analysis of the Proteobacteria group. Figure 6b shows the five classes of Proteobacteria at different aeration rates and filter media heights. Betaproteobacteria predominated at different aeration rates and filter media heights. The results were consistent with previous research performed by Wang et al. [21] that reported Betaproteobacteria as the main supplier of protons and electrons during the growth and metabolism of phase. The aeration rates produced no significant effects on the microbial community structure.
3.4.2. The Effect of Filter Media Heights on Microbial Community
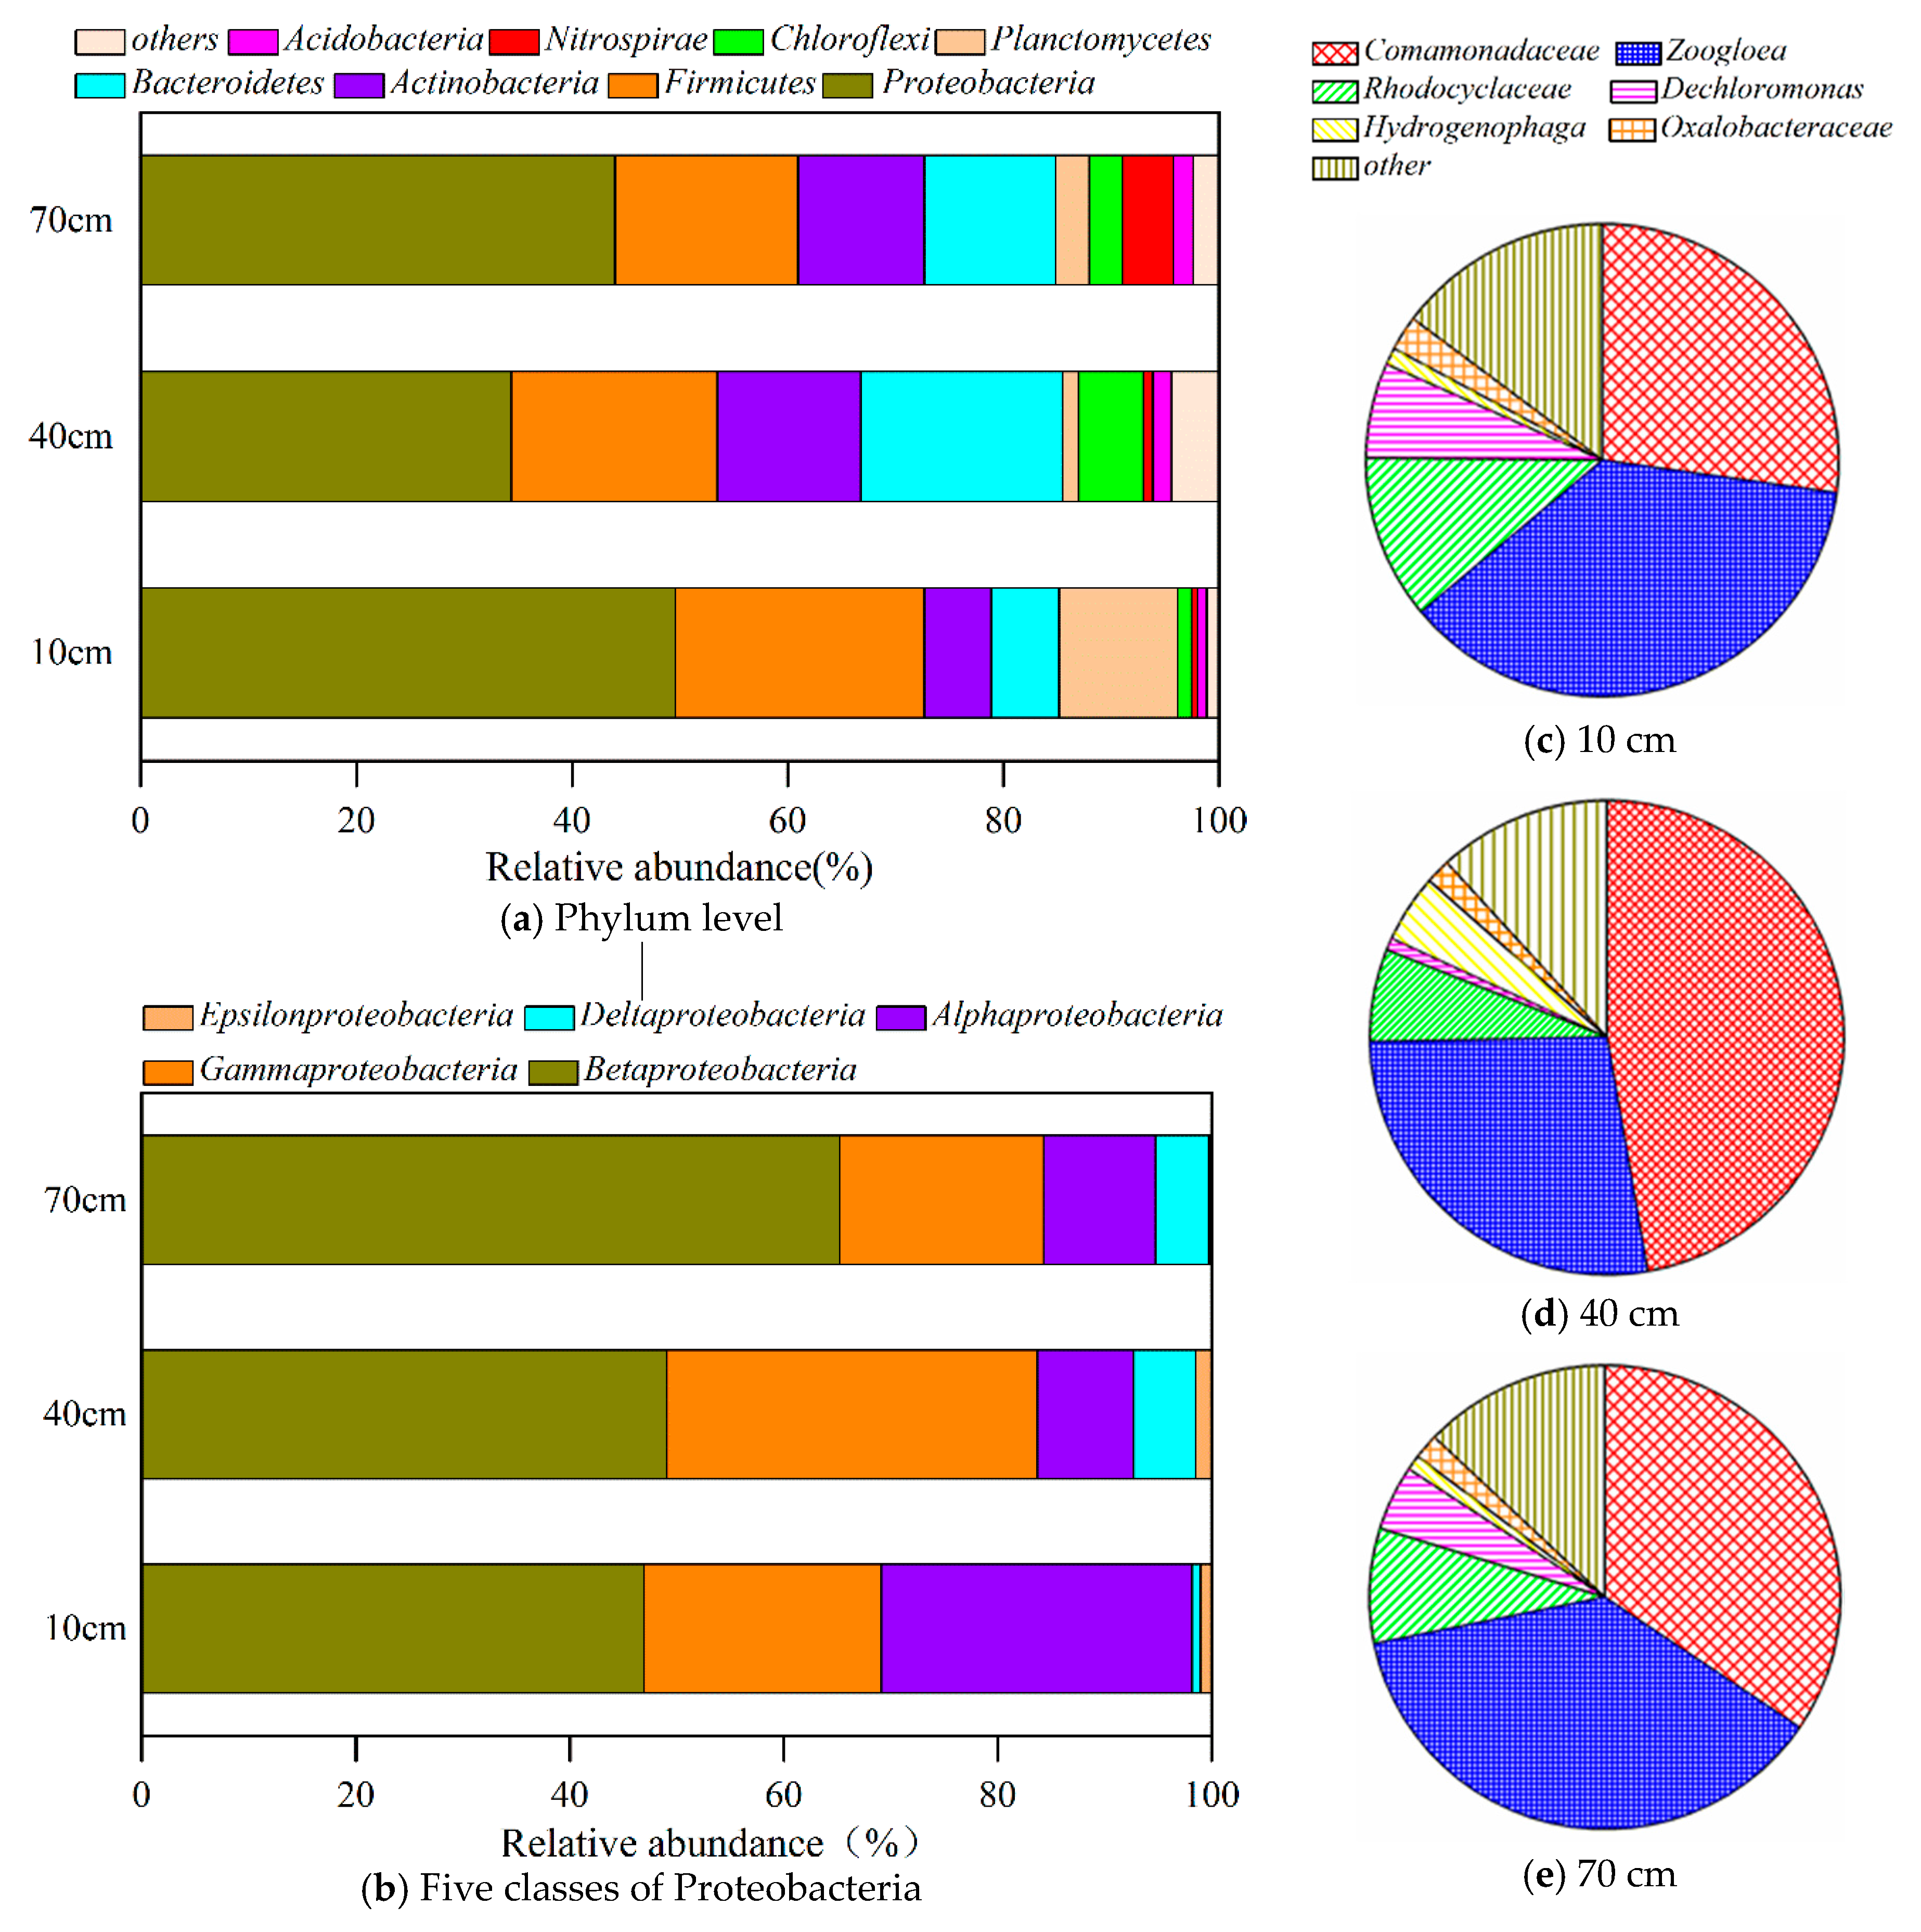
Figure 7 shows the microbial community composition at the phylum, class, and genus level at different filter media heights. The Proteobacteria represents a dominant phylum. The differences of microbial community distribution at different filter media heights were more obvious than at different aeration rates. The relative abundance of Proteobacteria (49.6%), Firmicutes (23.1%), and Planctomycetes (11.0%) peaked at 10 cm height of filter media. Moreover, in the COD test, we observed that the organic matter removal occurred mainly at 0–25 cm height of filter media. The organic matter distribution improved the growth and metabolism of microorganisms. According to the Section of 3.2.2, we found that nitrogen mainly removed at the bottom of filter media. The results showed that Planctomycetes could be responsible for the nitrogen loss and enhance the nitrogen removal. The microbial community is the primary responsible for the COD and nitrogen removal mechanism. The Bacteroidetes and Chloroflexi abundance peaked at 40 cm height of filter media. In addition, the relative abundance of Nitrospirae (4.7%) peaked at 70 cm height of filter media. The result explained why removal efficiency of NO3−-N showed a decreasing trend as the filter media heights increased (see Section 3.2.2).
Figure 7b shows the five classes of Proteobacteria at different filter media heights. Betaproteobacteria predominated at different filter media heights. The results were consistent with the result of different aeration rates. The relative abundance of the Alphaproteobacteria peaked at 10 cm height of filter media. The relative abundance of Alphaproteobacteria decreased as the dissolved oxygen increased (in Table 1), which suggested that the dissolved oxygen concentration promoted bacterial growth. Figure 7c–e shows the relative abundance of five classes of Betaproteobacteria at different filter media heights. The relative abundance of Comamonadaceae and Dechloromonas at 10 cm, 40 cm, and 70 cm heights of filter media responded to 48.93%, 33.73%, and 39.02% of the total microbial abundance, respectively. These bacterial groups represented the dominant denitrifying bacteria found in our study [24]. The results explained why nitrogen presented a high removal at the bottom of filter media. In addition, the relative abundance of Zooglea at different filter media height were 27.90%, 36.69%, and 37.28%, respectively. The bacteria might be more sensitive to the high dissolved oxygen. Notably, the relative abundance of Dechloromonas at different filter media heights were 0.86%, 6.51%, and 4.53%, from 10 cm to 70 cm, respectively. The bacteria were not only a denitrifying but also phosphate-accumulating microorganisms. The result is strictly related to the distribution of dissolved oxygen and pollutants. Our result showed that the microbial community structure explained the removal mechanism of COD, nitrogen, and phosphorus. However, it remains unclear which specific microorganisms played a role in the nitrogen and phosphorus removal. Therefore, further studies are necessary to explore the specific functional microbes of nitrogen and phosphorus in the UBAF system.
4. Conclusions
Our study demonstrated a close relationship between the microbial community structure and pollutants removal. Changes in the aeration rates influenced the nitrogen and phosphorus removal, but not COD. Specifically, we demonstrated that the continuous operation of an aeration rate of 65 L/h produced a stable, higher removal efficiency of COD, NH4+-N, NO3−-N, and TP. The results showed that optimizing the aeration rate can achieve efficient pollutant removal in an UBAF. The COD and NH4+-N removal occurred mainly at the bottom (0–25 cm) of the UBAF reactor. The presence of Planctomycetes (anammox bacteria), Nitrospirae (nitrifying), and Proteobacteria (nitrogen and phosphorus removal bacteria) indicated the presence of both nitrogen and phosphorus removal bacteria in the UBAF. In addition, we also observed a high relative abundance of the Comamonadaceae and Dechloromonas at 10 cm height of filter media. Our findings suggested these microbes likely responded for the nitrogen and phosphorus removal. However, the correlation of microbial community and pollutants removal remains unclear. Future studies should further explore the relationship between microorganisms and pollutants.
Author Contributions
J.R., W.C. and T.W. conceived of and designed the experiments. J.R., M.W., C.Z. performed the experiments. J.R. analyzed the data and wrote the paper.
Funding
This research was funded by the National Natural Science Foundation of China (51679192; 51709224), Key R & D Plan in Shaanxi Province (2017SF-392), and Shaanxi Provincial Department of Education Natural Science Special Project (15JK1525)
Acknowledgments
The authors thank the three referees and the editor for their supports to improve the quality of the manuscript.
Conflicts of Interest
The authors declare no conflict of interest.
References
- Yu, Q.; Huang, H.; Ren, H.; Ding, L.; Geng, J. In situ activity recovery of aging biofilm in biological aerated filter: Surfactants treatment and mechanisms study. Bioresour. Technol. 2016, 219, 403–410. [Google Scholar] [CrossRef] [PubMed]
- Liu, T.; Quan, X.; Li, D. Evaluations of biofilm thickness and dissolved oxygen on single stage anammox process in an up-flow biological aerated filter. Biochem. Eng. J. 2017, 119, 20–26. [Google Scholar] [CrossRef]
- Abu Hasan, H.; Sheikh Abdullah, S.R.; Tan Kofli, N.; Kamarudin, S.K. Effective microbes for simultaneous bio-oxidation of ammonia and manganese in biological aerated filter system. Bioresour. Technol. 2012, 124, 355–363. [Google Scholar] [CrossRef] [PubMed]
- Pramanik, B.K.; Fatihah, S.; Shahrom, Z.; Ahmed, E. Biological aerated filters (BAFs) for carbon and nitrogen removal: A review. J. Eng. Sci. Technol. 2012, 7, 428–446. [Google Scholar]
- Chen, T.; Peng, T.; Feng, C.; Chen, N.; Hu, Q.; Hao, C. The feasibility of an up-flow partially aerated biological filter (U-PABF) for nitrogen and COD removal from domestic wastewater. Bioresour. Technol. 2016, 218, 307–317. [Google Scholar] [CrossRef]
- Qiu, Y.; Zhang, C.; Li, B.; Li, J.; Zhang, X.; Liu, Y.; Liang, P.; Huang, X. Optimal Surface Aeration Control in Full-Scale Oxidation Ditches through Energy Consumption Analysis. Water 2018, 10, 945. [Google Scholar] [CrossRef]
- Wu, G.; Zheng, D.; Xing, L. Nitritation and N2O Emission in a Denitrification and Nitrification Two-Sludge System Treating High Ammonium Containing Wastewater. Water 2014, 6, 2978–2992. [Google Scholar] [CrossRef]
- Albuquerque, A.; Makinia, J.; Pagilla, K. Impact of aeration conditions on the removal of low concentrations of nitrogen in a tertiary partially aerated biological filter. Ecol. Eng. 2012, 44, 44–52. [Google Scholar] [CrossRef] [Green Version]
- Abu Hasan, H.; Sheikh Abdullah, S.R.; Kamarudin, S.K.; Tan Kofli, N.; Anuar, N. Simultaneous NH4+-N and Mn2+ removal from drinking water using a biological aerated filter system: Effects of different aeration rates. Sep. Purif. Technol. 2013, 118, 547–556. [Google Scholar] [CrossRef]
- Zou, Y.; Zhang, L.; Wang, L.; Zhang, S.; Yu, X. Effects of Aeration, Vegetation, and Iron Input on Total P Removal in a Lacustrine Wetland Receiving Agricultural Drainage. Water 2018, 10, 61. [Google Scholar] [CrossRef]
- Yang, K.; Yue, Q.; Kong, J.; Zhao, P.; Gao, Y.; Fu, K.; Gao, B. Microbial diversity in combined UAF-UBAF system with novel sludge and coal cinder ceramic fillers for tetracycline wastewater treatment. Chem. Eng. J. 2016, 285, 319–330. [Google Scholar] [CrossRef]
- Wang, H.; Dong, W.; Li, T.; Liu, T. Enhanced synergistic denitrification and chemical precipitation in a modified BAF process by using Fe2+. Bioresour. Technol. 2014, 151, 258–264. [Google Scholar] [CrossRef] [PubMed]
- Wu, C.Y.; Zhou, Y.X.; Wang, Y.; Guo, M.K. Innovative combination of Fe2+-BAF and ozonation for enhancing phosphorus and organic micropollutants removal treating petrochemical secondary effluent. J. Hazard. Mater. 2017, 323, 654–662. [Google Scholar] [CrossRef] [PubMed]
- Zhang, M.; Yang, Q.; Zhang, J.; Wang, C.; Wang, S.; Peng, Y. Enhancement of denitrifying phosphorus removal and microbial community of long-term operation in an anaerobic anoxic oxice-biological contact oxidation. J. Biosci. Bioeng. 2016, 122, 456–466. [Google Scholar] [CrossRef] [PubMed]
- Fish, K.; Osbornc, A.M.; Boxall, J.B. Biofilm structures (EPS and bacterial communities) in drinking water distribution systems are conditioned by hydraulics and influence discolouration. Sci. Total Environ. 2017, 593–594, 571–580. [Google Scholar] [CrossRef] [PubMed]
- Isanta, E.; Bezerra, T.; Fernández, I.; Suárez-Ojeda, M.E.; Pérez, J.; Carrera, J. Microbial community shifts on an anammox reactor after a temperature shock using 454-pyrosequencing analysis. Bioresour. Technol. 2015, 181, 207–213. [Google Scholar] [CrossRef] [PubMed] [Green Version]
- Zhang, Z.; Wang, Y.; Leslie, G.L.; Waite, T.D. Effect of ferric and ferrous iron addition on phosphorus removal and fouling in submerged membrane bioreactors. Water Res. 2015, 69, 210–222. [Google Scholar] [CrossRef] [PubMed]
- Bao, T.; Chen, T.; Tan, J.; Wille, M.L.; Zhu, D.; Chen, D.; Xi, Y. Synthesis and performance of iron oxide-based porous ceramsite in a biological aerated filter for the simultaneous removal of nitrogen and phosphorus from domestic wastewater. Sep. Purif. Technol. 2016, 167, 154–162. [Google Scholar] [CrossRef]
- Wang, X.; Han, J.; Chen, Z.; Jian, L.; Gu, X.; Lin, C.J. Combined processes of two-stage Fenton-biological anaerobic filter–biological aerated filter for advanced treatment of landfill leachate. Waste Manag. 2012, 32, 2401–2405. [Google Scholar] [CrossRef] [PubMed]
- Zhao, C.; Xie, H.; Xu, J.; Xu, X.; Zhang, J.; Hu, Z.; Liu, C.; Liang, S.; Wang, Q.; Wang, J. Bacterial community variation and microbial mechanism of triclosan (TCS) removal by constructed wetlands with different types of plants. Sci. Total Environ. 2015, 505, 633–639. [Google Scholar] [CrossRef] [PubMed]
- Wang, J.; Wang, Y.; Bai, J.; Liu, Z.; Song, X.; Yan, D.; Abiyu, A.; Zhao, Z.; Yan, D. High efficiency of inorganic nitrogen removal by integrating biofilm-electrode with constructed wetland: Autotrophic denitrifying bacteria analysis. Bioresour. Technol. 2017, 227, 7–14. [Google Scholar] [CrossRef] [PubMed]
- Mulder, A.; van de Graaf, A.A.; Robertson, L.A.; Kuenen, J.G. Anaerobic ammonium oxidation discovered in a denitrifying fluidized bed reactor. FEMS Microbiol. Ecol. 1995, 16, 177–183. [Google Scholar] [CrossRef]
- Pereira, A.D.; Leal, C.D.; Dias, M.F.; Etchebehere, C.; Chernicharo, C.A.L.; De Araújo, J.C. Effect of phenol on the nitrogen removal performance and microbial community structure and composition of an anammox reactor. Bioresour. Technol. 2014, 166, 103–111. [Google Scholar] [CrossRef] [PubMed]
- Chakravarthy, S.S.; Pande, S.; Kapoor, A.; Nerurkar, A.S. Comparison of denitrification between paracoccus sp. and diaphorobacter sp. Appl. Biochem. Biotechnol. 2011, 165, 260–269. [Google Scholar] [CrossRef]
Figure 1.
Experimental schematic of laboratory-scale up-flow biological aerated filter (UBAF) system.
Figure 1.
Experimental schematic of laboratory-scale up-flow biological aerated filter (UBAF) system.

Figure 2.
Effect of aeration rates on the removal efficiency of chemical oxygen demand (COD), NH4+-N, NO3−-N, and total phosphorus (TP).
Figure 2.
Effect of aeration rates on the removal efficiency of chemical oxygen demand (COD), NH4+-N, NO3−-N, and total phosphorus (TP).

Figure 3.
COD removal along with the height of the filter media layer.
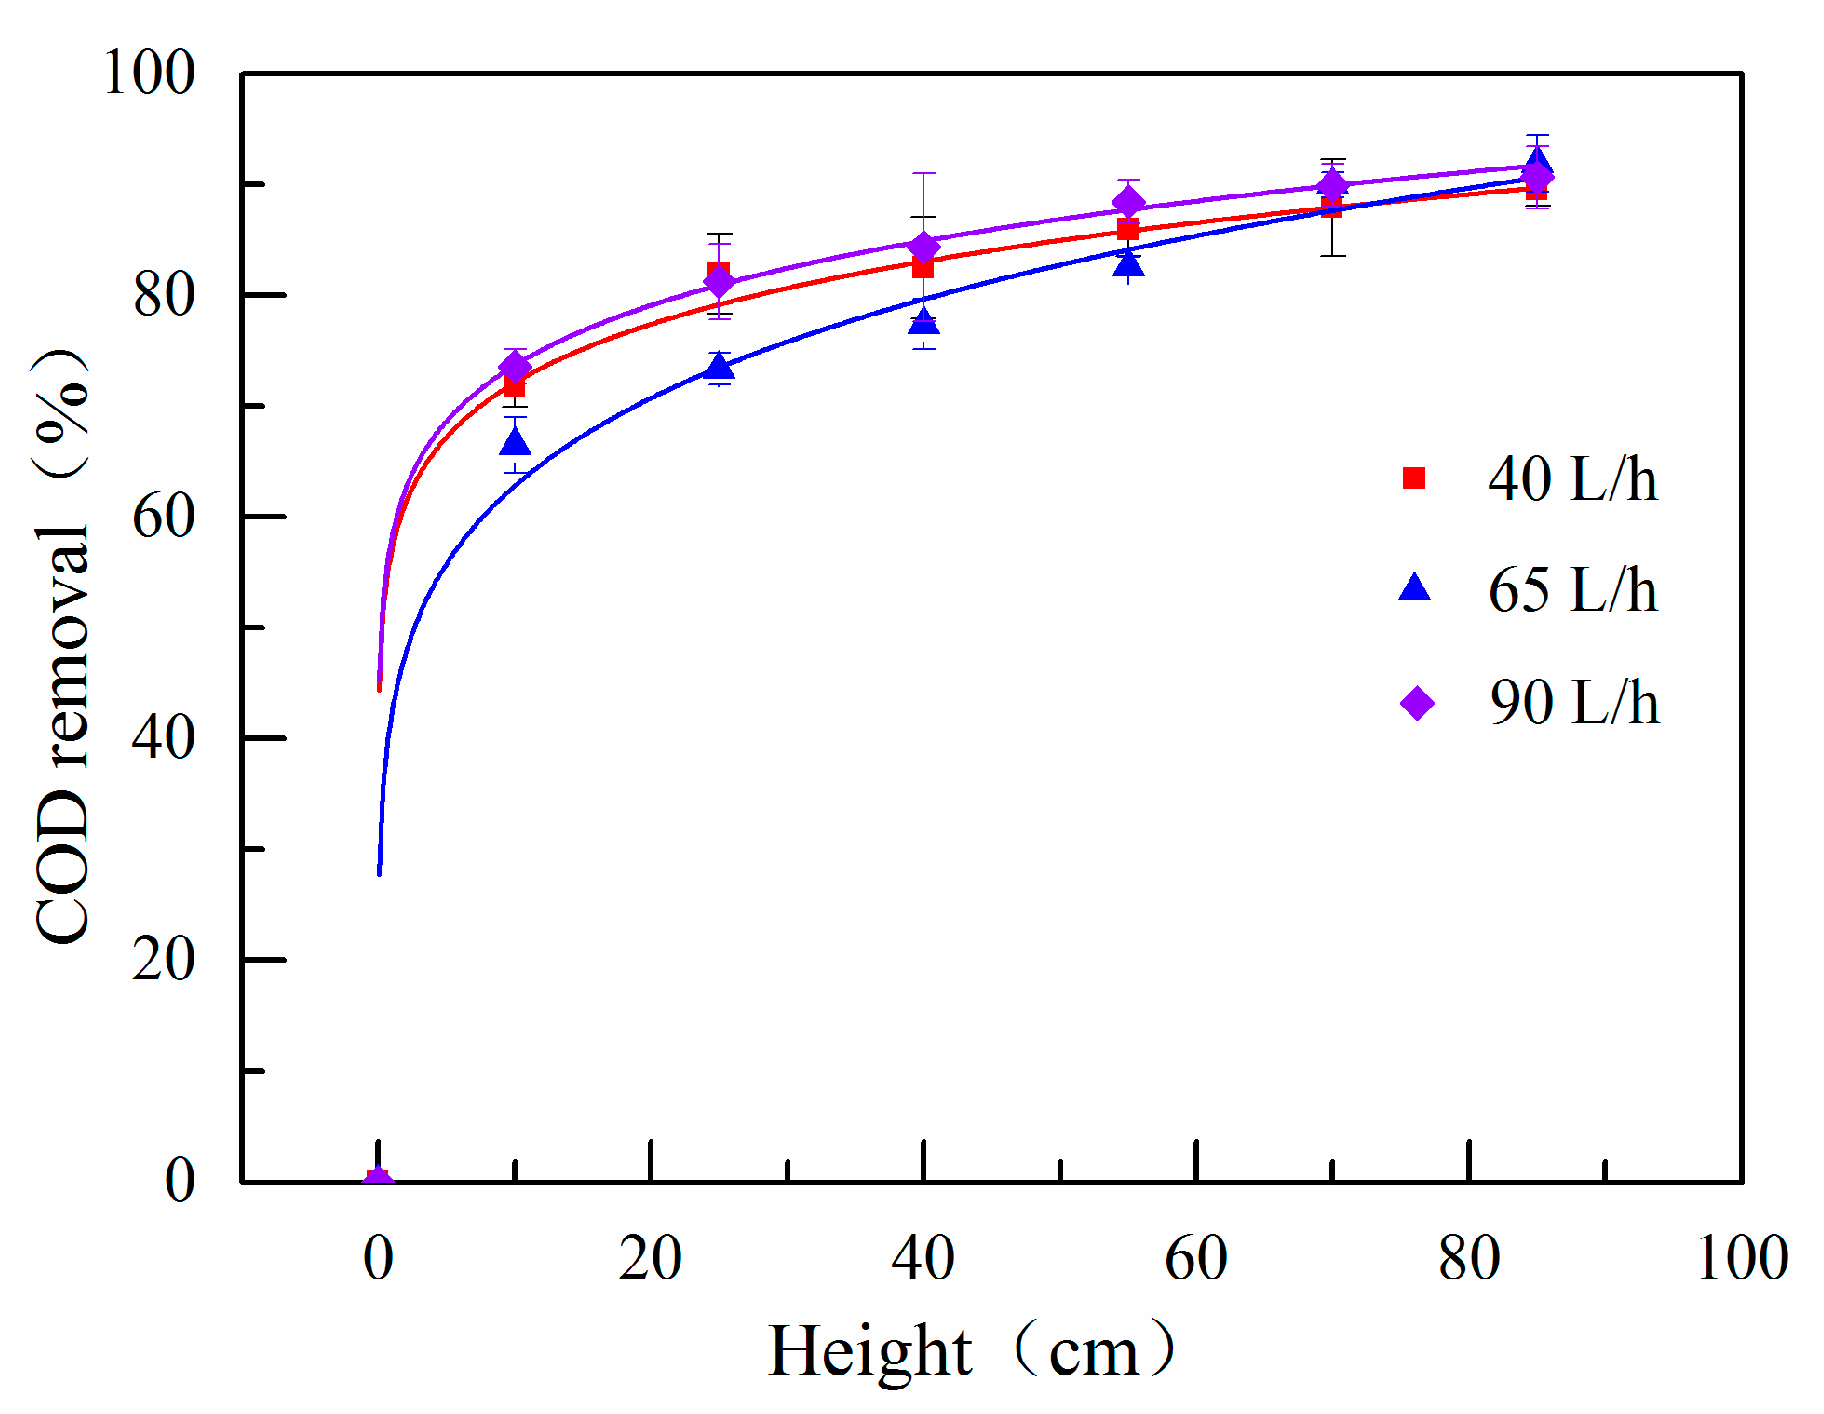
Figure 4.
Nitrogen removal along with the height of the filter media layer.
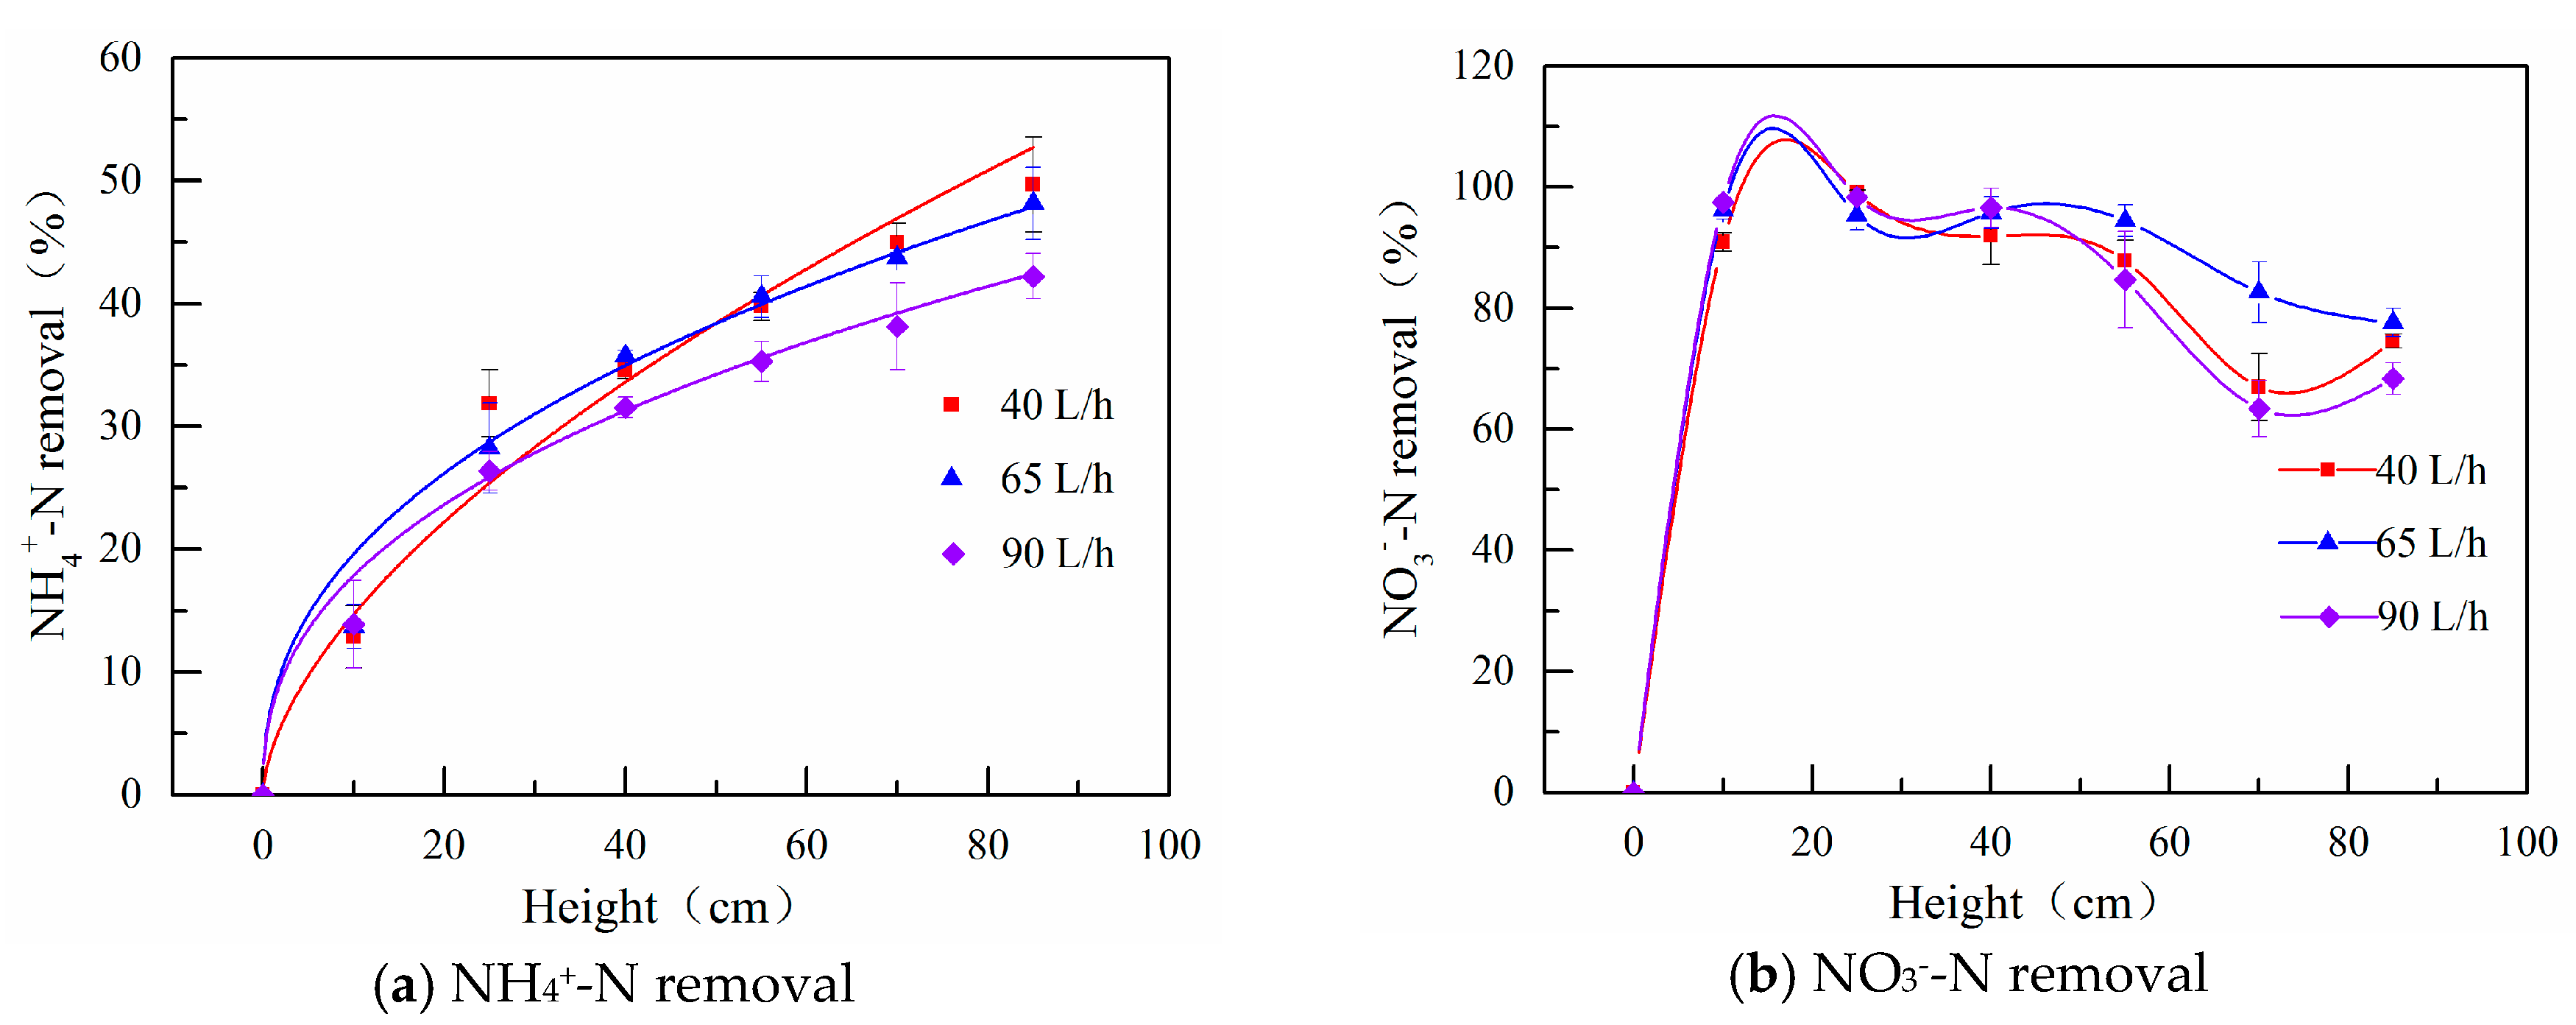
Figure 5.
TP removal along with the height of the filter media layer.

Figure 6.
Microbial community composition at the phylum and class: (a) Phylum level at different aeration rates; (b) five classes of Proteobacteria at different aeration rates.
Figure 6.
Microbial community composition at the phylum and class: (a) Phylum level at different aeration rates; (b) five classes of Proteobacteria at different aeration rates.

Figure 7.
Microbial community composition at the phylum, class, and genus level: (a) Phylum level at different filter media heights; (b) five classes of Proteobacteria at different filter media heights; (c–e) show the genus of Betaproteobacteria at filter media heights of 10 cm, 40 cm, and 70 cm, respectively.


Table 1.
The distribution of dissolved oxygen (DO) concentrations at different aeration rates and filter media heights (Unit: mg/L).
Table 1.
The distribution of dissolved oxygen (DO) concentrations at different aeration rates and filter media heights (Unit: mg/L).
| Aeration Rates | Influent | 10 cm | 25 cm | 40 cm | 55 cm | 70 cm | Effluent |
|---|---|---|---|---|---|---|---|
| 40 L/h | 8.59 | 1.96 | 2.42 | 1.81 | 1.70 | 2.76 | 8.60 |
| 65 L/h | 8.67 | 0.95 | 1.35 | 1.13 | 0.90 | 1.71 | 8.56 |
| 90 L/h | 9.03 | 1.63 | 2.76 | 2.91 | 3.85 | 4.95 | 8.99 |
Table 2.
The richness and diversity of 16S rRNA sequences at different conditions.
| Sample | OTUs | Simpson | Chao1 | ACE | Shannon |
|---|---|---|---|---|---|
| 40 L/h | 433 | 0.9819 | 910 | 1340.01 | 6.64 |
| 65 L/h | 430 | 0.9775 | 962 | 1341.49 | 7.21 |
| 90 L/h | 414 | 0.9580 | 895 | 1277.43 | 6.53 |
| 10 cm | 413 | 0.9530 | 943 | 1362.56 | 6.72 |
| 40 cm | 476 | 0.9646 | 825 | 1166.10 | 6.85 |
| 70 cm | 458 | 0.9709 | 1032 | 1417.76 | 7.17 |
© 2018 by the authors. Licensee MDPI, Basel, Switzerland. This article is an open access article distributed under the terms and conditions of the Creative Commons Attribution (CC BY) license (http://creativecommons.org/licenses/by/4.0/).
Share and Cite
MDPI and ACS Style
Ren, J.; Cheng, W.; Wan, T.; Wang, M.; Zhang, C. Effect of Aeration Rates and Filter Media Heights on the Performance of Pollutant Removal in an Up-Flow Biological Aerated Filter. Water 2018, 10, 1244. https://doi.org/10.3390/w10091244
AMA Style
Ren J, Cheng W, Wan T, Wang M, Zhang C. Effect of Aeration Rates and Filter Media Heights on the Performance of Pollutant Removal in an Up-Flow Biological Aerated Filter. Water. 2018; 10(9):1244. https://doi.org/10.3390/w10091244
Chicago/Turabian StyleRen, Jiehui, Wen Cheng, Tian Wan, Min Wang, and Chengcheng Zhang. 2018. "Effect of Aeration Rates and Filter Media Heights on the Performance of Pollutant Removal in an Up-Flow Biological Aerated Filter" Water 10, no. 9: 1244. https://doi.org/10.3390/w10091244
Note that from the first issue of 2016, this journal uses article numbers instead of page numbers. See further details here.