Variations of the Snow Water Equivalent in the Ourika Catchment (Morocco) over 2000–2018 Using Downscaled MERRA-2 Data

 ,
, 
Abstract
:1. Introduction
2. Data and Method
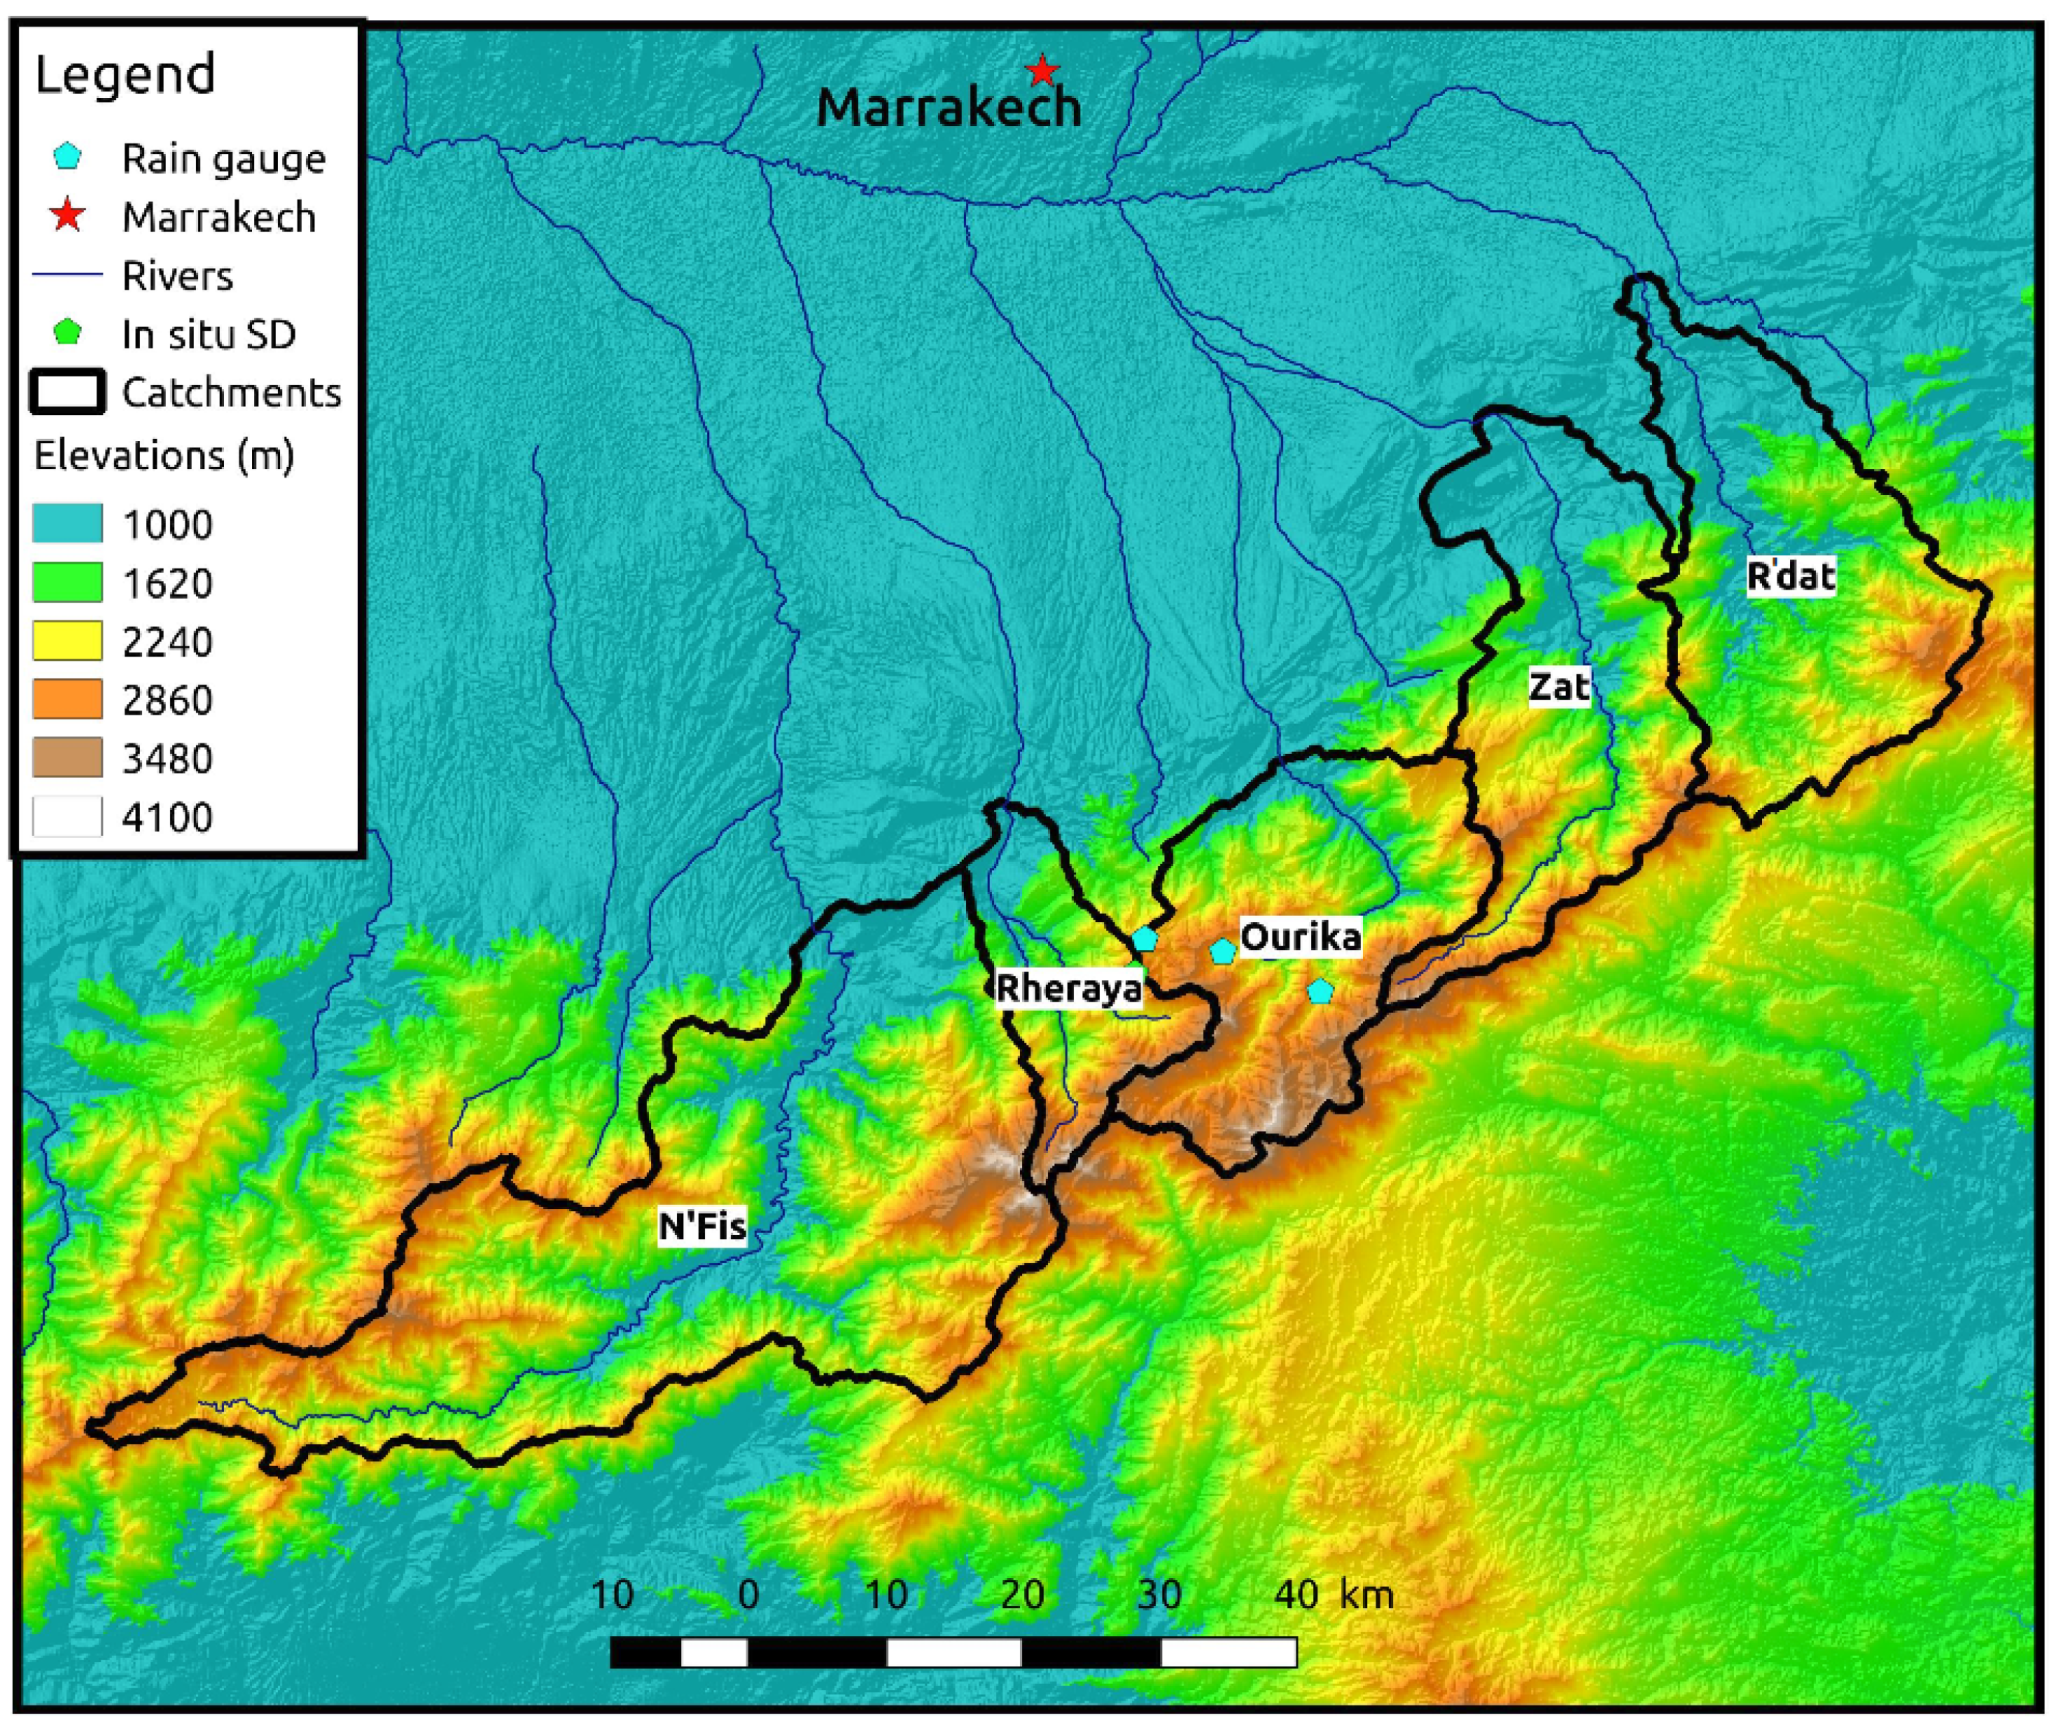
2.1. Study Area
2.2. Data
2.2.1. Meteorological Data
2.2.2. DEM
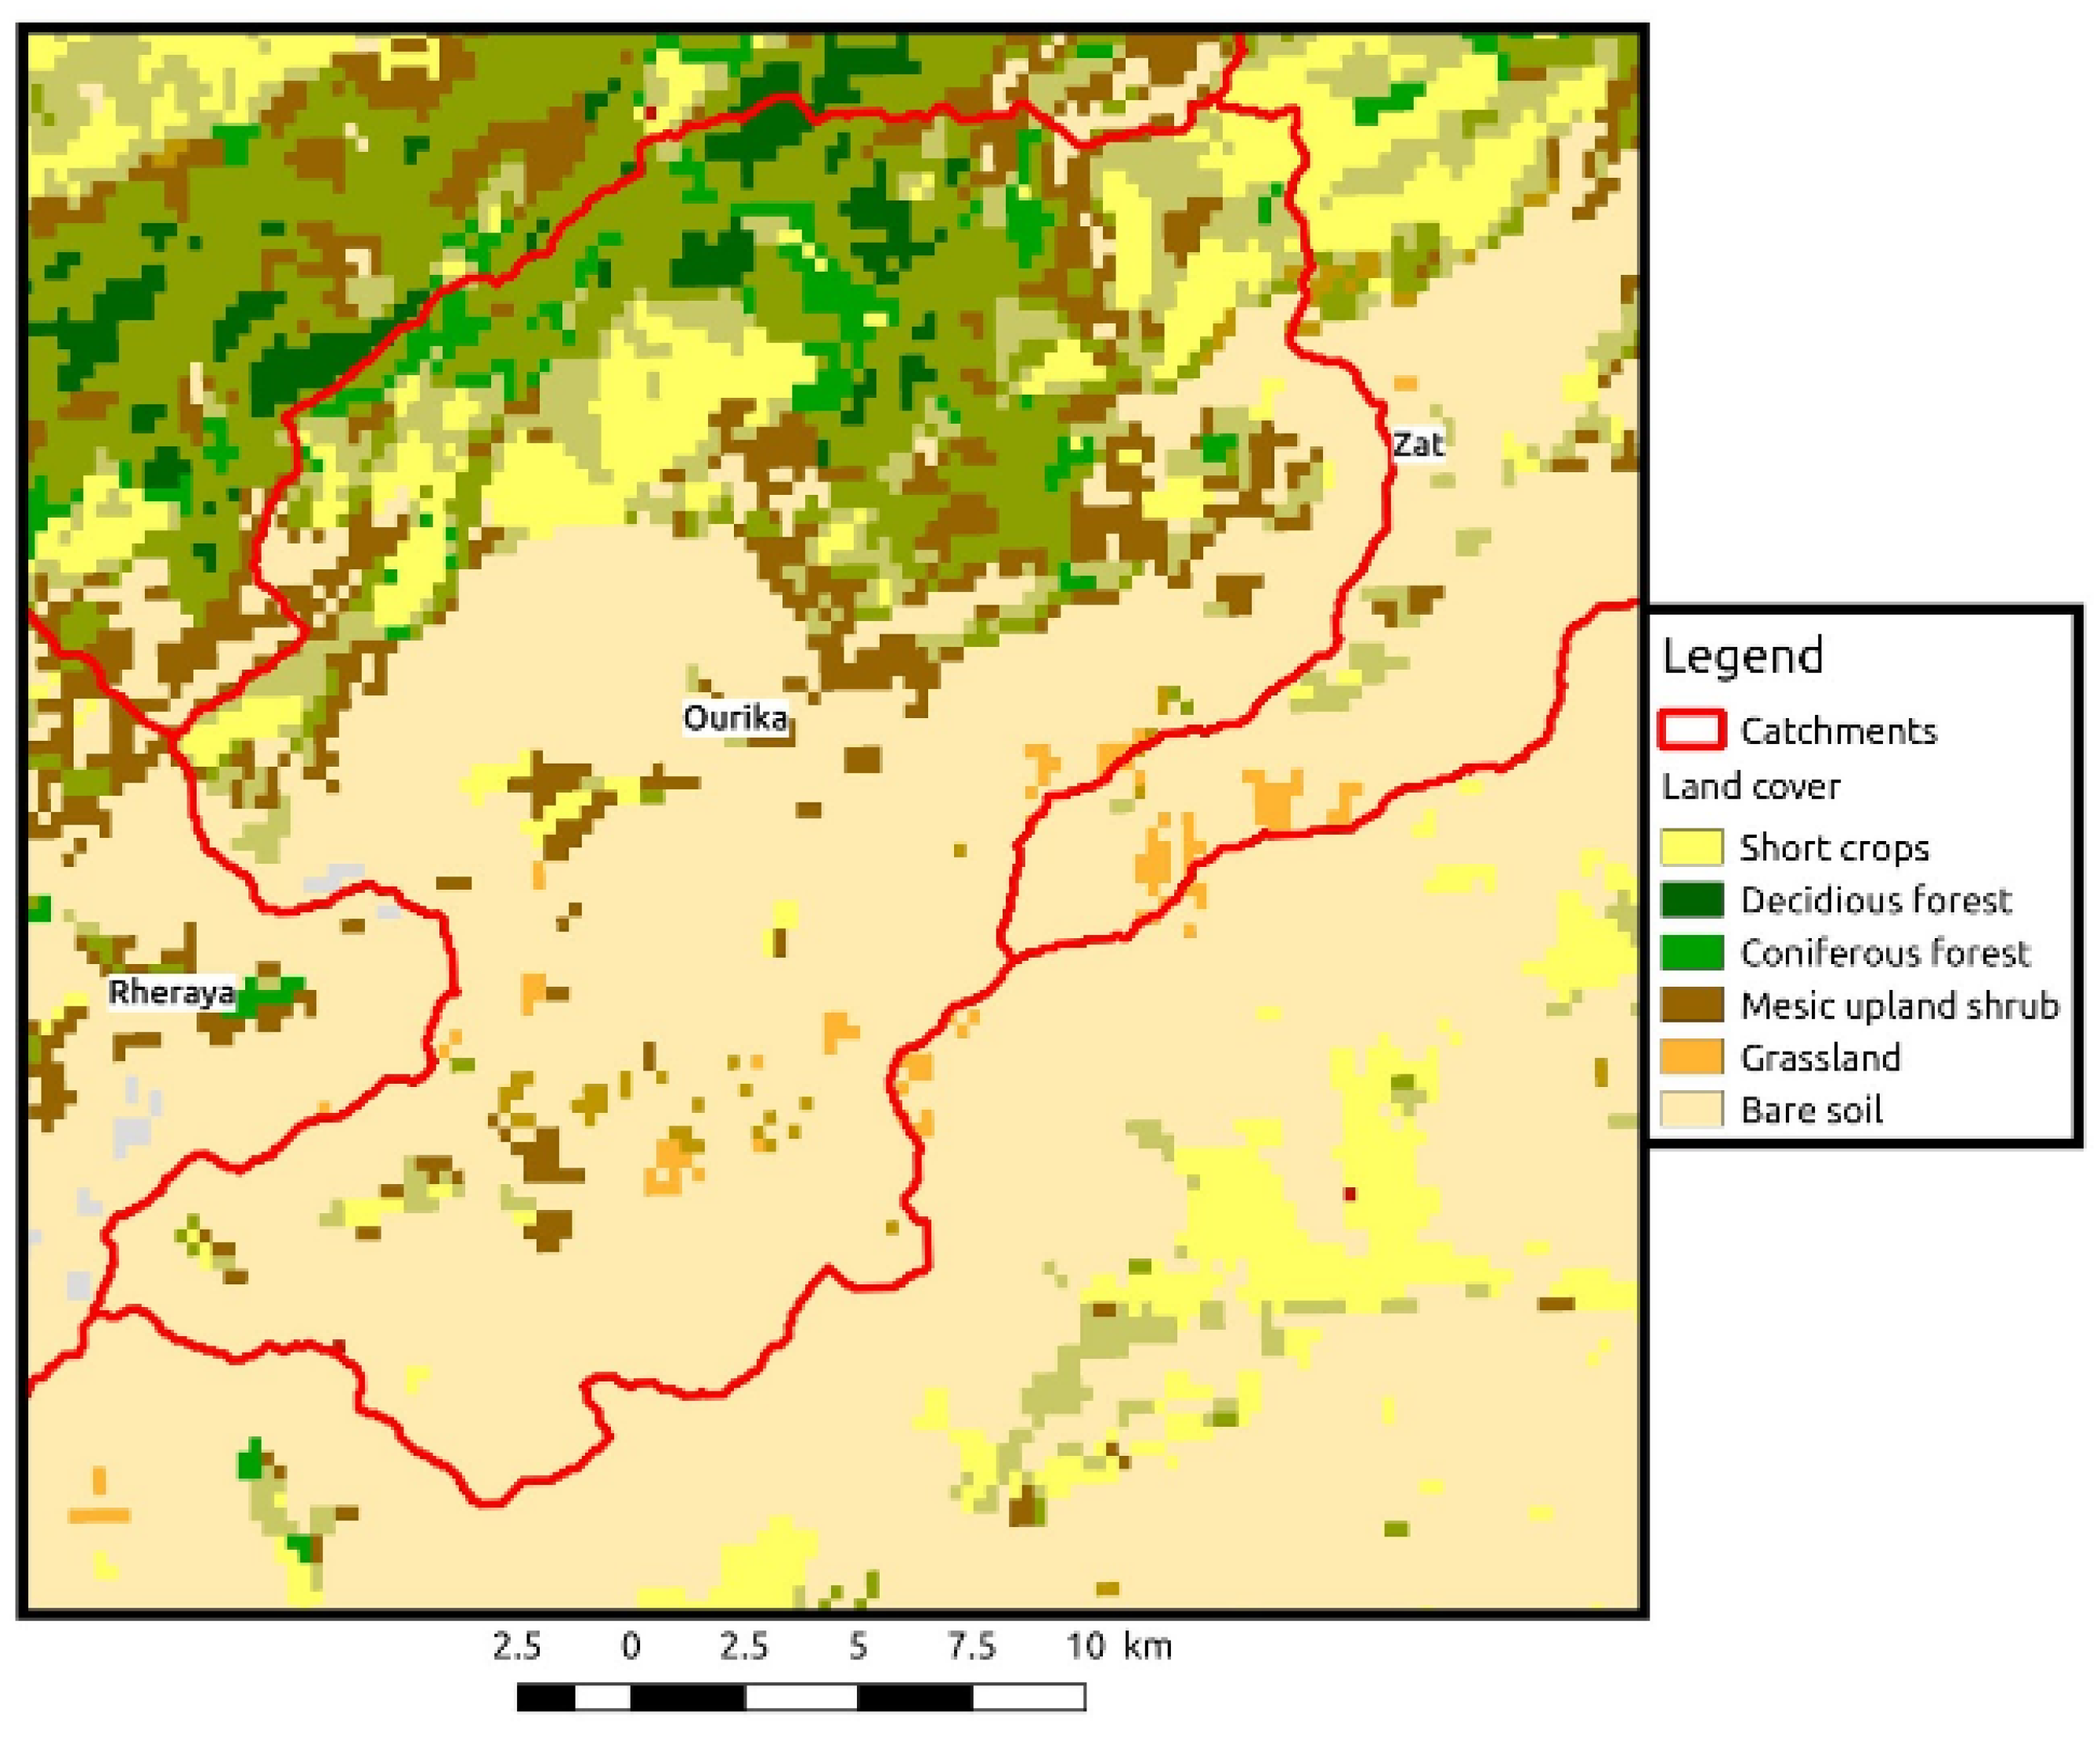
2.2.3. Land Cover
2.2.4. Snow Cover Area
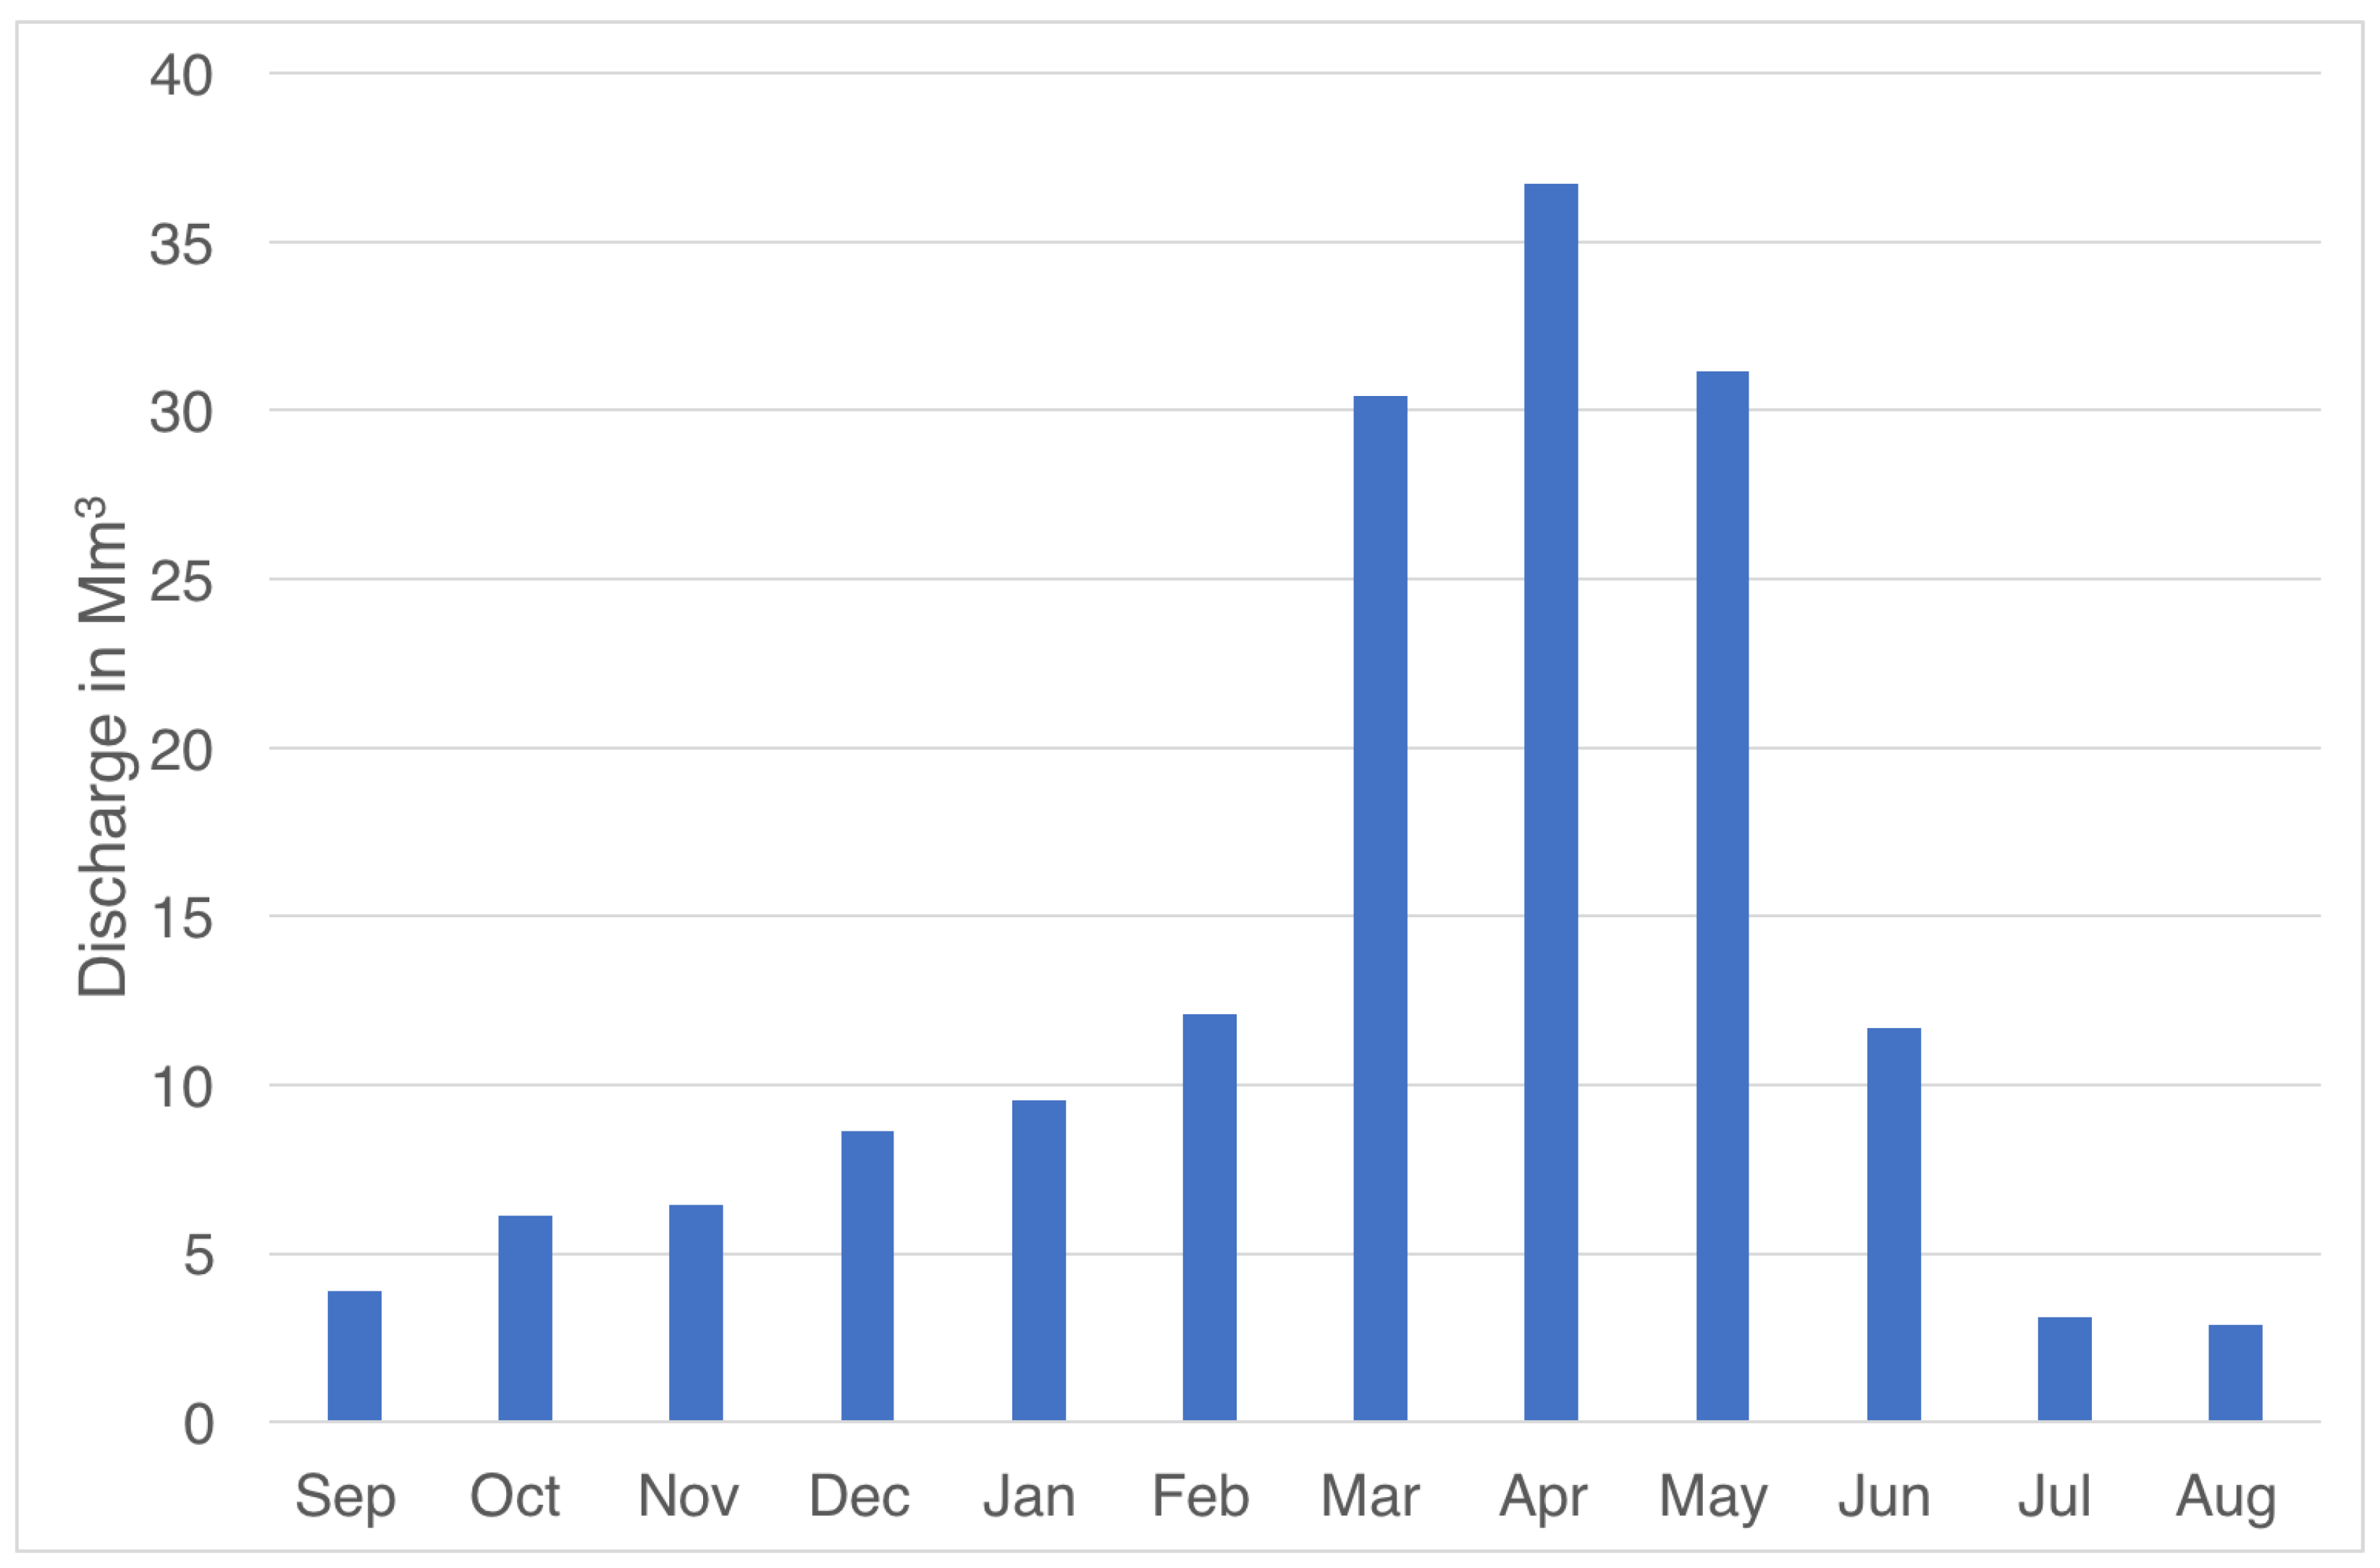
2.2.5. Ourika River Discharge
2.2.6. In Situ Precipitation Gauge
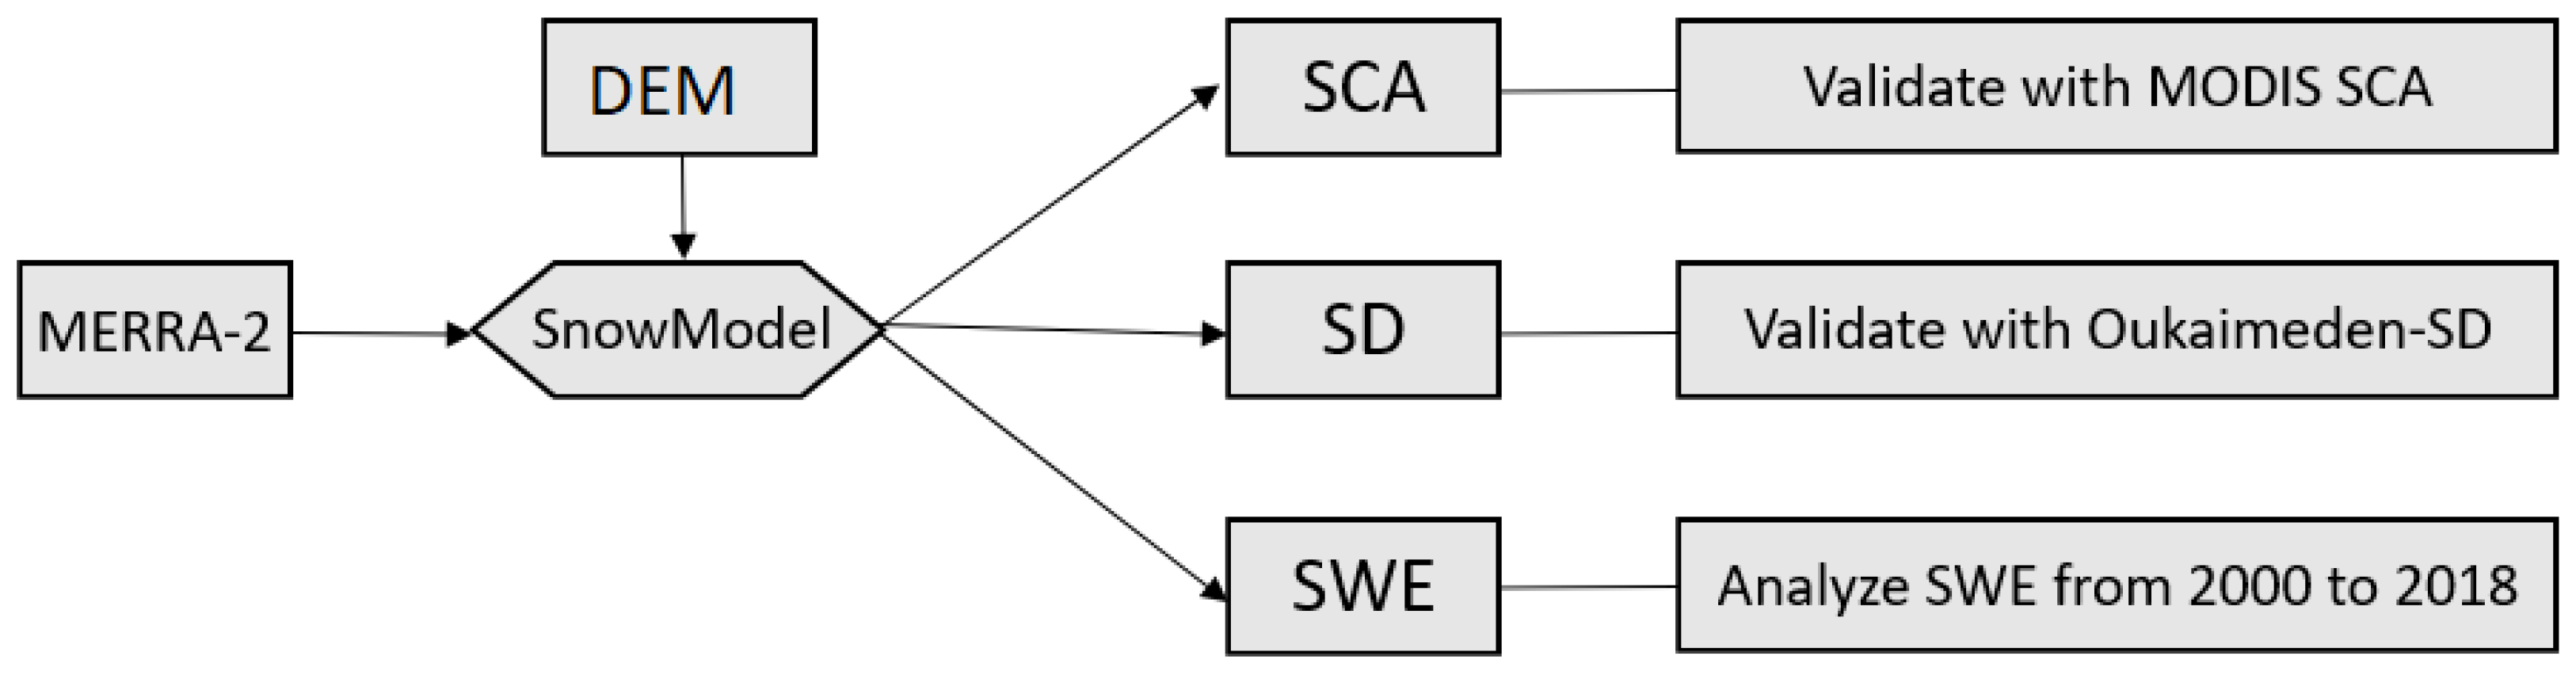
2.3. Methodology
2.3.1. Snow Energy and Mass Balance Model
2.3.2. Pre-Processing of MERRA-2 Variables
2.3.3. Model Evaluation
3. Results
3.1. Validation
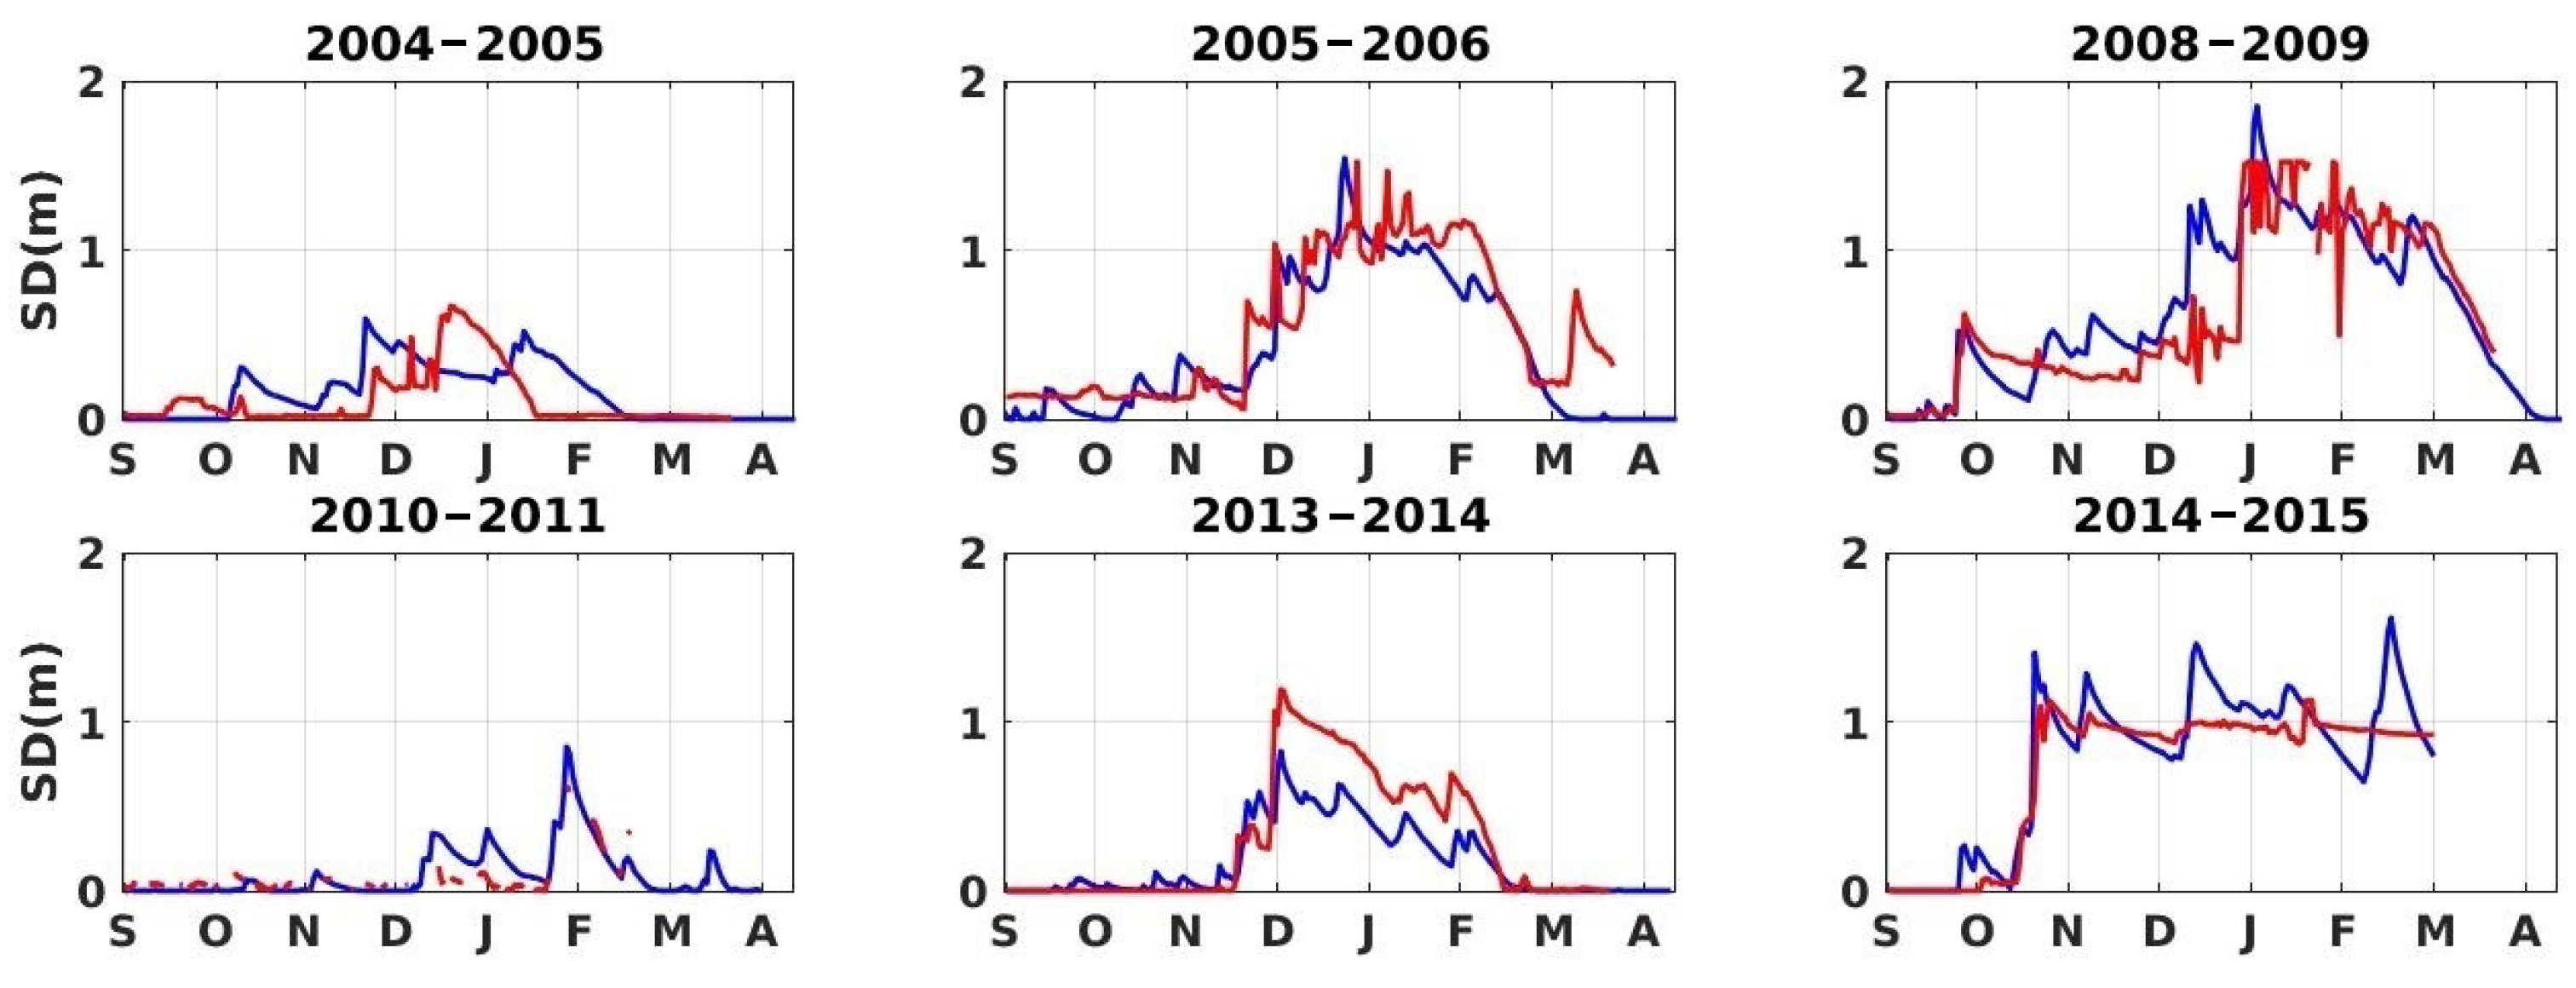
3.1.1. Snow Depth at Oukaimeden
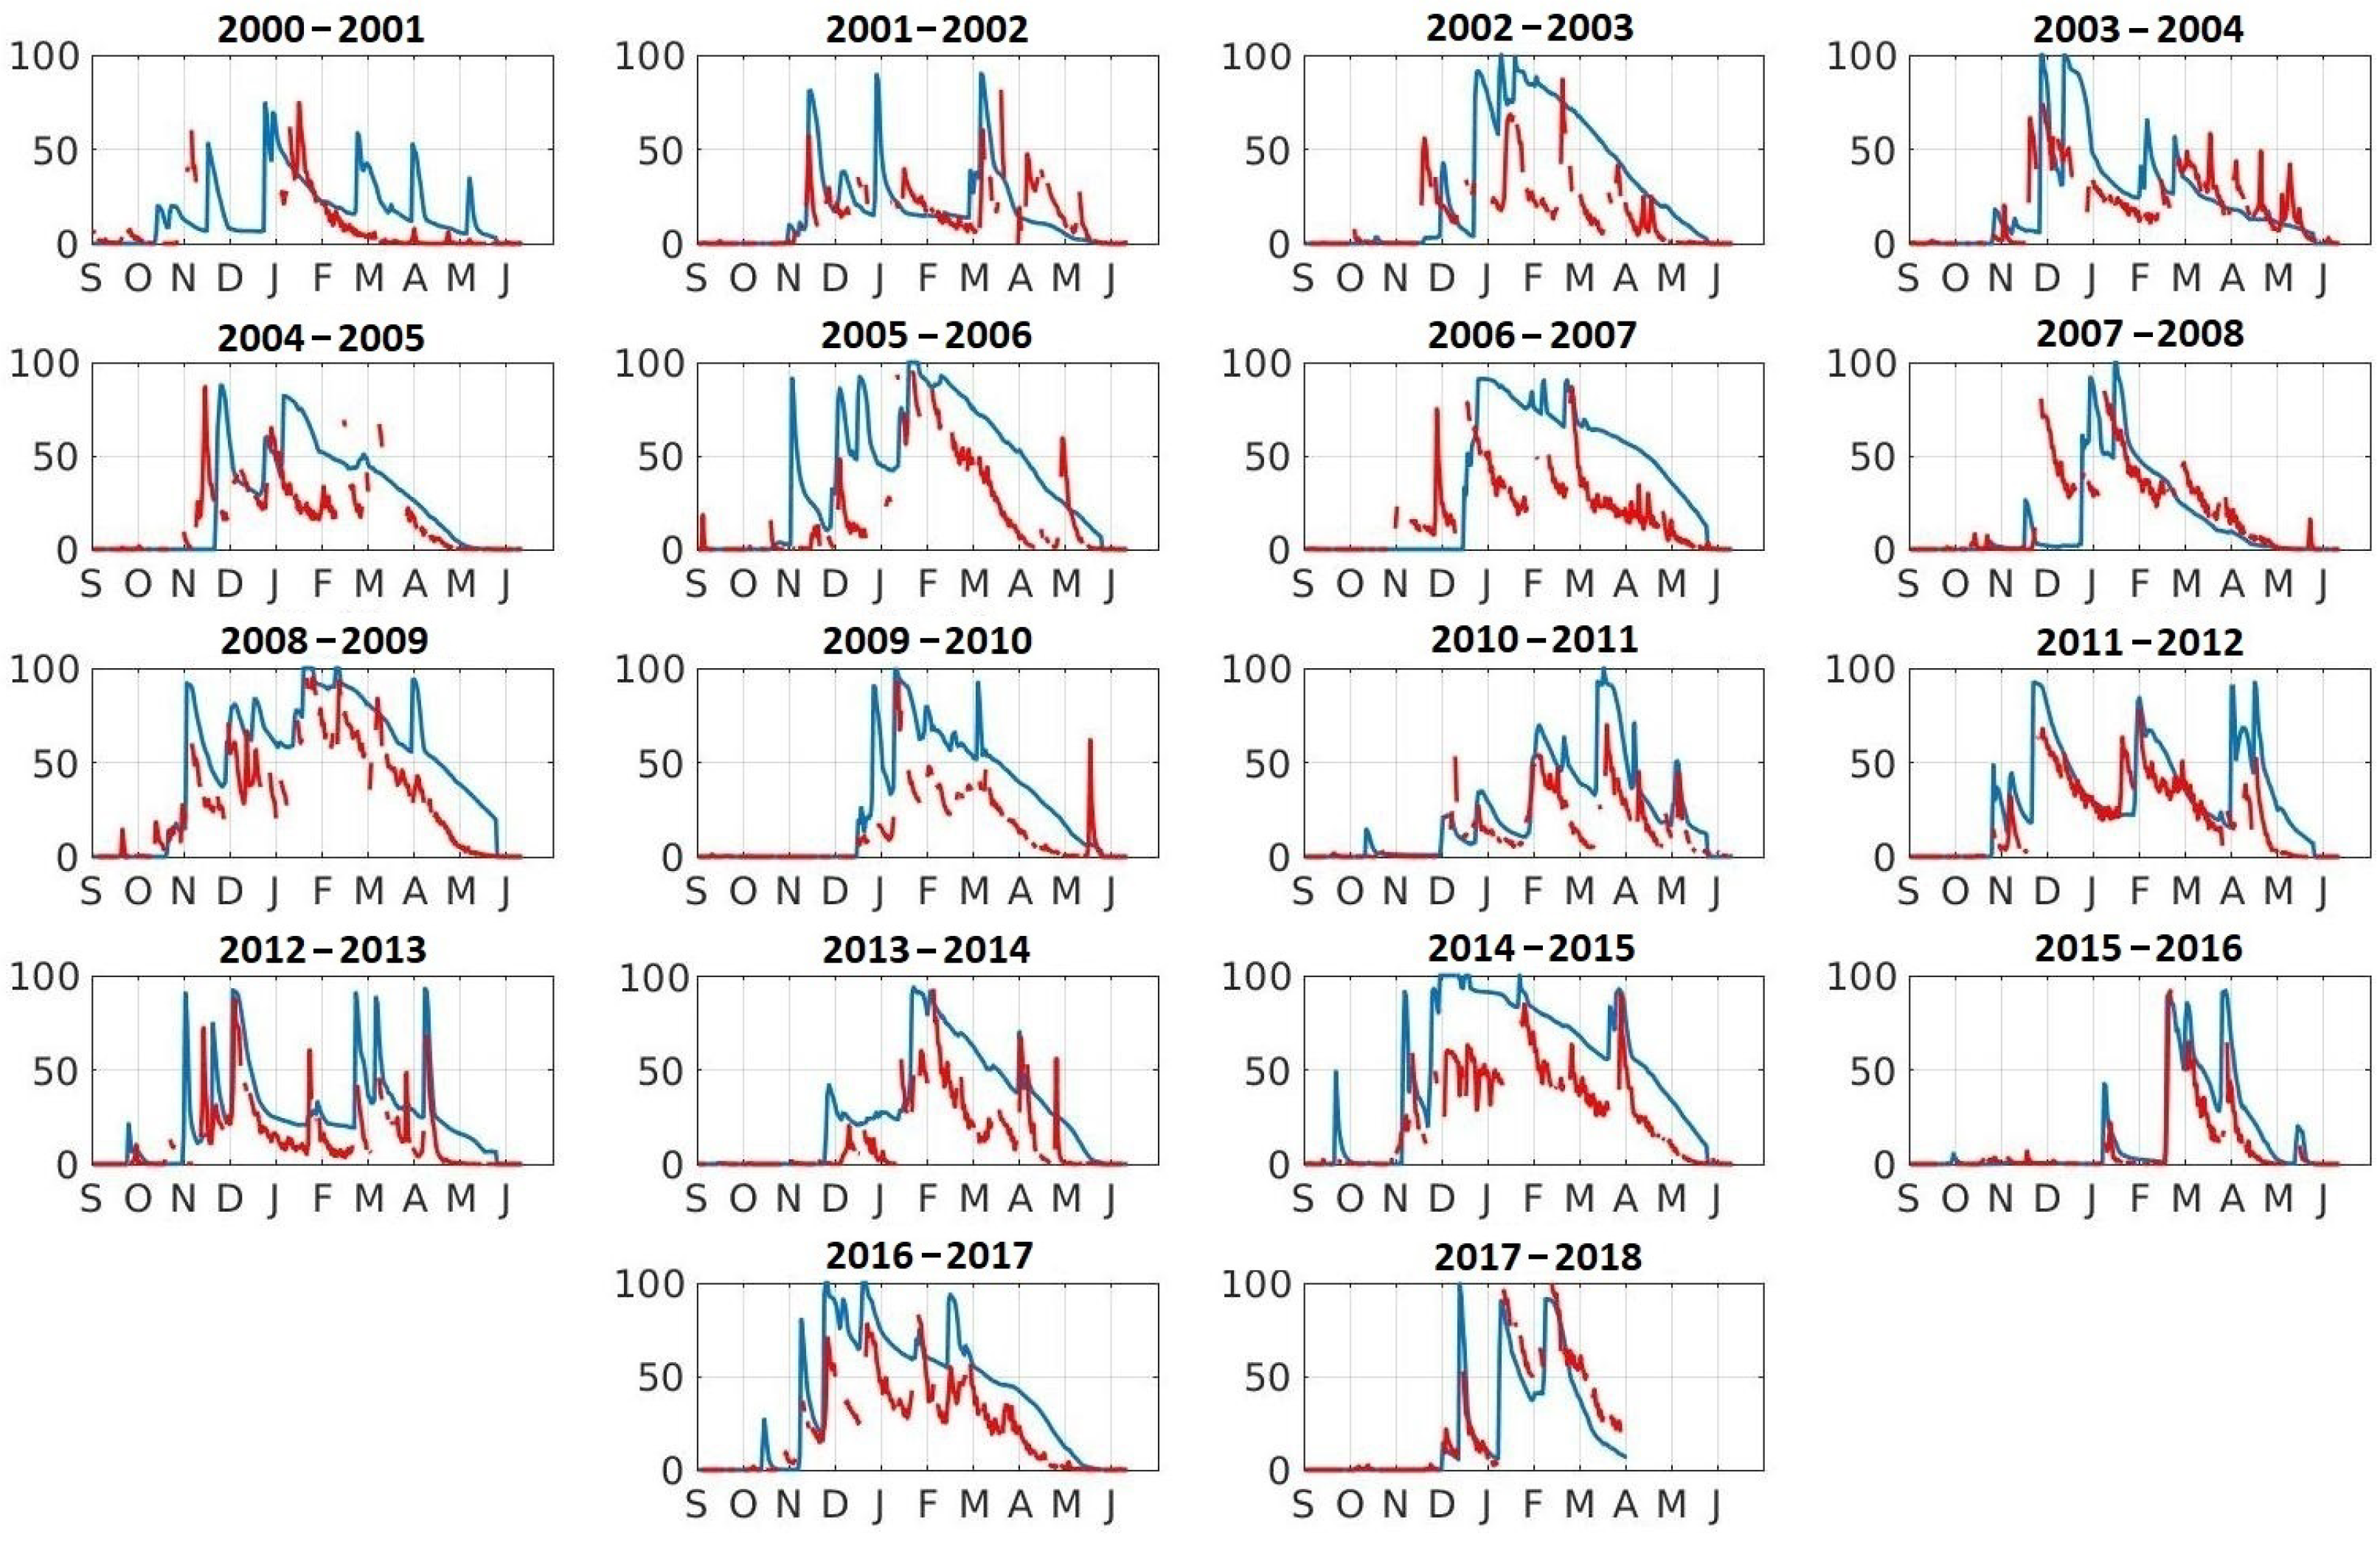
3.1.2. Snow Cover Area
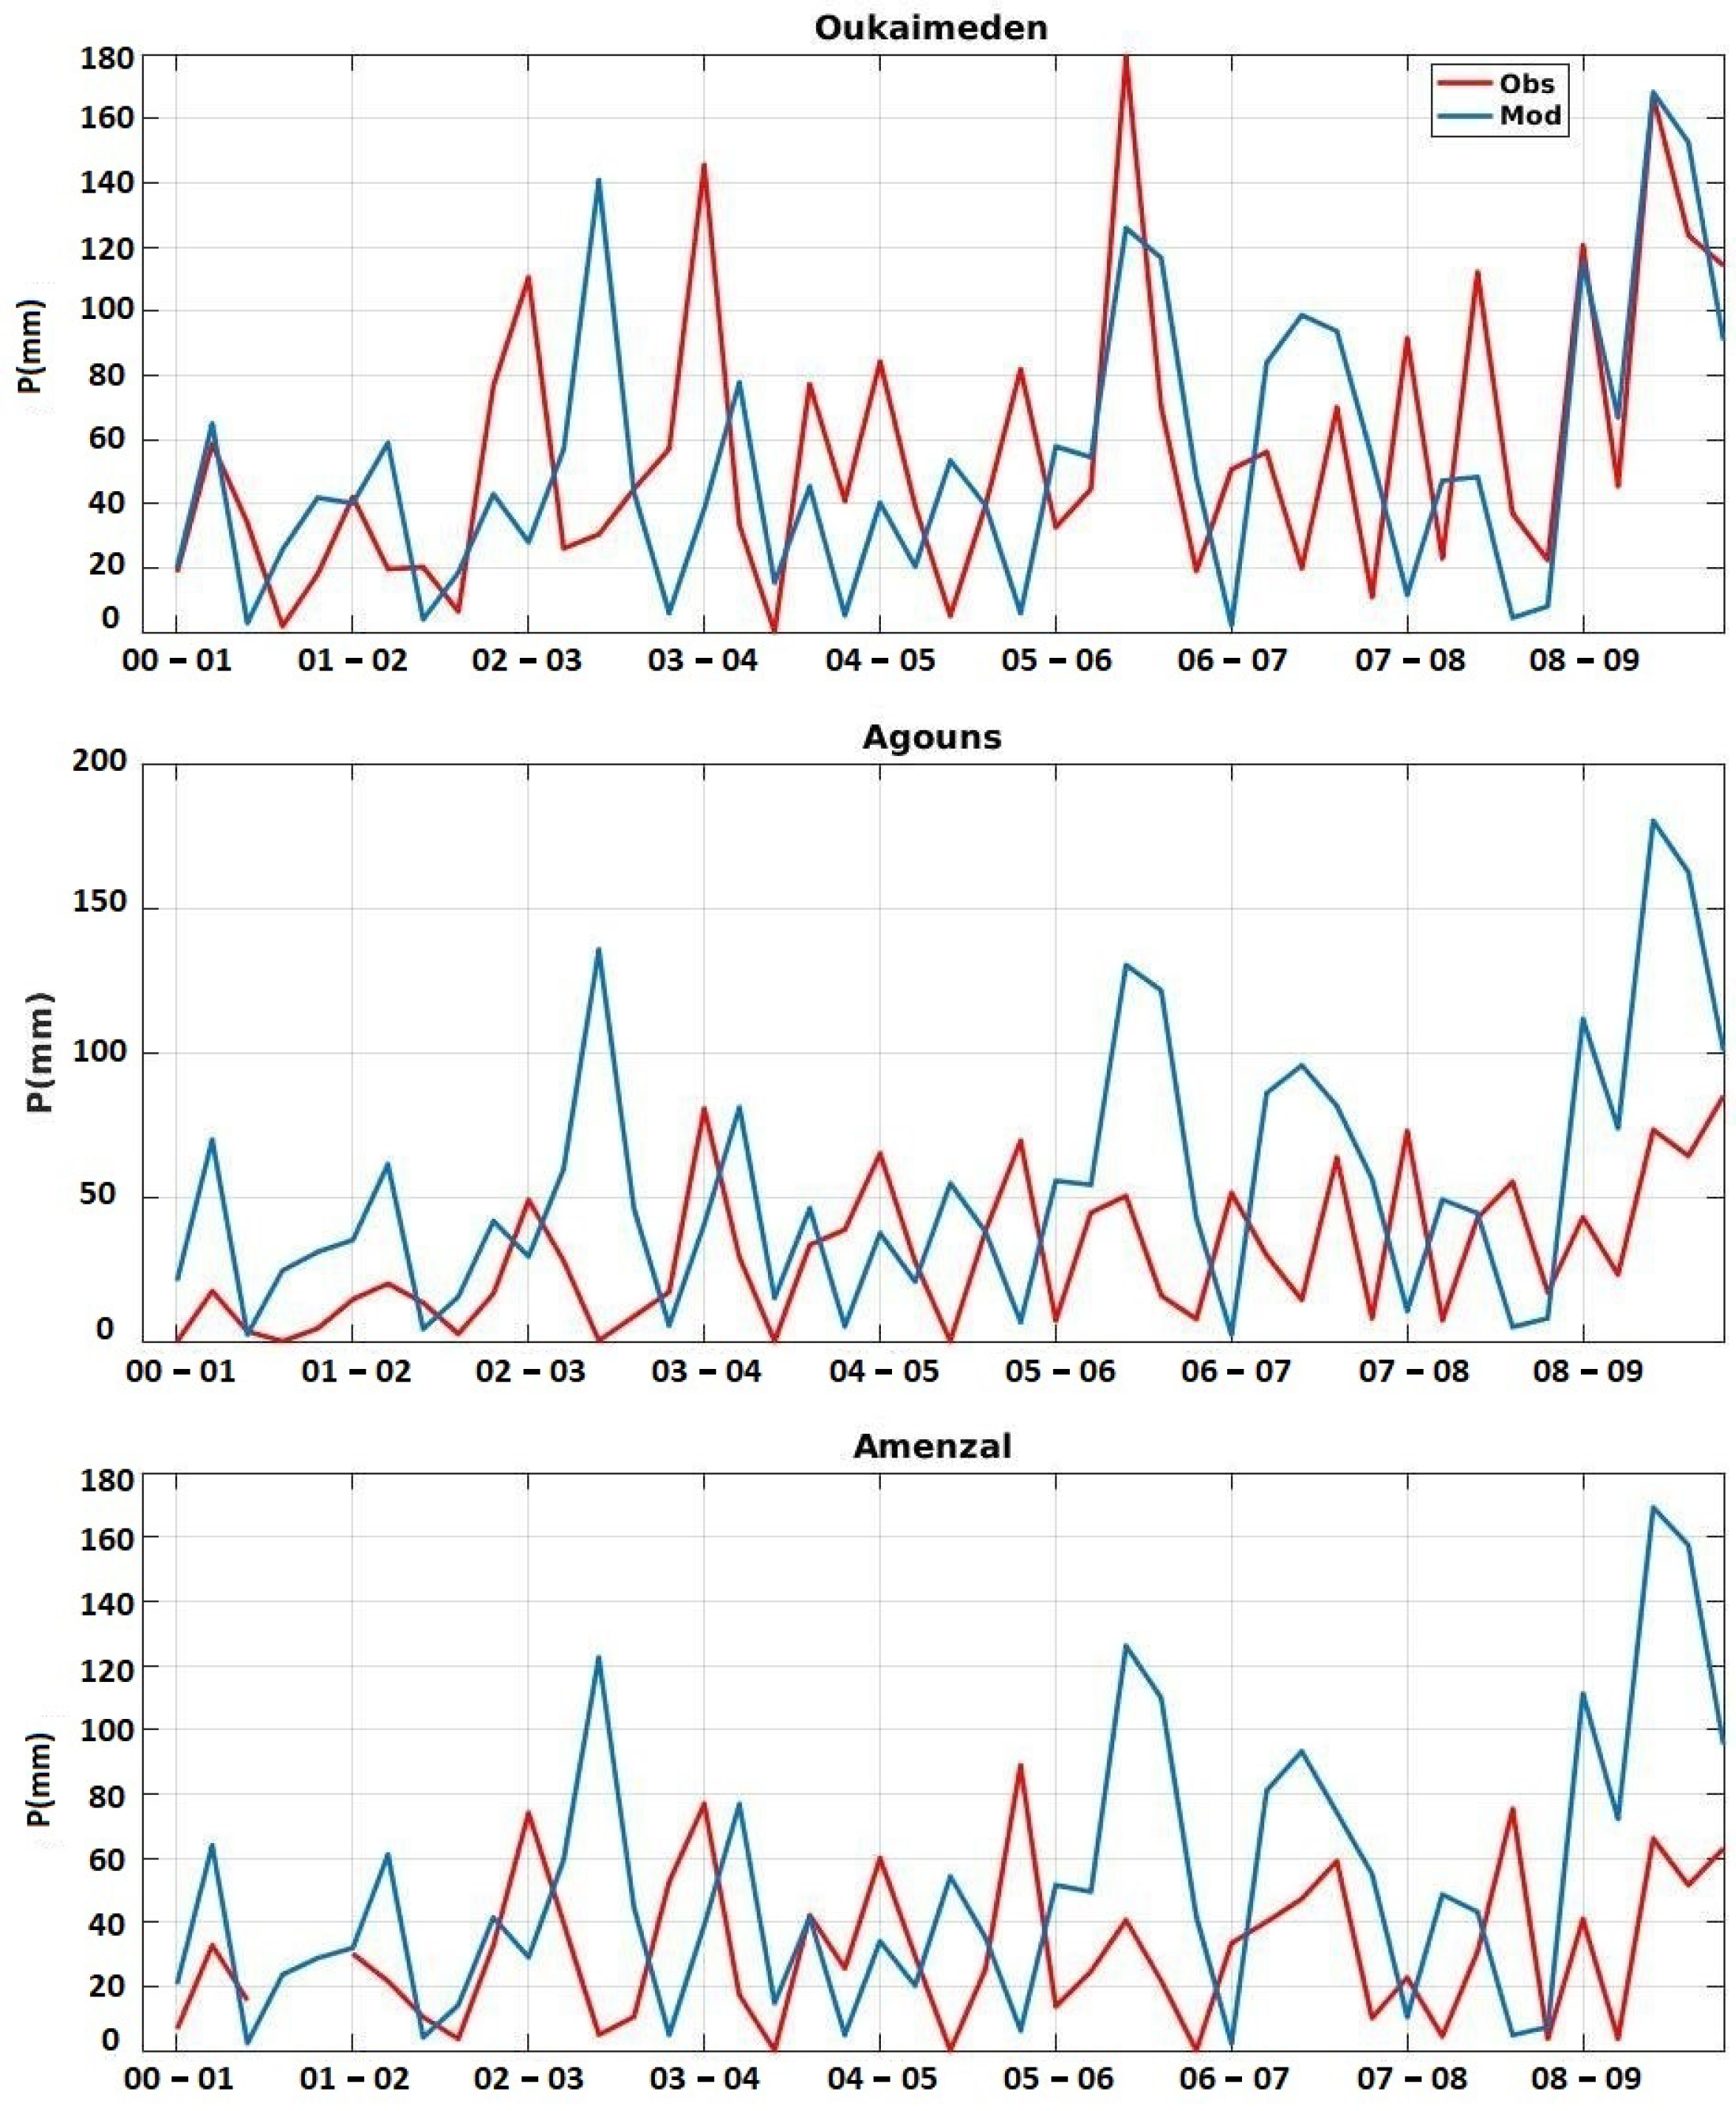
3.1.3. In Situ Precipitation
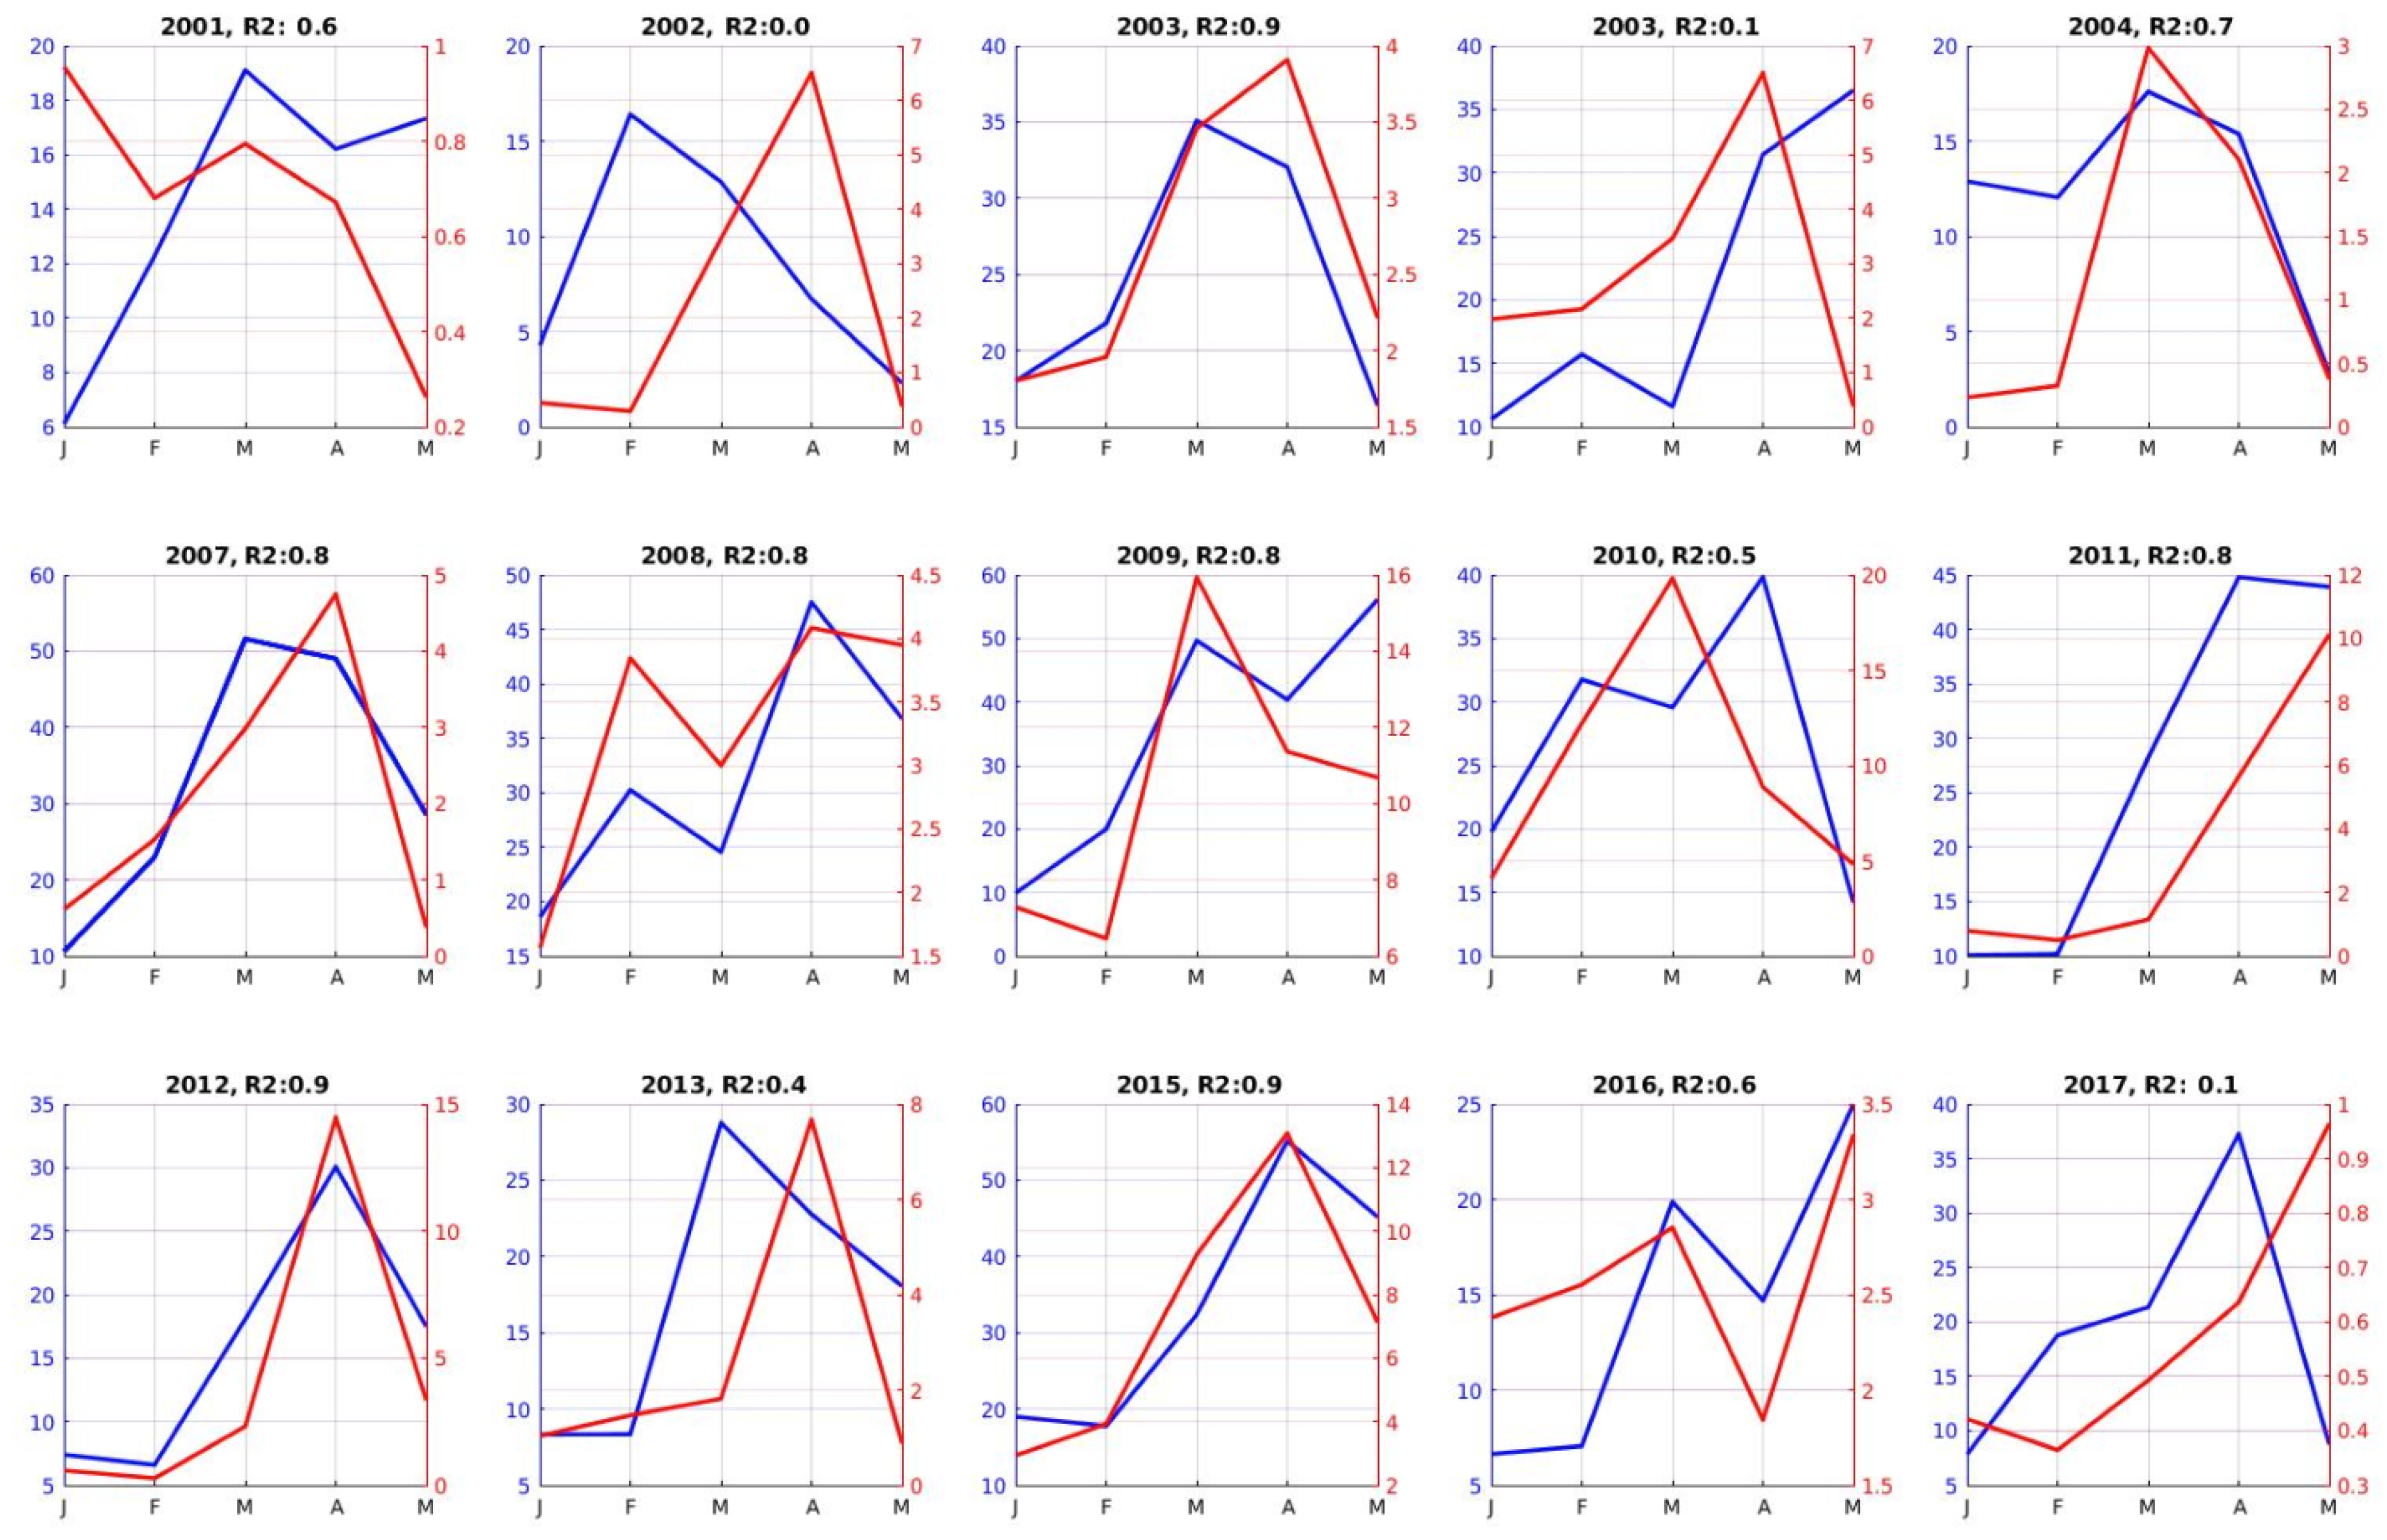
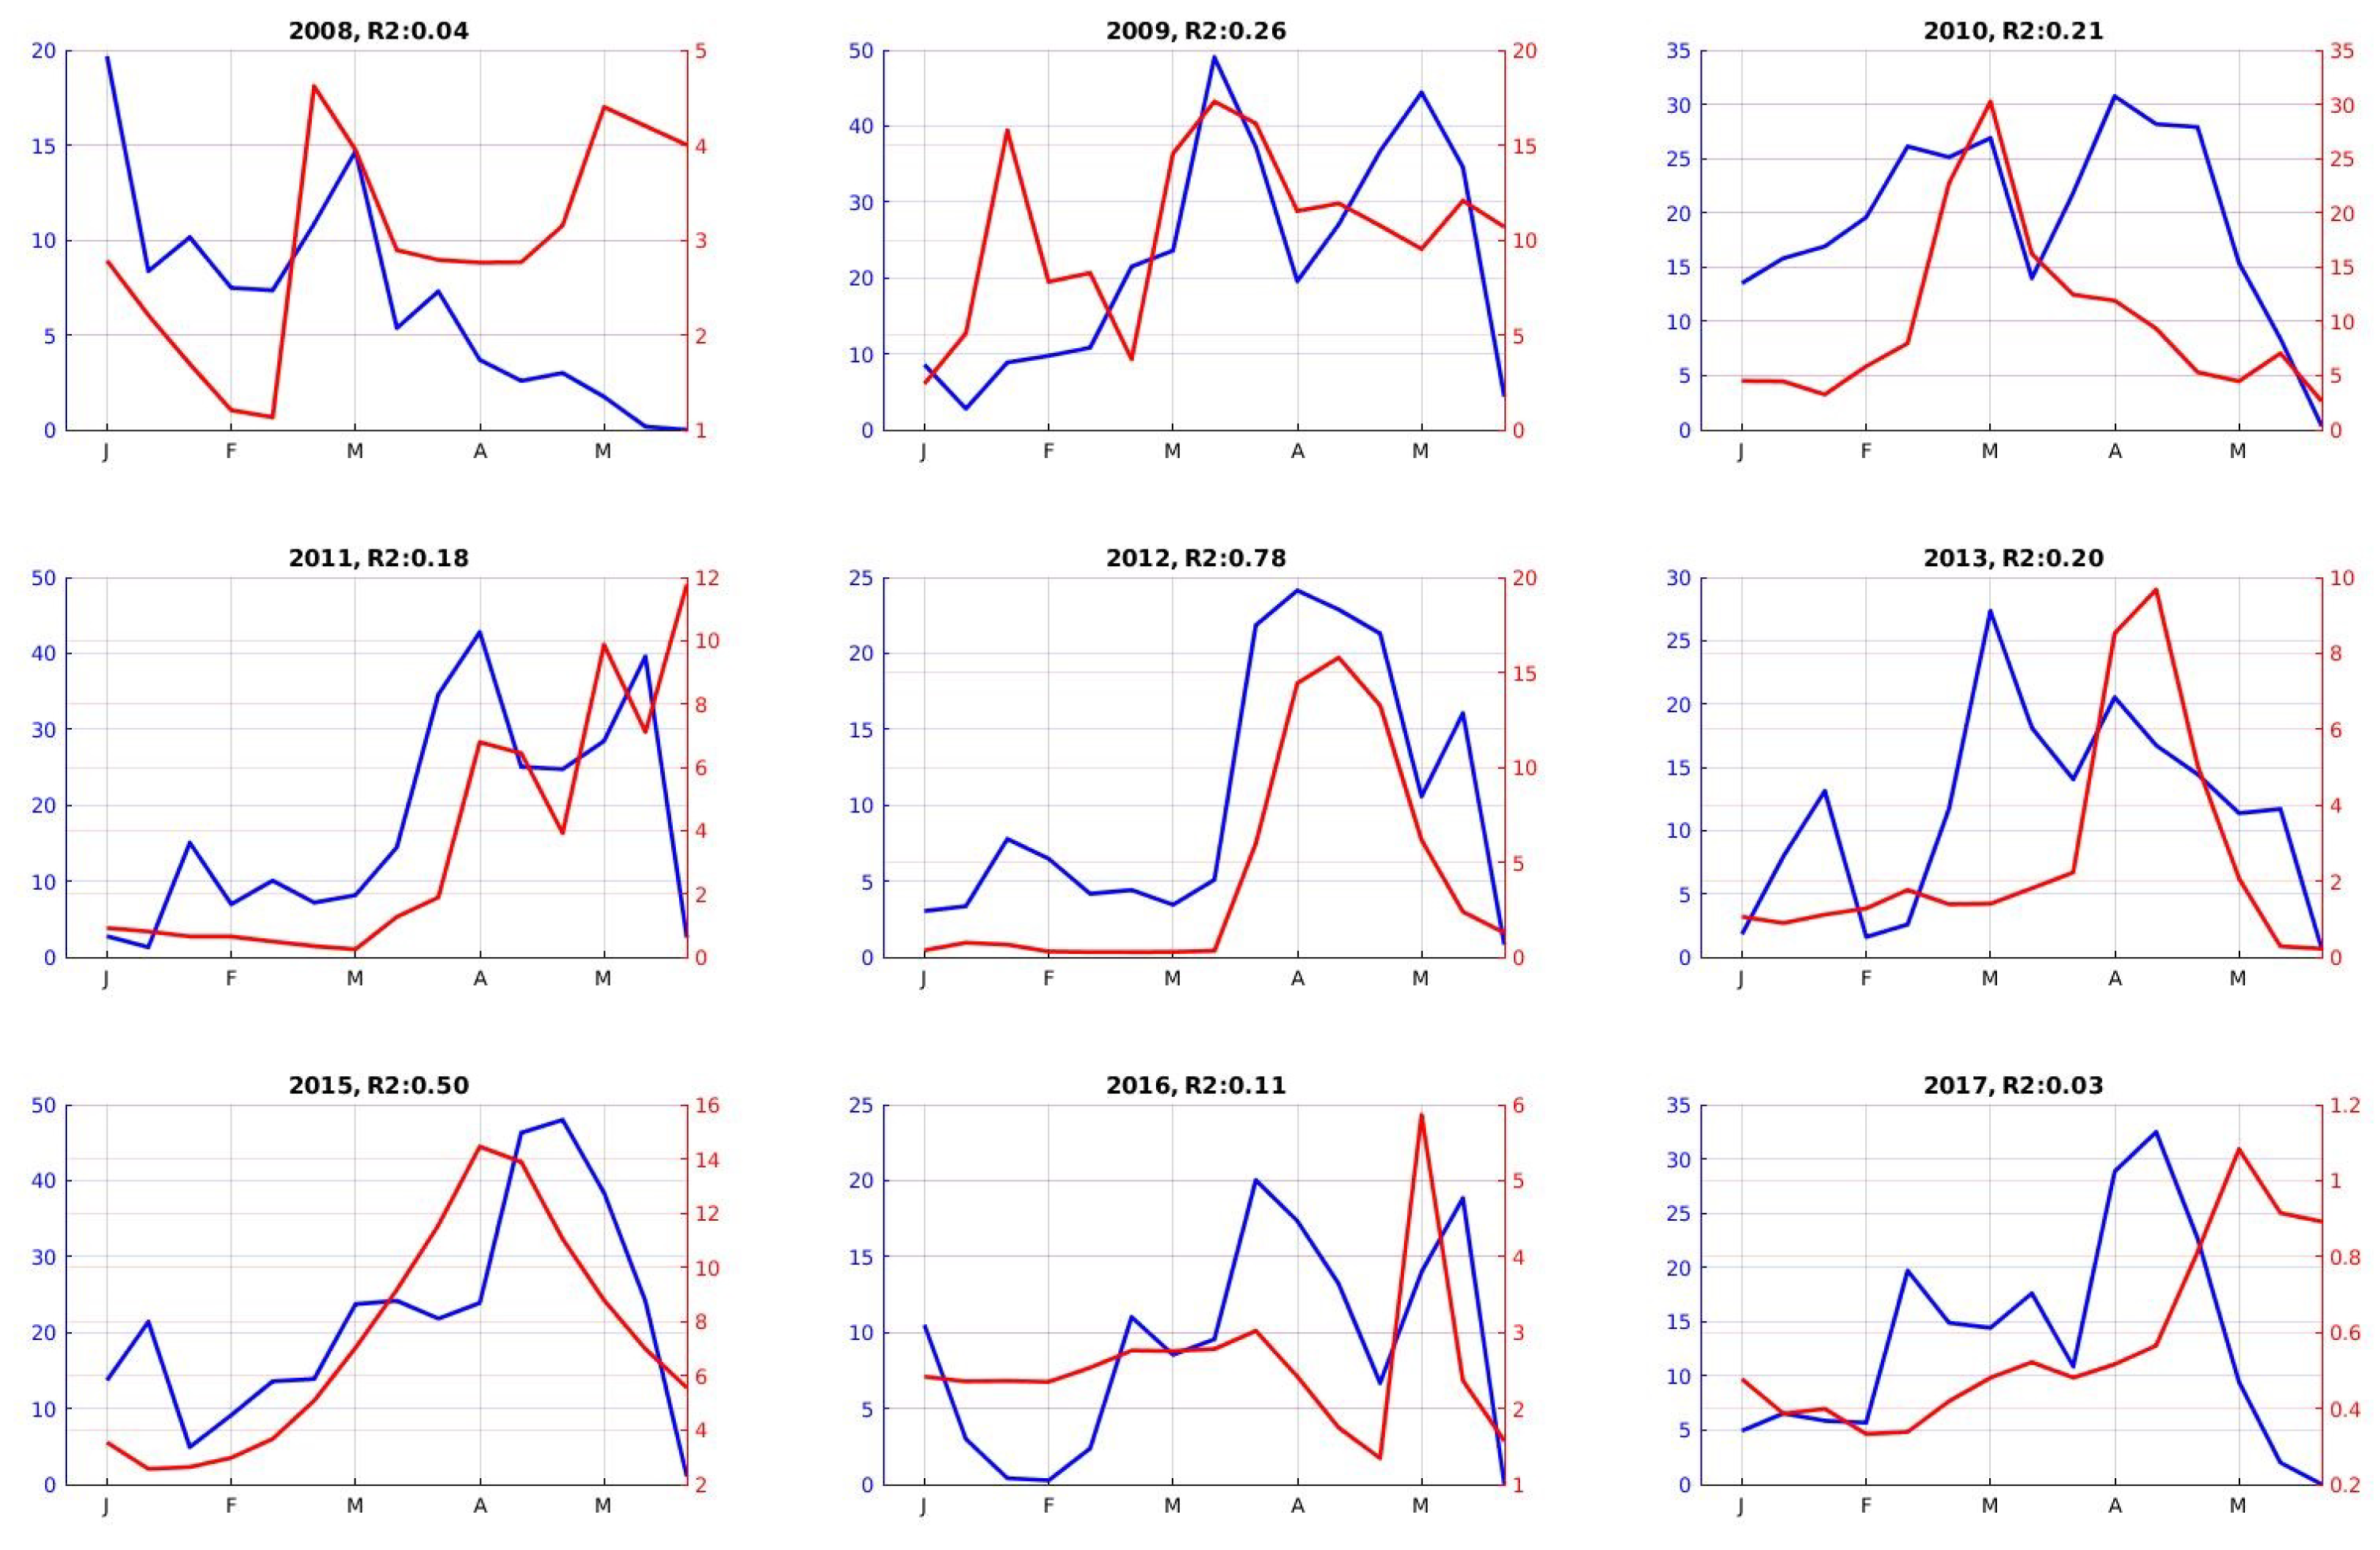
3.1.4. Ourika River Discharge
3.2. Variations of the Simulated SWE
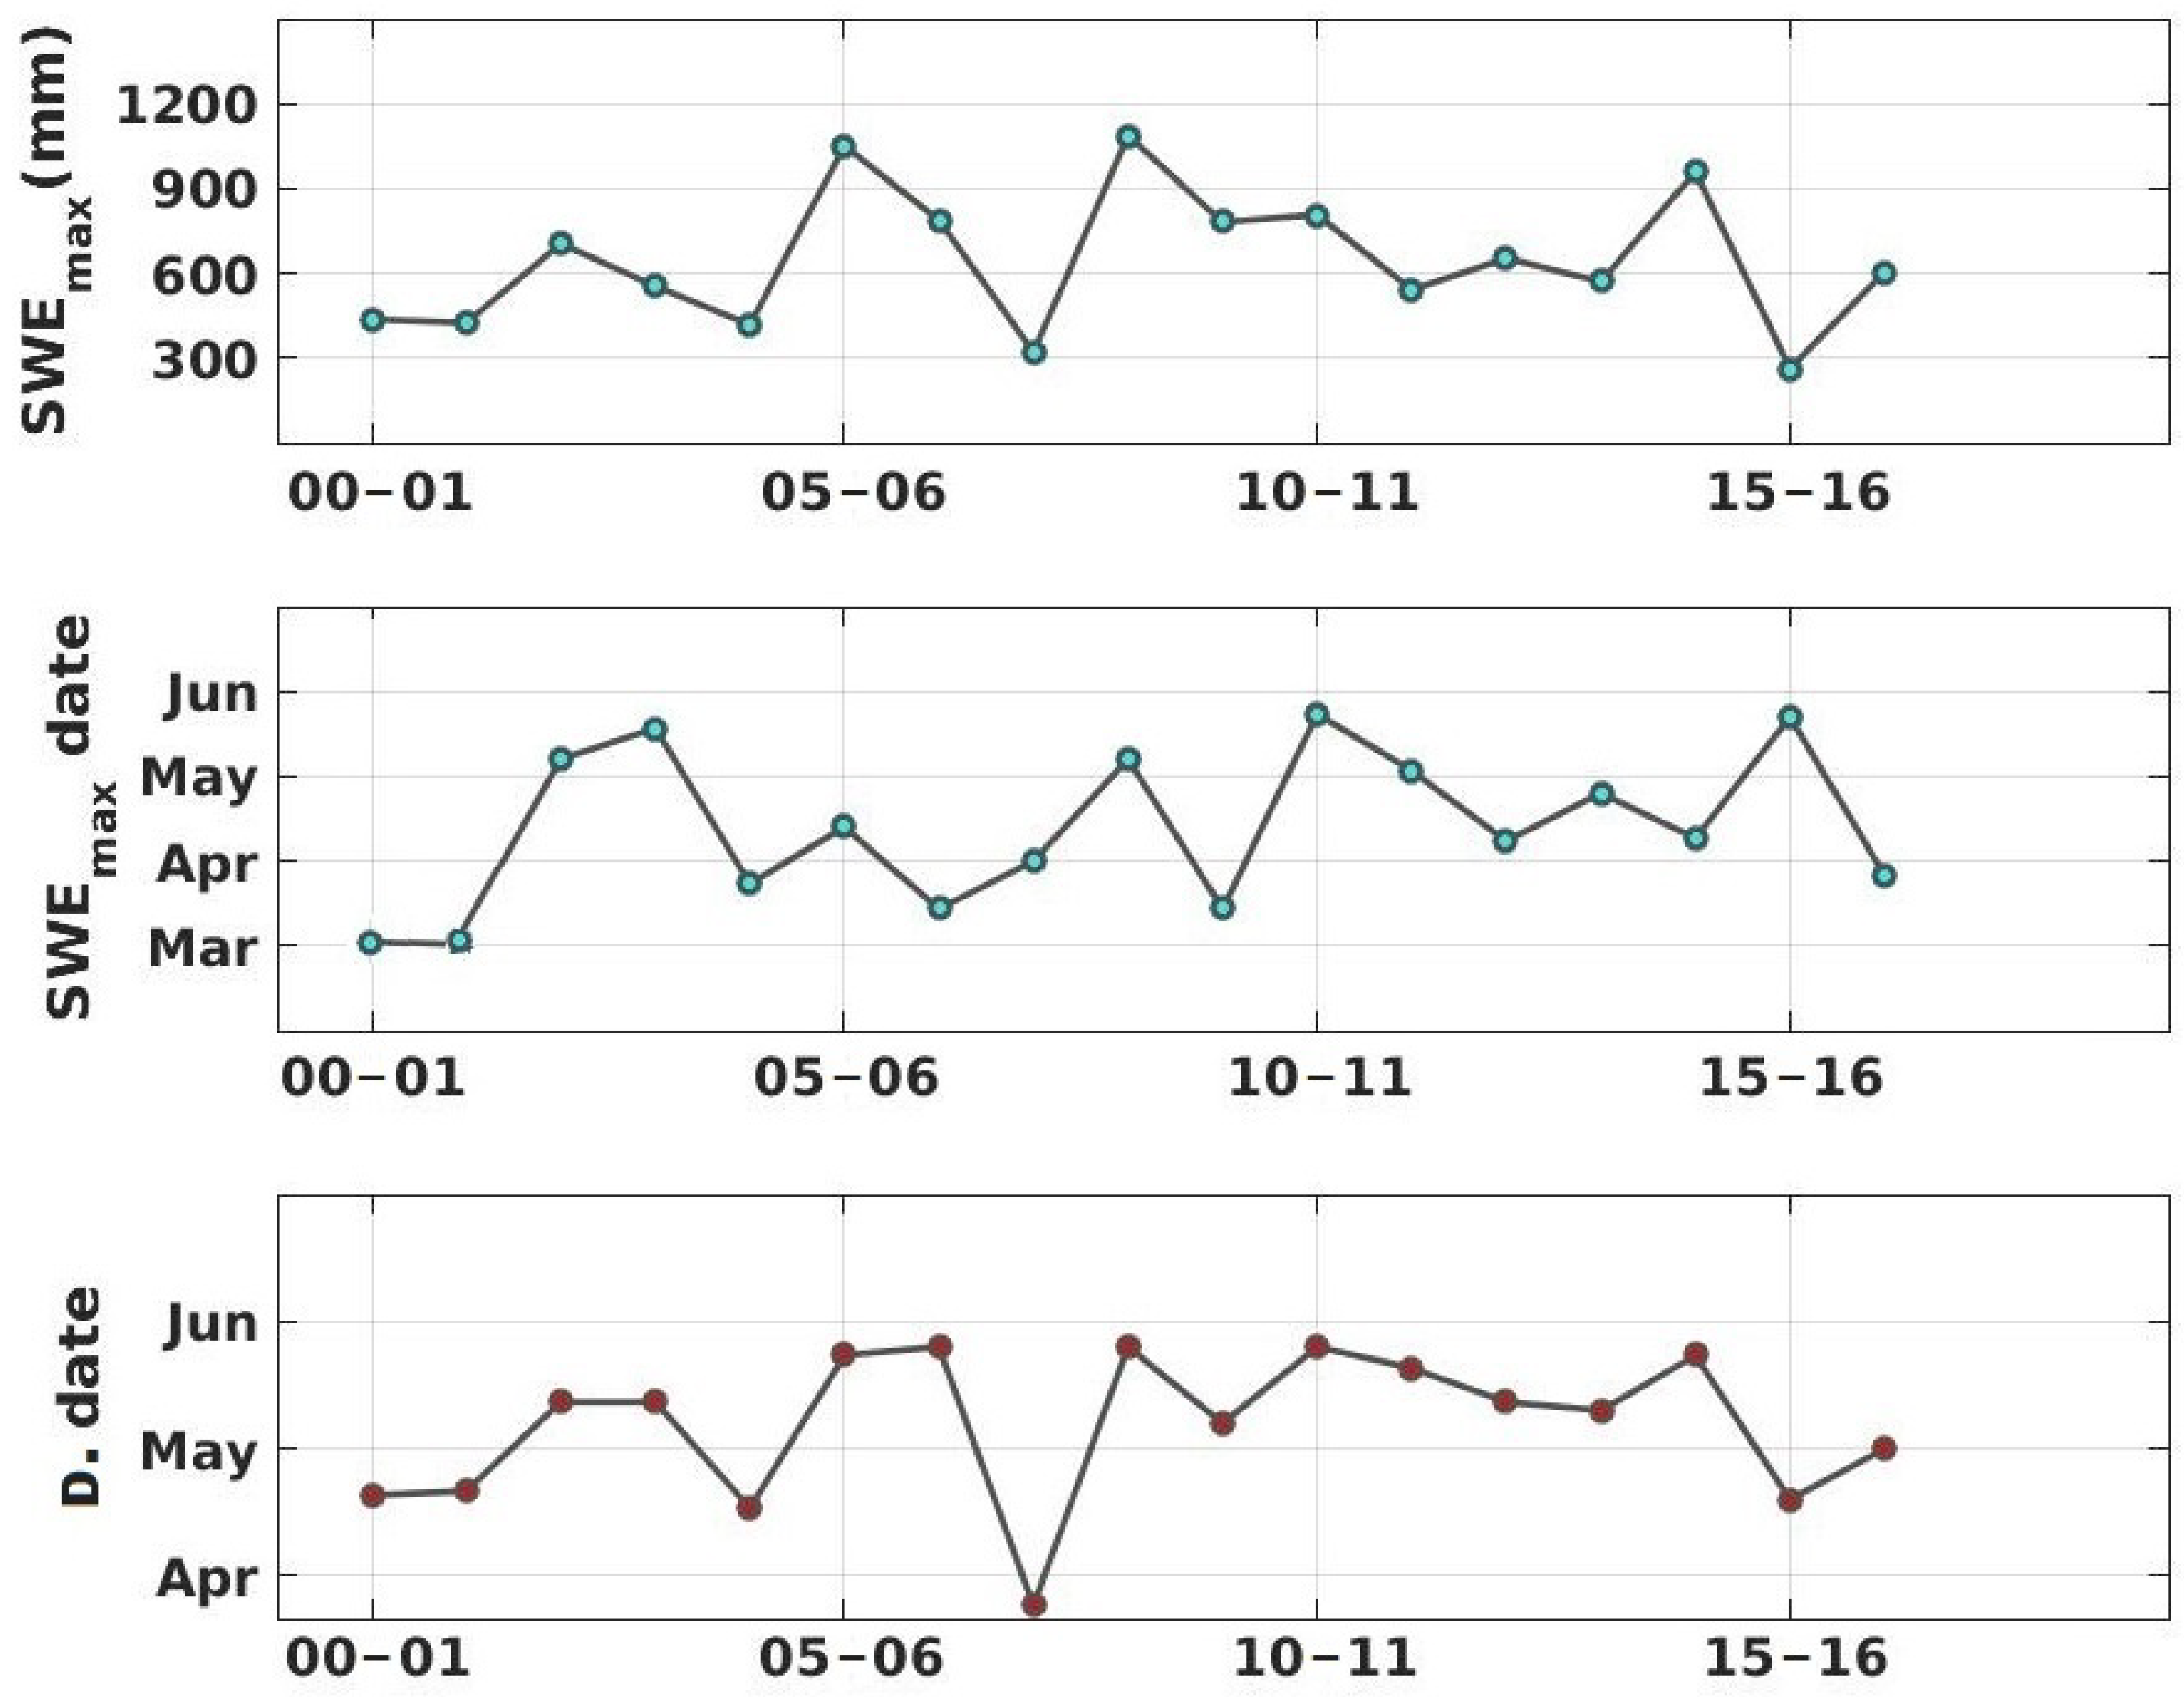
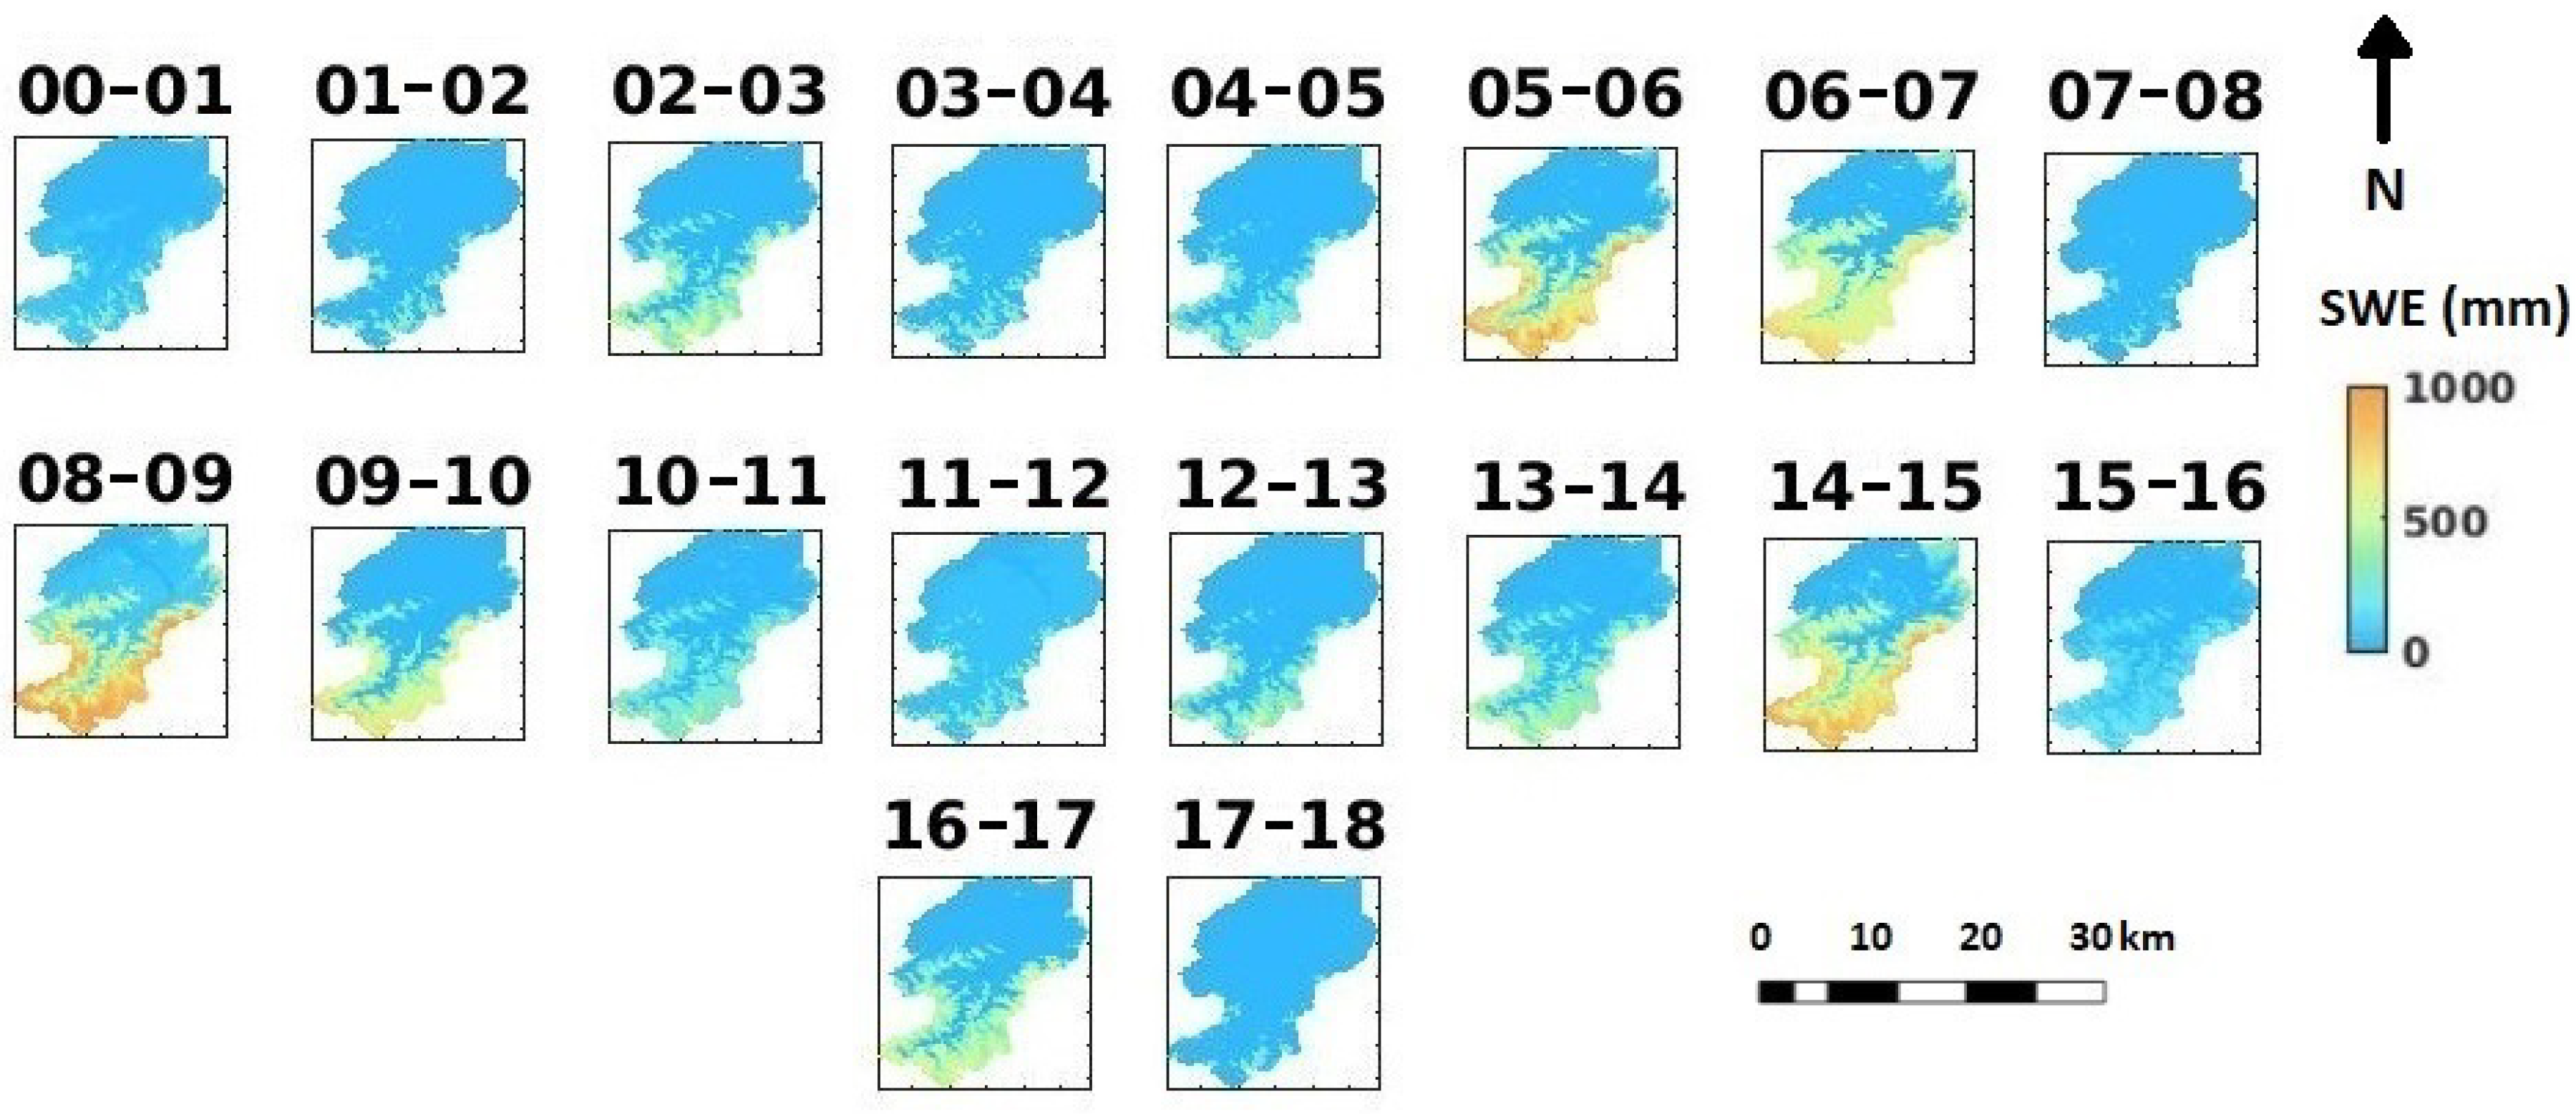
3.2.1. Variations of the Simulated SWE from 2000–2017
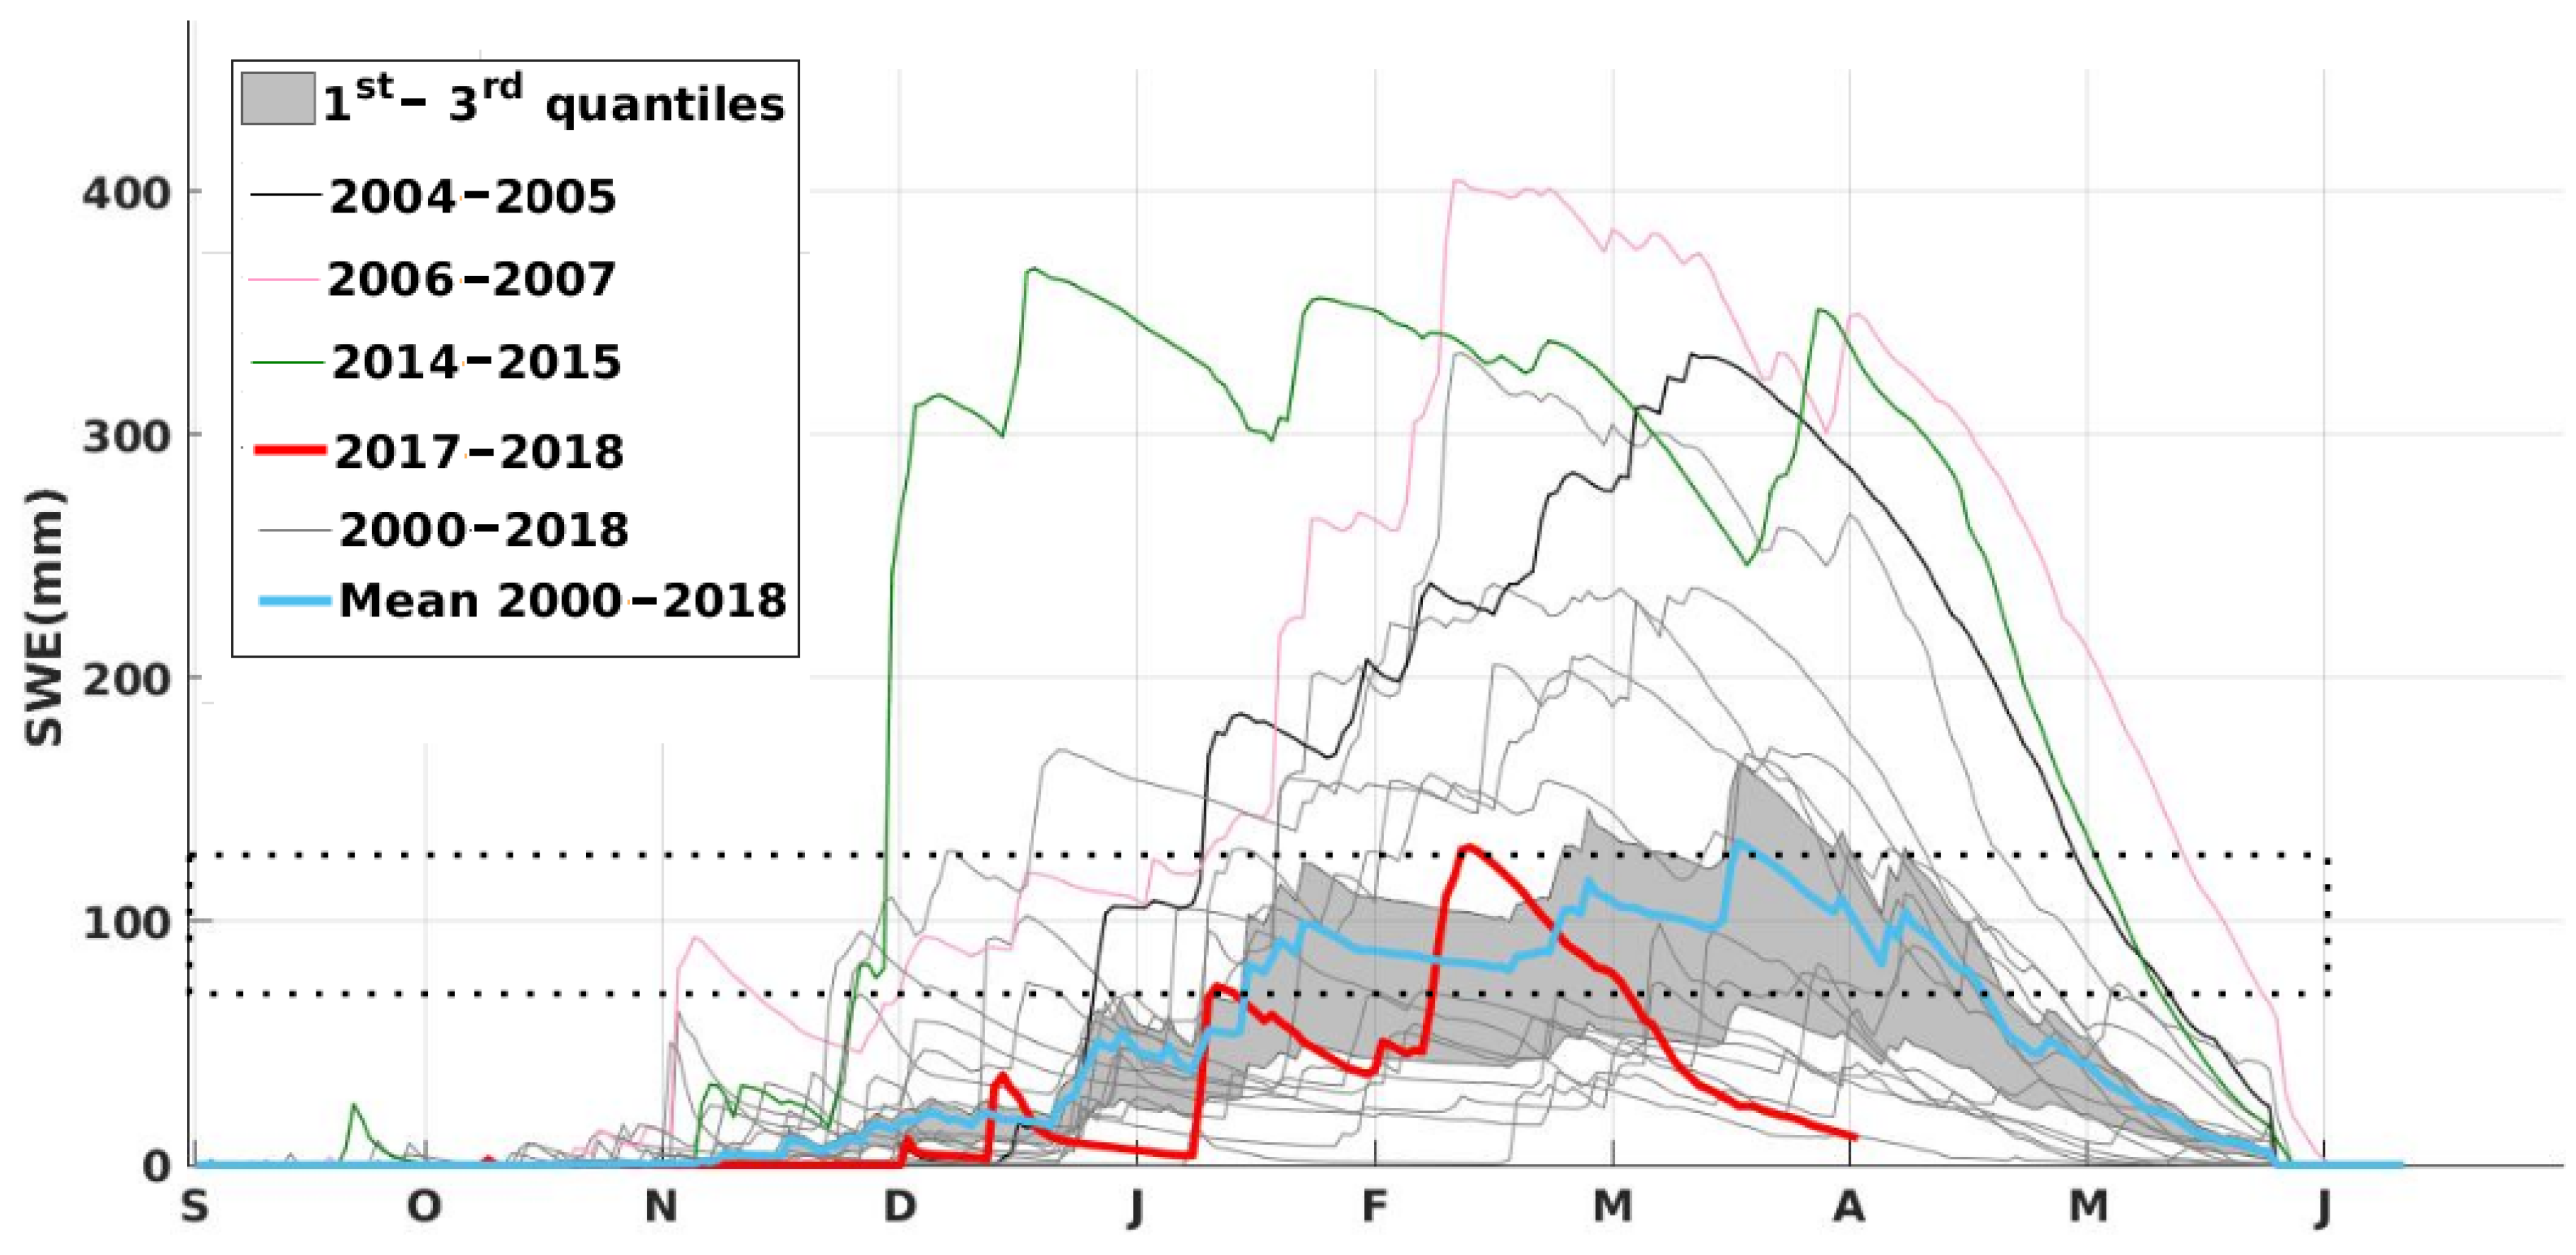
3.2.2. Variations of the Simulated SWE over the 2017–2018 Snow Season
4. Discussion
- In 2000–2001, the model produces high runoff values, while the discharge was low. In the same period, large variations in the SCA were simulated, while MODIS data indicate that the SCA was close to zero (Figure 6).
- In 2003–2004, the simulated SCA is well correlated to the MODIS SCA during the melt season, although the model overestimates the runoff from May–April. This suggests that there is an excess of liquid precipitation in the model forcing.
- In 2008–2009, the runoff simulation is completely anti-correlated with the discharge measurements. Given that the snow depth at Oukaimeden and the SCA over the catchment are properly simulated (Figure 5 and Figure 6), we conclude that the simulated rise in runoff in spring is due to erroneous rainfall events in MERRA-2.
5. Summary and Conclusions
Author Contributions
Funding
Acknowledgments
Conflicts of Interest
References
- Viviroli, D.; Dürr, H.H.; Messerli, B.; Meybeck, M.; Weingartner, R. Mountains of the world, water towers for humanity: Typology, mapping, and global significance. Water Resour. Res. 2007, 43. [Google Scholar] [CrossRef] [Green Version]
- Fayad, A.; Gascoin, S.; Faour, G.; López-Moreno, J.I.; Drapeau, L.; Le Page, M.; Escadafal, R. Snow hydrology in Mediterranean mountain regions: A review. J. Hydrol. 2017, 551, 374–396. [Google Scholar] [CrossRef]
- Jarlan, L.; Khabba, S.; Er-Raki, S.; Le Page, M.; Hanich, L.; Fakir, Y.; Merlin, O.; Mangiarotti, S.; Gascoin, S.; Ezzahar, J.; et al. Remote sensing of water resources in semi-arid Mediterranean areas: The joint international laboratory TREMA. Int. J. Remote Sens. 2015, 36, 4879–4917. [Google Scholar] [CrossRef]
- Moroccan Minster. Recensement Général de la Population et de l’habitat du Maroc (2014). Available online: https://www.hcp.ma/Note-sur-les-premiers-resultats-du-Recensement-General-de-la-Population-et-de-l-Habitat-2014_a1516.html (accessed on 15 May 2018).
- Simonneaux, V.; Hanich, L.; Boulet, G.; Thomas, S. Modelling runoff in the Rheraya Catchment (High Atlas, Morocco) using the simple daily model GR4J. Trends over the last decades. In Proceedings of the 13th IWRA World Water Congress, Montpellier, France, 1–4 September 2008. [Google Scholar]
- Boudhar, A.; Hanich, L.; Boulet, G.; Duchemin, B.; Berjamy, B.; Chehbouni, A. Evaluation of the snowmelt runoff model in the Moroccan High Atlas Mountains using two snow-cover estimates. Hydrol. Sci. J. 2009, 54, 1094–1113. [Google Scholar] [CrossRef]
- Hajhouji, Y.; Gascoin, S.; Fakir, Y.; Richard, R.; Simonneaux, V.; Chehbouni, A. Evaluation d’un modèle pluie-debit sur le bassin versant de la Rheraya dans le Haut Atlas marocain/Evaluation of a rainfall-runoff model in the Rheraya catchment (High Atlas Morocco). La Houille Blanche 2018, in press. [Google Scholar]
- Agence japonaise de cooperation internationale. Etude du Plan de Gestion Integree des Ressources en eau dans la Plaine du Haouz; Agence du bassin hydraulique du Tensift (ABHT): Marrakech, Morocco, 2008.
- Marchane, A.; Jarlan, L.; Hanich, L.; Boudhar, A.; Gascoin, S.; Tavernier, A.; Filali, N.; Le Page, M.; Hagolle, O.; Berjamy, B. Assessment of daily MODIS snow cover products to monitor snow cover dynamics over the Moroccan Atlas mountain range. Remote Sens. Environ. 2015, 160, 72–86. [Google Scholar] [CrossRef]
- Hock, R. Temperature index melt modelling in mountain areas. J. Hydrol. 2003, 282, 104–115. [Google Scholar] [CrossRef] [Green Version]
- Marks, D.; Domingo, J.; Susong, D.; Link, T.; Garen, D. A spatially distributed energy balance snowmelt model for application in mountain basins. Hydrol. Process. 1999, 13, 1935–1959. [Google Scholar] [CrossRef]
- Boudhar, A.; Boulet, G.; Hanich, L.; Sicart, J.E.; Chehbouni, A. Energy fluxes and melt rate of a seasonal snow cover in the Moroccan High Atlas. Hydrol. Sci. J. 2016, 61, 931–943. [Google Scholar] [CrossRef]
- López-Moreno, J.; Gascoin, S.; Herrero, J.; Sproles, E.; Pons, M.; Alonso-González, E.; Hanich, L.; Boudhar, A.; Musselman, K.; Molotch, N.; et al. Different sensitivities of snowpacks to warming in Mediterranean climate mountain areas. Environ. Res. Lett. 2017, 12, 074006. [Google Scholar] [CrossRef]
- Dozier, J.; Bair, E.H.; Davis, R.E. Estimating the spatial distribution of snow water equivalent in the world’s mountains. Wiley Interdiscip. Rev. Water 2016, 3, 461–474. [Google Scholar] [CrossRef]
- Brun, E.; Vionnet, V.; Boone, A.; Decharme, B.; Peings, Y.; Valette, R.; Karbou, F.; Morin, S. Simulation of northern eurasian local snow depth, mass, and density using a detailed snowpack model and meteorological reanalyses. J. Hydrometeorol. 2013, 14, 203–219. [Google Scholar] [CrossRef]
- Mernild, S.H.; Liston, G.E.; Hiemstra, C.A.; Malmros, J.K.; Yde, J.C.; McPhee, J. The Andes Cordillera. Part I: Snow distribution, properties, and trends (1979–2014). Int. J. Climatol. 2017, 37, 1680–1698. [Google Scholar] [CrossRef]
- Alonso-González, E.; López-Moreno, J.I.; Gascoin, S.; Ojeda, M.G.V.; Sanmiguel-Vallelado, A.; Navarro-Serrano, F.; Revuelto, J.; Ceballos, A.; Esteban-Parra, M.J.; Essery, R. Daily gridded datasets of snow depth and snow water equivalent for the Iberian Peninsula from 1980 to 2014. Earth Syst. Sci. Data 2018, 10, 303–315. [Google Scholar] [CrossRef] [Green Version]
- Reichle, R.H.; Liu, Q.; Koster, R.D.; Draper, C.S.; Mahanama, S.P.; Partyka, G.S. Land surface precipitation in MERRA-2. J. Clim. 2017, 30, 1643–1664. [Google Scholar] [CrossRef]
- Reichle, R.H.; Draper, C.S.; Liu, Q.; Girotto, M.; Mahanama, S.P.; Koster, R.D.; De Lannoy, G.J. Assessment of MERRA-2 land surface hydrology estimates. J. Clim. 2017, 30, 2937–2960. [Google Scholar] [CrossRef]
- Liston, G.E.; Elder, K. A distributed snow-evolution modeling system (SnowModel). J. Hydrometeorol. 2006, 7, 1259–1276. [Google Scholar] [CrossRef]
- AfricaNews. Morocco Experiences Heavy Snowfall, Social Media Reacts. Available online: http://www.africanews.com/2018/01/09/morocco-experiences-heavy-snowfall-social-media-reacts/ (accessed on 17 May 2018).
- Morocco: A Rare Snowfall for Second Time This Winter. Available online: https://www.aljazeera.com/news/2018/02/morocco-rare-snow-falls-time-winter-180207104614251.html (accessed on 10 April 2018).
- Juillerat, M. Etude Hydrologique Comparative de 5 Bassins Versants du Haut Atlas Marocain. Ph.D. Thesis, Faculté de Sciences et Techniques Département de sciences de la terre Cadi Ayyad, Marrakech, Morocco, 2004. [Google Scholar]
- Zkhiri, W.; Tramblay, Y.; Hanich, L.; Berjamy, B. Regional flood frequency analysis in the High Atlas mountainous catchments of Morocco. Nat. Hazards 2017, 86, 953–967. [Google Scholar] [CrossRef]
- Jarvis, A.; Reuter, H.I.; Nelson, A.; Guevara, E. Hole-Filled SRTM for the Globe Version 4. CGIAR-CSI SRTM 90m Database. 2008. Available online: http://srtm.csi.cgiar.org (accessed on 20 August 2018).
- Baba, W.; Gascoin, S.; Hanich, L.; Kinnard, C. Contribution of high resolution remote sensing data to the modeling of the snow cover the in Atlas Mountains. In Proceedings of the EGU General Assembly Conference Abstracts, Vienna, Austria, 23–28 April 2017; Volume 19, p. 19250. [Google Scholar]
- Bontemps, S.; Defourny, P.; Radoux, J.; Van Bogaert, E.; Lamarche, C.; Achard, F.; Mayaux, P.; Boettcher, M.; Brockmann, C.; Kirches, G.; et al. Consistent global land cover maps for climate modelling communities: Current achievements of the ESA’s land cover CCI. In Proceedings of the ESA Living Planet Symposium, Edinburgh, UK, 9–13 Septembe 2013; pp. 9–13. [Google Scholar]
- Hall, D.K.; Riggs, G.A.; Salomonson, V.V.; Barton, J.; Casey, K.; Chien, J.; DiGirolamo, N.; Klein, A.; Powell, H.; Tait, A. Algorithm Theoretical Basis Document (ATBD) for the MODIS Snow and Sea Ice-Mapping Algorithms; NASA Goddard Space Flight Center: Greenbelt, MD, USA, 2001; p. 45.
- Bruland, O.; Liston, G.E.; Vonk, J.; Sand, K.; Killingtveit, Å. Modelling the snow distribution at two high arctic sites at Svalbard, Norway, and at an alpine site in central Norway. Hydrol. Res. 2004, 35, 191–208. [Google Scholar] [CrossRef]
- Hiemstra, C.A.; Liston, G.E.; Reiners, W.A. Observing, modelling, and validating snow redistribution by wind in a Wyoming upper treeline landscape. Ecol. Model. 2006, 197, 35–51. [Google Scholar] [CrossRef]
- Mernild, S.H.; Hasholt, B.; Liston, G.E. Climatic control on river discharge simulations, Zackenberg River drainage basin, northeast Greenland. Hydrol. Process. Int. J. 2008, 22, 1932–1948. [Google Scholar] [CrossRef]
- Mernild, S.; Liston, G.; Steffen, K.; Broeke, M.; Hasholt, B. Runoff and mass-balance simulations from the Greenland Ice Sheet at Kangerlussuaq (Søndre Strømfjord) in a 30-year perspective, 1979–2008. Cryosphere 2010, 4, 231–242. [Google Scholar] [CrossRef] [Green Version]
- Mernild, S.H.; Liston, G.E. Greenland freshwater runoff. Part II: Distribution and trends, 1960–2010. J. Clim. 2012, 25, 6015–6035. [Google Scholar] [CrossRef]
- Gascoin, S.; Lhermitte, S.; Kinnard, C.; Bortels, K.; Liston, G.E. Wind effects on snow cover in Pascua-Lama, Dry Andes of Chile. Adv. Water Resour. 2013, 55, 25–39. [Google Scholar] [CrossRef] [Green Version]
- Szczypta, C.; Gascoin, S.; Houet, T.; Hagolle, O.; Dejoux, J.F.; Vigneau, C.; Fanise, P. Impact of climate and land cover changes on snow cover in a small Pyrenean catchment. J. Hydrol. 2015, 521, 84–99. [Google Scholar] [CrossRef] [Green Version]
- Suzuki, K.; Kodama, Y.; Nakai, T.; Liston, G.E.; Yamamoto, K.; Ohata, T.; Ishii, Y.; Sumida, A.; Hara, T.; Ohta, T. Impact of land-use changes on snow in a forested region with heavy snowfall in Hokkaido, Japan. Hydrol. Sci. J. 2011, 56, 443–467. [Google Scholar] [CrossRef] [Green Version]
- Suzuki, K.; Liston, G.E.; Kodama, Y. Variations of winter surface net shortwave radiation caused by land-use change in northern Hokkaido, Japan. J. For. Res. 2015, 20, 281–292. [Google Scholar] [CrossRef]
- Hiemstra, C.A.; Liston, G.E.; Reiners, W.A. Snow redistribution by wind and interactions with vegetation at upper treeline in the Medicine Bow Mountains, Wyoming, USA. Arct. Antarct. Alp. Res. 2002, 34, 262–273. [Google Scholar] [CrossRef]
- Liston, G.E.; Haehnel, R.B.; Sturm, M.; Hiemstra, C.A.; Berezovskaya, S.; Tabler, R.D. Simulating complex snow distributions in windy environments using SnowTran-3D. J. Glaciol. 2007, 53, 241–256. [Google Scholar] [CrossRef]
- Liston, G.E.; Elder, K. A meteorological distribution system for high-resolution terrestrial modeling (MicroMet). J. Hydrometeorol. 2006, 7, 217–234. [Google Scholar] [CrossRef]
- Kirchner, P.; Bales, R.; Molotch, N.; Flanagan, J.; Guo, Q. LiDAR measurement of seasonal snow accumulation along an elevation gradient in the southern Sierra Nevada, California. Hydrol. Earth Syst. Sci. 2014, 18, 4261–4275. [Google Scholar] [CrossRef] [Green Version]
- Nadal-Romero, E.; Revuelto, J.; Errea, P.; López-Moreno, J. The application of terrestrial laser scanner and SfM photogrammetry in measuring erosion and deposition processes in two opposite slopes in a humid badlands area (central Spanish Pyrenees). Soil 2015, 1, 561. [Google Scholar] [CrossRef]
- Boesch, R.; Bühler, Y.; Marty, M.; Ginzler, C. Comparison of digital surface models for snow depth mapping with UAV and aerial cameras. In Proceedings of the XXIII ISPRS Congress; ISPRS: Prague, Czech Republic, 2016; pp. 453–458. [Google Scholar]
- Gascoin, S.; Hagolle, O.; Huc, M.; Jarlan, L.; Dejoux, J.; Szczypta, C.; Marti, R.; Sánchez, R. A snow cover climatology for the Pyrenees from MODIS snow products. Hydrol. Earth Syst. Sci. 2015, 19, 2337. [Google Scholar] [CrossRef] [Green Version]
- DeWalle, D.R.; Rango, A. Principles of Snow Hydrology; Cambridge University Press: Cambridge, UK, 2008. [Google Scholar]
- Fassnacht, S. Estimating Alter-shielded gauge snowfall undercatch, snowpack sublimation, and blowing snow transport at six sites in the coterminous USA. Hydrol. Process. 2004, 18, 3481–3492. [Google Scholar] [CrossRef]
- Gelaro, R.; McCarty, W.; Suárez, M.J.; Todling, R.; Molod, A.; Takacs, L.; Randles, C.A.; Darmenov, A.; Bosilovich, M.G.; Reichle, R.; et al. The modern-era retrospective analysis for research and applications, version 2 (MERRA-2). J. Clim. 2017, 30, 5419–5454. [Google Scholar] [CrossRef]
- Schulz, O.; De Jong, C. Snowmelt and sublimation: Field experiments and modelling in the High Atlas Mountains of Morocco. Hydrol. Earth Syst. Sci. Discuss. 2004, 8, 1076–1089. [Google Scholar] [CrossRef]
- Margulis, S.A.; Cortés, G.; Girotto, M.; Durand, M. A Landsat-era Sierra Nevada snow reanalysis (1985–2015). J. Hydrometeorol. 2016, 17, 1203–1221. [Google Scholar] [CrossRef]
- Girotto, M.; Cortés, G.; Margulis, S.A.; Durand, M. Examining spatial and temporal variability in snow water equivalent using a 27 year reanalysis: Kern River watershed, Sierra Nevada. Water Resour. Res. 2014, 50, 6713–6734. [Google Scholar] [CrossRef] [Green Version]

| Catchment | Area (km) | (m) | (m) | Q (Mm) | (mm) | |
|---|---|---|---|---|---|---|
| N’fis (at Lalla Takerkoust) | 1288 | 750 | 2069 | 175 | 136 | 19 |
| R’dat (at Sidi Rahal) | 557 | 645 | 2091 | 72 | 129 | 7 |
| Zat (at Tafriat) | 540 | 720 | 2293 | 104 | 193 | 22 |
| Ourika (at Aghbalou) | 507 | 974 | 2438 | 156 | 308 | 41 |
| Rheraya (at Tahanaout) | 225 | 1036 | 2577 | 48 | 213 | 36 |
| Variable Name | Description | Unit |
|---|---|---|
| PHIS | Geopotential height | m/s |
| LON | Longitude | ° |
| LAT | Latitude | ° |
| T2M | Temperature at 2 m | K |
| QV2M | 2-m specific humidity | kg·kg |
| U2M | 2-m eastward wind | m·s |
| V2M | 2-m northward wind | m·s |
| PRECTOTCORR | Precipitation rate | kg·m·s |
| Year | 2004–2005 | 2005–2006 | 2008–2009 | 2010–2011 | 2013–2014 | 2014–2015 |
|---|---|---|---|---|---|---|
| RMSE | 0.21 | 0.19 | 0.22 | 0.15 | 0.33 | 0.17 |
| Bias | 0.06 | −0.07 | 0.08 | 0.03 | −0.11 | 0.01 |
| 0.37 | 0.88 | 0.82 | 0.49 | 0.66 | 0.92 |
| Years | 2000–2001 | 2001–2002 | 2002–2003 | 2003–2004 | 2004–2005 | 2005–2006 | 2006–2007 | 2007–2008 | 2008–2009 |
| SCA | 0.32 | 0.52 | 0.68 | 0.62 | 0.57 | 0.71 | 0.73 | 0.61 | 0.89 |
| Q | 0.32 | 0.02 | 0.81 | 0.48 | 0.48 | 0.68 | 0.71 | 0.62 | 0.85 |
| Years | 2009–2010 | 2010–2011 | 2011–2012 | 2012–2013 | 2013–2014 | 2014–2015 | 2015–2016 | 2016–2017 | 2017–2018 |
| SCA | 0.87 | 0.87 | 0.81 | 0.80 | 0.77 | 0.90 | 0.88 | 0.90 | 0.73 |
| Q | 0.25 | 0.72 | 0.85 | 0.16 | NA | 0.78 | 0.39 | 0.01 | NA |
© 2018 by the authors. Licensee MDPI, Basel, Switzerland. This article is an open access article distributed under the terms and conditions of the Creative Commons Attribution (CC BY) license (http://creativecommons.org/licenses/by/4.0/).
Share and Cite
Baba, M.W.; Gascoin, S.; Jarlan, L.; Simonneaux, V.; Hanich, L. Variations of the Snow Water Equivalent in the Ourika Catchment (Morocco) over 2000–2018 Using Downscaled MERRA-2 Data. Water 2018, 10, 1120. https://doi.org/10.3390/w10091120
Baba MW, Gascoin S, Jarlan L, Simonneaux V, Hanich L. Variations of the Snow Water Equivalent in the Ourika Catchment (Morocco) over 2000–2018 Using Downscaled MERRA-2 Data. Water. 2018; 10(9):1120. https://doi.org/10.3390/w10091120
Chicago/Turabian StyleBaba, Mohamed Wassim, Simon Gascoin, Lionel Jarlan, Vincent Simonneaux, and Lahoucine Hanich. 2018. "Variations of the Snow Water Equivalent in the Ourika Catchment (Morocco) over 2000–2018 Using Downscaled MERRA-2 Data" Water 10, no. 9: 1120. https://doi.org/10.3390/w10091120