Scenario-Based Economic Impact Analysis for Bridge Closures Due to Flooding: A Case Study of North Gyeongsang Province, South Korea

1
Department of Civil Engineering, Andong National University, 1375 Gyeongdong-ro, Andong-si, Gyeongsangbuk-do 36729, Korea
2
School of Construction Engineering, Kyungil University, 50 Gamasil-gil, Hayang-eup, Gyeongsan-si, Gyeongsangbuk-do 38428, Korea
*
Author to whom correspondence should be addressed.
Water 2018, 10(8), 981; https://doi.org/10.3390/w10080981
Submission received: 31 May 2018
/
Revised: 21 July 2018
/
Accepted: 24 July 2018
/
Published: 25 July 2018
(This article belongs to the Special Issue Influence of the Urban Fabric on the Risks of Floods)
Abstract
:Flooding has the ability to severely reduce the capacity of a transportation network. The closure of even a single bridge, which often acts as a critical link in transportation networks, can have a severe impact on the entire network. This impact can lead to significant economic costs resulting from increased travel distances for drivers. Despite the significance of these costs, however, notably few studies have been conducted to determine the societal economic cost that would be incurred due to bridge closures. One possible reason for the lack of studies investigating bridge closures due to flooding could stem from the difficultly in collecting data. To address this issue, the methodology presented in this paper uses modeling and data resources that are available for major cities in most developed countries, including those in South Korea. We evaluate the economic impact of the bridge closures using the new administrative capital of North Gyeongsang Province, South Korea as a case study. Scenarios for the closure of bridges are derived from channel surveys and hydraulic analyses. These methods are used to overcome a lack of adequate data on historical floods in the new city. Traffic is forecasted to estimate the number of road users that would be forced to take detours due to inundated bridges. Contrasting travel distances when bridges are and are not operational, economic costs incurred by bridge closures due to flooding are estimated. The results indicated that bridge closures would result in an economic cost of 1563 USD to 44,180 USD per day, depending on how many bridges are closed and how many people are living in the new city. The estimates from this study will act as guidelines for identifying cost-effective mitigation and preparedness strategies aimed at reducing the frequency and impact of bridge closures due to flooding.
1. Introduction
Bridges provide expedited access from one side of a physical obstacle to another and commonly cross bodies of water, valleys, and roads. Bridges serve as critical links in transportation networks and can enhance social cohesion in their surrounding area by reducing the cost of travel and trade. The closure of even a single bridge can have a severe impact on a transportation network. Closures can result in increased costs due to transport delays and greater travel distances. In extreme cases, bridge closures can significantly reduce economic activity by physically isolating communities from the rest of the transportation network. Despite the importance of bridges in transportation networks, notably few studies estimating economic cost due to bridge closures have been conducted [1,2]. In the limited work within this area of study, most have focused on earthquake-induced bridge closures [3,4,5,6]. However, bridges are also susceptible to closures from flooding. This paper will focus on flood-induced bridge closures. This study is performed for several reasons. Amongst the various types of natural disasters that can lead to bridge closures and failures, floods are a leading cause of bridge closures and failures [7,8]. More intense flooding is expected to occur in flood-prone areas in the future as more frequent and heavier periods of precipitation occur as a result of climate change [9,10,11]. As a result, flood-induced travel disruptions, including bridge closures, are expected to increase.
One possible reason for the lack of studies focused on bridge closures due to flooding may stem from the difficultly in collecting data. To address this issue, the methodology presented in this paper uses modeling and data resources that are available for many major cities in most developed countries, including those in South Korea. We evaluate the economic impact of bridge closures in North Gyeongsang Province (i.e., Gyeongsangbuk-Do), South Korea as a case study. North Gyeongsang Province has been selected as the site of this case study for several reasons. First, North Gyeongsang Province is relocating its administrative capital to a new location and is currently constructing a new city for it. The new city’s (The city under examination has yet to be named by the Korean Government. In this paper it will be referred to as “the new city.”) construction is scheduled for completion by the end of 2018. Historical traffic data for the area would not be representative of the new city’s future conditions because the proposed location was previously used for agricultural purposes. Therefore, the methodology applied in this paper does not rely on detailed historical traffic data. Second, this location receives over half of its total annual precipitation in the summer months. Third, rivers in this providence are generally narrow, winding, and shallow, which can lead to rapid increases in water levels. The combination of these last two factors increases the likelihood of flooding.
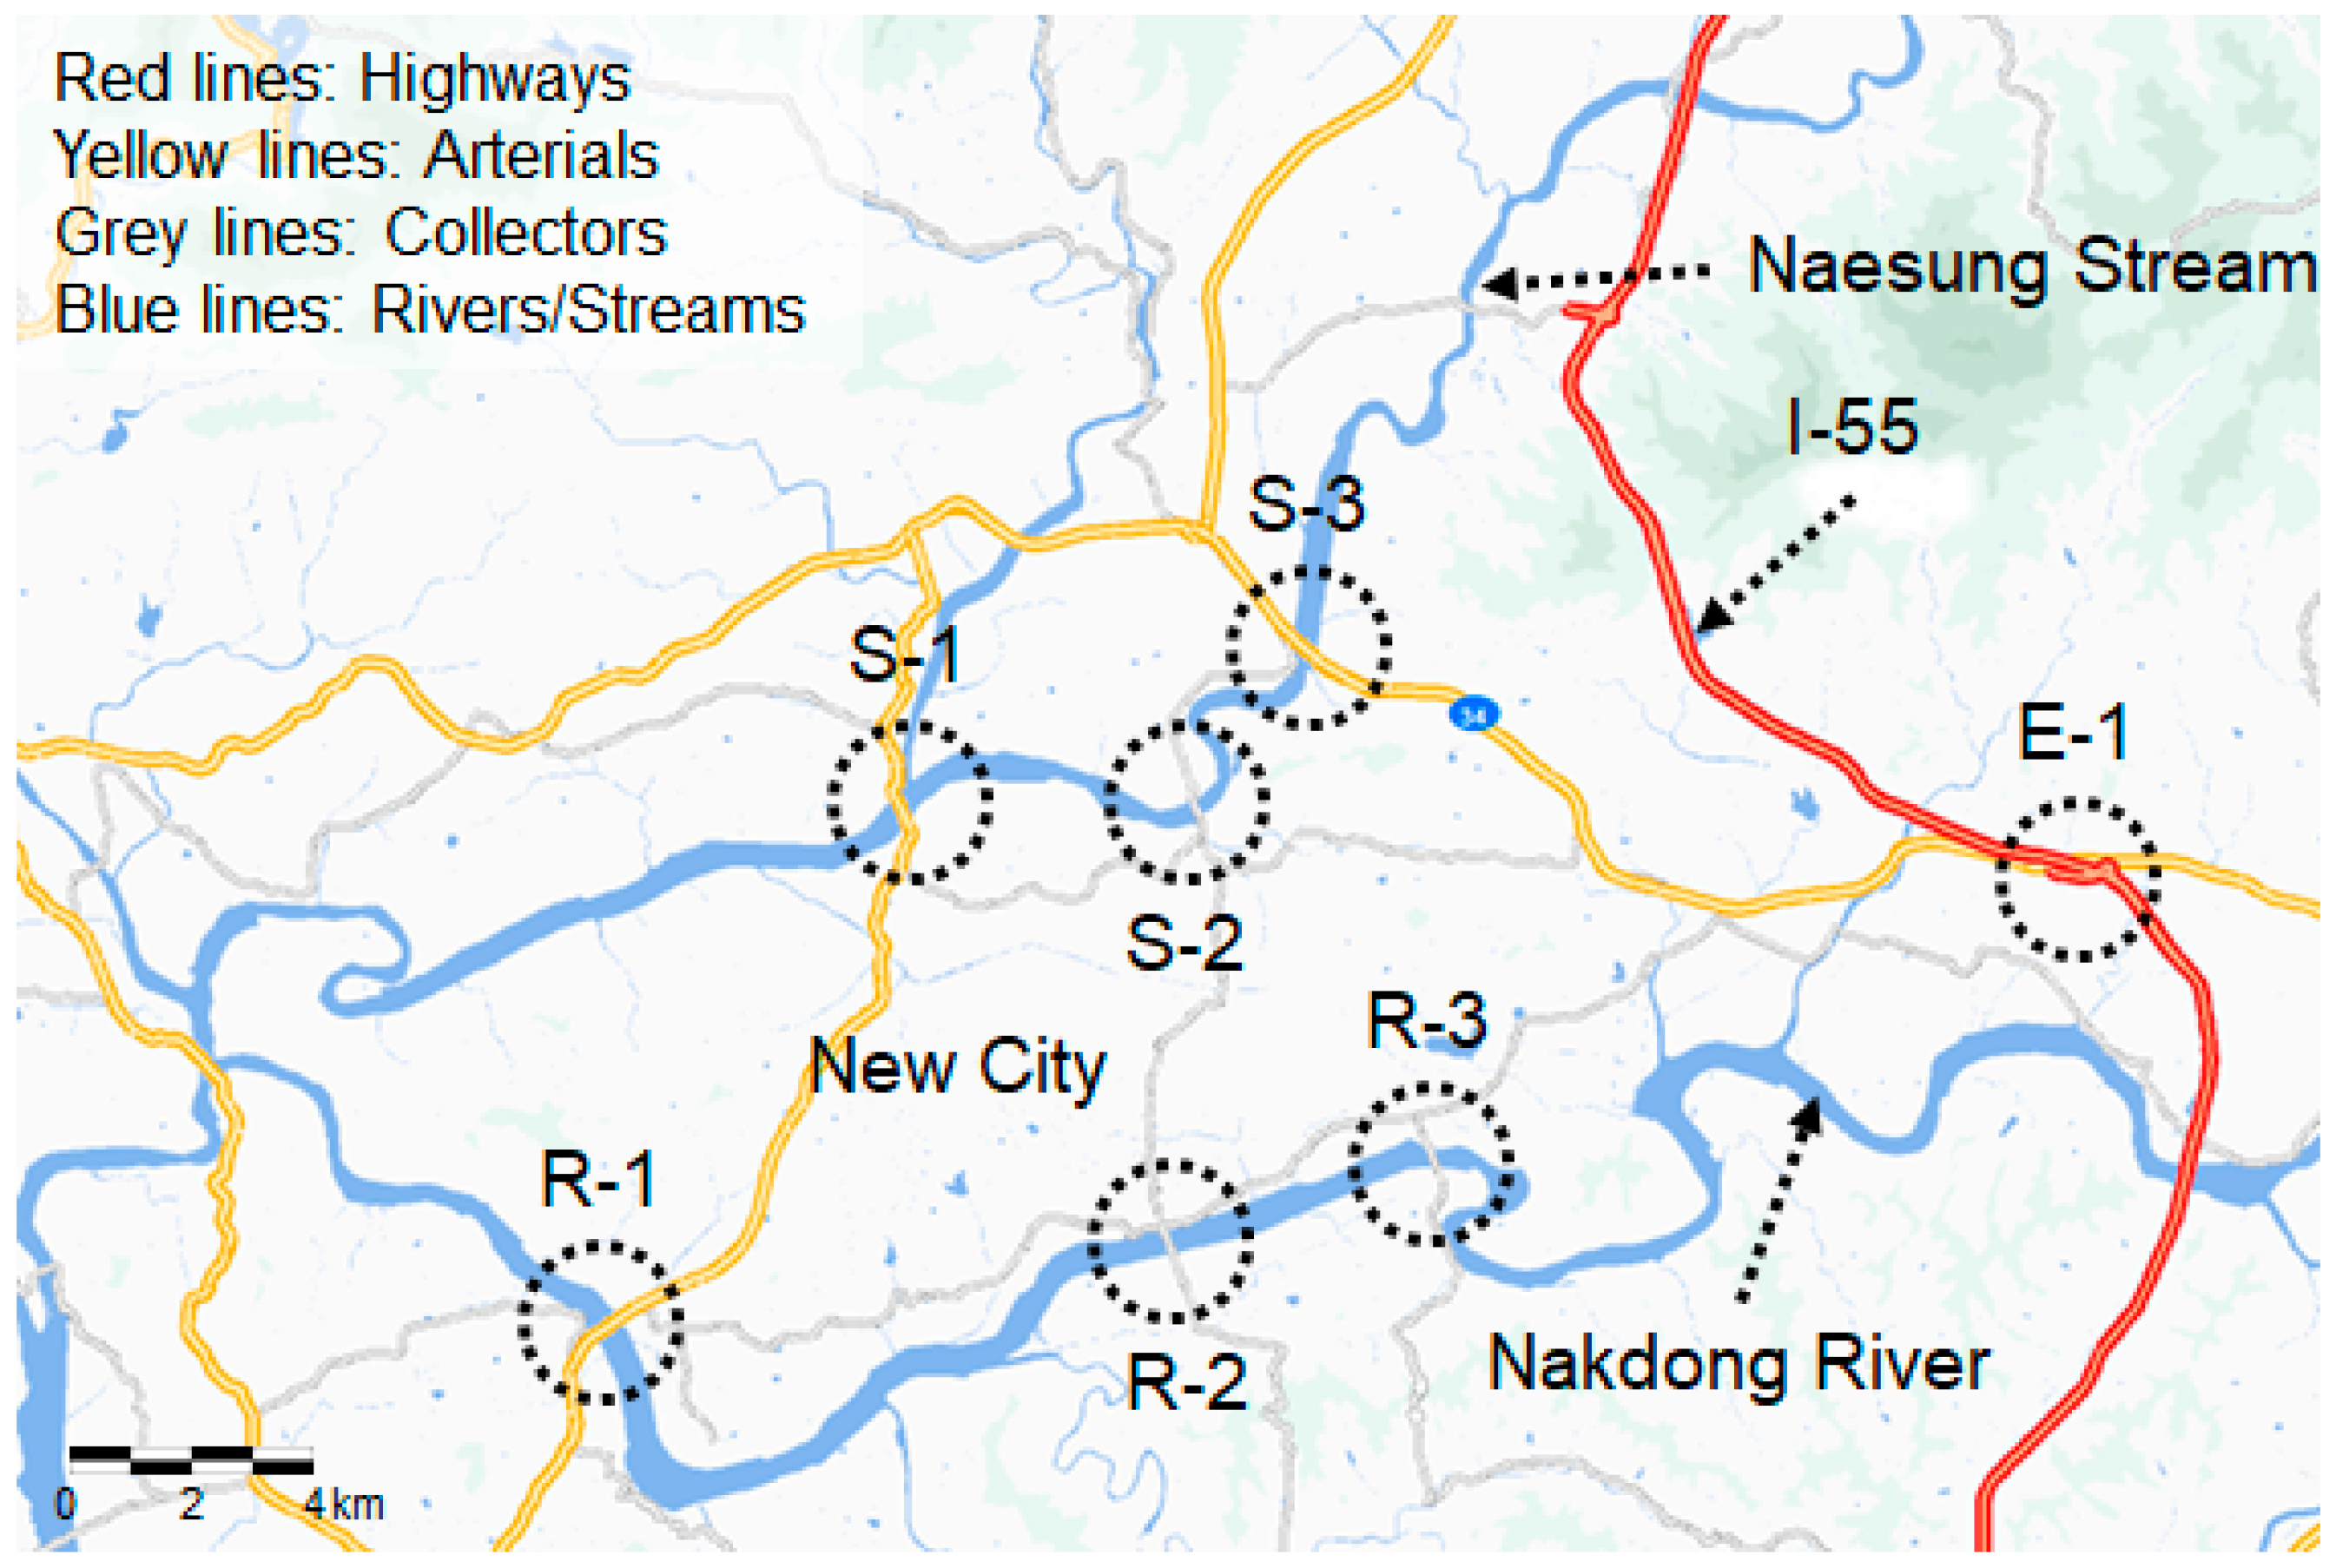
The new city is highly susceptible to flooding due to its geographic location. The new city has an area of 10.966 km2 and is surrounded by the Nakdong River, the Naesung Stream (a tributary of the Nakdong River), and highway I-55 (Figure 1). Six bridges (i.e., S-1, S-2, S-3, R-1, R-2, and R-3) and one highway exit (i.e., E-1) are the only means to enter and exit the new city. In brief, its location is analogous to that of an island. Even temporary bridge closures would dramatically impact traffic conditions. Closures would result in route modifications that would increase driving distances and times. Such detours would create notable congestion on nearby roads, particularly on highway I-55. This phenomenon prompts the question: what would the economic cost be if some or all of the bridges were closed? In this paper, we attempt to answer this question through a case study examination. For this study, we limit our analysis to direct costs borne by road users, specifically costs resulting from increased travel distances. The estimates from this study will act as a guideline for identifying cost effective mitigation and preparedness strategies, which aim to reduce the frequency and impact of bridge closures due to flooding. These estimates could, for example, be associated with the cost of improving city resilience to flooding (e.g., the construction cost for the dredging of the river and its tributary and payment to contractors for the early reopening of the bridges).
2. Methodology
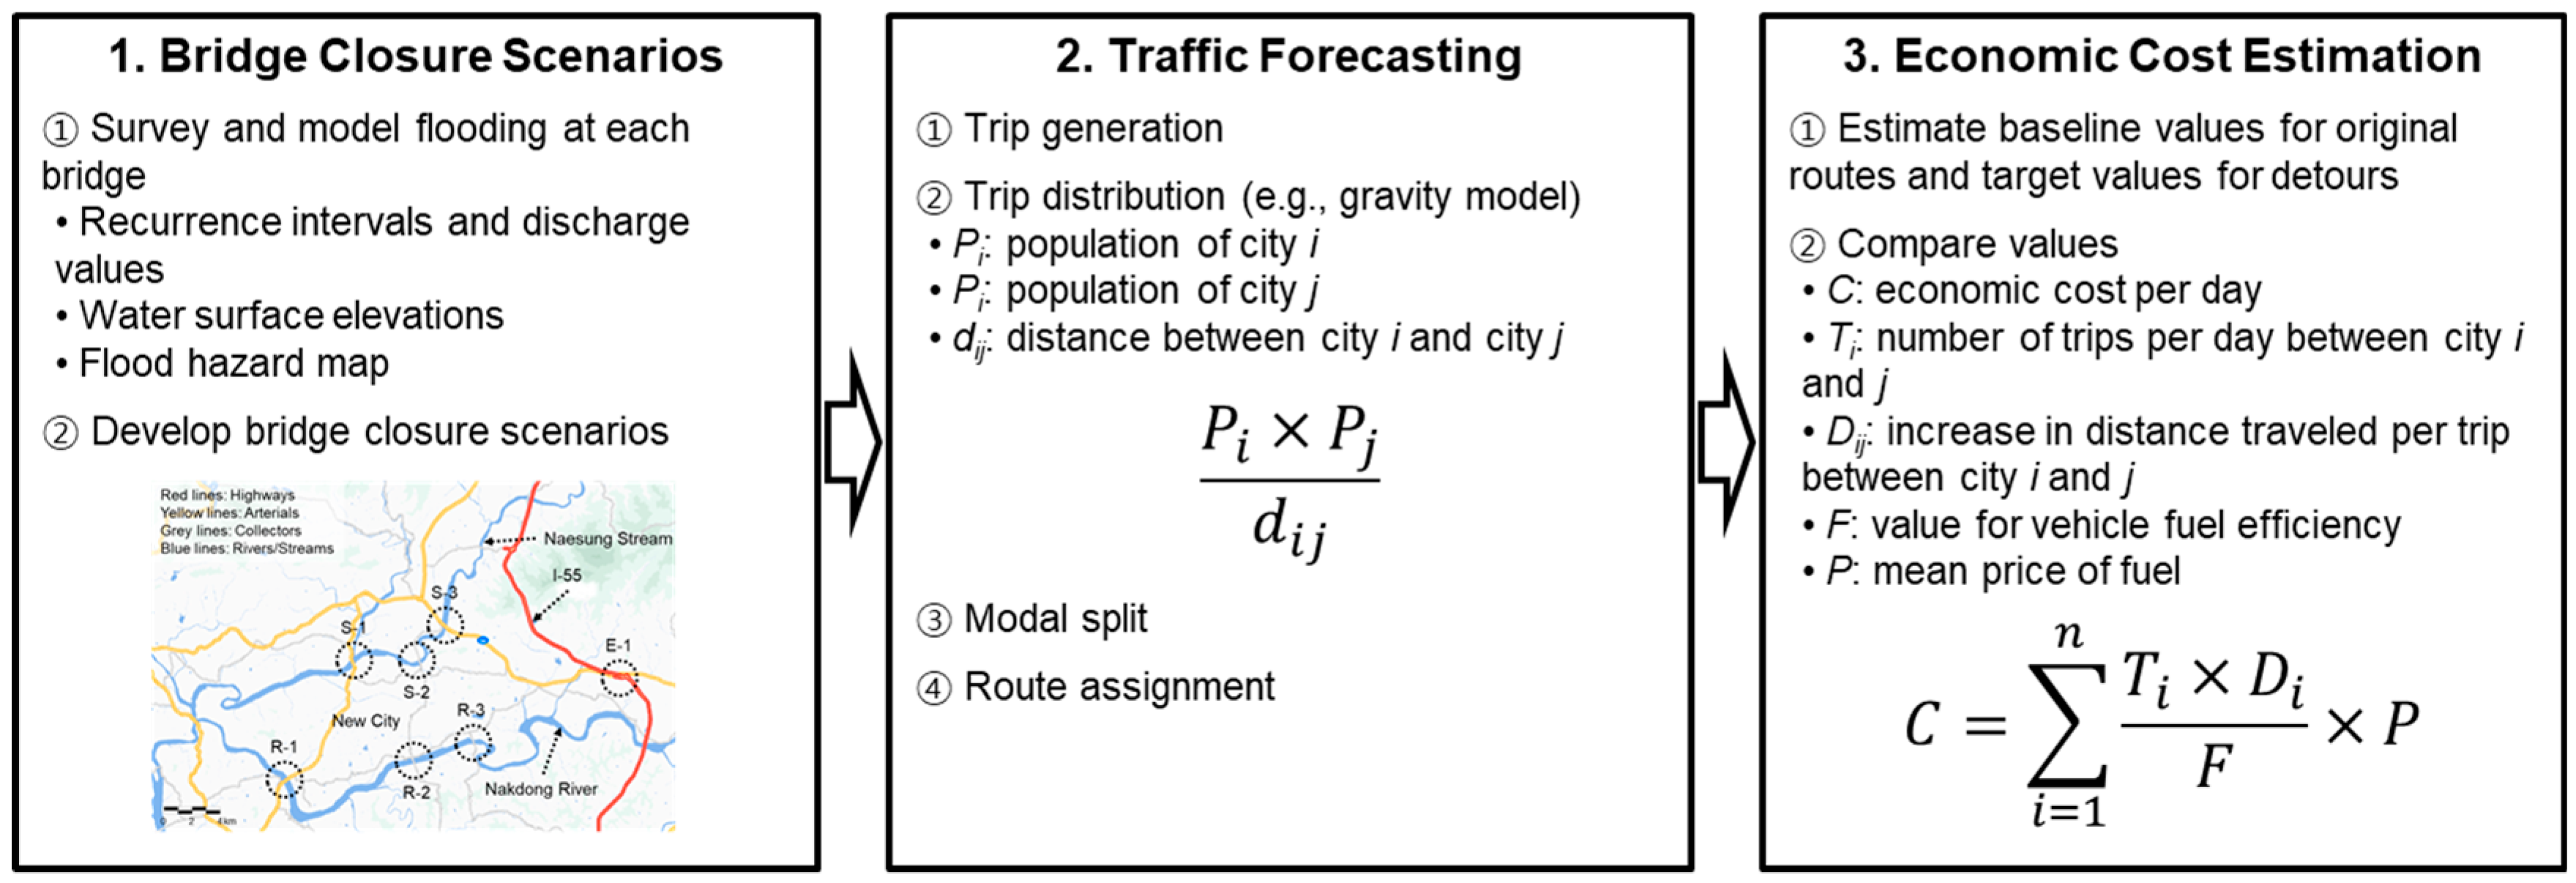
We propose a framework to evaluate the economic impact of bridge closures on road users. The proposed framework consists of three main steps (Figure 2): bridge closure scenarios, traffic forecasting, and economic cost estimation. Details for each step are provided in the following subsections.
2.1. Bridge Closure Scenarios
We evaluate the economic impact of bridge closures on road users for multiple flooding scenarios. To develop the scenarios, we surveyed and modeled flooding at each of the six bridge locations because there are no flood records for this city as it is currently under construction. This process starts with a hydrological analysis to determine discharge values for the Nakdong River and the Naesung Stream, a tributary of the Nakdong River. Next, hydraulic analysis is conducted to determine water surface elevations for discharge values at each location. Finally, a flood hazard map is generated under the assumption that, if the water surface elevation for the area surrounding a bridge were greater than that of the land, the bridge would be submerged. Repeating this process, the specific discharge values required to induce flooding at each bridge location are determined (Table 1).
Using the values in Table 1, two flooding scenarios were derived. If S-1, with a discharge value of 3870 m3/s, on the Naesung Stream were closed due to flooding, the other bridges (S-2 and S-3) on the same stream would be closed because they have lower discharge values (i.e., 3240 m3/s). Similarly, if R-2 or R-3 with discharge values of 9500 m3/s on the Nakdong River were closed, the other five bridges on the stream and river would also close for the same reason. Alternatively, if S-2 or S-3, locations with the smallest discharge values, are submerged in flood-waters, S-1 would also close. If S-2 or S-3 were submerged, it would mean that a large area around S-1, including approaching roads, would also be submerged. More importantly, if S-2 or S-3 were submerged, S-1 should be closed for safety reasons irrespectively if it is immersed or not. This would also apply to the relation of R-1 to R-2 and R-3 due to their physical proximity.
As the Naesung Stream is a tributary of the Nakdong River, the stream is narrower and shallower than the Nakdong River. As a result, it can be concluded that the bridges on the stream (i.e., S-1, S-2, and S-3) are more vulnerable to flooding than the ones on the river (i.e., R-1, R-2, and R-3). Based on this conclusion, two scenarios were derived, although a total of 64 (=2 to the 6th power) bridge closure scenarios could theoretically be conceived. In the first scenario, the three bridges on the Naesung Stream are submerged in floodwaters. In the second scenario, all six bridges are closed. The former scenario is more likely to occur than the latter. In both scenarios, however, numerous road users would be forced to take detours due to road closures. The increased travel distances would culminate in economic costs. Naturally, the incurred costs are contingent on the number of disrupted road users. One study estimated that the population of this area would increase from 25,000 in 2015 to 100,000 in 2027 [12]. Therefore, we analyze both scenarios at two points in time, 2015 and 2027, to estimate potential economic costs due to road closures.
2.2. Traffic Forecasting
To estimate the number of road users that would be rerouted, we used conventional traffic forecasting processes. The process included four stages: trip generation, trip distribution, modal split, and route assignment. First, the number of trips to and from the new city in North Gyeongsang Province was generated. To this end, we used estimates from the Korean Development Institute [13] for the annual average daily traffic across each of the six bridges for 2015 and 2027. The values were derived from a national transportation survey by the Ministry of Land, Transport, and Maritime Affairs [14]. These estimates accounted for population growth, change in land use patterns, and development projects near the new city in each time period. It should be noted that all of the trips generated by various activities were aggregated and analyzed at the city level. Average daily traffic across the six bridges was estimated to be 2818 in 2015 and 21,917 in 2027.
In the second stage of traffic forecasting, trips were generated to and from the new city and another city in North Gyeongsang Province. There were a number of different methodologies used to generate trip distributions. For the majority of these methodologies, a reliable source of traffic data was required (e.g., the number of trips, the distribution patterns in a region, and the most likely mode of transportation for each trip). However, there is no such data for the new city, since the site was previously sparsely populated. To overcome this limitation, we used a simple gravity model [15]. The model predicted the number of trips between any two cities based on population and distance. The number of trips between an origin city i and a destination city j vary directly with the population of i (Pi), directly with the population j (Pj), and inversely with the distance between i and j, (dij). The PiPj/dij value for any pair of cities allowed us to calculate a reasonable estimate of trips between cities i and j. These input values are available for most regions in South Korea, including North Gyeongsang Province. According to an empirical study by [16], the traffic flows of the Korean road system were well approximated by a gravity model.
In the third stage, modes of transport were determined. The city under investigation has limited public transportation infrastructure (i.e., no rail-based transportation). Therefore, only automobiles, such as cars, buses, and freight vehicles, were considered as options for modes of transportation. Due to limited traffic data for the area, we did not directly model the proportion of trips between each origin and destination based on automobile type. Rather, the average ratio of trips made by each mode in North Gyeongsang Province was used to estimate automobile type choices. In North Gyeongsang Province, the automobile profile of the trips generated to and from the new city and another city in North Gyeongsang Province is 75% cars, 23% freight vehicles, and 2% buses [17].
In the last stage, routes between origins and destinations in the transportation network are selected. Routes were selected using the shortest distance travelled between two cities, since economic impact is measured in terms of fuel consumption that is, in turn, proportional to vehicle kilometers of travel (VKT). Disruptions encountered on the shortest route that would redistribute traffic flows to other routes are not considered.
2.3. Economic Cost Evaluation
In this discussion, the economic cost incurred by bridge closures due to flooding was evaluated. The baseline values for the number of trips taken and the distance traveled between cities were calculated using the gravity model. The two flooding scenarios were later applied to the new city. The model was rerun, and the results were subsequently compared to the baseline values. The difference between these values determined how much farther each vehicle travels when the bridges are closed. Finally, the economic cost incurred from the bridge closures was computed using the following equation:
where C is the economic cost per day (in USD), Ti is the number of trips per day between the new city and city i in North Gyeongsang Province, Di is the increase in distance traveled per trip between the new city and city i in North Gyeongsang Province (km), F is a value for vehicle fuel efficiency (km/L), and P is the mean price of fuel (Korean Won/L).
3. Results
In 2015, the baseline values are estimated to be 2818 trips taken and 148,010 km traveled to and from the city in North Gyeongsang Province each day. The baseline values for 2027 are 21,971 trips and 1,153,985 km. Table 2 shows the incremental increases for 2015 and 2027 relative to the baseline values. In Scenario 1 in 2015, it was calculated that VKT increased by 10,120 due to the closure of the bridges on the Naesung Stream. In Scenario 2, where all six bridges are closed, VKT increased by 36,681 in 2015. Scenario 2 results in a VKT increase that is 3.6 times greater than that of Scenario 1. This discrepancy is created by the geographic position of the city in North Gyeongsang Province. The province is composed of 23 mutually exclusive cities, excluding the new city under investigation. North of the new city, the three bridges on the Naesung Stream serve to connect only three cities because the new city is located northwest of the province. In contrast, the three bridges to the south of the new city on the Nakdong River connect it to fourteen other cities. The other six cities are reached via the highway. Comparison of the findings from Scenario 1 and 2 suggests that, in order to improve the city’s resilience to flooding, focus should be placed on the three bridges on the Nakdong River.
Table 3 presents the number of vehicles per day (VPD) affected by flooding for each scenario. In 2015, 819 VPD are affected by the closure of the three bridges on Naesung Stream (i.e., Scenario 1), and 2818 VPD are affected by the closure of all six bridges on both the stream and river (i.e., Scenario 2). Between 2015 and 2027, VPD increases by 3.4 times in each scenario because the total distance of detoured routes and the number of trips affected by flooding are highly correlated with the location of the new city.
As previously mentioned and shown in Figure 1, the Naesung Stream and the Nakdong River are directly north and south of the city, respectively. Due to their locations, the bridges on the river and stream are not complementary. Once all of the bridges on the Naesung stream are closed, only the highway exit (i.e., E-1) serves as a gateway to or from the new city. A five-year survey of annual average daily traffic by the Korea Expressway Corporation revealed that approximately 369,000 VPD use I-55 along its entire route (i.e., 388.10 km). A 6% increase (21,971/369,000) in VPD over a short section of highway could create severe congestion on I-55 around the exit.
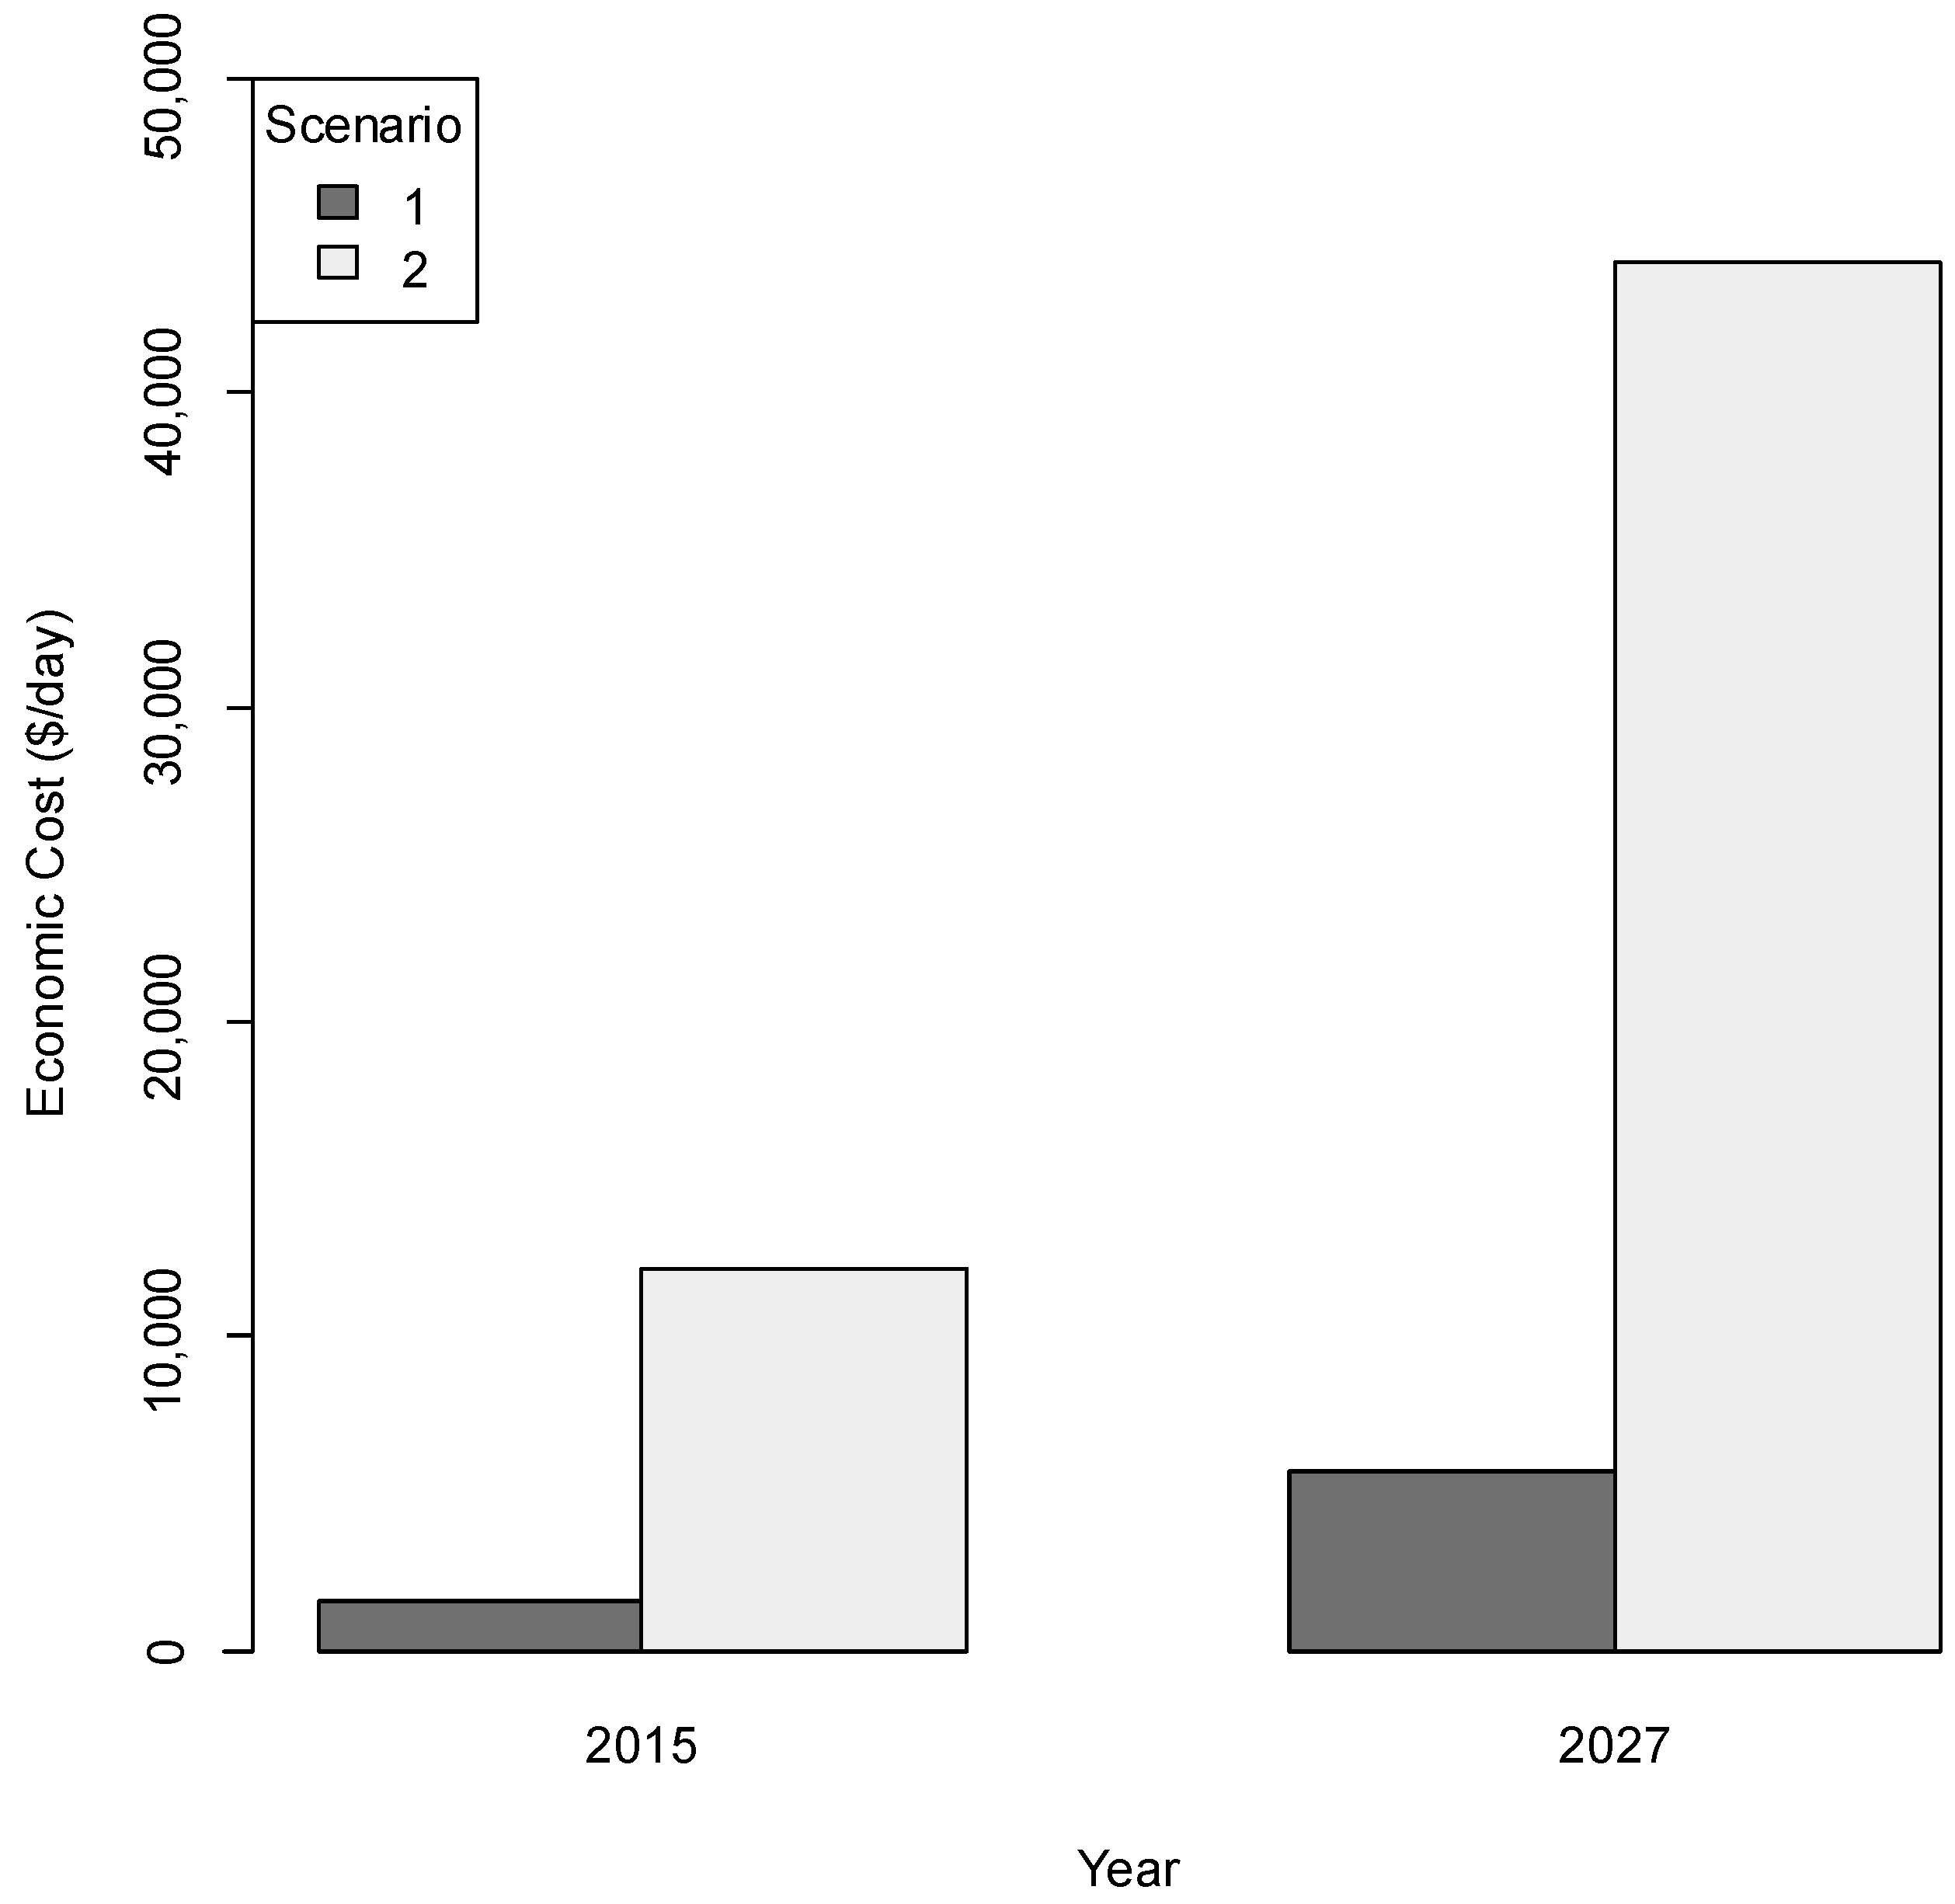
Figure 3 shows the economic cost resulting from bridge closures due to flooding on a per day basis for each scenario. This cost was calculated using a fuel efficiency of 12.4 L per km (Average fuel efficiency for a medium sized car in South Korea) and a gas price of 1600 Korean Won per liter. All costs are expressed in US dollars using a 1 to 1100 US Dollar to Korean Won exchange rate. The economic costs in 2015 and in 2027 are estimated to be 12,189 USD and 44,180 USD, respectively, in Scenario 2 (i.e., closure of all the bridges). These estimates can be translated into a direct economic benefit of using the bridges. The cost incurred by each driver could therefore be seen as the amount they would be willing to pay for the bridges to be restored or retrofitted, which should therefore be considered when choosing between restoration and retrofit measures aimed at reducing the probability of bridge closures due to flooding. For example, once a bridge is fully or nearly submerged by floodwaters, it should be inspected and cleaned for the purpose of safety prior to its reopening. Even though a bridge may seem to be structurally sound, it could have been damaged in many ways (e.g., stripping of the pavement, undermining of abutment footings). Furthermore, debris on the bridge deck and damage to approach roads should be dealt with promptly. The amount of time required to complete this repair work would naturally depend on the level of damage incurred. Thus, it would be a good strategy to provide adequate incentives for contractors to reopen bridges as soon as possible. The cost estimates could be used to calculate the value of incentives. The estimates could also be used in cost/benefit analyses of strategies aimed at improving city resilience to flooding. Higher bridges at the stream and the river may improve city resilience to flooding. However, higher bridges require higher road embankments, which would come at a significant expense. Alternatively, it would be a feasible strategy to dredge the river and its tributary to reduce the likelihood of flooding.
4. Conclusions
The frequency and intensity of floods are expected to increase as a result of climate change. This increase will lead to more intense flooding in areas already prone to flooding. Despite this projection, the literature on unplanned travel disruptions from flooding remains limited. This study is an interdisciplinary attempt at evaluating the economic impact of bridge closures using the new administrative capital of North Gyeongsang Province, South Korea as a case study. Scenarios for the closure of the bridges are derived from channel surveys and hydraulic analyses. These methods are used to overcome a lack of adequate data on historical floods in the new city. Two scenarios were adopted to identify which bridges would be closed in the event of a 200-year flood. A conventional traffic forecast was conducted to estimate the number of road users that would be detoured due to the bridge closures. Next, due to data limitations, a simple gravity model was used to generate and allocate trips to and from the new city. Comparing the distances with and without the bridges, the economic cost incurred by the bridge closures due to flooding was estimated.
The results indicate that flooding would result in an economic loss of between 1563 USD and 44,180 USD per day. The specific value depends on how many bridges are closed and the city’s population. The primary cause for this substantial difference in daily economic losses is the highway having only a single exit (i.e., E-1) as a gateway to or from the new city if all six bridges are closed. Thus, an additional gateway could significantly reduce the severity and impact of bridge closures due to flooding. The estimates from this study can act as guidelines for identifying cost effective mitigation and preparedness strategies that aim to reduce the economic cost stemming from flooding. The methodology presented in this paper could be applied to other municipalities facing similar flood risks. Improving a city’s capacity to address flooding can minimize broader economic and social damage. More specifically, critical infrastructure which is vulnerable to flood events should have functional alternatives to reduce losses during flooding and increase local community resilience. In addition, since climate change is expected cause more severe weather events in the future, over-designing critical infrastructure subject to flood events may be a reasonable choice.
Lastly, this study is not without limitation. First, the estimates were calculated based on the assumptions that road users are completely aware of bridge closures and that trips are not canceled, but rather simply detoured. Second, the populations for the cities in North Gyeongsang Province, excluding the new city, were assumed to be stable and based on the latest data. These conservative assumptions could lead to an underestimate or overestimate of the economic impact of bridge closures. Finally, flooding at each of the six bridge locations modeled in this study did not consider the potential effects of climate change on changes in future weather patterns and extremes that may alter future bridge closure scenarios.
Future studies addressing these limitations will enhance estimation accuracy. Furthermore, models that include indirect impacts on the regional economy due to increases in travel distance are encouraged and will lead to additional meaningful conclusions. At the time of writing, the new city has only one entrance (i.e., E-1) when the bridges are closed. However, as the new city grows, there will be a variety of entrances added. These changes will create new and different rerouting options based on a myriad of potential conditions that will also need to be explored.
Author Contributions
B.K. initiated the research; All authors took a part in the data analysis, interpretation, and writing the paper. All authors have read and approved the final manuscript.
Funding
This research was funded by the National Research Foundation of Korea, grant number [NRF-2016R1C1B1009711] and [NRF-2016R1C1B2015736].
Acknowledgments
This research was supported by Basic Science Research Program through the National Research Foundation of Korea (NRF). Any opinions and findings in this paper are those of the authors and do not necessarily represent those of the NRF.
Conflicts of Interest
The authors declare no conflicts of interest.
References
- Sohn, J. Evaluating the significance of highway network links under the flood damage: An accessibility approach. Transp. Res. Part A Policy Pract. 2006, 40, 491–506. [Google Scholar] [CrossRef]
- Xie, F.; Suarez, D. Evaluating the effects of the I-35W bridge collapse on road-users in the twin cities metropolitan region. Transp. Plan. Technol. 2011, 34, 691–703. [Google Scholar] [CrossRef] [Green Version]
- Emanuelsson, M.A.E.; McIntyre, N.; Hunt, C.F.; Mawle, R.; Kitson, J.; Voulvoulis, N. Flood risk assessment for infrastructure networks. J. Flood Risk Manag. 2014, 7, 31–41. [Google Scholar] [CrossRef]
- Chang, H.; Lafrenz, M.; Jung, I.-W.; Figliozzi, M.; Platman, D.; Pederson, C. Potential impacts of climate change on flood-induced travel disruptions: A case study of Portland, Oregon, USA. Ann. Assoc. Am. Geogr. 2010, 100, 938–952. [Google Scholar] [CrossRef]
- Jacob, K.; Gornitz, V.; Rosenzweig, C. Vulnerability of the New York City metropolitan area to coastal hazards, including sea-level rise: Inferences for urban coastal risk management and adaptation policies. In Managing Coastal Vulnerability; McFadden, L., Nicholls, R., Penning-Rowsell, E., Eds.; Elsevier: Amsterdam, The Netherlands, 2007; pp. 141–158. [Google Scholar]
- Suareza, P.; Andersonb, W.; Mahalc, V.; Lakshmanan, T.R. Impacts of flooding and climate change on urban transportation: A systemwide performance assessment of the Boston Metro Area. Transp. Res. Part D Transp. Environ. 2005, 10, 231–244. [Google Scholar] [CrossRef]
- Okuyama, Y.; Sahin, S. Impact Estimation of Disasters: A Global Aggregate for 1960 to 2007; Policy Research Working Paper 4963; The World Bank: Washington, DC, USA, 2009. [Google Scholar]
- Van Alphen, J.; Martini, F.; Loat, R.; Slomp, R.; Passchier, R. Flood risk mapping in Europe, experiences and best practices. J. Flood Risk Manag. 2009, 2, 285–292. [Google Scholar] [CrossRef]
- Gaitan, S.; ten Veldhuis, M.-C.; van de Giesen, N. Spatial distribution of flood incidents along urban overland flow-paths. Water Resour. Manag. 2015, 29, 3387–3399. [Google Scholar] [CrossRef]
- Intergovernmental Panel on Climate Change (IPCC). Climate Change 2007: Synthesis Report. Contribution of Working Groups I, II and III to the Fourth Assessment Report of the Intergovernmental Panel on Climate Change; IPCC: Geneva, Switzerland, 2007. [Google Scholar]
- Schreider, S.Y.; Smith, D.I.; Jakeman, A.J. Climate change impacts on urban flooding. Clim. Chang. 2000, 47, 91–115. [Google Scholar] [CrossRef]
- Chung, U.-K. A Basic Research on Introduction of Advanced Transit System in the New Town of Gyeongsangbuk-Do Province Office; Daegu Gyeongsangbuk Development Institute: Daegu, Korea, 2012. (In Korean) [Google Scholar]
- Korean Development Institute. A Feasibility Study on the Construction of a Road in the New Town of Gyeongsangbuk-Do Province Office; Korean Development Institute: Seoul, Korea, 2011. (In Korean) [Google Scholar]
- Ministry of Land, Transport, and Maritime Affairs. 2009 Annual Traffic Volume Report; Ministry of Land, Transport, and Maritime Affairs: Suwon, Gyeonggi-do, Korea, 2010. (In Korean)
- Taaffe, E.J.; Gauthier, H.L.; O’Kelly, M.E. Geography of Transportation, 2nd ed.; Simon and Schuster: Upper Saddle River, NJ, USA, 2006. [Google Scholar]
- Jung, W.-S.; Wang, F.; Stanley, H.E. Gravity model in the Korean highway. Europhys. Lett. 2008, 81, 48005. [Google Scholar] [CrossRef] [Green Version]
- Ministry of Land, Infrastructure, and Transport. 2014 Annual Traffic Volume Report; Ministry of Land, Infrastructure, and Transport: Sejong-si, Korea, 2015. (In Korean)
Figure 1.
A map of the new administrative capital of North Gyeongsang Province.

Figure 2.
Framework to evaluate economic impact of bridge closures on road users.

Figure 3.
Economic cost per day due to the closure of the bridges.


Table 1.
Recurrence interval and discharge values to inundate each bridge.
| River/Stream | Bridge | Recurrence Interval (years) | Discharge Value (m3/s) |
|---|---|---|---|
| Naesung Stream | S-1 | 300 | 3870 |
| S-2 | 200 | 3240 | |
| S-3 | 200 | 3240 | |
| Nakdong River | R-1 | 200 | 7500 |
| R-2 | 400 | 9500 | |
| R-3 | 400 | 9500 |
Table 2.
Incremental increases in vehicle kilometers of travel from baseline levels.
| Year | Scenario | ∆VKT (km) |
|---|---|---|
| 2015 | 1 | 10,120 |
| 2 | 36,681 | |
| 2027 | 1 | 78,903 |
| 2 | 285,991 |
Table 3.
Number of vehicles affected by flooding each day.
| Year | Scenario | VPD |
|---|---|---|
| 2015 | 1 | 819 |
| 2 | 2818 | |
| 2027 | 1 | 6386 |
| 2 | 21,971 |
© 2018 by the authors. Licensee MDPI, Basel, Switzerland. This article is an open access article distributed under the terms and conditions of the Creative Commons Attribution (CC BY) license (http://creativecommons.org/licenses/by/4.0/).
Share and Cite
MDPI and ACS Style
Kim, B.; Shin, S.C.; Kim, D.Y. Scenario-Based Economic Impact Analysis for Bridge Closures Due to Flooding: A Case Study of North Gyeongsang Province, South Korea. Water 2018, 10, 981. https://doi.org/10.3390/w10080981
AMA Style
Kim B, Shin SC, Kim DY. Scenario-Based Economic Impact Analysis for Bridge Closures Due to Flooding: A Case Study of North Gyeongsang Province, South Korea. Water. 2018; 10(8):981. https://doi.org/10.3390/w10080981
Chicago/Turabian StyleKim, Byungil, Sha Chul Shin, and Du Yon Kim. 2018. "Scenario-Based Economic Impact Analysis for Bridge Closures Due to Flooding: A Case Study of North Gyeongsang Province, South Korea" Water 10, no. 8: 981. https://doi.org/10.3390/w10080981
Note that from the first issue of 2016, this journal uses article numbers instead of page numbers. See further details here.