An Analysis of Seasonal Waste Draining for the Urban Agglomeration Using Statistical Methods


Department of Engineering Sanitary and Water Management, University of Agriculture in Krakow, 30-059 Kraków, Poland
*
Author to whom correspondence should be addressed.
Water 2018, 10(8), 976; https://doi.org/10.3390/w10080976
Submission received: 11 July 2018
/
Revised: 19 July 2018
/
Accepted: 23 July 2018
/
Published: 25 July 2018
(This article belongs to the Special Issue Freshwater Quality as a Driver of Aquatic Ecosystem Health)
Abstract
:The aim of the work was to analyze the seasonality of the sewage outflow from the urban agglomeration of Radom, using statistical methods in the aspect of environmental protection. The research was carried out on the basis of the observational series covering the daily volume of the sewage outflow in the years 2013–2015. The assessment was carried out according to the following stages: identification of the distribution of the average daily sewage outflow in particular months using nuclear estimators, seasonal evaluation using the Colwell indicators and Fourier spectral analysis, and identification of homogeneous seasons with regard to the sewage outflow using the cluster analysis. On the basis of the calculations that were carried out, no significant seasonality of the sewage outflow was noted, which results from the separated character of the sewage system in the urban agglomeration of Radom. The analyses showed that the applied statistical techniques are a practical solution for identifying the seasonality of sewage inflow to the treatment plant, thanks to which it will be possible to take appropriate actions related to minimizing the harmful impact of hydraulic overload on the biotic environment of the natural receiver.
1. Introduction
Surface waters are a very important source of water for large urban agglomerations. The continuous progress of urban agglomerations leads to an increase in human impact on the aquatic environment. Pollutants in rivers, lakes, and coastal waters pose a significant threat to the recipients of water charged from reservoirs, where the pollutants are concentrated. In extreme cases, pollutants introduced with sewage into water can lead to the extinction of all the biological life forms in the water, purging the receiver—the place where the treated wastewater is discharged (e.g., surface water or ground)—of self-cleaning skills [1,2,3].
Sewage outflowing from urban agglomerations is one of the basic parameters used by the design of sewage networks and sewage treatment plants [4]. The correct estimation of the size of this parameter is important for operational and economic reasons. Seasonal variability of hydraulic load often causes significant disturbances in the operation of the treatment plant, which results in the introduction of excessive amounts of pollutants into the receiver, causing the degradation of its environment. The volume of sewage flowing into the treatment plant is a factor that affects the rate of pollutants removal from wastewater in the processes occurring in sewage treatment plants [5,6]. The infiltration of incidental water and the inflow of surface water to the sewage network significantly contributes to the increase of the hydraulic load and the decrease of the sewage treatment efficiency [7]. During heavy precipitation, the inflow of rainwater may significantly affect the reduction of sewerage capacity [8]. The problem of the inflow of incidental water and its negative impact on the efficiency of the treatment plant operation is current and in recent years often put forward by scientists [9,10]. Among other things, the research is undertaken to quantify water infiltrating into the sewage systems based on the variability of the daily COD (Chemical Oxygen Demand) load in the wastewater [11]. Another example of such research is the work of Cardoso et al. [12], which presents new methods and techniques for quantitative estimation of infiltration in sewage systems. Production indicators were determined to assess the impact of infiltration on the sewage system, and then, they were tested in some model studies in Italy and France. The commonly used methods used for assessing the size of infiltration based on the volume balance have been compiled and presented in the work of Bénédittis and Bertrand-Krajewski [13]. At the same time, the authors noticed that these methods had never been compared simultaneously in the same experimental area.
The seasonality of the incoming sewage is a phenomenon that significantly affects the operation of sewage treatment plants. This phenomenon is related to the intense supply of incidental water to the sewage network, such as rainwater, water from melting of the snow cover, or infiltration water. Intensive inflow of external water at particular times of the year can lead to the hydraulic overload of the sewage treatment plant, resulting in the disturbance of the processes of its operation [14]. Seasonal inflow of incidental water causes the hydraulic overload of objects such as the sand separator and preliminary and secondary settling tanks. This negatively affects the work of biological reactors too by decreasing the temperature of sewage and reducing the time of keeping sewage in individual reactor chambers. Consequently, all of this leads to a seasonal reduction in the efficiency of the sewage treatment plant operation and thus increases the threat of pollution of the receiver’s water with insufficiently treated sewage [15].
So far, there have been no reports in the literature of using some advanced statistical techniques to assess the seasonal nature of the volume of sewage outflowing from urban agglomerations. In order to minimize the harmful effect of the hydraulic overload, there should be made a reliable identification of the seasonality of the sewage outflow, for which the operators may take actions related to the optimization of the treatment processes in a given period of the year. Bearing in mind that there cannot be found in the world literature any research results regarding the assessment of the seasonality of the sewage outflow from urban agglomerations, using advanced statistical techniques, the aim of this work was to conduct such an analysis using methods such as the Mann–Kendall test, kernel density estimations, the Colwell indicators, Fourier spectral analysis, and cluster analysis. The applied methods can be a new and effective solution for the operators of the treatment plants while identifying the phenomena of the sewage outflow seasonality.
2. Characteristics of the Research Area
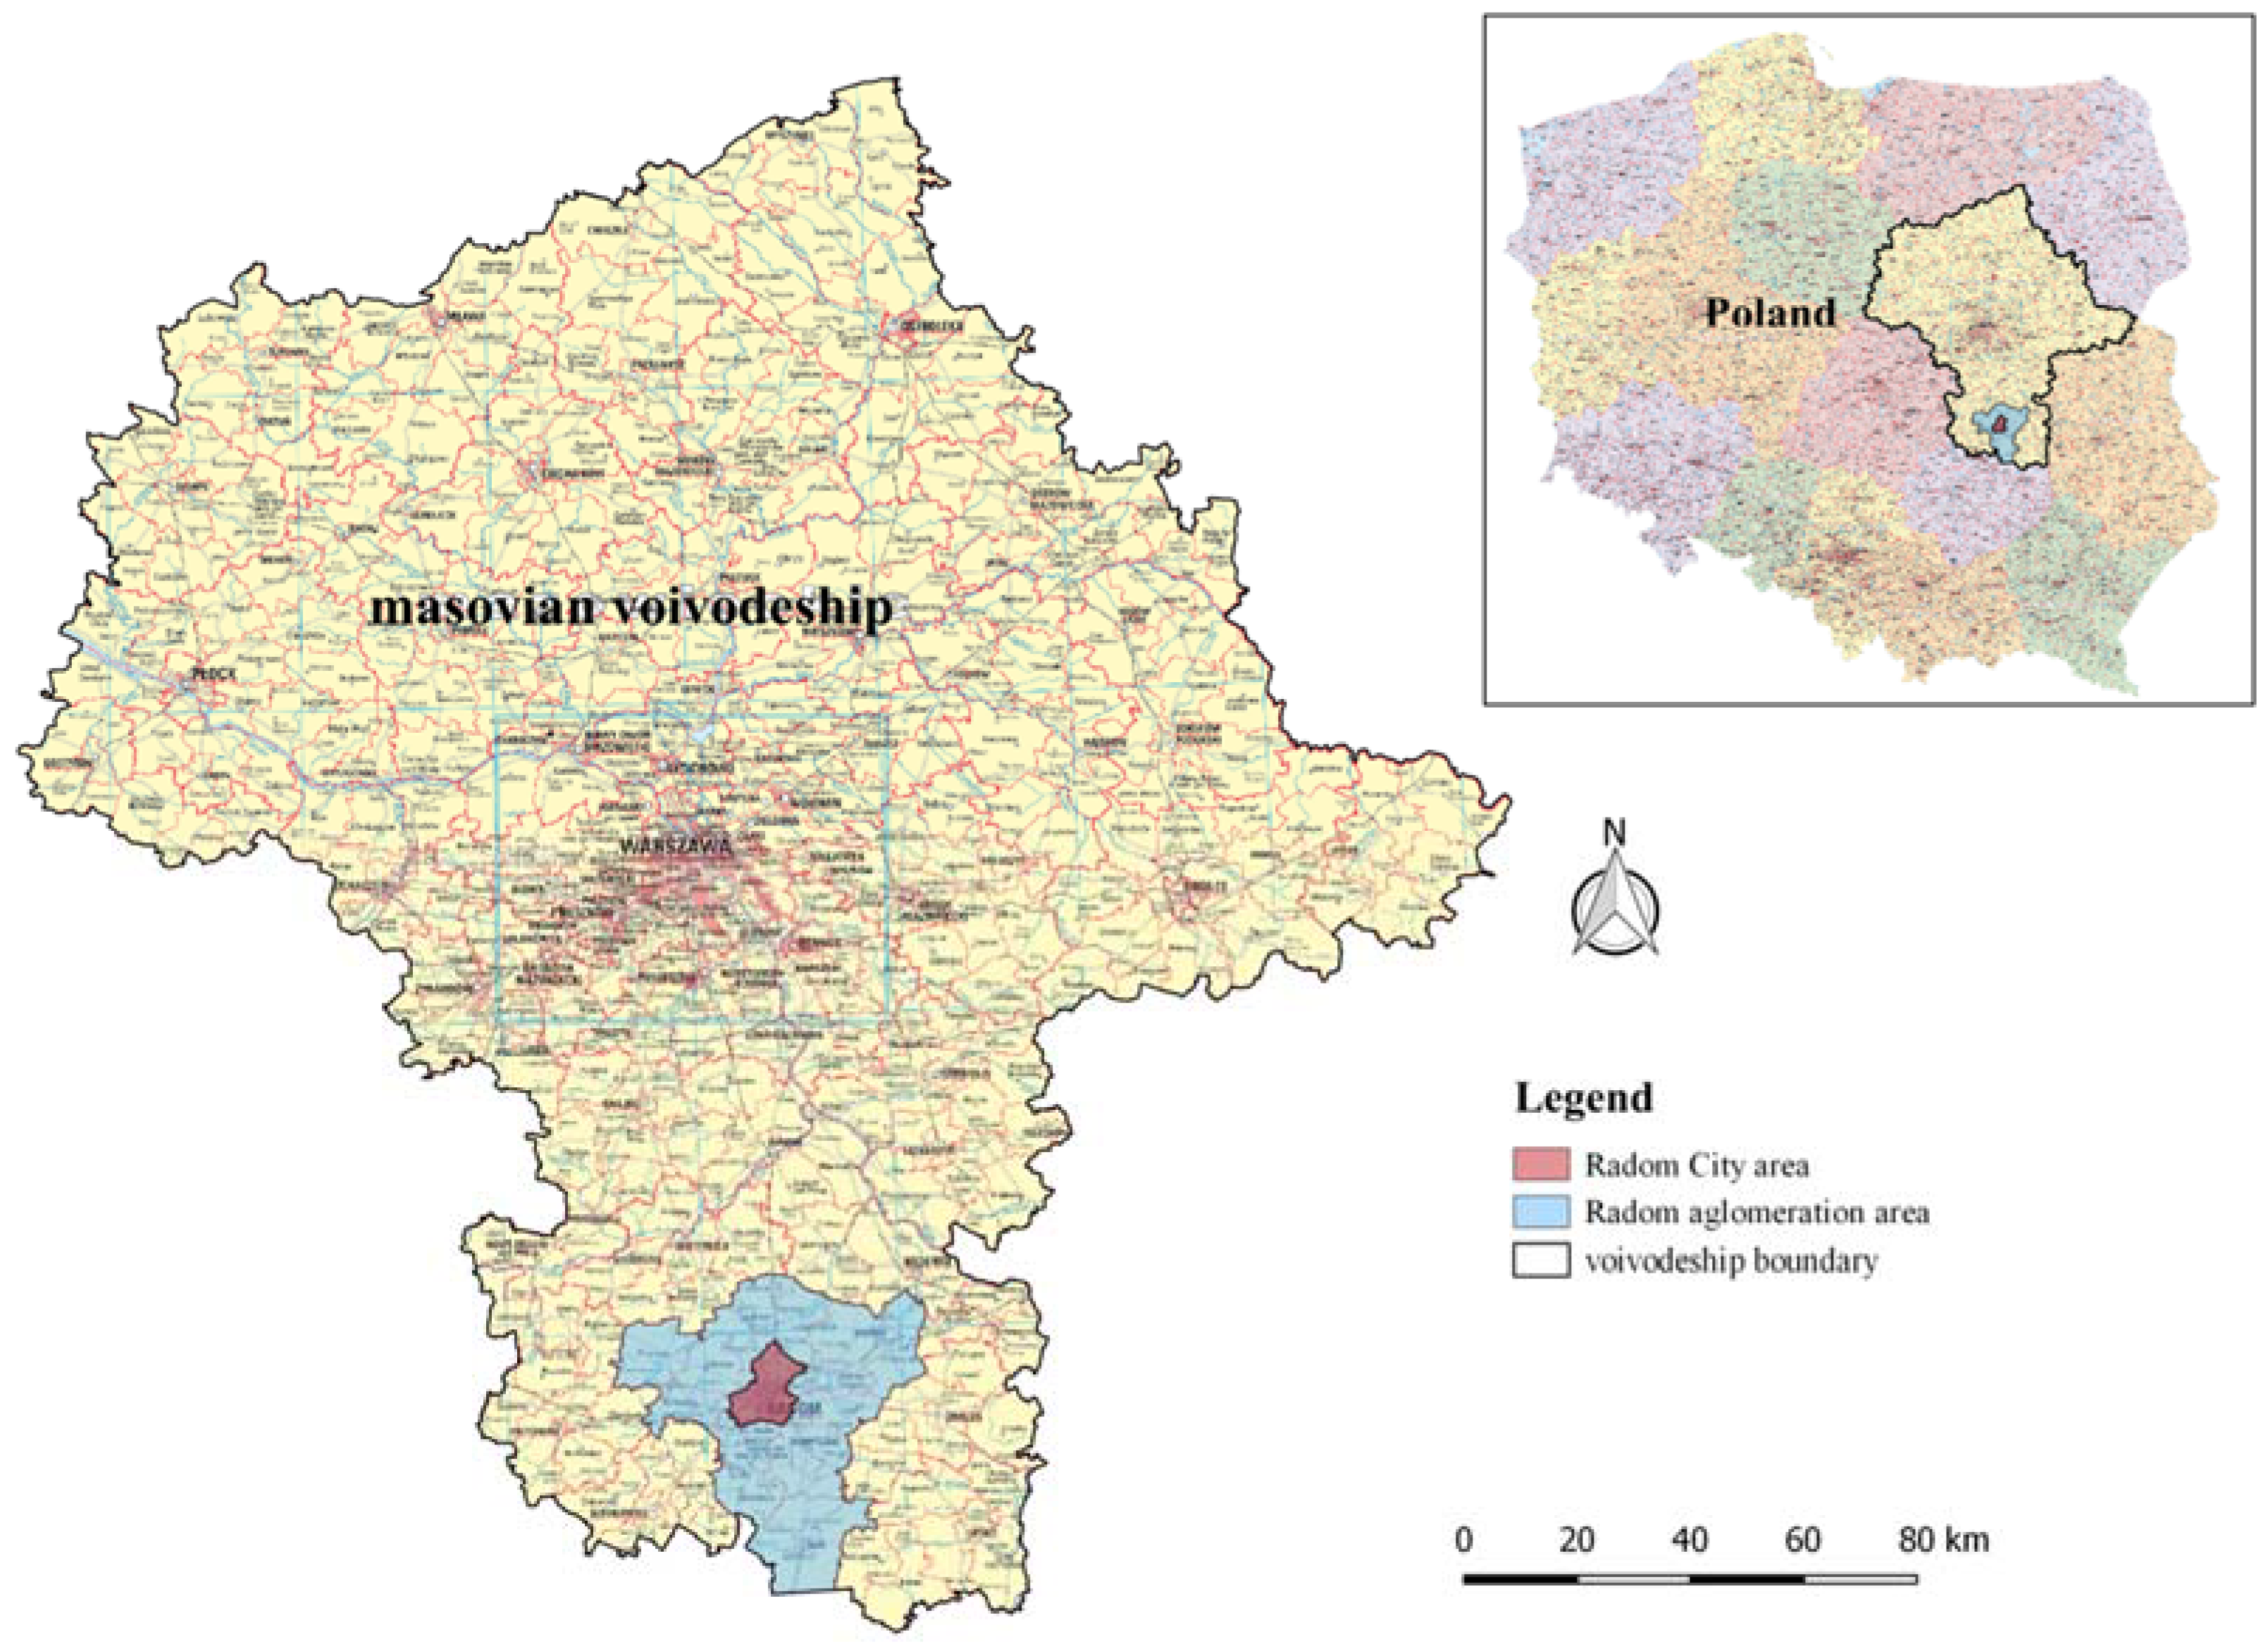
The analysis of the sewage outflow seasonality concerns the urban agglomeration of Radom. This is a town located in the southern part of the Masovian Voivodeship, Poland (Figure 1). The population equivalent (PE) of the agglomeration is 353,607. The total length of the sewage network is 603.8 km, 1.2% (7.4 km) of which is a combined sewage system and 98.8% (600.9 km) of which is a separate sewage system. The following parameters characterize the network: pipe diameters (from 63 to 800 mm), the number of drains (about 12,510), the number of network pumping stations (49 pieces), and the number of household pumping stations (100 pieces). The sewage network is made of the following material (% of total length): cast iron (1%), concrete (2%), stoneware (36%), PVC (polyvinyl chloride) (52%), polyethylene (4%), reinforced concrete (2%), polypropylene (1%), and polyester resins (2%).
3. Materials and Methods
The analysis of the sewage outflow seasonality was made on the basis of the data covering the daily volume of sewage discharged from the urban agglomeration of Radom in the years 2013–2015 and the daily rainfall corresponding to that period. The tests were carried out according to the following stages: the initial analysis of the volume of outflowing sewage, the analysis of the significance of the trend of the sewage outflow volume, and the analysis of the sewage outflow seasonality using statistical techniques.
3.1. Initial Analysis of the Volume of Outflowing Sewage
The initial analysis of daily volumes of outflowing sewage included the determination of some descriptive statistics: positional measures—minimum values (Qdmin), mean (Qdmean), and maximum (Qdmax); measures of dispersion—standard deviation (S) and coefficient of variation (Cs); and measures of shape of the studied variate distribution—the coefficient of skewness (A) and kurtosis (K). The average share of incidental water flowing into the sewage network in individual months was determined according to the following formula [16]:
where Qd is daily inflow of sewage to the sewage system [m3·d−1] and Qbd is the average daily inflow of sewage during dry (rainless) weather [m3·d−1].
The average daily inflow of sewage during dry weather was determined on the basis of the days when atmospheric precipitation did not exceed 1 mm and the last biggest rainfall occurred no later than 5 days before the abovementioned period [17].
3.2. Trend Analysis
Trend significance analysis was performed for the mean daily sewage outflow in a particular month for the analyzed period, using the Mann–Kendall test (MK test). The null hypothesis H0 of the test assumes no monotonic trend of the data, while the alternative H1 states that such a trend exists. The calculations were carried out for the significance level α = 0.05. The S statistics of the Mann–Kendall test was based on the following formula [18,19,20]:
where n is the number of elements of the time series.
On the basis of the standardized statistics, Z was calculated according to the following formula:
Variance S Var(S) is calculated using the following formula:
The main assumption of the MK test used is the lack of autocorrelation in the data series. In the case of the analyses concerning the mean daily sewage outflow in a particular month, such dependencies may occur, which lead to an underestimation of the variance Var(S). Therefore, an adjustment for variance correction is included, but this is calculated only for data with significant partial autocorrelation [21,22,23,24] as follows:
is the effective number of observations calculated as follows:
where is the value of the next significant coefficient of autocorrelation.
3.3. Seasonal Analysis
The seasonal analysis of the sewage outflow was made using the following statistical techniques: identification of the variate distribution with some kernel estimates, the Colwell indicators, and Fourier spectral analysis. The calculations were carried out for the significance level α = 0.05.
On the basis of the kernel estimators, a direct estimation of the density function was made, which allowed us to assess the seasonal variability of the mean daily sewage outflow in a particular month from the urban agglomeration. The estimators were determined according to the following dependence [25,26]:
where n is the number of the samples; h is the smoothing parameter identified with the so-called bandwidth; K is kernel function; and Xi is sample element.
The bandwidth h was determined according to the Silverman method [27]. The kernel function K was adopted as a Gaussian form of the kernel [28].
The seasonality assessment of the volume of sewage outflowing from the urban agglomeration of Radom and the monthly sums of atmospheric precipitation in the surveyed time period was also made on the basis of the so-called Colwell indicators. The Colwell indicators can assume values from 0 to 1, and these are as follows: predictability P and its components of constancy C and the seasonality index M. Predictability P is a measure of the regularity of a given phenomenon occurrence; it is the sum of constancy C and seasonality M. Constancy C describes the propensity of a given feature to remain unchanged throughout the whole period and assume maximum values when the studied variable has the same value in each analyzed period. The M index is a measure of the seasonal variation of the examined random variable. High values of this indicator indicate repetitive values of the variable in the same time periods. The Colwell indicators are determined on the basis of the following dependence [29,30,31]:
where H(X) is the uncertainty regarding the time of the analyzed phenomenon occurrence; H(Y) is uncertainty regarding the state of the analyzed phenomenon occurrence; H(XY) is the uncertainty regarding the interaction between the time and the state of the given phenomenon; and s is the number of the analyzed class ranges describing the given phenomenon.
P = C + M
A detailed procedure for determining the Colwell indicators is presented in the paper of Eslamian [32].
The supplement of the conducted seasonality analysis of the examined time series was the verification of its harmonic structure carried out by means of spectral analysis. The general model of the spectral function is described by the multiple regression function [33,34] as follows:
where Xt is the value of the variate during the time t, is a constant term, and are coefficients of regression, is frequency, t is time, and q is the number of the variables connected with the amount of date in the date series.
3.4. Classification of Homogeneous Time Periods in Relation to the Volume of Sewage Outflow
In order to determine homogeneous periods of time in relation to the daily sewage outflow from the urban agglomeration of Radom in individual months, the method of cluster analysis was applied. This method is based on the internal criterion of divisions, which is the mathematically defined similarity between the classified objects. In order to determine the volume between the clusters, the Ward method was used [35] as follows:
where Δ (A, B) is the distance between the clusters; is centrum of the cluster j; and nj is the number of elements in the cluster j.
4. Results and Discussion
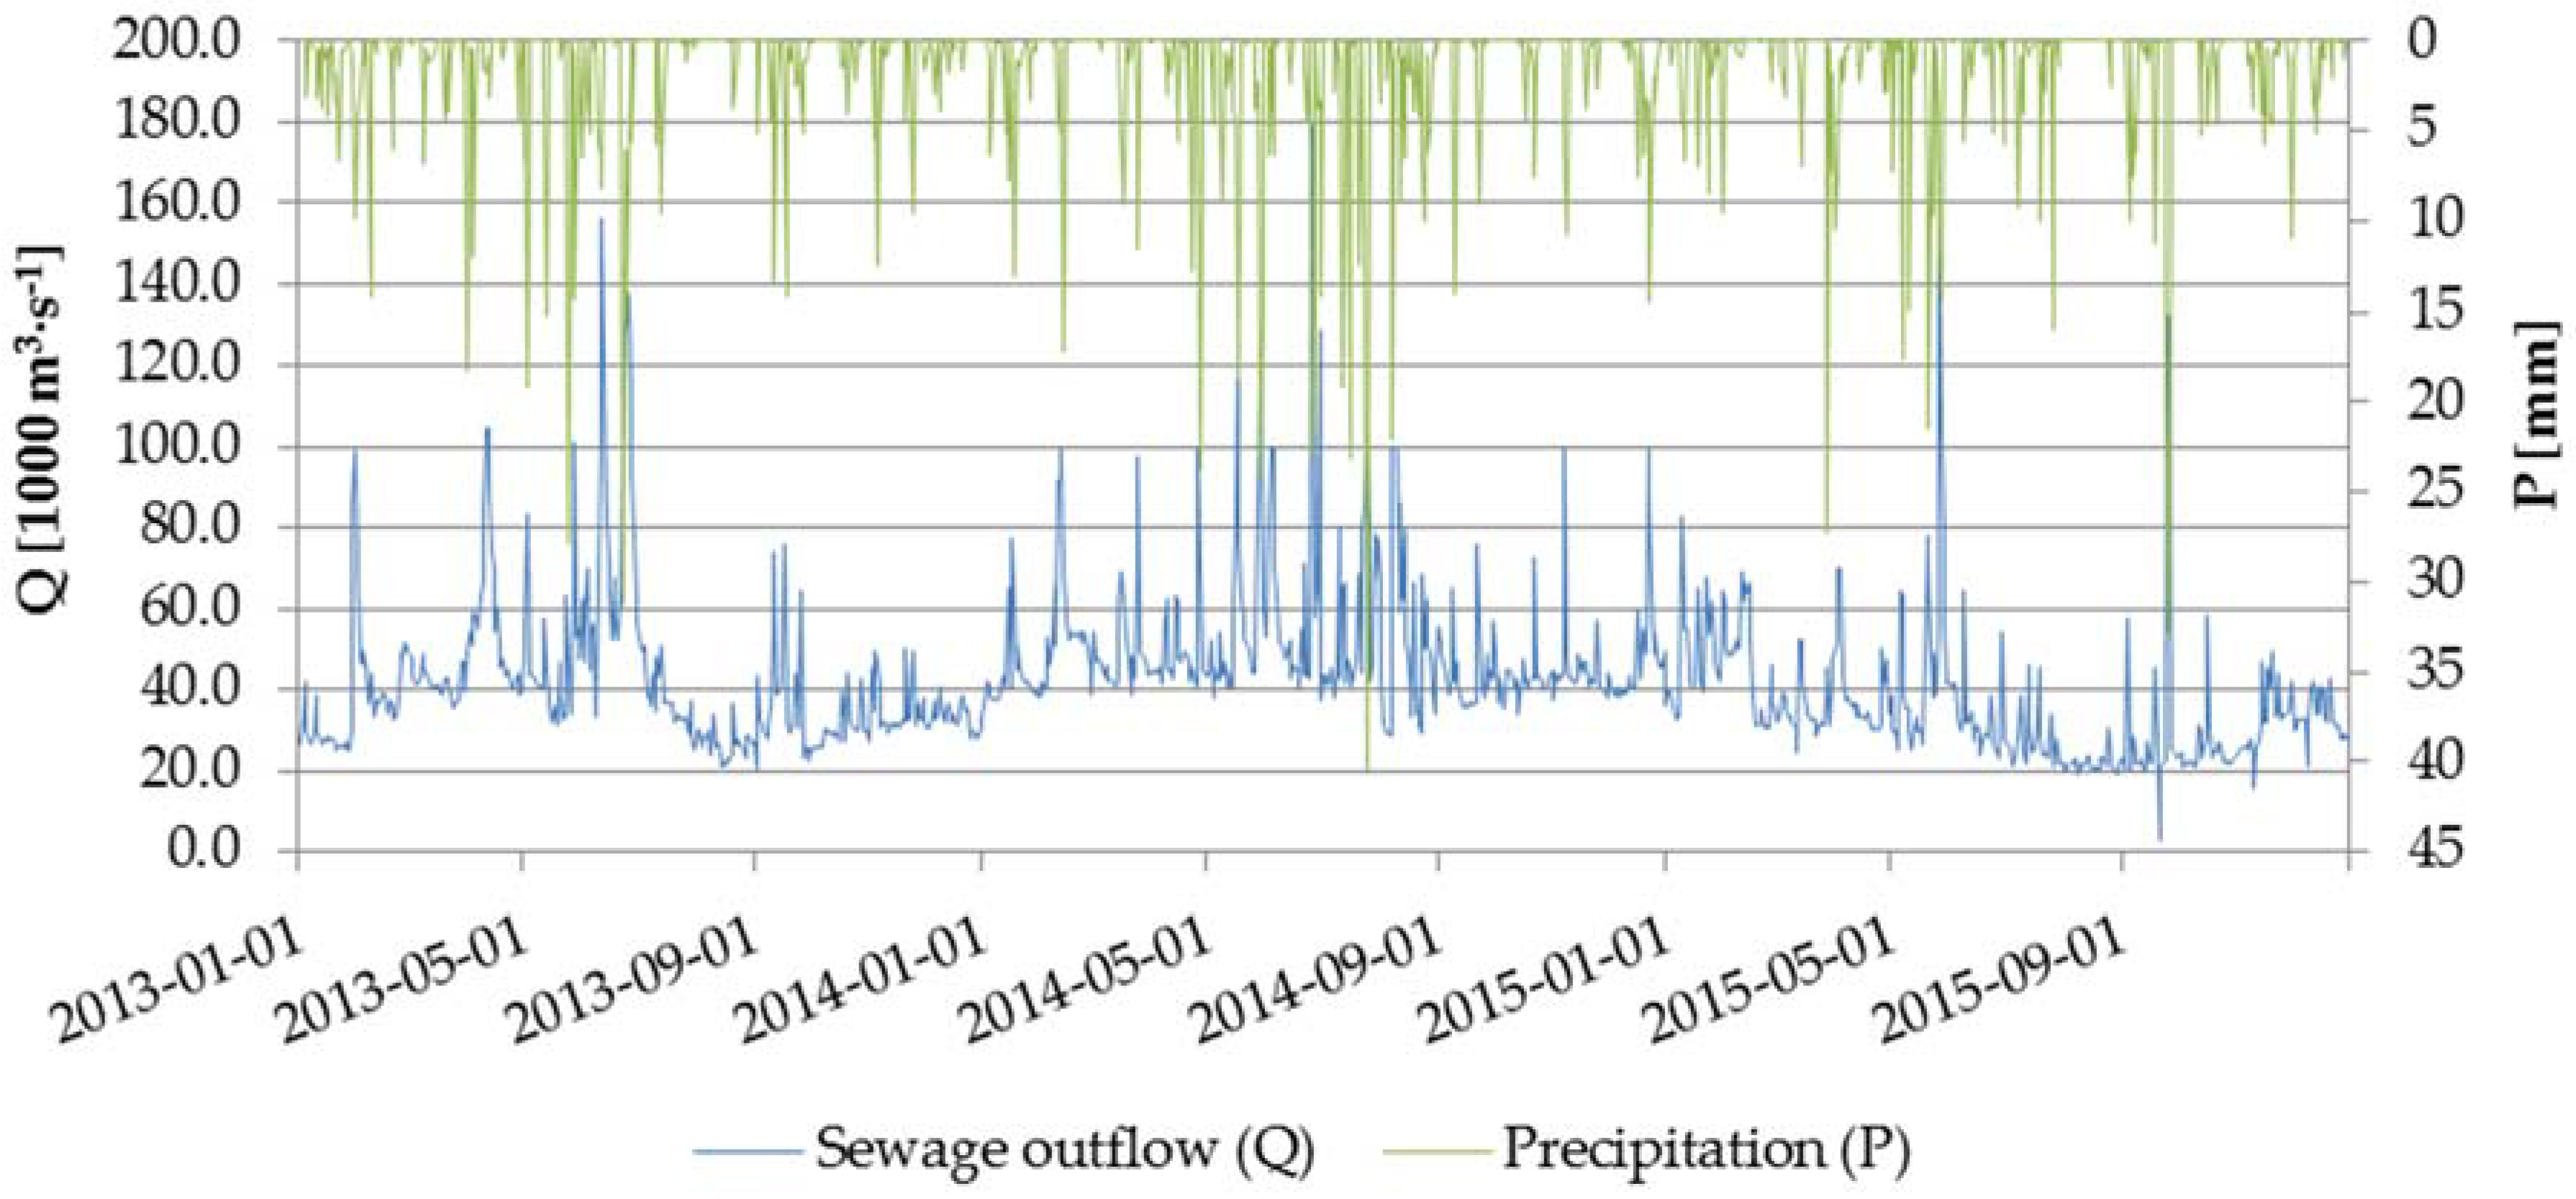
Figure 2 shows the size of the daily sewage outflow from the agglomeration of Radom in the years 2013–2015 against the background of atmospheric precipitation in the same time period. In order to determine the dynamics of changes in the sewage outflow, Table 1 presents the values of descriptive statistics defined for the examined variate.
On the basis of the rainfall data presented in Figure 2, there can be seen prevalence of summer precipitation (from May to July) over winter precipitation (from December to February). It is a phenomenon characteristic for the temperate climate zone, where Poland is located [36]. While analyzing the data concerning the daily sewage outflow from the investigated agglomeration, a spread on the level of 176,652 m3·d−1 was noted. The coefficient of variation Cs remained at the level of 44%, which indicated a high variability of the dynamics of the sewage outflow in the analyzed period. The value of the coefficient of skewness A was 2.40, which proved the right-sided asymmetry of the empirical distribution of the variate. This is due to the fact that for the analyzed agglomeration, the majority of Qd observations are lower than the Qdmean values. On the other hand, the size of kurtosis unambiguously indicated the leptokurtic distribution of the variate (positive value of the indicator). This means that the observational series did not show a significant number of outliers. Based on the calculations that were carried out, it was found that the daily sewage outflow is a variable characterized not only by a large variation in time but also the skewness of the empirical distribution. Similar results were also obtained by Młyński and Chmielowski [37] and Młyński et al. [38], who also showed a significant variety of the examined feature and their distribution asymmetry.
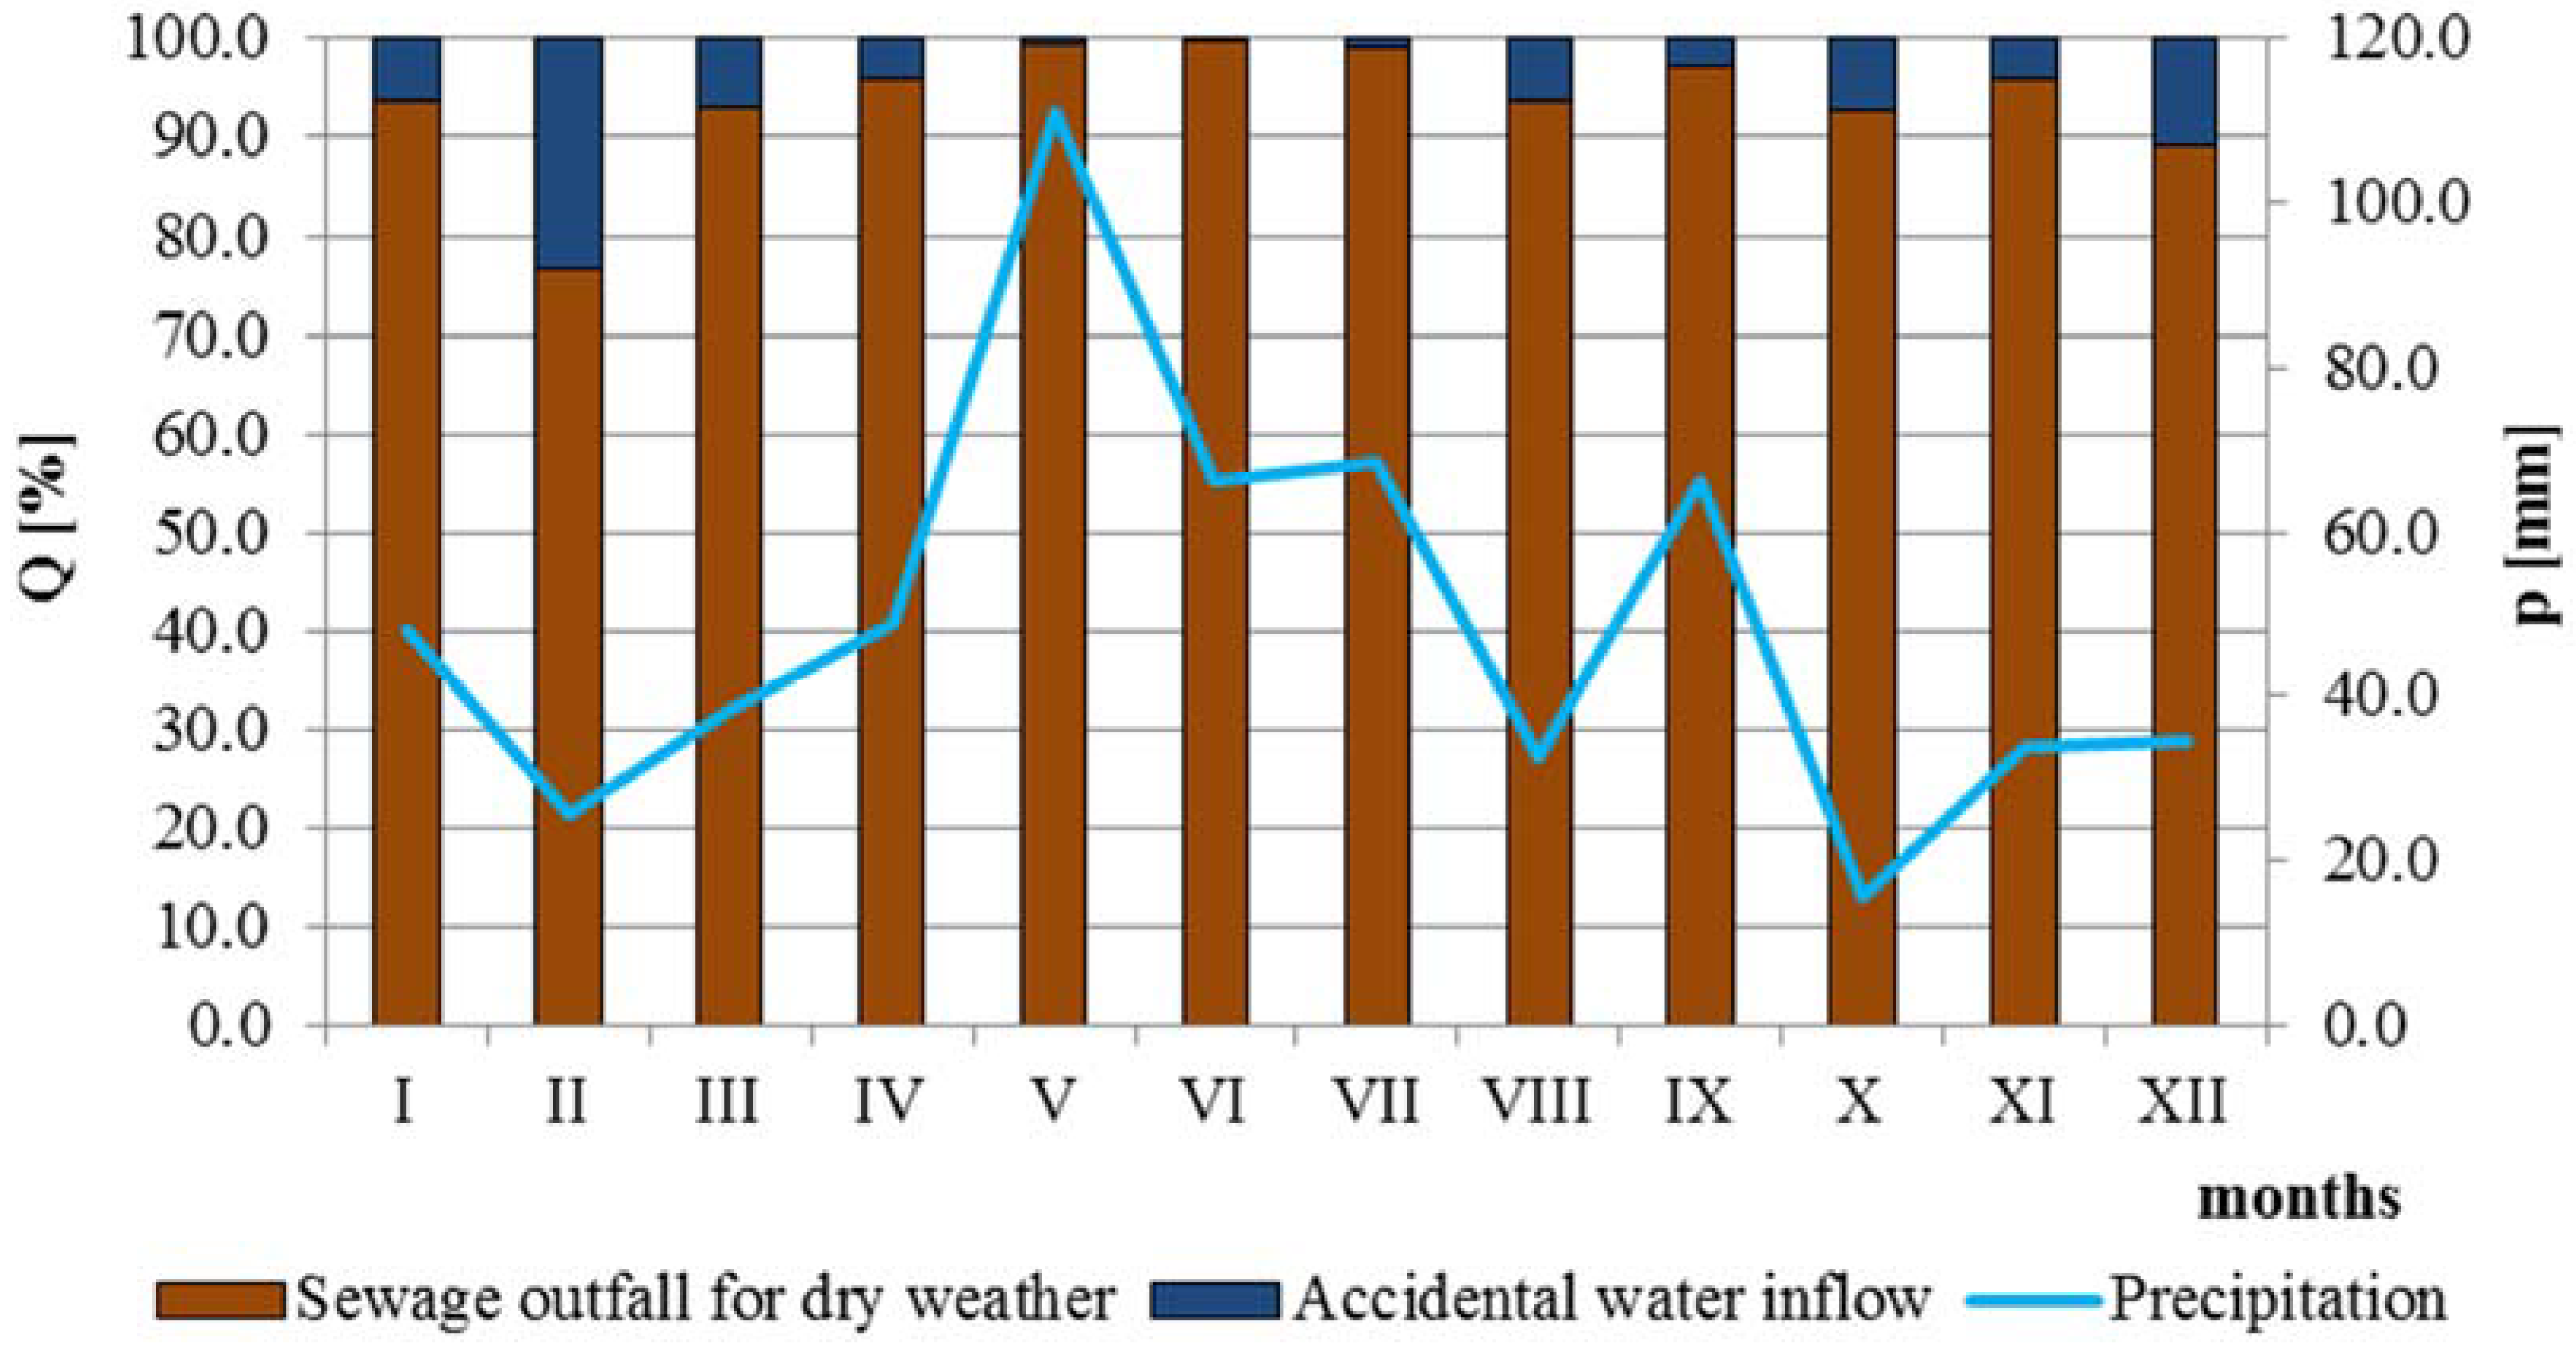
Figure 3 shows the average percentage of incidental water flowing into the sewage system of the urban agglomeration of Radom in months of the year (January to December), against the background of the average monthly amount of atmospheric precipitation in the analyzed period.
By analyzing the values that can be seen in Figure 3, it was found that the smallest average share of incidental water discharged to the sewage system was recorded in June (0.3%), while the highest was in February (23.4%). However, when it comes to the whole year, this share is small and amounts to just over 6%. It should also be noted that the maximum inflow of external water does not correspond to the maximum average monthly amount of atmospheric precipitation. This fact is explained primarily by the nature of the sewage system in the urban agglomeration of Radom. As it was mentioned above, a significant part of the system is a separate sewage system, in which sewage flows through a system of two ducts: one duct is for domestic and industrial sewage, and the other one is for rainfall sewage. The second part of the sewage system works periodically, during rainfall, thaw, and melt [39]. It is assumed that incidental water flowing into the analyzed sewerage is mainly infiltration (ground) water that can enter the system through some damage of the ducts, their connections, and the leakiness of the collector walls. The inflow of infiltration water occurs when the grade line of the duct bottom is below the groundwater table [40].
In the next stage of the research, there was carried out the analysis of the significance of the trend of the average monthly sewage outflow from the urban agglomeration of Radom in the years 2013–2015 using the modified Mann–Kendall (MMK) test. The calculations were carried out for the significance level α = 0.05. The results of calculations are presented in Table 2.
On the basis of the results summarized in Table 2, a decreasing trend was found for the average monthly volume of the sewage outflow from the studied agglomeration. This is evidenced by the Z statistic which takes negative values. However, it should be emphasized that this trend is not statistically significant (p above the assumed level of significance). Because the effective number of observations n/n* took the values above 1.0, it is concluded that for the analyzed time series there were some significant autocorrelations between the individual data. This may indicate seasonal variations in the sewage outflow. It is postulated that for the specific sewage system, seasonal variations are mainly caused by diversified water demand, with reference to different time periods during the year or the type of the area from which sewage is discharged: tourist, rural, suburban, or urban [41,42,43,44]. Despite the existence of some real autocorrelations, this fact did not influence the conclusions carried out by the MMK test, as evidenced by the values of the modified Z* statistic and the modified p* value.
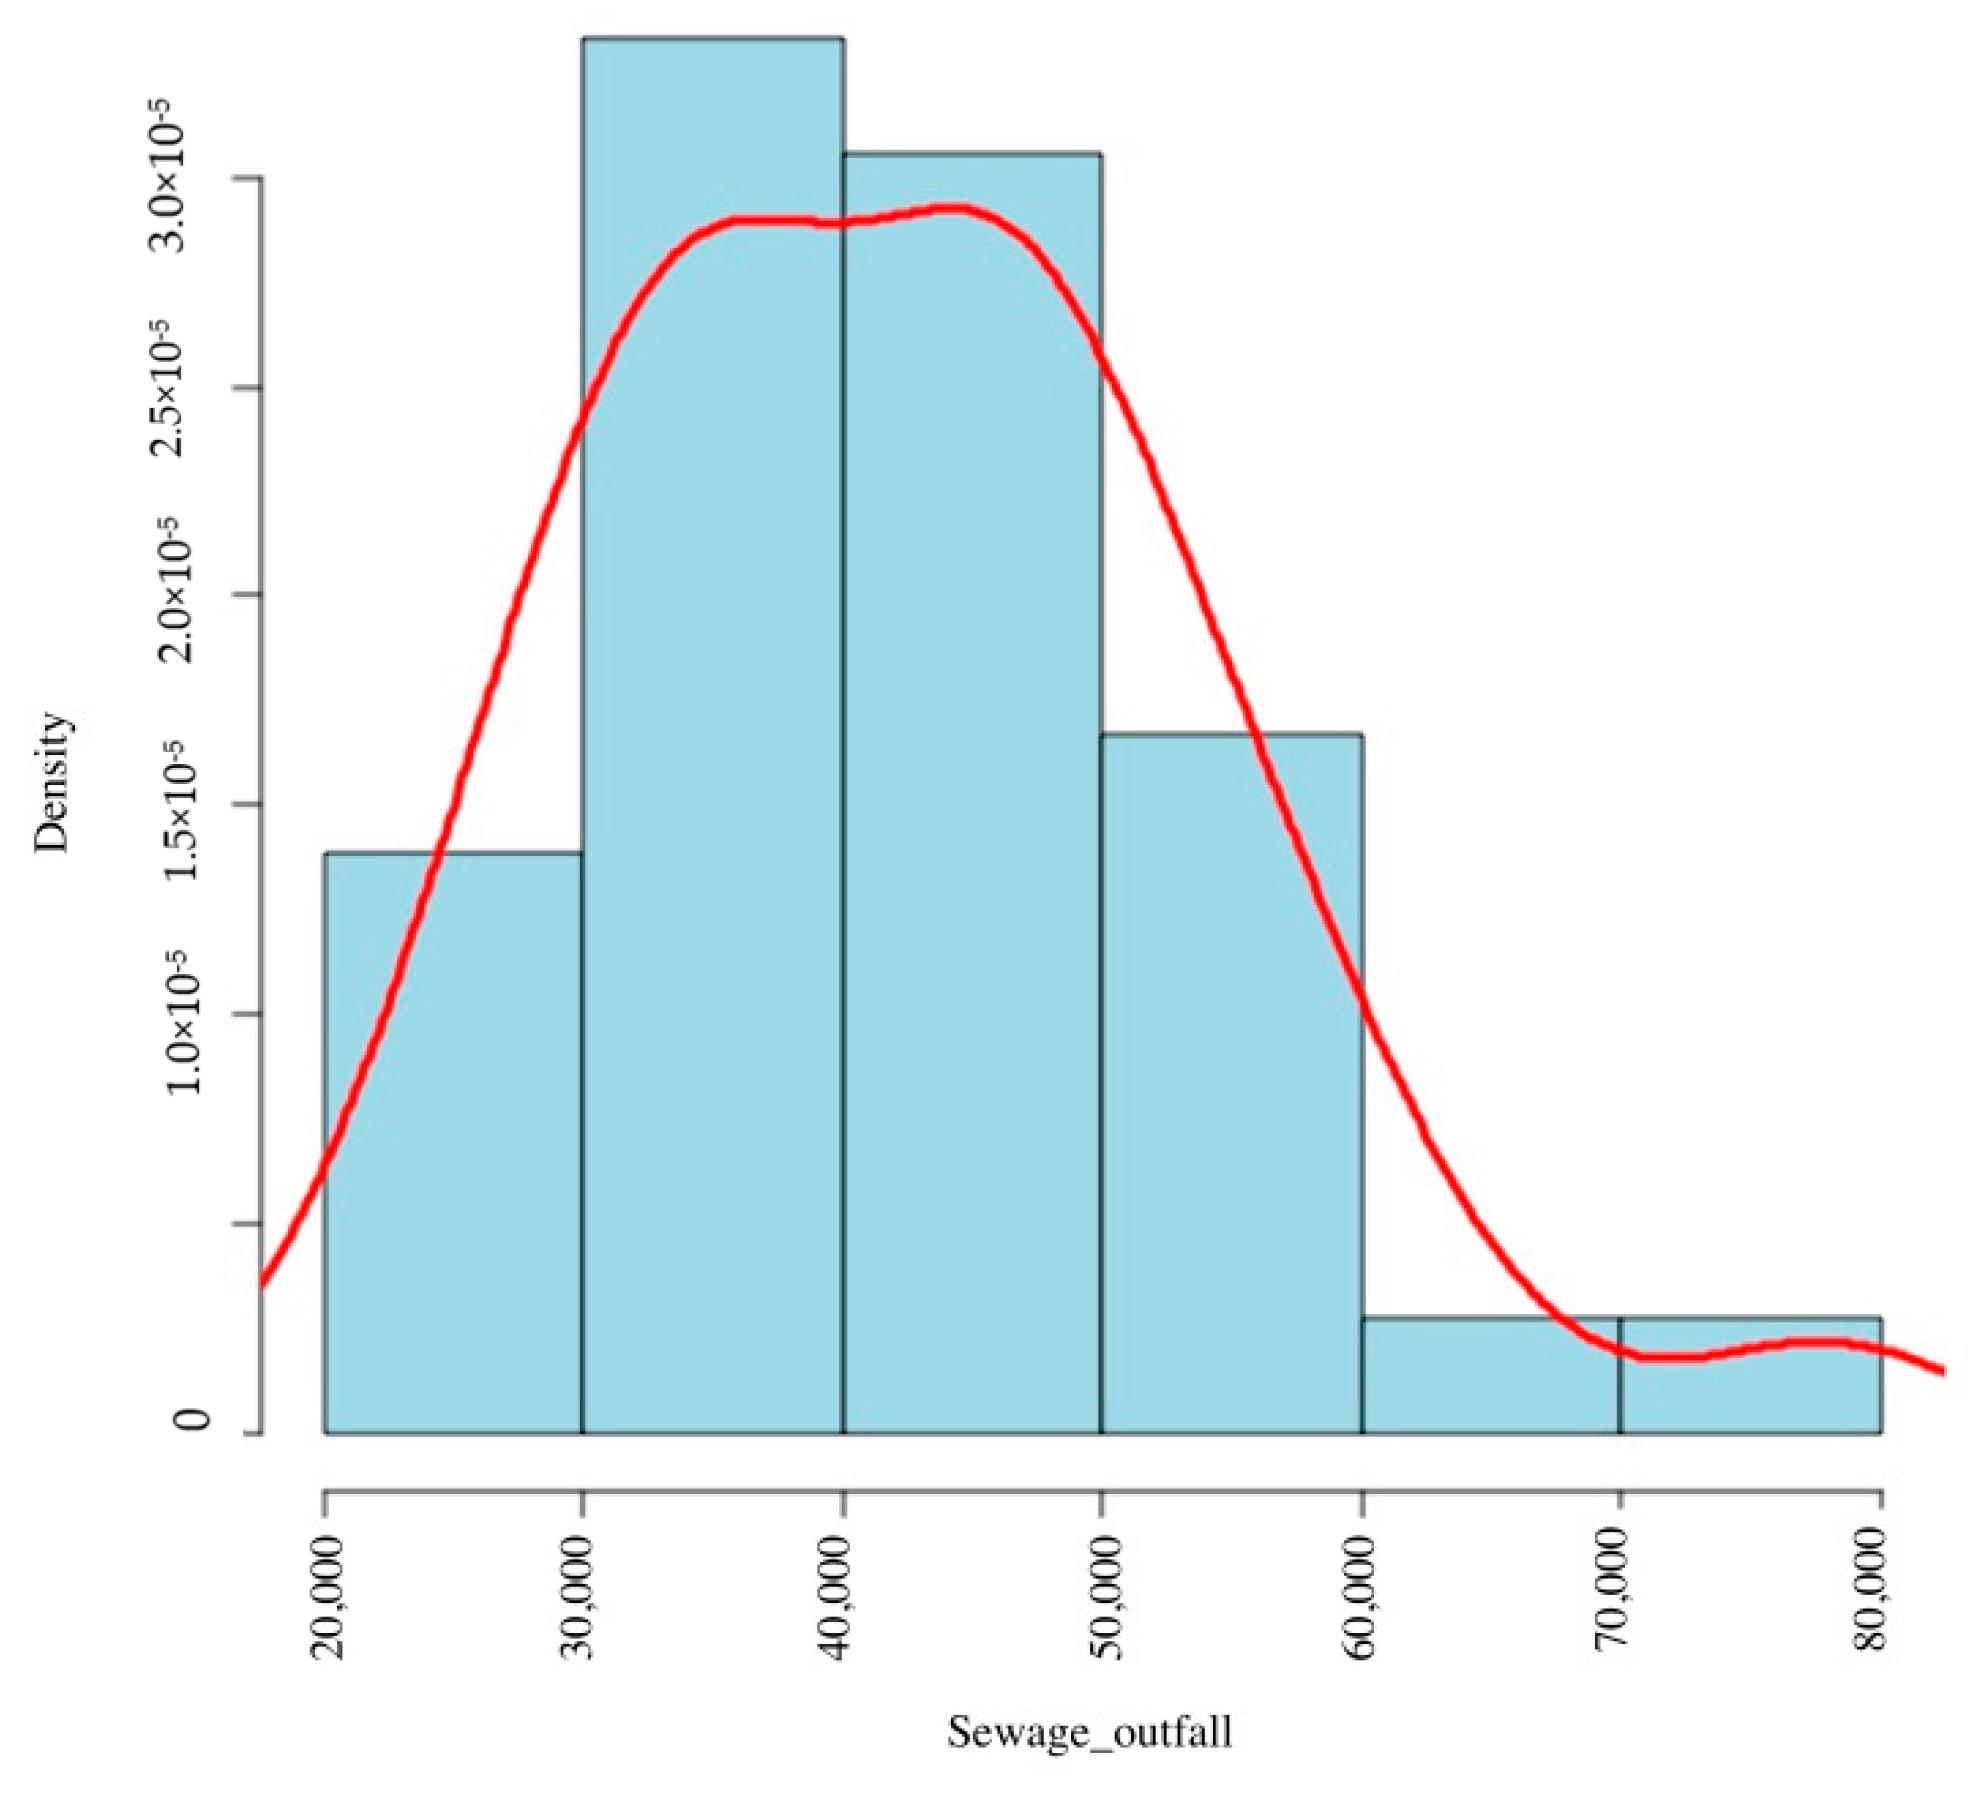
In order to determine the empirical distribution of the variate, kernel estimation was used for the mean daily sewage outflow in a particular month from the urban agglomeration of Radom. The results of the calculations are presented in Figure 4. While analyzing the obtained results, it was found that the kernel estimation of the density function indicates the unimodal nature of the density function. Thus, the observation series can be treated as one population in which there are no factors significantly disturbing the course of the analyzed phenomenon (the season and meteorological conditions do not affect the sewage outflow). However, by making a kernel analysis, while interpreting the results, some care should be taken. According to Santhosh and Srinivas [45], the choice of the method for estimating the smoothing parameter also has a significant impact on the result of the analysis. A value of a smoothing parameter that is too low may cause the estimator to have multimodal features. At high values of this parameter, the estimator becomes smoother, indicating the unimodal distribution of the characteristic. It should be emphasized that currently kernel estimation techniques have not been used to assess the seasonality of the sewage outflow from urban agglomerations. However, these methods have been used for the broad sense assessment of the functioning of sewage treatment plants. In the research [46], these estimators were used to compare linear and nonlinear techniques for monitoring the functioning processes of decentralized wastewater treatment plants. It has also been suggested [47] to use kernel estimation techniques for the diagnosis of some abnormalities of functioning and pollution reduction processes based on limited, in terms of number, observational series.
In the next stage of the research, there was made an analysis of the seasonality of the sewage outflow and the average monthly amount of atmospheric precipitation with the use of the Colwell indicators. The test results are presented in Table 3. On the basis of the conducted analysis, in the tested time period, there was found a stable course of the sewage outflow from the urban agglomeration, as evidenced by the C value. In the case of atmospheric precipitation, the seasonality of this phenomenon was definitely higher than the stability. The seasonality index M is almost 77% of P for the precipitation, whereas it is almost 25% for the sewage volume. However, it is necessary to note the high values of the predictability index P for the analyzed variables. This means that both the volume of sewage discharged and the course of atmospheric precipitation are easy to forecast. So far, the Colwell indicators have not been used to assess the seasonality of the sewage outflow. This attempt was made by Młyński et al. [48], where on the basis of these indicators, there was assessed the seasonal variability of the hydraulic load of sewage treatment plants located in the south of Poland, indicating that this method is also an effective way to assess seasonal variability of variates.
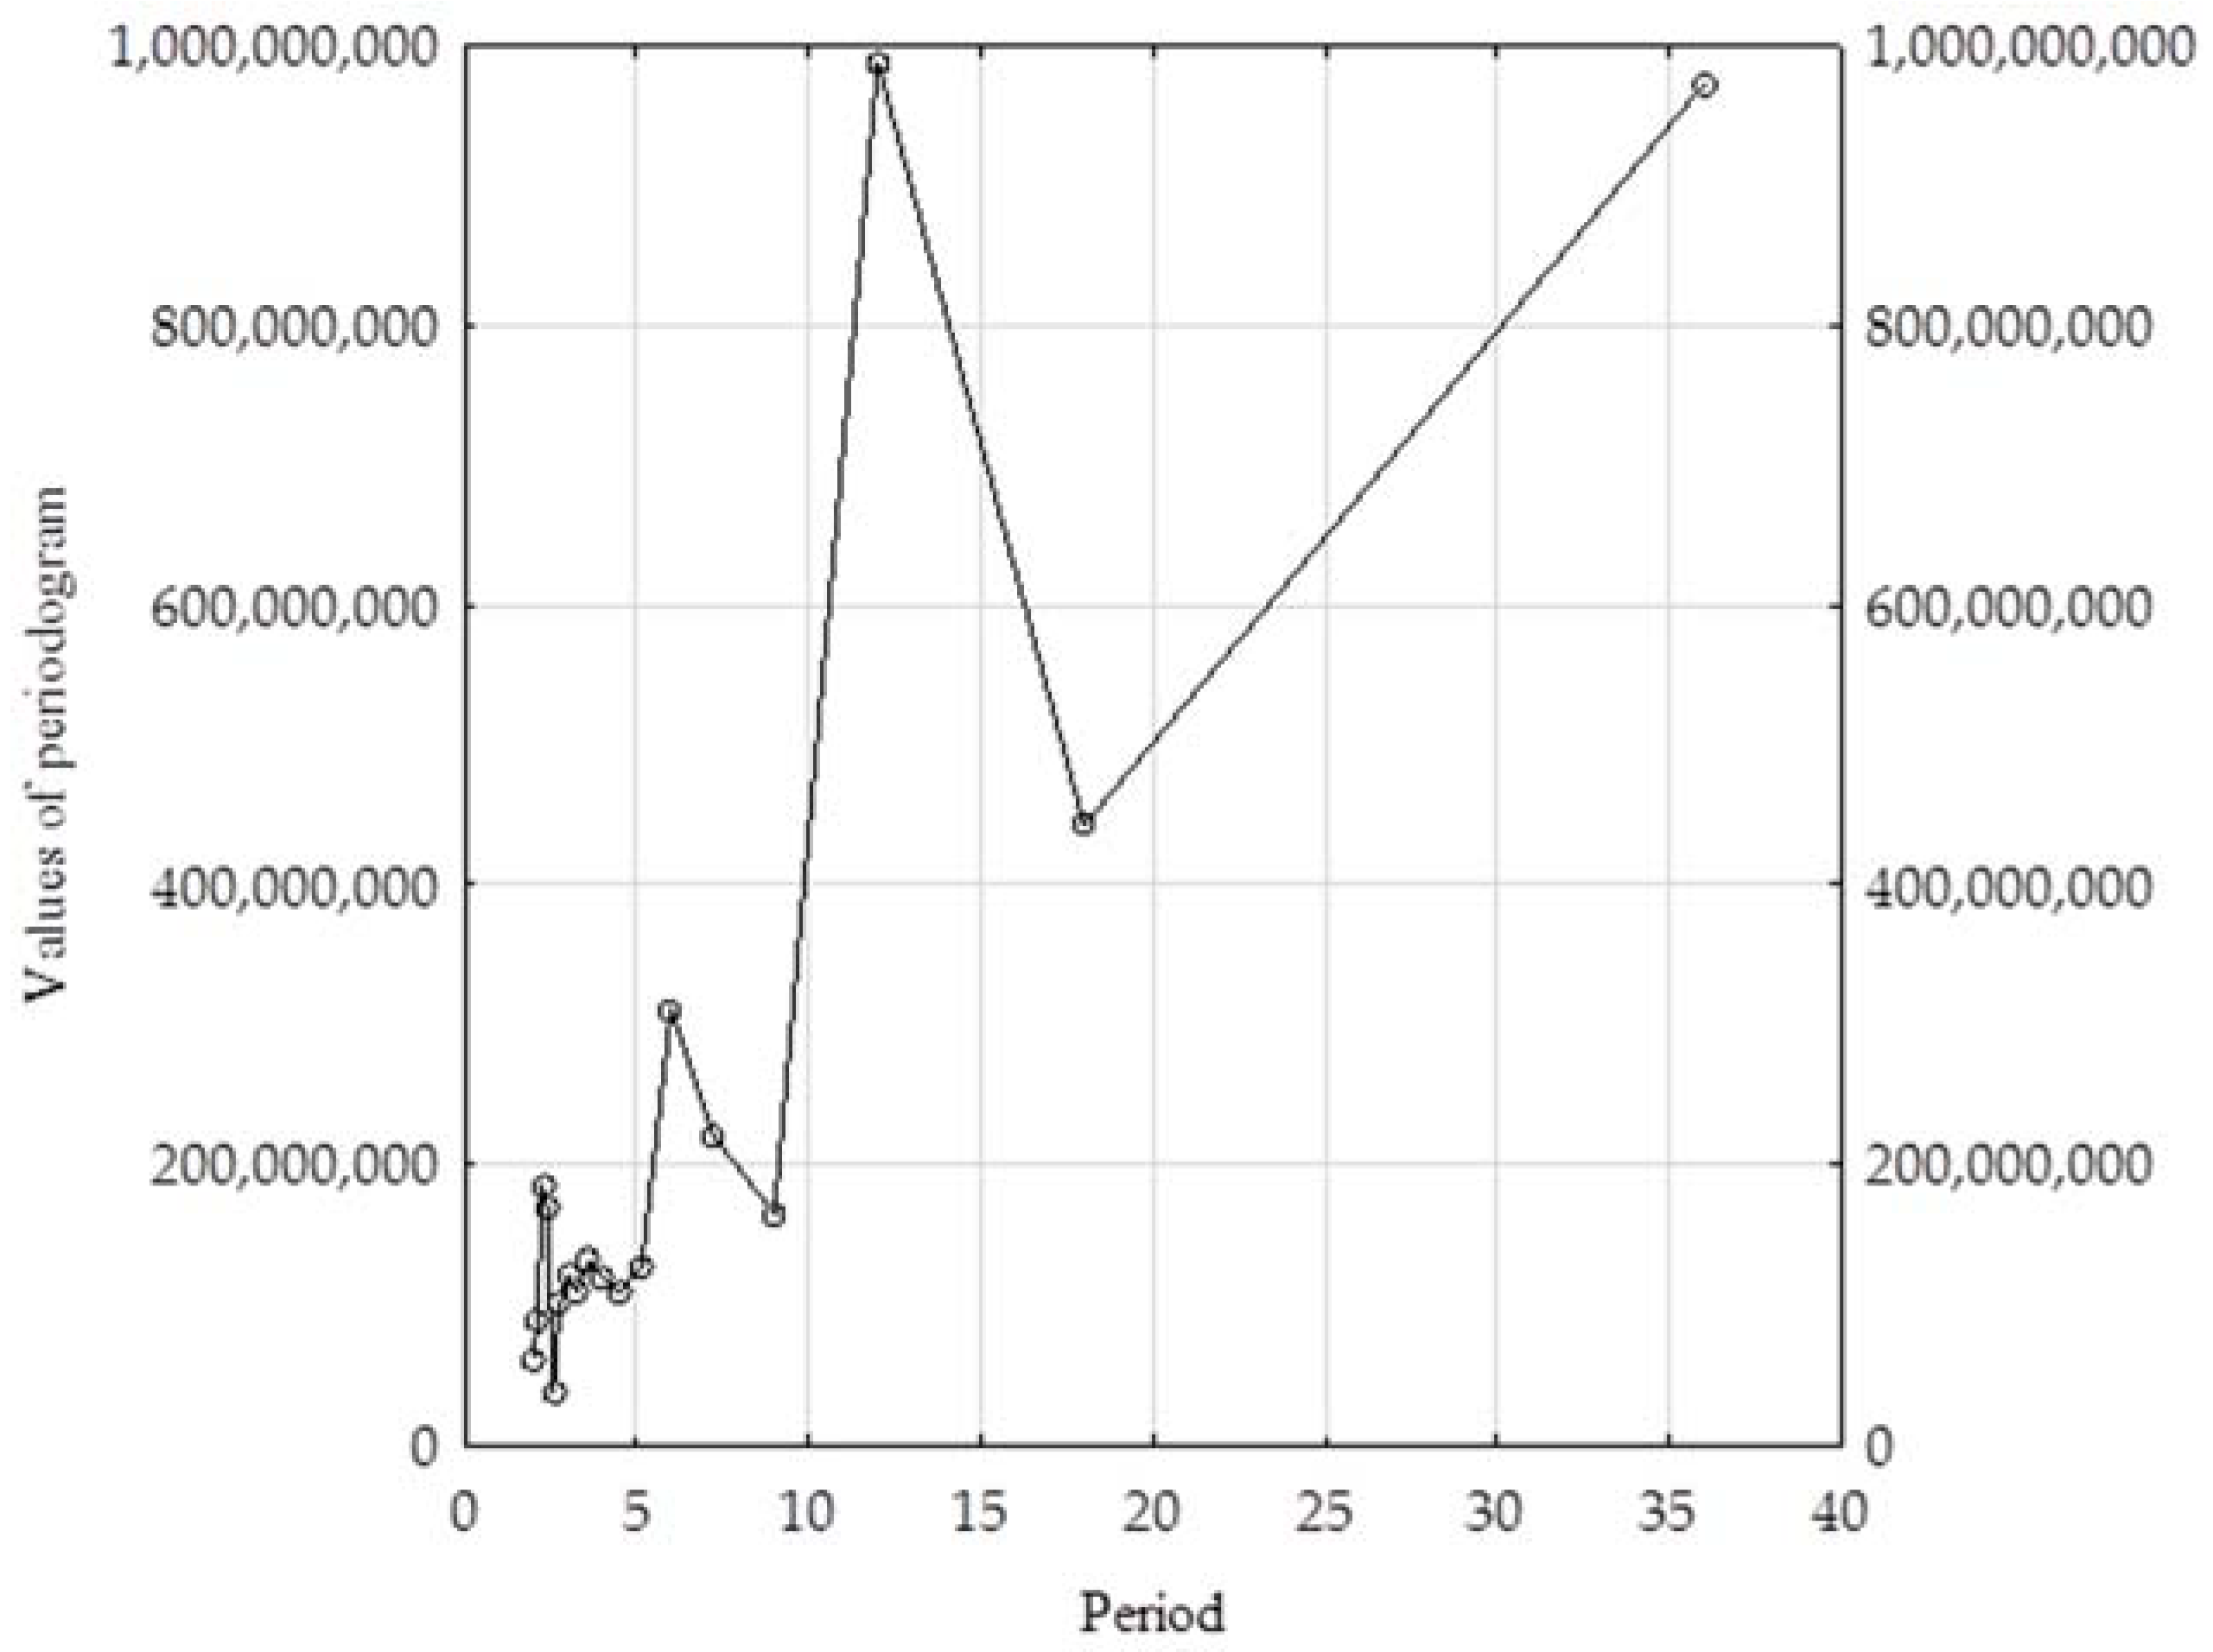
Additionally, there was made an analysis of the periodicity of the time series of the monthly averages of the daily sewage outflow, with the usage of spectral analysis to study the harmonic structure of the time series. The results of the analysis are presented in Figure 5. The performed spectral analysis allowed the decomposition of a complex time series, containing cyclical components, into several basic sinusoidal functions. As a result of the conducted analysis, it was found that in the examined time series, there were some periods characterized by different lengths, which in the initial phase could take the form of a random noise. In the case of the analyzed sewage system, it was found that there can be distinguished a 12-month cyclicity and 36- and 6-month cyclicity with lower values of periodogram for the sewage outflow from the examined urban agglomeration. It should be emphasized that spectral analysis has not also been used so far to assess the cyclical nature of the sewage outflow from urban agglomerations. Wąsik et al. [49] made an attempt to adapt this method to determine the impact of atmospheric precipitation on the amount of sewage flowing into the treatment plant in the south of Poland. The conducted research showed that Fourier spectral analysis is useful for determining the cyclicality of the time series in the form of the sewage outflow volume.
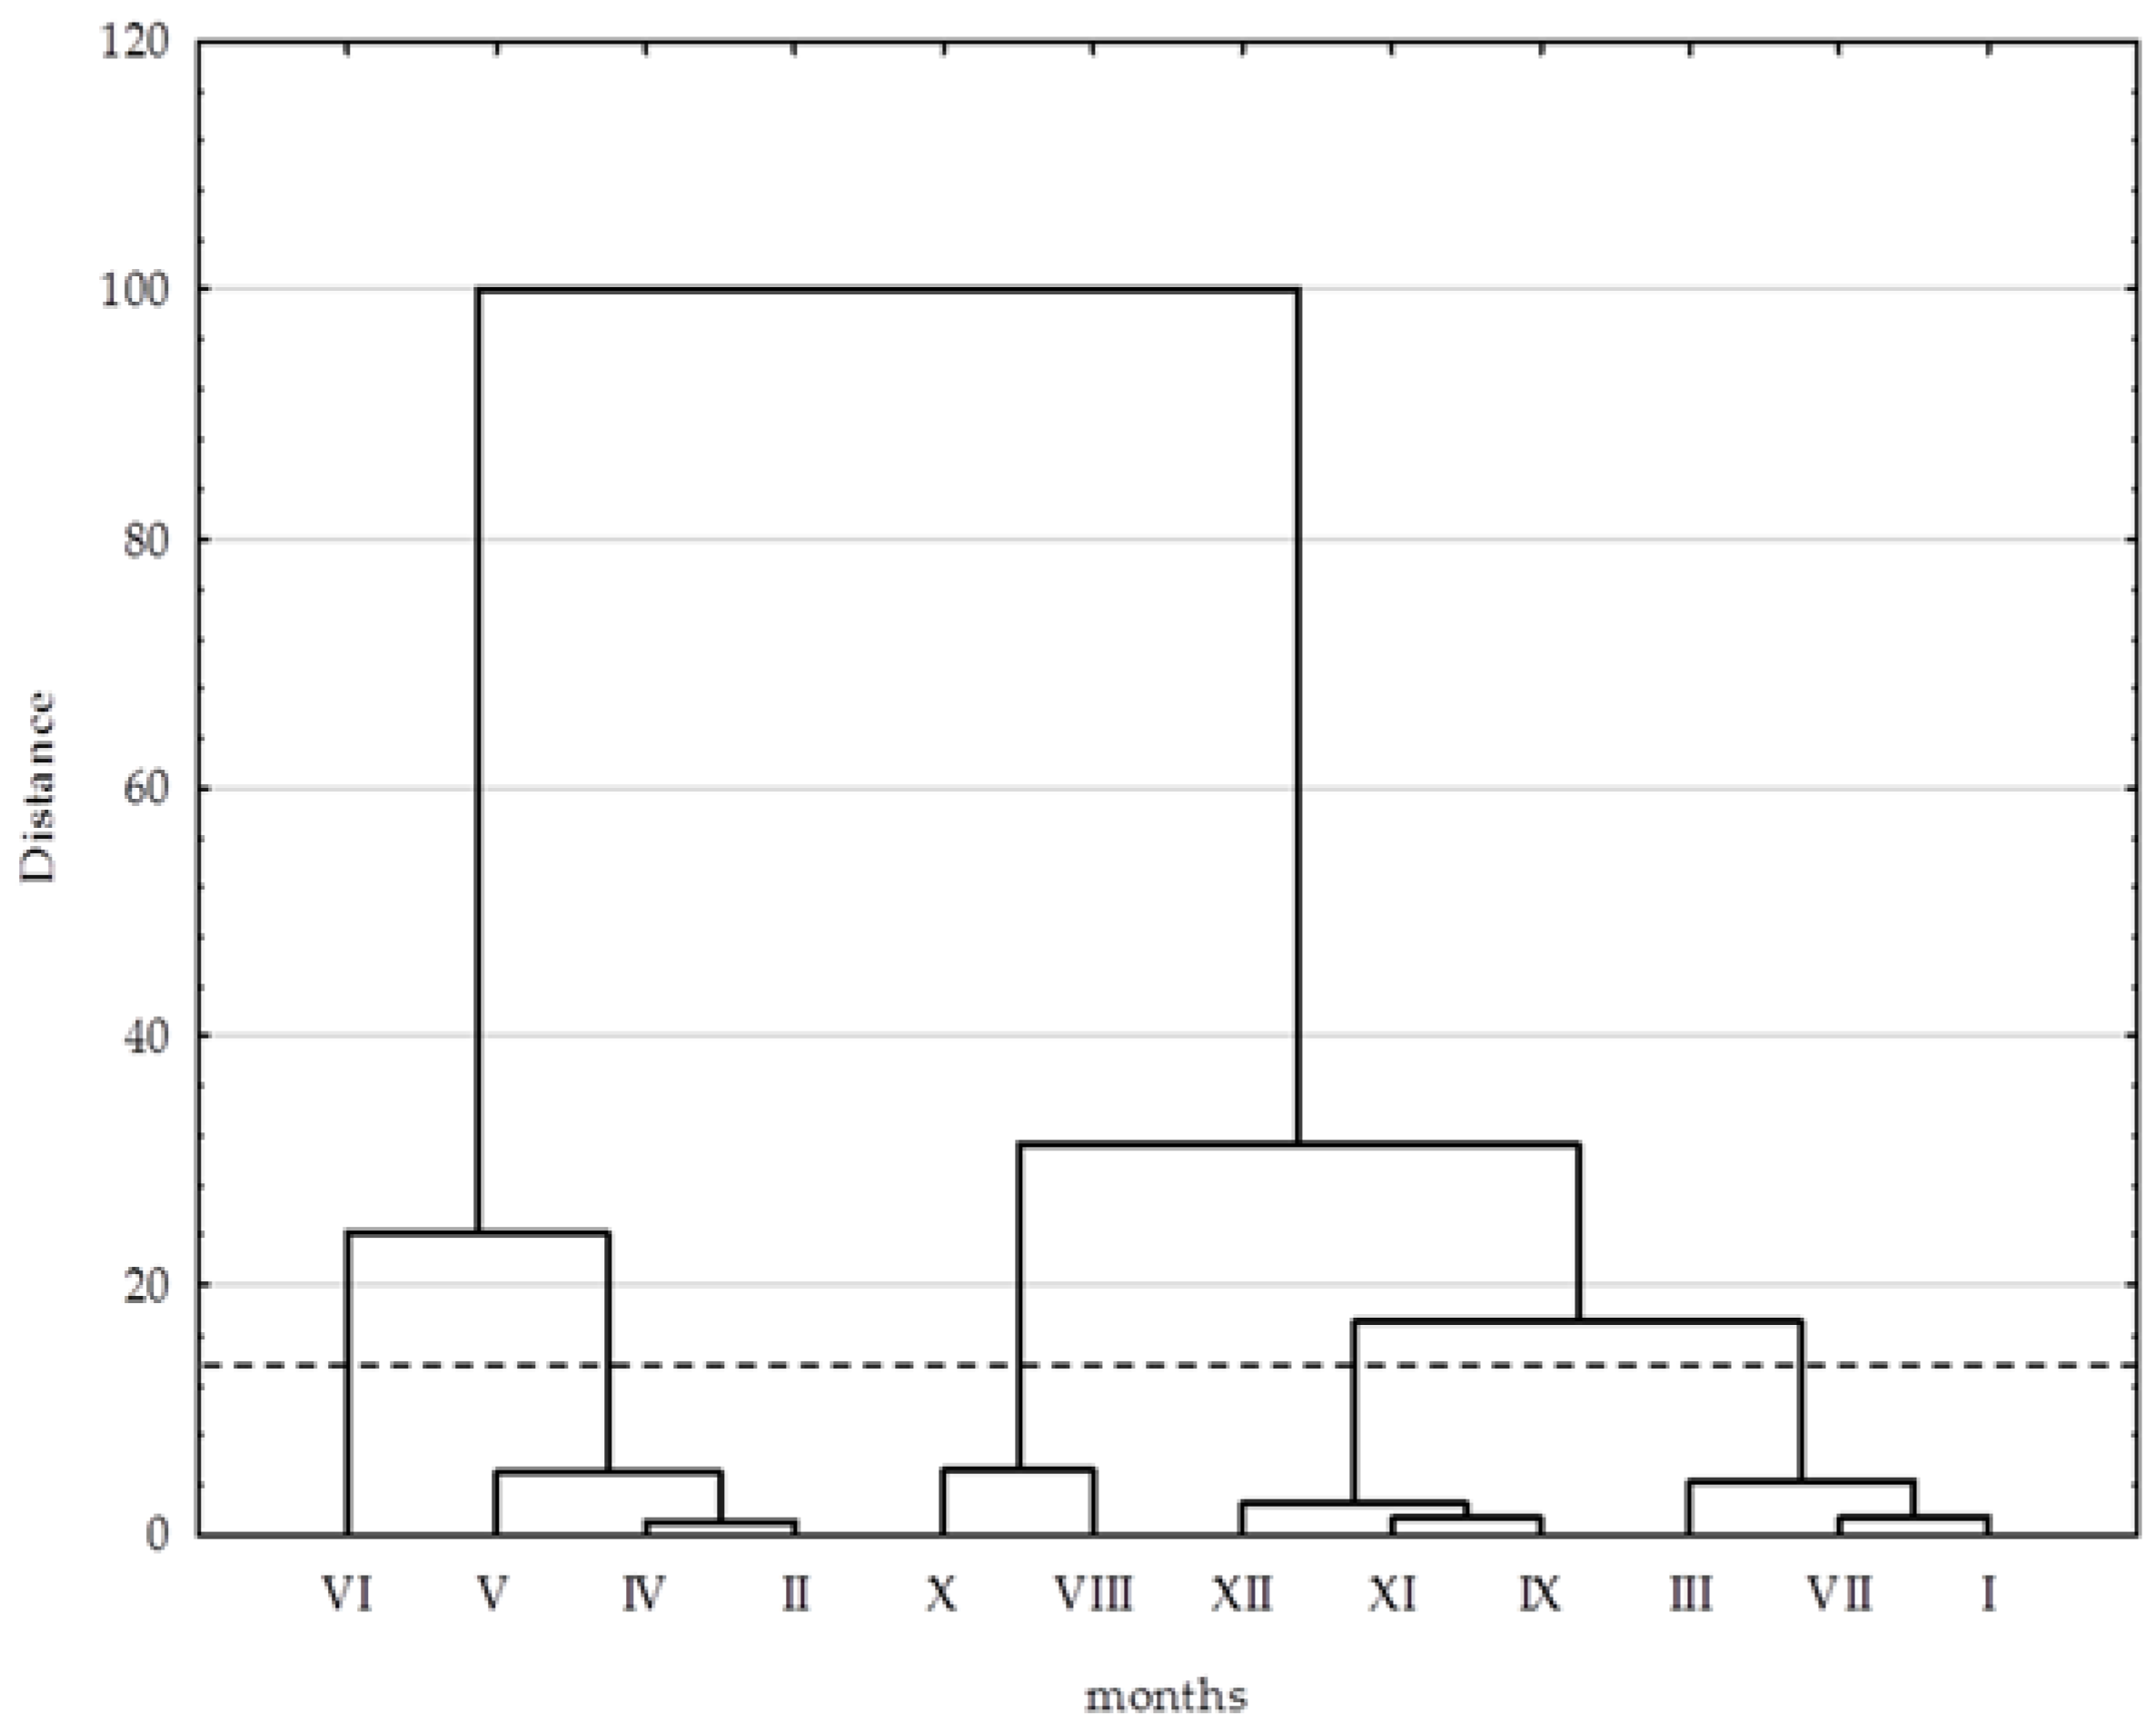
A supplement to the conducted research was an attempt to separate homogeneous seasons in relation to the daily volume of effluents discharged in individual months, using the cluster analysis method, where the agglomeration was made using the Ward method. The results of the calculation are presented in Figure 6.
On the basis of the course of the agglomeration chart, there was taken the cut-off level for the binding distance of 15%. It was noticed that at this distance there are five groups on the dendrogram, gathering particular months, in relation to the daily sewage outflow from the urban agglomeration of Radom in the studied time period. The first group was represented by three months, covering the winter, spring, and summer seasons of January, March, and July, respectively, for which the average daily sewage outflow was 41,451 m3·d−1, with the average monthly precipitation rate of 52 mm. In the second group, a cluster was formed by three months of the autumn–winter period, including September, November, and December, for which the average daily sewage outflow was 37,613 m3·d−1, and the average monthly amount of atmospheric precipitation was 45 mm. Within the third cluster, there were two months of the winter and summer months, August and October, respectively, for which the average daily outflow was 32,195 m3·d−1, and the average monthly atmospheric precipitation was 24 mm. The fourth group gathers one month of the winter season and two spring ones, February, April, and May, respectively, for which the average daily sewage outflow was 49,373 m3·d−1, while the average monthly amount of atmospheric precipitation was 62 mm. In the last, sixth group there was only one month, June, in which the average daily volume of outflowing sewage was 58,368 m3·d−1, with the average amount of monthly precipitation at 66 mm. It should be emphasized that the cluster analysis did not show any groups in which the variables would refer to a particular season (in each cluster months from other seasons). Therefore, the research carried out by the cluster analysis confirms the results of the calculations made using the analyzed methods. So far, there have been no reports in the literature related to the adaptation of the cluster analysis to assess either the seasonality of the sewage outflow from urban agglomerations or the hydraulic load of a treatment plant. These methods are commonly used in hydrological analyses [50,51].
Research using the cluster analysis, in a broad sense, of sanitary engineering has been carried out, among others by Bergel et al. [52], within which there was made the assessment of the possibility of using the agglomeration methods for hourly and daily variability of water demand in the water supply system in rural areas.
The research related to the seasonal variability of the sewage outflow from urban agglomerations is strictly related to the environmental protection of the treated sewage receiver. Zawilski and Brzezinska [53] confirmed that the seasonality of the sewage outflow is a very important factor in the protection of wastewater treatment plants against rapid changes in their working conditions. As shown by the analyses carried out by Miernik and Wałęga [54], variable conditions of hydraulic load in a treatment plant can increase the value of BOD5 in treated wastewater more than twice. The analyses carried out by Molenda [55] showed that the inflow of external water to the sewage system, which causes hydraulic overloads, is characterized by a high level of pollution, and the concentration of some pollutants exceeds the permissible values set for sewage discharged into water and ground. The analyses carried out by Ociepa [56] unambiguously indicated that there should be carried out a constant monitoring of the seasonal variability of the amount of incoming sewage, which is due to the large diversity of pollution of incidental water flowing into the sewage system. However, Masłoń [57] showed that the differentiated hydraulic load often causes significant disturbances in the functioning of the sewage treatment plant, which results in introducing excessive amounts of pollutants into the receiver and this causes degradation of its environment.
5. Conclusions
The aim of the work was to assess the possibility of using statistical techniques to assess the seasonality of the sewage outflow from the urban agglomeration of Radom. The analysis was made on the basis of the data covering the daily volume of sewage in the years 2013–2015 and the daily rainfall corresponding to that period. On the basis of the conducted tests, it has been shown that the average daily volume of the outflowing sewage has been characterized by high variability. In addition, the share of incidental water in the total volume of sewage discharged from the urban agglomeration was small and on average amounted to 6%. The long-term registers of daily volumes of effluent were characterized by a decreasing trend, although not statistically significant. The study of the sewage outflow seasonality carried out by kernel estimators, the Colwell indicators, and Fourier spectral analysis unambiguously indicated the lack of this phenomenon. In addition, the Colwell indicators confirmed the possibility of predicting the volume of the sewage outflow from the urban agglomeration of Radom. Also, the results obtained by the agglomeration using the cluster method confirmed the lack of seasonality of the sewage outflow.
The conducted research allowed us to state that the analyzed statistical techniques can be effectively used by the operators of sewage treatment plants to assess the hydraulic load of such facilities. From a practical point of view, the obtained results may indicate the need to undertake some detailed tests in individual sections of the sewage network, in order to determine where the greatest inflow of external water occurs. On this basis, the renovation methods can be indicated. In addition, the results of the analysis may justify undertaking some activities related to the examination of the age and material structure of the sewage system, in order to select the sections that are most exposed to the penetration of external water. It should also be remembered that an additional advantage will be some information regarding the location of the groundwater table. The above-mentioned analyses and tests will allow us to identify potential periods in which the volume of sewage exceeds the throughput of the sewage treatment plant. Thanks to this, it will be possible to take actions related to the functioning of individual elements of the technological sequence of the sewage treatment plant, enabling maintenance of the effectiveness of their work at the required level. Consequently, this will allow sewage to be discharged into the natural receiver without degrading its biotic conditions.
Author Contributions
Study design, D.M.; Data collection, P.B.; Statistical analysis, D.M.; Data interpretation, D.M.; Manuscript preparation, D.M.; and Literature search, D.M. and K.K.
Funding
This research received no external funding
Acknowledgments
The authors would like to thank the Head of the Department of Sanitary Engineering and Water Management, Faculty of Environmental Engineering and Land Surveying, University of Agriculture in Krakow, for financial support. The authors would also like to thank the anonymous reviewers for their constructive comments, which helped to substantially improve the manuscript.
Conflicts of Interest
The authors declare no conflict of interest.
References
- Brabec, E.; Schulte, S.; Richards, P.L. Impervious surfaces and water quality: A review of current literature and its implications for watershed planning. J. Plan. Lit. 2002, 16, 499–514. [Google Scholar] [CrossRef]
- Todeschini, S. Hydrologic and environmental impacts of imperviousness in an industrial catchment of Northern Italy. J. Hydrol. Eng. 2016, 21. [Google Scholar] [CrossRef]
- Gizińska-Górna, M.; Jóźwiakowski, K.; Marzec, M.; Pytka, A.; Sosnowska, B.; Różańska-Boczula, M.; Listosz, A. Analysis of the influence of a hybrid constructed wetland wastewater treatment plant on the water quality of the receiver. Rocz. Ochr. Sr. 2017, 19, 370–393. [Google Scholar]
- Kadlec, R.H. Comparison of free water and horizontal subsurface treatment wetlands. Ecol. Eng. 2009, 35, 159–174. [Google Scholar] [CrossRef]
- Trang, N.T.D.; Konnerup, D.; Schierup, H.-H.; Chiem, N.H.; Tuan, L.A.; Brix, H. Kinetics of pollutant removal from domestic wastewater in a tropical horizontal subsurface flow constructed wetland system: Effects of hydraulic loading rate. Ecol. Eng. 2010, 36, 527–535. [Google Scholar] [CrossRef]
- Seggelke, K.; Löwe, R.; Beeneken, T.; Fuchs, L. Implementation of an integrated real-time control system of sewer system and waste water treatment plant in the city of Wilhelmshaven. Urban Water J. 2013, 10, 330–341. [Google Scholar] [CrossRef]
- Karpf, C.; Krebs, P. Quantification of groundwater infiltration and surface water inflows in urban sewer networks based on a multiple model approach. Water Res. 2011, 45, 3129–3136. [Google Scholar] [CrossRef] [PubMed]
- Yap, H.T.; Ngien, S.K.; Othman, N.; Ghani, A.A.; Abd, N. Preliminary inflow and infiltration study of sewerage systems from two residential areas in Kuantan, Pahang. ESTEEM Acad. J. 2017, 13, 98–106. [Google Scholar]
- Beheshti, A.M.; Saegrov, S.; Ugarelli, R. Infiltration/inflow assessment and detection in urban sewer system. Innsendte Artikler 2015, 1, 24–34. [Google Scholar]
- Yap, H.T.; Ngien, S.K. Assessment on inflow and infiltration in sewerage systems of Kuantan, Pahang. Water Sci. Technol. 2017, 76, 2918–2927. [Google Scholar] [CrossRef] [PubMed]
- Bareš, V.; Stránský, D.; Sýkora, P. Sewer infiltration/inflow: Long-term monitoring based on diurnal variation of pollutant mass flux. Water Sci. Technol. 2009, 60, 1–7. [Google Scholar] [CrossRef] [PubMed]
- Cardoso, A.; Prigiobbe, V.; Giulianelli, M.; Baer, E.; Bénédittis, J.D.; Coelho, S.T. Assessing the impact of infiltration and exfiltration in sewer systems using performance indicators: Case studies of the APUSS project. Water Pract. Technol. 2006, 1. [Google Scholar] [CrossRef]
- Bénédittis, J.; Bertrand-Krajewski, J.L. Infiltration in sewer systems: Comparison of measurement methods. Water Sci. Technol. 2005, 52, 219–227. [Google Scholar] [CrossRef] [PubMed]
- Młyńska, A. Experimental analysis of bielany wastewater treatment plant hydraulic load variability. Tech. Trans. 2014, 5, 183–188. [Google Scholar]
- Kaczor, G.; Chmielowski, K.; Bugajski, P. Wpływ rocznej sumy opadów atmosferycznych na objętość wód przypadkowych dopływających do kanalizacji sanitarnej. Rocz. Ochr. Sr. 2017, 19, 668–681. (In Polish) [Google Scholar]
- Bugajski, P.; Kaczor, G.; Chmielowski, K. Variable dynamics of sewage supply to wastewater treatment plant depending on the amount of precipitation water inflowing to sewerage network. J. Water Land Dev. 2017, 33, 57–63. [Google Scholar] [CrossRef] [Green Version]
- Kaczor, G. Wpływ wiosennych roztopów śniegu na dopływ wód przypadkowych do oczyszczalni ścieków bytowych. Acta Sci. Pol. Form. Circ. 2011, 10, 27–34. (In Polish) [Google Scholar]
- Banasik, K.; Hejduk, L. Long term changes in runoff from a small agricultural catchment. Soil Water Res. 2012, 7, 64–72. [Google Scholar] [CrossRef]
- Rutkowska, A.; Ptak, M. On certain stationary tests for hydrological series. Stud. Geotech. Mech. 2012, 4, 51–63. [Google Scholar] [CrossRef]
- Blain, G.C. The influence of nonlinear trends on the power of the trend-free pre-whitening approach. Acta Sci. Agron. 2015, 37, 21–28. [Google Scholar] [CrossRef]
- Mondal, A.; Kundu, S.; Mukhopadhyay, A. Rainfall trend analysis by Mann-Kendall test: A case study of north-eastern part of Cuttack District, Orissa. Int. J. Geol. Earth Environ. Sci. 2012, 2, 70–78. [Google Scholar]
- Blain, G.C. The modified Mann-Kendall test: On the performance of three variance correction approaches. Bragantia Camp. 2013, 72, 416–425. [Google Scholar] [CrossRef]
- Pingale, S.M.; Khare, D.; Jat, M.K.; Adamowski, J. Trend analysis of climate variables in an arid and semi-arid region of the Ajmer District, Rajasthan, India. J. Water Land Dev. 2016, 28, 3–18. [Google Scholar] [CrossRef]
- Baran-Gurgul, K.; Raczyński, K. Dynamika występowania niżówek w rzekach górskich i wyżynnych na przykładzie Wisłoki i górnego Wieprza. Cz. 2. Zmienność wieloletnia. Woda Środowisko Obs. Wiej. 2017, 17, 5–17. (In Polish) [Google Scholar]
- Peng, J.; Zhao, S.; Liu, X.; Tian, L. Identifying the urban-rural fringe using wavelet transform and kernel density estimation: A case study in Beijing City, China. Environ. Model. Assess. 2016, 83, 286–302. [Google Scholar] [CrossRef]
- Pathiraja, S.; Moradkhani, H.; Marshall, L.; Sharma, A.; Geenens, G. Data-driven model uncertainty estimation in hydrologic data assimilation. Water Resour. Res. 2018, 54, 1252–1280. [Google Scholar] [CrossRef]
- Żelazny, M. Czasowo-Przestrzenna Zmienność Cech Fizykochemicznych Wód Tatrzańskiego Parku Narodowego; Instytut Geografii i Gospodarki Przestrzennej UJ: Kraków, Poland, 2012. (In Polish) [Google Scholar]
- Sivakumar, B. Chaos in Hydrology: Bridging Determinism and Stochasticity; Springer: Sydney, Australia, 2016. [Google Scholar]
- Webb, M.; Thoms, M.; Reid, M. Determining the ecohydrological character of aquatic refugia in a dryland river system: The importance of temporal scale. Ecohydrol. Hydrobiol. 2012, 12, 21–33. [Google Scholar] [CrossRef]
- Fernadez, R.; Sayama, T. Hydrological recurrence as a measure for large river basin classification and process understanding. Hydrol. Earth Syst. Sci. 2015, 19, 1919–1941. [Google Scholar] [CrossRef]
- Wałęga, A.; Młyński, D. Seasonality of median monthly discharge in selected Carpathian rivers of the upper Vistula basin. Carpath. J. Earth Environ. Sci. 2017, 12, 617–628. [Google Scholar]
- Eslamian, S. Handbook of Engineering Hydrology; Taylor & Francis Group: Boca Raton, FL, USA, 2014. [Google Scholar]
- Wałęga, A.; Michalec, B. Characteristics of extreme heavy precipitation events occurring in the area of Cracow (Poland). Soil Water Res. 2014, 9, 182–191. [Google Scholar] [CrossRef] [Green Version]
- Wałęga, A.; Młyński, D.; Bogdał, A.; Kowalik, T. Analysis of the course and frequency of high water stages in selected catchments of the upper Vistula basin in the south of Poland. Water 2016, 8, 394–409. [Google Scholar] [CrossRef]
- Murtagh, F.; Legendre, P. Ward’s hierarchical agglomerative clustering method: Which algorithms implement Ward’s criterion? J. Classif. 2014, 37, 274–295. [Google Scholar] [CrossRef]
- Kundzewicz, Z.W.; Matczak, P. Climate change regional review: Poland. WIREs Clim. Chang. 2012, 3, 297–311. [Google Scholar] [CrossRef]
- Młyński, D.; Chmielowski, K. Analiza obciążenia hydraulicznego wybranych oczyszczalni powiatu jasielskiego. Inżynieria Ekol. 2016, 50, 171–178. (In Polish) [Google Scholar] [CrossRef]
- Młyński, D.; Chmielowski, K.; Młyńska, A. Analysis of hydraulic load of a wastewater treatment plant in Jasło. J. Water Land Dev. 2016, 28, 61–67. [Google Scholar] [CrossRef] [Green Version]
- Pluta, K.; Mrowiec, M. Analiza oddziaływania systemów kanalizacyjnych na odbiornik. Inżynieria Ekol. 2015, 45, 183–194. (In Polish) [Google Scholar] [CrossRef]
- Kaczor, G.; Bugajski, P.; Bergel, T. Zastosowanie metody trójkąta do obliczania objętości wód infiltracyjnych i przypadkowych w kanalizacji sanitarnej. Inf. Ekol. Teren. Wiej. 2013, 3, 263–274. (In Polish) [Google Scholar]
- Chang, H.; Praskievisz, S.; Parandvash, H. Sensitivity of urban water consumption to weather and climate variability at multiple temporal scales. Int. J. Geospat. Environ. Res. 2014, 1, 1–21. [Google Scholar]
- Kaczor, G.; Bergel, T.; Bugajski, P.; Pijanowski, J. Aspects of sewage disposal from tourist facilities in national parks and other protected areas. Pol. J. Environ. Stud. 2015, 24, 107–114. [Google Scholar] [CrossRef]
- Cabral, M.; Mamade, A.; Amado, C.; Covas, D. Modeling the effect of weather conditions on urban water demand in multiple network areas: A practical approach to improve monthly and seasonal operation. J. Water Supply Res. Technol. Aqua 2016, 65, 612–625. [Google Scholar] [CrossRef]
- Bergel, T.; Szeląg, B.; Woyciechowska, O. Influence of a season on hourly and daily variations in water demand patterns in a rural water supply line—Case study. J. Water Land Dev. 2017, 34, 59–64. [Google Scholar] [CrossRef]
- Santhosh, D.; Srinivas, V. Bivariate frequency analysis of floods using a diffusion Based kernel density estimation estimator. Water Resour. Res. 2015, 49, 8328–8343. [Google Scholar] [CrossRef]
- Kazor, K.; Holloway, R.H.; Cath, T.Y.; Hering, A.S. Comparison of linear and nonlinear dimension reduction techniques for automated process monitoring of a decentralized wastewater treatment facility. Stoch. Environ. Res. Risk Assess. 2016, 30, 1527–1544. [Google Scholar] [CrossRef]
- Xiao, H.; Huang, D.; Pan, Y.; Liu, Y.; Song, K. Fault diagnosis and prognosis of wastewater processes with incomplete data by the auto-associative neural networks and ARMA model. Chemom. Intell. Lab. Syst. 2017, 161, 96–107. [Google Scholar] [CrossRef]
- Młyński, D.; Chmielowski, K.; Młyńska, A. Analiza zmienności ilościowej ścieków dopływających do wybranych oczyszczalni powiatu sanockiego. Acta Sci. Pol. Form. Circ. 2017, 16, 77–90. (In Polish) [Google Scholar] [CrossRef]
- Wąsik, E.; Bugajski, P.; Chmielowski, K.; Cupak, A. Wpływ opadów atmosferycznych w kotlinie sądeckiej na zmienność ilościową ścieków dopływających do oczyszczalni Wielopole. Inf. Ekol. Teren. Wiej. 2016, 2, 543–555. (In Polish) [Google Scholar]
- Cupak, A. Initial results of nonhierarchical cluster methods use for low flow grouping. J. Ecol. Eng. 2017, 18, 44–50. [Google Scholar] [CrossRef]
- Cupak, A.; Wałęga, A.; Michalec, B. Cluster analysis in determination of hydrologically homogeneous regions with low flow. Acta Sci. Pol. Form. Circ. 2017, 16, 53–56. [Google Scholar] [CrossRef]
- Bergel, T.; Woyciechowska, O.; Szeląg, B. Analiza zmienności godzinowego i dobowego zapotrzebowania na wodę w wybranym wodociągu wiejskim—Studium przypadku. Gaz Woda Tech. Sanit. 2017, 4, 171–174. [Google Scholar] [CrossRef]
- Zawilski, M.; Brzezińska, A. Wpływ przeciążenia biologicznej oczyszczalni ścieków w okresach mokrej pogody na jej sprawność. Ochr. Środowiska 2003, 2, 37–42. (In Polish) [Google Scholar]
- Miernik, W.; Wałęga, A. Wpływ czasu eksploatacji na efekty oczyszczania ścieków w oczyszczalni typu Lemna. Inf. Ekol. Teren. Wiej. 2006, 3, 39–51. (In Polish) [Google Scholar]
- Molenda, T. Dynamika zmian wybranych zanieczyszczeń w spływach powierzchniowych zlewni zurbanizowanej. Inf. Ekol. Teren. Wiej. 2006, 4, 117–124. (In Polish) [Google Scholar]
- Ociepa, E. Ocena zanieczyszczenia ścieków deszczowych trafiających do systemów kanalizacyjnych. Inżynieria i Ochr. Środowiska 2011, 4, 357–364. (In Polish) [Google Scholar]
- Masłoń, A. Evaluation of the effectiveness of wastewater treatment plant in Jasło under different hydraulic loading. Arch. Waste Manag. Environ. Protect. 2014, 16, 57–66. [Google Scholar]
Figure 1.
The location of the rural agglomeration of Radom against the background of the Masovian Voivodeship and Poland.
Figure 1.
The location of the rural agglomeration of Radom against the background of the Masovian Voivodeship and Poland.

Figure 2.
The volume of the daily sewage outflow from the urban agglomeration of Radom against the background of the daily atmospheric precipitation in the years 2013–2015.
Figure 2.
The volume of the daily sewage outflow from the urban agglomeration of Radom against the background of the daily atmospheric precipitation in the years 2013–2015.

Figure 3.
The average percentage of incidental water flowing into the sewage system of the urban agglomeration of Radom against the background of the average monthly amount of atmospheric precipitation.
Figure 3.
The average percentage of incidental water flowing into the sewage system of the urban agglomeration of Radom against the background of the average monthly amount of atmospheric precipitation.

Figure 4.
The course of the estimated kernel density function for the mean daily sewage outflow in a particular month from the urban agglomeration of Radom.
Figure 4.
The course of the estimated kernel density function for the mean daily sewage outflow in a particular month from the urban agglomeration of Radom.

Figure 5.
Periodogram of the monthly averages of the daily sewage outflow from the urban agglomeration of Radom.
Figure 5.
Periodogram of the monthly averages of the daily sewage outflow from the urban agglomeration of Radom.

Figure 6.
The agglomeration of the analyzed time periods in relation to the volumes of the sewage outflow.
Figure 6.
The agglomeration of the analyzed time periods in relation to the volumes of the sewage outflow.


Table 1.
The characteristics of the sewage outflow from the urban agglomeration of Radom in the years 2013–2015.
Table 1.
The characteristics of the sewage outflow from the urban agglomeration of Radom in the years 2013–2015.
| Qdmin [m3·d−1] | Qdmean [m3·d−1] | Qdmmax [m3·d−1] | S [m3·d−1] | CS [m3·d−1] | A [-] | K [-] |
|---|---|---|---|---|---|---|
| 2668 | 42,436 | 179,320 | 18,520 | 0.44 | 2.40 | 9.38 |
Note: Qdmin, Qdmean, Qdmax—minimum, mean, and maximum of daily volumes of outflowing sewage; S—standard deviation; Cs—coefficient of variability; A—coefficient of skewness; and K—kurtosis.
Table 2.
The results of the trend analysis carried out by the modified Mann–Kendall (MMK) test for the sewage outflow during the analyzed period of time.
Table 2.
The results of the trend analysis carried out by the modified Mann–Kendall (MMK) test for the sewage outflow during the analyzed period of time.
| Z* | p* | n/n* | Z | p | Var(S) | Var*(S) |
|---|---|---|---|---|---|---|
| −1.189 | 0.234 | 2.462 | −1.866 | 0.062 | 5390.000 | 13,269.610 |
Note: Z*—corrected standardized Mann–Kendall statistic; p*—corrected probability value; n/n*—effective number of observations; Z—standardized Mann–Kendall statistic; p—probability value; Var(S)—variance; and Var*(S)—corrected variance.
Table 3.
The values of the Colwell indicators for the average monthly the sewage outflows and the average monthly amount of atmospheric precipitation.
Table 3.
The values of the Colwell indicators for the average monthly the sewage outflows and the average monthly amount of atmospheric precipitation.
| Variable | Colwell Indicators | ||||
|---|---|---|---|---|---|
| C | M | P | C/P | M/P | |
| Sewage outflow | 0.555 | 0.180 | 0.734 | 0.755 | 0.245 |
| Atmospheric precipitation | 0.314 | 0.359 | 0.672 | 0.467 | 0.768 |
Note: C—constancy; M—seasonality index; and P—predictability.
© 2018 by the authors. Licensee MDPI, Basel, Switzerland. This article is an open access article distributed under the terms and conditions of the Creative Commons Attribution (CC BY) license (http://creativecommons.org/licenses/by/4.0/).
Share and Cite
MDPI and ACS Style
Młyński, D.; Kurek, K.; Bugajski, P. An Analysis of Seasonal Waste Draining for the Urban Agglomeration Using Statistical Methods. Water 2018, 10, 976. https://doi.org/10.3390/w10080976
AMA Style
Młyński D, Kurek K, Bugajski P. An Analysis of Seasonal Waste Draining for the Urban Agglomeration Using Statistical Methods. Water. 2018; 10(8):976. https://doi.org/10.3390/w10080976
Chicago/Turabian StyleMłyński, Dariusz, Karolina Kurek, and Piotr Bugajski. 2018. "An Analysis of Seasonal Waste Draining for the Urban Agglomeration Using Statistical Methods" Water 10, no. 8: 976. https://doi.org/10.3390/w10080976
Note that from the first issue of 2016, this journal uses article numbers instead of page numbers. See further details here.