Impact of Rainwater Harvesting on the Drainage System: Case Study of a Condominium of Houses in Curitiba, Southern Brazil


1
Laboratory of Energy Efficiency in Buildings, Department of Civil Engineering, Federal University of Santa Catarina, Florianópolis, Santa Catarina 88040-900, Brazil
2
Department of Civil Engineering, Federal Technological University of Paraná, Curitiba, Paraná 81280-340, Brazil
3
Department of Civil Engineering, Pato Branco Faculty, Pato Branco, Paraná 85503-350, Brazil
*
Author to whom correspondence should be addressed.
Water 2018, 10(8), 1100; https://doi.org/10.3390/w10081100
Submission received: 24 July 2018
/
Revised: 10 August 2018
/
Accepted: 15 August 2018
/
Published: 18 August 2018
(This article belongs to the Section Urban Water Management)
Abstract
:The objective of this work is to assess the impact of rainwater use in single-family houses on drinking water consumption and on the urban drainage system by means of a case study of a condominium of houses in the city of Curitiba, southern Brazil. A quantitative evaluation of the rainwater volume used and spilled in the recovery system was carried out using two methods for sizing the rainwater tank capacity. Using daily rainfall data and three demand scenarios of water consumption, it was possible to verify the efficiency and reliability of the adopted systems. Furthermore, in order to verify the impact on drainage, the greatest rainfall in the series was assessed and then it was possible to measure it by comparing the hydrograph peak flows with and without the rainwater harvesting systems in the watershed outfall, corresponding to the storage tanks (concrete boxes) in the condominium. It was concluded that there was a decrease in the peak flow of 4.9% and 4.4%, respectively, in the two storage tanks evaluated when the rainwater tank capacities were estimated using the method based on the German Practical Method.
1. Introduction
Freshwater is already scarce in many parts of the world and the drought stress is projected to increase. It is predicted that water supply will be available to only 60% of the world´s population in 20 years time [1]. In contrast to that, floods are becoming more frequent. This situation is due to the principles of control and domination that have guided rainwater management over time. For instance, the urban drainage system has been designed for rainwater to flow as quickly as possible, leaving the urban environment free of floods [2]. Therefore, it is necessary to create means to reduce the impact caused by years of water exploration in cities through measures that aim to restore the natural water cycle.
A solution is the implementation of water conservation programs, which include techniques such as rainwater harvesting systems. Not only the arid areas, but also the wetland regions, are following up rainwater harvesting systems due to the increase of dry events [3]. Several cities around the world already have standards and regulations for the application of water conservation programs that include rainwater use. Nevertheless, there are discrepancies among the methods for sizing the rainwater tank capacity, many of which end up failing to meet the demand. For that reason, sizing the rainwater tank capacity has been the focus of researchers such as Ghisi [4], Ghisi et al. [5], Bezerra et al. [6], and Berwanger and Ghisi [7].
Besides meeting the demand, the rainwater harvesting systems can improve rainwater management [8]. According to Palla et al. [9], when it comes to rainwater management, the rainwater harvesting systems have recently been recognised as one of the low impact development solutions, which aim to restore the natural water cycle in the cities. One of the points to be improved in order to restore the water cycle is to reduce its runoff.
Gee and Hunt [10] proposed two innovative methods in order to satisfactorily decrease surface flow peaks: a passive system and an active system. The passive system used a larger tank than the ideal one, with a container only for rainwater storage to mitigate peak flows, such as the model demonstrated by Herrmann and Schmida [11]. The active system included a real-time control device that automatically releases collected rainwater based on forecasted precipitation and the rainwater level within the tank, using precipitation data from the National Weather Service [10]. Gee and Hunt [10] obtained excellent results of volume and peak flow decrease. The passive system achieved an average of 82% of volume reduction and 90% of peak reduction, while the active system obtained 91% and 93%, respectively.
Other studies have evaluated the impact of rainwater harvesting systems on drainage through the reduction of drained volume and peak flow. Through the installing of a storage tank of 10 m³ volume and 100 m2 area in all buildings in a small region, Kim et al. [12] showed that the flow and the peak volumes were reduced by 18% and 20%, respectively. Palla et al. [9] found an average rate of 33% of peak reduction and 26% of drained rain volume reduction. Zhang et al. [13] obtained a reduction in volume flow of 13.9%, 30.2% and 57.7%, for 207.2 mm, 95.5 mm and 50.0 mm of daily precipitation, respectively. Steffen et al. [14] evaluated the benefits of rainwater management through the application of rainwater harvesting systems in 23 cities located in seven different regions of the United States of America. The results indicate that the rainwater harvesting can reduce the drained volume from 1 to 17%.
In the study of a basin in the city of Porto Alegre, Brazil, when comparing surface flow with and without rainwater harvesting systems, Buffon [15] obtained a maximum average value of 20.3% of flow reduction, based on the amount of rainy days. Following the same principle, Dornelles [16] concluded that there is no peak flow reduction. He observed only a reduction of the flow at the beginning of the hydrograph.
The researches quoted above show very different results from each other because the efficiency of the systems depends on several factors such as tank size, precipitation, water use, and soil use. Thus, carrying new case studies are important to show results from specific regions and may serve to compare with other sites of similar physical and climatic characteristics. Therefore, the main objective of this work is to evaluate the impact of rainwater harvesting on the drainage system of a condominium of houses in the city of Curitiba, southern Brazil.
In order to achieve the main objective of this study, it was necessary to simulate a series of data that allowed us to reach some specific objectives:
- -
- Comparing tank design methods proposed by the Municipal Legislation of Curitiba and by the Brazilian Association of Technical Standards;
- -
- Evaluating the supply of nonpotable water;
- -
- Evaluating the reduction of surface runoff;
- -
- Evaluating the peak flow reduction for a critical precipitation event.
2. Method
2.1. Place of Study
The research was developed through a case study of a condominium of houses in Curitiba with 79,168.06 m², 199 lots, streets, and a leisure area. Since the condominium was not yet fully occupied, some parameters were adopted, as follows:
- All lots were considered occupied by single-family houses;
- Each house was considered to have a rainwater harvesting system with an underground tank;
- Each house was considered to have a maximum floor plan area allowed by law, which means that the floor plan area of each house was equal to the area of the lot;
- The houses have 2, 3, or 4 bedrooms, depending on their floor plan area;
- The roof area and the projection of the house were considered equal, which equals 50% of the lots’ area;
- All lots maintained 25% of permeable area;
- The remaining 25% of the area is equivalent to the sidewalks.
Because of the fact that the condominium has an irregular topography, the drainage system has three storage tanks, one of which (the smallest one) does not receive rainwater from any lot. This, therefore, is not influenced by the rainwater use and, for this reason, was not considered in this evaluation. Thus, the evaluation of the impact of rainwater harvesting on drainage was performed by analysing one lot and the whole condominium, in the storage tank #1 and in the storage tank #2. The impact in the whole condominium was assessed through the reduction of the hydrograph peak considering the contribution areas to each storage tank.
2.2. Rainwater Demand
The water demand was calculated through the number of people per house and their consumption of water used for cleaning, washing private sidewalks, and flushing toilets. The end use of rainwater was considered in three different scenarios:
- Scenario 1: cleaning;
- Scenario 2: cleaning and washing floors (private sidewalks);
- Scenario 3: cleaning, washing floors, and flushing toilets.
2.3. Rainfall Data
Rainfall data from the Curitiba rain station located at the Polytechnic Center of the Federal University of Paraná were used. These data were granted by Simepar to the Curitiba meteorological station, from where daily rainfall data over the period 31 May 1997 to 22 September 2013 (5947 days) were obtained. The station is located approximately 8 km away from the study site and it was chosen due to the proximity and availability of daily data.
2.4. Surface Flow Coefficient
One of the variables that characterizes the surface flow is the surface flow coefficient or runoff coefficient. This coefficient is defined as the ratio between the surface water volume drained and the rainfall volume. Therefore, this coefficient is dimensionless and depends on the type of surface where the rain precipitates [19]. The flow coefficient varies from 1 (indicates that all precipitated water flows over the surface) to 0 (indicates that all precipitated water is absorbed by the surface). In this research, different runoff coefficients were used depending on each surface, according to the literature review.
2.5. Rainwater Tank Sizing
Based on local rainfall, roof area, rainwater demand, and runoff coefficient it was possible to size the tanks. The usable rainfall volume (shown in Section 2.5.1) was calculated in order to verify the reliability and efficiency of the system (shown in Section 2.6). The tanks were sized according to the method suggested by Municipal Decree of Curitiba (shown in Section 2.5.2) and by the German Practical Method (shown in Section 2.5.3).
2.5.1. Usable Rainfall Volume
Firstly, the usable rainwater volume was calculated using Equation (1) suggested by NBR 15527 [20]. Such volume refers to the total rainwater that can be used. It was made for all lots of the condominium as well as for a chosen lot.
where is the daily, monthly, or annual volume of usable rainfall (L); is the daily, monthly, or annual rainfall (mm); is the roof area (m²); is the runoff coefficient (dimensionless); and is the coefficient to represent rainwater losses (dimensionless); it depends on the solids disposal device and on the surface flow deviation; it was taken as 0.85 to represent rainwater losses of 15%.
2.5.2. Municipal Decree of Curitiba 293/2006
The rainwater tanks were then sized using Equation (2), which is the method recommended in the Municipal Decree of Curitiba 293/2006 [21]. This sizing was also performed for all lots and for the chosen lot.
where is the tank capacity (L); is the number of units (dimensionless); is the number of days of reservation (recommended 2 days); and is the total daily water consumption (L/d) of a house, being: was taken as 600 L/d in houses with 2 bedrooms, 800 L/d in houses with 3 bedrooms, and 1000 L/d in houses with 4 bedrooms.
The minimum tank capacity stipulated by the Decree 293/2006 is 500 L. Disadvantages of this method lay on the fact that it does not consider the local rainfall, and the water demand is fixed depending on the number of bedrooms.
2.5.3. NBR 15527/2007 Methods
The Brazilian standard NBR 15527/2007 presents the following methods: Rippl, Simulation, Australian, Azevedo Neto, Practical English, and Practical German [20]. Trying to obtain an easy-to-use method, this section aims to choose one of the methods for later comparison with the Municipal Decree 293/2006 Method.
The aim of this case study is to evaluate an easy-to-use method, through the study of six different methods. After the test, the Australian Method and the Simulation Method were considered too complex to be used on a daily basis. The Rippl Method does not apply to small demands and was not used in this work. The Practical English and the Azevedo Neto methods do not consider water demand when designing the tank. Thus, for the three scenarios, the calculated tank capacity was the same and that is why these methods were not used in this work. Among the practical methods, the German Practical Method presents an important characteristic when using the minimum value between the annual volume of rainfall and the annual volume of demand. Therefore, because of this characteristic, the tank capacity obtained from this method was tested in the Simulation and Australian methods using monthly rainfall data to verify the reliability and efficiency of the rainwater harvesting system. As a result, the German Practical Method demonstrated a good system reliability, meeting the requested demand with monthly data and becoming attractive for the study. Then, both the reliability and the efficiency of the system were tested by sizing the tanks using daily rainfall data.
The German Practical Method is an empirical method where the underground tank capacity value is adopted, which is 6% of the annual volume of consumption or 6% of the annual volume of usable rainfall. Equation (3) represents the German Practical Method.
where is the numerical value of the tank capacity (L); is annual volume of usable rainfall (L); and is the annual nonpotable water demand (L).
Besides the six methods proposed by the NBR 15527, the method for the consecutive number of days without rainfall [22,23,24] is also very widespread. Considering that the results obtained using the German Practical Method for the Curitiba region were satisfactory in meeting the demand, a comparison was made between the fixed value of 0.06 given in the formula of the German Practical Method and the statistical method of the consecutive number of days without rain. Since the German Practical Method uses annual data on the demand or volume of rainfall, it was considered that the figure 0.06 represents the percentage of consecutive days without rainfall in a year, which is equivalent to approximately 22 days.
A study performed by Gomes et al. [25] evaluated the daily rainfall data of 102 years of observation in Curitiba. The analysis of the data set showed an annual average of 22 consecutive days without rain, that is, approximately 6% of the days of the year. The distribution of the sampling frequency made it possible to estimate maximum annual numbers of consecutive days without rain of approximately 26, 30, and 35 days for the return times of 5, 10, and 20 years, respectively [25].
Based on the series adopted in this case study (17 years of data), the average number of consecutive days without rainfall is 19 days. Therefore, it is suggested that the German Practical Method is adapted as shown in Equation (4).
where is the numerical value of the tank capacity (L); is a years’ rainfall use volume (L); is the annual nonpotable water demand (L); and is the annual average of consecutive days without rainfall (%).
When the volume of usable rainfall is lower than the rainwater demand, there is a need to not adopt an excessively high demand. For this reason, it was defined as a condition for the use of this method that the demand is less than or equal to 1.25 times the value of the usable rainfall volume.
2.6. System Efficiency and Reliability
As explained by Bezerra et al. [6], the efficiency is related to the overflow volume of water not spilled and the reliability is related to the period in which the demand is met. In this study, the reliability of the system is given by the percentage of demand met in a day and the efficiency is provided by the volume of water not overflow in a day.
The system reliability is given, therefore, by Equation (5), and the efficiency is given by Equation (6).
2.7. Impact on Drainage
The main objective of this section refers to the comparison between the reduction of surface flow and the result of peak flows in the watershed outfall, considering two scenarios: with the rainwater harvesting systems and without the rainwater harvesting systems. This was performed to verify if there are changes in the hydrographs resulting from the excess rain that flows into the storage tank (watershed outfall) when the rainwater tank is calculated using the German Practical Method “19 days” for scenario 3 of rainwater demand.
The calculation of the reduction of the surface flow is done by multiplying the efficiency by the percentage of the volume of water drained from the roofs. The percentage of the volume of water drained from the roofs is equal to the volume of water drained from the roofs divided by the total volume of drained water. The volume of rainwater drained from the roofs is equal to the multiplication of the precipitation by the runoff coefficient and by the roof area. The same calculations are made for other surfaces, such as streets, sidewalks, roofs, and permeable areas. The total volume drained is equal to the sum of the volumes drained on each surface.
In order to evaluate peak flows, the highest rainfall was used. Analysing the day that presented the highest rainfall, the percentage of tank capacity that was empty and could receive the next rain volume was obtained. The hydrographs of each lot and of the watersheds that supply each storage tank were estimated using the Soil Conservation Service Method [19]. To use this method, the average slopes of the streets and lots of the path the drained water flowed to the storage tanks were quantified.
2.7.1. Scenario Without Rainwater Harvesting
In the scenario where there is no use of rainwater, the rainfall used was 113 mm. It is the highest rainfall and happened on 13 December 2010. Since there was no data of this discretised precipitation, which took place over the Brazilian summer, the discretization was done considering intervals of 30 min, i.e., 28.0% precipitated in the first 30 min and 22.0%, 17.0%, 15.0%, 10.0%, and 8.0% in the subsequent 30 min intervals. It was decided not to use the methodology of the alternate blocks because the summer precipitations in the studied region present a well-defined behaviour. Rainfalls occur at the end of the afternoon, after several hours of solar radiation, with high intensity, in periods that rarely exceed three hours of duration. Therefore, a typical summer rain of great intensity (113 mm) and short duration (3 h), starting more intense and decreasing its intensity over time, was considered.
2.7.2. Scenario with Rainwater Harvesting
The rainfall considered in the scenario in which there is rainwater harvesting was 113 mm minus the volume corresponding to the available tank capacity expressed in millimeters of rainfall. The result of the available volume is equal to the tank volume minus the previous day rainwater volume. This volume is given by the division between the available volume for storage of water in the tank and the roof area. Therefore, the resulting precipitation is less than 113 mm, since a part was retained in the tank. The accumulated volume in the tanks is deducted from the first 30 min rainfall.
2.7.3. Hydrographs Calculation
The rainwater drained was estimated by calculating the excess rainfall (or effective rainfall) using the Soil Conservation Service method presented in Equations (7)–(9). Given the discretised precipitation in time, the cumulative precipitation is calculated. Through the maximum potential infiltration, the initial infiltration and accumulated surplus precipitation are calculated. Finally, through the accumulated surplus precipitation, it is possible to find the surplus or effective precipitation, as follows.
where is the maximum potential infiltration (mm) and; is the runoff curve number.
is adopted according to the type of land use, treatment, and hydrological conditions. The survey of the land showed a mainly clayey soil. Knowing that the waterproof rate of each lot is 75.0% and that the average area of the lots does not exceed 500 m², the adopted is equal to 92 [19].
where is the initial infiltration (mm); is the maximum potential infiltration (mm); is the cumulative excess precipitation (mm); and is the time-discretised precipitation (mm).
The area of the triangular hydrograph, developed by the Soil Conservation Service, represents the effective precipitation; its geometric relationships are defined based on the concentration-time of the basin of interest [19]. The time of concentration can be obtained using several methods, which can result in very different values. In this work, the Schaake Formula was used, which is one of the recommended ones for the modelling of drainage of small urban basins with areas lower than 70 ha [26], as follows in Equation (10).
where is the concentration time (h); is the length of the talweg (km); is the declivity (m/m); and is the fraction of the waterproof area of the basin.
For the calculation of the hydrograph of each lot, the street and leisure area. the concentration times (Equation (11)), the peak instants (Equation (12)) and the unit peak flows (Equation (13)) were estimated.
where is the concentration time (h); is the time between half of the rainfall and the peak time (h); is the duration of the rainfall (h); is the peak instant (h); and is the peak flow for an excess rainfall of 1 mm over the basin (h).
Through the convolution of hydrographs, it was possible to define the hydrograph resulting from each lot, street and leisure area, for both scenarios: with and without rainwater harvesting system. Comparing the peaks of hydrographs obtained, it was possible to verify the impact of rainwater harvesting on the drainage for the greatest rainfall.
3. Results and Discussion
3.1. Rainwater Demand
As a result, the rainwater demand in each scenario corresponded to:
- Scenario 1: 2.9% of the water demand (for cleaning);
- Scenario 2: 8.7% of the water demand (2.9% for cleaning and 5.8% for washing floors);
- Scenario 3: 23.7% of the water demand (2.9% for cleaning, 5.8% for washing floors, and 15% for flushing toilets).
3.2. Rainfall Data
An annual average of approximately 1430 mm was obtained for the period 1998–2012. The annual rainfall volume and the maximum number of consecutive days without rain in this period can be observed in Table 1.
The average rainfall of the years 1997 and 2013 was not presented because there was no data for the whole year, but only for the months of June and July. However, historically these are the driest months of the year in Curitiba and, generally, with the highest number of consecutive days without rain. For this reason, they were taken into account for this study.
3.3. Surface Flow Coefficients
The surface flow coefficients adopted in this work are shown in Table 2.
3.4. Tanks Sizing
The tank capacities were estimated using the German Practical Method (equivalent to 22 consecutive days without rainfall) and the method based on the German Practical Method (using 19 days, 26 days, 30 days, and 35 consecutive days without rainfall, obtained from Gomes et al. [25]). The method stipulated by the Municipal Decree 293/2006 of Curitiba was also used to compare the results. Table 3 shows the tank capacities for the chosen lot according to the method used and Table 4 shows the tank capacities adopted according to market availability.
It can be observed that the tank capacities obtained using the German practical method and its adaptation increase according to the rainwater demand. On the other hand, the tank capacities obtained using the Municipal Decree Method are all the same, despite the scenario. This is due to the fact that the rainwater demand in this method is a function only of the number of bedrooms in a house.
The rainwater demand was lower than the volume of usable rainfall for all cases and, therefore, it was adopted in the calculation of the German Practical Method and the method based on the German Practical Method.
3.5. System Reliability
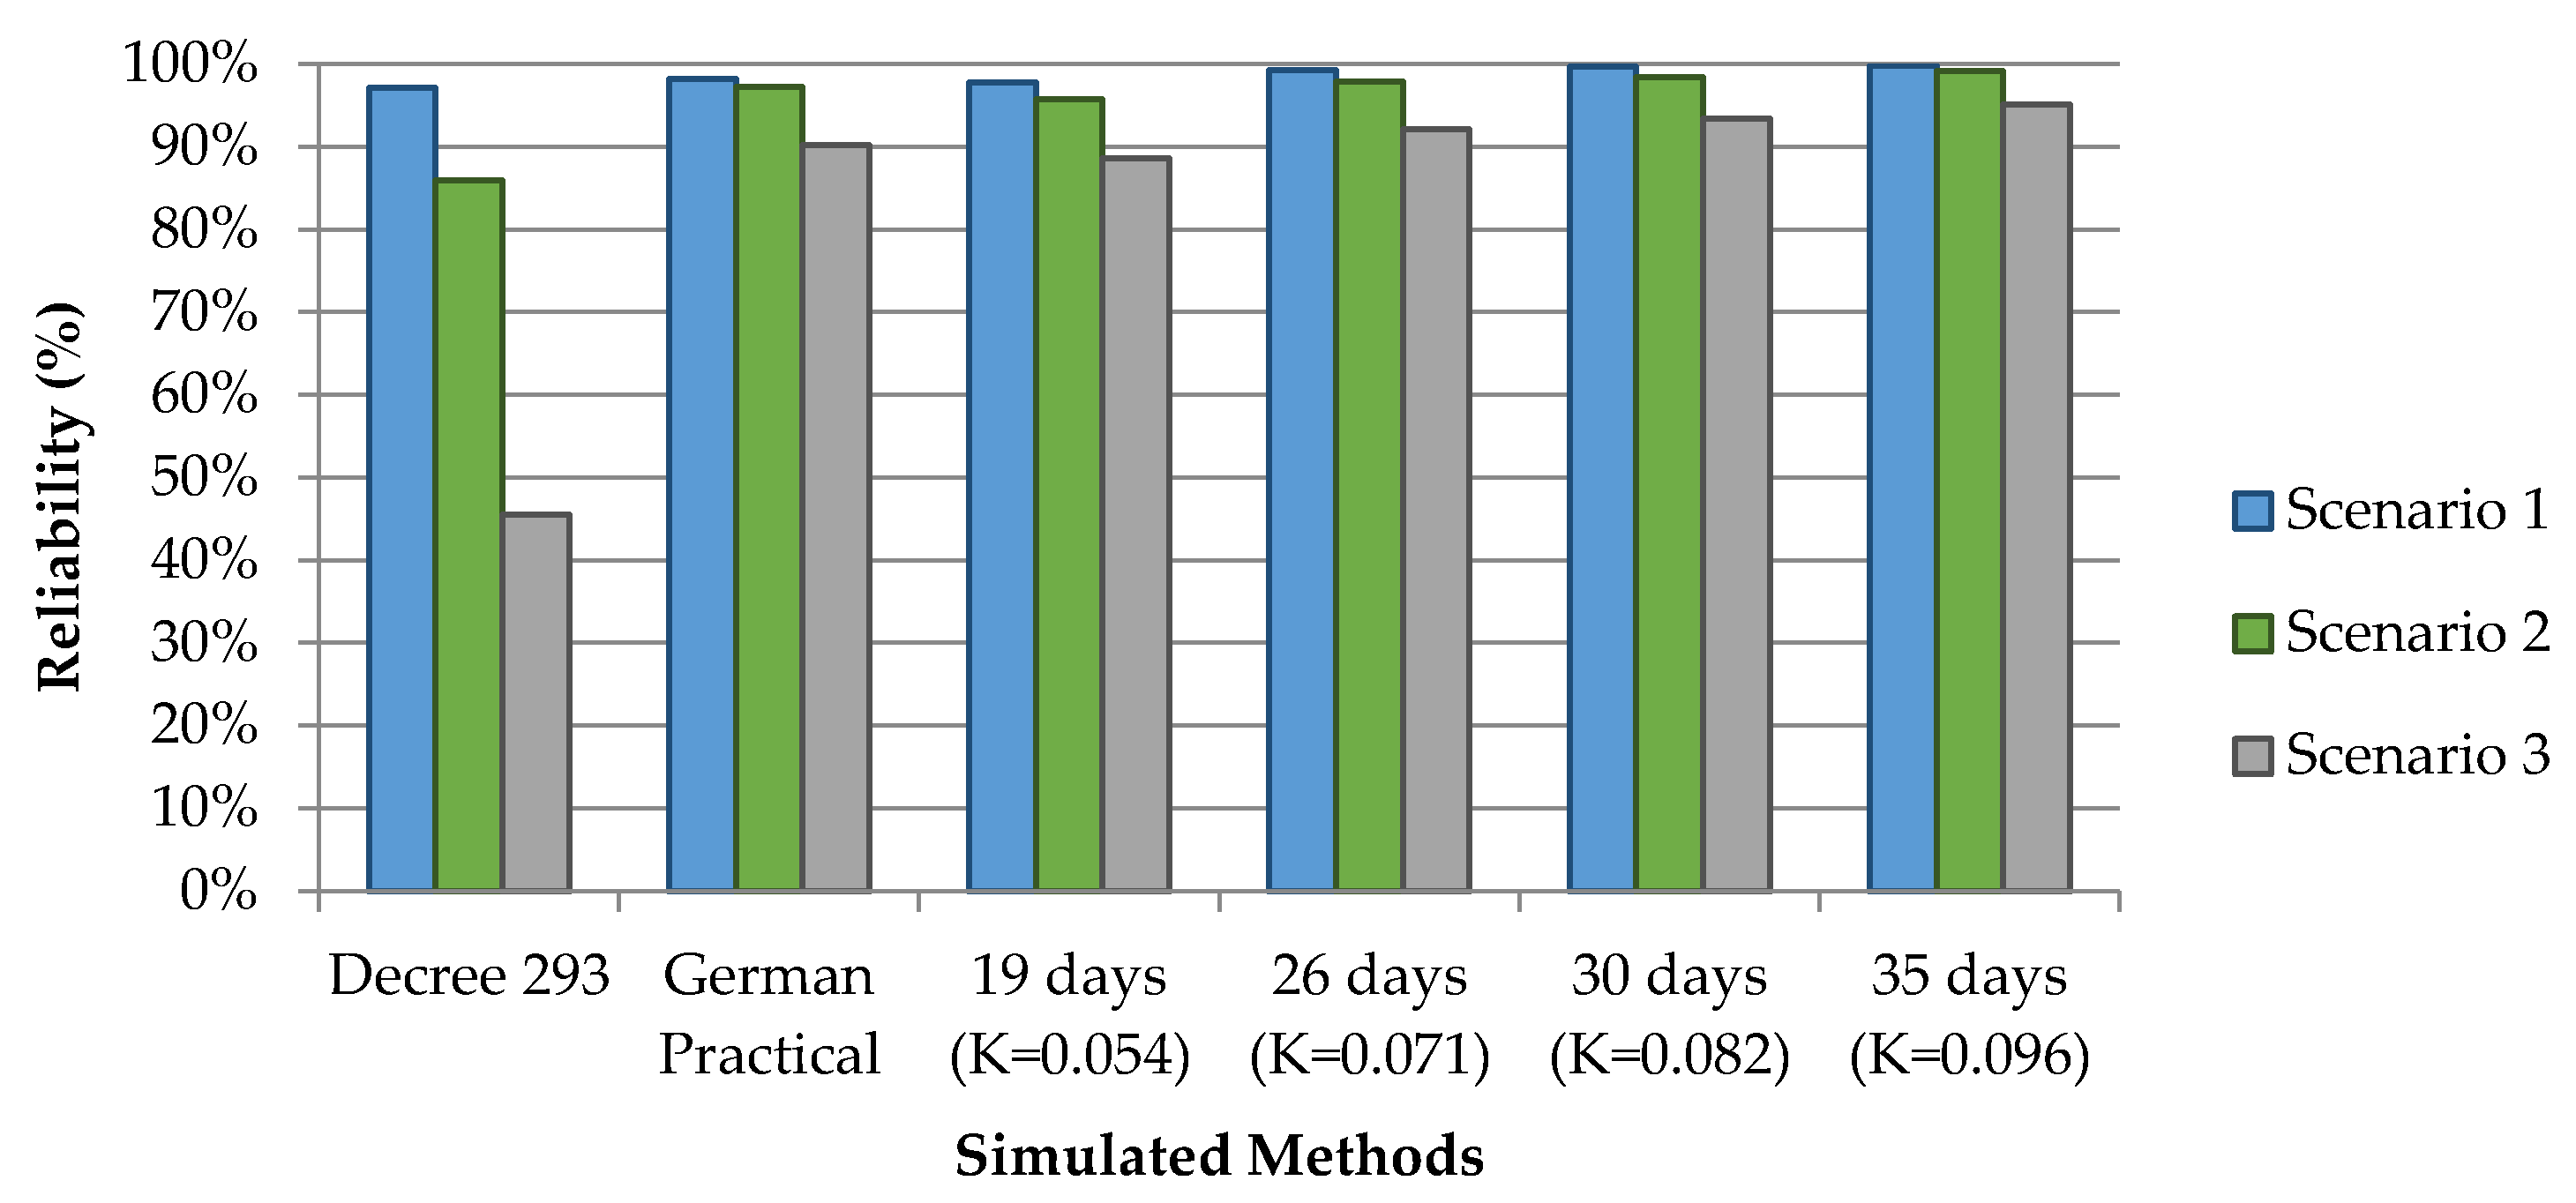
The daily rainwater demands in scenarios 1, 2, and 3 represent 2.9%, 5.8%, and 20.8% of the total water demand in the house, respectively. However, this demand is not always met, depending on the method used to calculate the tank capacity. Meeting the demand, therefore, depends on the reliability of each method and this is shown in Figure 1.
Figure 1 shows that the greatest reliability of the system is obtained using the method based on the German Practical Method, with 35 consecutive days without rainfall, i.e., the largest tank. As rainwater demand increases in the scenarios, reliability decreases. The method of Decree 293 led to low reliabilities, i.e., it decreases from approximately 97.1% in Scenario 1 to 85.9% in Scenario 2 and 45.5% in Scenario 3.
Figure 1 also shows that there is a small increase in the reliability when varying from 19 to 35 days with no rainfall in the method based on the German Practical Method. However, the tank capacity increased from 4000 to 7500 L. Therefore, it would be interesting to perform an economic analysis or a life cycle assessment; but this is not the focus of this study.
Table 5 shows the potential for potable water savings that can be obtained by using rainwater in each scenario.
Table 5 shows that the results obtained by the Decree Method lead to low water saving. On the German Practical Method, it is noticed that the longer the rainfall data series, the bigger the tank volume and, consequently, the greater the water saving. The optimum volume depends on the water saving potential difference chosen by the user. In the case study, for example, the consecutive 22-day method without rainfall (average of consecutive days without rain calculated over a series of 102 years of daily rainfall data) showed just 1.6% improvement in water saving relative compared to the 19-day method.
The World Meteorological Organization recommends a 30-year period for climate studies. Geraldi and Ghisi [30] observed that a 10-year period satisfies the purpose of obtaining potential potable water savings for a rainwater harvesting design.
3.6. System Efficiency
The effect of the use of rainwater on the drainage is directly related to the volume available in the tank at the time of the rainy event. For this reason, daily rainfall data were evaluated considering a fixed daily demand and thus obtaining the available tank capacity for the next rain event.
Through the efficiency of the system, it was observed that there is a significant reduction of rainwater volume that goes to the drainage network in Scenario 3. Since the efficiency is related to the volume that does not overflow, only the rainy days were analysed. On days without rain, the water does not overflow and is consumed. It is worth remembering that the higher the efficiency, the less rainwater flows off the tanks. As can be seen in Figure 2, efficiency increases as rainwater demand increases, which means that the more rainwater is consumed, the less rainwater flows off the tank.
Even for the method established by Municipal Decree 293 of Curitiba [21], where the tank capacity remains the same with the increase in the rainwater demand, it was possible to notice that there was a decrease in the overflow from Scenario 1 to Scenario 3. For the German Practical Method, in the first scenario for example, 49.8% of all the rainwater collected overflows from the tank. In Scenarios 2 and 3, the percentage decreases to 36.3% and 9.7%, respectively. Note that the results are very similar for any variation of the German Practical Method.
Taking into account all the rainwater that is drained from the condominium, including the rainwater drained from the gardens, floors, sidewalks (for common or private use), and internal streets, rainwater from roofs is equivalent to 26.9% of the total surface flow. That is, 26.9% of all rainwater drained in the condominium is equivalent to rainwater that can be used through the rainwater harvesting system. This percentage decreases as the rainwater demand decreases. For rainwater demand in Scenario 3, with the tank capacity calculated according to the German Practical Method, for example, there is an efficiency of 90.3%. Thus, it can be concluded that the reduction of the total flow when using rainwater is 24.3%. Figure 3 shows the reduction of the surface flow for each method and scenario.
Comparing the reduction of total flow with the study carried out by Buffon [15], a reduction that is slightly greater than the maximum observed by the author is observed; a 20.3% reduction. This is due to the characteristics of the systems, such as tank sizing and rainwater demand. The characteristics of areas responsible for surface flow, such as runoff coefficients, also influence this result.
Palla et al. [9] also used the German Practical method and obtained an average flow volume reduction equal to 26%, very close to the one found in this work. It is noteworthy that both studies were developed in residential areas and the average annual rainfall of both sites is close, being 1430 mm in Curitiba and 1340 mm in Genova.
Some authors have obtained much more significant results, such as Gee and Hunt [10], which reached averages of reduction of volume of surface flow equal to 77% and 90%. However, these values are justified because the systems proposed by the authors had devices that allowed space for storage of the next rainy event. In the tank of the passive system proposed by the authors, about 30% corresponded to the space available for the retention of precipitation, and 70% corresponded to the volume for rainwater use.
Other authors, such as Zhang et al. [13], also found satisfactory values of flow reduction, reaching 57.7% reduction. However, these authors considered the tank empty at the time of the rainy event, which is not usually the case in rainwater harvesting systems.
3.7. Hydrographs Comparison
In order to verify if there are changes in the hydrographs resulting from the excess rain that flows to the storage tanks when there is use of rainwater, the method based on the German Practical Method “19 days” and Scenario 3 of demand was used.
Through the hypothetical discretization of the rainfall used it was possible to estimate the amount of rainwater drained using the Soil Conservation Service Method. Table 6 shows the results.
The precipitation used in the two scenarios (with and without rainwater harvesting system) was discretised. In the scenario without rainwater harvesting system, the rainfall is 113 mm and is discretised in Figure 4a. In the scenario with rainwater harvesting system, the rainfall is the result of the 113 mm rainfall minus the available tank capacity. For the chosen lot, for example, the rainfall obtained was 106.5 mm, discretised according to Figure 4b.
According to Tucci [19], the positioning of the peak on the distribution of rain intensity depends on the pattern of local rainfall. If the factor y = 0, the rain is of the type completely advanced and the hietogram has its peak in the beginning of the rain. The intense rains in Curitiba happen in the summer season, are convective type and happen late in the afternoon, with maximum intensity in the beginning of the rain.
In this research, the volume available for rainwater storage in each tank was fixed at approximately 16.0% of the total volume. This value was deducted from the daily evaluation of the chosen lot, which, on the day in question, was 84.0% full in the simulation for Scenario 3, using the method based on the German Practical Method “19 days”. Thus, the highest retention found in this study was 9.76 mm, and the average of the entire condominium was 6.27 mm. The Dornelles’s research [16] points out that rainwater retention in tanks represents 4 mm for the popular house in Brazil. The impact of the use of rainwater in the chosen lot is observed by overlapping the resulting hydrograms. Figure 5 shows the result.
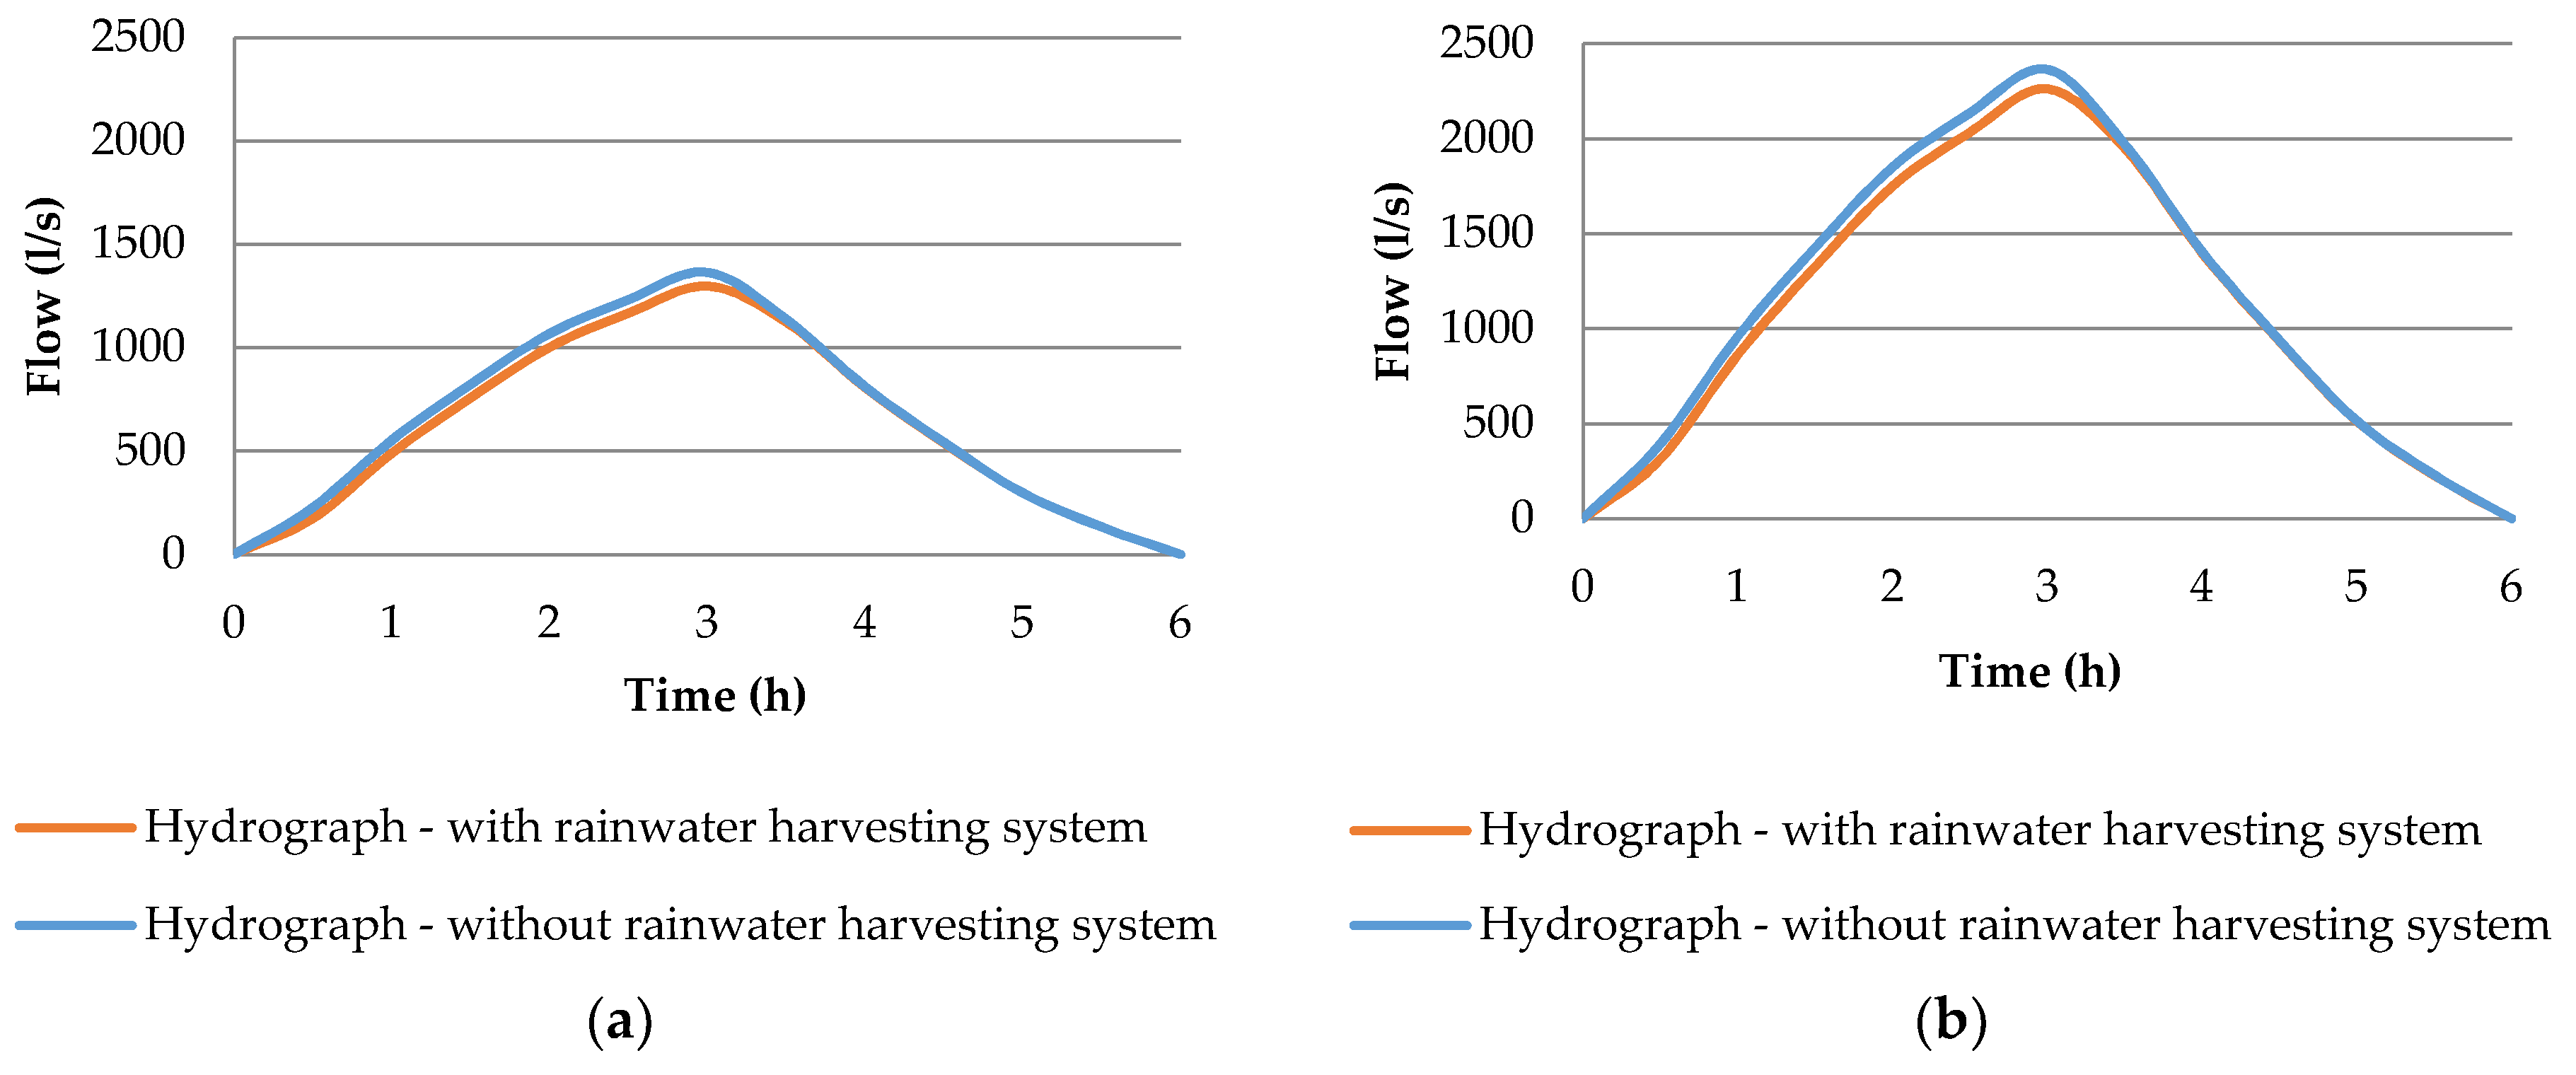
The result in the outflow of the watershed (or condominium, in this case) is given through the resulting hydrographs in each of the storage tanks, also considering the common streets and sidewalks and the recreational areas that contribute to this watershed. In addition to all contribution areas for each storage tank, the results for the two scenarios are shown in Figure 6.
In the hydrograph of the chosen lot, the percentage difference in the peak flow was 6.1% and remained close to this value at the exit of the watersheds, remaining 4.9% in storage tank #1 and 4.4% in storage tank #2.
It is worth mentioning that this result reduction is influenced by the fact that it is a condominium totally occupied by single-family houses. It is important to highlight that it would be altered when dealing with a city where there are more areas of direct drainage.
Figure 5 and Figure 6 show that there was no delay in peak flow. This feature can be explained by the fact that the rainwater harvesting tanks work as a passage box, where the water outlet diameter is greater or equal to the inlet diameter, and not as a storage tank, which has the function of delaying the hydrograph peak as shown by Tassi [31]. It is also noticed that there was a decrease of the flow in the first hours and the flow equals to the scenario without use of rainwater in the last hours.
Considering the other studies, such as Zahmatkesh et al. [32] and Palla et al. [9], it is difficult to compare the results, since most of the authors used simulation models that allowed them to present the values of peak flow reduction using hourly rainfall data and for a longer period. Zahmatkesh et al. [32] and Palla et al. [9] used the Storm Water Management Model (SWMM) to conduct their researches. Through the SWMM it is possible to simulate a dynamic model of rainfall flow. It can be used for a single rainy event or for long term continuous simulation. Palla et al. [9], for example, achieved a 33% peak reduction average.
Zahmatkesh et al. [32] obtained lower reduction values. These authors used other low-impact development techniques in their simulation and also predicted future rainfall indexes. For the average annual rainfall of 1656 mm, 1795 mm, and 2140 mm, the average peak flow reductions were 13%, 11%, and 8%, using rainwater harvesting systems, permeable pavements and bioretention.
In addition, peak reductions found by the authors of previous works [9,32] were very different, varying from 8 to 56% for systems with simple tanks for rainwater use. This is due to the large number of variables that influence the system, such as tank size, rainfall, and water usage pattern. Palla et al. [9] pointed out that for a rainfall depth of 121 mm and length of 3.2 h (summer storm typical of the Mediterranean, with high rainfall depth and short length), rainwater harvesting systems are able to contribute to the peak reductions (equal to 12%), in spite of the characteristics of the rainfall event due to the dry season. In Curitiba, however, precipitation periods are frequent and the dry periods are short. Due to this, the tanks are hardly empty, which directly influences the flow and the peak reduction.
This work was based on a single rainfall event, considering that 16.0% of the tank capacity was available to store the water volume of this event. A greater variation of rainfall events and of available volume in the tank is suggested for future studies. In sites where rainfall is less frequent, the peak flow may be lower, since the tank will have a larger volume available in rainy events.
4. Conclusions
The benefits associated with rainwater harvesting systems are beyond retention of runoff. It was noted that the supply of nonpotable water was satisfactorily met. System reliability was always above 80% for all three scenarios when variations of the German Practical Method were used. The scenario of higher demand represented potable water savings of approximately 20%. This percentage could be higher if the scenarios considered other nonpotable uses, such as use in the washing machine. In the demand assessment, the method of Decree 293 of Curitiba was considered inadequate, because it does not consider either the demand or the supply of water when sizing the tank.
It was noticed that the higher the capacity of the tank, the greater the reliability of the system and the higher the demand, thus the greater the reduction of the surface flow volume. Furthermore, the impact on drainage is influenced by several factors related to buildings, tank capacity, rainfall, and land use.
The results of this case study showed a flow reduction of 24.3% when the tank is sized through the German Practical Method. This result is obtained from the simulation of the adopted historical series. In order to evaluate the impact on the peak flow, the largest rainfall in the series was used. In this analysis, the reductions of 4.9% and 4.4% of the peak flows in the storage tank #1 and #2 respectively were obtained. The peak flow was evaluated for the scenario of higher demand, which favoured the reduction of the peak flow, and for the more intense rainfall (which was unfavourable to the reduction of the peak flow). The results presented in the evaluation of the peak reduction are very influenced by specific circumstances, such as the precipitation used for the hydrographic calculation. For a complete assessment of the impact of rainwater harvesting systems on urban drainage, the use of other scenarios of demand and rainfall are recommended. When possible, an evaluation of over-time flow rates should be made.
However, through the results of flow reduction, the widespread implementation of rainwater harvesting systems on the urban scale helps to reduce runoff. In addition to that, rainwater harvesting systems operate as source control solutions, helping to reduce the amount of runoff that would need to be treated before discharging into receiving water bodies. With the advancement of technology, rainwater harvesting systems can become more efficient as the technology becomes more accessible. The real-time control systems attached to the rainwater harvesting systems will allow greater control of both consumption and water discharge in urban drainage systems.
Author Contributions
In this study, authors A.T. and C.A.T. did conceptualization, methodology, formal analysis and write, while author E.G. helped to write the paper and E.B.C. helped to review and editing.
Funding
This research was funded by CAPES, grant number 1371800.
Conflicts of Interest
The authors declare no conflicts of interest.
References
- Poschen, P.; Iturriza, A.L.; Li, X.; Tobin, S.; Dessors, E.; Samaan, D.; Renner, M. Working Towards Sustainable Development: Opportunities for Decent Work and Social Inclusion in a Green Economy; International Labour Office: Genova, Italy, 2012. [Google Scholar]
- Bell, S. Renegotiating urban water. Prog. Plan. 2015, 96, 1–28. [Google Scholar] [CrossRef] [Green Version]
- Debusk, K.M.; Hunt, W.F.; Wright, J.D. Characterizing Rainwater Harvesting Performance and Demonstrating Stormwater Management Benefits in the Humid Southeast USA. J. Am. Water Resour. Assoc. 2013, 49, 1398–1411. [Google Scholar] [CrossRef]
- Ghisi, E. Parameters influencing the sizing of rainwater tanks. Water Resour. Manag. 2010, 24, 2381–2403. [Google Scholar] [CrossRef]
- Ghisi, E.; Montibeller, A.; Schmidt, R.W. Potential for potable water savings by using rainwater: An analysis over 62 cities in southern Brazil. Build. Environ. 2006, 41, 204–210. [Google Scholar] [CrossRef]
- Bezerra, S.M.C.; Christan, P.; Teixeira, C.A.; Farahbakhsh, K. Sizing rainwater harvesting reservoirs: A comparison between methods of ABNT NBR 15527:2007 and of Municipal Decree 293/2006 from the city of Curitiba, PR. Ambiente Construído 2010, 10, 219–231. (In Portuguese) [Google Scholar] [CrossRef]
- Berwanger, H.; Ghisi, E. Investment feasibility analysis of rainwater harvesting in the city of Itapiranga, Brazil. Int. J. Sustain. Hum. Dev. 2014, 2, 104–114. [Google Scholar]
- Zhang, D.; Gersberg, R.M.; Wilhelm, C.; Voigt, M. Decentralized water management: Rainwater harvesting and greywater reuse in an urban area of Beijing, China. Urban Water J. 2009, 6, 375–385. [Google Scholar] [CrossRef]
- Palla, A.; Gneco, I.; La Barbera, P. The impact of domestic rainwater harvesting systems in storm water runoff mitigation at the urban block scale. J. Environ. Manag. 2017, 191, 297–305. [Google Scholar] [CrossRef] [PubMed]
- Gee, K.D.; Hunt, W.F. Enhancing stormwater management benefits of rainwater harvesting via innovative technologies. J. Environ. Eng. 2016, 142, 04016039-1-11. [Google Scholar] [CrossRef]
- Herrmann, T.; Shmida, U. Rainwater utilization in Germany: Efficiency, dimensioning, hydraulic and environmental aspects. Urban Water 1999, 1, 307–316. [Google Scholar] [CrossRef]
- Kim, Y.; Kim, T.; Park, H.; Han, M. Design method for determining rainwater tank retention volumes to control runoff from building rooftops. KSCE J. Civ. Eng. 2014, 19, 1585–1590. [Google Scholar] [CrossRef]
- Zhang, X.; Hu, M.; Chen, G.; Xu, Y. Urban rainwater utilization and its role in mitigating urban waterlogging problems—A case study in Nanjing, China. Water Resour. Manag. 2012, 26, 3757–3766. [Google Scholar] [CrossRef]
- Steffen, J.; Jensen, M.; Pomeroy, C.A.; Burian, S.J. Water supply and stormwater management benefits of residential rainwater harvesting in U.S. cities. J. Am. Water Resour. Assoc. 2013, 49, 810–824. [Google Scholar] [CrossRef]
- Buffon, F.T. Rainwater Harvesting: Effect on the Urban Drainage System. Bachelor’s Thesis, Federal University of Rio Grande do Sul, Porto Alegre, Brazil, June 2010. [Google Scholar]
- Dornelles, F. Rainwater Use in the Urban Environment and Its Effect on Rainwater Drainage. Ph.D. Thesis, Federal University of Rio Grande do Sul, Porto Alegre, Brazil, October 2012. [Google Scholar]
- Ghisi, E.; Ferreira, D.F. Potential for potable water savings by using rainwater and greywater in a multi-storey residential building in southern Brazil. Build. Environ. 2007, 42, 2512–2522. [Google Scholar] [CrossRef]
- Tomaz, P. Aproveitamento de Água de Chuva: Aproveitamento de Água de Chuva Para Áreas Urbanas e Fins Não Potáveis, 2nd ed.; Navegar: São Paulo, Brazil, 2010. (In Portuguese) [Google Scholar]
- Tucci, C.E.M. Hydrology: Science and Application, 4th ed.; UFRGS/ABRH: Porto Alegre, Brazil, 2015. (In Portuguese) [Google Scholar]
- Associação Brasileira de Normas Técnicas (ABNT). Água da Chuva: Aproveitamento de Coberturas em áreas Urbanas Para Fins não Potáveis-Requisitos; Associação Brasileira de Normas Técnicas (ABNT): Rio de Janeiro, Brazil, 2007. (In Portuguese) [Google Scholar]
- Dispõe sobre os critérios do uso e conservação racional da água nas edificações e dá outras providências; Curitiba City Hall: Curitiba, Brazil, 28 March 2006. Decree No. 293. (In Portuguese)
- Cohim, E.; Garcia, A.; Kiperstok, A. Captação e aproveitamento de água de chuva: dimensionamento de reservatórios. In Proceedings of the IX Simpósio de Recursos Hídricos do Nordeste, Salvador, Brazil, 25–28 November 2008. (In Portuguese). [Google Scholar]
- Dornelles, F.; Tassi, R.; Goldenfum, J.A. Evaluation of the Dimensioning Techniques for Rainwater Harvesting Tanks. Braz. J. Water Resour. 2010, 15, 59–68. (In Portuguese) [Google Scholar] [CrossRef]
- Giacchini, M.; Andrade, A.G.F. Study on the method the days without rain for the tanks sizing. J. Eng. Technol. 2011, 3, 36–43. (In Portuguese) [Google Scholar]
- Gomes, J.; Weber, D.C.; Delong, M.D. Tank Design for Rainwater use Based on a Financial Criterion. Braz. J. Water Resour. 2010, 15, 89–100. [Google Scholar] [CrossRef]
- Silveira, A.L.L. Performance of time of concentration formulas for urban and rural basins. Braz. J. Water Resour. 2005, 10, 5–29. (In Portuguese) [Google Scholar] [CrossRef]
- May, S. Feasibility Study for the Use of Rainwater for Nonpotable Consumption in Buildings. Master’s Thesis, University of São Paulo, São Paulo, Brazil, June 2004. (In Portuguese). [Google Scholar]
- Carvalho, D.F. Manejo e conservação do solo e da água. 2013. UFRRJ—Prof. Daniel Fonseca de Carvalho, D.Sc. Available online: http://www.ufrrj.br/institutos/it/deng/daniel/ia1311-Manejo.htm (accessed on 16 August 2018).
- Alessi, F.; Kokot, P.J.; Gomes, J. Comparison of surface runoff generated by permeable pavements in concrete blocks and porous asphalt. Da Vinci 2006, 3, 139–156. [Google Scholar]
- Geraldi, M.S.; Ghisi, E. Influence of the length of rainfall time series on rainwater harvesting systems: A case study in Berlin. Resour. Conserv. Recycl. 2017, 125, 169–180. [Google Scholar] [CrossRef]
- Tassi, R. Effect of Batch Micro-Reservoir on Urban Macrodrainage. Master’s Thesis, Federal University of Rio Grande do Sul, Porto Alegre, Brazil, December 2002. (In Portuguese). [Google Scholar]
- Zahmatkesh, Z.; Burian, S.J.; Karamouz, M.; Tavakol-Davani, H.; Goharian, E. Low-impact development practices to mitigate climate change effects on urban stormwater runoff: Case study of New York City. J. Irrig. Drain. Eng. 2015, 141, 4014043-1-13. [Google Scholar] [CrossRef]
Figure 1.
Reliability of the methods in the three rainwater demand scenarios.

Figure 2.
Percentage of rainwater overflow according to each method and scenario.
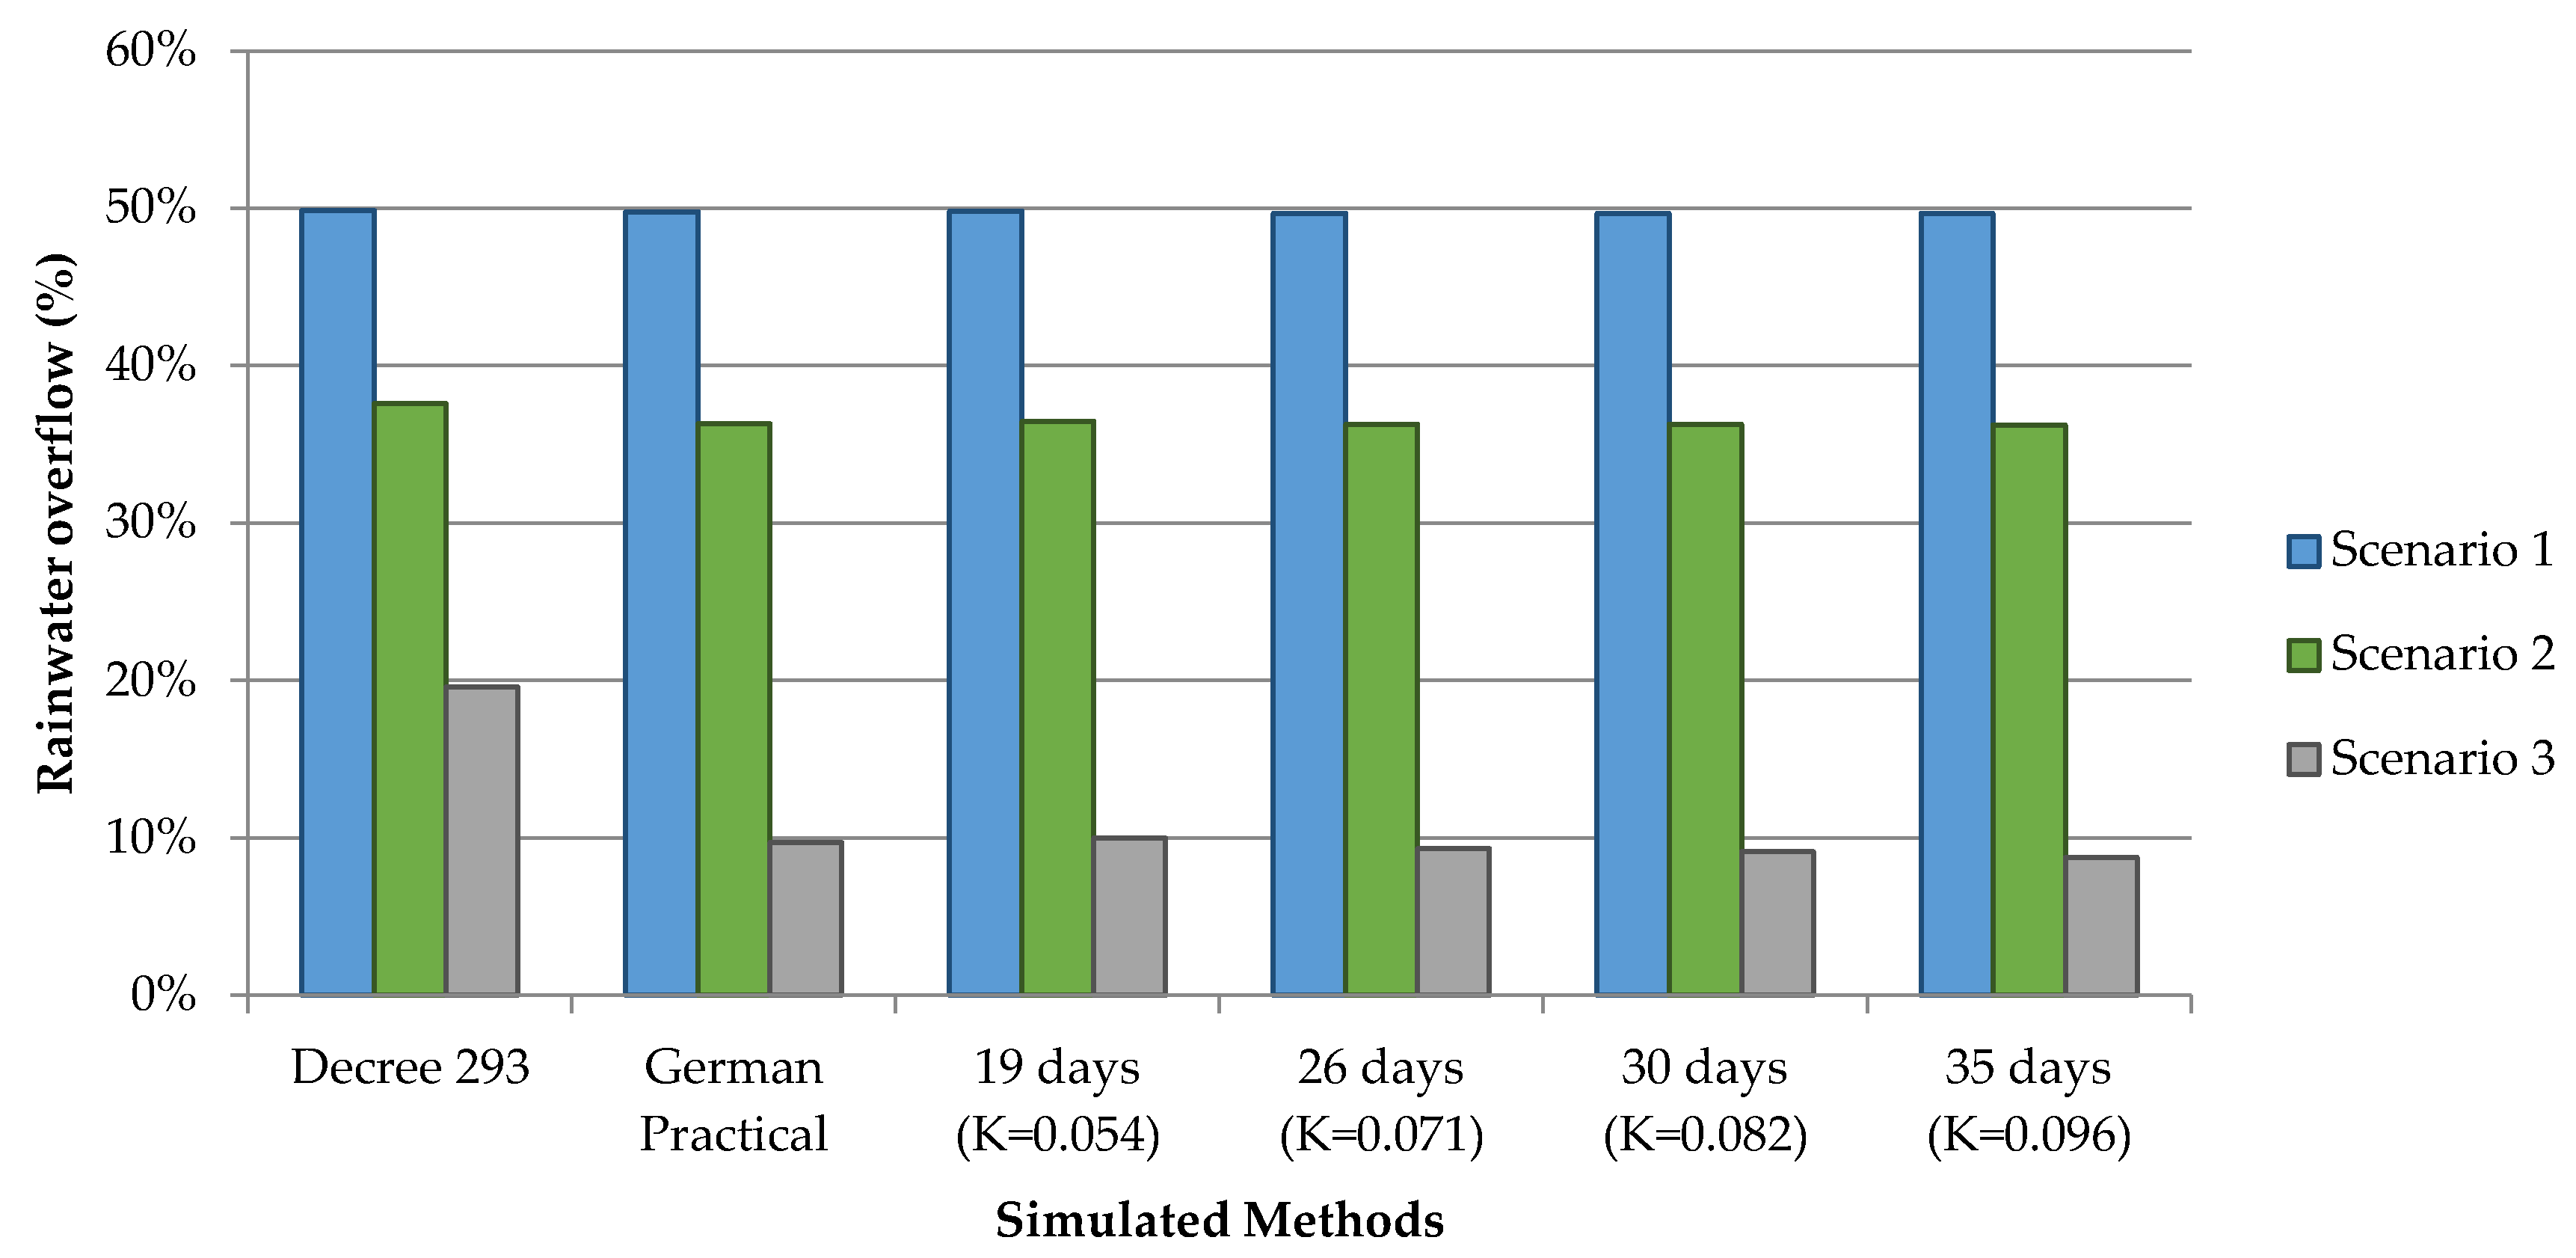
Figure 3.
Reduction of the volume of water drained in the condominium with the use of rainwater in each scenario.
Figure 3.
Reduction of the volume of water drained in the condominium with the use of rainwater in each scenario.

Figure 4.
Hypothetical discretization of the rainfall used for the chosen lot (a) without rainwater harvesting systems and (b) with rainwater harvesting systems.
Figure 4.
Hypothetical discretization of the rainfall used for the chosen lot (a) without rainwater harvesting systems and (b) with rainwater harvesting systems.
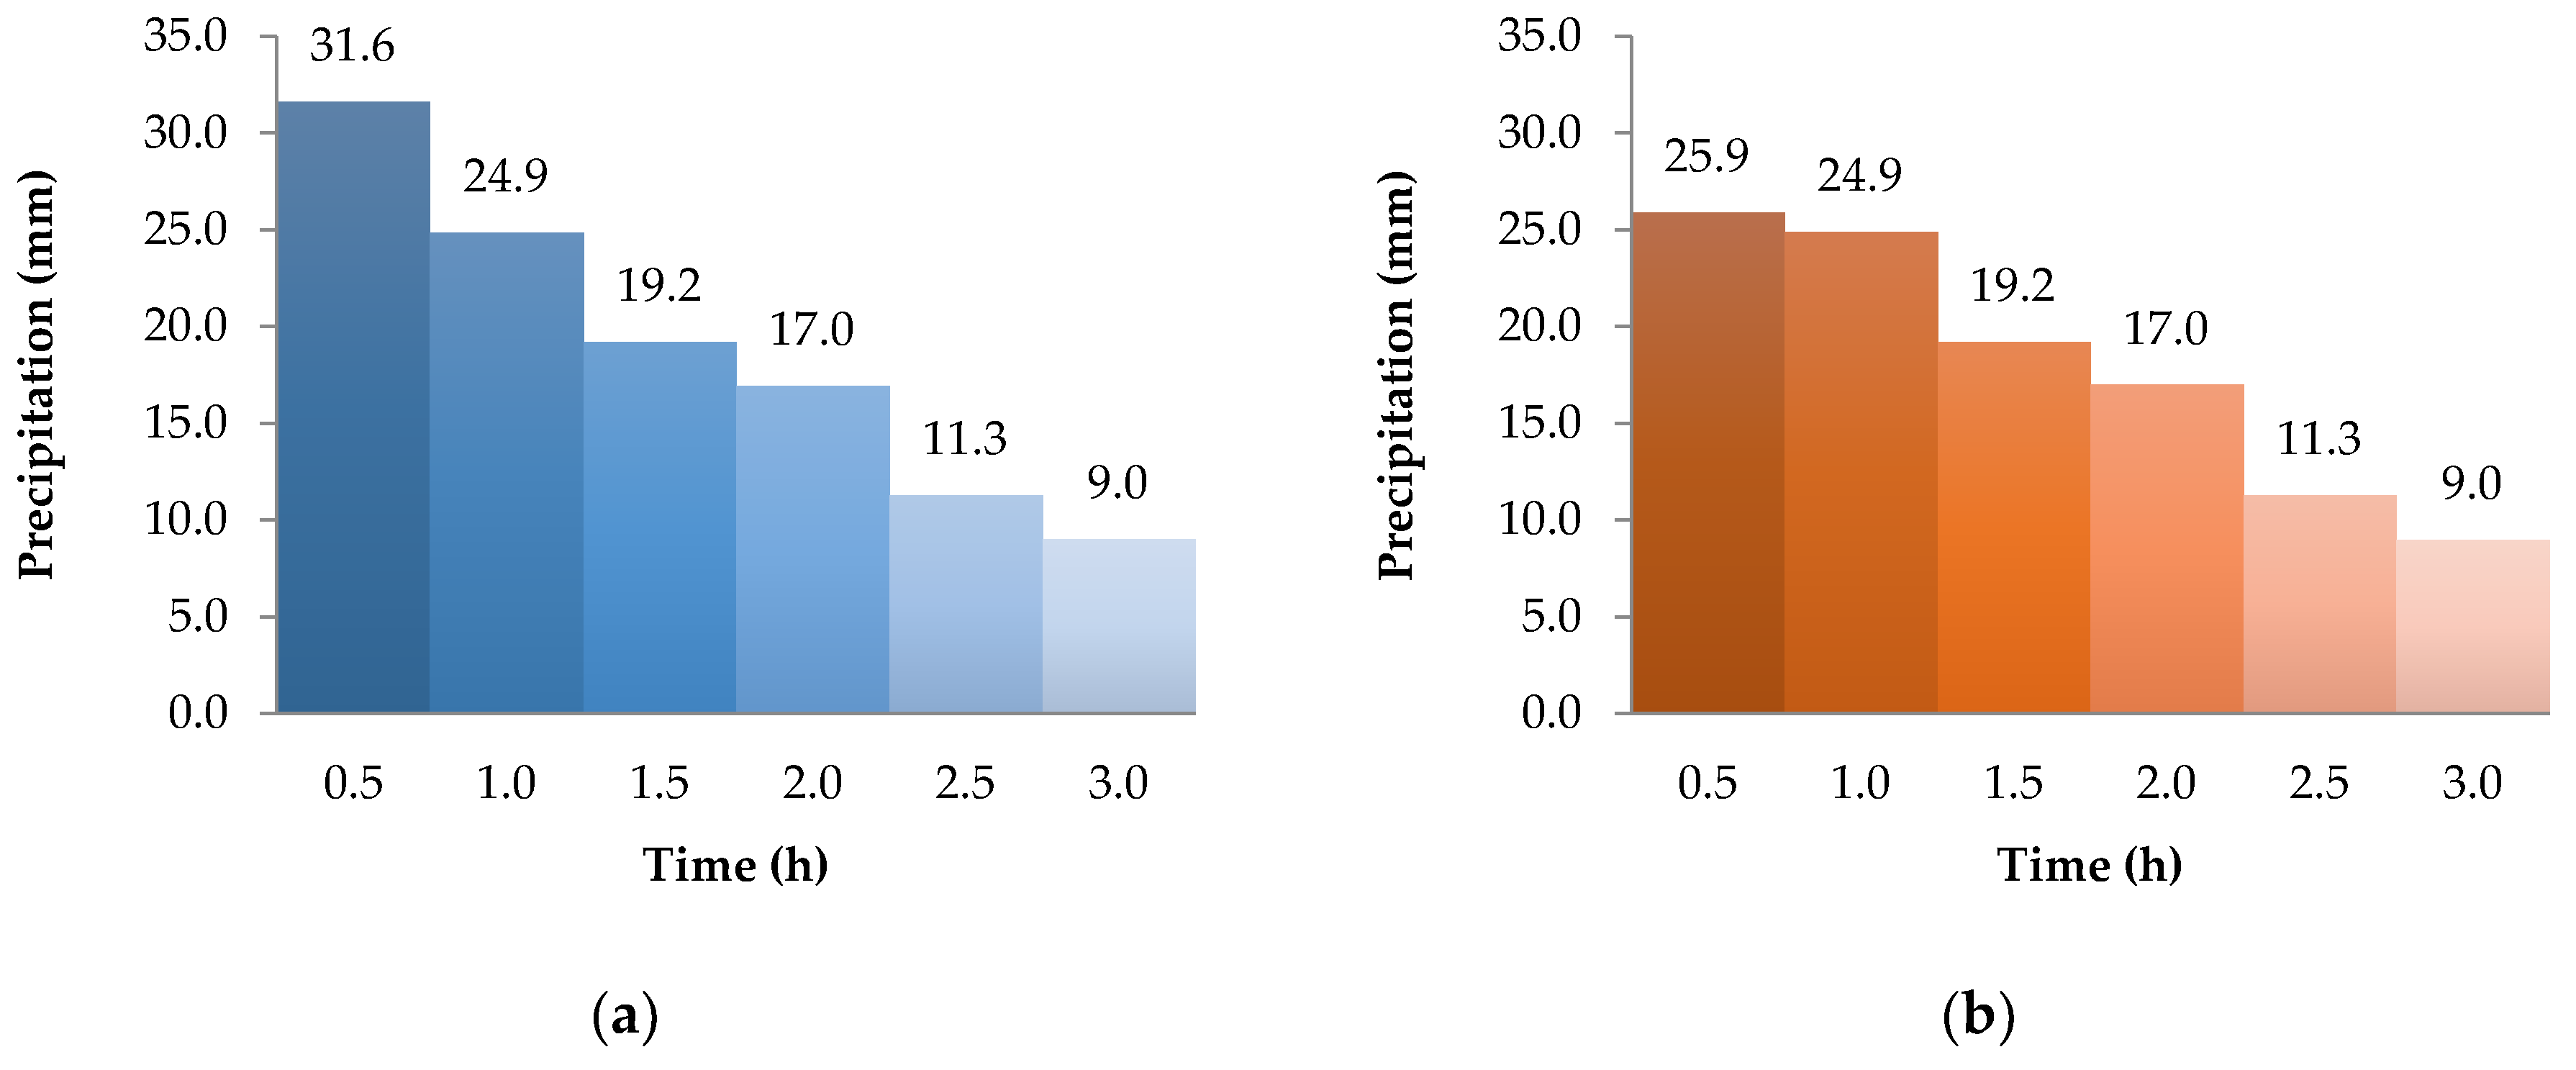
Figure 5.
Hydrograph resulting from the chosen lot for the two scenarios.
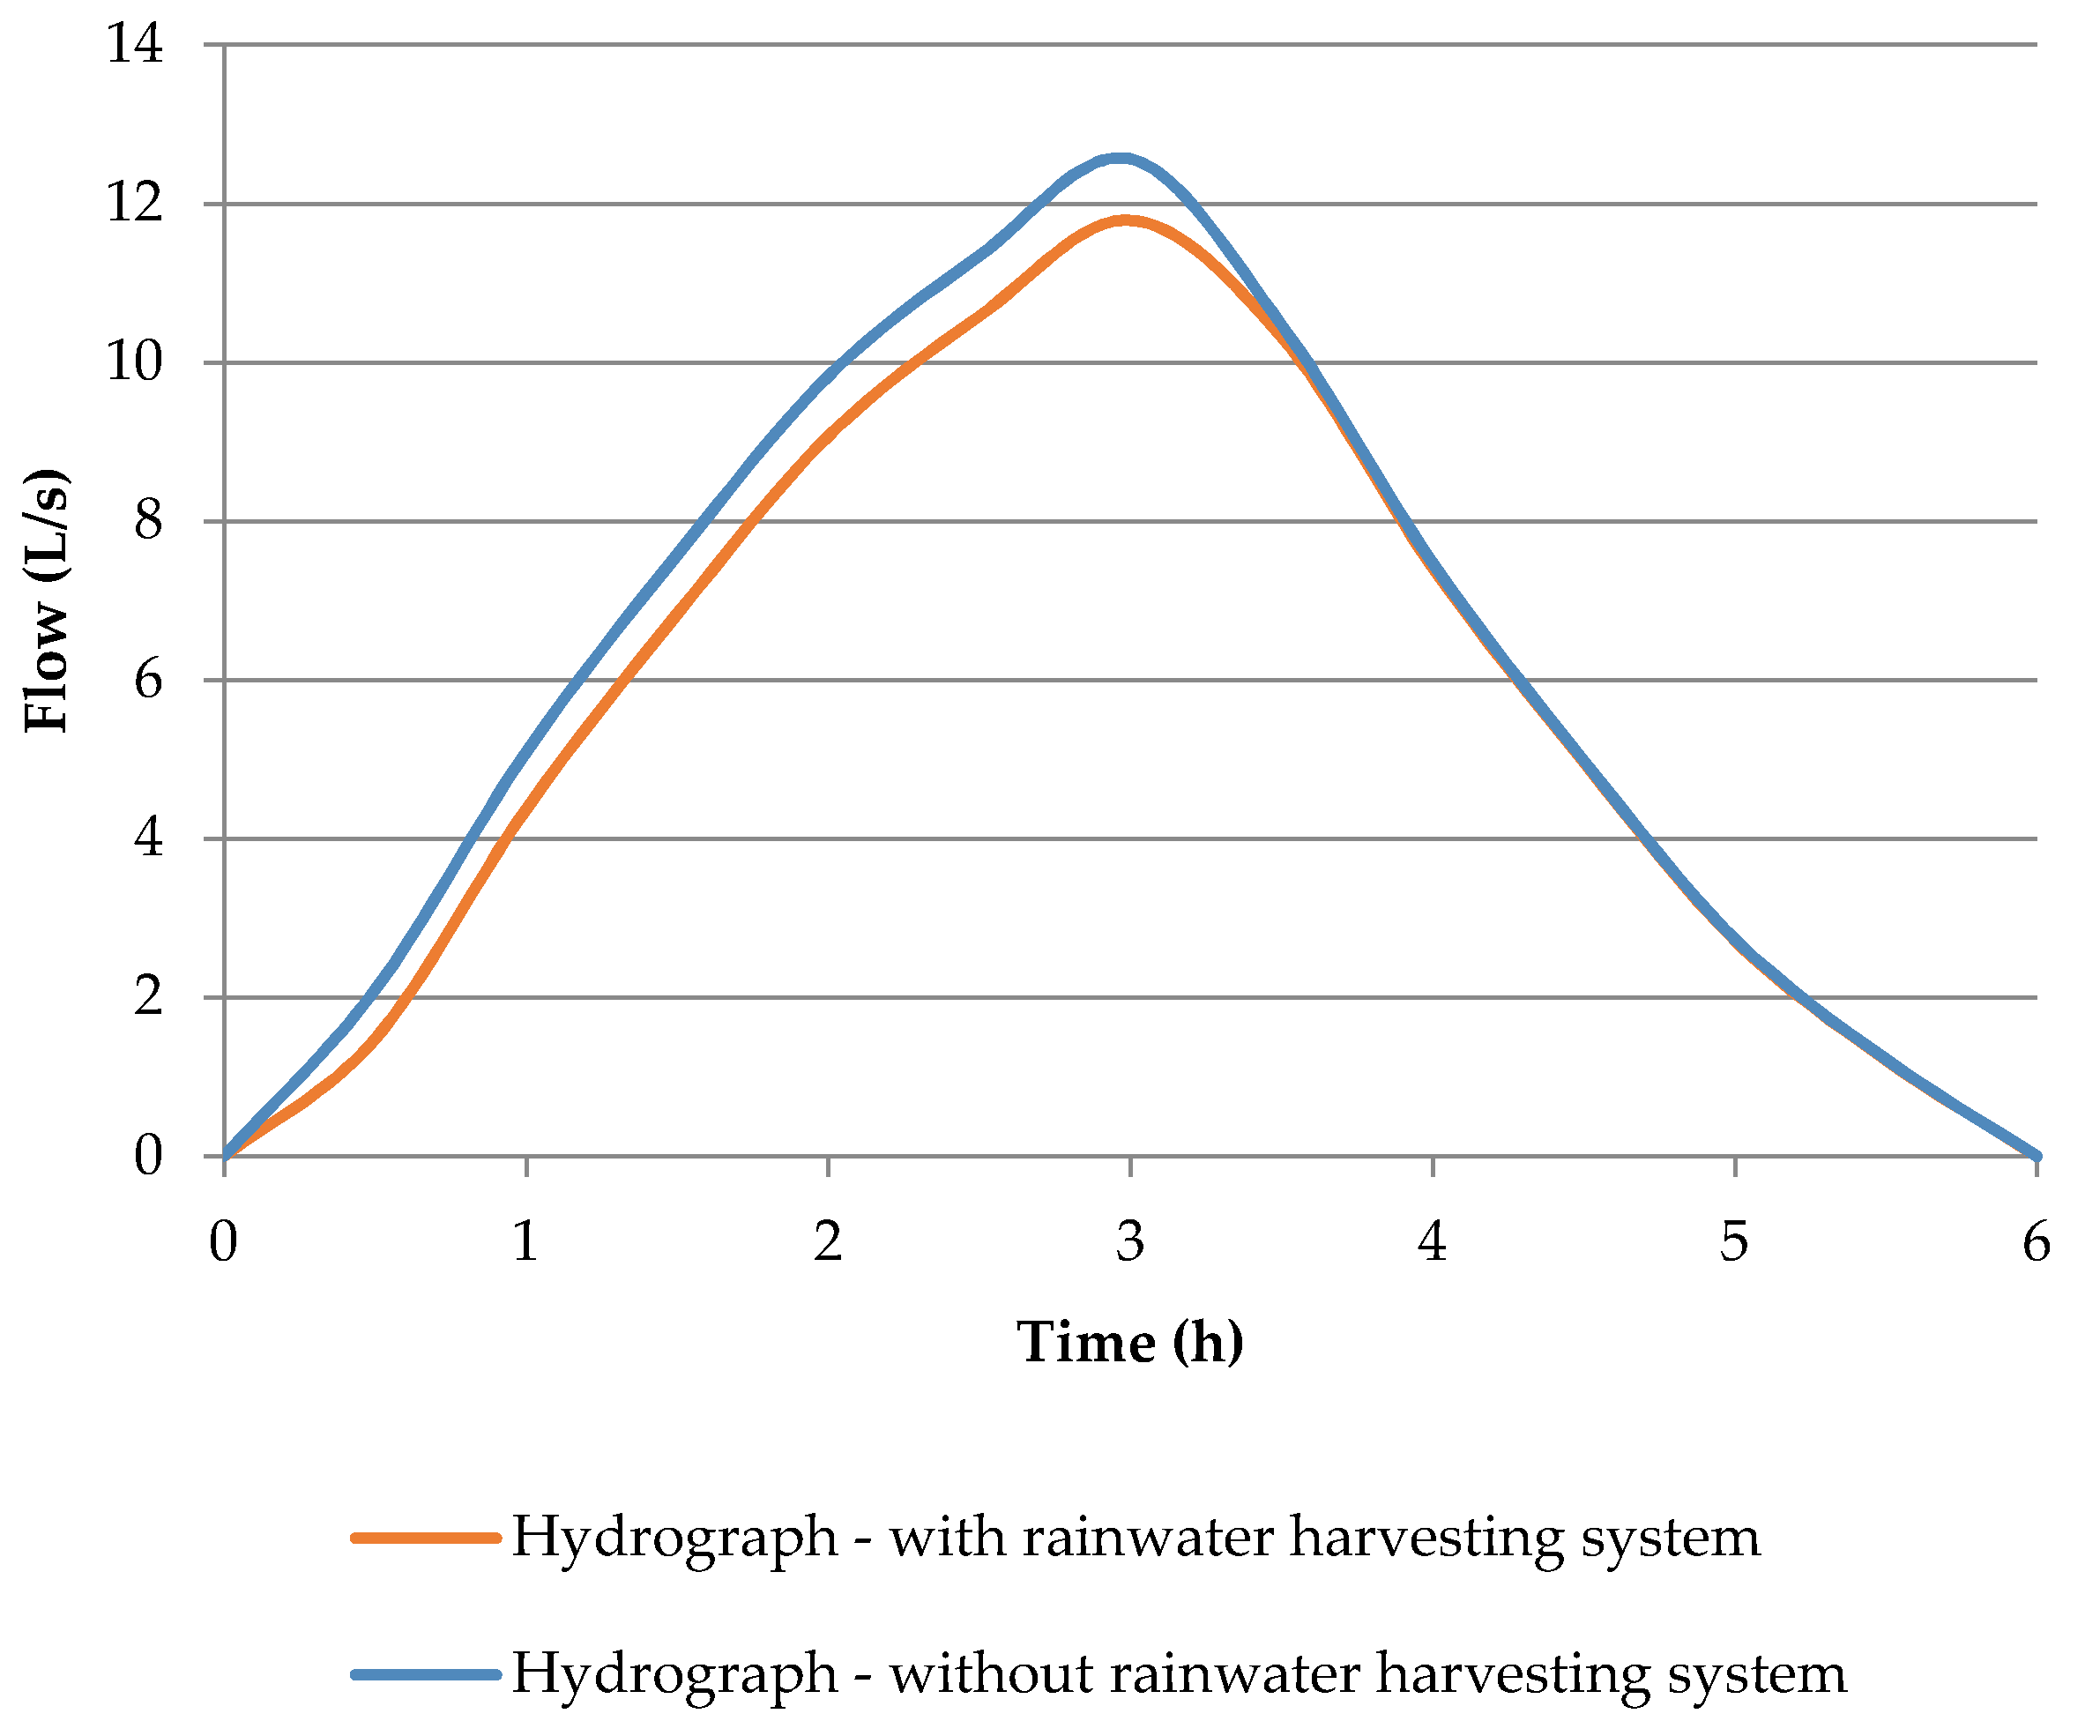
Figure 6.
Remaining hydrograph for (a) storage tank #1 and (b) storage tank #2 for the two scenarios.
Figure 6.
Remaining hydrograph for (a) storage tank #1 and (b) storage tank #2 for the two scenarios.

Table 1.
Maximum consecutive days without rainfall and average annual precipitation.
| Year | Maximum Number of Days without Rain | Annual Rainfall (mm) |
|---|---|---|
| 1997 | 13 | - |
| 1998 | 16 | 1824.8 |
| 1999 | 13 | 1412.0 |
| 2000 | 17 | 1385.6 |
| 2001 | 14 | 1567.6 |
| 2002 | 14 | 1383.8 |
| 2003 | 18 | 1189.0 |
| 2004 | 33 | 1191.2 |
| 2005 | 14 | 1333.2 |
| 2006 | 17 | 932.8 |
| 2007 | 38 | 1252.6 |
| 2008 | 28 | 1198.6 |
| 2009 | 10 | 1664.6 |
| 2010 | 23 | 1776.8 |
| 2011 | 21 | 1858.4 |
| 2012 | 25 | 1483.8 |
| 2013 | 13 | - |
| Average | 19 | 1430.3 |
Table 2.
Surface flow coefficients.
| Surfaces | Percentage of Occupied Area (%) | Type of Coating | Runoff Coefficient | Source |
|---|---|---|---|---|
| Roofs | 26.0 | Ceramic tiles | 0.85 | [27] |
| Streets | 13.8 | Asphalt | 0.95 | [28] |
| Common sidewalks | 12.9 | Paver | 0.58 | [29] |
| Private sidewalks | 12.7 | Concrete | 0.95 | [28] |
| Lawn gardens | 17.2 | Grass/silt clay with slope of 5 to 10% | 0.55 | [28] |
| Permanent preservation area | 14.1 | Native vegetation | 0.50 | [28] |
Table 3.
Tank capacities for the chosen lot according to the method used.
| Scenario | Tank Capacities (L) | |||||
|---|---|---|---|---|---|---|
| German Practical (22 days) | Decree 293 | 19 Days (K = 0.054) | 26 Days (K = 0.071) | 30 Days (K = 0.082) | 35 Days (K = 0.096) | |
| 1 | 632 | 500 | 568 | 747 | 863 | 1011 |
| 2 | 1262 | 500 | 1135 | 1493 | 1724 | 2019 |
| 3 | 4547 | 500 | 4092 | 5380 | 6214 | 7275 |
Table 4.
Tank capacities used according to market availability.
| Scenario | Tank Capacities (L) | |||||
|---|---|---|---|---|---|---|
| German Practical (22 days) | Decree 293 | 19 Days (K = 0.054) | 26 Days (K = 0.071) | 30 Days (K = 0.082) | 35 Days (K = 0.096) | |
| 1 | 500 | 500 | 500 | 500 | 1000 | 1000 |
| 2 | 1500 | 500 | 1000 | 1500 | 1500 | 2000 |
| 3 | 4500 | 500 | 4000 | 5500 | 6000 | 7500 |
Table 5.
Potential for potable water savings in each scenario.
| Scenario | Rainwater Demand (%) | Potential for Potable Water Savings (%) | |||||
|---|---|---|---|---|---|---|---|
| Decree 293 | 19 Days (K = 0.054) | 22 Days (German Practical) | 26 Days (K = 0.071) | 30 Days (K = 0.082) | 35 Days (K = 0.096) | ||
| 1 | 2.9 | 2.8 | 2.8 | 2.8 | 2.8 | 2.9 | 2.9 |
| 2 | 5.8 | 4.9 | 5.5 | 5.6 | 5.6 | 5.6 | 5.7 |
| 3 | 20.8 | 9.2 | 18.3 | 18.6 | 19.1 | 19.2 | 19.7 |
Table 6.
Precipitation surplus of rain discretization of 113 mm.
| Total Precipitation—P (mm) | Accumulated Precipitation (mm) | Curve Number—CN | Maximum Potential Infiltration—S (mm) | Initial Infiltration—P𝒂 (mm) | Cumulative Surplus Precipitation—Pe (mm) | Surplus Precipitation (mm) |
|---|---|---|---|---|---|---|
| 31.64 | 31.64 | 92 | 22.09 | 4.42 | 15.03 | 15.03 |
| 24.86 | 56.50 | 92 | 22.09 | 4.42 | 36.57 | 21.54 |
| 19.21 | 75.71 | 92 | 22.09 | 4.42 | 54.43 | 17.86 |
| 16.95 | 92.66 | 92 | 22.09 | 4.42 | 70.58 | 16.15 |
| 11.30 | 103.96 | 92 | 22.09 | 4.42 | 81.47 | 10.89 |
| 9.04 | 113.00 | 92 | 22.09 | 4.42 | 90.23 | 8.76 |
© 2018 by the authors. Licensee MDPI, Basel, Switzerland. This article is an open access article distributed under the terms and conditions of the Creative Commons Attribution (CC BY) license (http://creativecommons.org/licenses/by/4.0/).
Share and Cite
MDPI and ACS Style
Teston, A.; Teixeira, C.A.; Ghisi, E.; Cardoso, E.B. Impact of Rainwater Harvesting on the Drainage System: Case Study of a Condominium of Houses in Curitiba, Southern Brazil. Water 2018, 10, 1100. https://doi.org/10.3390/w10081100
AMA Style
Teston A, Teixeira CA, Ghisi E, Cardoso EB. Impact of Rainwater Harvesting on the Drainage System: Case Study of a Condominium of Houses in Curitiba, Southern Brazil. Water. 2018; 10(8):1100. https://doi.org/10.3390/w10081100
Chicago/Turabian StyleTeston, Andréa, Celimar Azambuja Teixeira, Enedir Ghisi, and Ernani Benincá Cardoso. 2018. "Impact of Rainwater Harvesting on the Drainage System: Case Study of a Condominium of Houses in Curitiba, Southern Brazil" Water 10, no. 8: 1100. https://doi.org/10.3390/w10081100
Note that from the first issue of 2016, this journal uses article numbers instead of page numbers. See further details here.