Calculation of Water Resource Value in Nanjing Based on a Fuzzy Mathematical Model


1
Business School, Hohai University, Nanjing 211100, China
2
School of Public Administration, Hohai University, Nanjing 211100, China
*
Author to whom correspondence should be addressed.
Water 2018, 10(7), 920; https://doi.org/10.3390/w10070920
Submission received: 13 June 2018
/
Revised: 6 July 2018
/
Accepted: 9 July 2018
/
Published: 11 July 2018
(This article belongs to the Section Urban Water Management)
Abstract
:In view of the complexity and uncertainty of water resources, this paper chooses an evaluation index system of 13 indicators based on the fuzzy mathematics model in three aspects: water resources, water quality and socioeconomic status. The entropy method was used to determine the weight of the index, and the water resource value of Nanjing in 2011–2015 was dynamically evaluated. The results show that the price of water resources in Nanjing from 2011 to 2015 rose from 3.43 yuan/m3 to 5.94 yuan/m3, showing a clear upward trend, but the corresponding price of water expenditure accounted for a proportion of disposable income from 2.27% to 1.87% during the same time period. This counterfactual trend proves that the current water price in Nanjing is relatively low and is not conducive to the efficient use of water resources. Given the fact that water prices have larger room for growth, the city government could initiate the reform of water pricing system and re-enact the water fee collection standards to achieve optimal allocation of water resources and sustainable development.
1. Introduction
Water resources are an important material resource in natural ecosystems and a key element in promoting social and economic progress. In recent years, with the rapid development of China’s economy, the ecological environment has suffered serious damage. Water shortage is also becoming increasingly acute. The current government-led water pricing model does not reflect the leverage of the market economy, because the water market price is set too low to be conducive to the sustainable development of water resources [1]. According to the principles of political economy, the price is the monetary performance of the value, and a reasonable water price should be based on scientific measurement of the value of water resources [2]. Therefore, an in-depth study of the water resource value has implications in setting water market prices, improving effective allocations of water resources and rational use, which are all critical in achieving the harmonious unification of ecological and social development.
The water value system is a complex system that is influenced by both natural systems and socioeconomic systems [3]. One cannot measure the value of water by only considering water itself and ignoring the social system and economic system. As far as the natural system and the social system, they are also a combination of various complex factors. Because of the “incompatibility principle” in complex systems, it is difficult to evaluate the value of water resources by using traditional value calculation methods such as the shadow price method [4], marginal opportunity cost model method [5], or the supply and demand price model [6]. At the same time, the water value system is a fuzzy system, and there is a great deal of uncertainty. For example, in the study of water resources, a simple “yes” or “no” is not sufficient in answering whether water pollution exists, because there could be serious pollution, heavy pollution, or light pollution. In addition, things that are not clear about this boundary need to have a mathematical form that can describe the difference of things in the process of gradual change [7]. Therefore, in view of the complexity and ambiguity of the water resource value system, this paper applies the theory and method of fuzzy mathematics to investigate the value of water resources [8]. First, the fuzzy comprehensive evaluation model of water resource value was constructed, then the water resource value calculation model was established to calculate the value of water resources.
Nanjing is situated in southeast China, which has rich precipitation and relatively adequate water resources. With the rapid economic development, the water consumption in Nanjing has been increasing year by year. The contradiction between supply and demand of water resources has become increasingly prominent, water shortage has become an important factor restricting social and economic development [9]. This research started from three aspects, namely water resource quantity, water resource quality and status of socioeconomic development, to construct an evaluation index system using entropy value method. The fuzzy comprehensive evaluation model is used to analyze and calculate the dynamic trend of water resource value and price in Nanjing from 2011 to 2015 in order to provide a method reference and data support for improving the water price system in Nanjing and promoting the sustainable development of water resources in Nanjing.
2. Materials and Methods
2.1. Research Area
Nanjing is located in southeastern China, governs 11 districts (Figure 1), and covers 6597 square kilometers with 8.27 million residents. Nanjing belongs to the north subtropics humid climate, with four distinct seasons and profuse rainwater. The annual average temperature is 15.3 °C, and the average relative humidity is 76%. Nanjing has about 117 rainy days and 237 frost-free days every year, with a mean precipitation of 1106.5 mm. However, the distribution of precipitation is temporally and spatially uneven throughout the year.
In Nanjing, there are a total of 564 rivers of varying sizes, including the Yangtze River, Chu River, Qinhuai River, and Gucheng Lake, among other greater rivers and lakes. The water system of the city belongs to three drainage basins of the Yangtze River, Huai River and Tai Lake. The drainage area of the Yangtze River is 6285 square kilometers, accounting for 95.5% total drainage area in Nanjing. In 2015, the total annual precipitation for the city was 1443.3 mm, which was 9.507 billion m3 for converted total precipitation amount. The water resource quantity for the city was 4.615 billion m3, of which the surface water resource quantity was 3.933 billion m3, underground water resource quantity was 0.8364 billion m3, repeated calculated amount was 0.1546 billion m3, and total water consumption was 4.024 billion m3 [10].
2.2. Data Source
According to the operability and availability of the data, the data sources used in this paper are derived from “Nanjing City Water Resources Bulletin 2011–2015” (http://shuiwu.nanjing.gov.cn), “Nanjing Statistical Yearbook 2011–2015” (http://www.njtj.gov.cn), “Nanjing Statistical Bulletin of National Economic and Social Development 2011–2015” (http://www.nanjing.gov.cn/index.html), and “Nanjing Tap Water Price List 2011–2015” (http://shuiwu.nanjing.gov.cn).
2.3. Methods
Water resource value accounting is the comprehensive application of economic theory and mathematical models [11]. The fuzzy comprehensive evaluation model can evaluate the value of water resources at multiple levels and with multiple factors to reflect the status of water resources in a more comprehensive way. Therefore, the authors use the fuzzy mathematical model to quantitatively evaluate the value of water resources in Nanjing; the accounting model is composed of two parts: the fuzzy comprehensive evaluation model of water resource value and the water resource price calculation model.
2.3.1. Fuzzy Comprehensive Evaluation Model of Water Resource Value
The water resource value is a complex and fuzzy system, and the factors that affect it can be broadly divided into 3 categories: quantity of water resources, quality of water resources and socioeconomic factors [12].
The water resource value model can be expressed as Equation (1).
In the equation, is the value of water resources, are the factors which affect the water resource value, such as water resources quantity, precipitation, urban domestic water consumption, water production cost and normal profit, etc. The model will be embodied as below.
Set the Domain for the elements of water resource value, which can be expressed by Equation (2).
The evaluation vector is H, which is shown as Equation (3).
The fuzzy comprehensive evaluation model of water resource value can be expressed as Equation (4).
In the equation, is the fuzzy comprehensive evaluation of water resource value; “” is the composite operation symbol of the fuzzy matrix. Generally, the operators “”, “”, “” and “” are employed. In the fuzzy comprehensive evaluation model of water resource value, the weighted average operator is used to perform calculations. “” is the weight vector of the fuzzy comprehensive evaluation of water resource value. “” is the comprehensive evaluation matrix, which is composed of the single factor judgment matrix, which is shown as Equation (5).
In the equation, refers to the -element -level evaluation value.
To determine , the membership function of each factor in element should first be determined. The membership function is the given Domain , which specifies any fuzzy set , (denoted as ) on , and for any , there is a membership degree corresponding to it; set as the membership function of , signified by . There are many ways to determine the membership function. In this paper, we use the ascending (descending) semi-trapezoidal distribution to establish a linear membership function [13]. The specific membership function is established as shown in Equations (6)–(8).
where is the actual value of the evaluation factor, is the criterion of the adjacency level of the evaluation factor, is the label of evaluation factor, is the evaluation degree, , is the membership of evaluation factor .
2.3.2. Entropy Method
As for the weight A, in the past, the method of subjectively determining weights was usually adopted to determine the weights of evaluation indexes, such as the experience method, the expert consultation method, the Analytic Hierarchy Process (AHP) method, etc. [14]. However, these methods result in deviation in the evaluation results due to subjective factors, which is not conducive to the accuracy of the evaluation results. As an objective and comprehensive evaluation method, the entropy method is a method to determine index weight according to data dispersion degree; it can better eliminate the subjective factor interference on each index weight, so that the evaluation results are more able to accord with reality [15]. Therefore, this paper uses the entropy method to determine the index weight; the weight matrix is denoted by . The specific calculation of the entropy method performed as follows:
Normalizing the in the matrix to obtain the standardized matrix :
where , represents the initial number value of the index, is the standardized number value, and and are the maximum and minimum number values of the corresponding indexes.
Then calculate the entropy of the index
where is the proportion of the evaluation index in the evaluation factor and is the entropy of the index, and . Obviously, when , is meaningless, so we amend the definition of as follows:
The weight of the evaluation index can be calculated by the following equation.
Additionally, the equation must satisfy , .
2.3.3. Water Resource Price Calculation Model
According to the comprehensive evaluation matrix , the comprehensive evaluation index of water resources can be obtained. However, is a dimensionless vector, and the water resource price must be obtained by the conversion formula, which can be expressed with the following equation.
In the equation, is the water resource price vector, is the comprehensive evaluation result of water resource value, and is the price of water resources. This paper adopts the method of water rate affordability index to determine the price vector [16]. The water rate affordability index is an indicator of the affordability of what water users pay for water products and water services (water charges). It can be calculated as follows.
where is the water rate affordability index, is the water fee and is the actual income.
Usually, water fees are based on water price; reasonable water prices should include water resource value, production costs, normal profits, sewage treatment fees, and tax fees. Therefore, as an important component of the water fee basis, water resource value is limited by the maximum water rate affordability index; that is, there is an upper limit of water resource value.
The upper limit of the water resource value is the price that reaches the maximum water fee affordability index. It can be calculated by Equation (16).
where is the upper limit of water resource value, is the water rate affordability index, is the per capita disposable income, is the annual per capita water consumption, is the water supply cost and the normal profit, is the sewage treatment fee, is the tax fee.
Since the upper limit of water resource value is , then the actual water resource price should be between . Accordingly, the price range of water resources can be divided into price vectors by using linear or nonlinear relations based on the actual situation. This paper uses equal intervals to obtain the water resource price vector , as per Equation (17).
According to the rules of the matrix calculation, we can obtain the water resource price corresponding to the result of the fuzzy comprehensive evaluation.
3. Results and Discussion
3.1. Evaluation Index and Actual Value
There are many factors that affect the value of water resources, not only the social and economic factors, but also the water resources system itself. Furthermore, there is an interaction between different affecting factors. Therefore, the evaluation indexes selected should be representative, applicable, independent and feasible.
The water resource value is determined by the scarcity level of water resource quantity. The scarcer the water is, the more valuable the water is. In China, there are less water resources in the northern region than in the south, so the water resources in the north are precious and more valuable than in the South. As a quantitative element to evaluate the value of the water resources in a region, it depends not only on the absolute amount of water, but also on the relative degree of scarcity of water. In those terms, we can use the “total water resources”, “local precipitation”, “per capita water resources” and other indicators to comprehensively reflect the quantity of water resources.
The water resource value is closely related to the water quality. As water function often depends on water quality, and the functions of water resources are different, the value created by a unit of water resources also varies. That is, there are differences in the contributions to the national economy based on the different functions of water resources. Therefore, its value should not be the same. When the water quality is good, the water function is varied, and accordingly, its value is high. When the water quality is bad, the water function is simple, and it may even lose its original function and become waste water, and therefore its value is low. In the evaluation of water resource value, “water function area water quality compliance rate”, “reservoir and lake water quality compliance rate” and other indicators can be chosen to comprehensively reflect the quality of the water resources.
The socioeconomic factors are important factors affecting the value of water resources. On the one hand, no matter how rich the water resources and how high the water quality are, if you do not go on to develop and combine it with socioeconomic factors, the value of the water resources at best shows only the ecological value; its economic value cannot be reflected. On the other hand, many countries and regions are based on estuaries or port cities to form a hub with major rivers, forming an overall developing situation and constituting an important pillar of social and economic development. This shows that the effective combination of water resources and socioeconomic factors is the productive source of water resource value. In the evaluation of water resource value, we must consider the socioeconomic factors that can reflect the role of water resources in socioeconomic development, as well as the socioeconomic development of water demand and dependency factors, such as “per capita GDP”, “unit GDP water demand”, “industrial added value water consumption” and so on.
According to the actual situation of Nanjing and the operability of the data, this paper chooses 13 evaluation indexes in Nanjing, shown in Table 1.
3.2. Evaluation Criteria and Weights
According to the principle of fuzzy comprehensive evaluation, the evaluation criteria of water resources are divided into five grades: high, relatively high, common, relatively low and low. In using these, the highest standard for the evaluation indicators of water resources factors and socioeconomic factors is set according to average from many years of the major cities in China, and then interval arithmetic is used to set the five-level magnitudes. Each evaluation index of the quality elements of water resources should set the evaluation criteria of each level according to the standard percentage of the targets. For positive indicators, the greater the number, the higher the value reflected; conversely, for negative indicators, the greater the number, the less value it reflects, and vice versa, as shown in Table 2.
3.3. Fuzzy Comprehensive Evaluation of Water Resource Value
Based on Equations (9)–(13), the weight vector of comprehensive evaluation of water resource value in Nanjing is calculated as follows:
Take 2011 as an example. According to Equations (5)–(8), the single-factor membership matrix of each index is determined, which can obtain the fuzzy comprehensive evaluation matrix of water resource value in Nanjing.
Based on Equation (4), the water resource value comprehensive evaluation weight vector and the fuzzy evaluation matrix can be combined to perform the calculation, and the fuzzy comprehensive evaluation result in 2011 can be obtained by .
3.4. Calculation of Water Resource Value
The water resource price needs to consider four elements: the cost and the profit of water supplies, the water rate affordability index, the sewage treatment fee and the water resources fee. Through the statistics released in 2011 in Nanjing, the ladder water price of Nanjing has three parts: the water supply price of the water enterprises, the sewage disposal fee, and tax fees. In 2011, the average per capita disposable income of Nanjing residents was 32,200 yuan, per capita annual water consumption was 130.94 m3, the water supply price was 1.24 yuan/m3, and the basic water price for residents was 2.8 yuan/m3. The sewage treatment fee was 1.3 yuan/m3, and the tax fees were 0.26 yuan/m3 with the average water supply cost and profit of the whole city accounting for 48% of the water supplying price.
According to academic research, different proportions of water fee expenditure in individual income will have different effects on people’s psychology and perceived affordability [17]. When the water charges account for 1% of personal income, it has little effect on people’s psychology. When water charges account for 2% of personal income, it has a certain effect, and people start to care about water usage. When the water charges account for 3% of personal income, people begin to pay attention to their water usage and start to save water. When water charges are more than 5% of personal income, it will have great influence on people’s psychology, and residents start to think about water reuse. In the international community, the water fee affordability index generally selects a ratio of 3% to 5%, which is a feasible index for developing countries [18]. According to the actual situation of Nanjing City, this paper selects a 3% ratio as the index of water rate affordability for Nanjing residents. On the basis of Equation (16), the upper limit of the water resource price in Nanjing is .
According to the basis of Equation (17), the water resource price vector is obtained by equating with equal intervals.
Based on Equation (14), we can obtain the water resource price in Nanjing in 2011.
× [5.22, 3.91, 2.61, 1.30, 0] = 3.43 yuan/m3.
Using the current water price in Nanjing, which was raised in 2012, we can calculate the water resource price in Nanjing from 2011 to 2015 by using the above calculation steps (Table 3).
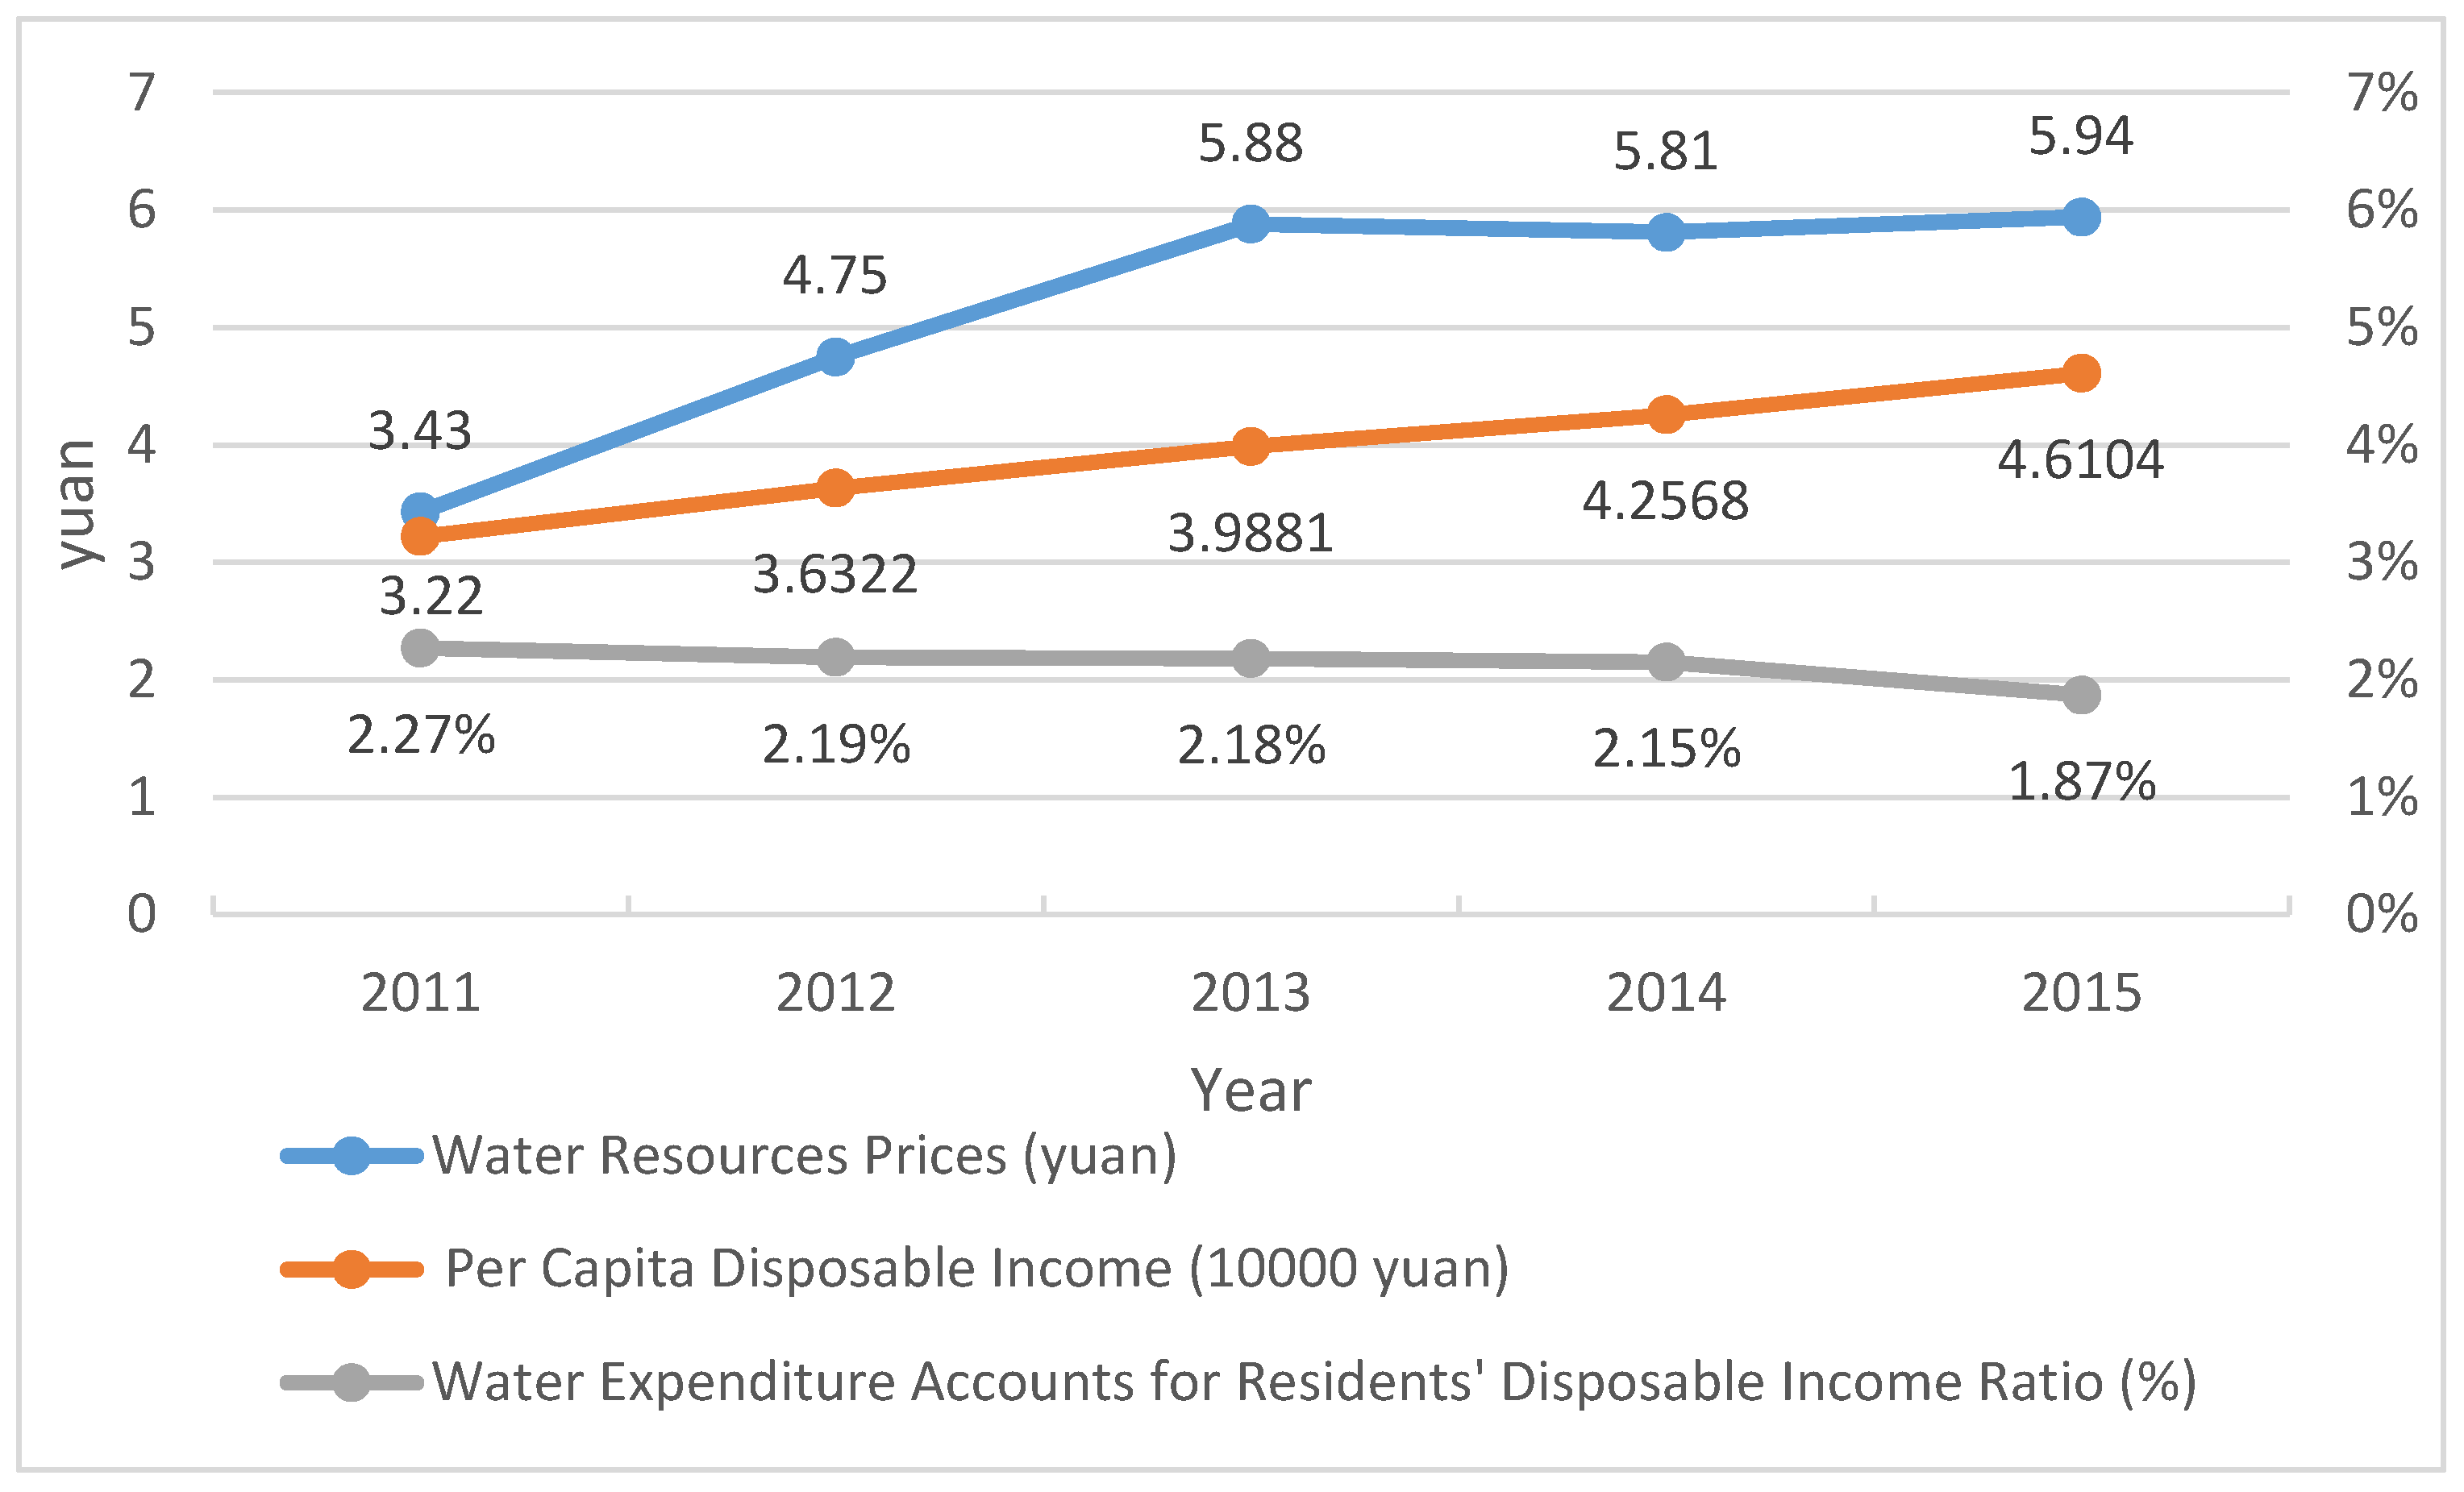
Through the price of water resources and per capita annual water consumption of residents in Table 3, we can calculate the annual water expenses of residents, and then calculate the water expenditure accounts for residents’ disposable income ratio. Based on our calculation of water resource price in Nanjing, it rose from 3.43 yuan/m3 to 5.94 yuan/m3 between 2011 and 2015, showing a clear upward trend. However, the corresponding price of water expenditure with respect to residents’ disposable income ratio decreased from 2.27% to 1.87%, showing a slow downward trend (Figure 2). This trend indicates that the water prices in Nanjing have a large room for growth.
A reasonable water price reflects both the science of its formation mechanism and a modest price level, which can not only be conducive to the utilization of water resources to achieve the sustainable development of water resources, but also to the economic affordability to consumers in promoting water conservation. In the long term, obtaining the full cost of water pricing would be the most conducive to the sustainable use of water resources, but based on the current objectives of China and many developing countries, this goal has not yet been fully realized.
Due to the uneven distribution of water resources and the degree of regional development, the current water price formulation includes different modes. In some areas, water is used as a commodity, and the price of water is determined at the full cost of water supply, and in some areas, water is used as a quasi-public product, with welfare water prices. In areas with abundant water resources and a developed economy, because the marginal cost of water supply is lower than that in underdeveloped areas, calculating the water price completely based on the cost may result in an imbalance of industrial distribution and the waste of water resources. In areas with low water resources or poor water quality, it is more difficult to obtain water, and the cost of water supply is higher. Usually, the economy in such areas is relatively underdeveloped. At this time, if the water price is simply determined by the cost of the water supply, it will cause further unfairness. Therefore, the formulation of water price should be calculated based on water supply costs, while taking full account of the demand for water resources, water scarcity, and affordability for water users.
With the increasing demand for water, it is difficult to meet the requirements for water conservation simply by limiting the amount of water used by economic means such as raising water prices and implementing stepped water prices. It is necessary to further increase the reuse rate of water resources and the productivity of reclaimed water when the water price policy is implemented, and to promote the use of water-saving appliances. As a quasi-public product, water resources directly affect the water habits and sustainable socioeconomic development, which implies many political and social impacts. Policy makers must fully consider the impact of various factors when formulating water price policies. The rise in water prices cannot affect the normal water demand of poor residents, in order to meet the needs of society while promoting the sustainable use of water resources.
4. Summary and Conclusions
This research took Nanjing as its object and chose 13 indexes, including gross water resource, per capita water resource quantity, per capita GDP, etc., using a structured fuzzy mathematical model for the value of water resources in order to build an evaluation system. The weights of indexes were defined using the entropy value method to calculate the value of water resources in Nanjing from 2011 to 2015, with the following conclusions obtained.
According to the data sources of Nanjing in 2011, the calculated value of water resources for Nanjing was 3.43 yuan/m3, plus 1.56 yuan/m3 for sewage disposal cost and taxes, and 0.6 yuan/m3 for water supply costs and profits; the calculated domestic water price was supposed to be 5.59 yuan/m3. Meanwhile, the basic water price for residents in Nanjing in 2011 was 2.8 yuan/m3, which only accounts for 50.09% of the value calculated herein. Even the highest ladder water price was 4.04 yuan/m3, which is still lower than the value calculated herein. When water price is 5.59 yuan/m3, the water rate expenditure accounts for 2.27% of residents’ disposable income, which still falls within the 3% for tolerance, as required by the structured model. This indicates that the current water price in Nanjing is on the low side, and raising the water rate is affordable. Raising the water rate is conducive to optimizing allocation of water resource, improving the water use efficiency of residents, enhancing water conservation awareness, and mitigating the eventuality of water resource shortage in Nanjing.
When using the fuzzy mathematics model to evaluate the value of water resources, the interlocking relations among water resource, aquatic environment, economy and society were considered comprehensively, instead of evaluating only the water resource itself. Additionally, the evaluation process also considers the affordability for water users. Thus, the evaluation result is able to reflect the practical situation in a better way. Compared with the former fuzzy comprehensive evaluation method, which is simply based on AHP, using the entropy value method to define weights can effectively solve the defect of being unduly subjective in the traditional weight evaluation, and can improve the practicability of the fuzzy evaluation model. In addition, dynamic calculation for the value of water resources can more deeply reflect the temporal and spatial variation of water resource value, increasing the stability and reliability of evaluation result. This calculating method for value of water resource was perfected in order to technologically underpin the reform of the water rate pricing system and the formulation of the water resource balance sheet in Nanjing.
Although the classification of water use, ration control and price mechanisms of ladder water price have been implemented to resolve the contradiction between water supply and demands in the city, there exist problems related to the unclear distribution of water rights, the low cost of the water supply, water resource waste, etc. This entails the efforts of related government departments put in perfecting water resource facilities as soon as possible and gradually pushing forward the reform of water rates to guarantee the price of water resource conforms to market rules, thereby realizing sustainable development and utilization of water resources in Nanjing.
Author Contributions
Y.J. proposed the research ideas and methods of the manuscript and was responsible for data collection and writing. J.S. and H.W. put forward revision suggestions for the paper.
Funding
The study is supported by the Fundamental Research Funds for the Central Universities (No. 2016B46314) and the Study on Application of Accounting Method in Ecological Environment (No. 2014B09314).
Conflicts of Interest
The authors declare no conflict of interest.
References
- Gan, H.; Qin, C.; Wang, L.; Zhang, X. Study on water pricing method and practice I. Discussion on the connotation of water resources value. J. Hydraul. Eng. 2012, 43, 289–295. (In Chinese) [Google Scholar]
- Madhoo, Y.N. Political economy of water pricing policy: Empirical evidence from public utilities in Mauritius. Water Resour. Res. 2004, 40, 1–9. [Google Scholar] [CrossRef]
- Hung, M.F.; Chie, B.T. Residential water use: Efficiency, affordability, and price elasticity. Water Resour. Manag. 2013, 27, 275–291. [Google Scholar] [CrossRef]
- Molinos-Senante, M.; Mocholí-Arce, M.; Sala-Garrido, R. Estimating the environmental and resource costs of leakage in water distribution systems: a shadow price approach. Sci. Total Environ. 2016, 568, 180–188. [Google Scholar] [CrossRef] [PubMed]
- Sun, L.; Lu, W.; Yang, Q.; Martín, J.D.; Li, D. Ecological compensation estimation of soil and water conservation based on cost-benefit analysis. Water Resour. Manag. 2013, 27, 2709–2727. [Google Scholar] [CrossRef]
- Qian, L.; Wang, H.; Zhang, K. Evaluation criteria and model for risk between water supply and water demand and its application in Beijing. Water Resour. Manag. 2014, 28, 4433–4447. [Google Scholar] [CrossRef]
- Jian, F.; Song, X.; Yu, W.B. Construction of the evaluation system of water asset price with fuzzy comprehensive assessment indexes: Taking Zhangye Prefecture in Heihe River basin as an example. J. Glaciol. Geocryol. 2016, 38, 567–572. (In Chinese) [Google Scholar]
- Zhang, G.; Liu, H. Calculation of protective price in water trading for valley cities. Resour. Sci. 2010, 32, 372–379. (In Chinese) [Google Scholar]
- Deng, Y.; Bonilla, M.; Ren, H.; Zhang, Y. Health risk assessment of reclaimed wastewater: A case study of a conventional water reclamation plant in Nanjing, China. Environ. Int. 2017, 112, 235–242. [Google Scholar] [CrossRef] [PubMed]
- Nanjing Water Authority. Nanjing City Water Resources Bulletin; Nanjing Water Authority: Nanjing, China, 2015. Available online: http://shuiwu.nanjing.gov.cn (accessed on 11 July 2018).
- Cooper, B.; Crase, L.; Pawsey, N. Best practice pricing principles and the politics of water pricing. Agric. Water Manag. 2014, 145, 92–97. [Google Scholar] [CrossRef]
- Van Dijk, D.; Siber, R.; Brouwer, R.; Logar, I.; Sanadgol, D. Valuing water resources in Switzerland using a hedonic price model. Water Resour. Res. 2016, 52, 3510–3526. [Google Scholar] [CrossRef]
- Ioris, A.A.R. The value of water values: Departing from geography towards an interdisciplinary synthesis. Geogr. Ann. Ser. B Hum. Geogr. 2013, 95, 323–337. [Google Scholar] [CrossRef]
- Donoso, G. Urban water pricing in Chile: Cost recovery, affordability, and water conservation. WIREs Water 2017, 4, e1194. [Google Scholar] [CrossRef]
- Dai, M.; Wang, L.; Wei, X. Spatial difference of water resource carrying capacity of Guangxi using fussy comprehensive evaluation model based on entropy weight method. Res. Soil Water Conserv. 2016, 23, 193–199. (In Chinese) [Google Scholar]
- Molinos-Senante, M.; Donoso, G. Water scarcity and affordability in urban water pricing: A case study of Chile. Util. Policy 2016, 43, 107–116. [Google Scholar] [CrossRef]
- Chica-Olmo, J.; Gonzalez-Gomez, F.; Guardiola, J. Do neighbouring municipalities matter in water pricing? Urban Water J. 2013, 10, 1–9. [Google Scholar] [CrossRef]
- Garcia-Valinas, M.A.; Martinez-Espineira, R.; Gonzalez-Gomez, F. Affordability of residential water tariffs: Alternative measurement and explanatory factors in southern Spain. J. Environ. Manag. 2010, 91, 2696–2706. [Google Scholar] [CrossRef] [PubMed]
Figure 1.
Administrative divisions of Nanjing.
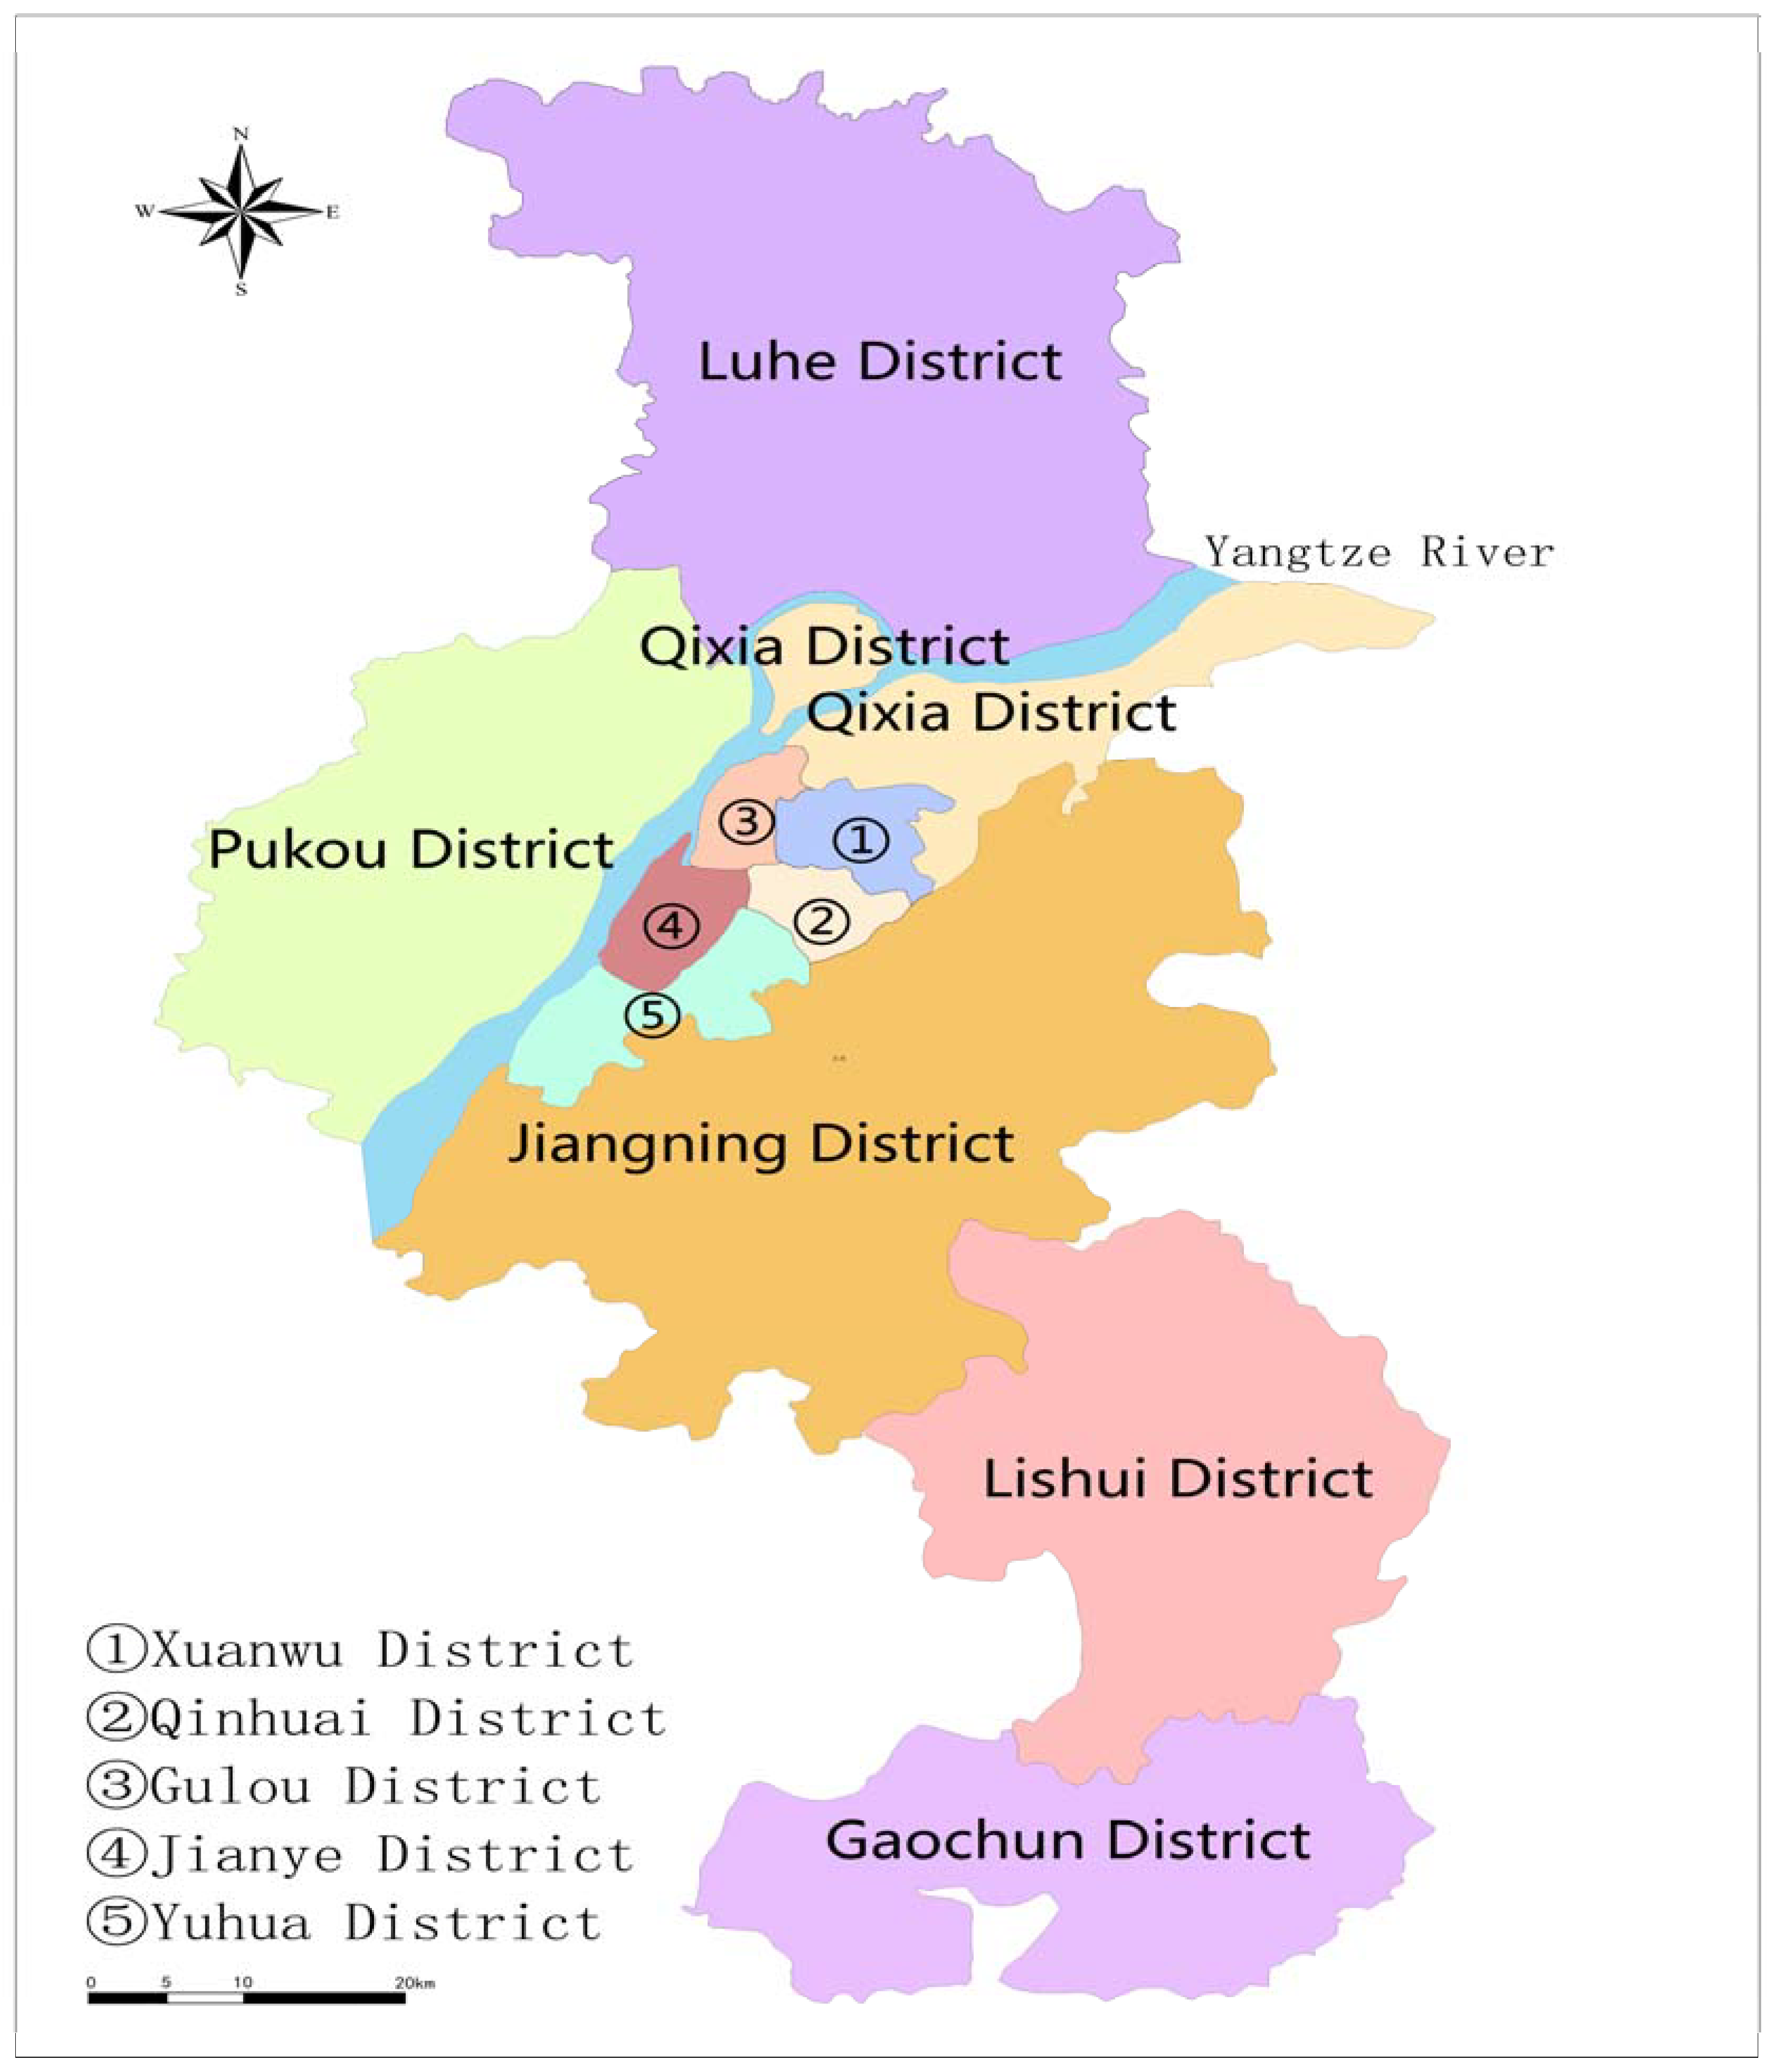
Figure 2.
Water resource prices and per capita disposable income trends 2011–2015.


Table 1.
Water resource value evaluation indices for 2011–2015.
| Evaluating Index | Unit | Definition | Actual Number | |||||
|---|---|---|---|---|---|---|---|---|
| 2015 | 2014 | 2013 | 2012 | 2011 | ||||
| Water Resources Quantity | Total Water Resources | 106 m3 | Characterize regional water resources abundance | 4615 | 3076 | 2372 | 2699 | 3602 |
| Annual Precipitation | mm | Characterize the natural recharge ability of regional water resources | 1443.3 | 1243.7 | 947.9 | 1071.6 | 1087.4 | |
| Transit Water Resources | 109 m3 | Characterize the potential availability of water resources | 920.6 | 898.6 | 791.4 | 1007.9 | 671.5 | |
| Water Consumption Per Unit Area | 103 m3/km2 | Characterize the regional abundance of water resources | 700.6 | 467 | 360.1 | 409.7 | 546.8 | |
| Per Capita Water Resources | m3 | Characterize the status of water resources per capita | 560.35 | 374.38 | 289.7 | 330.72 | 444.2 | |
| Water Resources Quality | Reservoir and Lake Water Quality Compliance Rate | % | Characterize the status of reservoir and lake water quality | 96.8 | 93.5 | 96.7 | 93.3 | 94 |
| Water Function Area Water Quality Compliance Rate | % | Characterize the status of water function area water quality | 58.4 | 68.1 | 62.5 | 53.6 | 44.6 | |
| River Water Quality Compliance Rate | % | Characterize the status of river water quality | 46.7 | 44.1 | 40.2 | 34.4 | 28.1 | |
| Socioeconomic | Per Capita GDP | 103 yuan | Characterize the degree of regional economic development | 118.2 | 107.5 | 98 | 88.5 | 76.7 |
| Unit GDP Water Demand | m3 | Characterize the level of water used for economic development | 41.4 | 47.9 | 52.6 | 60.1 | 76 | |
| Industrial Water Consumption | 106 m3 | Characterize the degree of water used in industrial development | 1091 | 1514 | 1426 | 1368 | 1455 | |
| Residents Living Water Consumption | 106 m3 | Characterize the level of water used in social life | 856 | 920 | 864 | 915 | 1062 | |
| Farmland Irrigation Water Consumption | 106 m3 | Characterize the extent of water use in agricultural development | 1458 | 1272 | 1437 | 1532 | 1861 | |
Table 2.
Evaluation standard and index weight of water resource valuation.
| Evaluating Index | Unit | Character | Evaluation Standard | Index Weight | |||||
|---|---|---|---|---|---|---|---|---|---|
| High | Relatively High | Common | Relatively Low | Low | |||||
| Water Resources Quantity | Total Water Resources | 106 m3 | - | 3000 | 4000 | 5000 | 6000 | 7000 | 0.0794 |
| Annual Precipitation | mm | - | 500 | 800 | 1100 | 1400 | 1700 | 0.0766 | |
| Transit Water Resources | 106 m3 | - | 200 | 400 | 600 | 800 | 1000 | 0.0710 | |
| Water Consumption Per Unit Area | 103 m3/km2 | - | 400 | 600 | 800 | 1000 | 1200 | 0.0794 | |
| Per Capita Water Resources | m3 | - | 400 | 800 | 1200 | 1600 | 2000 | 0.0791 | |
| Water Resources Quality | Reservoir and Lake Water Quality Compliance Rate | % | + | 100 | 80 | 60 | 40 | 20 | 0.0880 |
| Water Function Area Water Quality Compliance Rate | % | + | 100 | 80 | 60 | 40 | 20 | 0.0709 | |
| River Water Quality Compliance Rate | % | + | 100 | 80 | 60 | 40 | 20 | 0.0715 | |
| Socioeconomic | Per Capita GDP | 103 yuan | + | 140 | 110 | 80 | 50 | 20 | 0.0729 |
| Unit GDP Water Demand | m3 | + | 60 | 50 | 40 | 30 | 20 | 0.0777 | |
| Industrial Water Consumption | 106 m3 | + | 2500 | 2000 | 1500 | 1000 | 500 | 0.0683 | |
| Residents Living Water Consumption | 106 m3 | + | 1200 | 1000 | 800 | 600 | 400 | 0.0893 | |
| Farmland Irrigation Water Consumption | 106 m3 | + | 2500 | 2000 | 1500 | 1000 | 500 | 0.0759 | |
Table 3.
Calculation of water resource price in Nanjing.
| Factor | Unit | 2011 | 2012 | 2013 | 2014 | 2015 |
|---|---|---|---|---|---|---|
| Residential Water Price | yuan/m3 | 2.8 | 3.1 | 3.1 | 3.1 | 3.1 |
| Residents' per capita Disposable Income | yuan | 32,200 | 36,322 | 39,881 | 42,568 | 46,104 |
| Per Capita Water Consumption | m3 | 130.94 | 112.1 | 105.55 | 111.95 | 103.89 |
| Index of Water Rate Affordability | % | 3% | 3% | 3% | 3% | 3% |
| Water Supply Costs and Profits | yuan/m3 | 0.6 | 0.68 | 0.68 | 0.68 | 0.68 |
| Sewage Treatment Fees | yuan/m3 | 1.3 | 1.42 | 1.42 | 1.42 | 1.42 |
| Taxes Fees | yuan/m3 | 0.26 | 0.26 | 0.26 | 0.26 | 0.26 |
| Water Resource Price | yuan/m3 | 3.43 | 4.75 | 5.88 | 5.81 | 5.94 |
© 2018 by the authors. Licensee MDPI, Basel, Switzerland. This article is an open access article distributed under the terms and conditions of the Creative Commons Attribution (CC BY) license (http://creativecommons.org/licenses/by/4.0/).
Share and Cite
MDPI and ACS Style
Jia, Y.; Shen, J.; Wang, H. Calculation of Water Resource Value in Nanjing Based on a Fuzzy Mathematical Model. Water 2018, 10, 920. https://doi.org/10.3390/w10070920
AMA Style
Jia Y, Shen J, Wang H. Calculation of Water Resource Value in Nanjing Based on a Fuzzy Mathematical Model. Water. 2018; 10(7):920. https://doi.org/10.3390/w10070920
Chicago/Turabian StyleJia, Yizhen, Juqin Shen, and Han Wang. 2018. "Calculation of Water Resource Value in Nanjing Based on a Fuzzy Mathematical Model" Water 10, no. 7: 920. https://doi.org/10.3390/w10070920
Note that from the first issue of 2016, this journal uses article numbers instead of page numbers. See further details here.