An Index-Based Approach to Assess the Water Availability for Irrigated Agriculture in Sub-Saharan Africa
by
 , and
, and
Nizar Abou Zaki
1,*, 
Ali Torabi Haghighi
1,
Pekka M. Rossi
1,
Stefanos Xenarios
2 and
Bjørn Kløve
1 1
Water Resources and Environmental Engineering Research Unit, University of Oulu, 90570 Oulu, Finland
2
Graduate School of Public Policy, Nazarbayev University, Astana 01000038, Kazakhstan
*
Author to whom correspondence should be addressed.
Water 2018, 10(7), 896; https://doi.org/10.3390/w10070896
Submission received: 21 May 2018
/
Revised: 23 June 2018
/
Accepted: 2 July 2018
/
Published: 5 July 2018
(This article belongs to the Special Issue Sustainable Water Management in Agriculture under Global Change)
Abstract
:Agriculture is a major economic sector in sub-Saharan African (SSA) countries, where it contributes 32 percent of the gross domestic product (GDP) and employs 65 percent of the population. However, SSA countries are farming only a small percentage of their potential cultivable area and are using only a fraction of their renewable water resources. Moreover, despite the importance of land and water resources in SSA, especially in rural areas, there has been little research on their potential. In this study, an index was developed to assess the potential for agriculture, considering renewable water availability of both surface water and groundwater. The index-based approach was then used to assess the potential increase in arable land area in 15 selected SSA countries. The selected countries were classified using the index, based on the availability of renewable water resources nationwide. We also assessed the future water demand by employing three scenarios and combining different rain-fed and irrigated options. The results show that, except for Zimbabwe, the current available surface water or groundwater resources could be sufficient to farm all of the potential cultivable areas in the selected countries when both rain-fed and irrigated systems are fully operational. The findings also indicate that targeted infrastructure projects (e.g., reservoirs, channels), crop management, and water saving techniques could improve surface and groundwater availability in the SSA region.
1. Introduction
Sub-Saharan Africa (SSA) is rich in renewable water resources with a high potential for agriculture, which already contributes 32 percent of the total gross domestic product (GDP) and employs 65 percent of the labor force [1]. A relatively small proportion of the cultivable land area in SSA is farmed, in some cases, less than 10 percent of the potential cultivable area [2]. Currently, SSA countries use only 5% of their available water resources [3], while most of the agricultural plots are small-scale, family-owned farms using simple farming methods [4,5]. Rain-fed agriculture is applied to more than 95 percent of the total cultivated area [6], limiting farming potentials to the wet (rainy) seasons. To some extent, water is stored in pits, shallow wells, and small reservoirs, to be used later in the dry season [7]. Large-scale irrigation projects are increasing the recent years in SSA countries, mainly through foreign investments, yet to a limited extent [8]. These irrigation projects use direct surface water, withdrawing from lakes and rivers, or groundwater from either boreholes or deep wells [9,10].
The agriculture sector in SSA has not changed much in the past century [11]. Even with the introduction of large-scale farming and machinery, most farming in rural areas is still carried out using traditional methods [12]. The resource usage and production efficiency in small family-owned farms are comparatively low, and the infrastructure in rural areas is either basic or lacking [13]. A lack of management in the infrastructure sector can lead to the investment of time and energy to access faraway water resources, while leaving nearby available resources unexploited [14]. As the spread of the irrigated area is mostly affected by the lack of infrastructure projects, the development of the agriculture sector as a whole is directly related to the availability of the facilities provided by the local government [15].
Dryland regions play a significant role in SSA agriculture, making up to 43 percent of the land surface, including 75 percent of the arable land, and is inhabited by 50 percent of the total population [16]. Most of the communities in the SSA dry lands are rural and depend directly on farming and herding. The governments and development communities are taking on the challenges of enhancing the water management policies in dryland societies. The present surface and groundwater resources in the drylands can be located away from the populated areas, making them both undeveloped and underused. The fully irrigated agriculture is a recent practice in the drylands regions, where the internal surface and groundwater renewable water resources withdrawal and the agricultural development rates are the lowest [17]. Farmers also lack the tools to face irregular rainfall and soil moisture risk, directly affecting the crop yields in small households’ farms [18]. Simple practices designed to conserve rainfall while improving the agricultural water management practices can reduce the vulnerability and strengthen the coping capacity.
In SSA, there are many complex and inter-related issues that contribute to the lack of investments and progress of the agricultural sector, especially the rain-fed production [19]. Investments in SSA smallholder farms still need improvements in strategies, policies, market access, infrastructure, and institutions [20]. The aim of this study is to develop an index for classifying SSA countries based on their renewable water and arable land resources availability. The availability of water resources is then compared with the water demand needed to increase the cultivated areas. It needs to be mentioned that this study only assesses the renewable water resources availability to sustainably cover the increased agricultural water demand, by setting aside the other agricultural factors that also constrain the sector. The main hypotheses are that this index can theoretically map potential agricultural development by considering water supply as a key aspect to enable the expansion of farming in SSA
2. Materials and Study Sites
2.1. Data
The land and water data that are used in this study were taken from the database and the reports of the Food and Agriculture Organization (FAO). The FAO reports list the current farmed and potential cultivable areas in each country in SSA, with cultivable areas being defined as areas that can be directly farmed based on their physical characteristics. The renewable surface and groundwater resources quantities in the FAO reports are based on calculations and data provided by the different institutions responsible for water resources management in the different countries. The data used in this study to identify the groundwater exploitation costs are based on the results from the ‘Groundwater in SSA: Implications for Food Security and Livelihoods’ project, funded by the Rockefeller Foundation and carried out by the International Water Management Institute (IMWI) [21].
2.2. Study Region Characteristics
SSA covers an area of 22 million square kilometers, with a population of 1.1 billion, divided between 43 countries [22]. Based on the renewable surface and groundwater data available, and similarities in the geography and agricultural development situation, especially in rural areas, 15 out of the 43 countries, in Western and Eastern regions, were selected for analysis. The Western region countries include Benin, Burkina Faso, Ghana, Mali, Niger, Nigeria, and Togo, while those in the Eastern region include Ethiopia, Kenya, Malawi, Mozambique, Tanzania, Uganda, Zambia, and Zimbabwe. The selected countries represent a range of climate conditions, land use, water resources availability, and economic development (Table 1). Together, these countries cover approximately 45 percent of the total SSA area, which is divided into four main hydrogeological environments, Precambrian basement rock, volcanic rock, unconsolidated sediment, and consolidated sediment [23]. Precambrian basement rock is the most common environment, covering 40 percent of the total area [17]. The groundwater yield in the selected countries varies from, on average, 1.5 m3 per hour in Nigeria, to 25 m3 per hour in Ghana [18], and the region includes eight main river basins (in descending basin area order), namely, the Congo, Nile, Lake Chad, Niger, Zambezi, Senegal, Limpopo, and Volta [24]. These basins contain 27 major dams, with a capacity of 234 km3 in the Western region countries and 27 km3 in the Eastern region countries [25]. Based on AQUASTAT reports [26], the Western SSA countries have an average mean annual precipitation of 1356 mm (water volume 2873 km3), while the Eastern countries have an average mean annual precipitation of 920 mm (water volume 2665 km3).
The contribution of agriculture to the economy varies from 8.5 percent in Zambia to 41 percent in Togo (World Bank, 2013). More than 50 percent of the population work in agriculture, except in Nigeria (25 percent) and Benin (44 percent) [27]. About 86 percent of the withdrawn water is consumed by agriculture (Table 2), which is higher than the global average of 70 percent [28,29]. As a result of less precipitation volume, the long dry season, and the high evapotranspiration rate, the irrigation water demand is higher in the arid zone [30]. The Eastern SSA region has higher total water consumption (14.2 million (M) m3) than the Western region (12.3 Mm3). The Western SSA countries have 5-fold higher industrial water consumption than the Eastern countries, because of the greater amount of industry in the former [25]. Water consumption by agriculture is higher in the Eastern region, with its lower precipitation rate. Mali has the highest agricultural water demand, mostly because of the long dry season in that country, while Benin and Togo have the lowest water demand, as these countries have one of the highest precipitation rates in Africa [28,29]. Nigeria, with a significant industrial sector, has the highest industrial water consumption. Burkina Faso and Togo have the lowest industrial demand, as most of their population is involved in agricultural activities [22,31,32]. The average water consumption per capita gives a better image of average annual water consumption. Because of low precipitation rates, Mali, Niger, and Zimbabwe have the highest irrigation water consumption per hectare.
On average, in SSA, 75 percent of the water withdrawal is used in the agriculture sector [33]. Most farming activities in SSA countries are rain-fed, although the equipped irrigated area is continually increasing [19]. For rain-fed agriculture, other than depending on direct rainfall for water supply, there are rainwater catchment harvesting systems designed to collect runoff water [7]. These catchment systems are divided into two types, micro and macro, depending on size and volume. Micro rainwater harvesting techniques are the most common overall. These are a few cubic meters in volume and are particularly common in Burkina Faso, Mali, Niger, Tanzania, Kenya, Uganda, and Ethiopia [34]. The most common macro catchment techniques used are open ponds, cisterns, and dams, and they vary in volume from 50 m3 ponds to dams containing millions of cubic meters [7].
Irrigation in SSA was historically associated with the irrigation plains of large rivers like the Niger, Senegal, and Nile, where the governments developed the first irrigation schemes [35]. Since the 1980s, the irrigation sector has been constantly expanding, with the use of powered pumps for the extraction of groundwater. These irrigation projects enable agricultural production in dry countries and increase its intensity in humid countries [36]. Equipped irrigation is the most widely used form of water management in the SSA region, accounting for 87 percent of the managed areas and covering 13.4 million hectares [25]. Irrigated areas occupy, on average, six percent of the total cultivated area in SSA, which is lower than the proportion in Asia (38 percent) or America (12 percent) [25]. In the Western region of SSA, 360,000 hectares are irrigated, which represents approximately one percent of the total cultivated area [37]. The proportion is higher in the Eastern region, where two percent of the cultivated area is irrigated, and representing two percent of the total farmed zone [25]. Cereals are the largest harvested irrigated crop in terms of area, occupying 45 percent of the total irrigated area, followed by industrial crops, such as sugar, beets, and cotton (15 percent); irrigated forage crops (14 percent); and vegetables (12 percent) [26]. The irrigation demand is proportional to the precipitation and evapotranspiration rate in each country. Higher evapotranspiration especially in the dry season requires a higher irrigation volume. Irrigation consumption varies from 3000 m3 per hectare annually in Ghana, to over 9000 m3 annually in arid Niger [28,29]. The high-water consumption rate affects the percentage of the irrigated area. In some arid countries, such as Mali and Niger, agriculture may be possible only with irrigation projects, which may significantly add up to the overall expenditures. In the countries where the water demand per hectare is the highest (Mali, Niger, Ethiopia, and Tanzania), the agriculture sector consumes the highest percentage of water (Table 2).
The limiting nutrients of SSA soil might be the main constraint for increasing the cultivated areas in some countries. Low crop yields in Tanzania, Kenya, and Uganda, for example, can be directly related to poor soil fertility [38]. Zinc deficiency is very common in Western SSA countries, directly affecting the wheat, maize, and sunflower crops agriculture [39], while phosphorus is low in tropical soils because of the low pH rate [40]. Generally, Western SSA countries are characterized by low fertility soil, including calcium, magnesium, and potassium deficiency [41]. Similarly, the Eastern countries’ soil have deficiency in nitrogen, potassium, and phosphorus [42]. In an attempt to refine the soil quality, organic and inorganic fertilizers are used, especially in small farms. The inorganic fertilizers are in the form of ammonium nitrate, urea, rock phosphate, and potassium sulfate [43]. Still, the average fertilizer consumption per hectare in SSA, 18 kg/ha, is considered lower when compared with other regions of the world [44]. Table 3 shows the crop type percentage of the total irrigated area in the study zone.
3. Methods
3.1. Country Classification Framework
The renewable water resources are divided into surface and groundwater. In the case where the agricultural water demand is appreciably less in volume than the renewability rate, water usage is considered sustainable.
In order to develop an index for assessing the potential for future agriculture, a variable named the new agricultural water demand (NWD) is defined. This variable includes the sum of irrigation water demand (IWD) and current agricultural water withdrawal (CWD), as follows:
NWD = IWD + CWD
The irrigation water demand (IWD) is the increased water consumption volume needed to increase the farmed area, including both irrigated and rain-fed areas. The current agricultural water withdrawal (CWD) is the present water consumption in each country. To compare the new water demand (NWD) and the available renewable surface water (RSW) and groundwater resources (RGW) in each country, an index (Table 4) was used to classify the selected countries based on the available renewable resources and calculated increase. The renewable surface water (RSW) and groundwater resources (RGW) in each country are estimated based on the FAO data available. In this comparison, the countries were allocated to one of six classes (I–VI), defined based on the available water resources and cultivable area for development (Table 4). In the classification, NWD was also compared to both RSW and RGW, to assess the availability of each source compared to the demand. In the countries belonging to class I (the best conditions for development), all potential cultivable area can be farmed using either of the two water resources (RSW and RGW), as NWD is lower than both of the sources. On the other end, in class VI (the worst possible conditions), the current water demand (CWD) is already higher than both of the renewable water resources (RSW and RGW). The class VI countries are thus in an unsustainable condition with regards to water resources, and reforms are needed to balance the current demand and renewal ratio. The other classes (II, III, IV, and V) represent sustainable conditions, with RSW, RGW, or their sum being greater than NWD.
3.2. Agriculture Development Scenarios
For the analysis, the farmed area in the selected countries was divided between rain-fed and irrigated areas. The percentage area of each varies between climate zones, depending on the amount of precipitation. We consider that increasing the potential cultivable area is possible by increasing the rain-fed, irrigated, or combined rain-fed irrigated area. Different farming irrigation methods have different water consumption and production rates. This study assumed a variation of water consumption, depending on the different irrigation schemes developed. For the ease of the analysis, we clustered two main categories of irrigated and rain-fed farming schemes. We then considered the total cultivable area (ATotal), as follows:
where ARF is the current rain-fed cultivated area, AIR the current irrigated cultivated area, and APC is the potential cultivable area. The potential cultivable area can be increased by increasing the irrigated or rain-fed area with different water consumption rates (Figure 1).
ATotal = ARF + AIR + APC
Three different agricultural development scenarios are developed to assess the potential of each country to sufficiently cover the agricultural water demand nationwide. The scenarios are based on the water demand of different irrigation schemes, verity in total water consumption, and assuming that the potential cultivable area may be expanded by either rain-fed, irrigated, or combined water supply systems.
ATotal is divided between the new rain-fed (NARF) and new irrigated (NAIR) area in each scenario. NARF and NAIR varied by the area between the three different scenarios, depending on the irrigation methods used to farm the cultivable area. The three scenarios are as follows:
Scenario 1
All of the total potential cultivable area APC in a country is equipped for irrigated agriculture. In this scenario, the current rain-fed farmed area will remain unchanged, and thus, is as follows:
NAIR = APC
ATotal = ARF + NAIR
Scenario 2
The total potential cultivable area is partly irrigated (B ratio), and partly left rain-fed (A ratio). The ratios of (A) and (B) are calculated from the currently irrigated and rain-fed area ratios, as sourced in the FAO database [26]. We considered that the current farming methods in each country have been expanded proportionally to cover the total potential area.
NAIR = (A) × APC
NARF = (B) × APC
ATotal = ARF + AIR + NAIR + NARF
Scenario 3
The total potential cultivable area is farmed using only rain-fed agriculture. The current irrigated area then remains unchanged, as follows:
NARF = APC
ATotal = NARF + AIR
The new water demand for each scenario is calculated, as follows:
where NWD is the new water demand for irrigation (m3), CWD is the current water demand (m3), CWDIR is the current water demand for irrigation (m3), RFWD is the mean annual water depth required for one rain-fed hectare (m), IRGWD is the mean annual water depth required for one irrigated hectare (m), AIR is the current irrigated area, and ARF is the current rain-fed area.
NWD = CWD + (RFWD) × (NARF) + (IRGWD) × (NAIR)
4. Results
4.1. Current Status of Agriculture and Renewable Water Resources
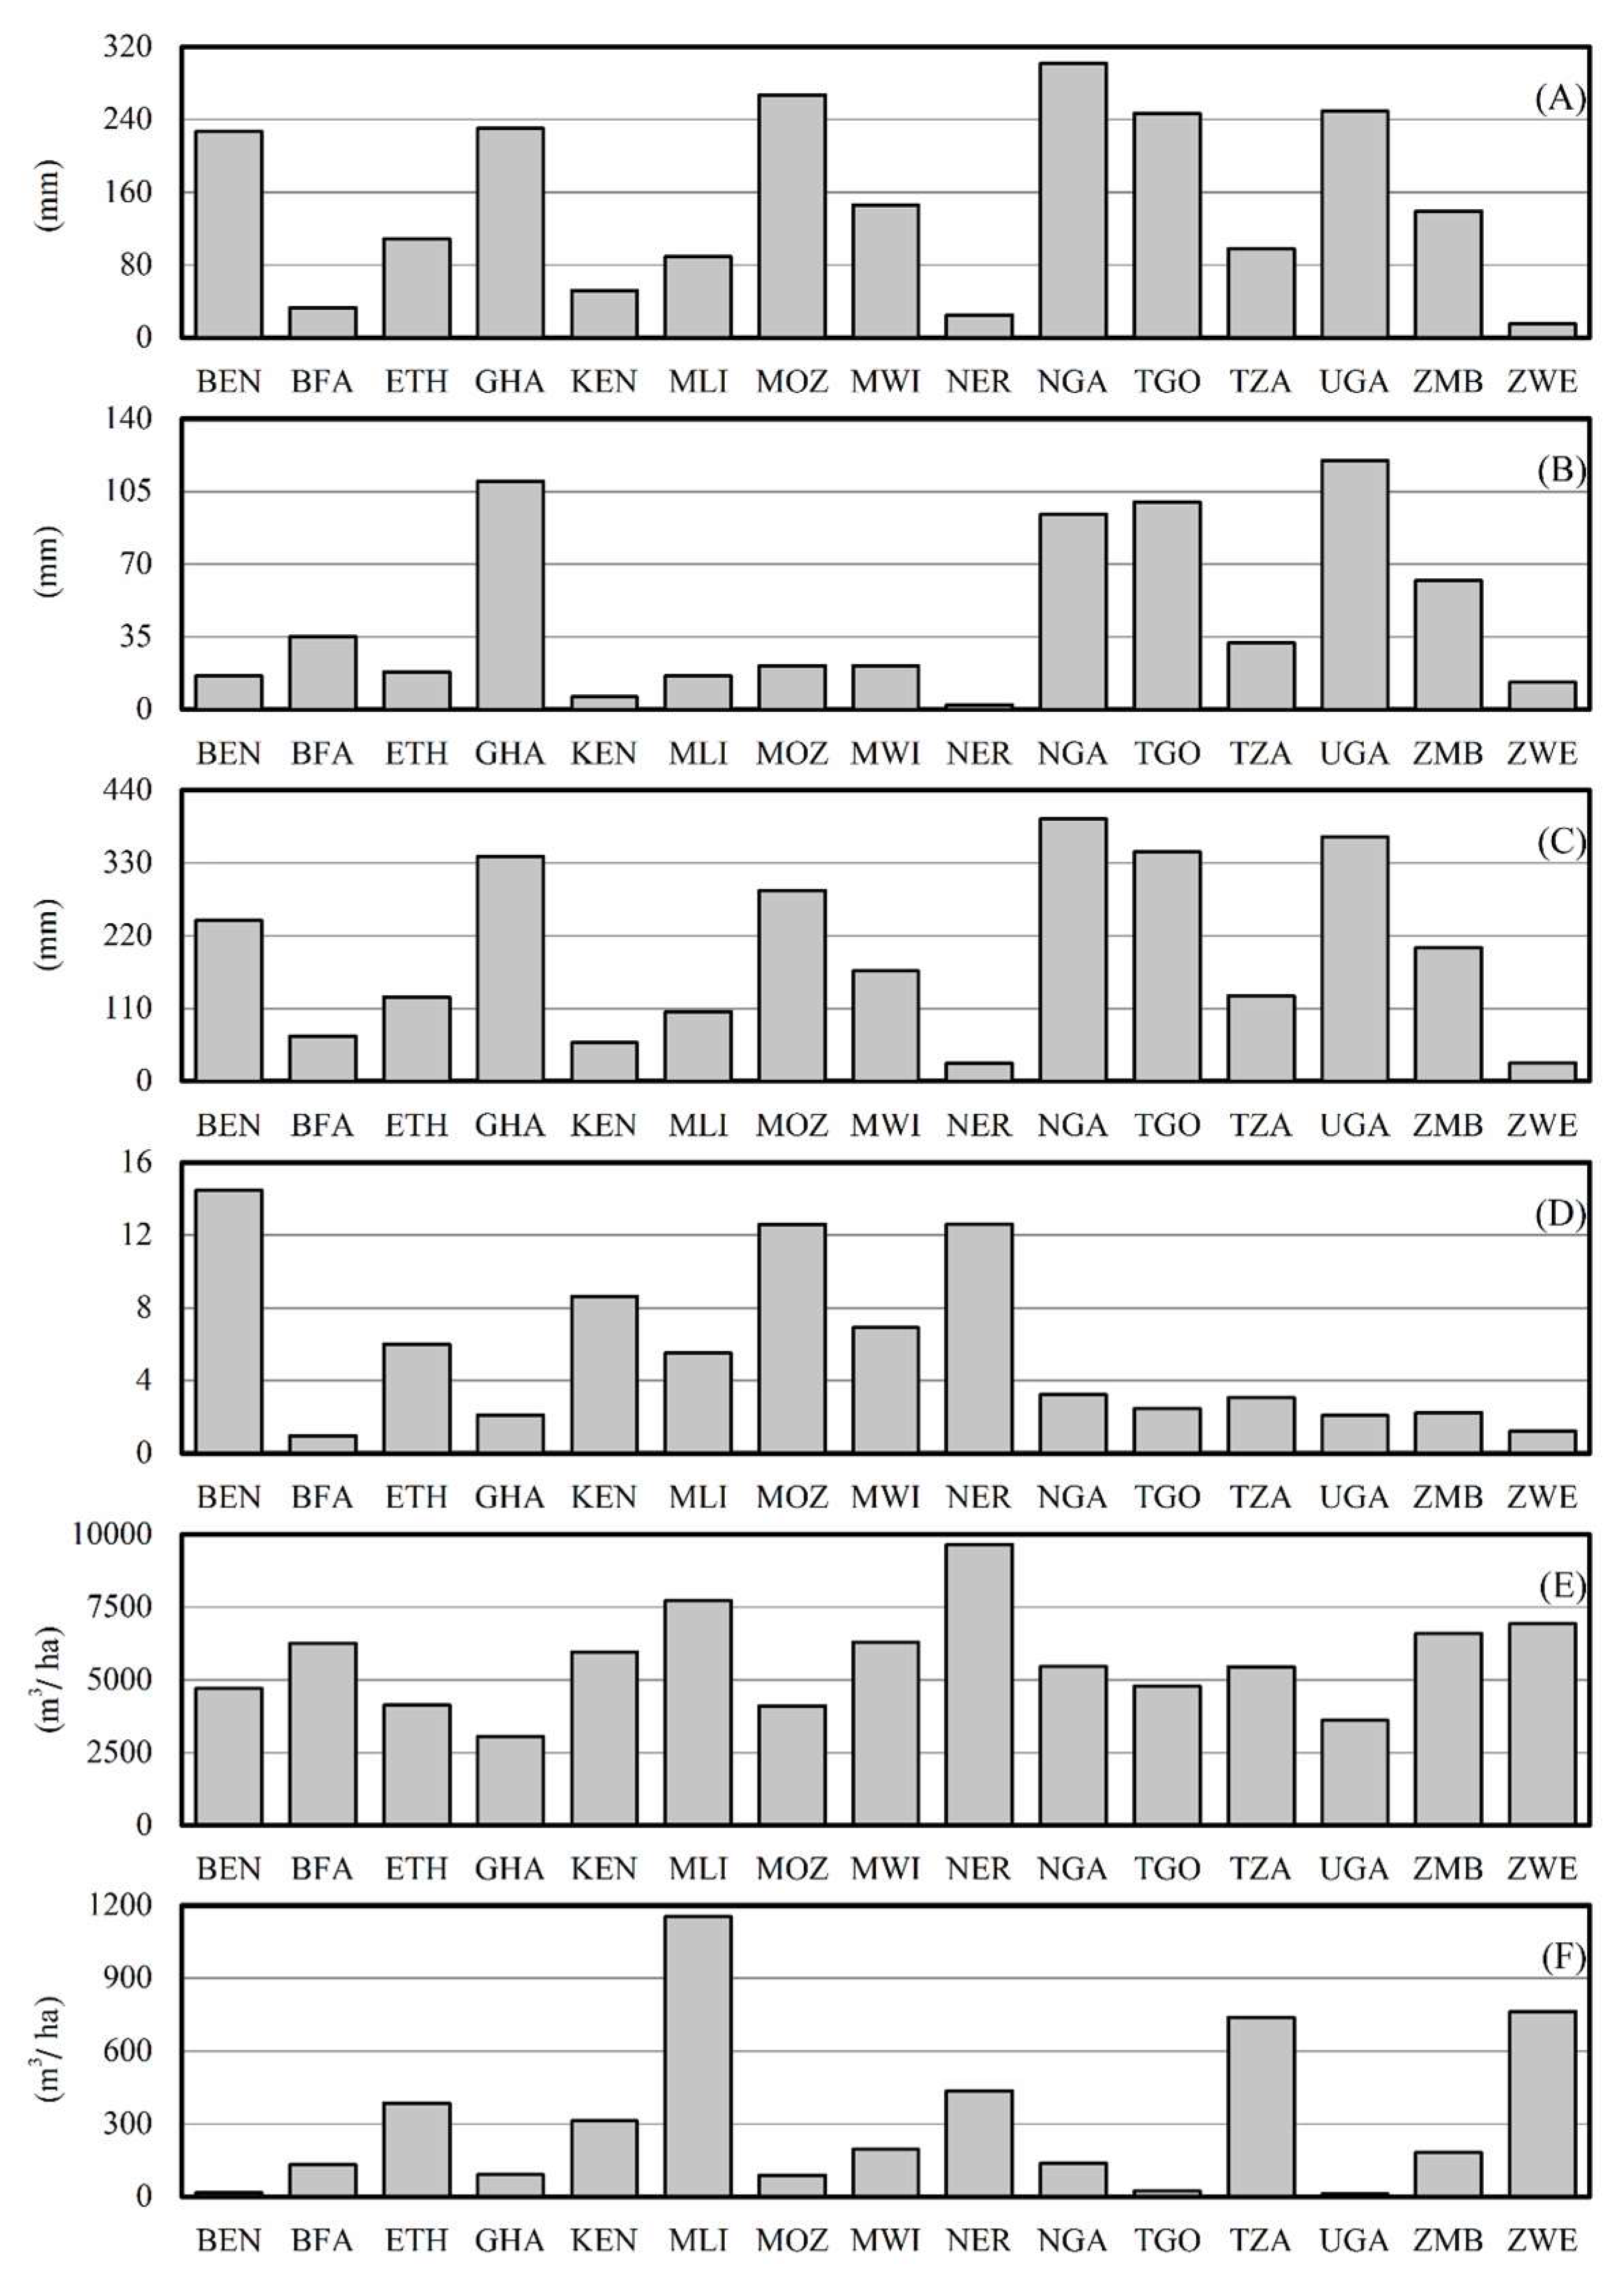
The renewable accumulated surface water and groundwater resources varied from 28 mm in Zimbabwe to 396 mm in Nigeria, indicating the availability of renewable water resources in SSA countries on a large scale. Farming the potential cultivable area in each country would increase the agricultural water demand. Figure 2 shows the surface water and groundwater depths as the amount of renewable water resources proportional to the country’s area annually. Nigeria has the highest mean available depth of renewable surface water and Uganda the highest mean available depth of groundwater. The renewable surface water per groundwater ratio shows the variation in the availability of these renewable resources. Lower ratio values, as in Burkina Faso, Zimbabwe, Uganda, and Ghana, indicate similar water and groundwater renewable volumes and a lower dependency on one resource. Benin, Niger, and Mozambique have a higher dependency on surface water resources, which can limit future groundwater resource use. Higher ratio values, as in Ghana, Mozambique, Nigeria, and Uganda, indicate a higher availability of renewable resources per country’s area. The irrigated hectare water demand, IRGWD, and the irrigation supplement water, RFISW (the volume of water used in rain-fed agriculture other than direct rainfall), used per hectare are the annual national average. Both the irrigated and rain-fed water demand are directly proportional to the amount of precipitation in each country. The IRGWD amount varied from 3000 m3/ha annually in Ghana to a little less than 10000 m3/ha annually in Niger, for irrigated hectares. The RFISW amount varied from less than 100 m3/ha annually in Uganda, Togo, Mozambique, Ghana, and Benin, to more than 1000 m3/ha annually in dry countries like Mali.
4.2. Potential for Agricultural Development
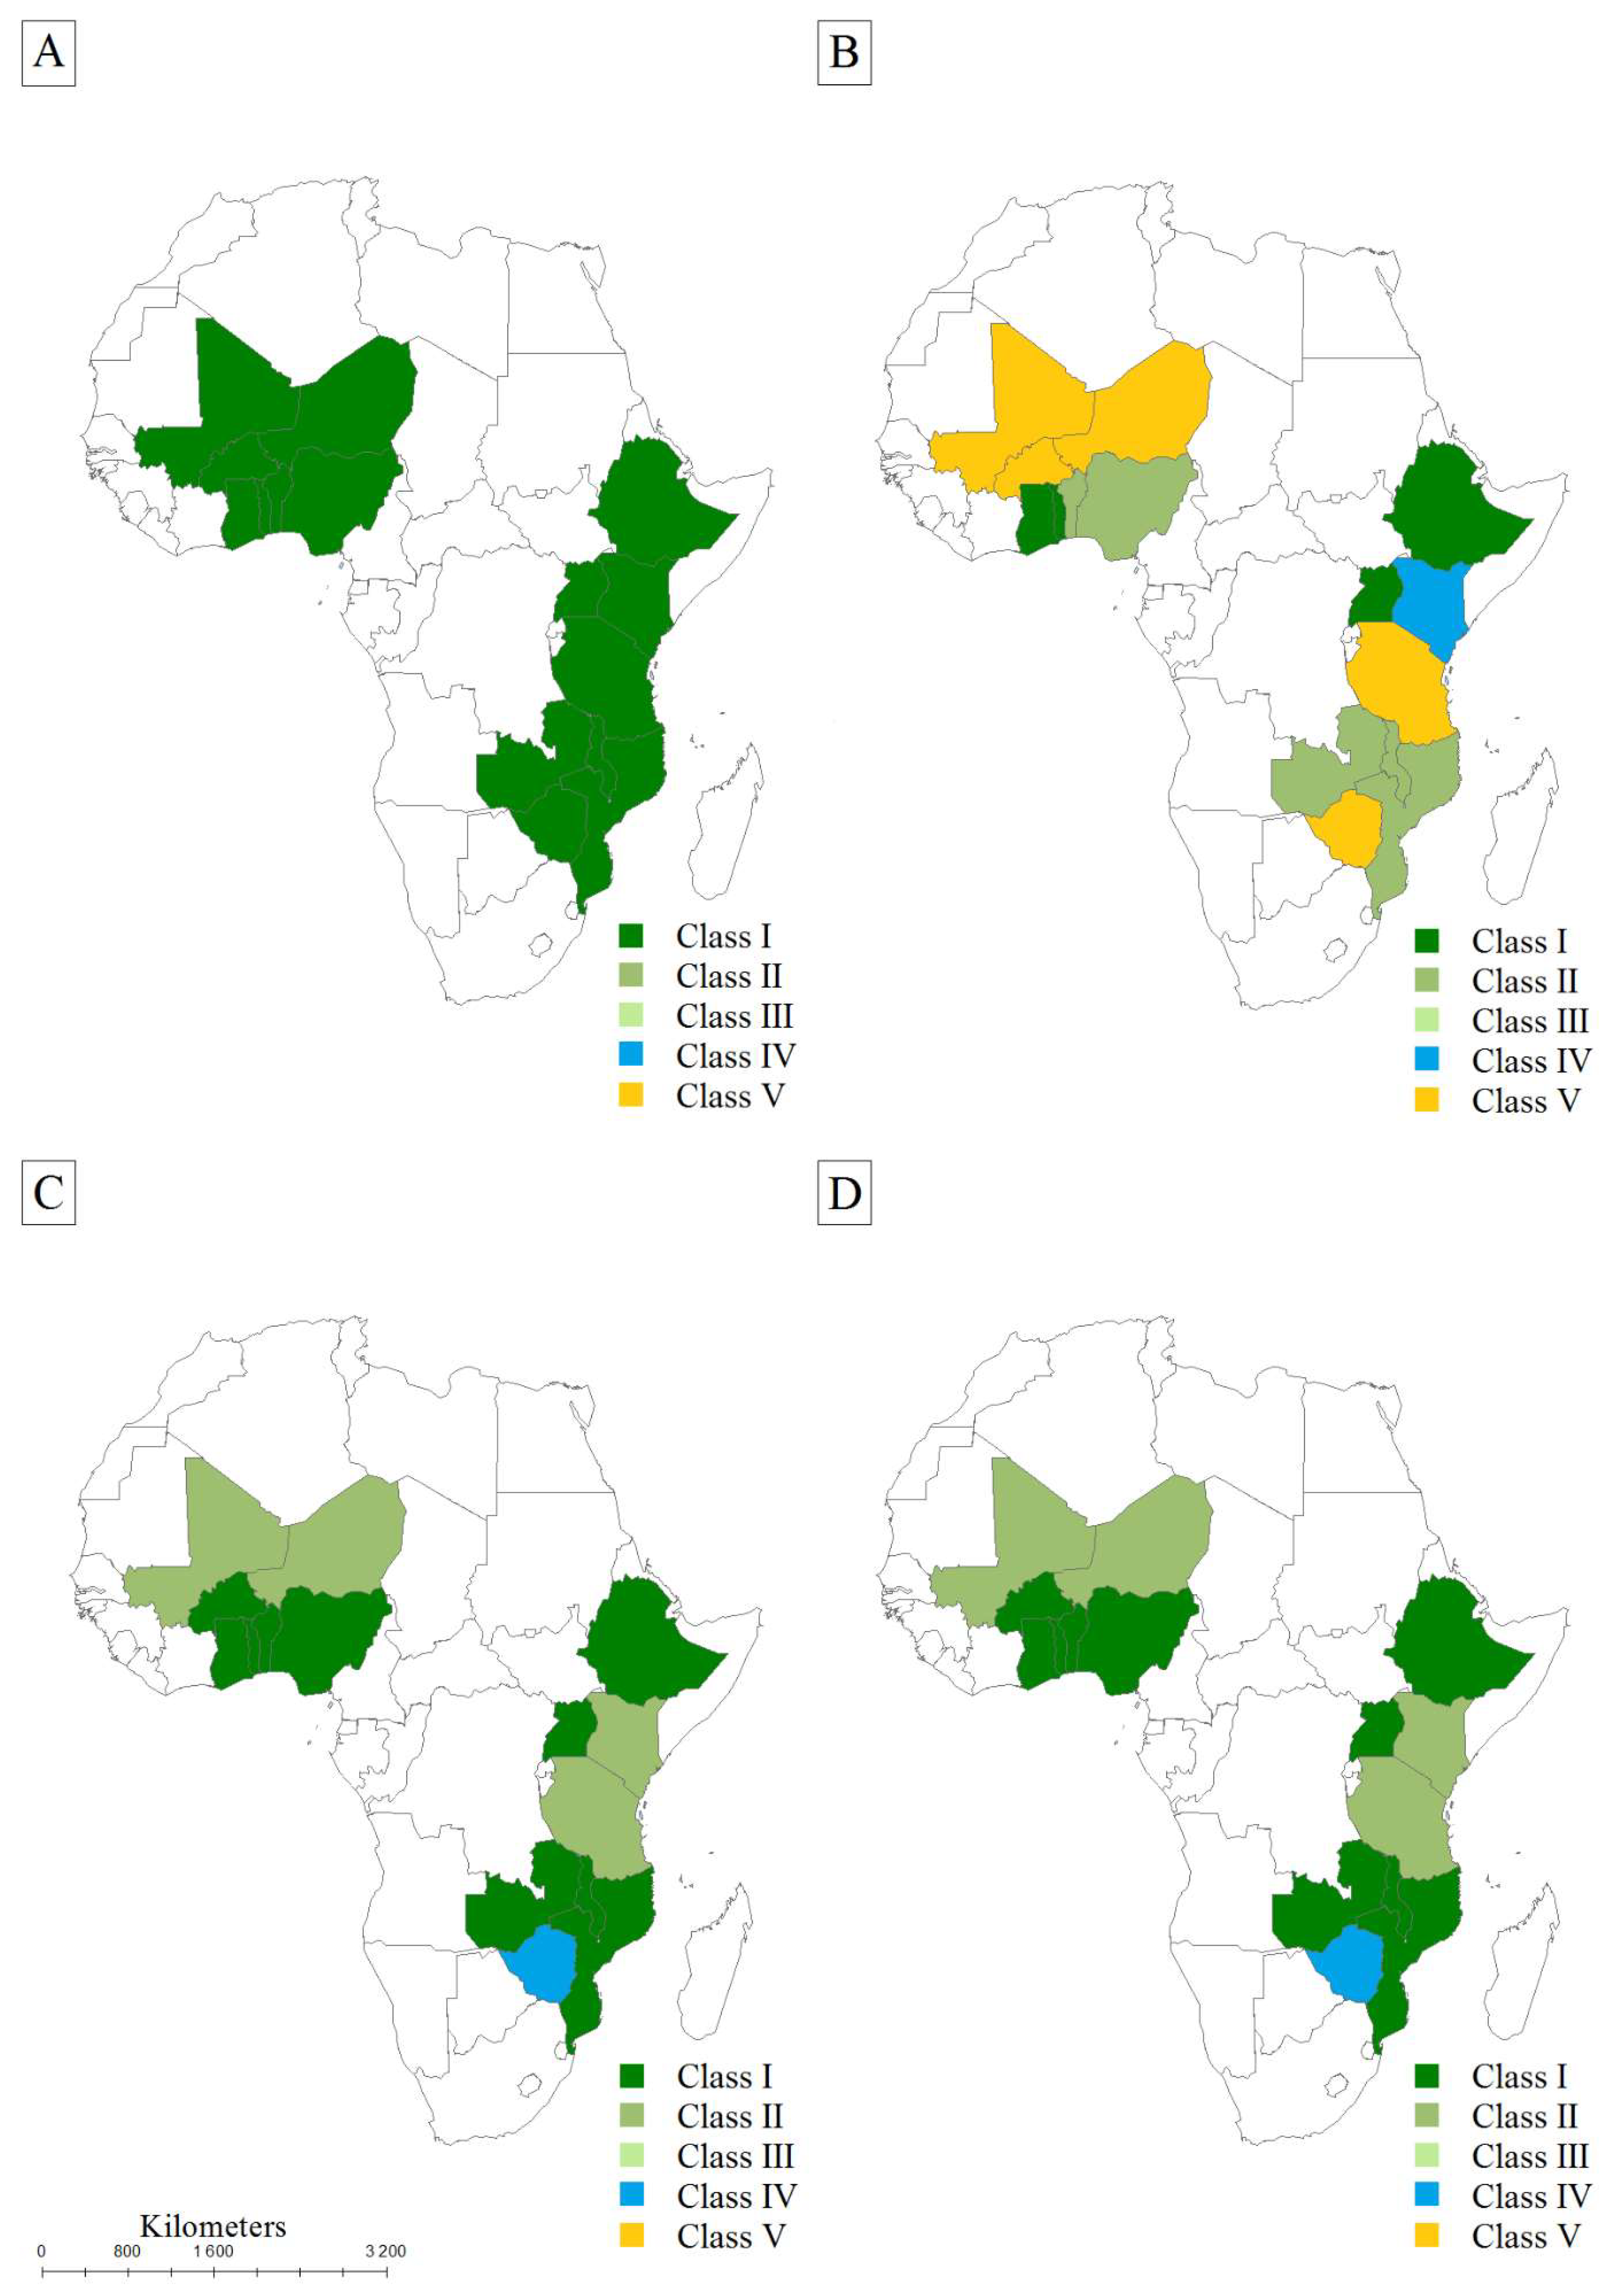
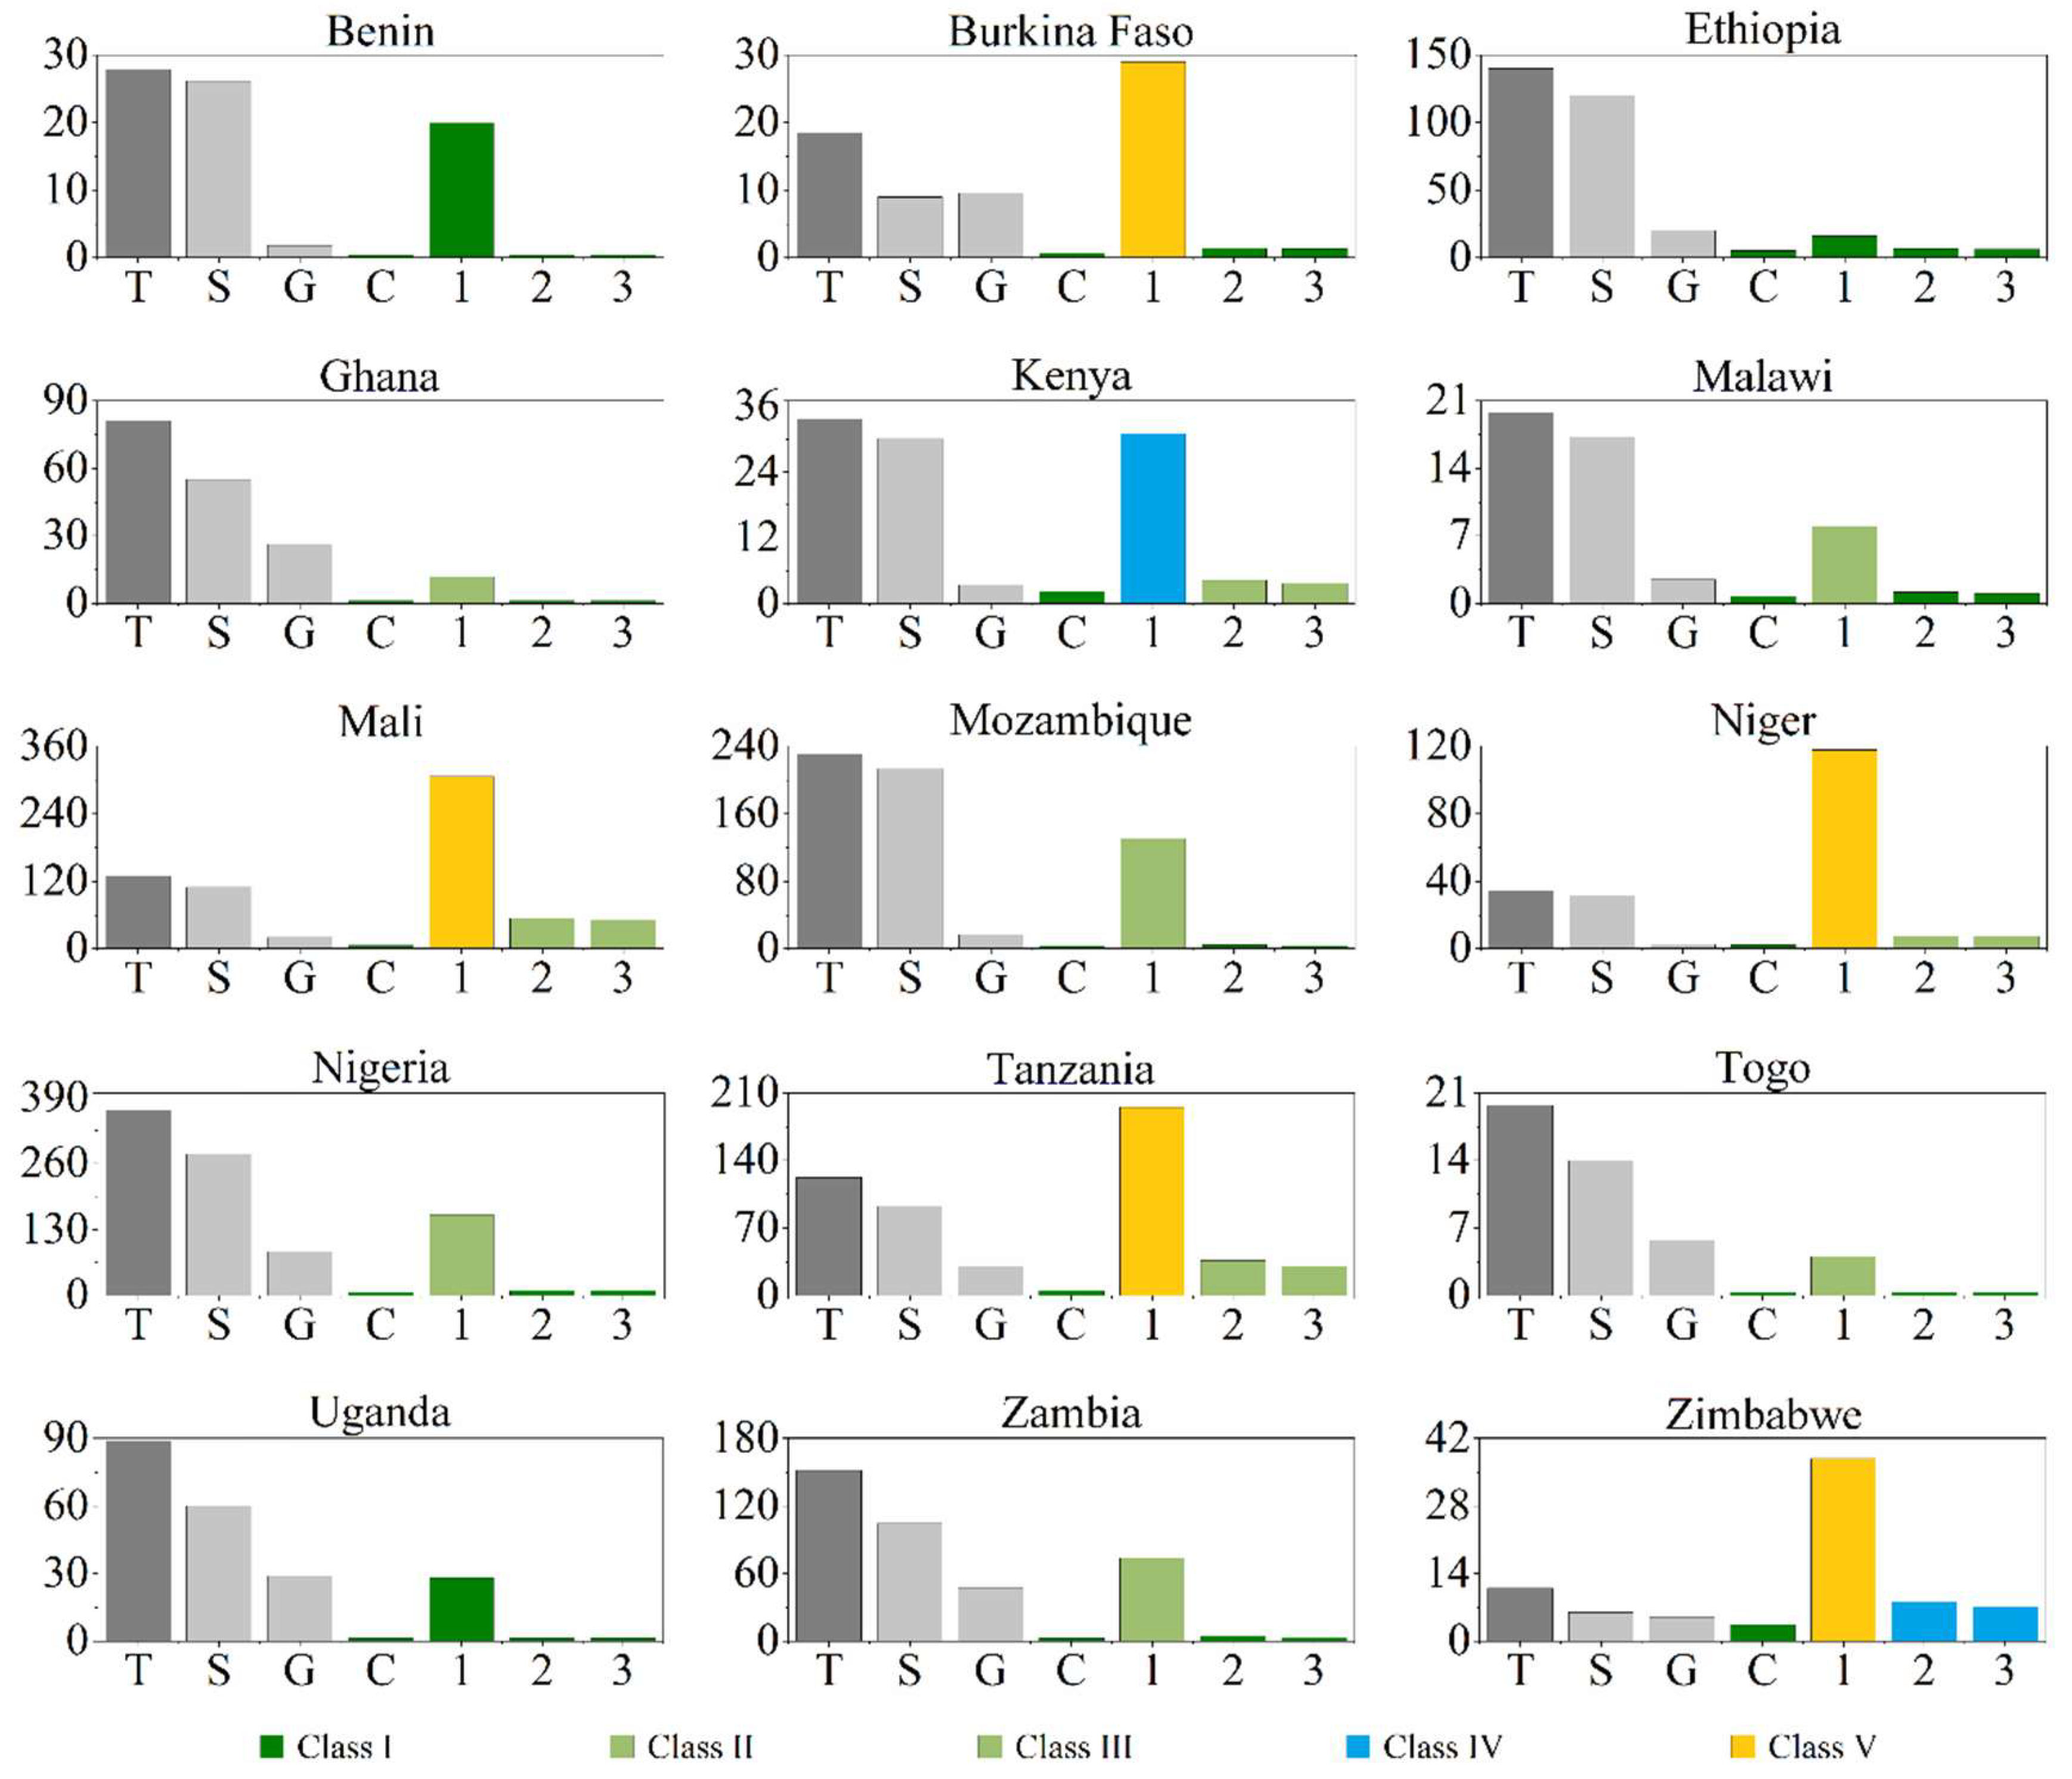
Ethiopia, Ghana, Togo, and Uganda were the only countries that did not have limitations on either of their water resources in any of the three scenarios analyzed. Niger, Mali, Burkina Faso, Tanzania, and Zimbabwe lacked the water resources, of both surface water and groundwater, for fully farming their potential cultivable area using irrigation systems. All countries, except Zimbabwe, had enough renewable resources to increase their potential cultivable area using the current situation, as defined by Scenario 2. Increasing the farmed area using rain-fed irrigation methods (scenario 3) would only set limitations for Zimbabwe, but this could be avoided by using an irrigation scheme based on both of the resources (surface water and groundwater). The calculated new water demand (NWD) for each scenario is shown in Figure 3.
In Scenario 1, Ethiopia, Ghana, Togo, and Uganda had the available surface water or groundwater resources for increased water demand and thus belonged to class I. As the irrigation water demand in other countries varied annually from 3000 to 10,000 m3 ha−1 (Figure 2), the renewable water resources might not be sufficient to meet the demand of farming all of the cultivable area. This was the case in Burkina Faso, Mali, Niger, Tanzania, and Zimbabwe, which belong to class V. These countries can only farm part of the potential area. Kenya, in this scenario, belongs to class IV, as depending on one resource (either surface water or groundwater) would not be sufficient, and in order to increase the farmed area, a mix of both resources would have to be used. Benin, Malawi, Mozambique, Nigeria, and Zambia had limitations on their groundwater resources and thus the increase of cultivated area through groundwater would may lead to the gradual depletion these resources. These countries belong to class II, where the renewable surface water resources are enough to cover the irrigation needs. This scenario depends on large scale irrigation projects developed by the government and farmed by the smallholders. These large public infrastructure projects, supported by investments and legislations, help to conduct reliable irrigation services and to secure water rights. These schemes have been slowing down recently in SSA, as they faced technological and institutional problems that have low returns for the farmers [45]. Large scale irrigation projects are the most suitable in the drylands along the main rivers. As the development cost can be very high, long term commitments from the government and the farms can bring good economic revenue for both sides. Mainly the development schemes must focus on both profitable crops and market access. Long term plans must also be set on providing the infrastructure, maintenance, management plans, and enhancing the farmers’ knowledge.
In Scenario 2, referring to the irrigated area ratio of the total cultivated area (Equation (5)), farming the cultivable area was considered by using the same percentage on a wider scale. In this scenario, all of the countries, except Kenya, Mali, Niger, and Tanzania, could depend on either surface or groundwater renewable resources. These countries belonged to class II, and would overexploit their renewable resources if they had to depend only on groundwater for irrigation. Zimbabwe must depend on both resources (falling into class IV), in this scenario. Here, developing low-cost irrigation projects can increase the hectare yields. Low-cost irrigation has always been popular throughout SSA along the rivers, where water is lifted with basic pump techniques and it irrigates small farms usually on the river’s bank [46]. The introduction of small diesel and electric pumps to increase the exploitation of local surface and groundwater resources, helps in increasing the small irrigation projects. These low-cost pumps and market-oriented products can increase the productivity and the economic revenue of the small hold farmers. Community based small irrigation projects, with external support, can improve the irrigation schemes for many local smaller farms. Taking advantage of the floods’ recession systems and the areas on the river banks can increase the farmed areas and the usage of soil moisture. Small community irrigation plans can perform effectively when partnership occurs between the local farmers and the external agencies that assist with funding and technological support.
In Scenario 3, using rain-fed agriculture for increasing the cultivated area, the water demand was the lowest. In this scenario, all countries, except Mali, had a per hectare demand (RFWD) ranging from 10 to 400 m3/ha annually. This amount of water is the supplement water (RFISW) needed in the dry season. By expanding this irrigation method nationwide, all countries, except Zimbabwe, could meet the water supply demand by using only one water source. Zimbabwe, which belonged to class II in this scenario, could farm the maximum cultivable area by using a combination of the two resources. In SSA, farmers lack the knowledge, skills, and the financial resources to adopt farming development and technological changes. As farming here depends on the direct rainfall, the drought sensitivity can be reduced and the productivity improved by controlling the runoff and concentrating on the soil moisture around the plant roots [7]. Plant pits is one of the techniques used to increase the soil moisture. Crop rotation, soil fertility management, increasing plant water uptake, and pest control are also some techniques used to increase the productivity on rain-fed agriculture. Water harvesting and water management techniques have helped farmers to overcome the drought periods, increase the yield, and provide water for supplementary irrigation.
5. Discussions
There is high likelihood of an increase in the exploitation rate of surface and groundwater resources in SSA. Large aquifer and major river systems in West and East SSA have potentials for expanding the irrigated areas and responding to the upcoming demand. Despite the considerable large renewable water volume, the equipped irrigated areas still represent three percent of the total arable land [47]. The current national plans in SSA aspire to expand the irrigated areas to 11 percent of the total arable areas in the next 50 years [48]. This set target could be attained, given the renewable water resources available. Still, however, more than 90 percent of the food production in SSA comes from rain-fed farming systems [3]. This study represents an attempt to assess the current and future availability of the cultivable area in selected SSA countries, with regards to the current and future capacity of the surface and groundwater resources in each country. The SSA region possesses nine percent of the total global renewable water resources, but, as results indicate (Figure 4A), only a fraction of these resources is currently being used. The potential cultivable areas in each country suggest areas that can be directly farmed, depending on their physical characteristics (Table 1). The analysis revealed that, other than Ethiopia, Ghana, Malawi, and Togo, the selected countries are farming less than half of their available cultivable area. The analysis also showed that the current agricultural water demand is much lower than the amount of renewable surface water and groundwater resources available.
Increasing the cultivable area in each country would increase the exploitation of the surface water, groundwater, or both resources. Apart from in Benin, Burkina Faso, Ghana, Nigeria, and Zimbabwe, most of the irrigation depends on surface water resources (Table 5) [28,29]. The percentage of this irrigation source varies within countries, depending on the availability of the resource and the exploitation cost. Meeting the calculated new water demand (NWD) would require searching for new water resources. The availability of these resources and the cost of exploitation are the most important factors to consider when choosing the most sustainable resources available (Table 5) [21]. Table 5 shows the irrigation dam capacity, the average well excavation cost, and the average well yield in each country. Countries with a high reservoir capacity will depend more on the surface water resources. In countries where the well and borehole cost is lower and the yield is high, increasing the groundwater exploitation will give better economic returns than building new dams. Considering the new water demand (NWD) calculated for the more realistic Scenario 2 (Figure 3), Niger, Mali, Kenya, Tanzania, and Zimbabwe would likely have to depend on surface water resources to meet the increase in the irrigation water demand. Apart from Zimbabwe, these countries have an irrigation dam capacity lower than 1000 Mm3. Zimbabwe has an irrigation reservoir of 4.5 Mm3, one of the highest in Africa, which would supply half of the NWD calculated for Scenario 2. For Benin, Kenya, Malawi, Mali, Niger, and Tanzania, where the irrigation dam capacity is low, considering increasing the groundwater exploitation to meet the NWD is a more plausible option. In Malawi, for example, well construction costs approximately US$ 2700, while the dam capacity is 25 Mm3, which is much lower than the NWD. In Ethiopia, exploiting surface water would be more economical in the current situation, with high costs of well construction (US$ 23,000), and might decrease the groundwater exploitation rate.
The current water consumption (CWD) is very low compared with the amount of renewable water resources available (Figure 3). Except for Zimbabwe, the CWD represents less than six percent of the total renewable resources in the selected countries. The sustainability of the water resources must be maintained when increasing the farmed areas in each country. This will prevent negative impacts on both ecology and society. Our method revealed a satisfactory assessment at a national level, but at the local level there may be issues to be tackled. In Scenario 2, where the potential cultivable area was increased based on the current water supply scheme, the calculated water demand (NWD) was still within the range of the available resources to maintain the natural recharge conditions on a national scale. Here, Mali and Zimbabwe used more than 30 percent of the available renewable resources.
Agricultural water management systems are already a priority in SSA, and agricultural land expansion takes place through the commercialization of large plots, as well as through subsistence farming. Managing soil moisture is the main issue in improving the rain-fed cropped areas, where the spread of manual and motorized pumps helps promoting individual low-cost irrigation and maintaining soil moisture. On a small scale, flood recession agriculture and communal pump schemes help to increase small community-based irrigation projects. For larger scale irrigation plans, big infrastructure projects, like dams or weirs construction, piped irrigation, and surface channels, could better meet the future demand.
Still however, as rain-fed agriculture covers 90 percent of the farmed areas currently, better measures shall be taken on crop and soil management to curb the water needs. Different options for introducing less water demanding varieties, various rooting and ploughing methods, better fertilizing and pesticide options, and improved soil moisturizing techniques are already in place and shall be up scaled [49].
The current data collection and integrated water resources management planning could not cover all of the aspects of water use in the SSA region. The data are still lacking, especially regarding groundwater recharge rates and the current aquifer situation. The FAO data include modelled values or estimates, in some cases, to fill the gaps. The data provided are the national averages and can vary within countries, especially for counties falling within different climate zones. However, the data and calculations can still be used to draw general conclusions regarding land and water availability in the selected countries.
6. Conclusions
The current study has shown the present and future agricultural water demand in SSA through the utilization of the available water resources in each assessed country. The study considered both large commercial and small farming plots to increase the agricultural produce in the examined SSA countries. To this end, water demand scenarios, resources availability, and increasing water exploitation were assessed on a national level. The results showed that all of the countries studied could expand their potential cultivable area, depending on their renewable resources. However, when making future water resources management plans, each country should be considered as a separate case. The volume of renewable surface and groundwater resources may be relatively estimated, but the cost of increasing the exploitation of each source must be considered. Future demands cannot be met by depending of surface and groundwater resources only, even when considering their relevant abundance.
The scenario with the highest economic returns, given the percentage of surface water and groundwater used, should be chosen. Recommendations for future development should also contemplate economic sustainability, including farmers’ livelihoods and long-term economic growth. Increasing the cultivated area on a country scale is related to more constrained factors than the ones discussed in this study. It is acknowledged, for instance, that major developments in the agricultural sector of SSA are directly related to society’s ability to enhance legislations and water management plans. This study aspires to present a baseline for the comparison of agricultural land and renewable water resources’ availability in SSA, as a precondition for the expansion of the agricultural sector in a sustainable manner.
Supplementary Materials
The following are available online at https://www.mdpi.com/2073-4441/10/7/896/s1, Production rate per country.
Author Contributions
Research conceptualization and methodology: (N.A.Z.), (A.T.H.) and (P.M.R.). Formal analysis and investigation: (N.A.Z.), (A.T.H.) and (P.M.R.). Research resources and data curation: (N.A.Z.). Original draft preparation: (N.A.Z.). Reviewing and editing (A.T.H.), (P.M.R.) and (S.X.). Supervision: (B.K.).
Funding
This research received no external funding.
Conflicts of Interest
The authors declare no conflict of interest.
References
- The World Bank 2013. Available online: https://data.worldbank.org (accessed on 23 February 2018).
- Clover, J. Food security in sub-saharan Africa: Feature. Afr. Secur. Rev. 2003, 12, 5–15. [Google Scholar] [CrossRef]
- Braune, E.; Xu, Y. The role of ground water in Sub-Saharan Africa. Groundwater 2010, 48, 229–238. [Google Scholar] [CrossRef] [PubMed]
- Makurira, H.; Mul, M.; Vyagusa, N.; Uhlenbrook, S.; Savenije, H. Evaluation of community-driven smallholder irrigation in dryland South Pare Mountains, Tanzania: A case study of Manoo micro dam. Phys. Chem. Earth Parts A/B/C 2007, 32, 1090–1097. [Google Scholar] [CrossRef]
- Wondimkun, Y.; Tefera, M. Household water harvesting and small scale irrigation schemes in Amhara Region; Best practices and technologies for small scale agricultural water management in Ethiopia. In Proceedings of the MoARD/MoWR/USAID/IWMI Symposium, Addis Ababa, Ethiopia, 7–9 March 2006; p. 11. [Google Scholar]
- Cooper, P.; Coe, R. Assessing and addressing climate-induced risk in sub-Saharan rainfed agriculture: Foreword to a special issue of experimental agriculture. Exp. Agric. 2011, 47, 179–184. [Google Scholar] [CrossRef]
- Biazin, B.; Sterk, G.; Temesgen, M.; Abdulkedir, A.; Stroosnijder, L. Rainwater harvesting and management in rainfed agricultural systems in sub-Saharan Africa—A review. Phys. Chem. Earth Parts A/B/C 2012, 47, 139–151. [Google Scholar] [CrossRef]
- Zafar, A. The growing relationship between China and Sub-Saharan Africa: Macroeconomic, trade, investment, and aid links. World Bank Res. Obs. 2007, 22, 103–130. [Google Scholar] [CrossRef]
- Binswanger, H.; Pingali, P. Technological priorities for farming in sub-Saharan Africa. World Bank Res. Obs. 1988, 3, 81–98. [Google Scholar] [CrossRef]
- Nakano, Y.; Bamba, I.; Diagne, A.; Otsuka, K.; Kajisa, K. The Possibility of a Rice Green Revolution in Large-Scale Irrigation Schemes in Sub-Saharan Africa; An African Green Revolution; Springer: Berlin, Germany, 2013; pp. 43–70. [Google Scholar]
- Barrios, S.; Bertinelli, L.; Strobl, E. Climatic change and rural-urban migration: The case of sub-Saharan Africa. J. Urban Econ. 2006, 60, 357–371. [Google Scholar] [CrossRef]
- Mrema, G.C.; Baker, D.; Kahan, D. Agricultural Mechanization in Sub-Saharan Africa: Time for a New Look; FAO: Roma, Italy, 2008. [Google Scholar]
- Izac, A.N.; Swift, M.J. On agricultural sustainability and its measurement in small-scale farming in sub-Saharan Africa. Ecol. Econ. 1994, 11, 105–125. [Google Scholar] [CrossRef]
- MacDonald, A.; Davies, J.; Calow, R.; Chilton, J. Developing Groundwater: A Guide for Rural Water Supply; ITDG Publishing: Rugby, UK, 2005; p. 358. [Google Scholar]
- Platteau, J. Physical infrastructure as a constraint on agricultural growth: The case of sub-Saharan Africa. Oxf. Dev. Stud. 1996, 24, 189–219. [Google Scholar] [CrossRef]
- Cervigni, R.; Morris, M. Confronting Drought in Africa's Drylands: Opportunities for Enhancing Resilience; World Bank Publications: Washington, DC, USA, 2016. [Google Scholar]
- MacDonald, A.; Davies, J. A Brief Review of Groundwater for Rural Water Supply in Sub-Saharan Africa; British Geological Survey: Nottingham, UK, 2000. [Google Scholar]
- Tafesse, M. Small-Scale Irrigation for Food Security in Sub-Saharan Africa; CTA: Wageningen, The Netherlands, 2003. [Google Scholar]
- Cooper, P.; Dimes, J.; Rao, K.; Shapiro, B.; Shiferaw, B.; Twomlow, S. Coping better with current climatic variability in the rain-fed farming systems of sub-Saharan Africa: An essential first step in adapting to future climate change? Agric. Ecosyst. Environ. 2008, 126, 24–35. [Google Scholar] [CrossRef] [Green Version]
- Barrett, C.B.; Lynam, J.; Place, F.; Reardon, T.; Aboud, A.A. 22 towards Improved Natural Resource Management in African Agriculture. In Natural Resources Management in African Agriculture: Understanding and Improving Current Practices; CABI: Wallingford, UK, 2002; Volume 287. [Google Scholar]
- Xenarios, S.; Pavelic, P. Assessing and forecasting groundwater development costs in Sub-Saharan Africa. Water SA 2013, 39, 529–538. [Google Scholar] [CrossRef]
- Aryeetey-Attoh, S.; McDade, B.E. Geography of Sub-Saharan Africa; Prentice Hall: Upper Saddle River, NJ, USA, 1997. [Google Scholar]
- MacDonald, A.M.; Bonsor, H.C.; Dochartaigh, B.É.Ó.; Taylor, R.G. Quantitative maps of groundwater resources in Africa. Environ. Res. Lett. 2012, 7, 024009. [Google Scholar] [CrossRef] [Green Version]
- Wolf, A.T.; Natharius, J.A.; Danielson, J.J.; Ward, B.S.; Pender, J.K. International river basins of the world. Int. J. Water Resour. Dev. 1999, 15, 387–427. [Google Scholar] [CrossRef]
- Frenken, K. Irrigation in Africa in Figures: AQUASTAT Survey, 2005; Food & Agriculture Org.: Roma, Italy, 2005; Volume 29. [Google Scholar]
- AQUASTAT Database. Available online: http://www.fao.org/nr/water/aquastat/data (accessed on 23 February 2018).
- Boserup, E. The Conditions of Agricultural Growth: The Economics of Agrarian Change under Population Pressure; Routledge: Abingdon-on-Thames, UK, 2017. [Google Scholar]
- FAO Country Profiles. Available online: http://www.fao.org/nr/water/aquastat/main (accessed on 23 February 2018).
- FAO. Yearbook; FAO: Rome, Italy, 2012. [Google Scholar]
- Bruins, H.; Evenari, M.; Nessler, U. Rainwater-harvesting agriculture for food production in arid zones: The challenge of the African famine. Appl. Geogr. 1986, 6, 13–32. [Google Scholar] [CrossRef]
- Reardon, T.; Delgado, C.; Matlon, P. Determinants and effects of income diversification amongst farm households in Burkina Faso. J. Dev. Stud. 1992, 28, 264–296. [Google Scholar] [CrossRef] [Green Version]
- Mougeot, L.J. Agropolis: The Social, Political and Environmental Dimensions of Urban Agriculture; Routledge: Abingdon-on-Thames, UK, 2010. [Google Scholar]
- Diao, X.; Hazell, P.B.; Resnick, D.; Thurlow, J. The Role of Agriculture in Development: Implications for Sub-Saharan Africa; Intl Food Policy Res Inst: Washington, DC, USA, 2007; Volume 153. [Google Scholar]
- Yosef, B.A.; Asmamaw, D.K. Rainwater harvesting: An option for dry land agriculture in arid and semi-arid Ethiopia. Int. J. Water Resour. Environ. Eng. 2015, 7, 17–28. [Google Scholar]
- Barghouti, S.; Lemoigne, G. Irrigation in Sub-Saharan Africa; World Bank: Washington, DC, USA, 1990. [Google Scholar]
- Burney, J.A.; Naylor, R.L. Smallholder irrigation as a poverty alleviation tool in sub-Saharan Africa. World Dev. 2012, 40, 110–123. [Google Scholar] [CrossRef]
- Tiffen, M. Transition in sub-Saharan Africa: Agriculture, urbanization and income growth. World Dev. 2003, 31, 1343–1366. [Google Scholar] [CrossRef]
- Keino, L.; Baijukya, F.; Ng’etich, W.; Otinga, A.N.; Okalebo, J.R.; Njoroge, R.; Mukalama, J. Nutrients Limiting Soybean (Glycine max L) growth in acrisols and ferralsols of Western Kenya. PLoS ONE 2015, 10, e0145202. [Google Scholar] [CrossRef] [PubMed]
- Abe, S.S.; Buri, M.M.; Issaka, R.N.; Kiepe, P.; Wakatsuki, T. Soil fertility potential for rice production in West African lowlands. Jpn. Agric. Res. Q. 2010, 44, 343–355. [Google Scholar] [CrossRef]
- De Valença, A.W.; Bake, A. Micronutrient Management for Improving Harvests, Human Nutrition, and the Environment; Scientific Project; Food & Business Knowledge Platform: Hague, The Netherlands, 2016; Volume 24. [Google Scholar]
- Raimi, A.; Adeleke, R.; Roopnarain, A. Soil fertility challenges and Biofertiliser as a viable alternative for increasing smallholder farmer crop productivity in sub-Saharan Africa. Cogent Food Agric. 2017, 3, 1400933. [Google Scholar] [CrossRef]
- Bekunda, M.; Nkonya, E.; Mugendi, D.; Msaky, J. Soil fertility status, management, and research in East Africa. East Afr. J. Rural Dev. 2002, 20, 94–112. [Google Scholar] [CrossRef]
- Morris, M.L. Fertilizer Use in African Agriculture: Lessons Learned and Good Practice Guidelines; World Bank Publications: Washington, DC, USA, 2007. [Google Scholar]
- Sommer, R.; Bossio, D.; Desta, L.; Dimes, J.; Kihara, J.; Koala, S.; Mango, N.; Rodriguez, D.; Thierfelder, C.; Winowiecki, L. Profitable and Sustainable Nutrient Management Systems for East and Southern African Smallholder Farming Systems: Challenges and Opportunities: A Synthesis of the Eastern and Southern Africa Situation in Terms of Past Experiences, Present and Future Opportunities in Promoting Nutrients Use in Africa; CIAT: London, UK, 2013. [Google Scholar]
- Gibbon, P. Experiences of Plantation and Large-Scale Farming in 20th Century Africa; DIIS Working Paper; Danish Institute for International Studies: Copenhagen, Denmark, 2011. [Google Scholar]
- Xie, H.; You, L.; Wielgosz, B.; Ringler, C. Estimating the potential for expanding smallholder irrigation in Sub-Saharan Africa. Agric. Water Manag. 2014, 131, 183–193. [Google Scholar] [CrossRef]
- Cassman, K.G.; Grassini, P. Can there be a green revolution in Sub-Saharan Africa without large expansion of irrigated crop production? Glob. Food Secur. 2013, 2, 203–209. [Google Scholar] [CrossRef]
- You, L.; Ringler, C.; Wood-Sichra, U.; Robertson, R.; Wood, S.; Zhu, T.; Nelson, G.; Guo, Z.; Sun, Y. What is the irrigation potential for Africa? A combined biophysical and socioeconomic approach. Food Policy 2011, 36, 770–782. [Google Scholar] [CrossRef] [Green Version]
- Ward, C. Improved Agricultural Water Management for Africa’s Drylands; World Bank Publications: Washington, DC, USA, 2016. [Google Scholar]
Figure 1.
The three scenarios used for evaluating the potential for increasing cultivable area. In scenario 1 ARF = 0 and in scenario 3 AIR = 0.
Figure 1.
The three scenarios used for evaluating the potential for increasing cultivable area. In scenario 1 ARF = 0 and in scenario 3 AIR = 0.
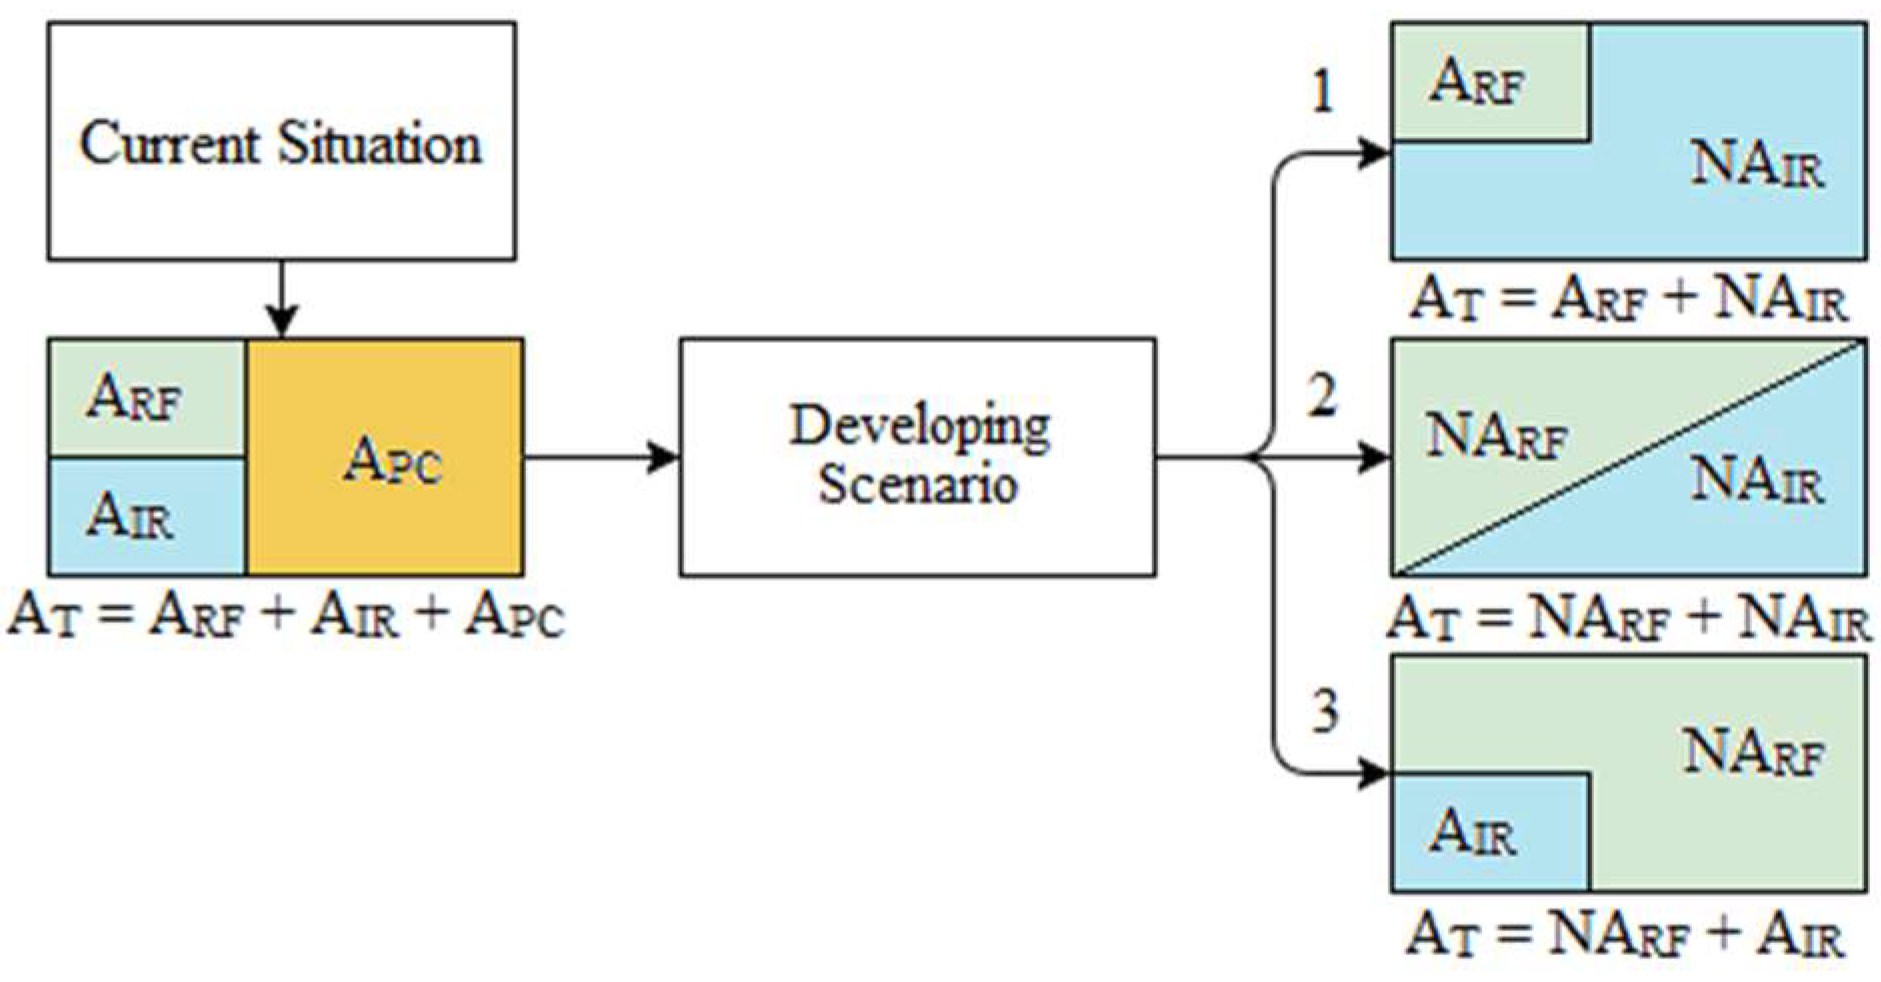
Figure 2.
Annual mean depth (mm) of (A) renewable surface water resources (RSW), (B) renewable groundwater resources (RGW), and (C) renewable surface and groundwater resources; (D) renewable surface water to groundwater ratio; (E) annual irrigation water demand per hectare (IWD, m3/ha); and (F) annual water supplement demand per hectare for rain-fed farming (RFISW, m3/ha).

Figure 3.
Water resources versus water consumption in the 15 different countries. T—total available annual renewable water resources; S—annual renewable surface water; G—annual renewable groundwater; C—current annual water consumption (includes domestic, industrial, and irrigation), 1—annual water consumption in scenario 1; 2—annual water consumption in scenario 2; 3—annual water consumption in 3. The Y-axis represents the water volume in 109 m3.

Figure 4.
Allocation of the 15 selected countries to classes based on different scenarios. (A) Current situation; (B) Scenario 1; (C) Scenario 2; and (D) Scenario 3. For an explanation of classes I–VI, see Table 4.
Figure 4.
Allocation of the 15 selected countries to classes based on different scenarios. (A) Current situation; (B) Scenario 1; (C) Scenario 2; and (D) Scenario 3. For an explanation of classes I–VI, see Table 4.

Table 1.
Annual renewable water resources and current cultivated and potential cultivable area (FAO) [26], in the 15 selected countries in Sub-Saharan Africa (SSA).
Table 1.
Annual renewable water resources and current cultivated and potential cultivable area (FAO) [26], in the 15 selected countries in Sub-Saharan Africa (SSA).
| Country | P (mm) | RSW (109 m3) | RGW (109 m3) | ARF (1000 ha) | AIR (1000 ha) | APC (1000 ha) |
|---|---|---|---|---|---|---|
| Benin | 1039 | 26.1 | 1.8 | 2803 | 12 | 4185 |
| Burkina Faso | 748 | 9.0 | 9.5 | 4375 | 25 | 4600 |
| Ethiopia | 848 | 120.0 | 20.0 | 10,381 | 290 | 2529 |
| Ghana | 1187 | 54.9 | 26.3 | 6300 | 31 | 3669 |
| Kenya | 630 | 30.2 | 3.5 | 5059 | 103 | 4780 |
| Malawi | 1181 | 17.2 | 2.5 | 2384 | 56 | 1160 |
| Mali | 282 | 110.0 | 20.0 | 4464 | 236 | 39,000 |
| Mozambique | 1032 | 214.1 | 17.0 | 4317 | 118 | 31,565 |
| Niger | 151 | 31.5 | 2.5 | 4426 | 74 | 12,000 |
| Nigeria | 1150 | 279.2 | 87.0 | 32,707 | 293 | 28,000 |
| Tanzania | 1071 | 92.2 | 30.0 | 4916 | 184 | 34,900 |
| Togo | 1168 | 14.0 | 5.7 | 2623 | 7 | 770 |
| Uganda | 1180 | 60.1 | 29.0 | 9091 | 9 | 7700 |
| Zambia | 1020 | 104.8 | 47.0 | 5133 | 156 | 11,061 |
| Zimbabwe | 657 | 6.0 | 5.0 | 3176 | 174 | 4970 |
P—annual precipitation rate, RSW—annual renewable surface water resources, RGW—annual renewable groundwater resources, ARF—current rain-fed areas, AIR—current irrigated areas, APC—potential cultivable areas. All data based on FAO estimates.
Table 2.
Distribution of water resources withdrawal (percentage) from surface water and groundwater reserves in the 15 selected countries for three major water-consuming sectors: agriculture, domestic, and industrial; and the agricultural population as a percentage of the total population (FAO) [26].
| Country | Agricultural Use (%) | Domestic Use (%) | Industrial Use (%) | Use of Water (m3 Per Capita Per Year) | Agricultural Population (%) |
|---|---|---|---|---|---|
| Benin | 45.4 | 31.5 | 23.1 | 20 | 44 |
| Burkina Faso | 86.2 | 13.0 | 0.8 | 67 | 92 |
| Ethiopia | 93.6 | 6.0 | 0.4 | 81 | 77 |
| Ghana | 66.4 | 23.9 | 9.7 | 50 | 54 |
| Kenya | 79.1 | 17.2 | 3.7 | 87 | 71 |
| Malawi | 80.6 | 14.7 | 4.7 | 88 | 73 |
| Mali | 90.1 | 9.0 | 0.9 | 550 | 77 |
| Mozambique | 86.6 | 11.0 | 2.4 | 36 | 74 |
| Niger | 95.2 | 4.3 | 0.5 | 204 | 83 |
| Nigeria | 68.8 | 21.1 | 10.1 | 70 | 25 |
| Tanzania | 89.3 | 10.2 | 0.5 | 143 | 73 |
| Togo | 45.0 | 52.6 | 2.4 | 35 | 53 |
| Uganda | 40.0 | 44.7 | 15.3 | 12 | 73 |
| Zambia | 76.0 | 16.5 | 7.5 | 162 | 63 |
| Zimbabwe | 78.9 | 14.0 | 7.1 | 325 | 56 |
Table 3.
Crop type percentage distribution of total irrigated area in the study zone (FAO) [26]. West and East SSA countries are the averages based of the geographical location. SSA Avg: indicates the total average of all of the sub-Saharan African countries.
Table 3.
Crop type percentage distribution of total irrigated area in the study zone (FAO) [26]. West and East SSA countries are the averages based of the geographical location. SSA Avg: indicates the total average of all of the sub-Saharan African countries.
| Region | Rice | Cereals | Vegetables | Root Crops | Fodder | Sugar Cane | Industrial Crops | Fruit Tres | Annual Crops | Permanent Crops | Total |
|---|---|---|---|---|---|---|---|---|---|---|---|
| West SSA | 12.5 | 17 | 31 | 2 | 0 | 18 | 5 | 0 | 11 | 3.5 | 100 |
| East SSA | 16 | 28 | 17 | 7.5 | 0 | 4 | 14 | 1 | 12 | 0.5 | 100 |
| SSA Avg | 15 | 29 | 12 | 3 | 14 | 4 | 11 | 4 | 3 | 5 | 100 |
Table 4.
Classification of countries based on renewable water resources and increased irrigation water demand.
Table 4.
Classification of countries based on renewable water resources and increased irrigation water demand.
| Class I | if NWD ≤ RSW and NWD ≤ RGW | New water demand is less than both renewable surface and groundwater resources |
| Class II | if NWD ≤ RSW and NWD > RGW | New water demand is less than the renewable surface water resources, but greater than the renewable groundwater resources |
| Class III | if NWD > RSW and NWD ≤ RGW | New water demand is greater than the renewable surface water resources, but less than the renewable groundwater resources |
| Class IV | If NWD ≤ (RSW + RGW) | New water demand is less than the sum of surface and groundwater resources |
| Class V | NWD > (RSW + RGW) and CWD < (RSW + RGW) | New water demand is greater than the summation of the surface and groundwater resources, but current water demand is less than the summation of the surface and groundwater resources |
| Class IV | If CWD > (RSW + RGW) | Current water demand is greater than the sum of the renewable surface and groundwater resources |
NWD: new calculated agricultural water demand; CWD: current agricultural water withdrawal; RSW: renewable surface water resources; RGW: renewable groundwater resources.
Table 5.
The percentage distribution of irrigation water sources between the surface water (SW) and groundwater (GW) in each of the 15 countries, and the irrigation dam capacity (FAO) [26]; and the average well cost and average yield (Xenarios and Pavelic) [21].
| Country | Percentage Irrigation SW | Percentage Irrigation GW | Irrigation Dam Capacity (Mm3) | Average Well Cost (US$) | Average Yield (m3/h) |
|---|---|---|---|---|---|
| Benin | 82 | 18 | 23.5 | - | - |
| Burkina Faso | 88 | 12 | 2285.0 | 12,549 | 5 |
| Ethiopia | 99 | 1 | 2027.0 | 23,268 | 8 |
| Ghana | 76 | 24 | 215.5 | 9465 | 6 |
| Kenya | 99 | 1 | 4.6 | 20,906 | 6 |
| Malawi | 99 | 1 | 25.0 | 2730 | - |
| Mali | 99 | 1 | 355.0 | 15,462 | 8 |
| Mozambique | 99 | 1 | 1444.0 | 8672 | 4 |
| Niger | 98 | 2 | 82.0 | 12,194 | 6 |
| Nigeria | 71 | 29 | 6095.0 | 6241 | 6 |
| Tanzania | 91 | 9 | 870.0 | 16,540 | 6 |
| Togo | 99 | 1 | 1710.0 | - | - |
| Uganda | 99 | 1 | - | 3539 | 5 |
| Zambia | 96 | 4 | 1382.0 | 6028 | 6 |
| Zimbabwe | 88 | 12 | 4497.0 | - | - |
© 2018 by the authors. Licensee MDPI, Basel, Switzerland. This article is an open access article distributed under the terms and conditions of the Creative Commons Attribution (CC BY) license (http://creativecommons.org/licenses/by/4.0/).
Share and Cite
MDPI and ACS Style
Abou Zaki, N.; Torabi Haghighi, A.; Rossi, P.M.; Xenarios, S.; Kløve, B. An Index-Based Approach to Assess the Water Availability for Irrigated Agriculture in Sub-Saharan Africa. Water 2018, 10, 896. https://doi.org/10.3390/w10070896
AMA Style
Abou Zaki N, Torabi Haghighi A, Rossi PM, Xenarios S, Kløve B. An Index-Based Approach to Assess the Water Availability for Irrigated Agriculture in Sub-Saharan Africa. Water. 2018; 10(7):896. https://doi.org/10.3390/w10070896
Chicago/Turabian StyleAbou Zaki, Nizar, Ali Torabi Haghighi, Pekka M. Rossi, Stefanos Xenarios, and Bjørn Kløve. 2018. "An Index-Based Approach to Assess the Water Availability for Irrigated Agriculture in Sub-Saharan Africa" Water 10, no. 7: 896. https://doi.org/10.3390/w10070896
Note that from the first issue of 2016, this journal uses article numbers instead of page numbers. See further details here.