Erosion, Suspended Sediment Transport and Sedimentation on the Wadi Mina at the Sidi M’Hamed Ben Aouda Dam, Algeria


1
Laboratoire Génie de l’Eau et de l’Environnement, Higher National School of Hydraulic, 09000 Blida, Algeria
2
University of Khemis Miliana, 44225 Ain Defla, Algeria
3
IRD Hydrosciences, 34090 Montpellier, France
4
Geo-Environment Laboratory, Faculty of Earth Sciences, Geography and Spatial Planning, University of Sciences and Technology Houari Boumediene, 16111 Bab Ezzouar Algiers, Algeria
*
Author to whom correspondence should be addressed.
Water 2018, 10(7), 895; https://doi.org/10.3390/w10070895
Submission received: 28 March 2018
/
Revised: 4 June 2018
/
Accepted: 26 June 2018
/
Published: 4 July 2018
(This article belongs to the Special Issue Modeling and Practice of Erosion and Sediment Transport under Change)
Abstract
:The objective of this study was to follow-up on the evolution of the hydro-pluviometric schemes and particular elements of Wadi Mina (6048 km2) to the Sidi M’Hamed Ben Aouda Dam to evaluate the silting origin and status of this dam situated in the northwest of Algeria. The pluviometric study targeted a series of rains during 77 years (1930–2007), the liquid discharge data cover a period of 41 years (1969–2010) and the solids and suspended sediment concentrations data cover very variable periods, starting from 22 to 40 years for the entire catchment area. The statistical tests for ruptures detection on the chronological series of rains and discharges indicate a net reduction of rains of more than 20% on the entire basin since 1970. The evolution of solids inputs was quantified: the maximum values are registered on autumn start and at the end of spring. The Wadi Mina basin brings annually 38 × 106 m3 of water with a specific degradation of 860 t·km−2·year−1. By comparing the results found, we thus observe that the basin upstream of SMBA (1B) Dam is the greatest sediment producer towards the dam because it shows a specific degradation equal to 13.36 t·ha−1·year−1.
1. Introduction
Algeria has always been confronted with extreme phenomena: periodic droughts which were sometimes severe and lasting and floods that are more often than not catastrophic. These events constitute a major constraint for the economic and social development and have been the subject of numerous studies [1,2,3,4,5,6,7,8,9,10,11,12].
Following a rain over a catchment area, a complex mechanism of interactions between hydrological and erosive phenomena is started. The streaming related to strong precipitations entails the soil slide by erosion in quantities that are sometimes very abundant. This has an impact on the environment and one of the results is the soils fertility loss and the early filling of water impoundments (dams, ponds, lakes), thus reducing their storing capacity and possibly entailing as well as degradation of the water quality and usage conflicts [13].
Since the Independence of Algeria, the total number of dams in exploitation at national level increased from 14 in 1962 to 65 in 2014 and, if we add the inter-basin water transfer major works, there are 7 billion m3 of water that are mobilized to be used for drinking water supply, irrigation and industry [14].
The scale of aggradations and the raise of the bottom of these dam impoundments by successive deposits of sediments brought by the watercourses and the wind are a serious problem whose negative consequences are considerably felt in the agriculture, farming, fishing, electricity and navigation fields [15,16,17]. The study on the silting of lakes, catchment areas or dams is of considerable interest for attempting to explain the complex mechanisms of solid transport and to quantify the volumes of transported sediments [18,19,20,21] and for a potential dredging of the impoundment [22].
The sedimentation in North Africa dams is very high in relation to what is noted at international level. According to Lahlou [23], the 23 major dams that are being exploited in Morocco lose annually 50 Mm3 of their storage capacity. In Tunisia, the annual loss of the storage capacity is estimated between 0.5% [24] and 1% for a total initial capacity of about 1430 Mm3 [25]. Algeria’s rivers transport a large quantity of sediments [26,27]. The sediment deposited in Algerian dams is estimated to be 20 million m3·year−1 [28]. Competition for water among agriculture, industry, and drinking water supply—accentuated by a drought in Algeria—has shown the need for greater attention to be paid to water [29] and for it to be managed at the large basin scale [30]. Surface water resources in Algeria are evaluated to be approximately 8376 billion m3 for an average year [31]. These water resources in Algeria are characterized by wide variability—the resources for the last nine years have been significantly below this average [32]. Under these circumstances, several dams were built in Algeria to ensure water resources for the supply of drinking water to all its cities and allowed approximately 12,350 km2 of irrigated land to be developed [31,32,33]. However, the sediments deposits in the dam reservoirs are estimated, on average, at 20 million m3 per year [34]. The high efficiency of sediments transport of the Algerian rivers [27,35] encouraged numerous authors to study the transfer of sediments in suspension in this area [36,37,38,39,40,41]. Considering these problems and to establish the lifespan of dams and to implement a better strategy of water resources management, research on the dynamics of sediments underlines the need to better understand the variations of erosion, deposits and dynamics of storage of sediments in a variety of catchment areas and rivers [42]. In this context, a certain number of studies used the relation of concentration of suspended particles matters (SPM) for acquiring a more complete understanding of the drainage basins processes [19,43,44].
Among the factors that favor erosion (slope, nature of rocks, hilly area, climate, and human activities), climate is recognized as the main factor in the semiarid Mediterranean regions of Algeria that go through short and intense rain episodes, a strong power of evaporation of the wind, prolonged droughts and freezing cycles [45,46]. The erosion is extremely active and the average concentration is at least higher than the global average [42].
Indeed, the main works for surface waters mobilization (big dams, dams and small lakes) were built on the watercourses of basins situated in the northern part of the country. These basins are characterized by various hilly areas dominated, on the one side, by marly lands and soils vulnerable to erosion and, on the other side, by a forest cover limited in the most watered parts and a seasonal vegetation cover. To these natural conditions is added the torrential nature of precipitations that fall at the end of the dry season and that would be responsible for a major part of the erosion and the solid load of water [21].
This article presents a study of erosion, sedimentation and climate change on Wadi Mina, at the Sidi M’Hamed Ben Aouda Dam in the northeast of Algeria, in a semiarid area. It is essential to know the evolution of water resources available for this dam in a variable climatic environment. In addition, since 1976 the rains reduction starting [47] and the increase in extreme events [48], the erosion and solids transport conditions were modified. The first results of the SIGMED (Approche Spatialisée de l’Impact des activités aGricoles au Maghreb sur les transports solides et les ressources en Eau De grands bassins versants) program showed as well the impact of human activities on environment and erosion [49,50], but it is still difficult to quantify the anthropogenic and climatic parts responsible for the recent modifications of the dynamic erosion on the basin [51].
The watershed of Wadi Mina (6048 km2, northwest Algeria) is the subject of numerous works in the field of water erosion and siltation of dams [52,53,54,55,56,57,58,59,60,61,62,63,64,65,66,67].
The hydrologic part was a study on the rain and water flows in the basin towards available stations supplied by ANRH (National Agency for Hydraulic Resources). The solid transport of suspended particles matters (SPM) was estimated based on specific measures taken by the hydrological services of ANRH during the period 1969–2010. The water volume of the SMBA (Sidi M’Hamed Ben Aouda) Dam was estimated based on the results of the bathymetric measures supplied by ANBT (National Agency for Dams and Transfers) in the period 1978–2004.
In the last part, we studied the sedimentation study on the SMBA Dam and the origin of sediments, comparing the soil loss measured at the hydrometric stations with the dam silting data (bathymetry) with the results of a study of soils erosion by the USLE (Universal Soil Loss Equation) method carried out by Toumi et al. [66]. This is the first comparative study in Algeria which compares the erosion and sedimentation rates on a river basin and the associated reservoir, from several different approaches; this is the originality of this article in relation to the literature.
2. Materials and Methods
2.1. Study Area
Situated in a semiarid area, the catchment area of Wadi Mina presents strong erodibility and the good availability of pluviometric and hydrometric data. Situated at around 300 km west of Algiers, the catchment area Wadi Mina drains, at the level of the Sidi M’Hamed Ben Aouda (SMBA) Dam, a surface of 6048 km2 (Figure 1). Wadi Mina is among the main tributaries of Wadi Cheliff. There are two dams on Wadi Mina, the SMBA Dam, subject of our study, and the Bakhadda Dam, situated at 90 km. The topographic study [68] allowed classifying the studied sub-basins in the hard hilly landscape class, in accordance with the IRD (French National Institute for Research for Sustainable Development) classification [69]. The basin of Wadi Mina spreads on dissimilar natural units:
- In the south, the Tellian plateaus also include the mountains of Frenda and Saida, with an altitude ranging from 900 to 1300 m, where limestone shows on the surface.
- In the north, a unit of mountain ranges and basins, generally of inferior altitude of 900 m, within a complex geological structure, individualized in blocks, where Ouarsenis is one of the most remarkable. They are characterized by an abundance of outcrops of marls, very sensible at hydric erosion.
The climate of the region is Mediterranean semi-arid with an annual average precipitation of 305 mm, marked by an irregularity which is both seasonal and inter-annual [68]. Moreover, the analysis of geographical repartition and the diversity of vegetal formations on the basin showed the existence of two parts clearly distinct [59,70]: the north area which is purely marlacious, strongly eroded and lacking vegetation, except for a few small islands of reforestation and plantations of fruit trees in the valley and the south area which is less eroded and where about 50% of the surface is covered by scattered vegetation with very variable density, ranging from the localized forest (pine of Alep) to the very scattered covering scrub. It must be noted that subsistence agriculture reigns with excessive exploitation of soils, a permanent clearing and an intensive overgrazing.
2.2. Acquisition and Preparation of Data
The pluviometric data came from the National Agency of Hydraulic Resources (ANRH). They are registered at 26 pluviometric posts (Table 1) distributed on the catchment area and the related observation duration is variable. The longest chronicles (1930–2007) are registered at the pluviometric stations in the south of the basin (Figure 2).
For the entire 26 stations of the basin of Wadi Mina over a period of 77 years (1930–2007), it has been estimated at around 4% the total number of gaps on all the time series of monthly and annual precipitation. Gaps in rainfall series were filled using the method of the regional vector to facilitate the use of rupture tests [47].
The longest possible series of hydrometric data (1969–2010) were used (Table 2). We have at our disposal five hydrological series on the Wadi Mina basin, with little or no gaps (Figure 3).
The solid discharges and concentrations of SPM data cover 40 years periods from 1970/1971 to 2009/2010 for the Wadi El Abtal and Sidi Abdel Kader Djilali stations, from 1975/1976 to 2009/2010 for the Ain Hamara station (35 years old), from 1985/1986 to 2005/2006 for the Sidi Ali Ben Amar station, and from 1972/1973 to 1993/1994 for the Takhmert station (22 years old).
The measurement of suspended sediment concentrations (C) consists of a systematic sampling of water samples using a 500 cL bottle. These samples are taken at a single point, either on the edge or in the middle of the Wadi. Samples are more numerous during floods, while in low water or when the liquid discharge (Q) is constant during the day, only one sample is taken. The difficulty of the measurement is the non-uniformity of the sediment concentration in the measurement section. The turbidity measurement procedure used by ANRH is developed in the work of Bourouba [35] and Meddi [68].
C and Q measurements were used to define rating curves that estimate C from measured values of Q on the Wadi Mina, according to a common approach [71,72,73,74,75,76]. The curves most commonly used to estimate sediment transport is a power function [77,78,79]: Q = aCb, where a and b are regression coefficients determined empirically that account for the effectiveness of erosion and transport [42].
2.3. Methods Used
The main objective of the analysis of a chronological series, in accordance with Kendall and Stuart [80], is to bring clarity on the statistical mechanisms generating this series of observation.
Discontinuities in the studied datasets were analyzed using the rupture tests of Pettitt, Buishand, Lee, and Heghinian and the segmentation procedure of Hubert [81]. The null hypothesis tested is that there is no rupture in the series and a rupture is considered as very likely when it is statistically significant and is detected by two tests or two stations. These procedures are well defined by Maftei et al. [82] and in Khomsi et al. [83]. The choice of retained methods is based on the robustness of their foundation and the conclusions of a simulation study of artificially disturbed random series [84]. The study was performed with the software KHRONOSTAT [85], developed by IRD [86].
These tests were applied on the precipitations series in Algeria [87], Morocco [88] and Sub-Saharan Africa [89] as well as on the hydro-pluviometric studies series of the Sudan-Sahelian area [89,90], in West and Central Africa [91], and Tunisia [92]. These methods are thus largely validated in many regions of the world, on rains, discharges or temperatures series.
2.3.1. Flood Frequency Analysis (FFA)
The HYFRAN-PLUS software (version-V2.1) developed by the Canadian Institute (INRS-ETE, Eau Terre Environnement Research Centre of Institut national de la recherche scientifique), is designed for Hydrological Frequency Analysis (FFA) especially for extreme value. In the FFA, data corresponds to observations X1, …, XN which are independent and identically distributed (IID), i.e., verify the hypothesis of homogeneity, stationarity and independence. Several models are available to fulfill this task and the selection of the most robust approach to fit the model to data is a great challenge [93]. The prediction procedure is mainly based on the selection of the best fit for a given dataset. Conventional estimates of flood exceedance quantiles are highly dependent on the form of the underlying flood frequency distribution [94]. Several frequency distributions have been developed to fit different probability shapes, especially for extreme values. The first models related to extreme value theory (EVT) are the Generalized Extreme Value distribution [95], Gumbel [96] and then other models such as Lognormal distribution, Pearson family, Halphen family, Logistic distribution related models are proposed to give more flexibility when the EVT hypotheses are not fulfilled [97].
A decision support system (DSS) has been developed in the HYFRAN-PLUS software [98] to discriminate the different classes of the statistical distributions, and especially to estimate the quantiles for high return period T. Note that, for a random variable Q, the quantile QT with a return period T is the solution of the equation: . DSS is mainly based on the classification of statistical distributions according to their asymptotic behavior. DSS is mainly based on the classification of statistical distributions according to their asymptotic behavior [99].
There are three nested classes of distributions that are commonly used for extremes [94,100] and implemented in the HYFRAN-PLUS software: Class C (regularly varying distributions) containing Fréchet (EV2), Halphen Inverse B (HIB), Log-Pearson type 3 (LP3) and Inverse Gamma (IG) distributions, class D (the sub-exponential distributions) involving Halphen type A (HA) and B (HB), Gumbel (EV1), Pearson type 3 (P3) and Gamma (G) distributions and the class E of distributions with inexistent exponential moments (Figure 3 and Figure 4). The Log-Normal (LN) distribution has an asymptotic behavior between the C and D classes [94]. However, the use of the Generalized Extreme Value (GEV) distribution is currently a standard, thanks to the simplicity of its quantile function and the availability of software for parameter estimation [94].
The methods developed in the DSS allow identifying the most adequate class for adjusting a given sample. These methods are (Figure 4) [94]:
- the test Jarque–Bera (JB test): considered to test the log-normality with selected a priori based on the diagram (represented by coefficients of variation Cv and skewness Cs);
- the graphic log-log: used to discriminate firstly the class C and secondly D and E classes;
Mean Excess Function (MEF) used to discriminate the classes D and E; and two statistics: the ratio of Hill and Jackson statistics that can be used to perform a confirmatory analysis of suggested conclusions from the two previous methods (log-log graph and MEF).
2.3.2. Generalized Extreme Value (GEV) Distribution and the Extreme Value Theory (EVT)
The generalized extreme value (GEV) distribution appears to be a universal model for hydrological extremes in several regions of the world (in particular in the United Kingdom), the same as the Log-Pearson type 3 distribution in the USA and Australia or Lognormal distribution in China [94].
When modeling the maxima of random variables, extreme value theory plays the same fundamental role as the central limit theorem when modeling sums of variables. In both cases, the theory tells us what are the limiting distributions. Generally, there are two main ways to identify extremes in real data. Let Y1, …, YN, be a sequence of N random variables, and X their maximum:
taken in successive periods. If the variables Y1, …, YN are independent and identically distributed and F0 is their distribution function (referred here as parent distribution), the distribution of the maximum X is given by:
Let X1, …, XN constitute the extreme events, also called block of maxima, taken in n successive periods, for example n years. The limiting distribution for the block of maxima is given by Fisher and Tippett [101]. The Fisher–Tippett theorem states that if the sequence Y1, …, YN are Independent and Identically Distributed (IID) and if there exist constants and some non-degenerate function H such that HN converges, when N tends to infinity, towards H in distribution , then H corresponds to one of the three standard extreme value distributions:
Depending on each case, the distribution of the original observation F0 belongs to the Max-Domain of Attraction (MDA) of A, :
- The Gumbel MDA contains a great variety of distributions such as Normal, Gamma, Exponential and Gumbel.
- The Fréchet MDA contains distributions with power decay tail as the Pareto, Student, Cauchy, Inverse Gamma and Fréchet.
- The Weibull MDA distributions are light tailed with finite right endpoint. Such domain of attraction encloses Uniform and Beta distributions and is not of interest in FFA. The Weibull distribution has an upper bound and is not considered for high extremes.
Von Mises [101] proposed the generalized extreme value (GEV) distribution, which includes the three limit distributions EV1, EV2 and EV3. Another re-parameterization given by Fisher and Tippett [102] is generally used in hydrology:
whenever . When the shape parameter k is positive (respectively negative), the GEV corresponds to the inverse Weibull (EV3) (respectively Fréchet, EV2) distribution. The limiting case, k = 0, corresponds to the Gumbel (EV1) distribution. The simplicity of the GEV distribution function lead to an explicit expression of the quantile function to compute quantile for a given non-exceedance probability p:
This explicit quantile formula is also useful to generate a GEV samples by inversion method based on the generation of uniform distribution.
2.3.3. USLE Method
A classic example is the Universal Soil Loss Equation (USLE) [103]. This method expresses the long-term average annual soil loss as a product of rainfall erosivity factor (R factor), soil erodibility factor, slope length factor, slope steepness factor, cover-management factor, and support practice factor. USLE only predicts the amount of soil loss that results from sheet or rill erosion on a single slope and does not account for additional soil losses that might occur from gully, wind or tillage erosion. This erosion model was created for use in selected cropping and management systems, but is also applicable to non-agricultural conditions such as construction sites. The USLE can be used to compare soil losses from a particular field with a specific crop and management system to “tolerable soil loss” rates. Alternative management and crop systems may also be evaluated to determine the adequacy of conservation measures in farm planning. However, erosion is seen as a multiplier of rainfall erosivity (the R factor, which equals the potential energy); this multiplies the resistance of the environment, which comprises K (soil erodibility), SL (the topographical factor), C (plant cover and farming techniques) and P (erosion control practices). Since it is a multiplier, if one factor tends toward zero, erosion will tend toward zero.
3. Results
3.1. Analysis of Precipitations
At the monthly scale, some significant patterns arise. There are two periods of maximum occurrence of rupture in the rainfall time series of the stations studied, Autumn until January, which concentrate more than 40% of the annual amount of precipitation, with a peak in December and January, and Spring between April and June with more than 20% of the annual amount and two peaks in June and April. Intermediate seasons show much less occurrences of ruptures during the 1970s. However, during the 1980s the maximum of occurrence of ruptures is in August, and similarly during the 2000s in August and September, while during the 1990s the maximum is in March (Table 3).
The pluviometric posts for which a rupture could be detected are more numerous in the north than in the south. The pluviometric deficits noted are frequently close to 19–20%. This pluviometric deficit is thus felt for more than three decades and seems to be accentuated during the 1970–1980 decade. The areas in the west center and northwest have higher totals ruptures than the other areas on a monthly and yearly scales.
Indeed, 13 stations present a considerable rupture during the 1970–1980 decade for the entire catchment area of Wadi Mina, which represents 50% of the pluviometric stations used in this study (Figure 5).
It is equally interesting to note that the stations that present ruptures are localized differently during each decade: in the northwest of the basin before the 1970 decade, on the entire basin, except for the highlands of south and southeast, between the years 1970 and 1980, and on the entire basin, except for the center, after 1980, but in proportion representing less than half.
Indeed, we have noted a rupture corresponding to a decrease of precipitations during the mid-1970s over the whole Wadi Mina basin (58% series present a rupture in 1976) (Table 3), date presented by numerous researchers [6,104], who already indicated the tendency towards drought starting with 1970 in north Algeria. These results are compliant with the recent works in Algeria [8,11] and which concluded to a rains decrease noted during the last thirty years which hit the entire country of Algeria, but especially its western part, adding up to: (a) 30–40% at annual level and more than 40% during winter and spring in the Mascara region; (b) 20–30% on the littoral, starting from the center to the western part of the country; and (c) 20% at annual level and 25% during winter in the center of the country. They confirm as well the results of works carried out on the basins of the extreme west in Algeria [6,11] which concluded to a decrease of rainfall. A rupture in the rainfall time series is frequently observed in 1979–1980, except 1972 for the Wadi Mina basin, at the Wadi El Abtal and Ain Hamara stations, and 1976 for the west-central part of Algeria. These results confirm as well the occurrence in Morocco of a pluviometric deficit starting with 1970 and its continuation during the 1980s, an extremely severe and long drought episode [105]. At the level of North Africa, the results obtained by Meddi et al. [11] in Algeria and by Bouzaiane and Laforgue [106] in Tunisia indicate the same rupture period and show the spatial extension of the drought, accompanied by a net pluviometric reduction. The conclusions of the Intergovernmental group on the climate evolution from 2001 and 2007 [107] and those of the regional report of the United Nations on the changes in North Africa [108], go in the same direction.
3.2. Analysis of Hydrological Data
The discharges register a global decrease since 1970 (Table 4), or the probable ruptures are noted as well during rainy season and dry season (Table 4), which means that even the low water levels are slow, for a sudden drop, it indicates that the level of the groundwater has also abruptly fall.
At annual level, the probable rupture dates are 1974, 1975, 1980 and 1994, which corresponds generally to the ruptures detected at month level. In addition, the ruptures on the series of annual daily maximum were for the most part noted in 1970, 1984 and 1995 and the ruptures dates for the annual daily minimum series are detected in 1972, 1981 and 1994. The rupture in the daily maximum flows series is thus never noted the same year as in the average annual flows series, while there are the same ruptures dates for the average annual flows and the minimum daily flows.
In Sahelian and non-Sahelian Africa, many authors have revealed, based on hydro-pluviometric series, a dry phase which started around 1970 [109,110] and which lasts until today [111,112], it was noted as well a decrease of rivers flows [109,113,114], lakes levels [113], as well as a shortening of the rainy season [115,116].
These results indicate a satisfactory concordance with the dates detected on the annual and monthly rainfall of late 1970s/early 1980s. We thus assume that the decrease of runoff would be caused by a global decrease in precipitations on the catchment area of Wadi Mina [47]. However, we must not rule out a possible impact of storages and uses on the drastic decline of low water levels compared to groundwater.
In addition, several authors, among which [117], have as well reported rain decreases for the Mediterranean perimeter: in Spain, Italy, Turkey and Cyprus from 1951 to 1995 [118], between 1950 and 2000 in October in Mediterranean Iberia, March in Atlantic Iberia, January and winter in Greece and winter in the Middle East. Hulme et al. [119] showed a strong decrease of rains for the Mediterranean basin between the start and the end of 20th century. Likewise, subsequent to an analysis of the evolution of pluviometric inputs in the plains of Ghriss (northwest Algeria) [10], it was shown a net decrease starting with 1973, estimated at more than 25%. We can quote as well other results that have indicated that rains simulation over north Algeria, with an annual decrease of 15%, would entail a reduction of the annual runoff of 40% [120]. In Morocco, a climatic rupture that starts around 1976 in certain regions and which extends largely around 1979–1980, to nearly the entire territory, was noted [69,121].
As a consequence of the decrease of rainfall after the 1970s rupture which was observed in most basins of western Algeria, river discharges generally decreased as well. Meddi and Hubert [6] showed that the decrease in river discharge varied between −37% and −70% from eastern Algeria to western Algeria. In the Macta basin in northwest Algeria, runoff was estimated to be 28–36% lower in 1976–2002 as compared to 1949–1976 [11]. In the Tafna basin, also in northwest Algeria, research [122,123] showed that the decrease in precipitation after the rupture date was, on average, 29% over the whole basin and was accompanied by a decrease of 60% in river flow [42]. In Wadi Sebdou in west Algeria, Norrant and Douguédroit [118] showed that rainfall and discharge began to decrease in the 1970s. The diminution of rainfall by 24% between the period 1939–1975 (526 mm) and the period 1975–2004 (401 mm) induced a decrease by 55% of the yearly volume discharged in 1975–2004 as compared to 1939–1975. A similar variability was observed on Wadi Abd basin (Wadi Mina) [43].
Finally, we note that annual discharges have been decreasing overall since the 1970s, which generally corresponds to ruptures detected at the monthly time step. There is therefore a good agreement with the rupture dates in the annual rainfall series, which suggests a climatic cause, in the first place, the observed decline in discharges in the Wadi Mina basin [47].
The study of floods is a precondition for the choice of an adjustment distribution and thus the floods flows on the entire Wadi Mina basin are classified in category C and follow a GEV distribution (Table 5).
The results of stationary nature and independence hypotheses tests of the studied data concerning the annual floods of the stations of the sub-basins of Wadi Mina indicate the acceptance of the independence tests of Wald–Wolfowitz and the stationary nature tests of Kendall for all the stations (Table 5).
The study of the floods recurrence variability before and after the ruptures was performed on all the stations of the basin of Wadi Mina (Figure 6). For all the stations, the maximum discharges values decreased for the same return period with about 30 to 40%. For example, at the Ain Hamara station and before the rupture of 1992, the floods with intensity lower than 80 m3·s−1 only return once in five years (Figure 6a). However, beyond this value, precisely starting with 99 m3·s−1, the floods present longer return periods (20–100 years). However, after the same rupture date and for the same return periods, the intensities of the floods considerably decreased. For example, with a return period of 20 years before 1992, the flood with an intensity of 99 m3·s−1 became centenary.
The change of the pluviometric regime of the 1970s had thus as an impact a variance of recurrence of floods on all the sub-basins of the catchment area of Wadi Mina.
The pluviometry reduction has, of course, consequences on the watercourses regimes and thus on the availability of water resources which is the key to the success of many development projects. Nevertheless, the consequences of this reduction of flown volumes are already obvious with regard to the water and environment resources exploitation. Agriculture and the alimentation of impoundments are largely sanctioned by this resource decrease. The consequences of this phenomenon are thus very worrying with regard to the good functioning and the cost-effectiveness of projects already performed or planned.
3.3. Solids and Liquids Annual Transports
The annual average concentrations of SPM are compared with annual average discharge (Figure 7). Despite year-to-year irregularities at the Sidi Aek Djilali station, concentrations and discharges have changed in opposite directions. Discharges increased from 14 m3·s−1 in the late 1980s to less than 3 m3·s−1 in the early 2000s, while concentrations increased from 44 g·L−1 in 1974 to nearly 78 g. In 2005, flows at the El Abtal Wadi station increased from more than 40 m3·s−1 in 1974 to 0.48 m3·s−1 in 1997, whereas the concentrations evolved by 12 g·L−1, in 1971, to almost more than 67 g·L−1 in 2005. However, ruptures were detected on the rainfall and discharges from the mid-1970s, but this result show that is no effect of ruptures in precipitation and discharge on the solid load response since the discharge and rainfall decrease in the 1970s and increase in the early 2000s while the sediment load is still increasing. Geomorphologists have noted the difficulty of predicting the impacts of climate change on sediment yield due to nonlinear effects [124,125,126]. In addition, Achite and Ouillon [42] in their study on Wadi Abd basin, found that the change in flow regime induced a fully nonlinear effect between river discharge and sediment yield. This must be considered in the forecasts, especially in small river basins in semi-arid areas.
Regression analysis was performed between the concentration in instant suspended sediment (c) and the instant discharge (Q) at Wadi Mina. Generally, the power model Q = aCb, where a and b are regression coefficients, is the most used for the estimation of the sediment concentration (Figure 8) [77,78,79].
As for the majority of watercourses, we found a power relation [127] for Wadi Mina, connecting the concentration of SPM in g·L−1 to the liquid discharge in m3·s−1 (Figure 8). A first graphic analysis of this figure shows a fairly strong dispersion around the regression line, with a very broad concentration range for low discharges below 10 m3·s−1 and concentrations that become significantly higher, above 10 g·L−1 for discharges greater than 50 m3·s−1.
For studying the basin responses in terms of discharges and SPM during the hydrological year, it was considered useful to regroup the instantaneous values pursuant to the different seasons (Table 6).
The analysis in Figure 9 shows that autumn and spring are distinguished by their strong liquid discharges generating an important flow of SPM. The maximum solid flow is of 42,365 kg·s−1, achieved in September 1994, resulting from a liquid discharge of more than 351 m3·s−1.
In contrast, during winter and summer, we note a net regression of liquid discharge that do no longer exceed 84 m3·s−1 in winter and 38 m3·s−1 in summer. However, we note a few specificities for each season.
For autumn, the heavy charge is explained by the fact that rain often falls on a dried up soil and badly protected by vegetation [68].
The basin of Wadi Mina is bare in autumn and, after a long warm period, the autumn floods imply systematically suspended solids inputs in maximum number and this phenomenon is relatively reduced for the following season, in winter or when the lands forming the basin are saturated and the vegetation cover is developed [68].
On the one hand, the torrential and aggressive rains are the ones occurring in October and November and they tear off major quantities of SPM and, on the other hand, the weak vegetation cover of the preceding season (summer) favors the destruction of the soil aggregates that shall be subsequently transported in suspension by the watercourse.
In winter, the erosion of the bed and the banks along the watercourse becomes important because of the increase of discharges in Wadi, and as well runoffs are generated by rainy sequences which are relatively abundant but of weak intensity (0.4 mm) in Takhmert and (29.1 mm) in Ain Hamara. They find a loose soil with vegetation cover that confers soil roughness and favors water retention [128].
In winter, the runoffs remain important, although this season is a little rainy and cold transition period with a succession of freezing and thawing which is caused essentially by the important water reserves, stored in the soil, following the autumn rains.
In spring, the erosion of the bed and the banks along the watercourse becomes important as this is essentially related to the increase discharges in the Wadi and the herbaceous cover and cultures that considerably reduce the mobilization of thin materials on the slopes. We can add as well the reduction of rains of heavy intensity compared with the winter season.
At the end of spring, the soil is humid and the vegetation cover is well developed. On the slopes, the thin soils saturate rapidly and develop important erosion in the gully and mass movement [129,130]. In addition, in this period, the floods have an important role in the production of sediments in the drainage networks. In addition, Hallouz et al. [67], in their study on the Wadi Mina basin, found that the maximum values of the solid inputs, for all the sub-basins, are observed at the beginning of autumn and at the end of the spring, this variability is explained on the one hand by the variation of the vegetal cover (bare soils) during the year and the erosive nature of the autumn rains (high intensities) and on the other hand by the releases made by the Bakhadda Dam, so these two factors allow the first autumn floods to transport large quantities of sediment after a long dry season characterized by high temperatures and the destruction of soil aggregates. Rainfall erosivity is the potential ability of rainfall to cause soil loss [131]. The rainfall erosivity index represents the climate influence on water related soil erosion [132]. Rainfall erosivity is the impact of the kinetic energy of raindrops on soil. Higher velocity and larger size of the raindrops results in higher kinetic energy and higher soil loss. According to Yu [132], most soil erosion researchers and soil conservationists recognize the positive correlation between erosivity and rainfall intensity [133].
3.4. Annual Inputs
The calculation of the sediment average specific load (Ds) in tons is given by the product sum of three variables Q (m3·s−1), C (g·L−1) and T (duration in seconds). Table 7 resumes the average specific exportations in tons per km2 and per year for each sub-basin.
The average specific sediment discharge of Wadi Mina at the Sidi M’Hamed Ben Aouda Dam is 860 t·km−2·year−1 (the sum of degradations measured at the stations Wadi El Abtal and Sidi Abdelkader El Djilali to which is added the load produced on the surface of the transitional basin VI). We note that this value is very moderated in relation to those published for other basins in the region, such as the basin of Wadi Mazafran (Algerian coastal basins), Wadi Isser (Lakhdaria), Wadi Sebdou (basin Tafna), Wadi Agrioum (east Algerian), whose specific degradations amount to 1610, 2300 and 1120 t·km−2·year−1 [134,135] and 5000 t·km−2·year−1 [136]. Meddi [68] already reported that Wadi Haddad à Sidi Abdelkader El Djilali has a high average specific load in relation to other catchment areas (Ds = 965 t·km−2·year−1), which means that this sub-basin continues to be the busiest supplier of sediments towards the dam. This catchment area is the most favorable for the runoff from the point of view of topography and vegetation cover [68]. It is characterized by a discontinuous and poor vegetation cover during warm season. The concentration of floods after the warm season in October and sometimes in May, with strong intensities, would generate strong concentrations in sediments during these months. This context favorable to the runoff and, consequently, to the solid transport explains this serious degradation of soils for this catchment area, in addition to its geological nature which is very favorable as well to this event (marl) [68].
The lowest degradation values are observed for Wadi Abd at Takhmert (220 t·km−2·year−1) and Wadi Mina upstream of Sidi Ali Ben Amar (239 t·km−2·year−1). These values can well be explained by the less favorable nature of the runoff of basins which are characterized by floods of average or light power [68].
3.5. Where from Does Originate the Sediments of the Dam?
Thus, the results of bathymetric surveys performed at the level of the SMBA Dam indicated that the capacity loss of the dam since its commissioning in 1978 and until 2004 is evaluated at 82 × 106 m3 (Figure 10), equivalent to a third (1/3) of its initial capacity. Remini and Bensafia [64] estimated that, in 2010, the SMBA Dam registers a sediment volume equal to 109 × 106 m3, namely an annual average loss of about 3.5 × 10⁶ m3·year−1, equivalent to a sediment load equal to 5.6 × 10⁶ t·year−1 that deposits in the impoundment of the dam (considering an average density of the sediment of 1.6 t·m−3).
Indeed, according to bathymetric surveys conducted in 1978, 1985, 2000 and 2004, the SMBA Dam has lost much of its capacity (Figure 11), from 1978 to 1985 annual loss estimated to 1.35 million m3, from 1985 to 2000, an annual loss of about 4.41 million m3 and from 2000 to 2004 an annual loss was estimated to 1.42 × 10⁶ m3, over all these periods of bathymetric measurements, the highest loss rate was observed between 1985 and 2000, which is probably due to exceptional rains that hit the region during this period, thus in October 1993: “Twenty minutes of rain do 16 dead and a dozen of missing persons in Relizane” [137].
It is important to note that at the start of the dam exploitation, the reservoir filling with fine particles is carried out linearly according to weather conditions. Starting with 2000, there was a decrease in siltation, mainly caused by the dam exploitation mode (periodic shelving of fine particles by the outlet gates) [14].
Conversely, the calculations made by the concentration measures for the basin of Wadi Mina at the level of the station of Wadi El Abtal and Wadi Haddad, at the Sidi AEK Djilali station level, and which control a surface of 5856 km2, generated a load equal to 5.2 × 10⁶ t·year−1 (Table 8). The difference of 400,000 t·year−1 corresponds to the sedimentary inputs of the micro-basin surrounding the impoundment (192 km2) and the autochthon sedimentation in the impoundment, without being able to establish the parts of each source. To elaborate further on this topic, we should deploy specific measures as those presented by Maleval [138]. This difference of 400,000 t·year−1 corresponds to a specific degradation of 21 t·ha−1·year−1, namely 2.4 times more than the specific degradation for the entire basin of 5856 km2 (Table 8). This difference can be explained, on the one hand, by potential autochthon sedimentation, but which is not quantifiable for the moment, and, on the other side, by a specific degradation intrinsically higher because of geomorphology reasons, as the eroded products on the slopes arrive very rapidly at the impoundment, without the existence of an intermediary decantation area. Thus, this specific degradation value of 21 t·ha−1·year−1 is even higher than the “potential” erosion value of about 12 t·year−1, calculated by Toumi et al. [66] for the entire basin, based on the USLE equation.
For concluding this part, we can note that, in accordance with the digits in Table 8, over 90% of sediments of the SMBA Dam appears to come from the contributions of the Wadi Haddad and Wadi Mina upstream of the dam.
Thus, Touaibia [45] showed that the USLE equation allowed to map each parameter of this equation for the entire basin of Wadi Mina and superposition of layers (for each parameter) in a GIS and resulted in values of degradation in t·ha−1·year−1 (Table 9).
Indeed, the results of the concentration measures as well as those found by the erosive potentials equation (USLE) show that the basin upstream of the SMBA (1B) Dam (Figure 12) presents an important erosive risk, because it produces a specific degradation equal to 13.36 t·ha−1·year−1 and 19.64 t·ha−1·year−1, respectively, this because of the predominance of tertiary marls in this part of the basin and which are covered in northeast by calcareous sandstone and dolomites and the slopes, which are from 12% to 30%, generating important corrosive risks with occurrence of the signs caused by diffuse streaming, without forgetting the sparse vegetation cover [139]. In addition, the specific degradations vary from 11.54 to 12.64 t·ha−1·year−1 at the basin level (5B) upstream of the Bakhadda Dam and, respectively, the basin of Wadi Haddad (2B), calculated by the USLE equation [66] against 2.39 to 9.64 t·ha−1·year−1 on the same sub-basins, these values remaining high, considering that the basin of Wadi Haddad presents a lithology constituted by the Continental Quaternary (this formation is represented by alluvia, regs and terraces), the Continental Pliocene (represented by lacustrine limestone) and the marine Lower Miocene (represented by a marly formation). The basin vegetation is formed essentially of scrubland, representing almost 30% from the entire basin (degraded forest). The vegetation is overgrazed and is discontinuous in the space [68] and the basin (5B) upstream of the Bakhadda Dam is dominated by limestone and dolomites alternating with marls and an average dense vegetation and slopes varying from 5% to 12% that present weak erosion risks, but can be strong with the presence of agricultural activities, mainly grain farming that dominates soil occupation [139].
The values of specific degradation are low in the southwest part of the basin (basin of Wadi El Abd) and thus the fields in this regional are quasi-flat (slope lower than 10%) [139], and thus the specific degradations are equal to 3.86 t·ha−1·year−1 at the level of the Takhmert station and 8.82 t·ha−1·year−1 at the Ain Hamara station [66], in accordance with the calculations generated using the USLE equation, and varying from 2.20 t·ha−1·year−1 at the level of the Takhmert station and 5.02 t·ha−1·year−1 at the Ain Hamara station (Table 9), this basin marking the existence of marls which are friable rocks, thus a favorable factor for degradation and an insufficiency of forest vegetation and the surfaces are often used for pasture [128]. The climatic conditions semiarid are associated with a high degree of rainfall irregularity with average precipitations of 266 mm in Ain Hamara and 238 mm in Takhmert.
The maxim value of losses in soil is registered at the level of the dam basin (400,000 t·ha−1), this value representing the sum of the solid transport by suspension and that of the bed load which is estimated between 15% and 25% of the suspension [140], namely a loss in soil equal to 392,157 t·ha−1 and by bed load equal to 78,431 t·ha−1, estimating a load transport equal to 20% of the suspension.
Compared to the found values, we observe that the basin upstream of the SMBA Dam (1B) is the greatest producer of sediments towards the dam because it shows a specific degradation equal to 13.36 t·ha−1·year−1, value found after the elimination of release of water from the Bekhadda Dam, estimated at 1.32 t·ha−1·year−1 on average, considering that this dam registers an average loss amounting to 0.27 × 10⁶ m3 since its launching in 1936; this result corroborates with that found by Touaibia [45] as well as with the works of GTZ [141], because this area is dominated by a marly lithological formation situated often on the piedmonts of a slope of 10 to 20% (Table 9), favouring soil erosion.
In addition, the other sub-basins record specific degradation varying from 2.2 to 9.64 t·ha−1·year−1, and these values are close to those found by [66] using the USLE equation, except for the basin of Wadi Mina upstream at the level of the station of Sidi Ali Ben Amar, where the calculated value using the USLE equation is 4.83 times higher than the one calculated by the direct concentration measures (Figure 12). The value of the basin 5B using the concentrations measure considers the solids quantities sedimented in the dam impoundment in contrast to that generated by the USLE equation which does not consider the volumes of sediments caught in the Bakhadda dam but it only models potential soil erosion taking place. This calculation approach generated the difference between the estimated values by the two techniques (Table 9).
In fact, we only measured the sediment that actually reached the stream system, so the difference between what is measured in the current and what is predicted by USLE is largely due to the deposits of halfway that do not reach the watercourse. This does not prevent lake like Bakhadda dam also playing a role of intermediate trapping on the watercourse.
Soil erosion is such a highly variable process that one should avoid establishing rules for larger catchments without measuring at least a few of the processes taking place directly. Sediment concentration may point towards the real processes, but they are still an indirect value for material eroded. In this study, the purpose of the comparison of the different sources of information that we use is to evaluate the validity of the observed and modelled values: are the fluxes measured in the rivers (SPM) compatible with the rates of erosivity provided by USLE? Does the sedimentation rate in the dam reflect the orders of magnitude of SPM observed in streams? Thus, sub-basins can be used to locate a potential source of sediment in small sub-basins close to the reservoir, for which the erosivity rate could be higher, and/or the proximity to the reservoir allows for greater fraction of SPM carried to reach the reservoir.
The analysis of the photo of the slopes of the dam basin (Figure 13) indicates a favorable environment (inclined slopes and formed of slightly resistant soil, little or no vegetation cover, aggressive climate and human activities), for causing important inputs in sediments that shall deposit directly in the lake. This would explain largely the very serious specific degradation calculated for the small catchment area downstream with 192 km2 that surrounds the dam (6B) after the last station of hydrologic measurement, obtained by the difference between the equivalent in SPM, deducted from the dam silt volume and the concentration measures in SPM at the upstream hydrological station.
Indeed, the average annual streaming can reach 15–30%, varying with the years and depending on the fallow land silting by weeds between two weedings, but as well with the distribution of showers depending on the agricultural works and the prior humidity of the soil [142]. Average showers falling on the bare, saturated and crusted surface soil can cause a streaming exceeding 60–80%. Here lies the greatest risk for the dams silting because, gathering in gullies and Wadis, the floods peaks move very important quantities of materials [142].
We consider that the matters in suspension, measured at the catchment area outlet, do not reflect the current dynamics of all the slopes, but they reflect the transport capacity of streaming and runoff waters in the gullies. There exists a stock of fine sediments which is progressively evacuated towards the SMBA Dam and in a rhythm that depends on the available force: that of floods, related in particular to the quantity of rains received and the streaming coefficient [143].
Thus, depending on the gullied lands and the type of gully, the input to silting of an impoundment can reach and even exceed 30% [144].
4. Discussion
In this study, we could use the maximum of information available which allowed us, on the one hand, to calculate the quantities of solid transport on the whole of the watershed, and, on the other hand, to propose the hypotheses on the origin of the material sedimented in the SMBA Dam.
The rain, the discharge, and concentrations of SPM are fairly well known on the watershed of the Wadi Mina and its main tributaries.
Rainfall series for which a rupture could be detected are more to the north than to the south. The recorded rainfall deficits frequently are around 19–20%. This rainfall deficit is thus felt for over three decades and seems to have spread over the basin during the 1970s. Indeed, 13 stations time series show a significant rupture during the 1970s across the entire watershed of Wadi Mina which represents 50% of rainfall stations used in this study.
The largest number of monthly ruptures was detected during the 1970s especially during the months of January and April with, respectively, 18 and 15 ruptures whose average monthly rainfall accounts for about 12% of annual rainfall.
This decline of rains has resulted in a decrease in discharge, the latter, know an overall decrease since the 1970s, or the probable ruptures are observed both in the rainy season and in the dry season. At the annual time step, probable rupture dates are 1974, 1975, 1980 and 1994 which generally correspond to years where most of the ruptures detected at the monthly time step took place.
These results show a satisfactory agreement with the dates detected on the series of annual and monthly rainfall of late 1970s/early 1980s. Thus, we suppose that reduced flows would be due to an overall decrease in precipitation over the watershed of Wadi Mina [47]. Small changes in precipitation can have significant impact on the flow of surface water [145]. In fact, climate is recognized to be the main factor in semi-arid Mediterranean areas of Algeria which experience short and intense rain episodes, high evaporating power of wind, prolonged droughts and freezing and thawing cycles [42,45,46].
The recent increase of rainfall represented by a significant occurrence of positive ruptures in time series during the 2000s is not followed by an increase in discharges, which might be explained by an increasing impact of dams and small hydraulic structures over the basins that mitigate the effect of rainfall on the hydrological regime of sub basins.
With the aid of HYFRAN-PLUS software used in the second part, the assumptions of stationary and independence are verified on all the floods of the Wadi Mina basin and these are classified in Category C, following the GEV distribution.
In addition, the dates of rupture detected on each sub basin showed a decrease of floods from 1970 onward. The flood values change around the ruptures date, and the study concluded that, on the entire study area, a flood, for a twenty-year return period before the rupture date, became centennial after.
The two parts of this study have shown that the feeling of local population of a decrease in rainfall regime in the region is absolutely founded.
The last part of the study concerns the relationship between the suspended sediment transport on the Wadi Mina and siltation of the SMBA Dam.
Thus, the annual average concentrations of SPM were compared with annual average discharge. Despite year-to-year irregularities at the Sidi Aek Djilali station, concentrations and discharges have changed in opposite directions [68]. We found that ruptures were detected on the rainfall and discharges from the mid-1970s, this result show that is no effect of ruptures in precipitation and discharge on the solid load response since the discharge and rainfall decrease in the 1970s and increase in the early 2000s while the sediment load is still increasing.
The watershed of Wadi Haddad in Sidi Abdelkader El Djilali has a specific charge very high compared to other basins (Ds = 965 t·km−2·year−1) which means that even after the rupture in the rainfall time series, and the development of agriculture and dams, this sub-basin is still the provider of the largest amount of sediment to the reservoir. The lowest degradation values are observed on the Wadi in Abd Takhmert (220 t·km−2·year−1) and the Wadi Mina upstream in Sidi Ali Ben Amar (239 t·km−2·year−1). Wadi Mina basin annually provides 38 million m3 of water with a flow of 2.6 million tons of suspended sediment, which therefore corresponds to a relatively low specific degradation of about 860 t·km−2·year−1, a value significantly below published estimates for neighboring basins in Algeria and North Africa, This value indicates an increase in recent decades, which could be related to an increased susceptibility to soil erosion in the basin, under the combined effect of climatic and anthropogenic forcing [51]. However, the quantities of sediment exported by the Wadi are highly variable from one year to another. Note that the year 1994/95 alone represents a contribution of 8.15 million tons from the Wadi Abd, i.e., a specific degradation of more than 1500 t·km−2·year−1, a value that corresponds to estimates found for Maghreb watersheds as a whole.
We found that the basin upstream of the SMBA Dam (1B) is the greatest producer of sediments towards the dam because it shows a specific degradation equal to 13.36 t·ha−1·year−1, a value found after the elimination of release of water from the Bekhadda Dam, considering that this dam registers an average loss amounting to 0.27 × 10⁶ m3 since its launching in 1936. In addition, the other sub-basins record specific values varying from 2.2 to 9.64 t·ha−1·year−1, and these values are close to those found by Toumi et al. [66] using the USLE equation, except for the basin of Wadi Mina upstream at the level of the station of Sidi Ali Ben Amar, where the calculated value using the USLE equation is 4.83 times higher than the one calculated by the direct concentration measures. The value of the basin 5B using the concentrations measure considers the solids quantities sedimented in the dam impoundment in contrast to that generated by the USLE equation which does not consider the volumes of sediments caught in the Bakhadda Dam but only models potential soil erosion taking place. In fact, we only measured the sediment that actually reached the stream system, so the difference between what is measured in the current and what is predicted by USLE is largely due to the deposits of halfway that do not reach the watercourse. This does not prevent lake-like Bakhadda Dam also playing a role of intermediate trapping on the watercourse.
Soil erosion is such a highly variable process that one should avoid establishing rules for larger catchments without measuring at least a few of the processes taking place directly. Sediment concentration may point towards the real processes, but they are still an indirect value for material eroded. In this study, the purpose of the comparison of the different sources of information that we use is to evaluate the validity of the observed and modeled values. Thus, sub-basins can be used to locate a potential source of sediment in small sub-basins close to the reservoir, for which the erosivity rate could be higher, and/or the proximity to the reservoir allows for greater fraction of SPM carried to reach the reservoir.
According to the bathymetric surveys carried out at the SMBA Dam, loss in water capacity of this dam since its commissioning in 1978 until 2004 is estimated at 82 million m3, equivalent to a third of its original capacity. According to Remini and Bensafia [63], in 2010 the SMBA Dam contains a volume of sediments equal to 109 × 106 m3 or an annual average loss of about 3.5 × 10⁶ m3·year−1.
Based on these results, we concluded that over 90% of the sediments of the SMBA Dam come from the contributions of the Wadi Haddad and Wadi Mina upstream of the dam, but the specific degradation around the dam is higher than over the rest of the basin. Currently the dam filling by sediments is about 48%, so it should be completely silted up by 2048, without dynamic change.
Despite all the efforts made in recent years, the dam silting phenomenon has increased due to the increase in anthropogenic influence and erosion.
Definitively, the decrease in rainfall, which hit the region since the mid-1970s, induced a progressive degradation of the vegetation cover combined with the increase of summer thunderstorms, and induces changes in the functioning of the watershed with a greater susceptibility to erosion. For specific years, moderate rainfall and runoff generated considerable sedimentary flow.
5. Conclusions
This article presents a study of erosion, sedimentation and climate change on Wadi Mina, at the Sidi M’Hamed Ben Aouda Dam in the northeast of Algeria, in a semiarid area. It is important to fallow the evolution of water resources available for this dam in a variable climatic environment.
We have noted a rupture corresponding to a decrease of precipitations during the mid-1970s over the whole Wadi Mina basin which 58% series present a rupture in 1976. These results confirm as well the occurrence in Morocco of a pluviometric deficit starting with 1970 and its continuation during the 1980s, an extremely severe and long drought episode [106]. At the level of North Africa, the results obtained by Meddi et al. [11] in Algeria and by GIEC [107] in Tunisia indicate the same rupture period and show the spatial extension of the drought, accompanied by a net pluviometric reduction.
In addition, the discharges register a global decrease since 1970. At annual level, the probable rupture dates are 1974, 1975, 1980 and 1994, which corresponds generally to the ruptures detected at month level. In addition, the ruptures on the series of annual daily maximum were for the most part noted in 1970, 1984 and 1995 and the ruptures dates for the annual daily minimum series are detected in 1972, 1981 and 1994. The rupture in the daily maximum flows series is thus never noted the same year as in the average annual flows series, while there are the same ruptures dates for the average annual flows and the minimum daily flows.
As for the majority of watercourses, we found a power relation [127] for Wadi Mina, connecting the concentration of suspended matters in g·L−1 to the liquid discharge in m3·s−1. At seasonal scale, the analysis shows that autumn and spring are distinguished by their strong liquid discharges generating an important flow of suspended particles matters (SPM). The maximum solid flow is of 42,365 kg·s−1, achieved in September 1994, resulting from a liquid discharge of more than 351 m3·s−1.
In contrast, during winter and summer, we note a net regression of liquid discharge that no longer exceed 84 m3·s−1 in winter and 38 m3·s−1 in summer.
The average specific sediment discharge of Wadi Mina at the Sidi M’hamed Ben Aouda Dam is 860 t·km−2·year−1. We can note that over 90% of sediments of the SMBA Dam appears to come from the contributions of the Wadi Haddad and Wadi Mina upstream of the dam.
In fact, starting in the late 1980s, annual production of sediments became seven times larger than the previous period, with an increase four times greater of contribution of the dry season rates [146].
Author Contributions
F.H. wrote the main paper, and F.H., M.M., G.M., S.T., S.A.R. discussed the results and implications and commented on the manuscript at all stages. F.H., M.M., G.M., S.T., S.A.R. contributed extensively to the work presented in this paper.
Funding
This study was supported by funding from the AUF through the program SIGMED (MeRSI No. 6313PS005) Bureau Western Europe and North Africa.
Acknowledgments
Thanks to ANRH for the hydrological and rainfall data.
Conflicts of Interest
The authors declare no conflict of interest.
References
- Laborde, J.P. Carte Pluviométrique de L’ALGÉRIE du Nord à L’échelle du 1/500000; Projet PNUD/ALG/88/021, Une Carte Avec Notice Explicative; Agence Nationale des Ressources Hydrauliques: Bir Mourad Rais, Algeria, 1993; 44p. (In French) [Google Scholar]
- Rossel, F.; Le Goulven, P.; Cadier, E. Répartition spatiale de l’influence de l’ENSO sur les précipitations annuelles de l’Equateur. Rev. Sci. L’eau J. Water Sci. 1999, 12, 183–200. (In French) [Google Scholar] [CrossRef] [Green Version]
- Touazi, M.; Laborde, J.P. Cartographie des pluies annuelles en Algérie du Nord. Assoc. Int. Climatol. 2000, 13, 192–198. (In French) [Google Scholar]
- Meddi, H. Quantification des Précipitations: Application au Nord-Ouest Algérien Méthodologie Pluvia; Mémoire de Magister, Centre Universitaire de Mascara: Mascara, Algeria, 2001; 160p. (In French) [Google Scholar]
- El Mahi, A. Déficit Pluviométrique des Dernières Décennies en Algérie du Nord and Son Impact sur les Ressources en Eau; Mémoire de Magister, Centre Universitaire de Mascara: Mascara, Algeria, 2002; 120p. (In French) [Google Scholar]
- Meddi, M.; Hubert, P. Impact de la modification du régime pluviométrique sur les ressources en eau du Nord-ouest de l’Algérie. In Proceedings of the International Symposium on Hydrology of the Mediterranean and Semi Arid Regions, Montpellier, France, 1–4 April 2003; IAHS Publication: Wallingford, UK, 2003; pp. 229–235. (In French). [Google Scholar]
- El Mahi, A.; Meddi, M.; Matari, A.; Kattrouci, K. Etat de la pluviométrie en période de sécheresse en Algérie du Nord et sa relation avec le phénomène ENSO. In Acte du Colloque ‘Terre and Eau’; Algerian Journal of Arid Areas: Annaba, Algeria, 2004; pp. 420–423. (In French) [Google Scholar]
- Talia, A.; Meddi, M. La pluvio-variabilité dans le Nord de l’Algérie. In Actes du Colloque ‘Terre and Eau’; Algerian Journal of Arid Areas: Annaba, Algeria, 2004; pp. 477–480. (In French) [Google Scholar]
- Meddi, H.; Meddi, M. Variabilité spatiale and temporelle des précipitations du Nord-Ouest de l’Algérie. Geogr. Tech. 2007, 2, 49–55. (In French) [Google Scholar]
- Bekoussa, B.; Meddi, M.; Jourde, H. Forçage climatique and anthropique sur la ressource en eau souterraine d’une région semi-aride: Le cas de la plaine de Ghriss (Nord-Ouest algérien). Sécheresse 2008, 19, 173–184. (In French) [Google Scholar]
- Meddi, M.; Talia, A.; Martin, C. Evolution récente des conditions climatiques et des écoulements sur le bassin versant de La Macta Nord-Ouest de l’Algérie. Géogr. Phys. Environ. Physio-Géo 2009, 3, 61–84. (In French) [Google Scholar] [CrossRef]
- Meddi, M.; Meddi, H.; Assani, A. Variabilité temporelle des précipitations dans les bassins de la Macta et la Tafna, Nord-Ouest d’Algérie. Water Ressour. Manag. 2010, 24, 3817. (In French) [Google Scholar] [CrossRef]
- Niazi, S.; Snoussi, M. Evaluation des risques d’inondation à une élévation accélérée du niveau de la mer sur le littoral de Tétouan Méditerranée occidentale marocaine. In Proceedings of the 3ème Journée Internationales de Géosciences de l’environnement, El Jadida, Morocco, 8–10 June 2005. (In French). [Google Scholar]
- Agence Nationale des Barrages et Transferts (ANBT). Rapport Annuel D’activité sur L’état des Barrages Algériens; ANBT: Kouba, Algeria, 2014. (In French) [Google Scholar]
- Williams, J.R.; Berndt, H.D. Sediment yield computed with universal equation. J. Hydraul. Div. 1972, 98, 2087–2098. [Google Scholar]
- Lahlou, A. Modèles de prédiction de la sédimentation des retenues de barrages des pays du Grand Maghreb. In Proceedings of the Atelier International UNESCO-AISH-ENIT sur L’Application des Modèles Mathématiques à L’évaluation des Modifications de la Qualité Des Eaux, Tunis, Tunisia, 7–12 May 1990; pp. 312–324. (In French). [Google Scholar]
- Wicks, J.M.; Bathurst, J.C. SHE-SED: A physically based, distributed erosion and sediment yield component for the SHE hydrological modeling system. J. Hydrol. 1996, 175, 213–238. [Google Scholar] [CrossRef]
- Kassoul, M.; Abdelgader, A.; Belorgey, M. Caractérisation de la sédimentation des barrages en Algérie. Rev. Sci. L’eau J. Water Sci. 1997, 3, 339–358. (In French) [Google Scholar] [CrossRef] [Green Version]
- Terfous, A.; Meghnounif, A.; Bouanani, A. Etude du transport solide en suspension dans l’oued Mouillah (Nord-Ouest Algérien). Rev. Sci. L’eau J. Water Sci. 2001, 14, 173–185. (In French) [Google Scholar] [CrossRef] [Green Version]
- Abdellaoui, B.; Merzouk, A.; Aberkan, M.; Albergel, J. Bilan hydrologique and envasement du barrage Saboun (Maroc). Rev. Sci. L’eau J. Water Sci. 2002, 15, 737–748. (In French) [Google Scholar] [CrossRef]
- Marzougui, A.; Ben Mammou, A. Le barrage de l’Oued Sejnane: Quantification de l’alluvionnement et évaluation de l’érosion spécifique de son bassin versant. Geo-Eco-Trop 2006, 30, 57–68. (In French) [Google Scholar]
- Remini, B.; Hallouche, W. Prévision de l’envasement dans les barrages Du Maghreb. Larhyss J. 2005, 4, 69–80. (In French) [Google Scholar]
- Lahlou, A. Envasement des Barrages au Maroc [Siltation of Dams in Morocco]; Wallada: Casablanca, Morocco, 1994; p. 286. ISBN 9981823074. (In French) [Google Scholar]
- Saadaoui, M. Érosion et Transport Solide en Tunisie. Mesure et Prévision du Transport Solide Dans les Bassins Versants et de L’envasement Dans les Retenues des Barrages; Direction Générale des Barrages et des Grands Travaux Hydrauliques (DGBGTH), Ministère de L’Agriculture, Direction Générale des Ressources en Eau, Direction des Eaux de Surface: Tunis, Tunisie, 1995; 30p. (In French) [Google Scholar]
- Abid, M. Envasement des Barrages en Tunisie; Direction Générale des Barrages et des Grands Travaux Hydrauliques (DGBGTH); Ministère de L’Agriculture: Tunis, Tunisie, 1998; 69p. (In French) [Google Scholar]
- Bourouba, M. Contribution à l’étude de l’érosion et des transports solides de l’Oued Medjerda supérieur (Algérie orientale). Bull. Rés. Eros. 1998, 18, 76–97. (In French) [Google Scholar]
- Colombani, J.; Olivry, J.C.; Kallel, R. Phénomènes exceptionnels d’érosion et de transport solide en Afrique aride et semi-aride. In Challenges in African Hydrology and Water, Ressources, Proceedings of the Harare Symposium, Harare, Zimbabwe, 23–27 July 1984; IAHS Publication: Oxfordshire, UK, 1984; Volume 144, pp. 295–300. (In French) [Google Scholar]
- Kettab, A. Les ressources en eau en Algérie: Stratégies, enjeux et vision. Desalination 2001, 136, 25–33. (In French) [Google Scholar] [CrossRef]
- Remini, B. La Problématique de L’eau en Algérie; Office des Publications Universitaires: Alger, Algérie, 2005; p. 162. (In French) [Google Scholar]
- Boithias, L.; Acuña, V.; Vergoñós, L.; Ziv, G.; Marcé, R.; Sabater, S. Assessment of the water supply: Demand ratios in a Mediterranean basin under different global change scenarios and mitigation alternatives. Sci. Total Environ. 2014, 470, 567–577. [Google Scholar] [CrossRef] [PubMed]
- Surface Water Resources Mobilization. Document of Algerian Ministry of Water Resources. Available online: http://www.mree.gov.dz (accessed on 24 April 2018).
- Hamiche, A.; Boudghene Stambouli, A.; Flazi, S. A review on the water and energy sectors in Algeria: Current forecasts, scenario and sustainability issues. Renew. Sustain. Energy Rev. 2015, 41, 261–276. [Google Scholar] [CrossRef]
- Bouzid-Lagha, S.; Djelita, B. Study of eutrophication in the Hamman Boughrara Reservoir (Wilaya de Tlemcen, Algeria). Hydrol. Sci. J. 2012, 57, 186–201. [Google Scholar] [CrossRef]
- Tidjani, A.E.; Yebdri, D.; Cherif, E.A. Ampleur de L’envasement Dans les Barrages Algériens; Documents Techniques en Hydrologie; UNESCO: Paris, France, 2000; Volume 29, pp. 121–128. (In French) [Google Scholar]
- Bourouba, M. Phénomène de transport solide dans les Hauts Plateaux Orientaux. Cas de l’Oued Logmane et oued Leham dans le bassin de la Hodna. Rev. Sci. Technol. 1998, 9, 5–11. [Google Scholar]
- Megnounif, A.; Terfous, A.; Bouanani, A. Production et transport des matières solides en suspension dans le bassin versant de la Haute-Tafna (Nord-Ouest algérien). Rev. Sci. L’eau J. Water Sci. 2003, 16, 369–380. [Google Scholar] [CrossRef] [Green Version]
- Achite, M.; Meddi, M. Variabilité spatio-temporelle des apports liquide et solide en zone semi-aride. Cas du bassin versant de l’oued Mina (nord-ouest algérien). Rev. Sci. L’eau J. Water Sci. 2005, 18, 37–56. [Google Scholar] [CrossRef] [Green Version]
- Achite, M.; Ouillon, S. Suspended sediment transport in semiarid watershed, Wadi abd, Algeria (1973–1995). J. Hydrol. 2007, 343, 187–202. [Google Scholar] [CrossRef]
- Ghenim, A.; Terfous, A.; Seddini, A. Étude du transport solide en suspension dans les régions semiarides méditerranéennes: Cas du bassin versant de l’Oued Sebdou (Nord-Ouest Algérien). Sécheresse 2007, 18, 39–44. (In French) [Google Scholar]
- Ghenim, A. Étude des Écoulements et des Transports Solides Dans les Régions Semi-Arides Méditerranéennes. Ph.D. Thesis, Université de Tlemcen, Chetouane, Algérie, 2008. [Google Scholar]
- Zettam, A.; Taleb, A.; Sauvage, S.; Boithias, L.; Belaidi, N.; Sánchez-Pérez, J.M. Modeling Hydrology and Sediment Transport in a Semi-Arid and Anthropized Catchment Using the SWAT Model: The Case of the Tafna River (Northwest Algeria). Water 2017, 9, 216. [Google Scholar] [CrossRef]
- Achite, M.; Ouillon, S. Recent changes in climate, hydrology and sediment load in the Wadi Abd, Algeria (1970–2010). Hydrol. Earth Syst. Sci. 2016, 20, 1355–1372. [Google Scholar] [CrossRef] [Green Version]
- Abdelkader Benkhaled & Boualem Remini. Temporal variability of sediment concentration and hysteresis phenomena in the Wadi Wahrane basin, Algeria. Hydrol. Sci. J. 2003, 48, 243–255. [Google Scholar] [CrossRef]
- Khanchoul, K.; Jansson, M.B.; Lange, Y. Comparison of suspended sediment yield in two catchments, northeast, Algeria. Z. Geomorphol. 2007, 51, 63–94. [Google Scholar] [CrossRef]
- Touaibia, B. Problématique de l’érosion et du transport solide en Algérie septentrionale. Sécheresse 2010, 21, 333–335. (In French) [Google Scholar]
- Houyou, Z.; Bielders, C.L.; Benhorma, H.A.; Dellal, A.; Boutemdjet, A. Evidence of strong land degradation by wind erosion as a result of rainfed cropping in the Algerian steppe: A case study at Laghouat. Land Degrad. Dev. 2014, 27, 1788–1796. [Google Scholar] [CrossRef]
- Hallouz, F.; Meddi, M.; Mahé, G. Modification du régime hydroclimatique dans le basin de l’oued Mina (Nord-Ouest d’Algérie). Rev. Sci. L’eau J. Water Sci. 2013, 26, 33–38. (In French) [Google Scholar] [CrossRef]
- Khomsi, K.; Mahe, G.; Sinan, M.; Snoussi, M.; Cherifi, R.; Nait Said, Z. Evolution des évènements chauds rares et très rares dans les bassins versants du Tensift et du Bouregreg (Maroc) et identification des types de temps synoptiques associés. In From Prediction to Prevention of Hydrological Risk in Mediterranean Countries; Ferrari, E., Versace, P., Eds.; University of Calabria: Cosenza, Italy, 2012; pp. 169–182. [Google Scholar]
- Mahé, G.; Aksoy, H.; Brou, Y.T.; Meddi, M.; Roose, E. Relationships between man, environment and sediment transport: A spatial approach. Rev. Sci. L’eau J. Water Sci. 2013, 26, 235–244. [Google Scholar] [CrossRef]
- Laouina, A.; Aderghal, M.; Al Karkouri, J.; Chaker, M.; Machmachi, I.; Machouri, N.; Sfa, M. Utilisation des sols, ruissellement et dégradation des terres, le cas du secteur Sehoul, région atlantique, Maroc. Sécheresse 2010, 21, 309–316. (In French) [Google Scholar]
- Mahè, G.; Benabdelfadel, H.; Dieulin, C.; El Baraka, M.; Ezzaouini, M.; Khomsi, K.; Rouche, N.; Sinan, M.; Snoussi, M.; Tra Bi, A.; et al. Evolution des débits liquides et solides du Bouregreg, 2015. In Gestion Durable des Terres, Proceedings of the Réunion Multi-Acteurs sur le Bassin du Bouregreg, Rabat, Morocco, 28 May 2013; ARGDT: Rabat, Morocco, 2014; pp. 53–62. ISBN 978-9954-33-482-9. (In French) [Google Scholar]
- Touaïbia, B.; Gomer, D.; Ouffar, F.; Geyer, F. Approche Quantitative de l’Erosion Hydrique essais de simulation de pluies sur micro-bassins expérimentaux bassin versant de l’oued mina. W. Relizane. Bull. Rés. Eros. 1992, 12, 401–407. (In French) [Google Scholar]
- Touaïbia, B.; Dautrebande, S.; Gomer, D.; Mostefaoui, M. Quantification de l’érosion à partir d’implantation de quatre retenues collinaires dans la zone des marnes. W. Relizane Algérie. Bull. Rés. Eros. 1995, 15, 408–416. (In French) [Google Scholar]
- Touaïbia, B.; Dautrebande, S.; Gomer, D.; Aidaoui, A. Approche quantitative de l’érosion hydrique à différentes échelles spatiales: Bassin versant de l’Oued Mina. J. Sci. Hydrol. 1999, 44, 408–416. (In French) [Google Scholar] [CrossRef]
- Touaïbia, B.; Gomer, D.; Aidaoui, A. Estimation de l’index d’érosion de wischmeïer dans les micros bassins expérimentaux de l’oued mina en Algérie du Nord. Bull. Rés. Eros. 2000, 20, 478–484. (In French) [Google Scholar]
- Touaïbia, B.; Gomer, D.; Aïdaoui, A.; Achite, M. Quantification et variabilité temporelles de l’écoulement solide en zone semi-aride, de l’Algérie du Nord. Hydrol. Sci. J. 2001, 46, 41–53. (In French) [Google Scholar] [CrossRef]
- Gomer, D. Programme Hydrométrique: Projet Pilote D’aménagement Intégré; Rapport D’évaluation: Sidi-M’Hamed Ben Aouda, Algérie, 1990. (In French) [Google Scholar]
- Gomer, D.; Vogt, T. Determination of runoff and soil erosion under semiarid conditions using GIS to integrate Landsat TM, DEH und hydrological field data from the Wadi Mina project Algeria. In Proceedings of the International Meeting “Soil Erosion in Semi-Arid Mediterranean Arcas”, Taormina, Italy, 28–30 October 1993; European Society for Soil Conservation: Catania, Italy, 1993; pp. 19–93. [Google Scholar]
- Kouri, L.; Vogt, H. Détermination de la Sensibilité des Terrains Marneux au Ravinement au Moyen de Système D’information Géographique. B.V de L’oued Mina; Tell Oranais Algérie. Bull Rés. Eros. 1997, 17, 64–73. (In French) [Google Scholar]
- Kouri, L.; Vogt, H.; Gomer, D. Analyse des processus d’érosion hydrique linéaire en terrain marneux. Bassin-versant de l’oued Mina, Tell Oranais, Algérie. Bull. Rés. Eros. 1997, 17, 64–73. (In French) [Google Scholar]
- Gomer, D. Ecoulement et Érosion Dans les Petits Bassins Versants à sols Marneux Sous Climat Semi-Méditerranéen. Ph.D. Thesis, Wasserbau, Université de Kajsruhe, Karlsruhe, Germany, 1994. [Google Scholar]
- Touaïbia, B.; Achite, M. Contribution à la cartographie de l’érosion spécifique du bassin versant de l’Oued Mina en zone semi-aride de l’Algérie septentrionale. Hydrol. Sci. J. 2003, 48, 235–242. (In French) [Google Scholar] [CrossRef]
- Remini, B.; Bensafia, D. Envasement du Barrage de SMBA Algérie. Comité Scientifique Projet SIGMED Rabat Maroc. 2011. Available online: http://armspark.msem.univ-montp2.fr/SigMED/index.asp?menu=ComiteScientifique (accessed on 12 September 2012). (In French).
- Bekhti, B.; Errih, M.; Sidi Adda, M. Modélisation de la sédimentation dans les retenues de barrages en Algérie (barrage Es-Saada). Sécheresse 2012, 23, 38–47. (In French) [Google Scholar]
- Remini, B. Evolution spatio-temporelle de l’envasement dans le barrage S.M.B.A. In Proceedings of the Séminaire International, Relizane, Algérie, 2–5 June 2012; pp. 75–89. (In French). [Google Scholar]
- Toumi, S.; Meddi, M.; Mahé, G.; Brou, Y.T. Cartographie de l’érosion dans le bassin versant de l’Oued Mina en Algérie par télédétection et SIG. Hydrol. Sci. J. 2013, 58, 1–17. (In French) [Google Scholar] [CrossRef]
- Hallouz, F.; Meddi, M.; Mahe, G. Régimes des matières en suspension dans le bassin versant de l’oued Mina sur l’oued Cheliff (Nord-Ouest algérien). La Houille Blanche 2017, 4, 61–71. (In French) [Google Scholar] [CrossRef]
- Meddi, M. Hydro-Pluviométrie and Transport Solide Dans le Bassin Versant de L’oued Mina (Algérie). Ph.D. Thesis, University Louis Pasteur, Strasbourg, France, 1992. (In French). [Google Scholar]
- Dubreuil, P.; Guiscafre, J. La planification du réseau hydrométrique minimal. Cah. ORSTOM Sér. Hydrol. 1971, 8, 3–38. (In French) [Google Scholar]
- Mahieddine, M. Quantification and Variabilité Parcellaire Sous Simulation de Pluie Dans le Bassin Versant de L’Oued Mina. Ph.D. Thesis, Ecole Nationale Supérieure des Sciences Agronomiques, Alger, Algeria, 1997; 120p. (In French). [Google Scholar]
- Walling, D.E. Assessing the accuracy of suspended sediment rating curves for a small basin. Water Resour. Res. 1977, 13, 531–538. [Google Scholar] [CrossRef]
- Asselman, N.E.M. Fitting and interpretation of sediment rating curves. J. Hydrol. 2000, 234, 228–248. [Google Scholar] [CrossRef]
- El Mahi, A.; Meddi, M.; Bravard, J.P. Analyse du transport solide en suspension dans le bassin versant de l’Oued El Hammam (Algérie du Nord). Hydrol. Sci. J. 2012, 57, 1642–1661. (In French) [Google Scholar] [CrossRef]
- Tebbi, F.Z.; Dridi, H.; Morris, G.L. Optimization of cumulative trapped sediment curve for an arid zone reservoir: Foum El Kherza (Biskra, Algeria). Hydrol. Sci. J. 2012, 57, 1368–1377. [Google Scholar] [CrossRef] [Green Version]
- Louamri, A.; Mebarki, A.; Laignel, B. Variabilité interannuelle et intra-annuelle des transports solides de l’Oued Bouhamdane, à l’amont du barrage Hammam Debagh (Algérie orientale). Hydrol. Sci. J. 2013, 58, 1559–1572. (In French) [Google Scholar] [CrossRef] [Green Version]
- Hallouz, F. Transport Solide Dans le Bassin D’El Oued Mina et Sédimentation du Barrage SMBA. Ph.D. Thesis, Es-Sciences, Ecole Nationale Supérieure d’Hydraulique (ENSH), Soumaâ, Algeria, 2014; 219p. [Google Scholar]
- Ferguson, R.I. Accuracy and precision of mandhods for estimating river loads. Earth Surf. Process. Landf. 1987, 12, 95–104. (In French) [Google Scholar] [CrossRef]
- Cordova, J.R.; Gonzalez, M. Sediment yield estimation in small watersheds based on stream flow and suspended sediment discharge measurements. Soil Technol. 1997, 11, 57–69. [Google Scholar] [CrossRef]
- Jansson, M.B. Estimating a sediment rating curve of the Reventazon river at Palomo using logged mean loads within discharge classes. J. Hydrol. 1996, 183, 227–241. [Google Scholar] [CrossRef]
- Kendall, S.M.; Stuart, A. The Advanced Theory of Statistics, 1969–1976 ed.; Charles Griffin: London, UK, 1943. [Google Scholar]
- Lubes-Niel, H.; Masson, J.; Paturel, J.; Servat, E. Variabilité climatique et statistiques. Etude par simulation de la puissance et de la robustesse de quelques tests utilisés pour vérifier l’homogénéité de chroniques. Rev. Sci. L’eau J. Water Sci. 1998, 11, 383–408. (In French) [Google Scholar] [CrossRef] [Green Version]
- Maftei, C.; Bărbulescu, A.; Buta, C.; Şerban, C. Change points detection on variability analysis of some precipitation series, MAMECTIS/NOLASC/CONTROL/WAMUS’11. In Proceedings of the 13th WSEAS International Conference on Mathematical Methods, Computational Techniques and Intelligent Systems, Iasi, Romania, 1–3 July 2011; pp. 232–237. [Google Scholar]
- Khomsi, K.; Mahé, G.; Sinan, M.; Snoussi, M. Hydro-climatic variability in two Moroccan basins: Comparative analysis of temperature, rainfall and runoff regimes. In Climate and Land Surface Changes in Hydrology, Proceedings of the H01, IAHS-IAPSO-IASPEI Assembly, Gothenburg, Sweden, 22–26 July 2013; IAHS Publication: Oxfordshire, UK, 2013; pp. 193–190, 359. [Google Scholar]
- Bonneaud, S. Méthodes de Détection des Ruptures Dans les Séries Chronologiques; Rapport de Stage de fin D’études; ISIM: Montpellier, France, 1994. (In French) [Google Scholar]
- KHRONOSTAT. Logiciel D’analyse Statistique de Séries Chronologiques; IRD Ex: Paris, France, 1998; Available online: http://www.hydrosciences.org/spip.php?article239 (accessed on 14 October 2011). (In French)
- Lubes, H.; Masson, J.M.; Servat, E.; Paturel, J.-E.; Kouame, B.; Boyer, J.F. ICCARE: Rapport n 3: Caractérisation de Fluctuations Dans Une Série Chronologique par Applications de Tests Statistiques: Étude Bibliographique; IRD Ex: Montpellier, France, 1994; 22p. (In French) [Google Scholar]
- Meddi, M.; Humbert, J. Etude des potentialités de l’écoulement fluvial dans le Nord de l’Algérie en vue d’une réalimentation des aquifères. In Eaux Sauvages, Eaux Domestiquées, Hommage à L. DAVY; University of Provence: Marseille, France, 2000; pp. 177–190. [Google Scholar]
- Singla, S.; Mahé, G.; Dieulin, C.; Driouech, F.; Milano, M.; El Guelai, F.Z.; Ardoin-Bardin, S. Evolution des relations pluie-débit sur des bassins versants du Maroc. In Global Change: Facing Risks and Threats to Water Resources, Proceedings of the Sixth World FRIEND Conference, Fez, Morocco, 25–29 October 2010; IAHS Publication: Oxfordshire, UK, 2010; Volume 340, pp. 679–687. [Google Scholar]
- Hubert, P.; Carbonnel, J.P.; Chaouche, A. Segmentation des séries hydrométéorologiques. Application à des séries de précipitations and de débits de l’Afrique de l’Ouest. J. Hydrol. 1989, 110, 349–367. (In French) [Google Scholar] [CrossRef]
- Chaouche, A. Structure de la Saison des Pluies en Afrique Soudano-Sahélienne. Ph.D. Thesis, J’Ecole des Mines de Paris, Paris, France, 1988. (In French). [Google Scholar]
- Moron, V. Variabilité spatio-temporelle des précipitations en Afrique sahélienne and guinéenne de 1933 à 1990. Météorologie 1992, 43–44, 24–30. (In French) [Google Scholar]
- Kebaili Bargaoui, Z. Occurrence des sécheresses dans le bassin de la Medjerda (Tunisie). Rev. Sci. L’eau J. Water Sci. 1989, 2, 429–447. (In French) [Google Scholar] [CrossRef] [Green Version]
- Bobée, B. Extreme flood events valuation using frequency analysis: A critical review. La Houille Blanche 1999, 100–105. [Google Scholar] [CrossRef]
- El Adlouni, S.; Ouarda, T.B.M.J. Étude de la loi conjointe débit-niveau par les copules: Cas de la rivière Châteauguay. Can. J. Civ. Eng. 2008, 35, 1128–1137. (In French) [Google Scholar] [CrossRef]
- Fisher, R.A. On the ‘Probable Error’ of a Coefficient of Correlation deduced from a Small Sample. Metron 1921, 1, 3–32. (In French) [Google Scholar]
- Gumbel, E.J. Statistics of Extremes; Columbia University Press: New York, NY, USA, 1958. [Google Scholar]
- El Adlouni, S.; Ouarda, T.B. Frequency Analysis of Extreme Rainfall Events. In Rainfall: State of the Science; Testik, F.Y., Gebremichael, M., Eds.; American Geophysical Union: Washington, DC, USA, 2010. [Google Scholar] [CrossRef]
- El Adlouni, S.; Bobée, B. Système d’Aide à la Décision pour l’estimation du risque hydrologique. In Numéro Spécial du Journal des Sciences Hydrologiques, Proceedings of the Conference FRIEND, Fès, Morocco, 25–29 October 2010; IASH Publication: Edinburgh, UK, 2010. (In French) [Google Scholar]
- El Adlouni, S.; Bobée, B. Delta diagram based test for the Halphen (A and B) and the Gamma distributions. In Proceedings of the EGU General Assembly Conference, Vienna, Austria, 27 April–2 May 2014; Volume 16. [Google Scholar]
- Beirlant, J.; Goegebeur, Y.; Segers, J.; Teugels, J. Statistics of Extremes: Theory and Applications; Wiley Series in Probability and Statistics; John Wiley & Sons, Ltd.: Chichester, UK, 2004; 522p, ISBN 13 978-0-471-97647-9. [Google Scholar]
- Von Mises, R. La distribution de la plus grande de n valeurs; American Mathematical Society: Providence, RI, USA, 1954; Volume II, pp. 271–294. [Google Scholar]
- Fisher, R.; Tippett, L. Limiting forms of the frequency distribution of the largest and smallest member of a sample. Proc. Camb. Philos. Soc. 1928, 24, 180–190. [Google Scholar] [CrossRef]
- Jenkinson, A.F. The frequency distribution of the annual maximum (or minimum) values of meteorological elements. Q. J. R. Meteorol. Soc. 1955, 81, 58–171. [Google Scholar] [CrossRef]
- Wischmeier, W.H.; Smith, D.D. Predicting Rainfall Erosion Losses: A Guide to Conservation Planning; U.S. Department of Agriculture: Washington, DC, USA, 1978.
- National Agency for Hydraulic Resources (ANRH). Les changements climatiques and leur impact sur les ressources en eau en Algérie. In Proceedings of the Assises Nationales sur L’Eau, Fez, Morocco, 25–29 October 2010; ANRH: Alger, Algeria, 2010; p. 41. (In French). [Google Scholar]
- Bouzaiane, S.; Laforgue, A. Monographie Hydrologique des oueds Zéroud et Merguellil; DGRE–ORSTOM: Tunis, Tunisie, 1986. (In French) [Google Scholar]
- Le Groupe d’experts intergouvernemental sur l’évolution du climat (GIEC). Impacts Adaptation and Vulnerability, Summary for Policymakers. In Contribution of Working Group II to the Fourth Assessment Report of the Intergovernmental Panel on Climate Change; Parry, M.L., Canziani, O.F., Palutikof, J.P., van der Linden, P.J., Hanson, C.E., Eds.; Cambridge University Press: Cambridge, UK, 2007; Available online: www.ipcc.ch (accessed on 2 July 2018).
- Abdellali, S.A.; Fougrach, H.; Hsain, M.; Saloui, A.; Badri, W. Andude de la variabilité du régime pluviométrique au Maroc septentrional (1935–2004). Sécheresse 2011, 22, 139–148. (In French) [Google Scholar]
- Mahé, G.; Olivry, J.C. Variations des précipitations and des écoulements en Afrique de l’Ouest and centrale de 1951 à 1989. Sécheresse 1995, 6, 109–117. (In French) [Google Scholar]
- Wotling, G.; Mahé, G.; L’Hote, Y.; Lebarbe, L. Analyse par les vecteurs régionaux de la variabilité spatiotemporelle des précipitations annuelles liées à la Mousson africaine. Veill. Clim. Satell. 1995, 52, 58–73. [Google Scholar]
- Kingumbi, A.; Bergaoui, Z.; Bourges, J.; Hubert, P.; Kalled, R. Étude de L’évolution des Séries Pluviométriques de la Tunisie Centrale; Documents Techniques en Hydrologie, No. 51 (“Hydrologie des Régions Méditerranéennes” Actes du Séminaire de Montpellier); UNESCO: Paris, France, 2000; pp. 341–345. [Google Scholar]
- L’Hôte, Y.; Mahé, G.; Somé, B.; Triboulet, J.P. Analysis of a Sahelian annual rainfall index updated from 1896 to 2000; the drought still goes on. Hydrol. Sci. J. 2002, 47, 563–572. [Google Scholar]
- Sircoulon, J. Variation des débits des cours d’eau and des niveaux des lacs en Afrique de l’ouest depuis le début du vingtième siècle. In The Influence of Climate Change and Climatic Variability on the Hydrology Regime and Water Resources, Proceedings of the Vancouver Symposium, Vancouver, BC, Canada, 9–22 August 1987; Solomon, S.I., Beran, M., Hogg, W., Eds.; IAHS Publication: Oxfordshire, UK, 1987; pp. 13–25. [Google Scholar]
- Opoku-Ankomah, Y.; Amisigo, B.A. Rainfall and runoff variability in the south western river system of Ghana. In Proceedings of the Abidjan’98 Conference on the Water Resources Variability in Africa during the XXth Century, Abidjan, Cote d’Ivoire, 30 November 1998; IAHS Publication: Oxfordshire, UK, 1998; pp. 307–321. [Google Scholar]
- Bello, N.J. Evidence of climate change based on rainfall records in Nigeria. Weather 1998, 52, 412–418. [Google Scholar] [CrossRef]
- Servat, E.; Paturel, J.E.; Lubès-Niel, H.; Kouamé, B.; Masson, J.M.; Travaglio, M.; Marieu, B. De différents aspects de la variabilité de la pluviométrie en Afrique de l’ouest et centrale non sahélienne. Rev. Sci. L’eau J. Water Sci. 1999, 12, 363–387. (In French) [Google Scholar] [CrossRef]
- Alpert, P.; Ben-Gai, T.; Bahard, A.; Benjamini, Y.; Yekutieli, D.; Colacino, M.; Diodato, L.; Ramis, C.; Homar, V.; Romero, R.; et al. The paradoxical increase of Mediterranean extreme daily rainfall in spite of decrease in total values. Geophys. Res. Lett. 2002, 29, 31-1–31-4. [Google Scholar] [CrossRef] [Green Version]
- Norrant, C.; Douguédroit, A. Monthly and daily precipitation trends in the Mediterranean (1950–2000). Theor. Appl. Climatol. 2006, 83, 89–106. [Google Scholar] [CrossRef]
- Hulme, M.; Osborn, T.J.; Johns, T.C. Precipitation sensitivity to global warming: Comparisons of observations with HadCM2 simulations. Geophys. Res. Lett. 1998, 25, 3379–3382. [Google Scholar] [CrossRef]
- Laborde, J.P.; Goubesville, P.; Assaba, M.; Demmak, A.; Belhouli, L. Climate evolution and possible effects on surface water resources of North Algeria. Curr. Sci. 2010, 98, 1056–1062. [Google Scholar]
- Mahé, G.; Singla, S.; Driouech, F.; Khomsi, K. Analyse de la persistance de ruptures dans des séries pluviométriques au Maroc en fonction de l’échelle spatiale and de la reconstitution des données. In Proceedings of the Conférence CIREDD4, Blida, Algeria, 22–23 February 2011; pp. 22–23. [Google Scholar]
- Ghenim, A.N.; Megnounif, A. Ampleur de la sécheresse dans le bassin d’alimentation du barrage Meffrouche (Nord-Ouest de l’Algérie). Géogr. Phys. Environ. Physio-Géo 2013, 7, 35–49. (In French) [Google Scholar] [CrossRef]
- Ghenim, A.N.; Megnounif, A. Analyse des précipitations dans le Nord-Ouest Algérien. Sécheresse 2013, 24, 107–114. (In French) [Google Scholar] [CrossRef]
- Jerolmack, D.J.; Paola, C. Shredding of environmental signals by sediment transport. Geophys. Res. Lett. 2010, 37, L19401. [Google Scholar] [CrossRef]
- Coulthard, T.J.; Ramirez, J.; Fowler, H.J.; Glenis, V. Using the UKCP09 probabilistic scenarios to model the amplified impact of climate change on drainage basin sediment yield. Hydrol. Earth Syst. Sci. 2012, 16, 4401–4416. [Google Scholar] [CrossRef] [Green Version]
- Knight, J.; Harrison, S. The impacts of climate change on terrestrial Earth surface systems. Nat. Clim. Chang. 2013, 3, 24–29. [Google Scholar] [CrossRef]
- Probst, J.L.; Bazerbachi, A. Transports en solution et en suspension par la Garonne Supérieure. Sci. Géol. Bull. 1986, 39, 79–98. (In French) [Google Scholar]
- Asnouni, F. Etude du Transport Solide en Suspension Dans le Bassin Versant D’oued AL ABD. Master’s Thesis, Hydraulique Université de Tlemcen, Tlemcen, Algeria, 2014. [Google Scholar]
- Roose, E. Introduction à la Gestion Conservatoire de l’eau, de la Biomasse et de la Fertilité des Sols (GCES); Bulletin Pédologique de la FAO No. 70; United Nations Food and Agriculture Organization: Rome, Italy, 1999; Available online: http://www.fao.org/docrep/T1765F/t1765f00.htm (accessed on 22 July 2016).
- Roose, É.; Chebbani, R.; Bourougaa, L. Ravinement en Algérie: Typologie, facteurs de contrôle, quantification et réhabilitation. Sécheresse 2000, 11, 317–326. [Google Scholar]
- Silva, A.M. Rainfall Erosivity Map for Brazil. Catena 2004, 57, 251–259. [Google Scholar] [CrossRef]
- Yu, B. Rainfall Erosivity and its Estimation for Australia’s Tropics. Aust. J. Soil Res. 1998, 36, 143–166. [Google Scholar] [CrossRef]
- Isikwue, M.O.; Ocheme, J.O.; Aho, M.I. Evaluation of Rainfall Erosivity Index for Index for Abuja Lombardi Method. Niger. J. Technol. 2015, 34, 56–63. [Google Scholar] [CrossRef]
- Bourouba, M. Les variations de la turbidité and leurs relations avec les précipitations and les débits des oueds semi arides de l’Algérie orientale. Bull. ORSTOM 1997, 17, 345–360. [Google Scholar]
- Megnounif, A. Étude du Transport des Sédiments en Suspension Dans les Écoulements de Surface. Ph.D. Thesis, Universit de Tlemcen, Tlemcen, Algérie, 2007; p. 164. [Google Scholar]
- Demmak, A. Contribution à L’étude de L’érosion et des Transports Solides en Algérie Septentrionale. Ph.D. Thesis, Université de Pierre et Marie Curie, Paris, France, 1982. (In French). [Google Scholar]
- La CROIX. Inondations Meurtrières en Algérie, Parue le 12/11/2001 à 12h00, L’explication Météorologique. Available online: http://www.la-croix.com/Archives/2001-11-12/INondations-meurtrieres-en-Algerie-_NP_-2001-11-12-144826 (accessed on 3 March 2018).
- Maleval, V. Premiers résultats des mesures d’érosion ravinaire sur les versants lacustres du barrage Sidi Mohammed Ben Abdellah (Maroc) et perspectives de recherche. In Gestion Durable des Terres, Proceedings of the Réunion Multi-Acteurs sur le Bassin du Bouregreg CERGéo, Rabat, Morocco, 28 May 2013; Laouina, A., Mahe, G., Eds.; ARGDT: Rabat, Morocco, 2014; pp. 53–62. ISBN 978-9954-33-482-9. (In French) [Google Scholar]
- Toumi, S. Application des Techniques Nucléaires et de la Télédétection à L’étude de L’érosion Hydrique Dans le Bassin Versant de L’oued Mina. Ph.D. Thesis, Es-Sciences, Ecole Nationale Supérieure d’Hydraulique (ENSH), Soumaâ, Algeria, 2014; p. 189. (In French). [Google Scholar]
- Larfi, B.; Remini, B. Le transport solide dans le bassin versant de l’oued Isser. Impact sur l’envasement fu barrage de Beni Amrane (Algérie). LARHYSS J. 2006, 5, 63–73. (In French) [Google Scholar]
- Deutsche Gesellschaft fur Technische Zusammenabeit (GTZ). Carte du Danger D’érosion. Projet D’aménagement Intégré du Bassin Versant de L’oued Mina. Schéma Directeur D’aménagement; Office Allemand de la Coopération Technique, S.A.R.L (GTZ), IFG, Institut des Géosciences Appliquées: Offenbach, Germany, 1987. (In French) [Google Scholar]
- Kouidri, R. Premiers Résultats de Quantification de Ruissellement et de L’érosion en Nappe sur Jachère en Algérie (Région de Médéa); Annales de la Recherche Forestière en Algérie; INRF: Alger, Algérie, 1993. (In French) [Google Scholar]
- Diallo, D. Erosion des sols en Zone Soudanienne du Mali Transfert des Matériaux Érodés Dans le Bassin Versant de Djitiko (Haut Niger). Ph.D. Thesis, L’université Joseph Fourier, Grenoble, France, 2000; p. 212. (In French). [Google Scholar]
- Naimi, M.; Tayaa, M.; Ouzizi, S.; Choukra-Ilha, R.; Kerby, M. Dynamique de l’érosion par ravinement dans un bassin versant du Rif occidental au Maroc. Sécheresse 2003, 14, 95–100. (In French) [Google Scholar]
- Lienou, G.; Mahé, G.; Paturel, J.E.; Servat, E.; Sighomnou, D.; Ecodeck, G.E.; Dezeter, A.; Dieulin, C. Changements des régimes hydrologiques en région équatoriale camerounaise: Un impact du changement climatique en Afrique équatoriale? Hydrol. Sci. J. 2008, 53, 789–801. (In French) [Google Scholar] [CrossRef]
- Megnounif, A.; Nekkache Ghenim, A. Influence des fluctuations hydro-pluviométriques sur la production des sédiments: Cas du bassin de la Haute Tafna. Rev. Sci. L’eau J. Water Sci. 2013, 26, 53–62. [Google Scholar] [CrossRef]
Figure 1.
Localization of the catchment area of Wadi Mina.
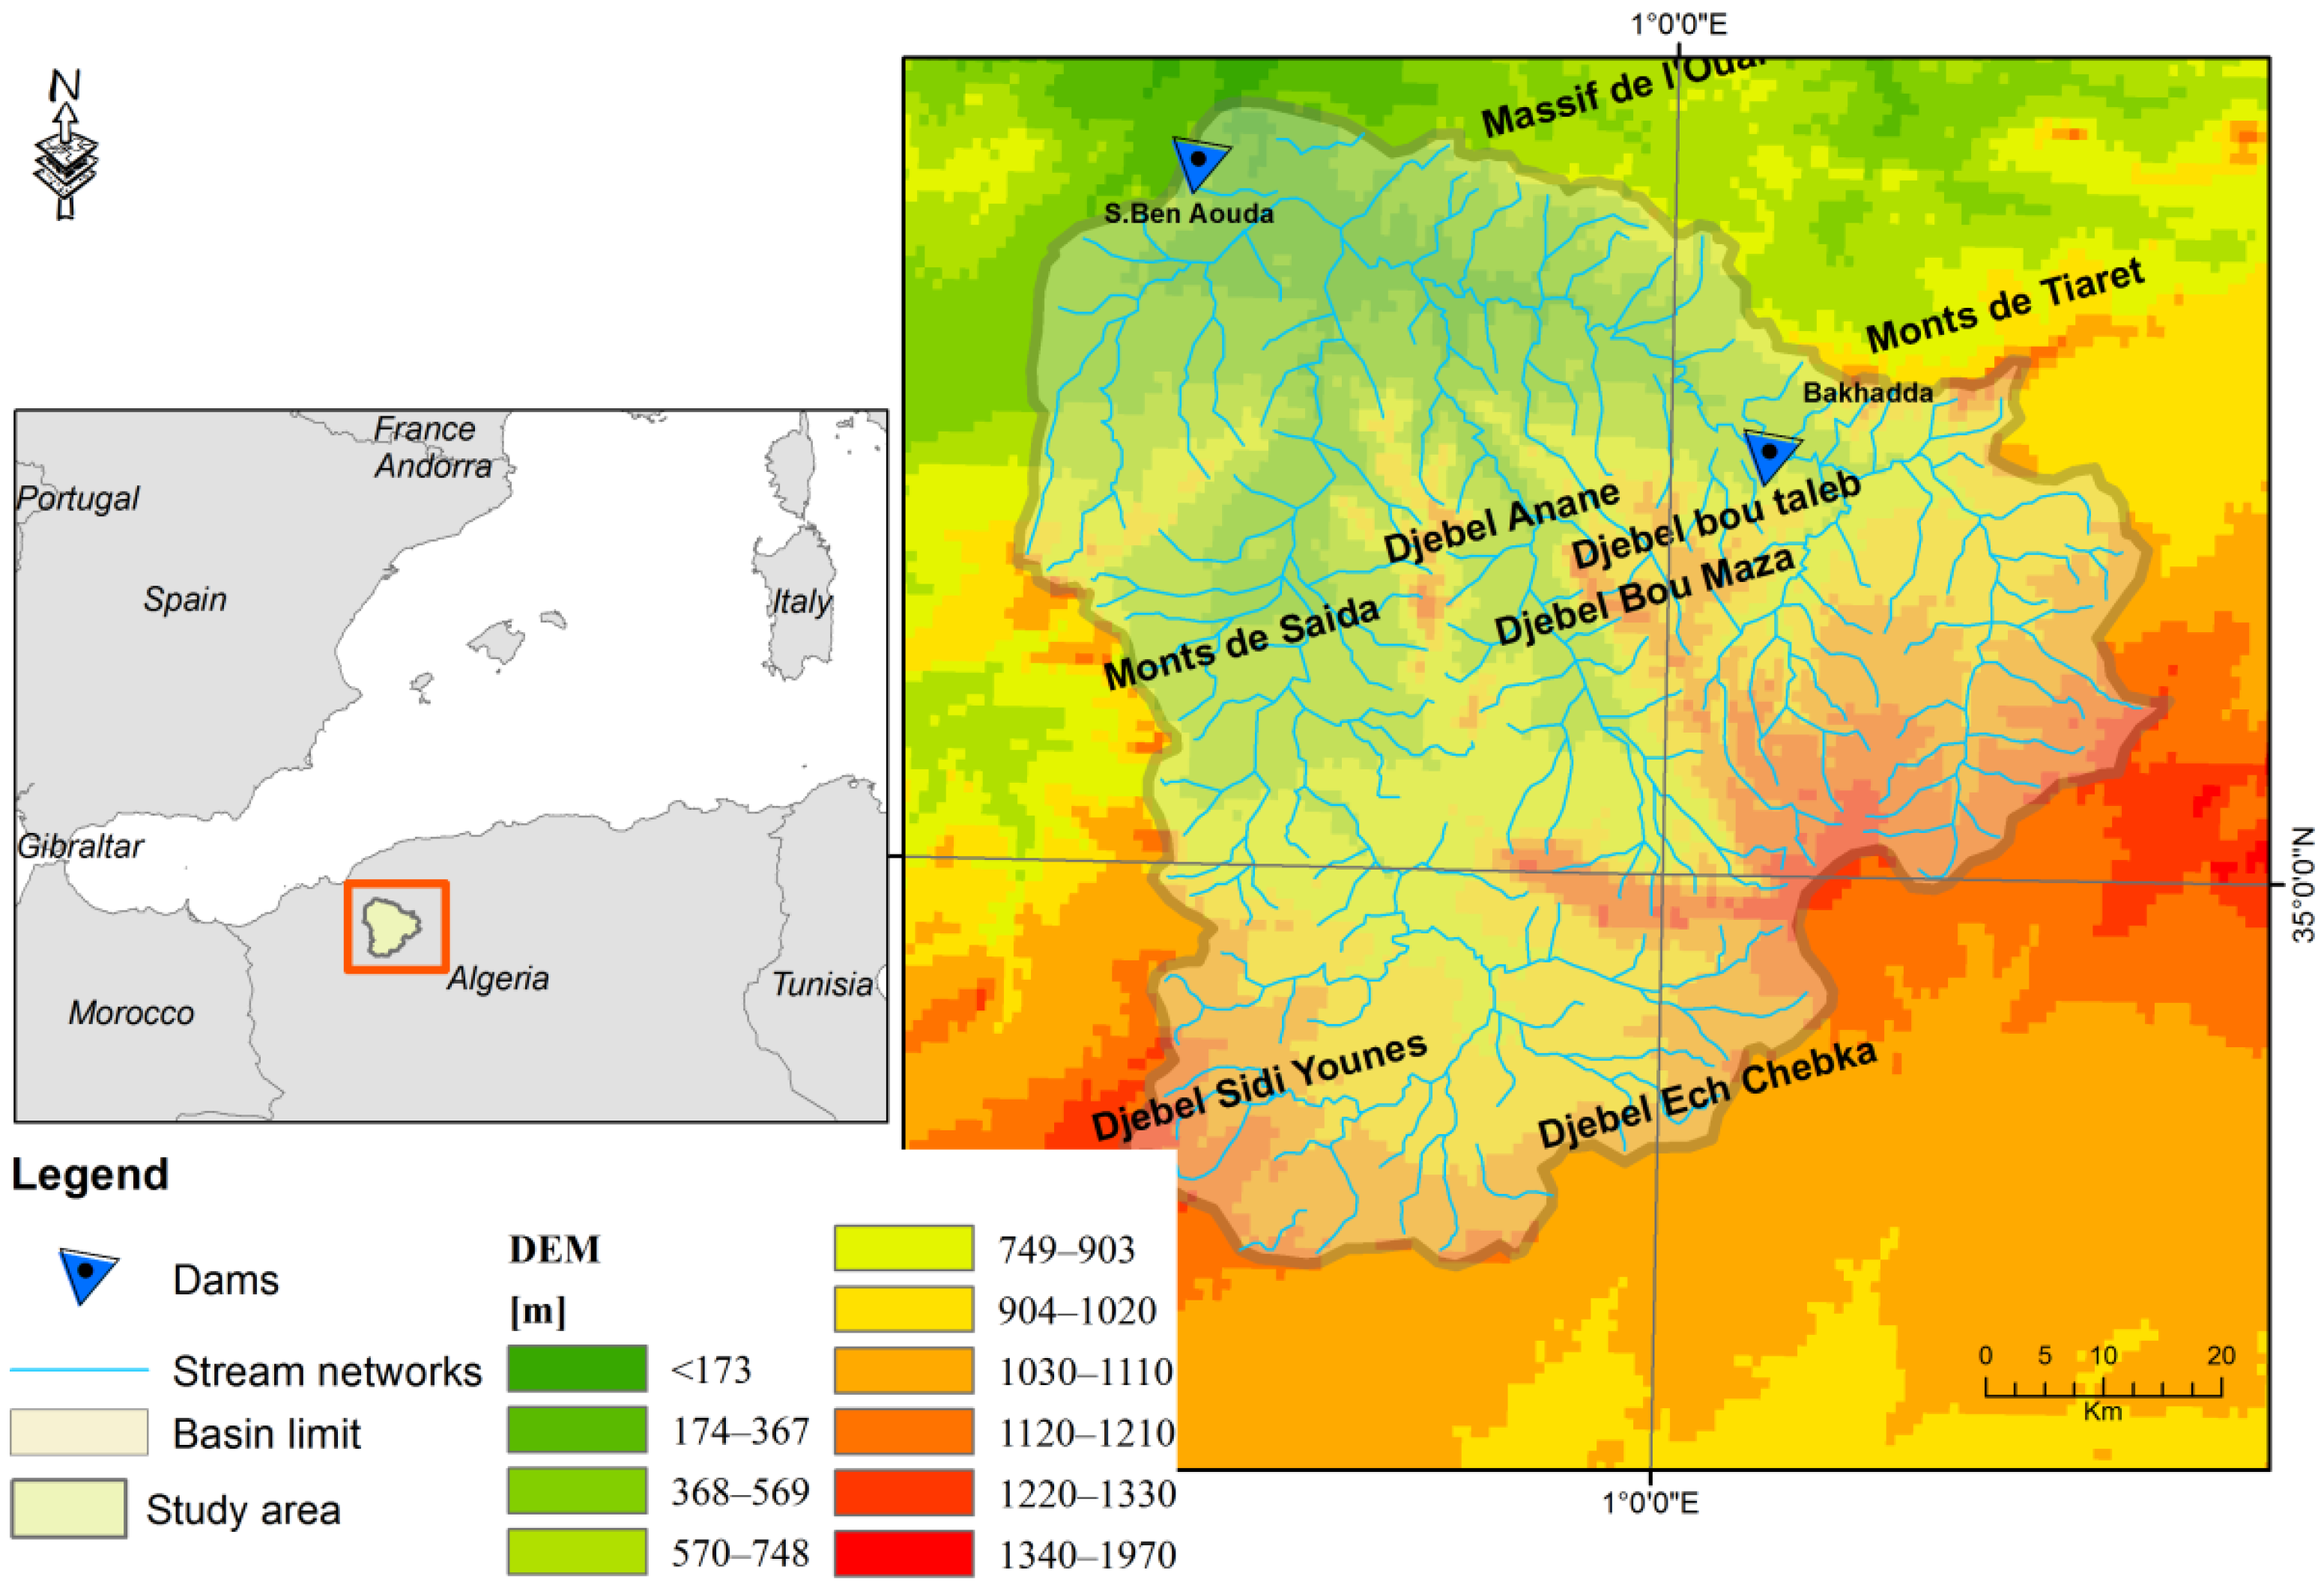
Figure 2.
Localization of pluviometric and hydrometric stations (group of regions: E: east; NW: northwest; CW: center-west; and SW: southwest).
Figure 2.
Localization of pluviometric and hydrometric stations (group of regions: E: east; NW: northwest; CW: center-west; and SW: southwest).

Figure 3.
Distributions ordered with respect to their right tails [94].
Figure 3.
Distributions ordered with respect to their right tails [94].
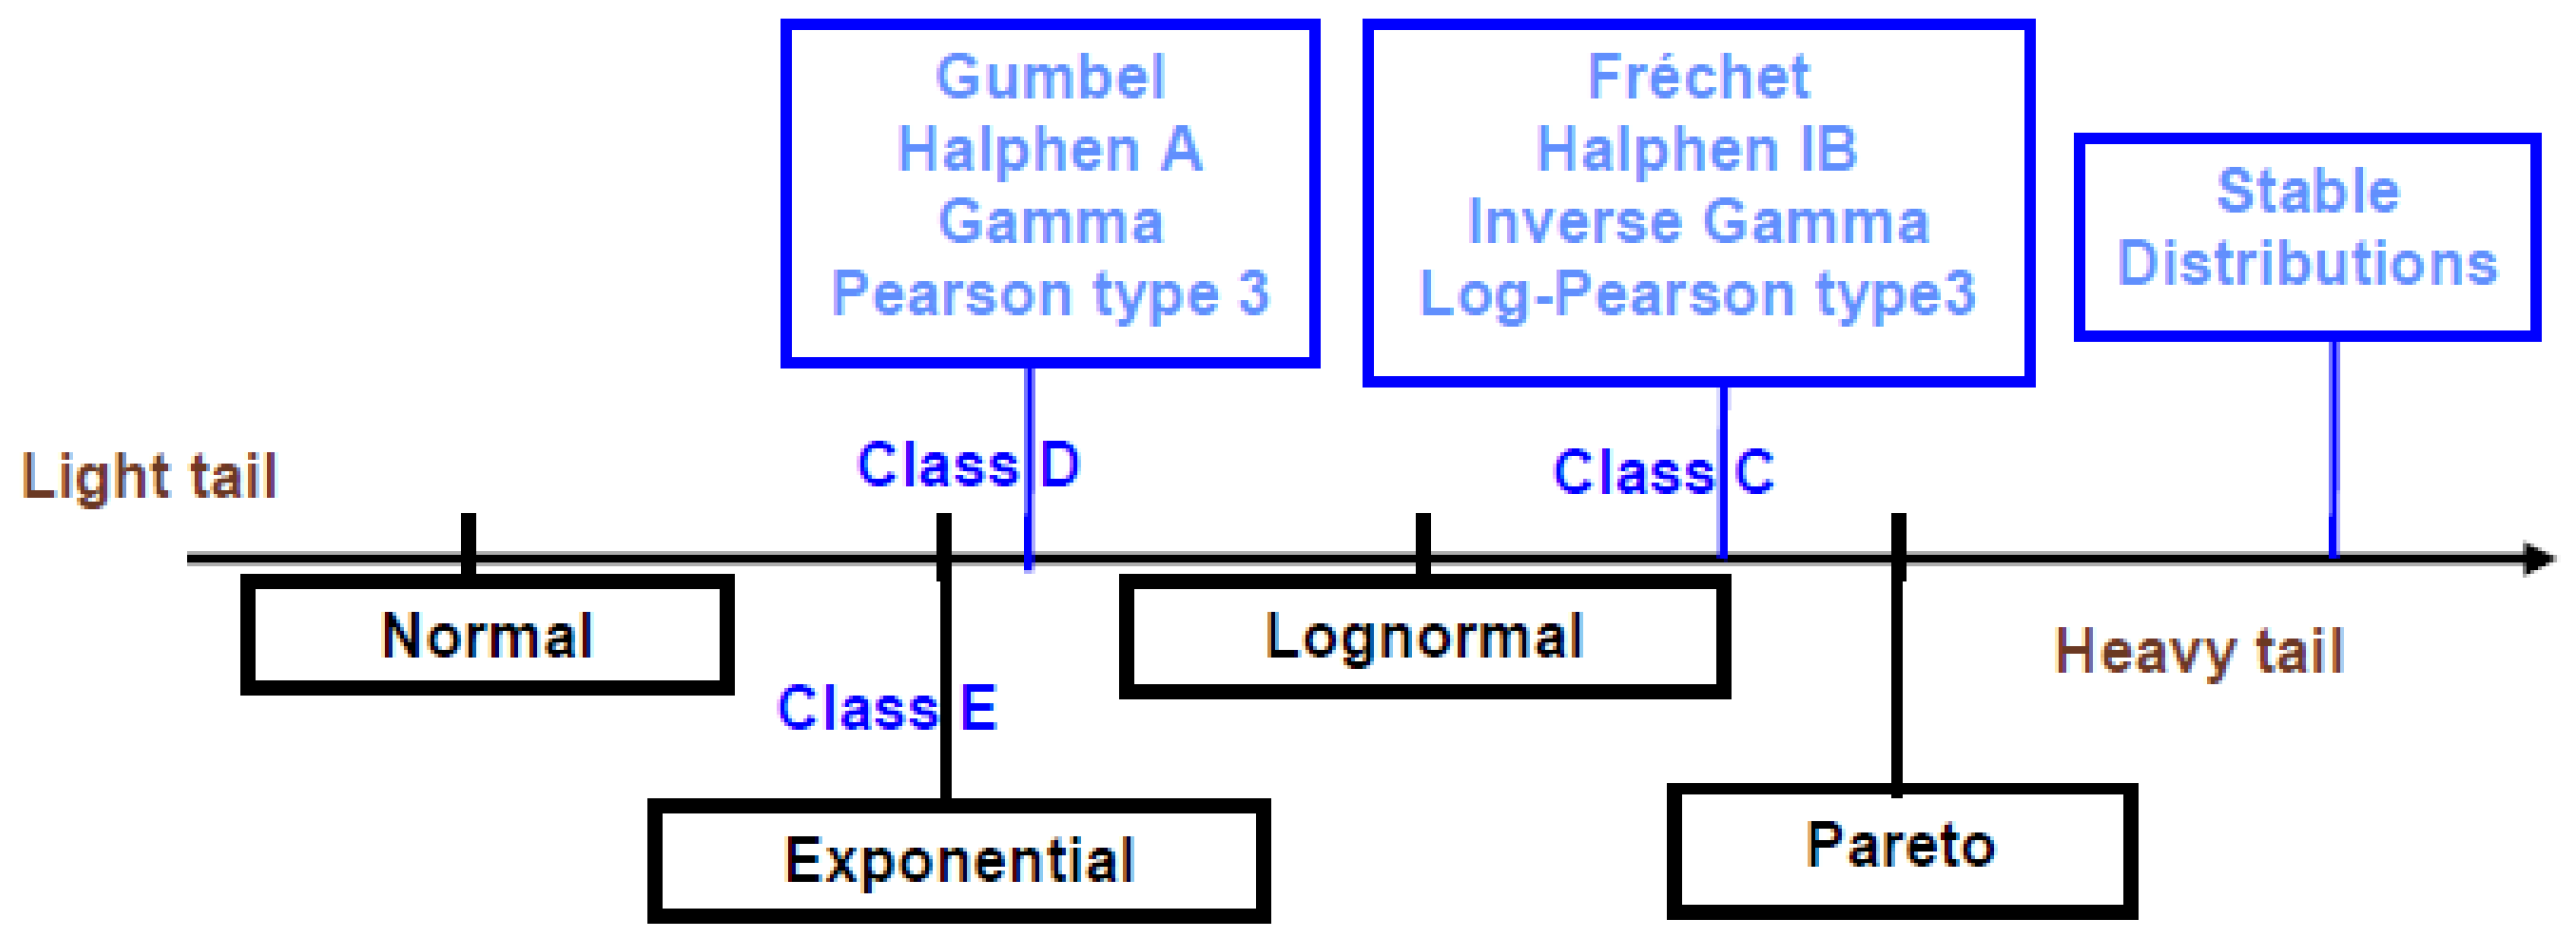
Figure 4.
Diagram for class discrimination used in the DSS (according to [94]).
Figure 4.
Diagram for class discrimination used in the DSS (according to [94]).

Figure 5.
Ruptures detected at rainfall stations: (a) before 1970; (b) 1970–1980; and (c) after 1980. Rupture dates were detected: by three statistical tests (black: strong ruptures); by two statistical tests (dark grey: probable rupture); or by at least one statistical test (light grey: weak rupture).

Figure 6.
Impact of ruptures in the hydrometric series on the floods recurrence. (a) Ain Hamara station; (b) Sidi Ali Ben Amar station; (c) Sidi Abdelkader Djilali station; (d) Wadi El Abtal station; (e) Takhmert station.
Figure 6.
Impact of ruptures in the hydrometric series on the floods recurrence. (a) Ain Hamara station; (b) Sidi Ali Ben Amar station; (c) Sidi Abdelkader Djilali station; (d) Wadi El Abtal station; (e) Takhmert station.
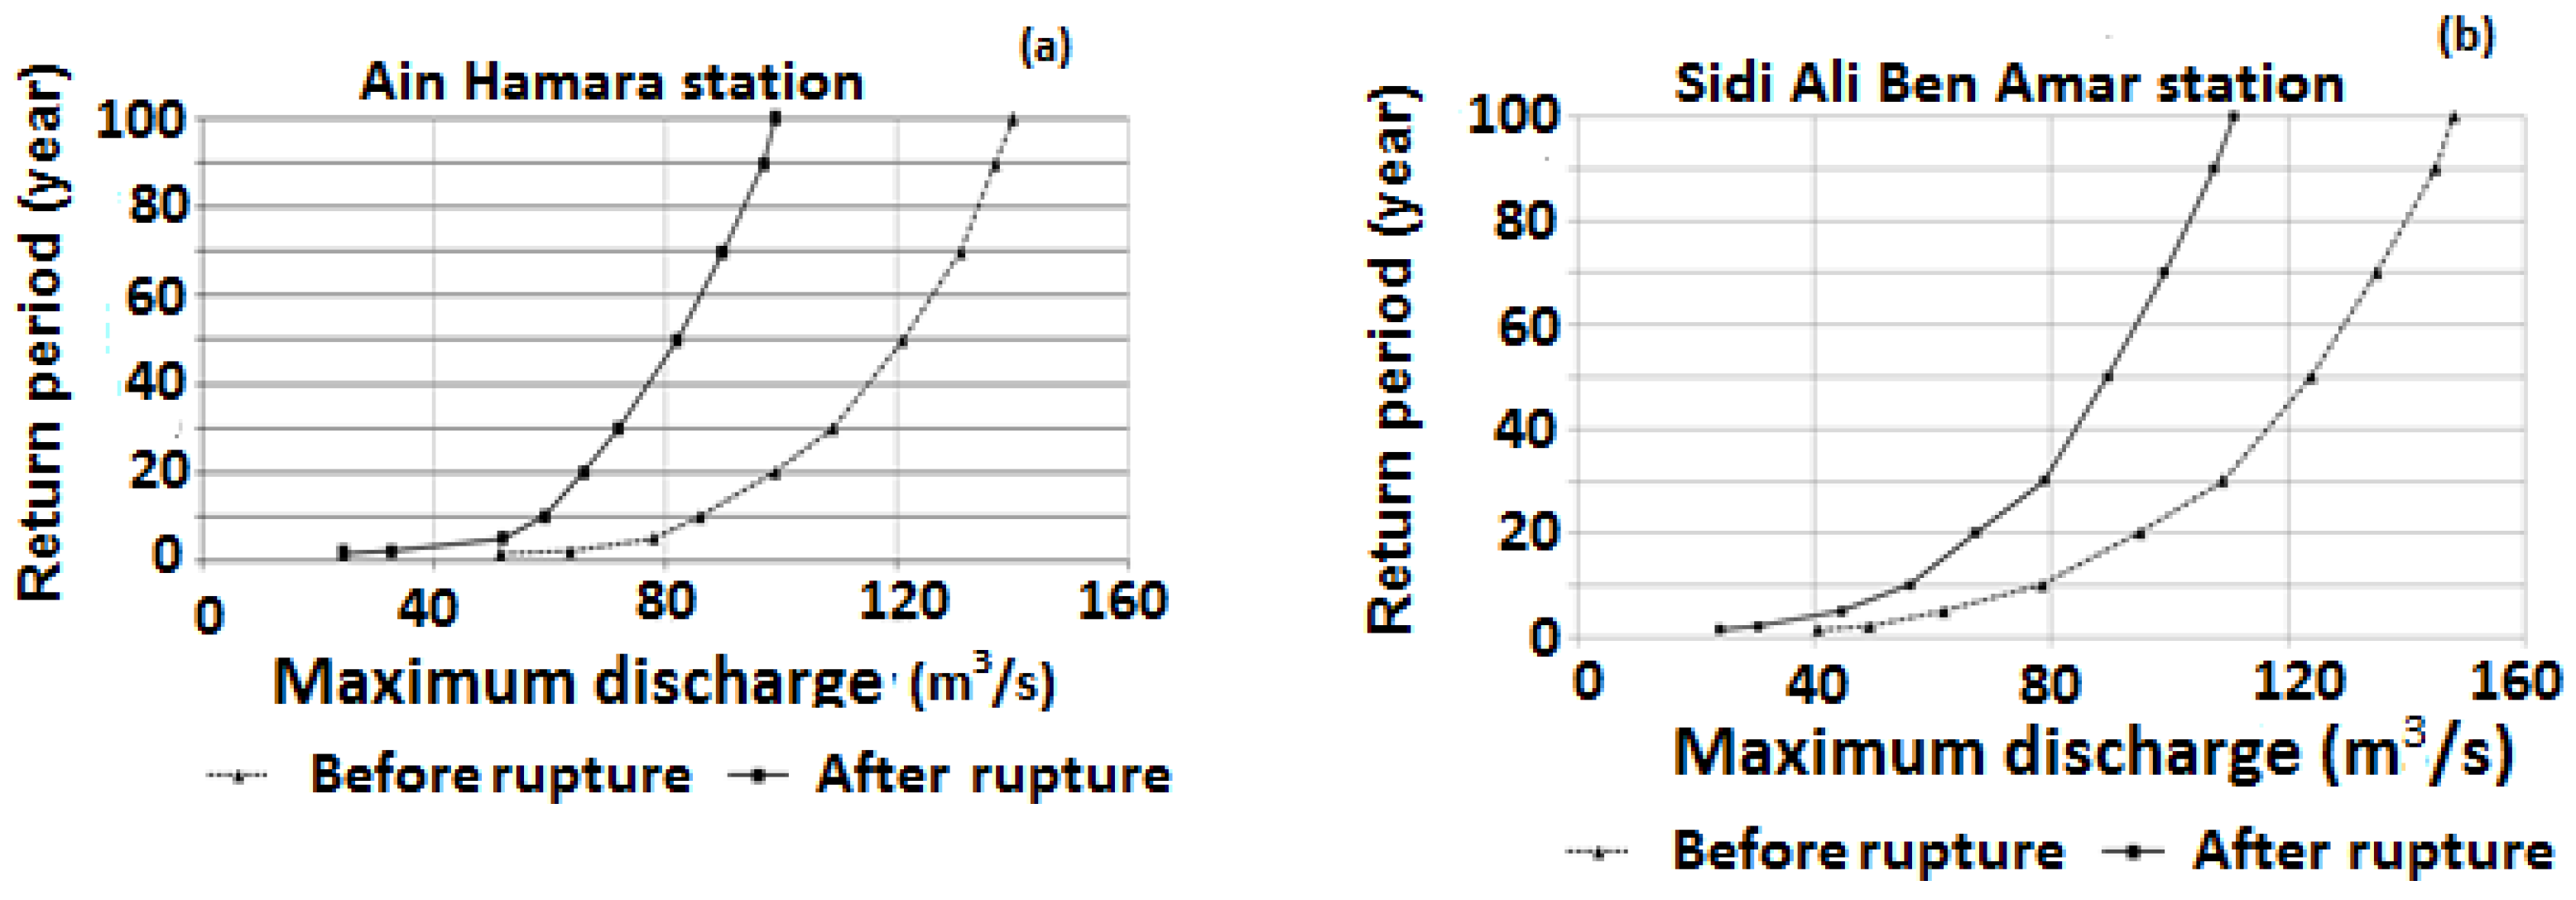
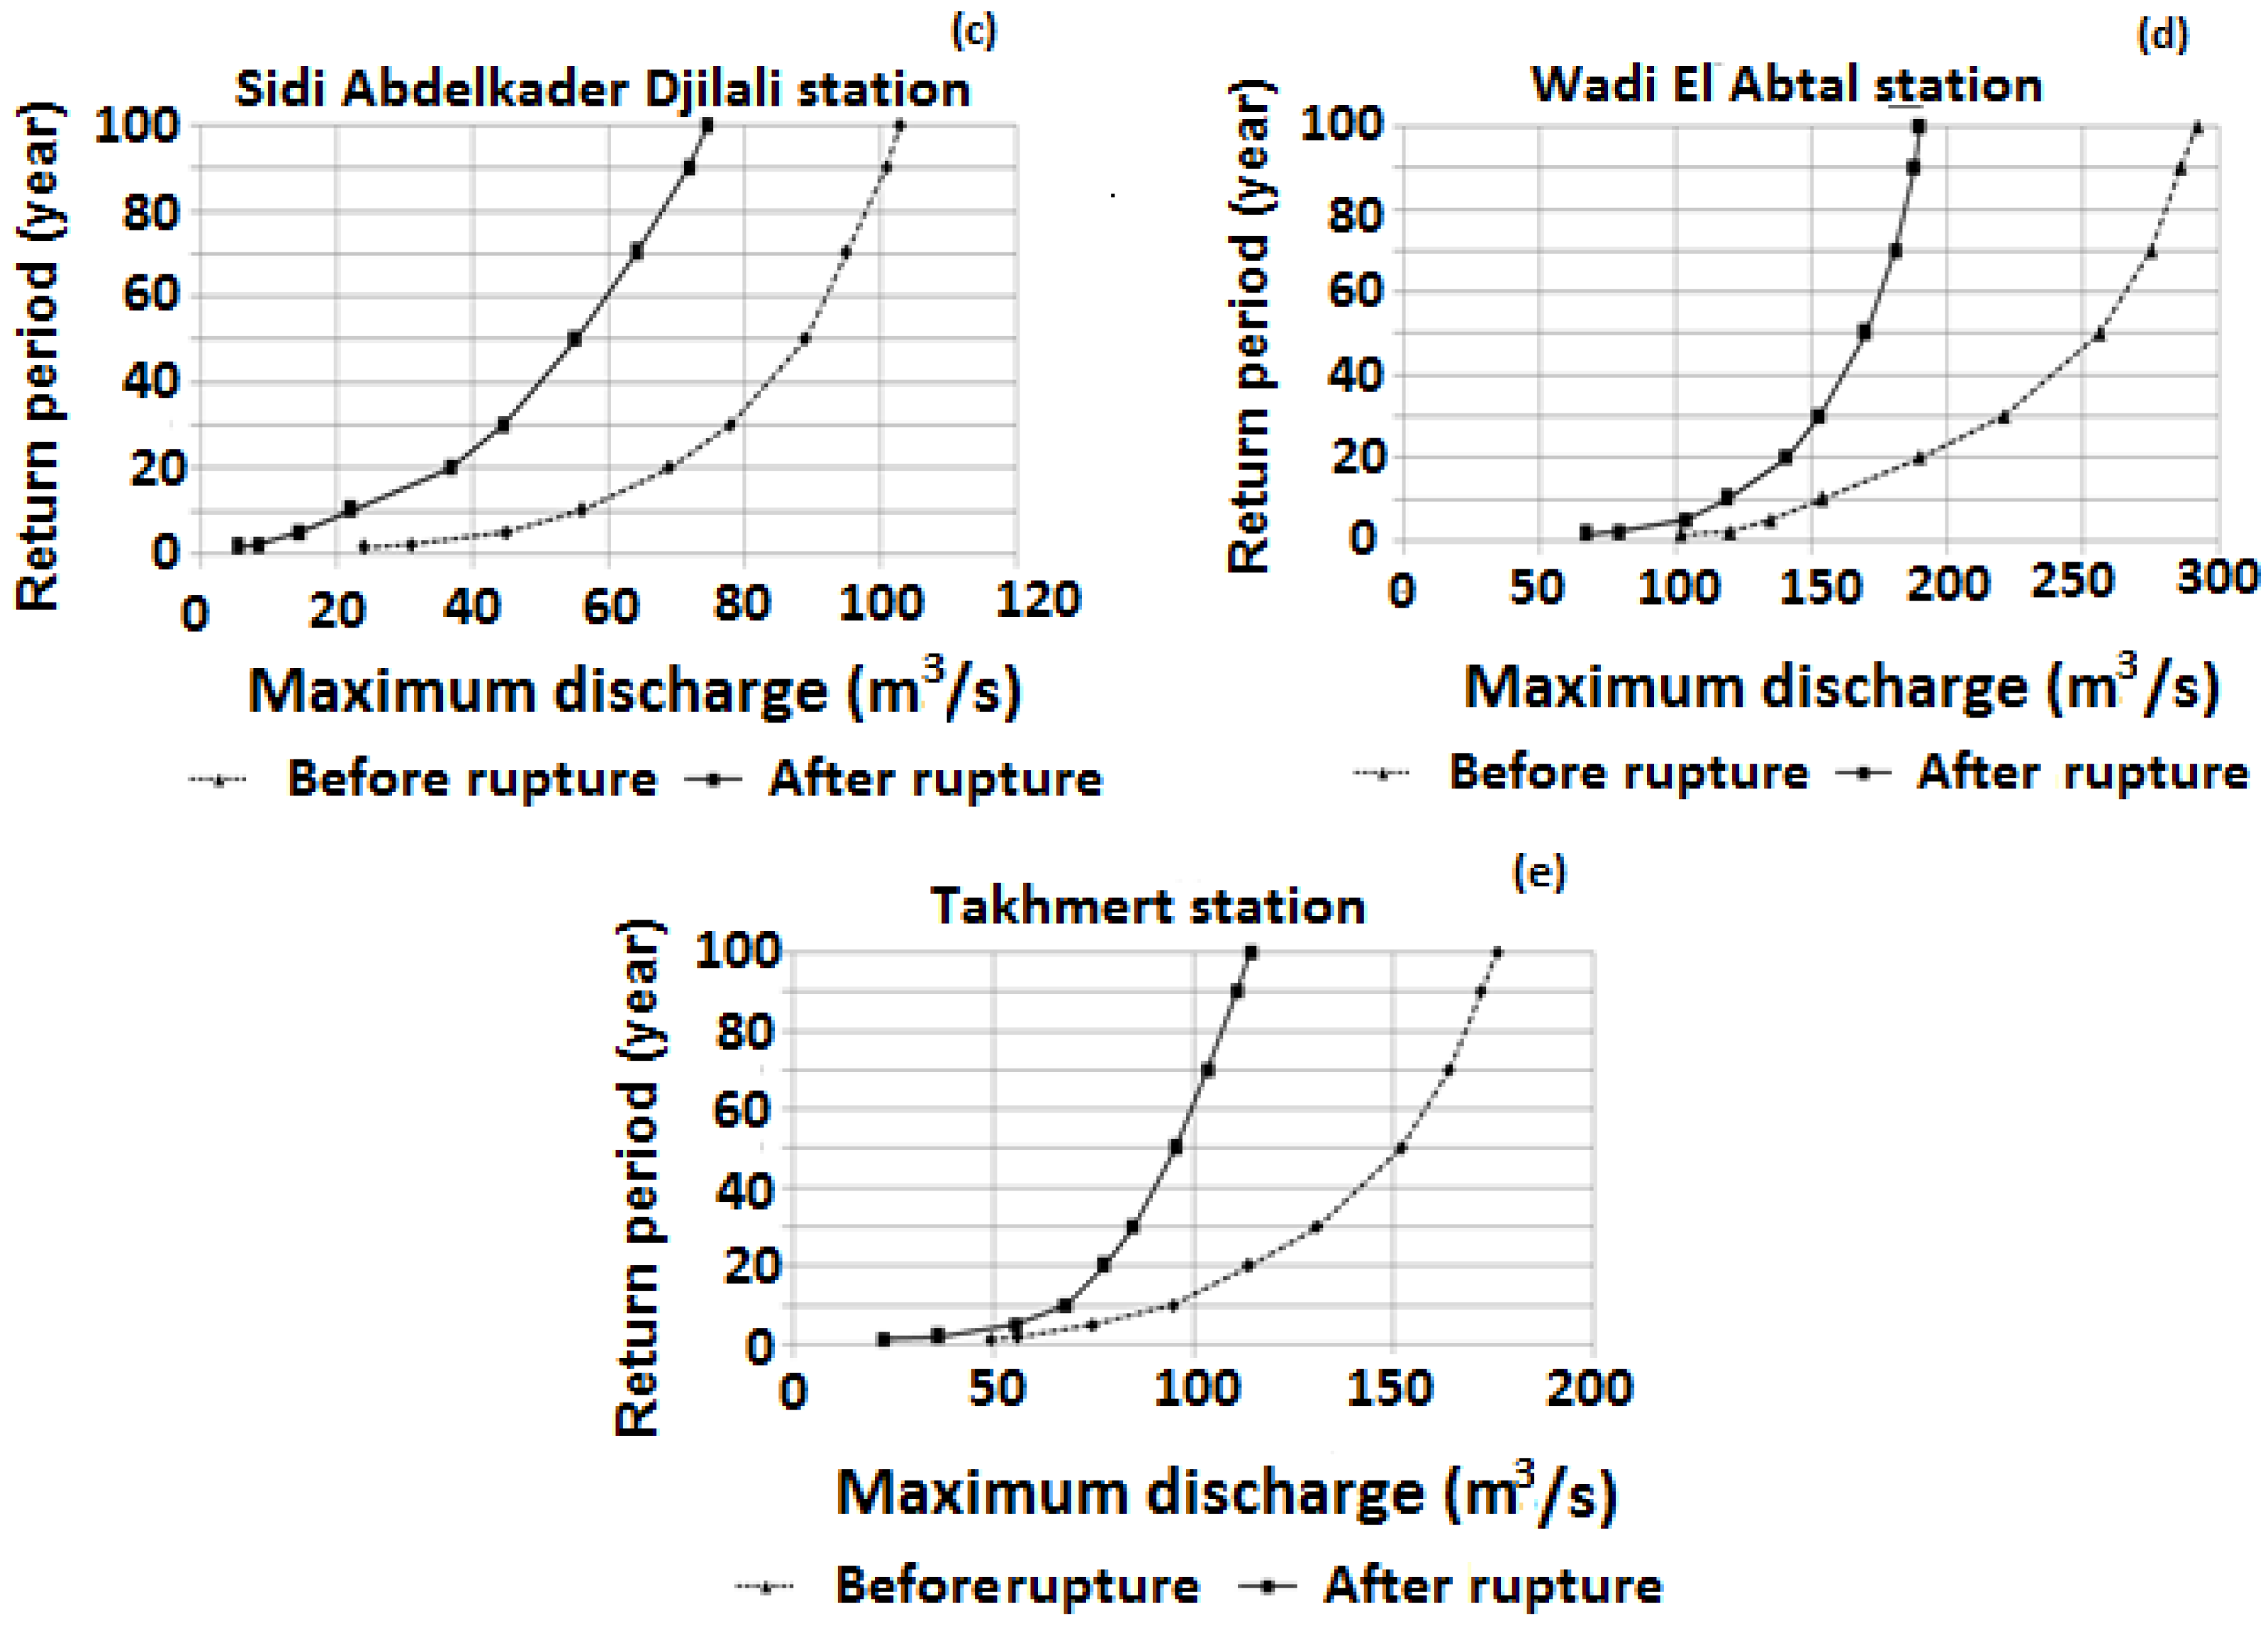
Figure 7.
Evolution of annual average of discharges and concentrations of SPM in the Wadi Mina basin: (a) Wadi El Abtal station; (b) Sidi Aek Djilali station.
Figure 7.
Evolution of annual average of discharges and concentrations of SPM in the Wadi Mina basin: (a) Wadi El Abtal station; (b) Sidi Aek Djilali station.

Figure 8.
Relation between the liquids instantaneous flows and the concentrations of matters in suspension (Station of Wadi Abtal).
Figure 8.
Relation between the liquids instantaneous flows and the concentrations of matters in suspension (Station of Wadi Abtal).

Figure 9.
Seasonal variations (summer: June, July and August; autumn: September, October, November; winter: December, January, February; and spring: March, April, May) of the instantaneous values of discharges depending on the concentrations of suspended particles matters (SPM) (Station Wadi El Abtal). (a) Summer; (b) Autumn; (c) Spring; (d) Winter.

Figure 10.
Evolution of the basin morphology and the surface in free water of the Sidi M’Hamed Benaouda Dam [14]. (a) Initial water volume (1978–1985); (b) Water volume (1985–2004).
Figure 10.
Evolution of the basin morphology and the surface in free water of the Sidi M’Hamed Benaouda Dam [14]. (a) Initial water volume (1978–1985); (b) Water volume (1985–2004).

Figure 11.
Evolution of the accumulated loss of water from the Sidi M’Hamed Benaouda Dam [14].
Figure 11.
Evolution of the accumulated loss of water from the Sidi M’Hamed Benaouda Dam [14].
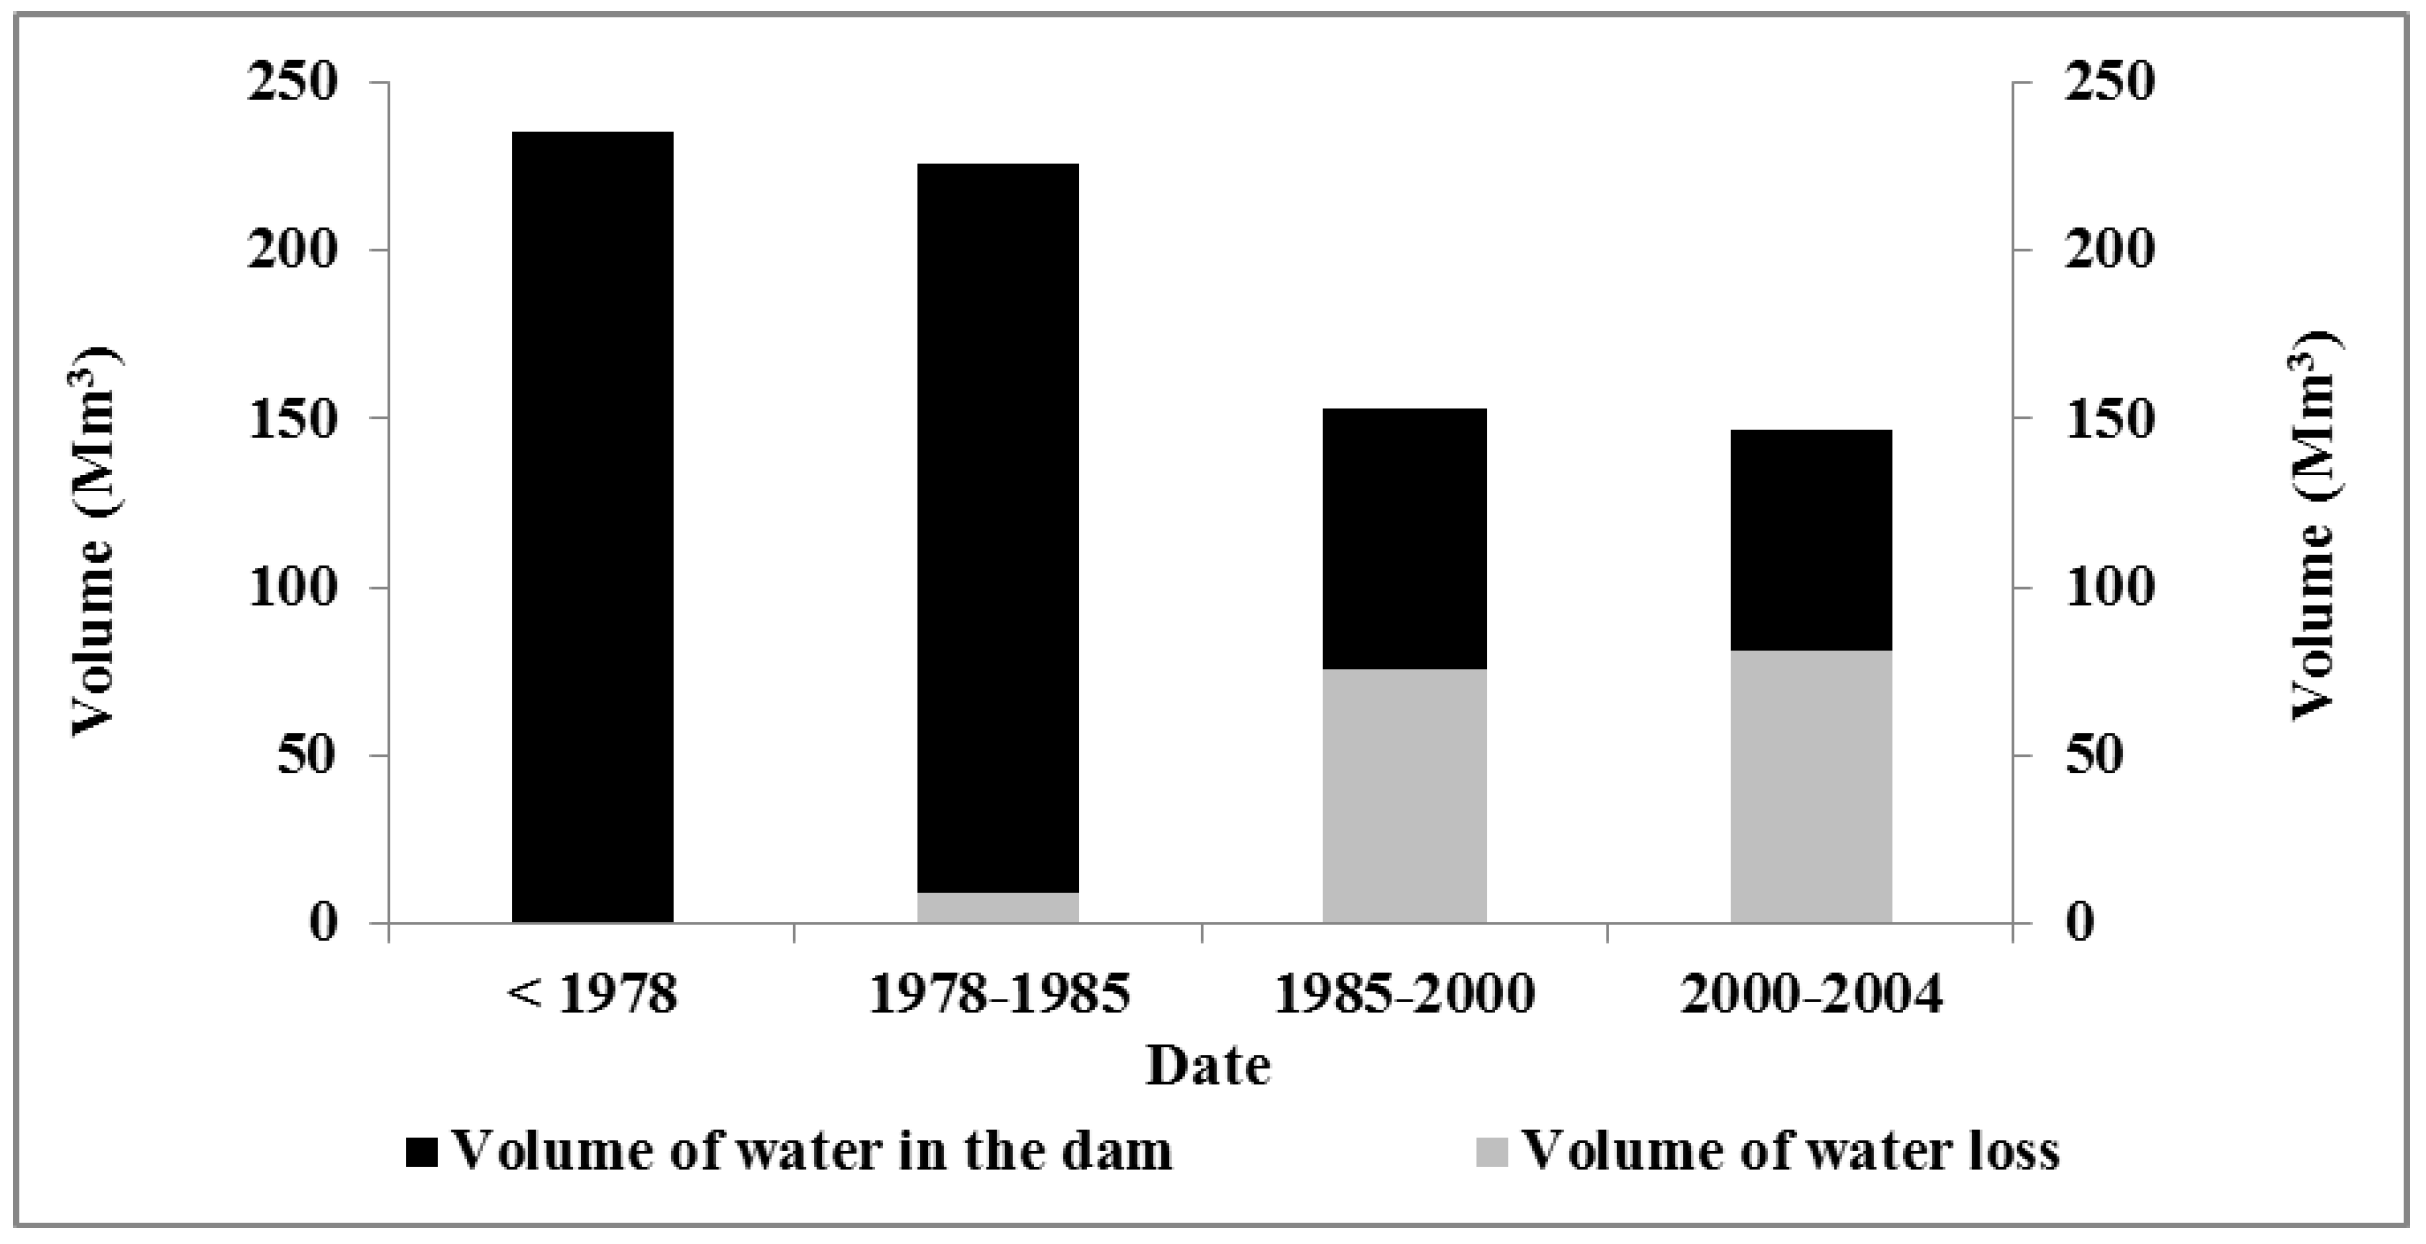
Figure 12.
Specific degradation per sub-basin.
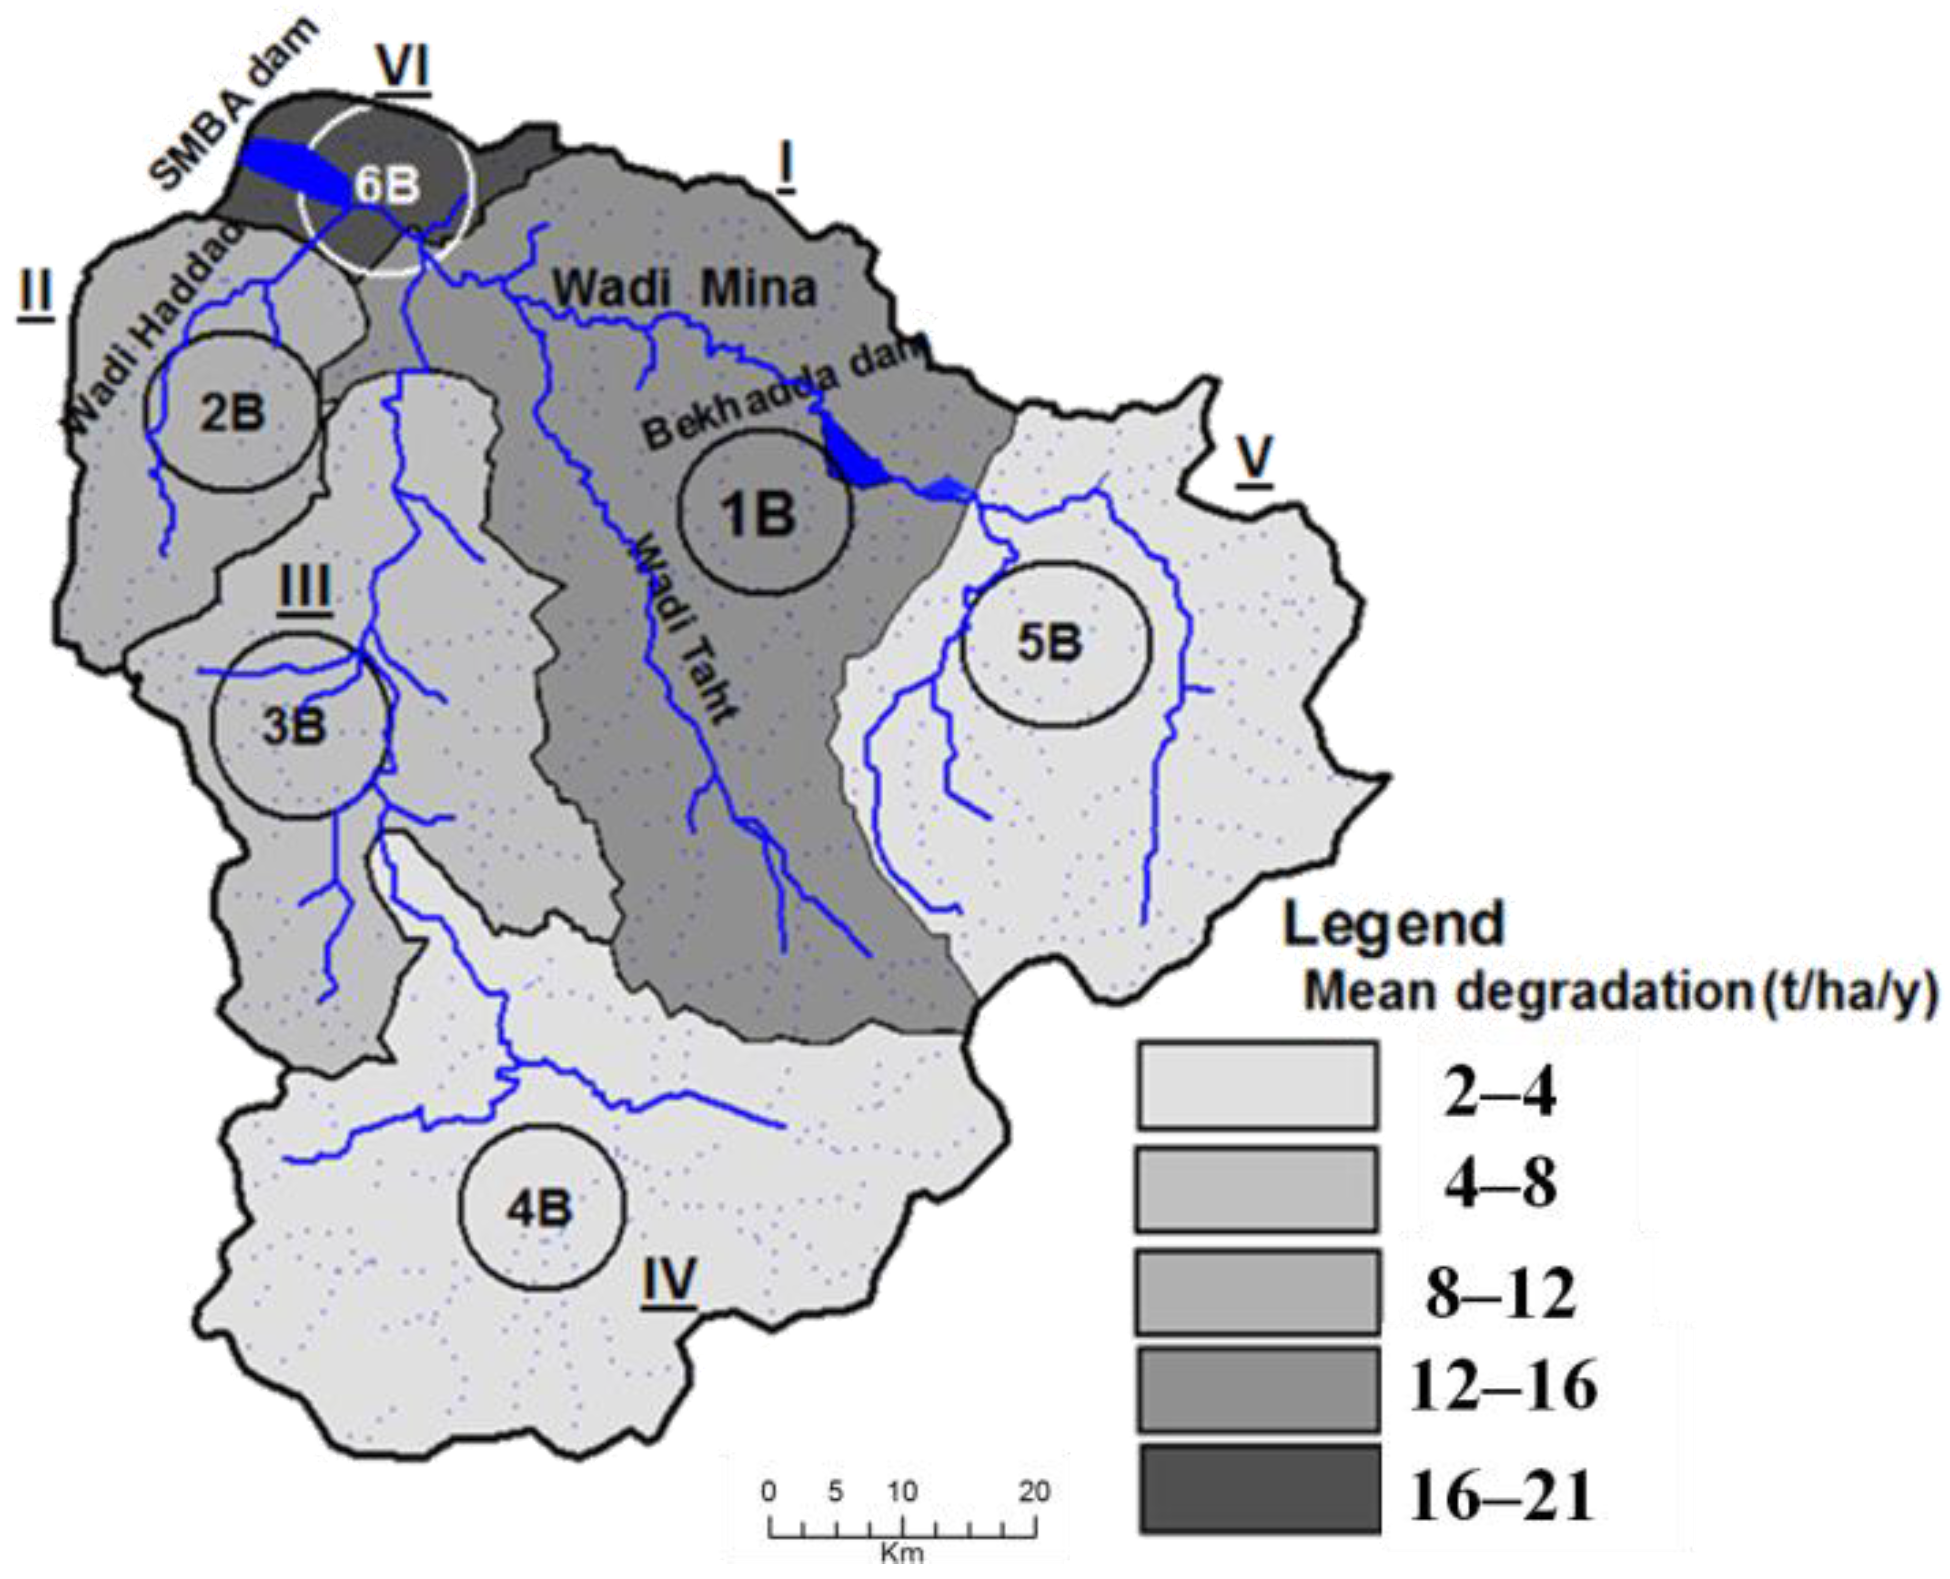
Figure 13.
Bare banks of the SMBA Dam (Shot Hallouz, August 2013).
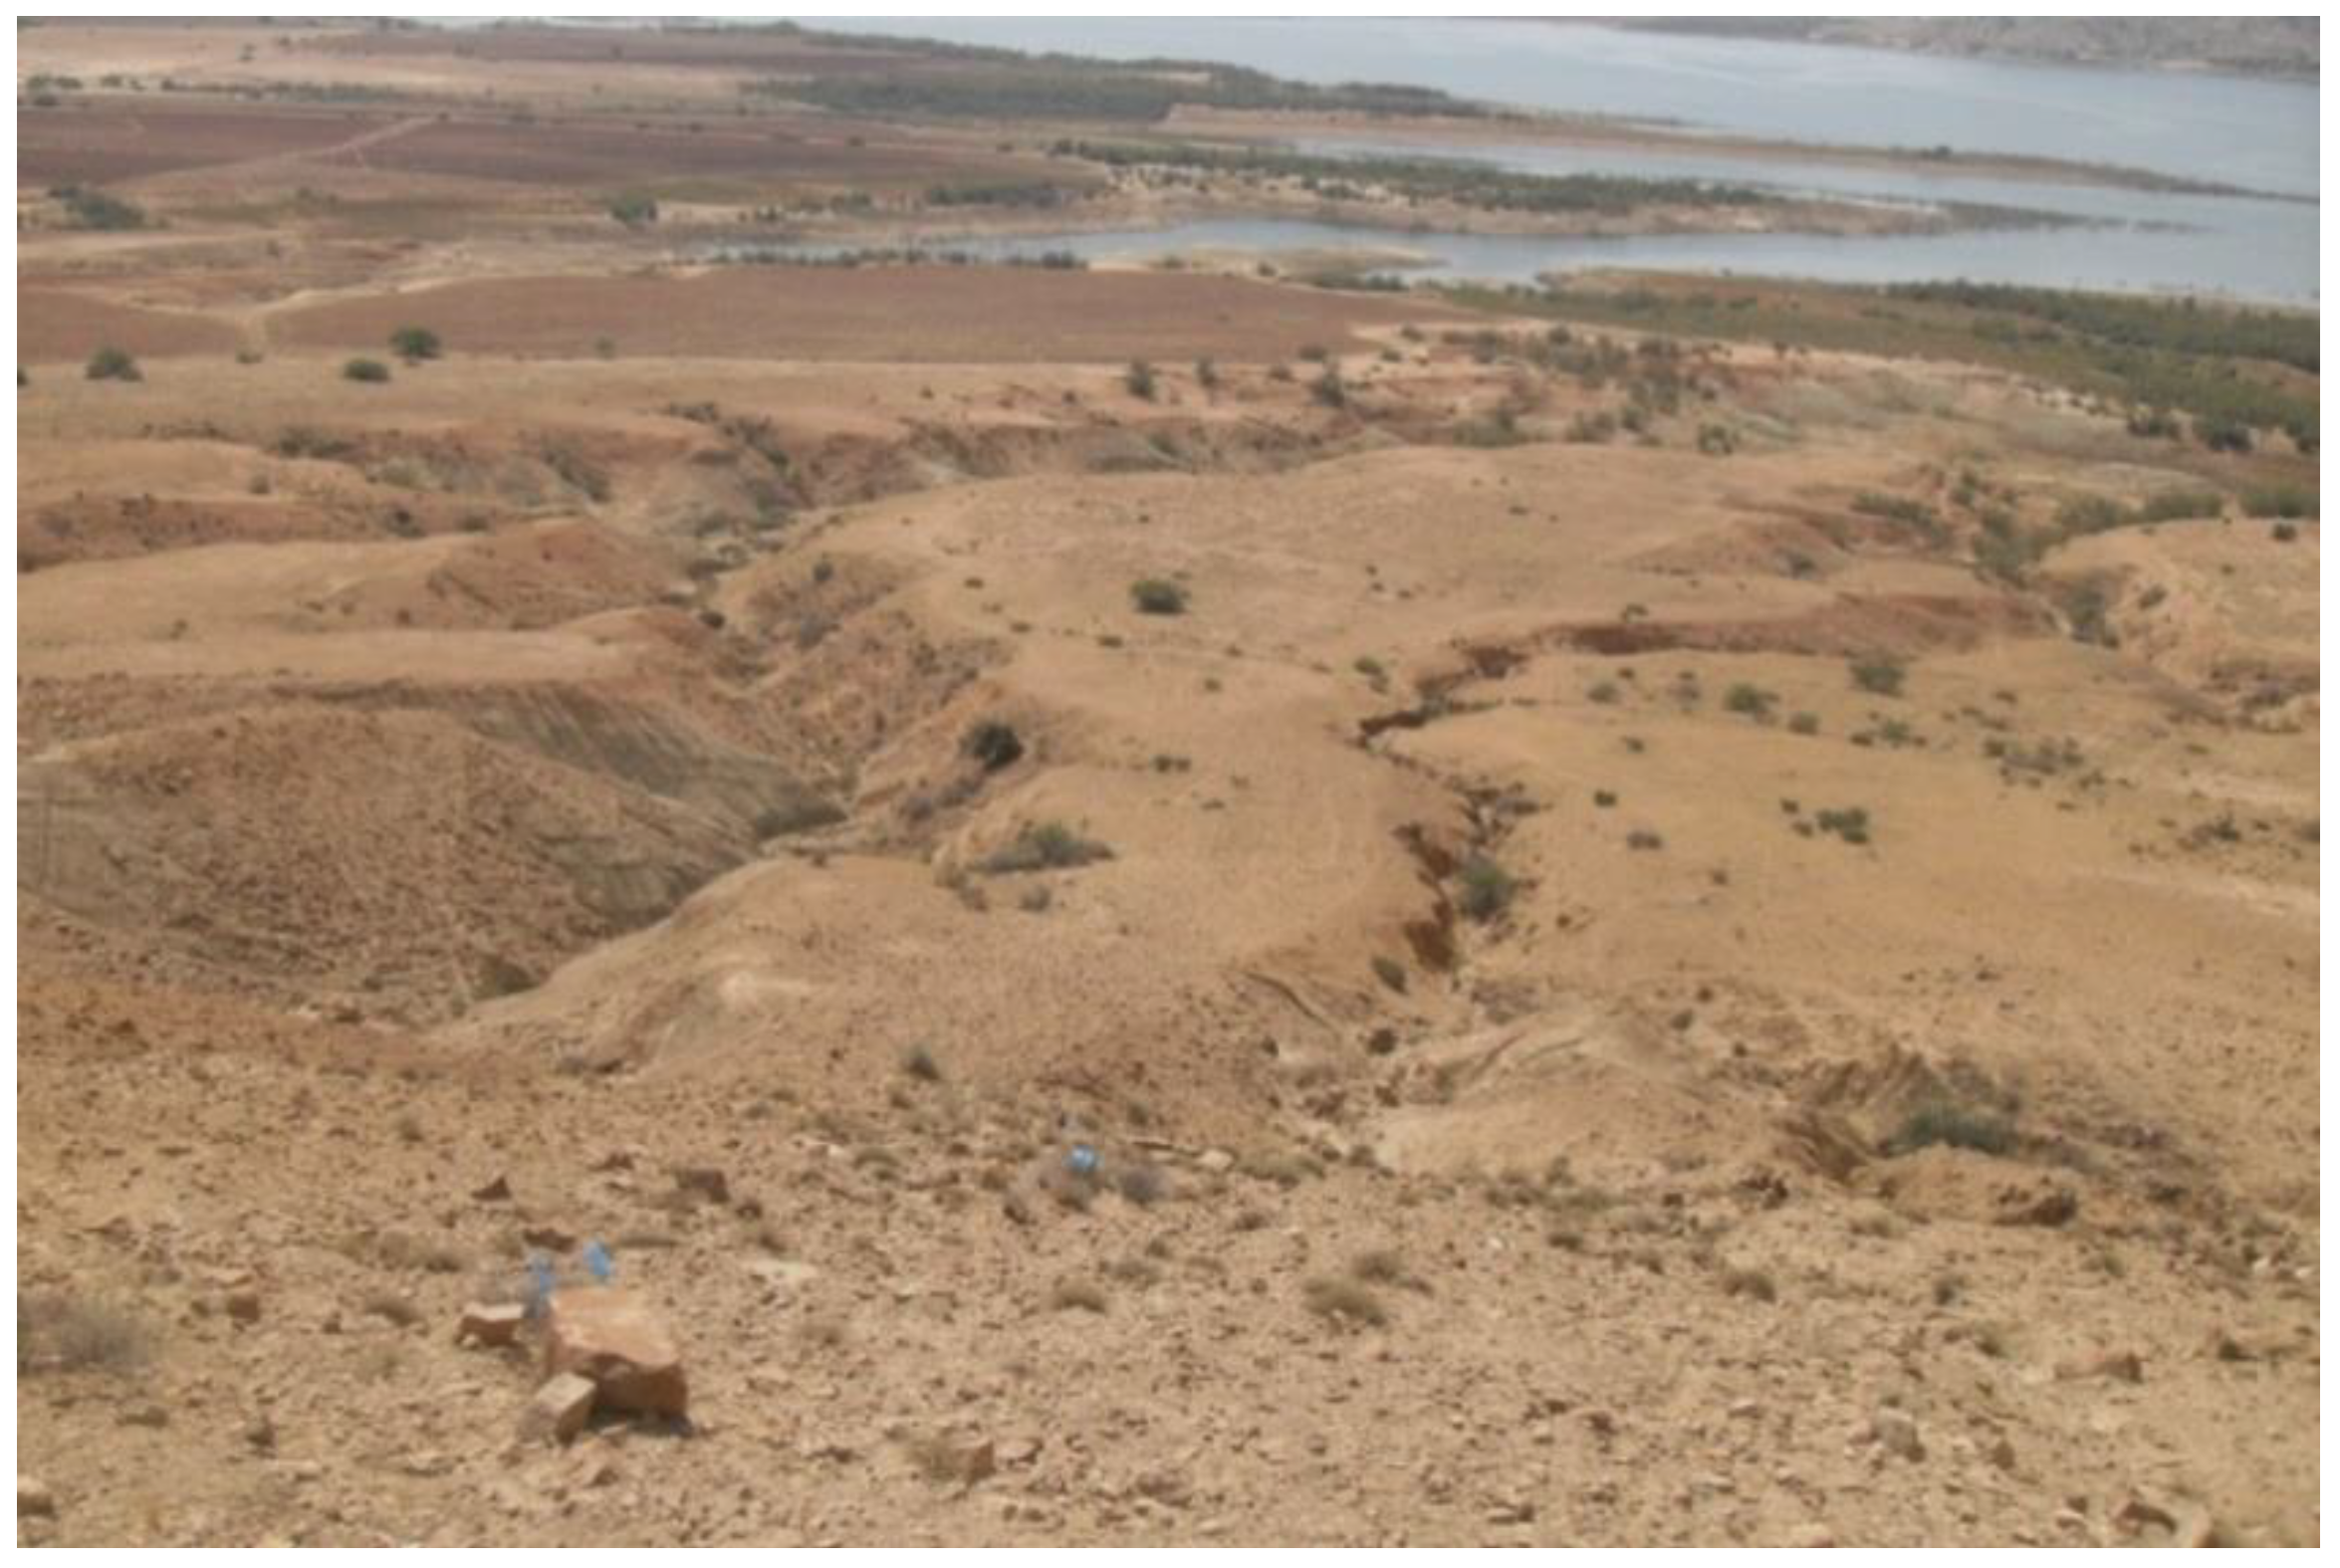

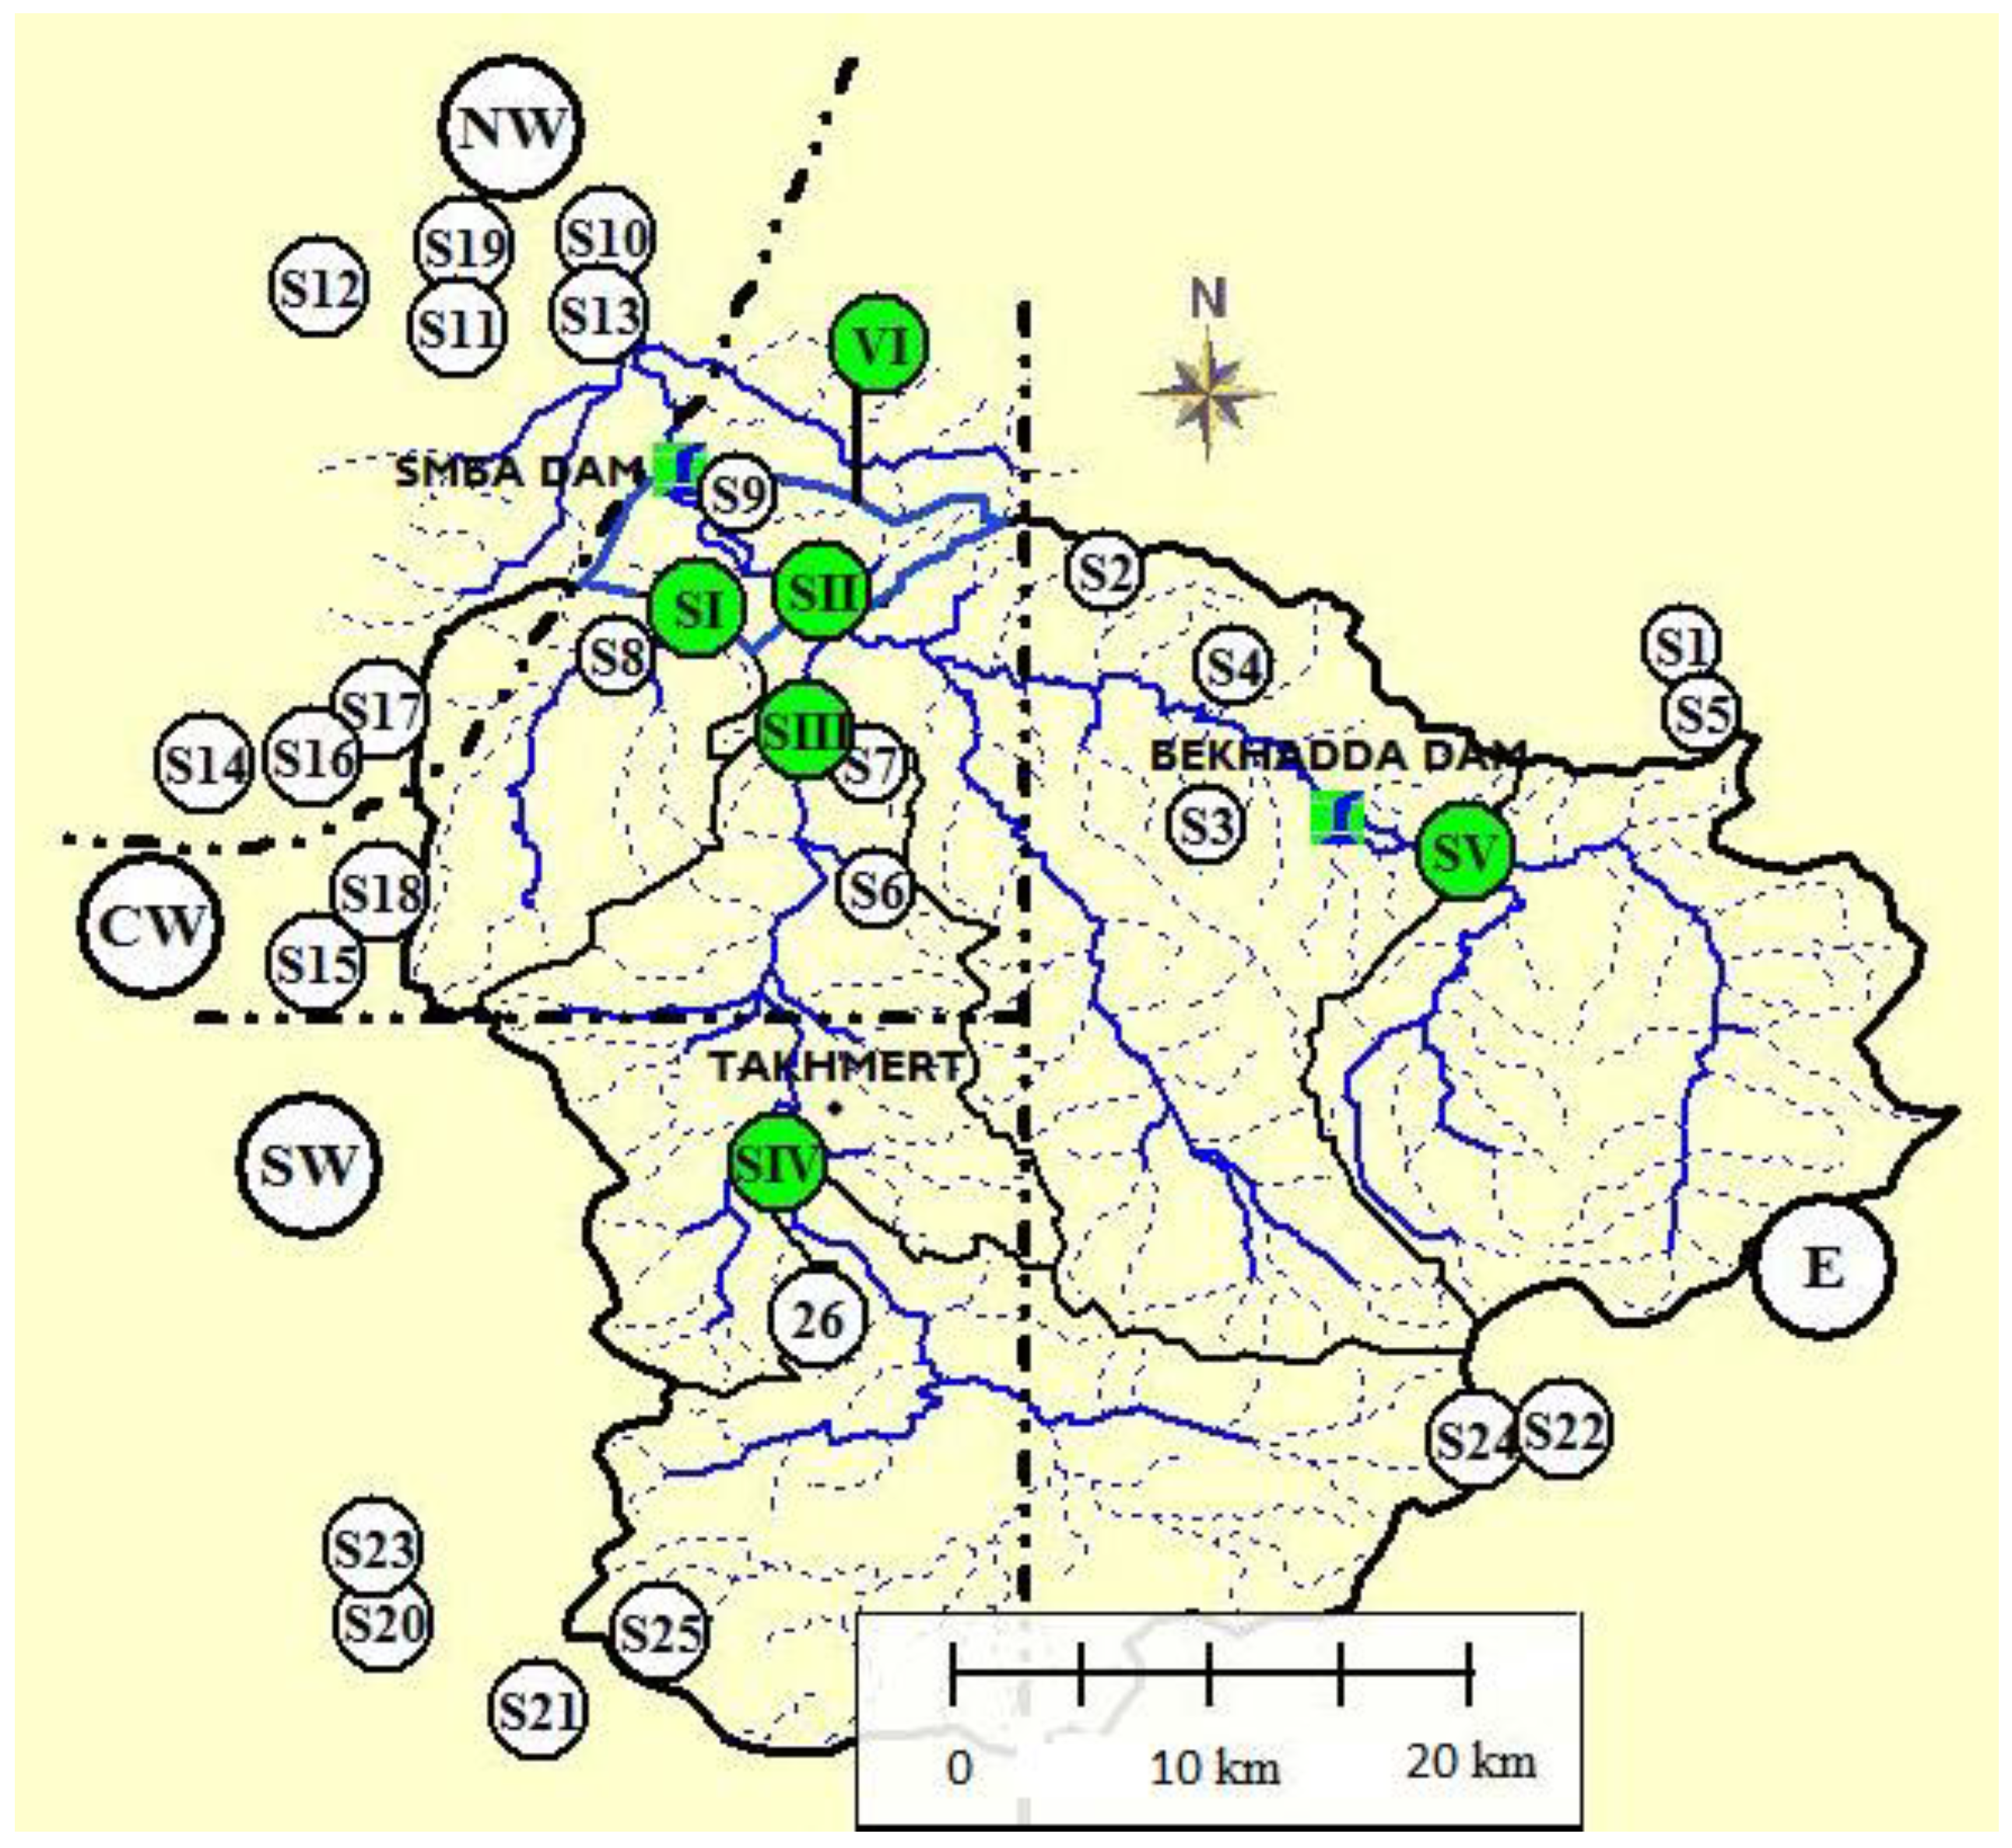
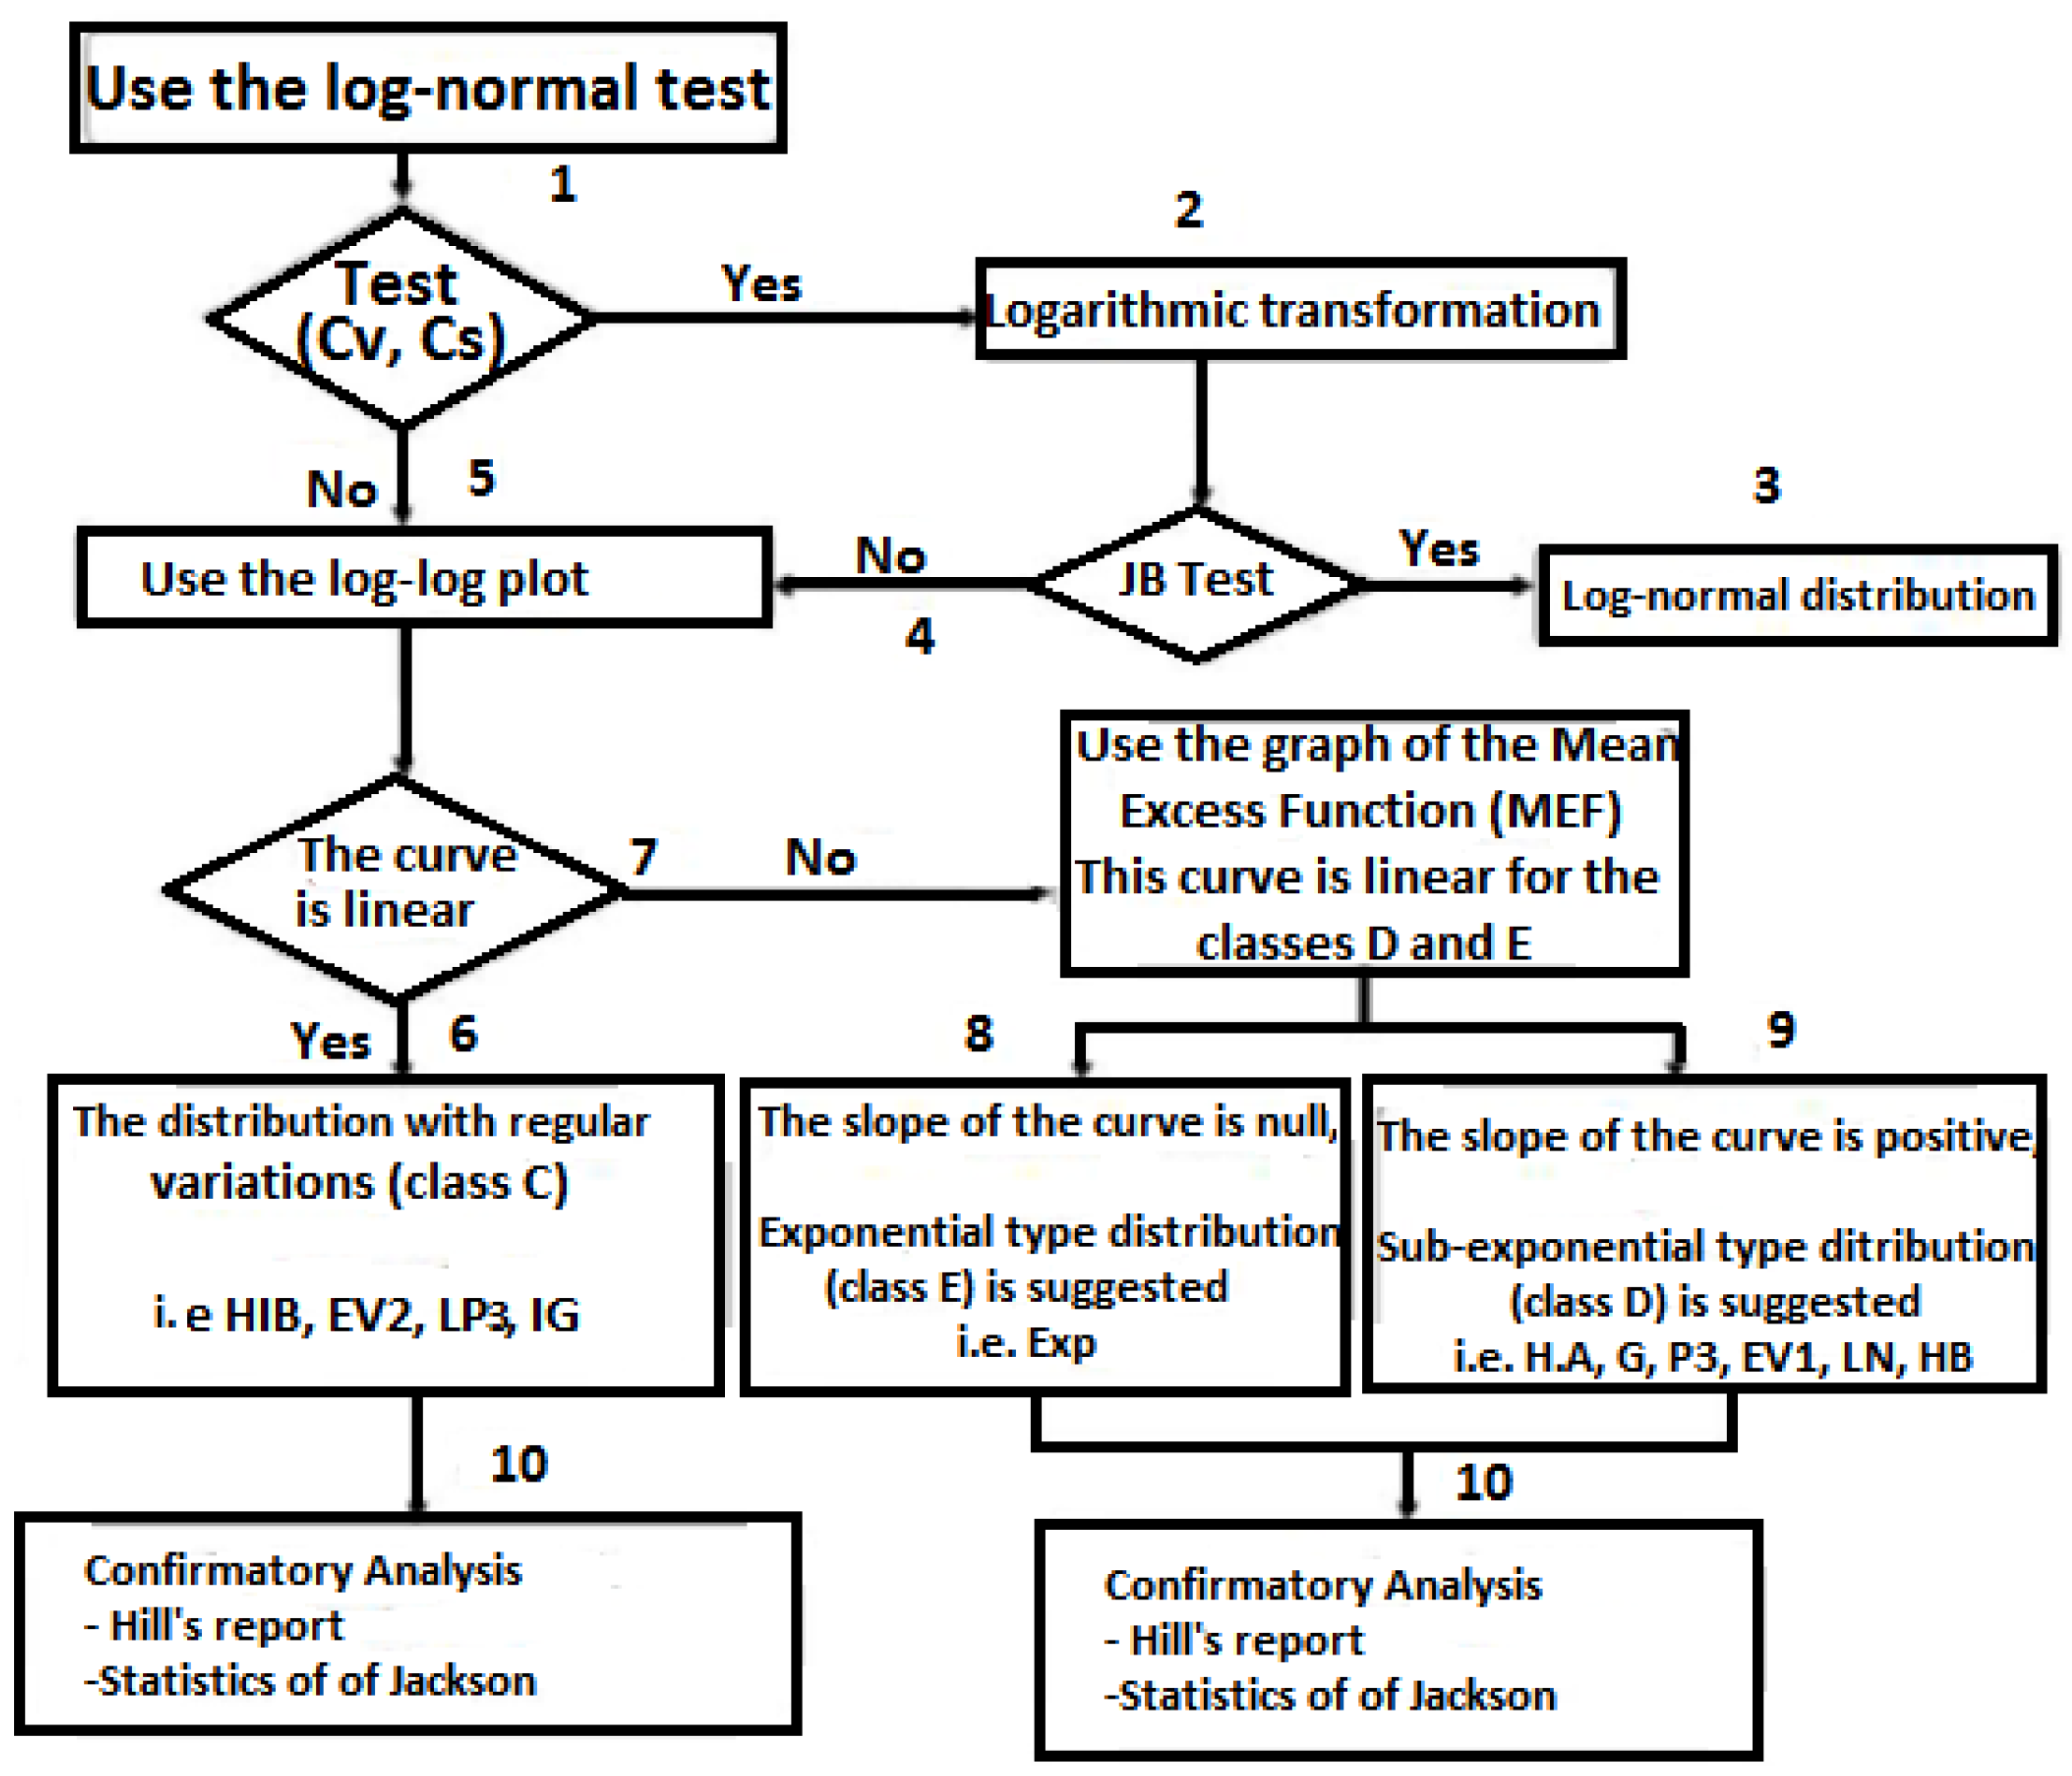
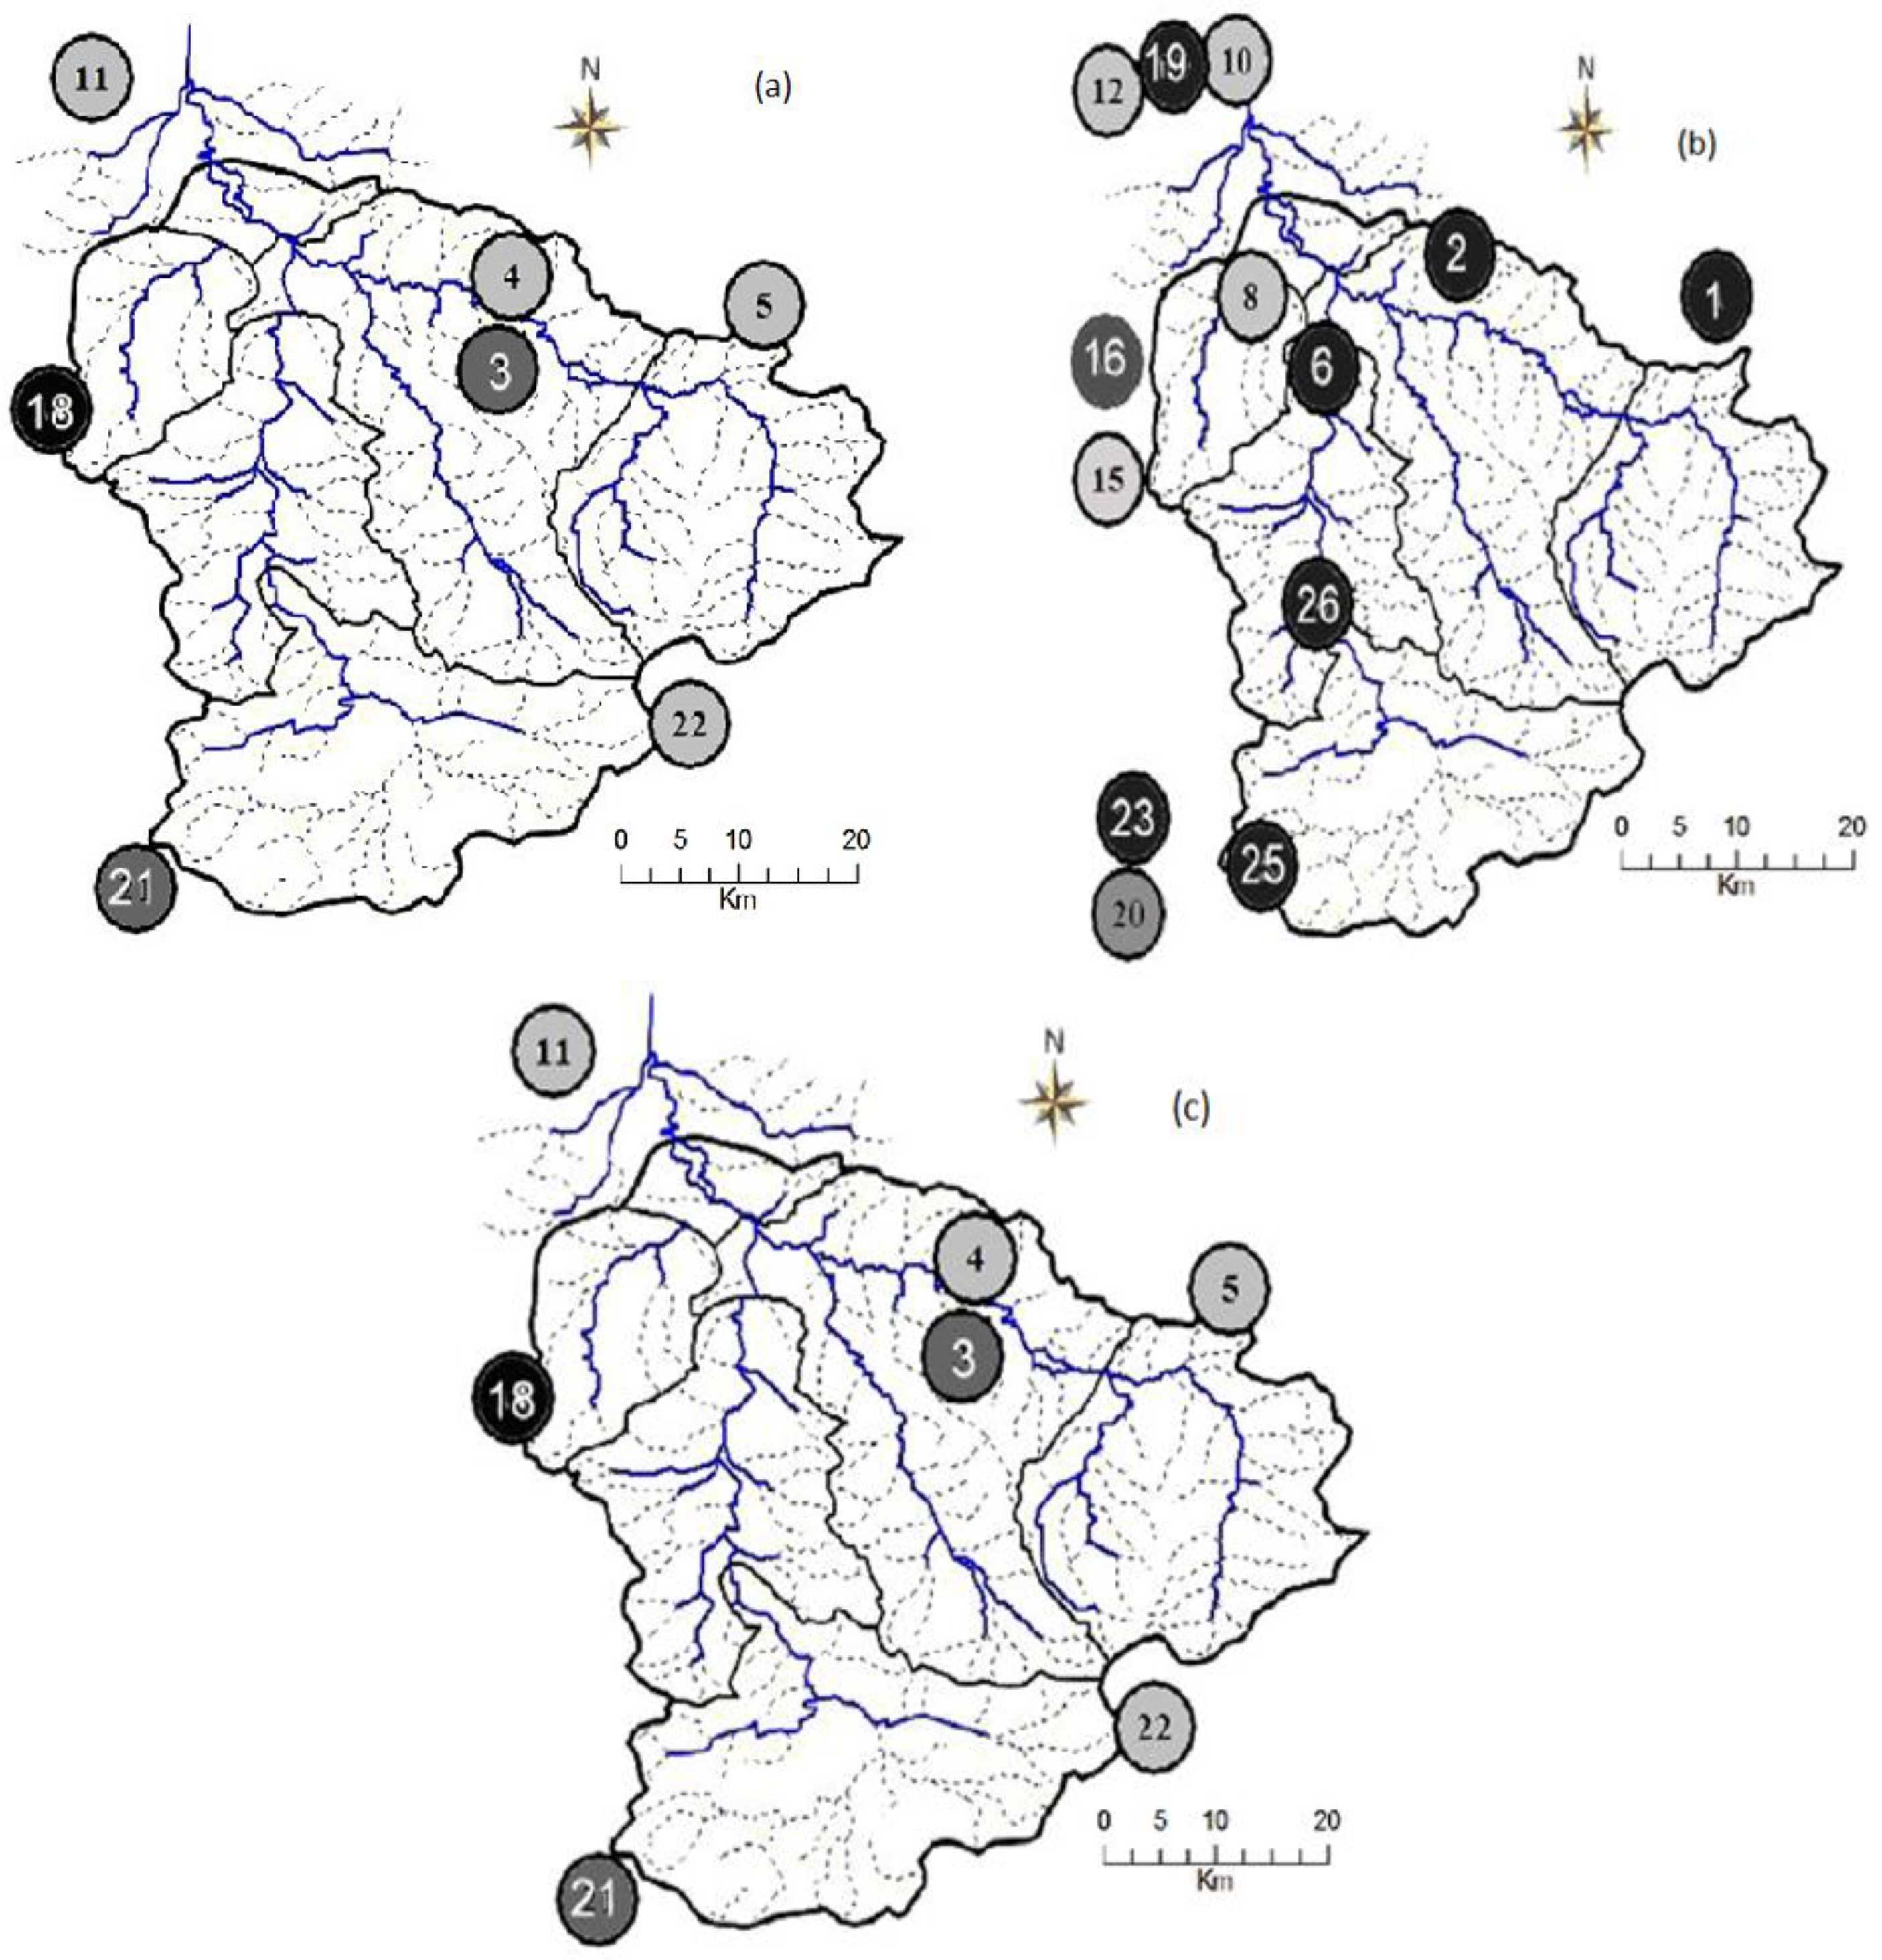
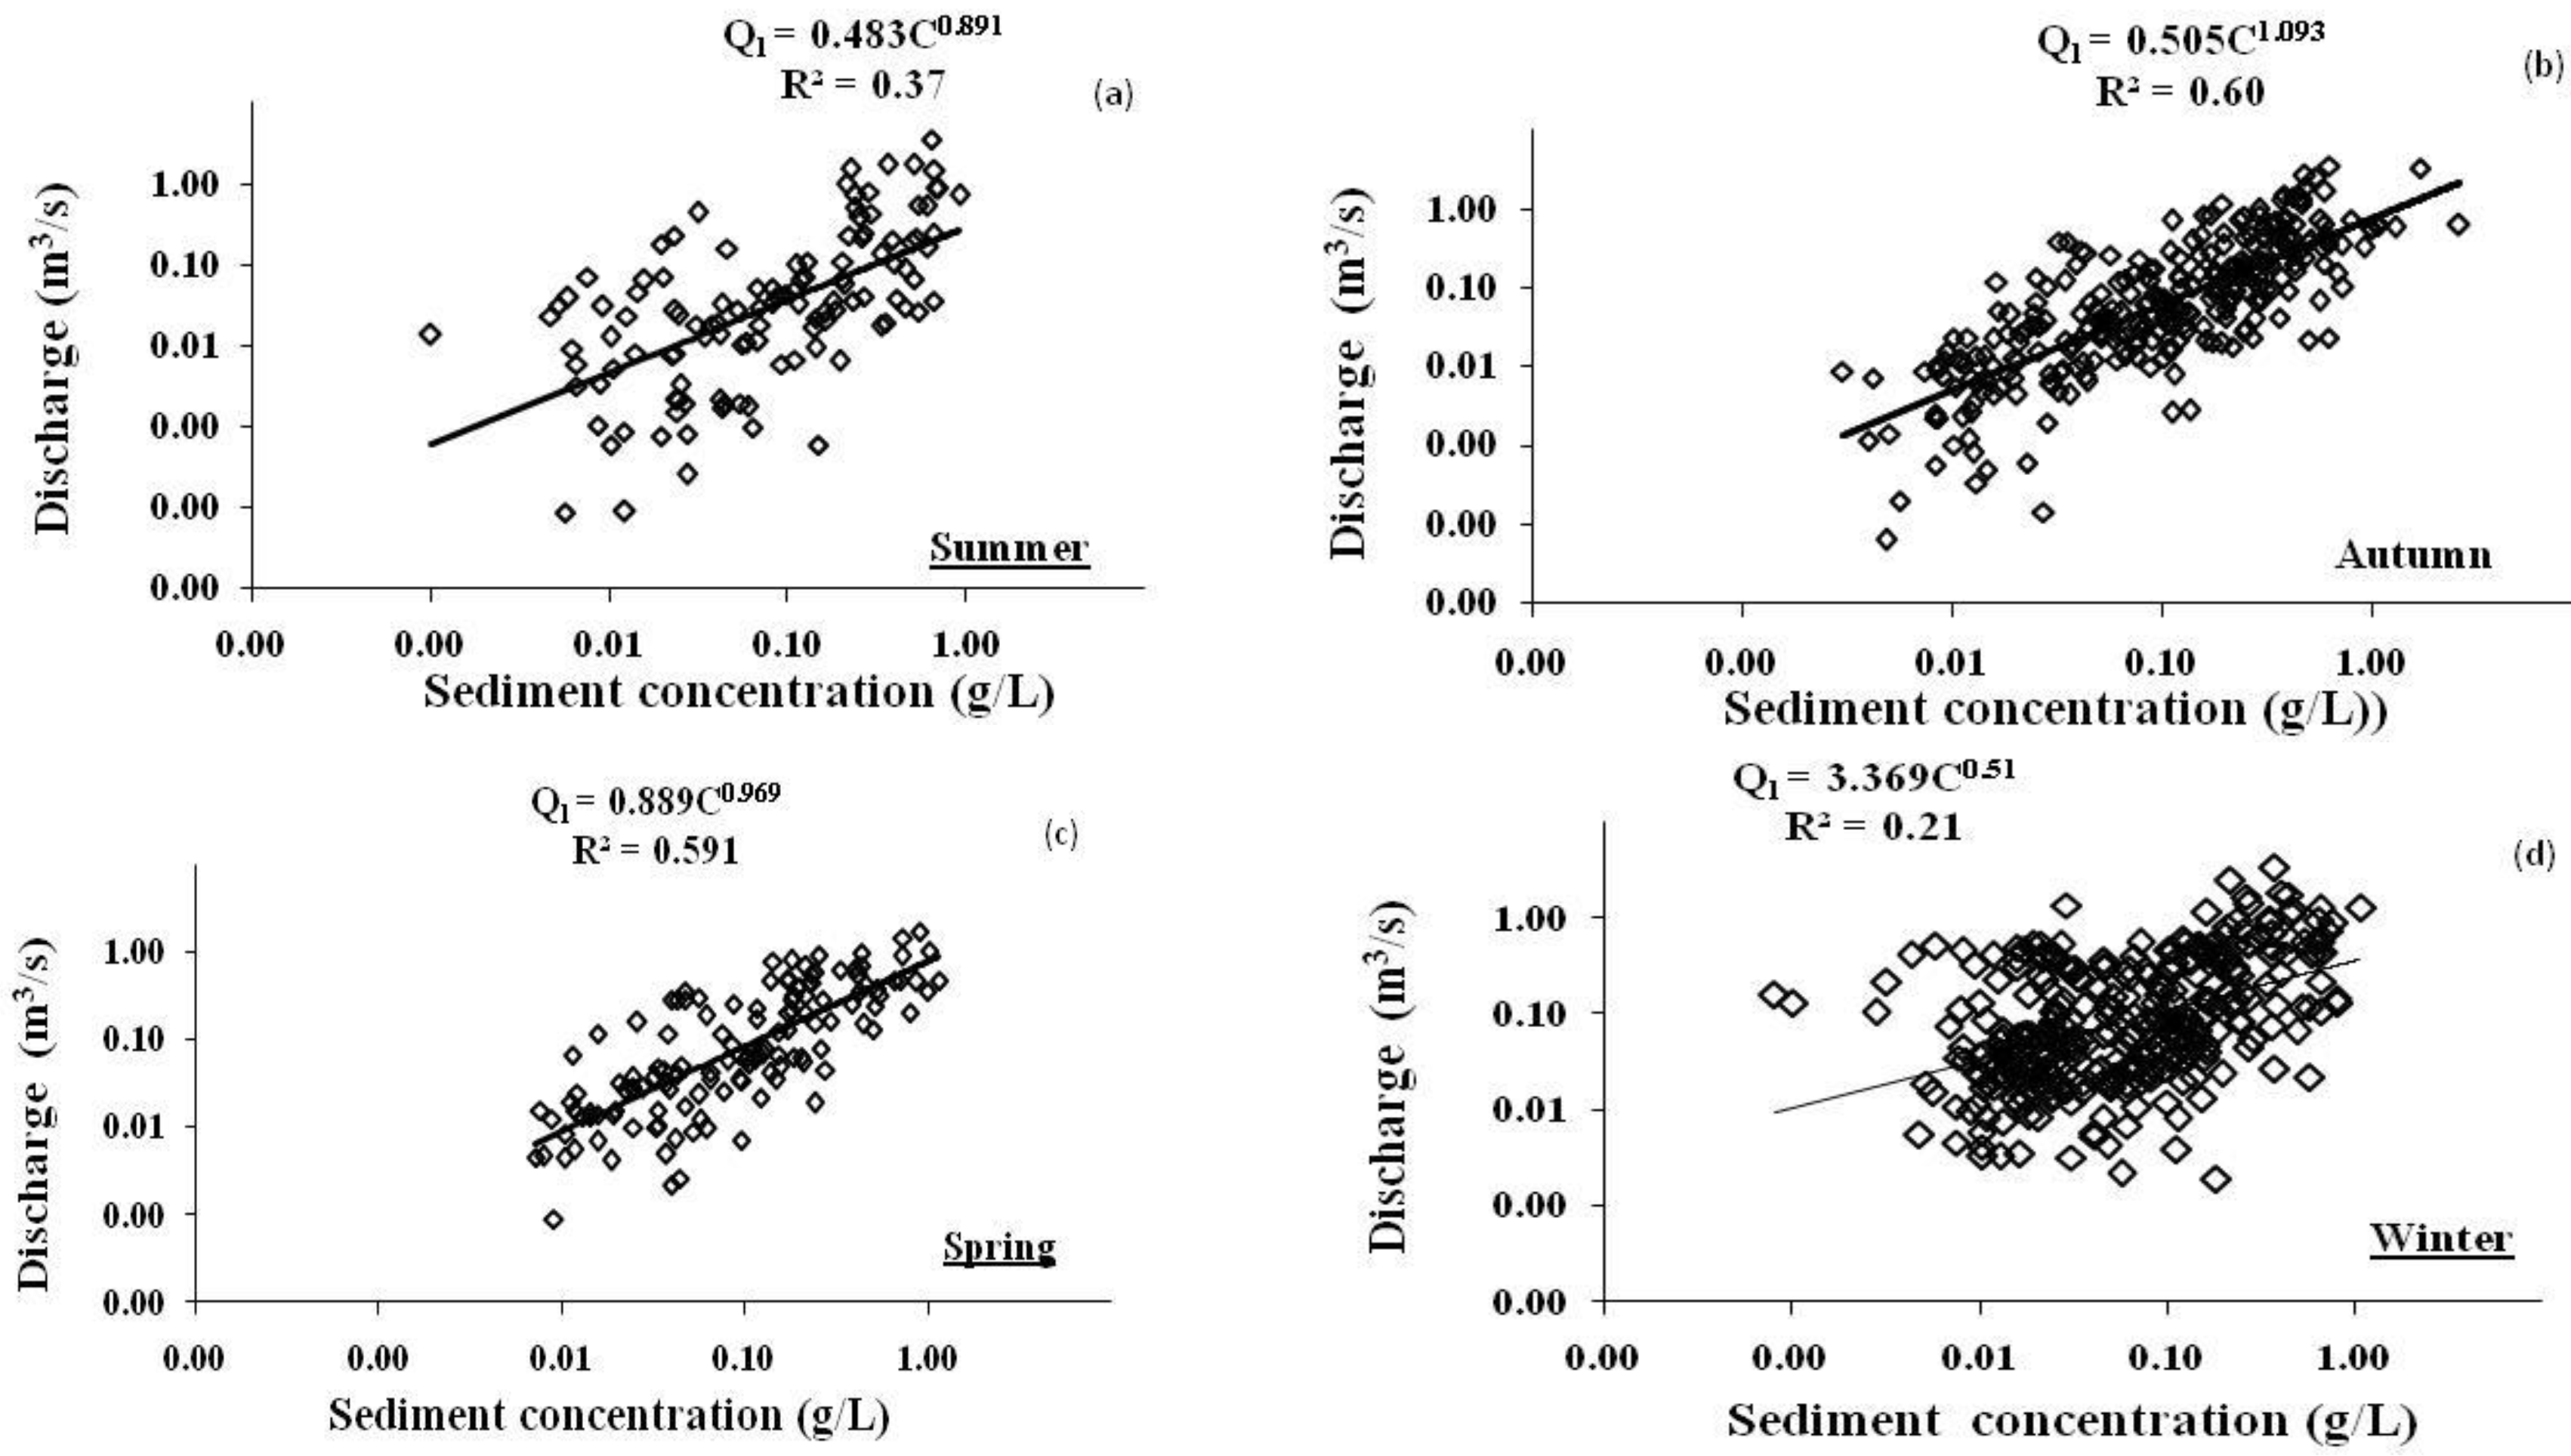
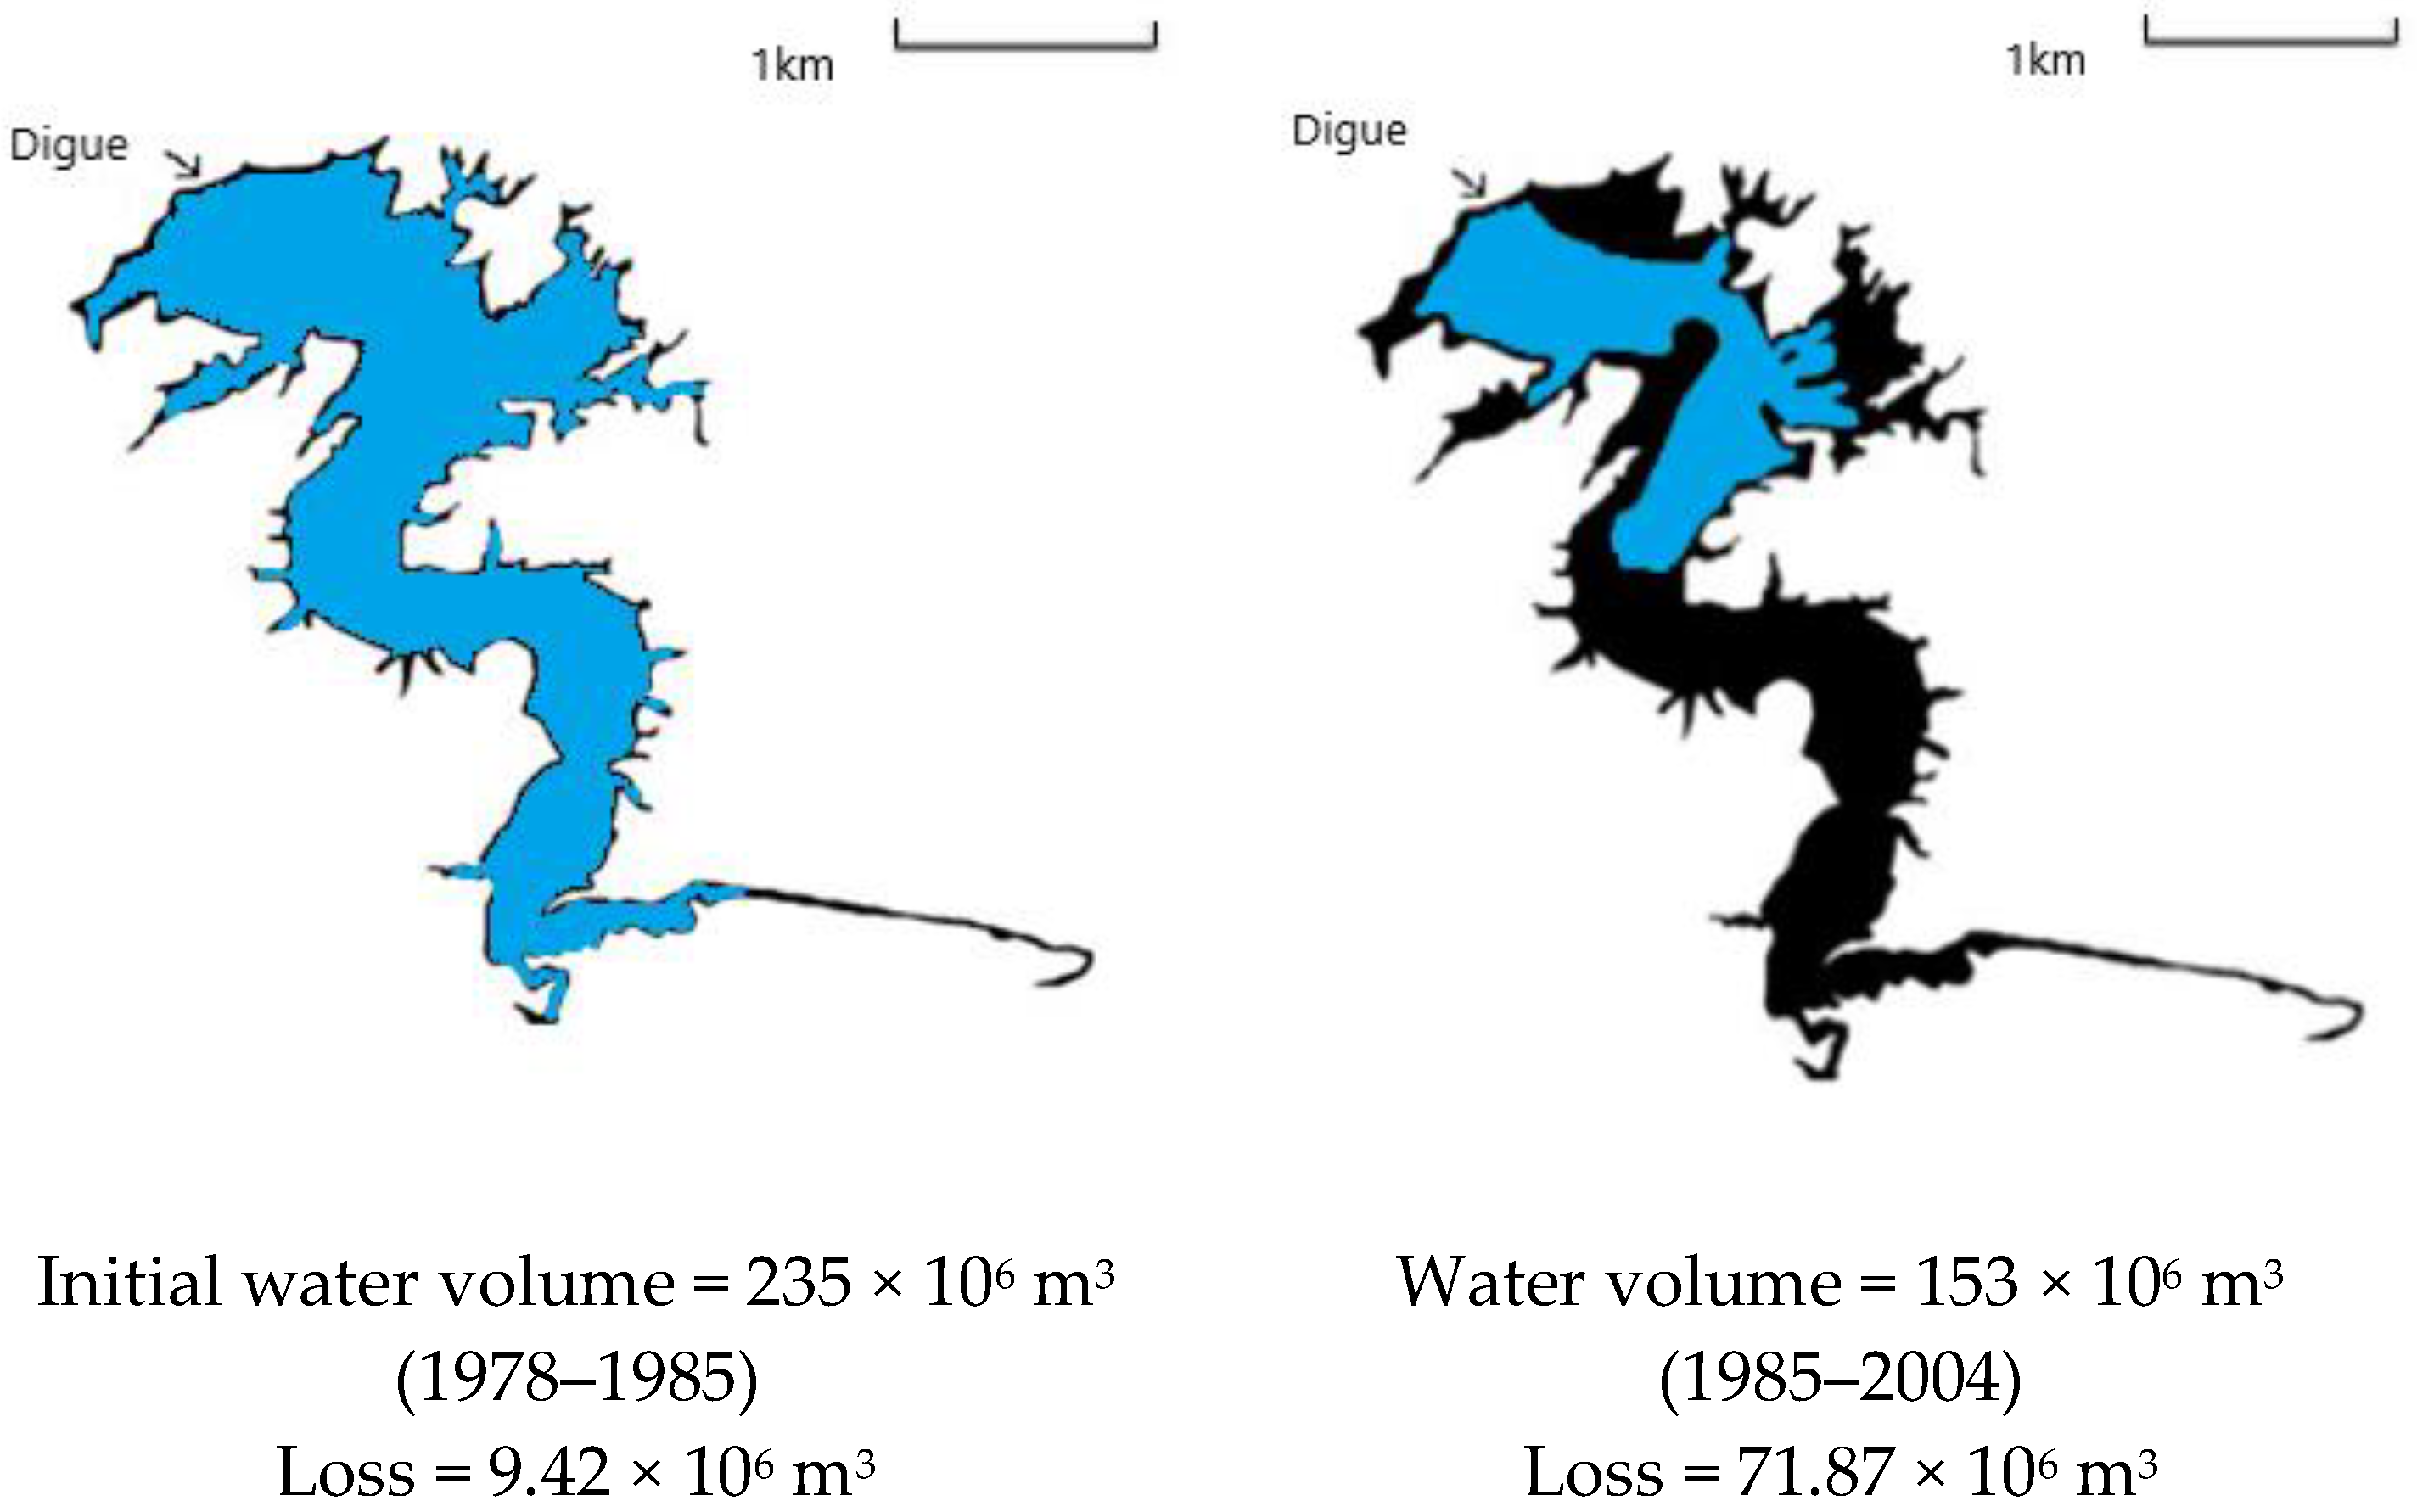
Table 1.
Inventory of pluviometric stations (latitudes and longitudes in decimal degrees, altitude in m).
Table 1.
Inventory of pluviometric stations (latitudes and longitudes in decimal degrees, altitude in m).
| N° | ANRH Station Code | Name | Latitude | Longitude | Altitude | Period |
|---|---|---|---|---|---|---|
| 1 | 012507 | Wadi Lili | 35.50417 | 1.288056 | 588 | 1969–2007 |
| 2 | 012703 | Djdiouia amont | 35.6525 | 0.8277778 | 562 | 1930–2003 |
| 3 | 012901 | Bakhadda Bge | 35.35444 | 1.035 | 572 | 1972–2007 |
| 4 | 012909 | Sidi Ali Benamar | 35.32444 | 1.129722 | 630 | 1971–1994 |
| 5 | 012917 | Tiaret-ANRH | 35.38528 | 1.306944 | 1106 | 1990–2007 |
| 6 | 013302 | Ain Hamara | 35.38028 | 0.6797222 | 288 | 1968–2007 |
| 7 | 013306 | Wadi El-Abtal | 35.46056 | 0.6972222 | 354 | 1952–1968 |
| 8 | 013401 | Sidi AEK Djilali | 35.48555 | 0.5877778 | 236 | 1968–2007 |
| 9 | 013410 | SMBA | 35.58528 | 0.5944445 | 195 | 1968–2007 |
| 10 | 013505 | Relizane DEMRH | 35.76278 | 0.5347222 | 58 | 1966–2005 |
| 11 | 013506 | El Matmar | 35.72333 | 0.4847222 | 70 | 1990–2007 |
| 12 | 013507 | L’Hillil | 35.72556 | 0.3480555 | 120 | 1968–2006 |
| 13 | 013511 | Relizane aval | 35.73695 | 0.5336111 | 69 | 1938–1969 |
| 14 | 111401 | Mascara | 35.38278 | 0.2408333 | 487 | 1930–1961 |
| 15 | 111404 | Aouf | 35.18639 | 0.3688889 | 968 | 1930–1959 |
| 16 | 111405 | Matmor | 35.33333 | 0.2 | 470 | 1930–2003 |
| 17 | 111407 | Tighenif | 35.42417 | 0.3252778 | 540 | 1938–1969 |
| 18 | 111418 | Nesmoth | 35.25945 | 0.3913889 | 906 | 1990–2007 |
| 19 | 111609 | Bouguirat | 35.76472 | 0.2291667 | 65 | 1930–2003 |
| 20 | 080504 | Bled Bel Hammar | 34.73583 | 0.22 | 1170 | 1970–2006 |
| 21 | 080606 | Maamora | 34.68389 | 0.5269445 | 1148 | 1974–2007 |
| 22 | 080701 | Medrissa | 34.89611 | 1.233333 | 1110 | 1930–2006 |
| 23 | 111216 | Med El Habib | 34.8 | 0.2541667 | 1106 | 1930–2007 |
| 24 | 013201 | Ain Kermès | 34.90861 | 1.1025 | 1112 | 1976–2007 |
| 25 | 013204 | Sidi Yousef | 34.80056 | 0.5944445 | 1091 | 1930–2007 |
| 26 | 013304 | Takhmert | 35.115 | 0.6913889 | 663 | 1930–2007 |
Table 2.
Inventory of hydrometric stations used for the study.
| Basin | S/Basin | Stations | Surface (km²) | Latitude | Longitude | Altitude | Period | Number of Instantaneous Solid Flow Measurements |
|---|---|---|---|---|---|---|---|---|
| Wadi Haddad | 2B | Sidi Aek Djilali: I | 499 | 35.48555 | 0.5877778 | 236 | 1969/2010 | 6262 |
| Wadi Mina | 1B | Wadi El Abtal: II | 5365 | 35.58528 | 0.5944445 | 195 | 1969/2010 | 17,692 |
| Wadi Abd Aval | 3B | Ain Hamara: III | 2474 | 35.38028 | 0.6797222 | 288 | 1969/2010 | 10,222 |
| 4B | Takhmert: IV | 1488 | 35.115 | 0.6913889 | 663 | 1969/2007 | 737 | |
| Upstream Wadi Mina | 5B | Sidi Ali Ben Amar: V | 1163 | 35.32444 | 1.129722 | 630 | 1969/2007 | 848 |
| Wadi Mina | 6B | Intermediary zone: VI | 192 | / | / | / | / | / |
Table 3.
Ruptures detected at the level of each pluviometric station. Ruptures dates detected by three statistical tests (red: strong rupture), by at least two statistical tests (dark gray: probable ruptures), by at least one statistical test (light gray: weak rupture) on the catchment areas (in bold: the ruptures dates detected for more than one catchment area the same year or the same month) (empty box = no probable rupture detected).
| Station | Regional Groups | S | O | N | D | J | F | M | A | M | J | J | A | Annual | |
|---|---|---|---|---|---|---|---|---|---|---|---|---|---|---|---|
| Oued lili | E | 72 | 75 | 77 | 80 | 75 | 85 | 71 | 82 | 70 | 74 | ||||
| Djdiouia amont | 75 | 01 | 81 | 72 | 86 | 96 | 76 | 01 | 76 | ||||||
| Bekhadda bge | 75 | 77 | 74 | 76 | 77 | 76 | 76 | 70 | 74 | 69 | 06 | ||||
| Sidi Ali Ben Amar | 74 | 78 | 81 | 78 | 78 | 81 | |||||||||
| Tiaret—ANRH | 84 | 73 | 74 | 79 | 78 | 76 | 02 | 93 | |||||||
| Medrissa | 93 | 01 | 99 | 96 | 96 | 01 | 98 | ||||||||
| Ain kermes | 92 | 80 | 71 | 72 | 75 | 79 | 76 | 84 | |||||||
| Total ruptures by region | 04 | 04 | 04 | 03 | 07 | 02 | 06 | 04 | 02 | 06 | 05 | 06 | 06 | ||
| Relizane demrh | NW | 71 | 83 | 00 | 87 | 72 | 95 | 74 | 75 | 70 | 76 | 03 | 93 | 75 | |
| El Matmar | 02 | 80 | 71 | 03 | 72 | 06 | 05 | 79 | 06 | 76 | 06 | 87 | 05 | ||
| Hillil | 02 | 70 | 00 | 81 | 72 | 70 | 74 | 75 | 71 | 76 | 03 | 75 | 75 | ||
| Relizane aval | 81 | 82 | 78 | 70 | 81 | 73 | 77 | 80 | 02 | 82 | 65 | ||||
| Mascara | 72 | 74 | 81 | 77 | 82 | 73 | 70 | 75 | 01 | 60 | |||||
| Motmor | 75 | 99 | 74 | 96 | 76 | 01 | 76 | ||||||||
| Tighenif | 82 | 80 | 71 | 72 | 79 | 02 | 76 | 80 | 87 | 67 | |||||
| Bouguirat | 01 | 74 | 01 | 96 | 76 | 01 | 76 | ||||||||
| Total ruptures by region | 05 | 06 | 07 | 07 | 07 | 05 | 06 | 06 | 06 | 07 | 06 | 08 | 08 | ||
| Ain Hamara | CW | 84 | 80 | 06 | 70 | 06 | 68 | 74 | 81 | 70 | 76 | 75 | |||
| Oued El Abtal | 02 | 74 | 71 | 80 | 74 | 92 | 75 | 78 | 64 | ||||||
| Sid Aek Djilali | 02 | 06 | 02 | 03 | 72 | 68 | 74 | 02 | 71 | 03 | 05 | 87 | 75 | ||
| Sidi M’Hamed Ben Aouda | 02 | 80 | 71 | 03 | 72 | 06 | 05 | 79 | 06 | 76 | 06 | 87 | 69 | ||
| Aouf | 81 | 71 | 77 | 91 | 94 | 79 | 82 | 81 | 71 | ||||||
| Nesmoth | 80 | 74 | 83 | 72 | 79 | 76 | 80 | 04 | |||||||
| Total ruptures by region | 05 | 04 | 05 | 05 | 06 | 04 | 04 | 06 | 05 | 05 | 04 | 04 | 06 | ||
| Bled Bel Hammar | SW | 78 | 74 | 73 | 75 | 76 | 76 | 76 | 80 | 75 | 76 | 81 | 77 | ||
| Maamora | 92 | 74 | 82 | 71 | 72 | 74 | 80 | 79 | 70 | 89 | |||||
| Med El Habib | 75 | 99 | 81 | 72 | 96 | 98 | 96 | 96 | 76 | ||||||
| Sidi Youcef | 06 | 74 | 96 | 96 | 96 | 76 | |||||||||
| Takhmert | 75 | 74 | 96 | 98 | 76 | 76 | |||||||||
| Total ruptures by region | 03 | 03 | 01 | 05 | 03 | 02 | 04 | 04 | 02 | 05 | 04 | 0 | 05 | ||
| % of annual rain | 06 | 08 | 11 | 13 | 11 | 13 | 12 | 13 | 08 | 02 | 01 | 02 | |||
| Number of ruptures in the decades | 1960 | 02 | 01 | 05 | |||||||||||
| 1970 | 03 | 09 | 08 | 12 | 18 | 05 | 07 | 15 | 09 | 17 | 07 | 03 | 13 | ||
| 1980 | 05 | 07 | 01 | 05 | 02 | 02 | 04 | 01 | 02 | 02 | 03 | 09 | 02 | ||
| 1990 | 03 | 02 | 02 | 07 | 03 | 01 | 03 | 03 | 01 | 02 | |||||
| 2000 | 06 | 01 | 05 | 03 | 03 | 02 | 02 | 03 | 01 | 05 | 06 | 03 | |||
Table 4.
Detection of ruptures in the annual and monthly flow series and annual maximum (Qmaxd) and minimum (Qmind) daily discharge (1968/1969–2006/2007). Dates of ruptures detected by three statistical tests (red: strong ruptures), by at least two statistical tests (dark gray: probable ruptures), by at least one statistical test (light gray: weak rupture) (on the catchment areas (in bold: the ruptures dates detected for more than one catchment area the same year or the same month) (empty box = no probable rupture detected).
| Station | S | O | N | D | J | F | M | A | M | J | J | A | Annual Discharge | Qmaxd Annual Daily | Qmind Annual Daily | |
|---|---|---|---|---|---|---|---|---|---|---|---|---|---|---|---|---|
| Ain Hamara | 72 | 99 | 71 | 74 | 06 | 81 | 84 | 80 | 70 | 00 | 79 | 72 | 92 | 72 | ||
| Takhmert | 93 | 75 | 96 | 89 | 95 | 02 | 97 | 94 | 85 | 94 | ||||||
| Sidi Ali Ben Amar | 74 | 82 | 82 | 83 | 88 | 87 | 87 | 87 | 89 | 90 | 90 | 81 | 70 | 81 | ||
| Wadi El Abtal | 73 | 73 | 70 | 95 | 72 | 81 | 80 | 76 | 79 | 75 | 74 | 84 | 72 | |||
| Sidi Aek Djilali | 70 | 75 | 90 | 70 | 90 | 87 | 91 | 75 | 76 | 76 | 75 | 74 | 75 | 95 | 74 | |
| % annual discharge | Total | |||||||||||||||
| Number of ruptures in the decades | 1960 | 0 | ||||||||||||||
| 1970 | 3 | 4 | 3 | 1 | 1 | 1 | 1 | 3 | 2 | 3 | 3 | 22 | ||||
| 1980 | 1 | 2 | 1 | 2 | 2 | 3 | 3 | 1 | 1 | 2 | 1 | 15 | ||||
| 1990 | 1 | 3 | 1 | 2 | 1 | 2 | 1 | 1 | 11 | |||||||
| 2000 | 1 | 1 | 1 | 3 | ||||||||||||
Table 5.
Distribution of floods for each station of the Wadi Mina basin.
| Basin | Stations | Independence (Wald–Wolfowitz) | Stationary (Kendall) | Class Distributions |
|---|---|---|---|---|
| Wadi El Abd Aval | Ain Hamara | Accepted to the 5% threshold | Accepted to the 1% threshold | C (GEV distribution) |
| Takhmert | Accepted to the 5% threshold | Accepted to the 5% threshold | C (GEV distribution) | |
| Wadi Haddad | Sidi Abdel Kader Djilali | Accepted to the1% threshold | Accepted to the 1% threshold | C (GEV distribution) |
| Upstream Wadi Mina | Wadi El Abtal | Accepted to the 5% threshold | Accepted to the 5% threshold | C (GEV distribution) |
| Sidi Ali Ben Amar | Rejected to the 1% threshold | Accepted to the 5% threshold | C (GEV distribution) |
Table 6.
Seasonal models connecting the instantaneous flows with the concentration of matters in instant suspension.
Table 6.
Seasonal models connecting the instantaneous flows with the concentration of matters in instant suspension.
| STATION | Correlation | Autumn | Winter | Spring | Summer |
|---|---|---|---|---|---|
| W. El Abtal | Model | Q = 0.506C1.092 | Q = 1.940C0.719 | Q = 0.889C0.969 | Q = 0.483 C0.891 |
| Coefficient R2 | 0.60 | 0.20 | 0.59 | 0.37 | |
| S.A.E.K. Djilali | Model | Q = 0.031C1.137 | Q = 0.125C0.561 | Q = 0.024C1.12 | Q= 0.161C0.584 |
| Coefficient R2 | 0.60 | 0.20 | 0.63 | 0.30 | |
| A. Hamara | Model | Q = 1.038C0.854 | Q = 1.715 8C0.458 | Q = 0.893C0.867 | Q = 1.292C0.655 |
| Coefficient R2 | 0.51 | 0.34 | 0.55 | 0.38 | |
| Takhmert | Model | Q =0.8C1.022 | Q = 1.78 8C0.621 | Q = 1.13C0.934 | Q = 0.842C0.845 |
| Coefficient R2 | 0.63 | 0.43 | 0.66 | 0.44 | |
| S.A.B. Amar | Model | Q = 0.799C0.733 | Q = 2.437C0.167 | Q = 0.67C0.712 | Q = 0.277C0.896 |
| Coefficient R2 | 0.56 | 0.21 | 0.64 | 0.44 |
Table 7.
Results of the calculation of sediment charge in tons.
| Basins | W. Mina (I + II) | W. Haddad | W. Mina | W. Abd | W. Mina Amont | |
|---|---|---|---|---|---|---|
| Station name | (W. Abtal + S.A. Djilali) | S. Aek Djilali | W. El Abtal | A. Hamara | Takhmert | S. A. B. Amar |
| Average specific load (t·km−2·year−1) | 860 | 965 | 762 | 502 | 220 | 239 |
| Period of observation | 1969/2010 | 1969/2010 | 1969/2010 | 1969/2010 | 1969/2007 | 1969/2007 |
Table 8.
Sedimentary load and specific degradation in the basin of Wadi Mina.
| Designation | SMBA Dam |
|---|---|
| Sedimentary load deposited in the dam impoundment (bathymetry). | 5.6 × 10⁶ t·year−1 |
| Sedimentary load by concentration measure on Wadi Haddad and Wadi Mina upstream. | 5.2 × 10⁶ t·year−1 |
| Sedimentary load coming from the dam slopes. | 4 × 10⁵ t·year−1 |
| Specific degradation (dam slopes). | 21 t·ha−1·year−1 |
| Specific degradation (Stations: W.El Abtal + Sidi Abdelkader Djilali). | 8.6 t·ha−1·year−1 |
Table 9.
Values of specific degradation per sub-basin.
| Sub-Basin | Wadi Name | Specific Degradation (t·ha−1·year−1) | ||
|---|---|---|---|---|
| USLE Equation | Concentrations Measure | Difference (USLE, Concentrations Measures) | ||
| 1B | 19.64 | 13.36 | 6.28/32% | |
| 5B | Wadi Mina | 11.54 | 2.39 | 9.15/79% |
| 6B | / | 21 | / | |
| 2B | Wadi Haddad | 12.64 | 9.64 | 3.00/24% |
| 3B | 8.82 | 5.02 | 3.80/43% | |
| 4B | Wadi El Abd | 3.86 | 2.20 | 1.66/43% |
© 2018 by the authors. Licensee MDPI, Basel, Switzerland. This article is an open access article distributed under the terms and conditions of the Creative Commons Attribution (CC BY) license (http://creativecommons.org/licenses/by/4.0/).
Share and Cite
MDPI and ACS Style
Hallouz, F.; Meddi, M.; Mahé, G.; Toumi, S.; Rahmani, S.E.A. Erosion, Suspended Sediment Transport and Sedimentation on the Wadi Mina at the Sidi M’Hamed Ben Aouda Dam, Algeria. Water 2018, 10, 895. https://doi.org/10.3390/w10070895
AMA Style
Hallouz F, Meddi M, Mahé G, Toumi S, Rahmani SEA. Erosion, Suspended Sediment Transport and Sedimentation on the Wadi Mina at the Sidi M’Hamed Ben Aouda Dam, Algeria. Water. 2018; 10(7):895. https://doi.org/10.3390/w10070895
Chicago/Turabian StyleHallouz, Faiza, Mohamed Meddi, Gil Mahé, Samir Toumi, and Salah Eddine Ali Rahmani. 2018. "Erosion, Suspended Sediment Transport and Sedimentation on the Wadi Mina at the Sidi M’Hamed Ben Aouda Dam, Algeria" Water 10, no. 7: 895. https://doi.org/10.3390/w10070895
Note that from the first issue of 2016, this journal uses article numbers instead of page numbers. See further details here.