Article

Beyond Eutrophication: Vancouver Lake, WA, USA as a Model System for Assessing Multiple, Interacting Biotic and Abiotic Drivers of Harmful Cyanobacterial Blooms

by
Gretchen Rollwagen-Bollens
1,2,*,
Tammy Lee
1,
Vanessa Rose
1 and
Stephen M. Bollens
1,2
1
School of the Environment, Washington State University, Vancouver, WA, 98686, USA
2
School of Biological Sciences, Washington State University, Vancouver, WA 98686, USA
*
Author to whom correspondence should be addressed.
Water 2018, 10(6), 757; https://doi.org/10.3390/w10060757
Submission received: 16 April 2018 / Revised: 7 June 2018 / Accepted: 8 June 2018 / Published: 10 June 2018
(This article belongs to the Special Issue Eutrophication of Waterways: An Old Problem with Modern Consequences)

Abstract

:
Eutrophication of lakes and reservoirs has contributed to an increase in the magnitude and frequency of harmful cyanobacterial blooms; however, the interactive effects of nutrient availability (eutrophication) and other abiotic and biotic drivers have rarely been comprehensively studied in the field. We undertook an eight-year (2005–2013) research program that assessed the interaction of multiple factors driving cyanobacterial blooms in Vancouver Lake, a large, shallow eutrophic lake in Washington, USA. Our program consisted of nearly continuous monthly or weekly monitoring of water quality and plankton community composition over eight years, as well as multiple zooplankton grazing experiments over three years. We found a relatively consistent seasonal succession of phytoplankton and zooplankton assemblages, and a pattern of interacting factors influencing cyanobacterial bloom dynamics. Typically, a combined effect of decreased dissolved inorganic nitrogen (N), a sudden increase of dissolved inorganic phosphorus (P), and a cascading effect of zooplankton grazing created a ‘perfect storm’ of conditions that promoted the rapid proliferation of cyanobacteria over the two to three weeks before a bloom. At the blooms’ peaks, cyanobacterial carbon biomass reached as high as 20 µg L−1, with total [chl a] often exceeding 750 µg L−1. In the weeks following the blooms’ peaks, [PO4-P] and [NH4-N] dropped and copepod feeding rates fell to near zero, whereas microzooplankton grazing rates reached their maxima. Microzooplankton grazing impact, combined with low nutrient availability, then drove down cyanobacteria abundance. Vancouver Lake serves as a model for understanding multiple, interacting drivers of cyanobacterial bloom dynamics in shallow, temperate lakes, and is therefore an important system in which to investigate new questions related to the science and management of harmful algal blooms.

1. Introduction

Cyanobacteria are globally ubiquitous in aquatic systems and form an important component of planktonic food webs, particularly as biogeochemical mediators of nitrogen and phosphorus [1]. Cyanobacterial blooms are historically natural occurrences and not inherently problematic [2]. However, harmful cyanobacterial blooms—those causing major negative impacts on ecosystems—are a critical threat to freshwater systems in the 21st century.
Cyanobacterial blooms may result in diminished water quality and low dissolved oxygen levels, leading to fish kills, decreased biodiversity, and the disruption of food webs and ecosystem dynamics [3,4,5]. In addition, numerous cyanobacterial species produce hepatotoxins, neurotoxins, or contact irritants [6]. These cyanotoxins may cause illness or fatalities from exposure to contaminated water [1,6,7], which poses an especially challenging problem when drinking water supplies are affected. Monitoring and mitigation efforts associated with cyanobacterial blooms are often costly and time consuming [8,9,10]. Therefore, identifying the factors contributing to cyanobacterial blooms is a critical step toward successfully managing these events, a need made more urgent as blooms occur with increased frequency around the world [5,11,12].
The link between eutrophication and cyanobacterial blooms is well-studied and supported by substantial evidence [13,14,15], and elevated concentrations of nitrogen and phosphorus are most often responsible [16,17,18]. However, cyanobacteria are multi-talented ecostrategists [7,19] that exist within complex planktonic ecosystems, and are thus influenced by changes in the physical environment and interactions with other planktonic taxa. Therefore, a thorough understanding of bloom dynamics must include examining influences of a wide range of interacting biotic and abiotic factors in the context of a more eutrophied world.
For instance, high water temperatures (>25 °C) favor cyanobacterial growth and further promote blooms [20,21,22] due to their high optimal growth temperatures relative to eukaryotic algae [23,24,25]. In particular, Microcystis are often the source of substantial toxin production and reach peak growth rates at higher temperatures than most other cyanobacteria [26,27,28]. Periods of strong water column stratification, coupled to warm temperatures, further improve competitive conditions for cyanobacteria capable of using gas vesicles to gain mobility within a highly stable water column [29,30]. Moreover, climate change is predicted to strengthen the effects of these key abiotic factors by increasing nutrient loading during periods of intense rainfall, increasing water temperatures, intensifying water column stability, and prolonging periods of summer drought [22,31]. More broadly, interacting factors resulting from climate change are expected to create more extreme conditions, in turn promoting cyanobacterial dominance due to their competitively advantageous traits relative to eukaryotic algae [25,31,32].
Biotic factors also play an important, and in some ways more complex, role in bloom formation, persistence, and decline. Cyanobacteria are often resistant to grazing by herbivores due to the production of mucilage or tough exterior sheaths, development of large colonies, and production of toxic secondary metabolites [33,34,35], though feeding studies show species-specific differences in consumption rates and selectivity by grazers. For instance, some studies found zooplankton to preferentially consume certain strains of cyanobacteria over others, especially where large daphnid cladocerans were abundant [36,37,38]. However, the ability to consume cyanobacteria differs between daphnid species [39,40], with some species avoiding or rejecting cyanobacteria altogether [41,42,43]. Similarly, copepod grazers may influence cyanobacteria blooms through their feeding preferences [44,45,46,47], the effects of which may vary throughout a bloom cycle and either enhance or suppress cyanobacterial population growth [48,49].
Zooplankton communities of temperate, eutrophic lakes generally transition from dominance by large daphnids to smaller cladocerans and omnivorous copepods over the spring and summer [37,50], and grazing effects further vary from lake to lake and with season [48]; therefore, the influence of grazing on bloom control may be difficult to predict. However, current evidence suggests that the effect of zooplankton grazers on cyanobacterial blooms is dynamic and significant, and likely to change with continued coexistence in eutrophic, cyanobacteria-dominated systems [35].
Research into the cause of cyanobacterial blooms has often been focused on a single factor, e.g., nitrogen or phosphorus concentration, a particular species of grazer, or a narrow set of environmental conditions. But increasing evidence highlights the importance of the interactive effects of multiple factors acting simultaneously, and often synergistically, to dictate the timing and magnitude of harmful blooms [31,51]. The challenge moving forward is to tease apart and quantify these independent factors and how they are interacting together to influence bloom dynamics, and to place experimental studies in the context of system-scale field observations.
Here, we synthesize the results of an eight-year field and experimental program that investigated how multiple biological and environmental factors drive cyanobacteria blooms in Vancouver Lake, a large, shallow, eutrophic lake located in the city of Vancouver, Washington, USA, directly adjacent to the Columbia River and the city of Portland, Oregon, USA (Figure 1). Our investigations included high-frequency water quality and plankton sampling, as well as repeated, detailed experiments to measure the grazing rates and diet selectivity of the major micro- and mesozooplankton consumers of cyanobacteria and algae. Our goal in this paper is to synthesize both published and new results from our long-term studies in context with current research on freshwater cyanobacterial blooms. In particular, we present Vancouver Lake as a model for understanding the interactions of both abiotic and biotic processes on cyanobacteria bloom dynamics in large shallow temperate lakes.

2. Materials and Methods
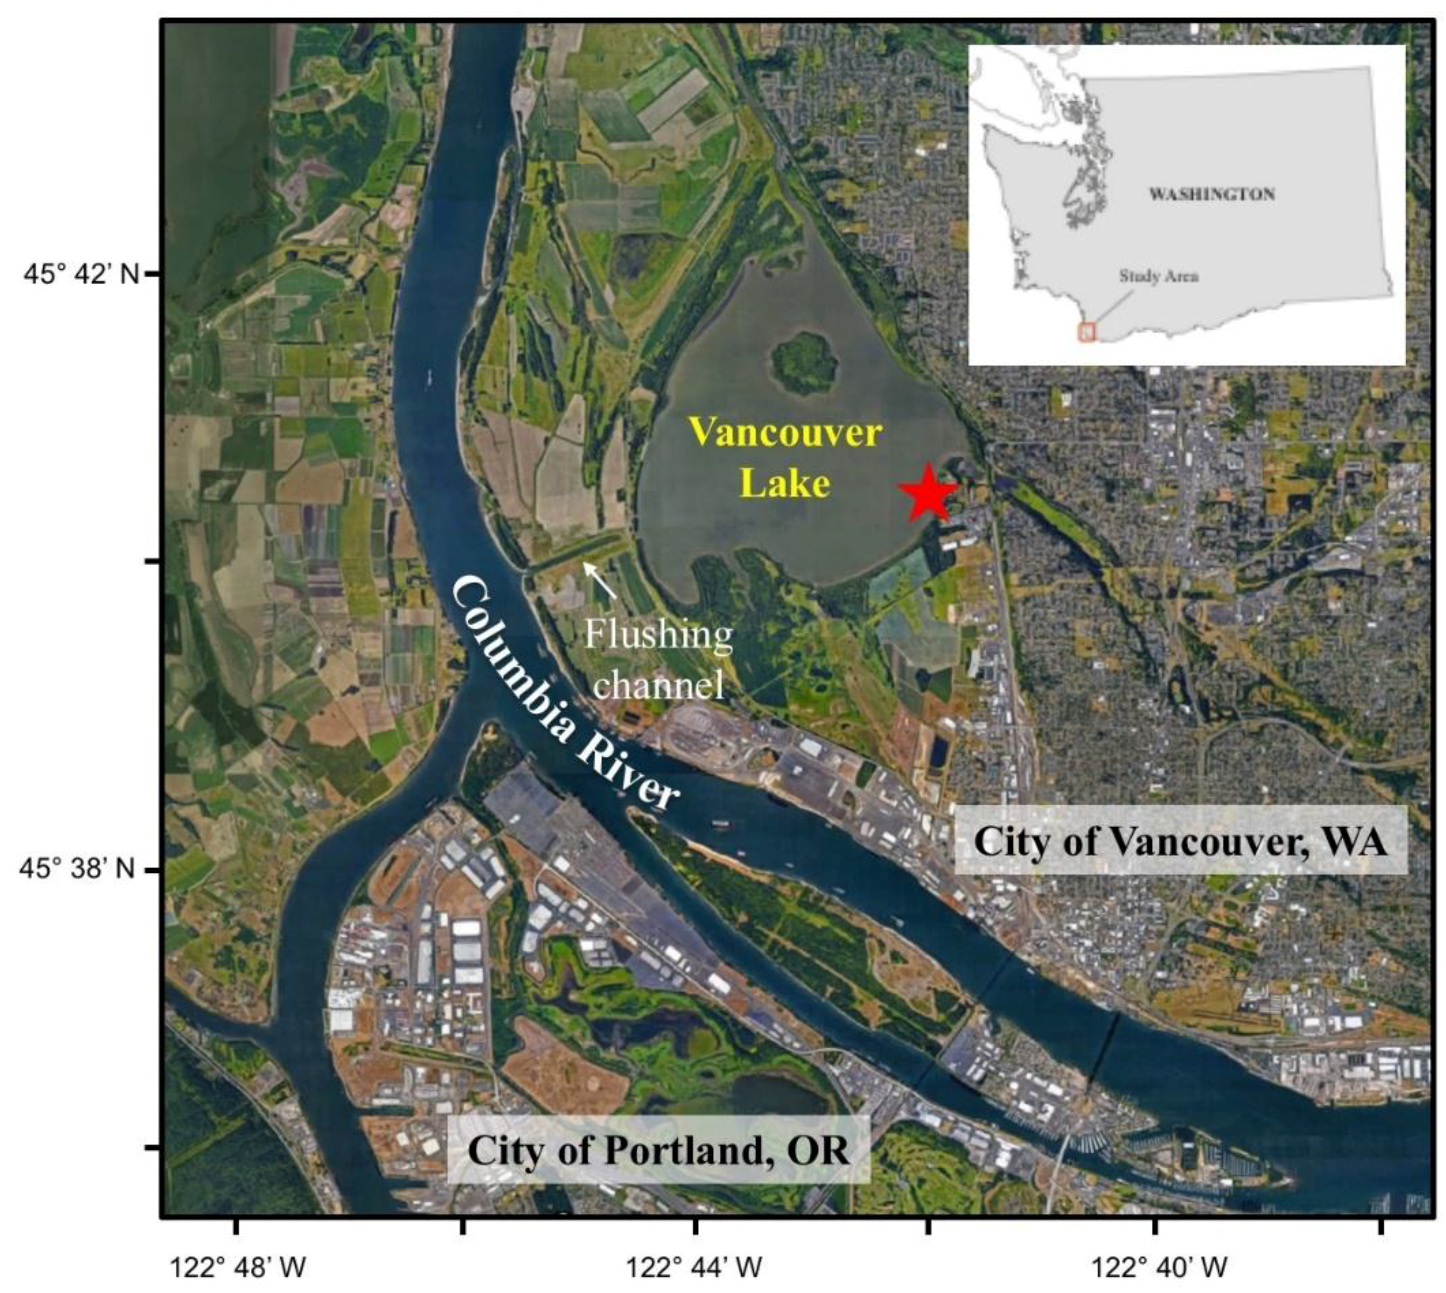
2.1. Study Area

2.1.1. Geography of Vancouver Lake

Vancouver Lake is a large (~9.3 km2), shallow (mean depth ~1.2 m) floodplain lake that is a popular destination for swimming, bird watching, boating, and fishing in the state of Washington, USA (Figure 1). Vancouver Lake is also an important habitat for a range of fish species, as well as migrating and resident waterfowl, raptors, and songbirds. Vancouver Lake is the largest of the Columbia River floodplain lakes, and it is also the largest lake in the Vancouver, WA-Portland, OR metropolitan area of ~2 million people.
Historically, Vancouver Lake was a clear, moderately deep (6–8 m) lake that was flushed during the spring and fall freshets of the Columbia River [52]. Beginning in the early 20th century, hydroelectric dams were constructed upstream of Vancouver, and the Columbia River was diked to reclaim land for the Port of Vancouver along the south and west sides of Vancouver Lake. These modifications eliminated the natural semi-annual flushing of the lake, and rapid urbanization in the surrounding watershed over the next several decades increased sedimentation rates, such that by the 1980’s, Vancouver Lake had shallowed to an average depth of only 1 m [53]. In addition, nutrient loading, hypoxia, and cyanobacterial blooms increased in the lake, which led to poor water quality as early as the 1960’s [52].
In order to re-establish the flushing of Vancouver Lake, an artificial channel was constructed in 1983 between the lake and the Columbia River. The project included a large dredging operation to create the 1.2-km channel and to deepen and shape the lake bottom. In addition, the dredge spoils were used to form a small island near the middle of the lake [53] (Figure 1). Two 2-m diameter culverts equipped with one-way tide gates at one end of the flushing channel allow Columbia River water to flow into the lake when water levels in the river are higher than the lake, but not the reverse.
Currently, Vancouver Lake is hydrologically connected to the Columbia River by Lake River to the north and by the flushing channel to the southwest. Lake River connects to the Columbia River approximately 23 km downstream of the lake. The flow in Lake River is bidirectional and changes direction nearly every day, determined by the Columbia River stage, which is controlled by the tides and hydropower operations upstream of the Portland-Vancouver area [54]. As a result, water levels in Vancouver Lake are deepest in winter months, when flows are highest in the Columbia River, and shallowest in summer, during low flow, with a 3- to 4-m difference in lake depth during each water year. Despite the additional inflow through the flushing channel, lake depth has remained stable at ~1 m and water quality is quite poor, with high levels of dissolved nitrogen and phosphorus, high turbidity, and high pH [54,55].
Most important from a management perspective, Vancouver Lake continues to experience intense summertime blooms of Dolichospermum (sensu Anabaena) and Aphanizomenon cyanobacteria, often necessitating closure of the lake to swimming and other recreational use [52,55,56]. In a particularly problematic period from 2004–2010, the Clark County Department of Public Health was forced to close the lake to all human contact on seven separate occasions, with closures lasting on average three to four weeks [56].

2.1.2. Lake Management Context

In 2004, increasing concern for the health of Vancouver Lake among local, state, and federal governmental agencies, private businesses, and citizen groups led to the formation of the Vancouver Lake Watershed Partnership (VLWP). The goals of the VLWP were to coordinate and fund efforts to investigate and understand the causes of the cyanobacterial blooms and to develop approaches to mitigate or possibly eliminate these harmful blooms [56]. Over the next 10 years, the VLWP funded several research studies to better understand and quantify the water balance, nutrient budget, and cyanobacterial bloom dynamics in the lake.
As part of the latter effort, our Aquatic Ecology Laboratory at Washington State University in Vancouver, WA, conducted an extensive field sampling program to measure water quality and plankton abundance and diversity in Vancouver Lake, as well as an experimental program to quantify the biotic and abiotic factors that influence the timing, magnitude, and duration of the annual cyanobacteria blooms.

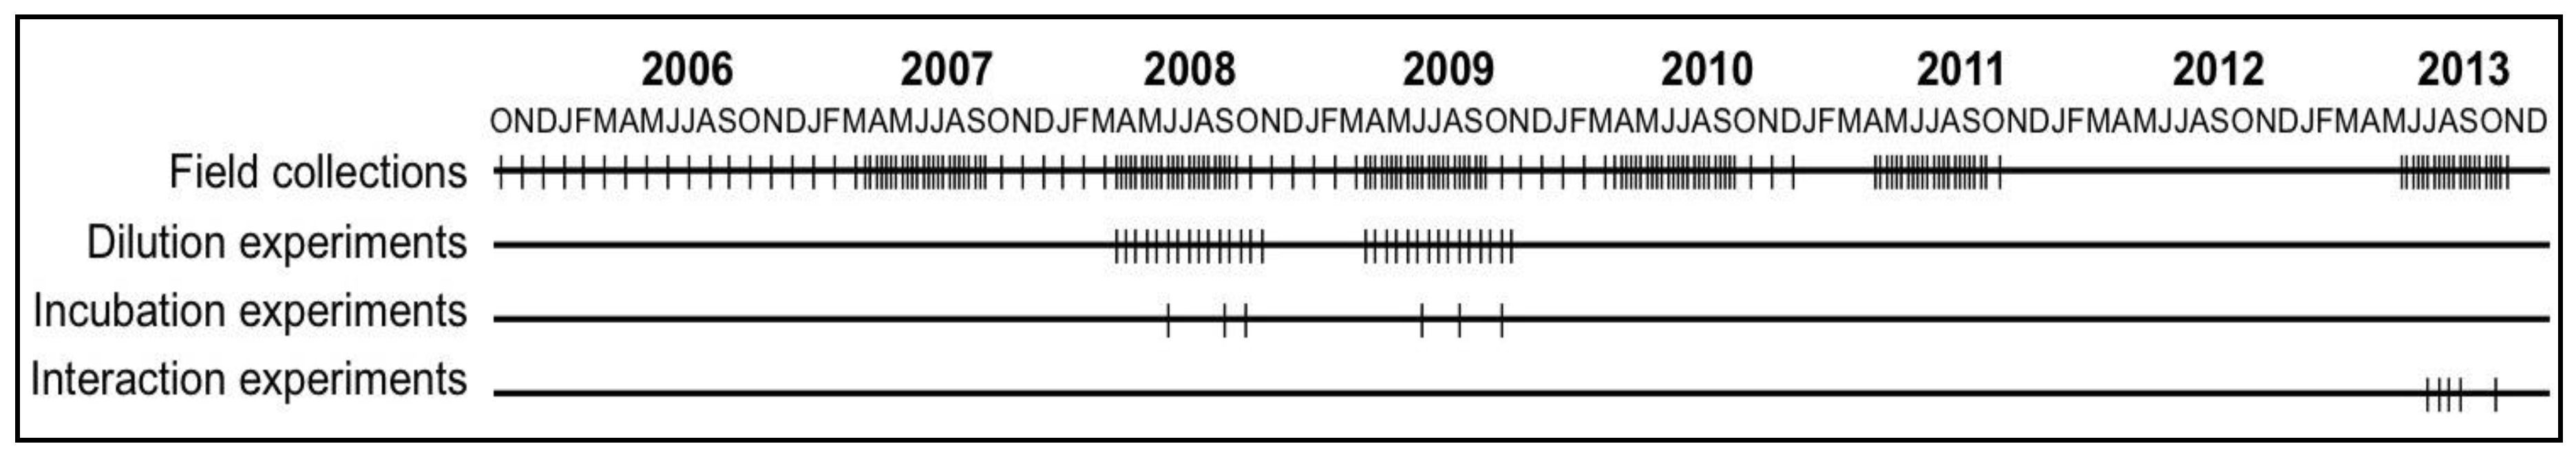
2.2. Field and Experimental Programs to Study Cyanobacterial Bloom Dynamics in Vancouver Lake

Our overall research program in Vancouver Lake extended from October 2005 to October 2013. Over this time period, we conducted a nearly continuous field sampling effort to monitor and assess water quality and plankton community abundance and composition. In addition, we led three sets of experimental investigations of zooplankton grazing and phytoplankton growth rates over complete cyanobacterial bloom cycles in 2008, 2009, and 2013 (Figure 2).

2.3. Field Sampling

We collected all samples from a dock located on the southeastern shore of Vancouver Lake (Figure 1). The depth at this location is representative of the mean lake depth [54], and the results of a targeted study of spatial variability of plankton abundance and composition in Vancouver Lake that we conducted in 2007 showed no significant spatial differences in plankton community composition (Kendall’s tau; n = 10 taxa per site; p > 0.05) (Bollens and Rollwagen-Bollens, unpublished data). Based on these results, we deemed that samples collected from the dock were representative of the lake as a whole.
Our long-term (eight-year) field sampling was conducted at least monthly and, when resources allowed, more frequently during suspected bloom periods. Specifically, from October 2005 through February 2007, we collected lake water and plankton samples monthly. Between March 2007 and September 2010, we collected lake water and plankton samples monthly (October through March) and weekly (April through September). Additionally, in both 2011 and 2013, we once again collected lake water and plankton samples weekly from May to October (Figure 2).

2.3.1. Water quality

At every sampling time from October 2005 to October 2013, we used a YSI 91 or 6920 multimeter probe to measure temperature and dissolved oxygen (DO) concentrations from the surface to the bottom, at 0.3-m intervals. We also measured lake depth and Secchi depth at the dock sampling site. In addition, we collected triplicate surface water samples for chl a analysis with a clean bucket, which were transported back to the laboratory in dark bottles on ice. There, we filtered a 15–25 mL aliquot of lake water from each replicate sample onto GF/F filters and kept them frozen at −20 °C until analysis using a Turner Model 10 AU fluorometer [57].
From February 2007 through October 2010, and May through October 2013, we subsampled an additional 50-mL of surface water from each replicate bucket sample for the analysis of nitrite (NO2-N), nitrate (NO3-N), ammonium (NH4-N), orthophosphate (PO4-P), and silicate (SiO4-Si). Subsamples were filtered through a 0.45-μm Millipore filter into acid-washed plastic bottles and kept on ice until returned to the laboratory. We froze the samples and sent them to the Marine Chemistry Lab at the University of Washington’s School of Oceanography for analysis following the protocols of the WOCE Hydrographic Program using a Technicon AAII system, or Seal Analytical AA3 autoanalyzer.

2.3.2. Plankton Community Composition

We sampled the lake for microplankton (unicellular eukaryotic plankton and cyanobacteria <20 µm in size) abundance and taxonomic composition via triplicate collections of surface water using a clean bucket, and then preserved 200-mL subsamples in 5% acid Lugol’s solution. We further sampled the lake from our dock station for mesozooplankton (metazoan plankton >73 µm in size, e.g., copepods, cladocerans, rotifers) by towing a 0.5-m diameter, 73-µm mesh zooplankton net vertically from just above the bottom to the surface, in triplicate. We concentrated the net contents and preserved each tow sample in 5–10% buffered formalin.
In the laboratory, we settled 1–10 mL aliquots of the Lugol’s preserved samples overnight in Utermöhl chambers, and examined the chambers using an Olympus CK-40 inverted microscope at 200–400×. We identified to genus and sized all microplankton individuals, calculated their biovolume based on geometric shape [58], and determined their carbon biomass according to Menden-Deuer and Lessard [59]. We also enumerated and identified all mesozooplankton individuals by examining 5–25 mL aliquots of the formalin-preserved samples with a Leica MZ-6 stereomicroscope. Individuals were identified to the lowest possible taxon and life history stage using Thorp and Covich [60].

2.4. Statistical Analyses of Field Data

A more detailed explanation for each type of statistical analysis described here can be found in two previously published papers from this program in Vancouver Lake by Lee et al. ([61,62]).

2.4.1. Analysis of Plankton Community Composition

We used a series of statistical methods to determine significant groupings within the zooplankton and phytoplankton assemblages. [Note: we used an ecological nomenclature modified from Stroud et al. [63] to define community as “a group of interacting species populations occurring together in space” and assemblage as “a taxonomically related and comparably sized group of species populations that occur together in space.”] First, we performed cluster analysis to identify distinct groups within each assemblage using a relative Euclidean distance measure and Ward’s method for group linkage [64]. We then employed a multiple response permutation procedure (MRPP), using ranked Sorenson’s distance, to test whether the groups resulting from the cluster analysis were significantly different from one another [65,66]. Finally, we used indicator species analysis to determine which phytoplankton, or zooplankton, taxa were most strongly associated with each group resulting from the cluster analysis [67].

2.4.2. Analysis of Environmental Factors Associated with Plankton Community Structure

We used non-metric multidimensional scaling (NMDS) to detect the relationships between plankton assemblages and environmental variables [66]. Environmental variables included in the NMDS ordinations of the phytoplankton assemblage were water depth, Secchi depth, temperature, DO, NO2-N, NO3-N, NH4-N, PO4-P, SiO4-Si availability, seasonality, and DIN:DIP. Environmental variables included in the NMDS ordinations of the zooplankton assemblage were water depth, Secchi depth, temperature, DO, NO2-N, NO3-N, NH4-N, PO4-P, SiO4-Si availability, seasonality, cyanobacteria biomass, and chl a concentration. All cluster analyses, MRPP tests, indicator species analyses, and NMDS ordinations were performed using PC-ORD version 5.3 software.

2.5. Experimental Program

2.5.1. Microzooplankton Grazing (Dilution) Experiments

We conducted dilution experiments (following [68,69,70]) every two weeks from April to October/November in 2008 and 2009 to estimate grazing rates of the microzooplankton (here and throughout defined as heterotrophic protists <200 µm in size) and growth rates of the phytoplankton (here and throughout defined as autotrophic-mixotrophic protists and cyanobacteria) over the course of two entire cyanobacterial bloom cycles (see Boyer et al. [71] for a detailed description of the approach). In short, we set up 24-h incubations of multiple dilution ratios of ambient lake water with filtered surface lake water (1:0, 0.75:0.25, 0.5:0.5, 0.25:0.75, and 0.1:0.9), each amended with NO3 and PO4, in 1-L polycarbonate bottles. The bottles were placed on a plankton wheel revolving at 0.5–1 rpm under ambient light and temperature conditions. At the beginning and end of each incubation, every treatment bottle was subsampled and filtered for later determination of chl a concentration. In every other experiment (approximately once per month), we also preserved 200-mL subsamples from every incubation bottle in 5% Lugol’s solution for enumeration and identification of protists and cyanobacteria, as described above.
Phytoplankton growth and microzooplankton grazing rates were estimated according to Landry and Hassett [68]. For those experiments in which protists and cyanobacteria were enumerated and identified, we also estimated taxon-specific growth rates and microzooplankton grazing rates on specific prey categories and phytoplankton size classes.

2.5.2. Mesozooplankton Feeding (Incubation) Experiments

We conducted feeding experiments [72,73] with the cyclopoid copepod Acanthocyclops robustus. Copepods were incubated in unfiltered lake water before, during, and following cyanobacterial blooms that occurred in the August–September of both 2008 and 2009. [Note: in 2008–2009 we identified the dominant cyclopoid copepod species to be Diacyclops thomasi. However, in 2013, a more detailed taxonomic analysis in our laboratory revealed that these copepods were actually Acanthocyclops robustus.]
A detailed description of the experimental methods may be found in Rollwagen-Bollens et al. [46], and are summarized here. We conducted 12-h (overnight) incubations of copepods in 500-mL bottles filled with unfiltered surface water collected from Vancouver Lake. We collected the copepods from the lake using a 73-µm plankton net, and within 2 h of collection, gently sorted adult, female copepods into holding beakers containing filtered lake water. We next prepared quadruplicate incubation bottles as initial controls (containing lake water only, subsampled at the start of the incubation), final controls (containing lake water only, incubated overnight, and then subsampled), and feeding treatments (lake water plus copepods, incubated overnight, then subsampled). The bottles were incubated on a slowly rotating (0.5–1 rpm) plankton wheel at ambient lake temperatures for 12 h in the dark. All subsamples were preserved in 5% Lugol’s solution, and later analyzed microscopically to enumerate and identify the cyanobacteria and protist plankton as described above.
We calculated the clearance rates (mL copepod−1 h−1) and ingestion rates (µgC copepod−1 h−1) of copepods for each prey category according to Marin et al. [74]. We also assessed the copepods’ feeding selectivity by first comparing the clearance rates on different prey types within each experiment using one-way ANOVA [75]; and second by calculating an electivity index (E*; [76,77]) following the approach and equations described in Rollwagen-Bollens and Penry [72].

2.5.3. Experiments to Measure the Interaction of Nutrients and Copepod Grazing on Phytoplankton Growth

We conducted five grazing and nutrient addition incubation experiments in Vancouver Lake from July to October 2013, using the highly abundant cyclopoid copepod Acanthocyclops robustus as the grazer and PO4 as the added nutrient. Copepods and surface water were collected from Vancouver Lake as described above for incubation experiments (for complete details, see Rose et al. [49]).
In short, all experiments were conducted with the following treatments, each set up with four replicate bottles: ‘‘Copepod’’ treatments contained unfiltered lake water plus adult female A. robustus; ‘‘Nutrient’’ treatment bottles contained unfiltered lake water plus PO4; and ‘‘Copepod plus Nutrient’’ treatments contained unfiltered lake water plus both copepods and PO4. In addition, one set of four bottles containing only unfiltered lake water were prepared as initial controls and subsampled before the incubation, and a second set of four bottles containing unfiltered lake water were set up as final controls. All final control and treatment bottles were incubated at ambient lake temperatures for 12 h in the dark on a slowly rotating (0.5–1 rpm) plankton wheel. At the end of each incubation period, all final bottles were subsampled for measurement of chl a concentration.
Net phytoplankton growth rates (day−1) for all five experiments were determined based on changes in chl a concentration between the initial samples and the final control and treatments, assuming exponential growth. A two-way ANOVA [75] was used to test for significant differences in growth rates within each experiment, testing for the effect of ‘copepods’ and ‘nutrients,’ as well as the interaction of these two factors.

3. Results

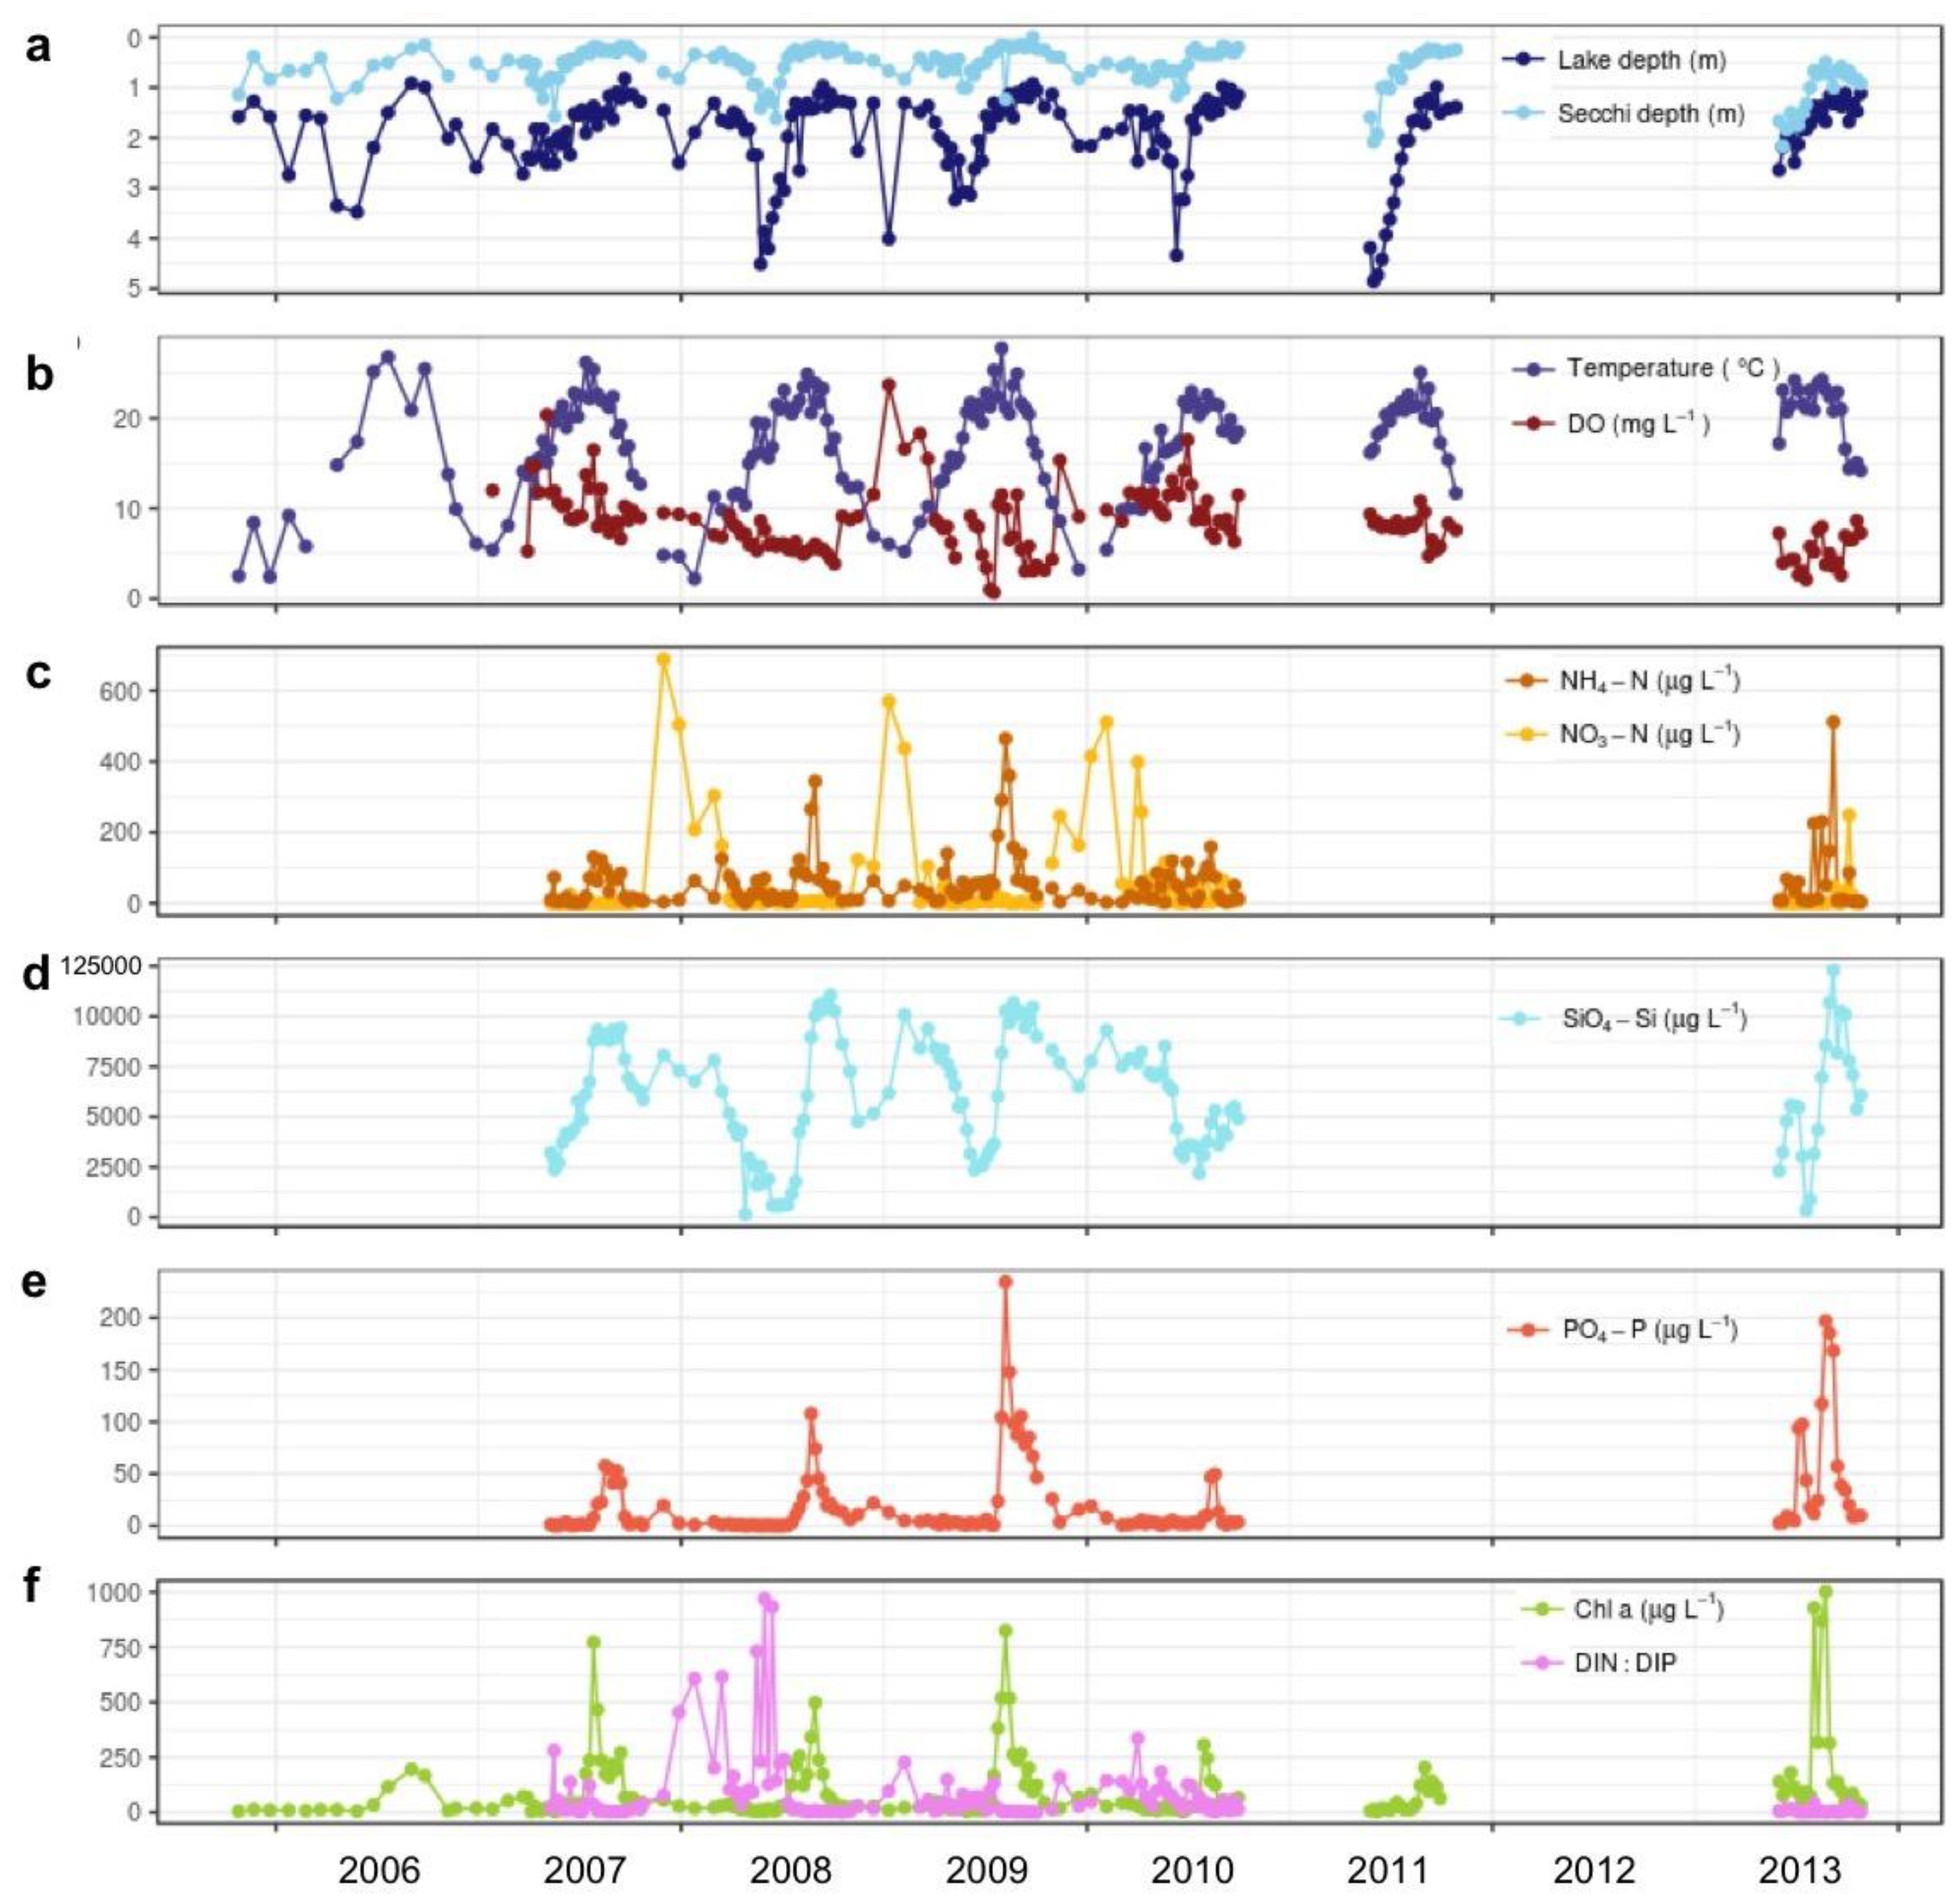
3.1. Temporal Variability of Environmental Conditions and Phytoplankton Blooms in Vancouver Lake, 2005–2013

3.1.1. Water Quality

Water quality conditions in Vancouver Lake varied seasonally and on an inter-annual basis over the course of our eight-year sampling program (Figure 3). Over the period from 2005 to 2013, total lake depth fluctuated seasonally, being deepest during spring high flow and shallowest during the late summer-early autumn low river flow periods. Secchi depth ranged from 0.2–2.0 m and followed a similar seasonal pattern as lake depth (Figure 3a). Surface temperatures also varied seasonally, with coolest temperatures in winter and warmest temperatures in summer over a range of 2.0–28 °C. Dissolved oxygen concentrations ranged from hypoxic conditions (<2.0 mg L−1) during the summer months to supersaturated conditions (>14 mg L−1) during the winter and spring months (Figure 3b).
Nutrient concentrations also showed strong seasonal patterns. NH4-N fluctuated throughout the year, but concentrations were greatest during the summer bloom periods. Conversely, NO3-N concentrations were minimal during summer and peaked during the winter months (Figure 3c). Similarly, SiO4-Si showed dramatic seasonal fluctuations, with minima occurring just prior to the late summer blooms, but then increasing rapidly to maxima during the blooms, with the largest change occurring over the summer of 2013 (Figure 3d). In addition, PO4-P concentration peaked at the onset of cyanobacterial blooms during every summer sampled (Figure 3e). On an inter-annual basis, the summer maxima of PO4-P and NH4-N concentrations were lowest in 2007 and increased each summer until both nutrients reached their highest peaks in 2009 and again in 2013 (Figure 3).
Over our study period, chl a concentrations ranged from 4.1–1000 μg L−1 with substantial peaks during the summer, concurrent with the onset of cyanobacterial blooms. The highest chl a values were observed in the summers of 2007, 2009, and 2013, concurrent with minima in the ratio of dissolved inorganic N (DIN) to dissolved inorganic P (DIP) (Figure 3f).

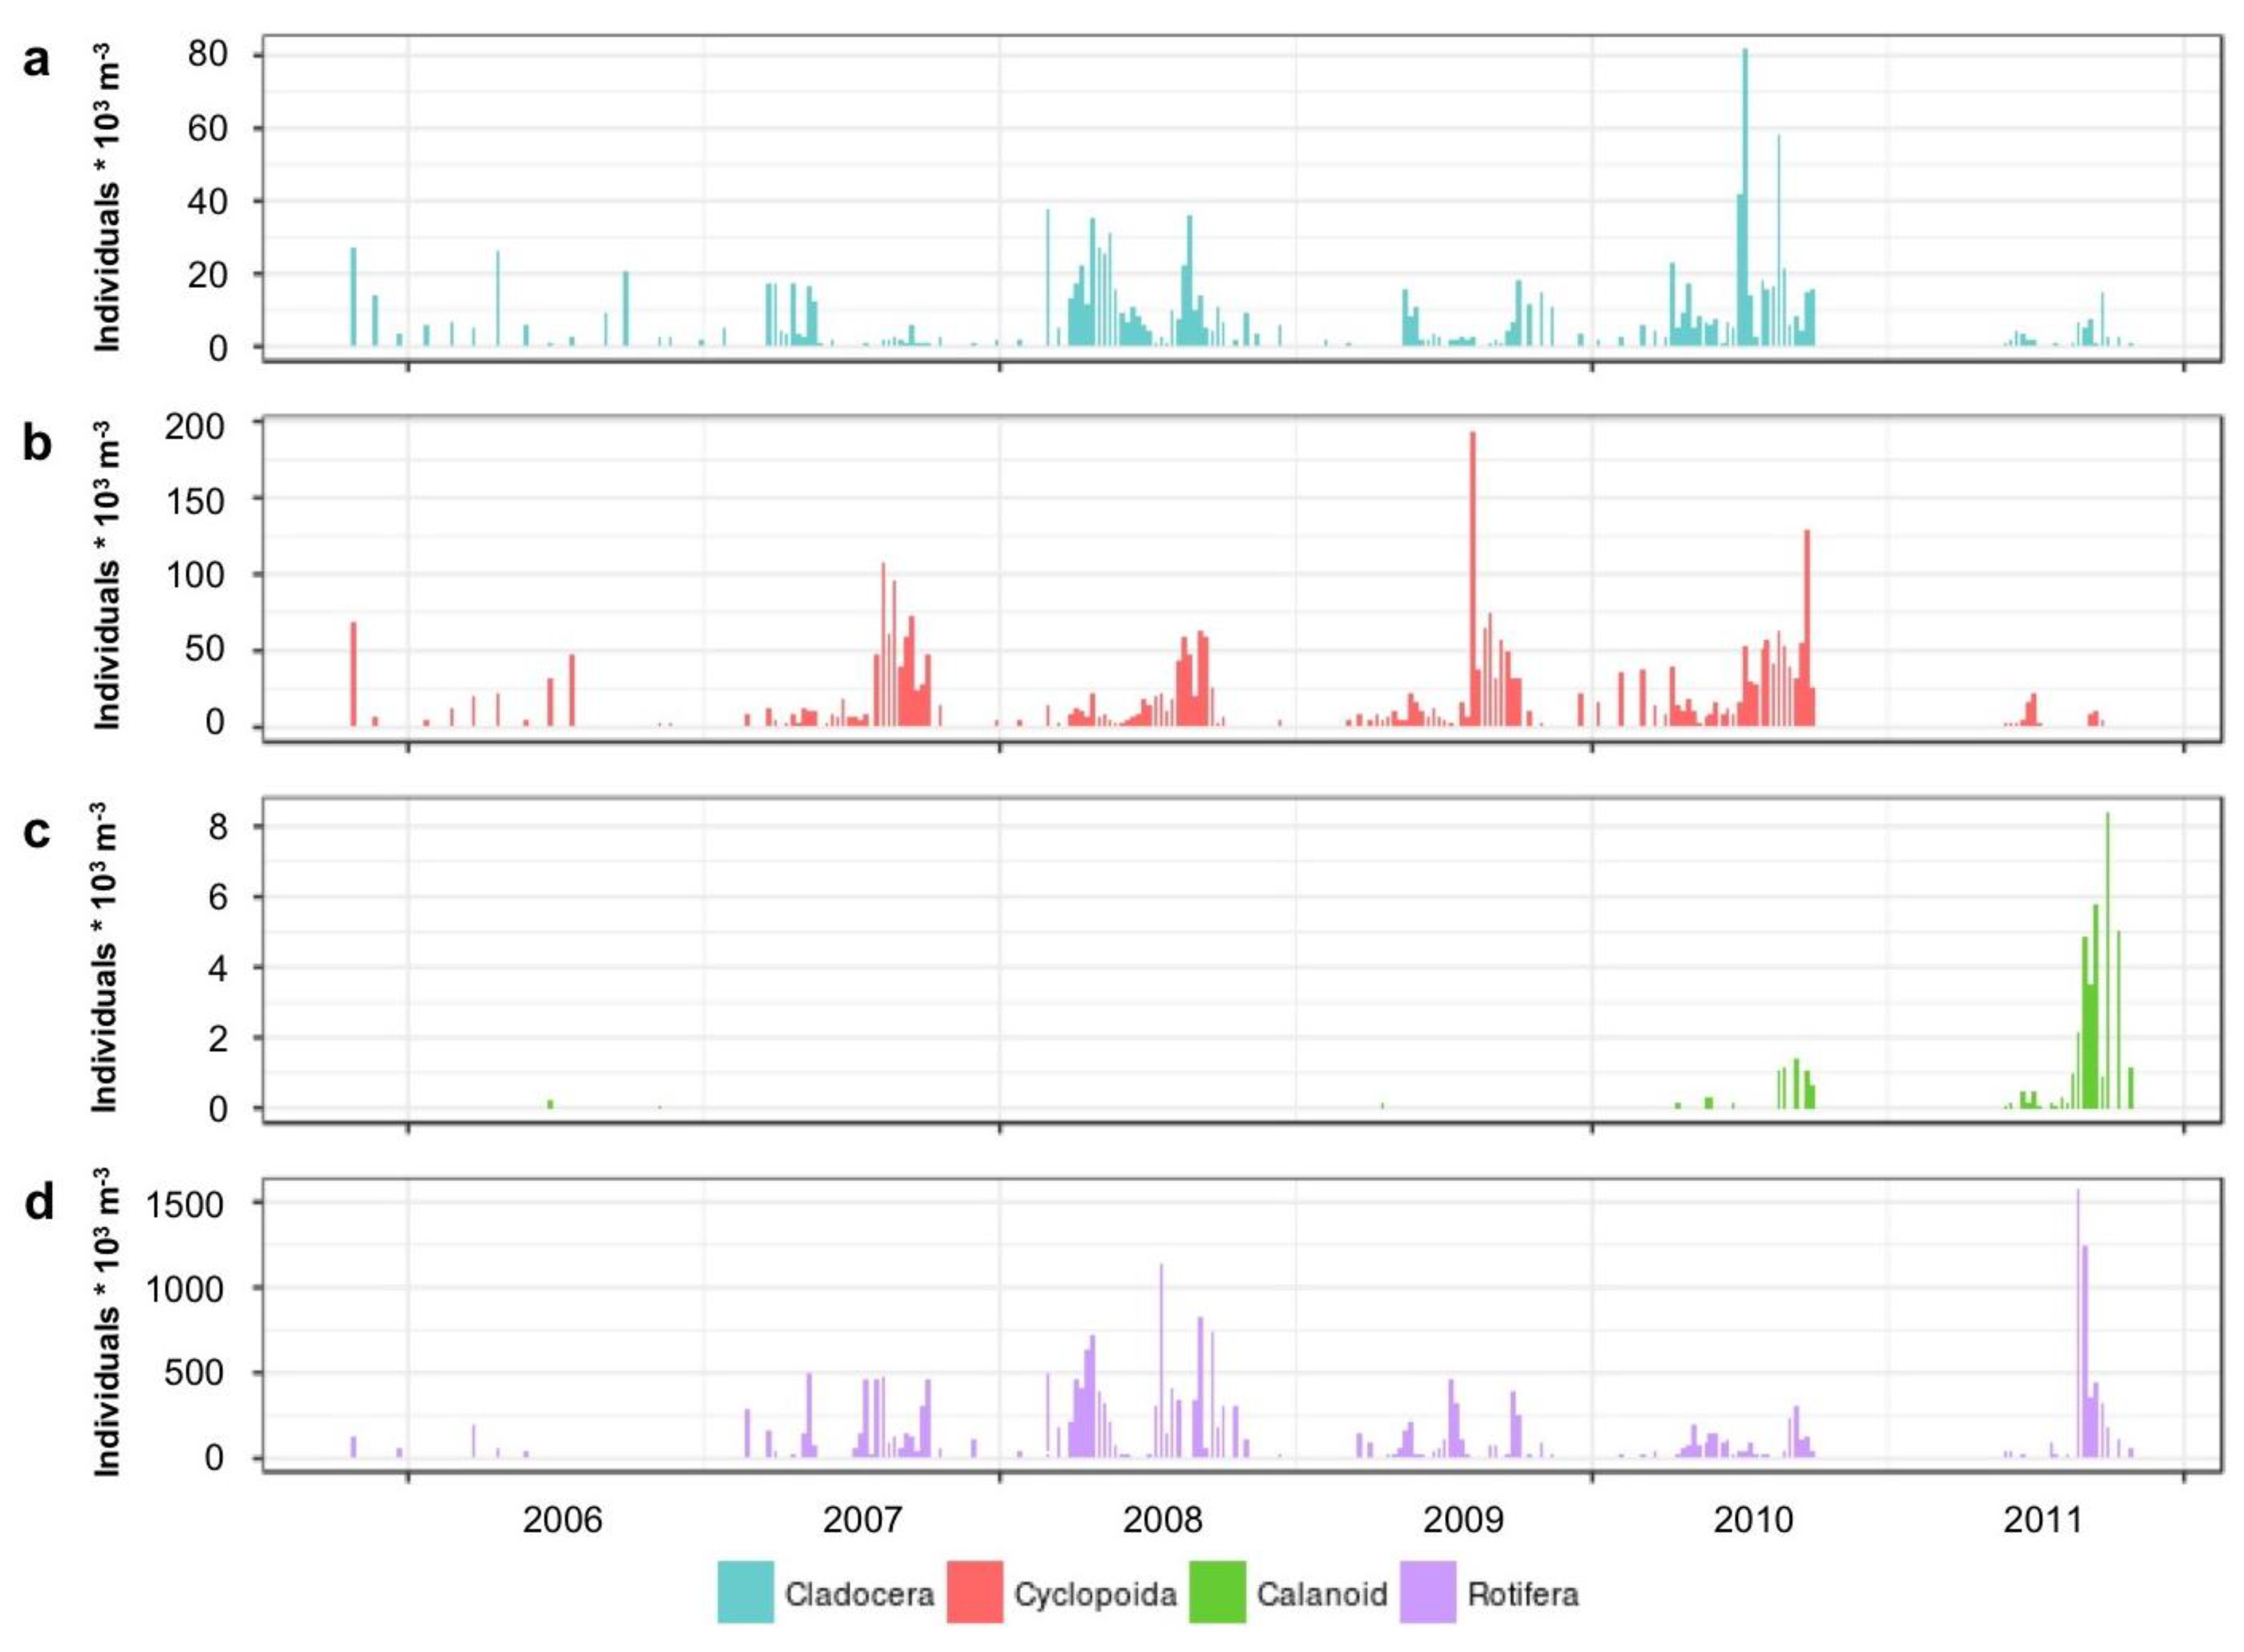
3.1.2. Microplankton and Mesozooplankton Abundance, Biomass, and Composition

We conducted high frequency sampling and taxonomic determination of the microplankton in Vancouver Lake over a four-year period from January 2007 to December 2010. With regard to the phytoplankton, a clear seasonal pattern was observed, with phytoplankton carbon biomass peaking in the late summer of each year. In 2008 and 2009, the summertime increases in phytoplankton biomass were especially extreme, reaching up to 20× the levels observed in the spring and early summer of each year (Figure 4a). The phytoplankton blooms in 2008 and 2009 (and to some extent 2007) were dominated by cyanobacteria biomass; however, the bloom in 2010 was mainly the result of the increased biomass of diatoms, except for a brief (two to three weeks) period in late summer when cyanobacteria dominated the assemblage (Figure 4b). The biomass of heterotrophic microplankton (ciliates and dinoflagellates) also increased during the summer of each year from 2007–2009; however, these taxa were more dominant in the early summer months prior to increased cyanobacteria biomass (Figure 4).
We also conducted a detailed microscopic analysis of the cyanobacterial taxa present in Vancouver Lake from January 2007 to December 2010. Over this period, two substantial cyanobacterial blooms in the late summer of 2008 and 2009 were evident, while the 2007 and 2010 summertime blooms of cyanobacteria were more muted (Figure 5a). Blooms in 2007, 2008, and 2009 were primarily dominated by filamentous Aphanizomenon sp.; however, in 2009, the cyanobacteria bloom was initially dominated by Dolichospermum flos-aquae (sensu Anabaena flos-aquae) (Figure 5b). During 2010, the summer bloom was brief, with low phytoplankton biomass overall, consisting mostly of diatoms and some Aphanizomenon sp. (Figure 4; Figure 5).
In addition to sampling the microplankton in Vancouver Lake, we also measured the abundance and taxonomic composition of the mesozooplankton from January 2005 through December 2011. Mesozooplankton abundance typically reached a maximum twice per year—during late spring (May) and during late summer (August/September) (Figure 6). Cladocerans, particularly Daphnia retrocurva, dominated the late spring peak each year (Figure 6a). However, cyclopoid copepods were the most abundant crustacean taxon in Vancouver Lake overall, consisting nearly exclusively of Acanthocyclops robustus, and these copepods dominated the late summer period each year from 2005 to 2010 (Figure 6b). Calanoid copepods were also observed throughout the sampling period, but in very low abundances, mainly consisting of two genera (Leptodiaptomus sp. and Skistodiaptomus sp.). However, in 2011, the invasive copepod Pseudodiaptomus forbesi became highly abundant in Vancouver Lake, much as it has in the Columbia River [78,79,80,81], and dominated the mesozooplankton assemblage in the late summer of that year (Figure 6c). Finally, the rotifers Polyarthra sp., Asplanchna sp., and Brachionus sp. were present each year; Keratella sp. was present each year from 2007 through 2011 (when this taxon dominated the zooplankton abundance during early summer), but not in 2005 or 2006; and Kellicottia sp. was present only in 2010 (Figure 6d).

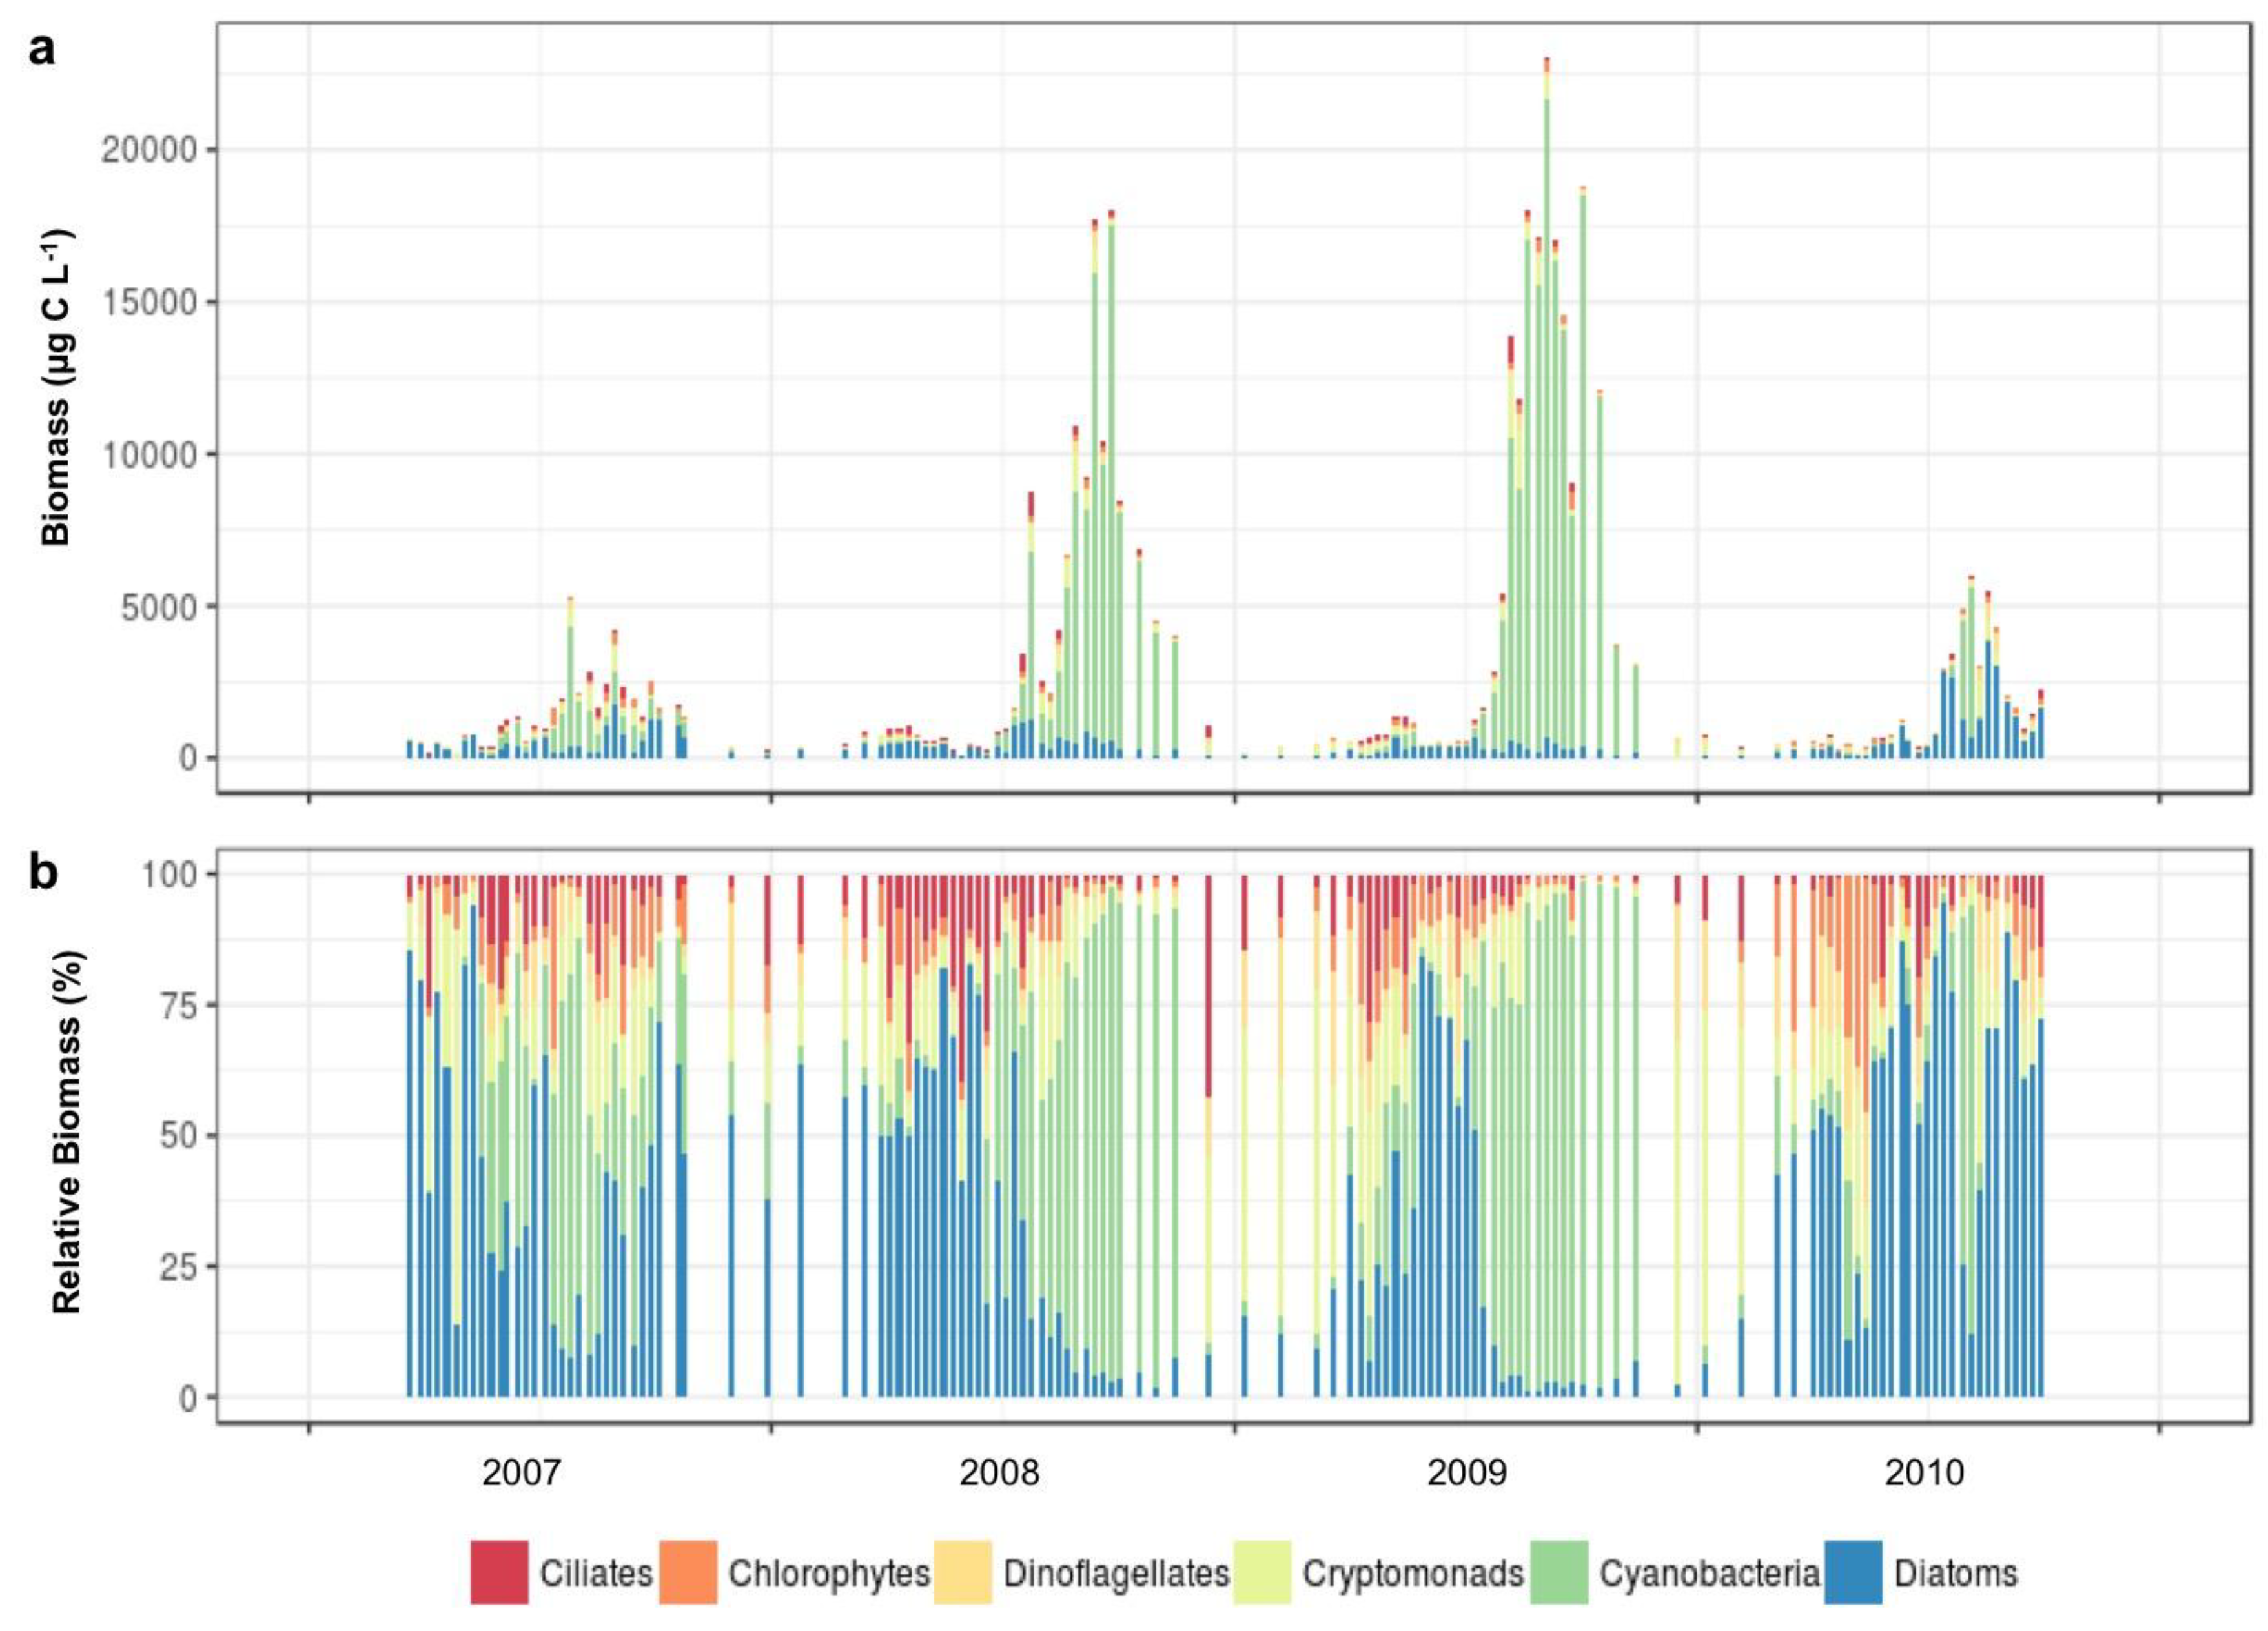
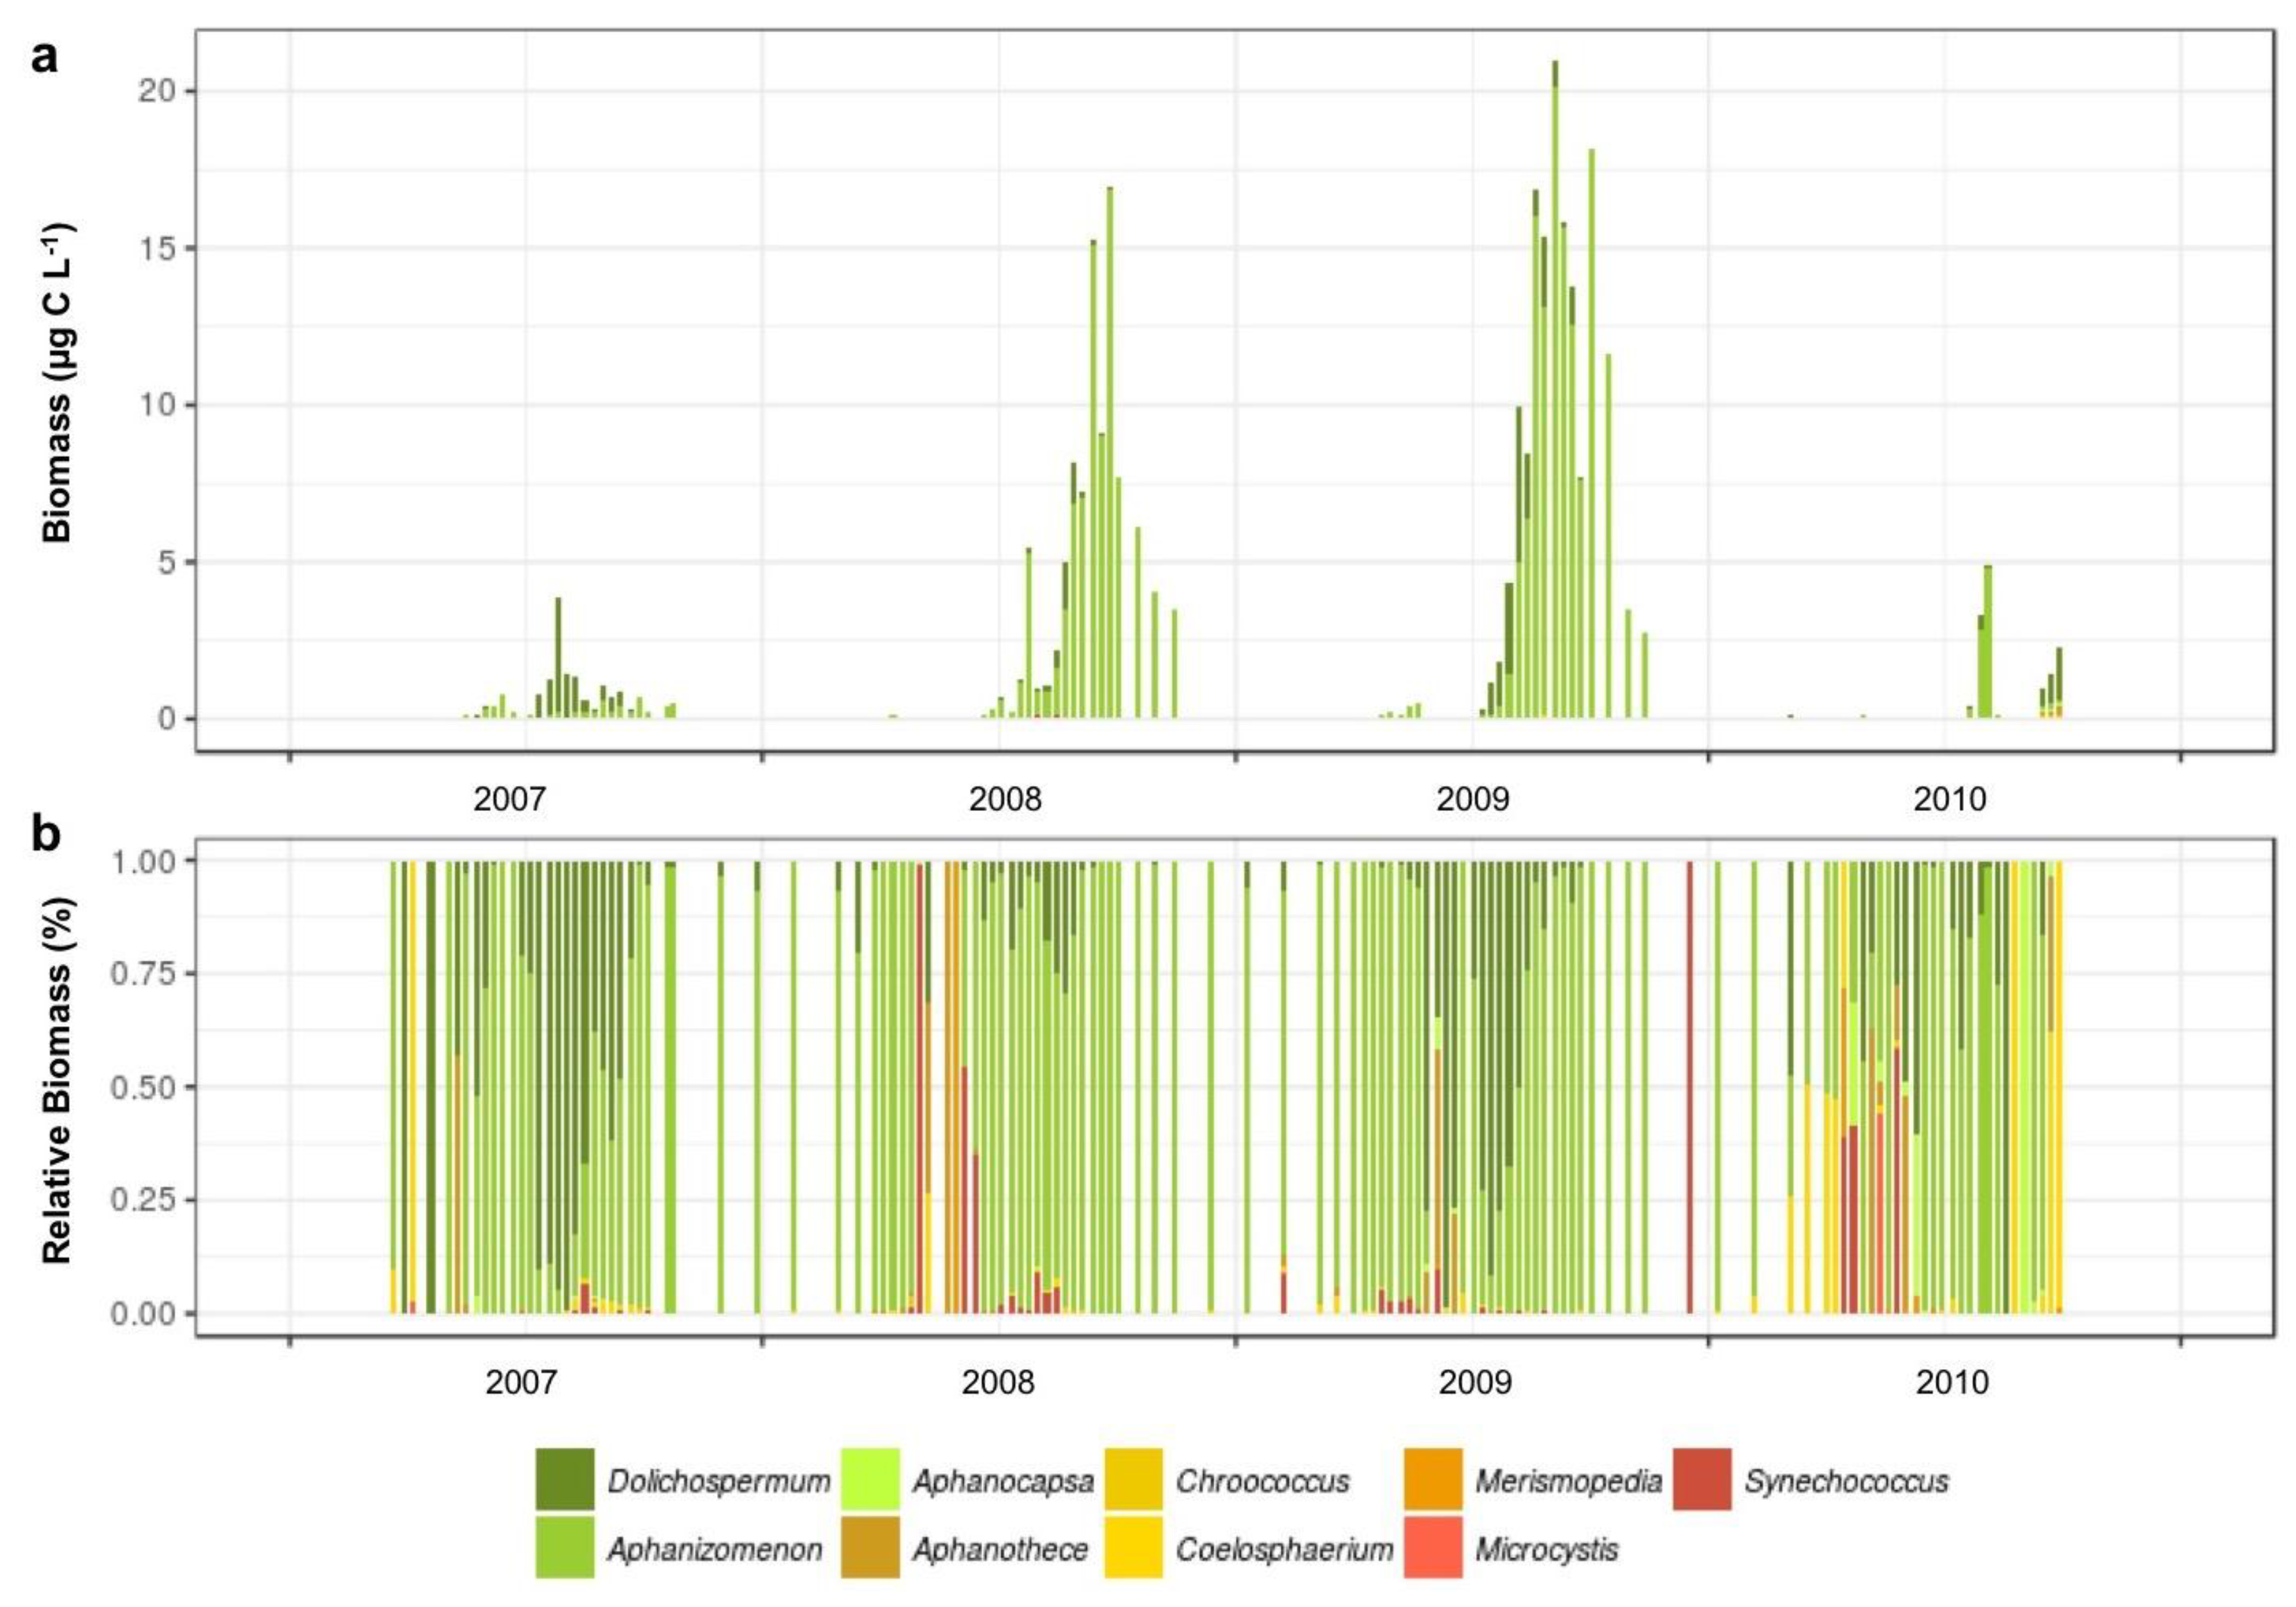
3.1.3. Interannual Pattern of Cyanobacterial Blooms in Vancouver Lake

We also observed notable variation in the abundance and composition of the planktonic community between warm, dry years (in particular 2007, 2009, and 2013) and the coolest and wettest year in our eight-year program (2010). With respect to the phytoplankton, during spring 2010, the assemblage included a much higher proportion of chlorophytes than in the previous three warm years, and the summer bloom was dominated by diatoms, with only a small increase in the biomass of Aphanizomenon spp. Moreover, the total biomass of the 2010 summer bloom was only ~1/3 that of 2009, when temperatures in the summer frequently exceeded 25 °C, well above those observed in summer 2010 (Figure 3 and Figure 4). Among the mesozooplankton, the abundance of cladocerans was higher and the abundance of rotifers lower during the wet summer of 2010, while during the warmest summer (2013), overall zooplankton abundance was substantially lower than previous years (Figure 6).

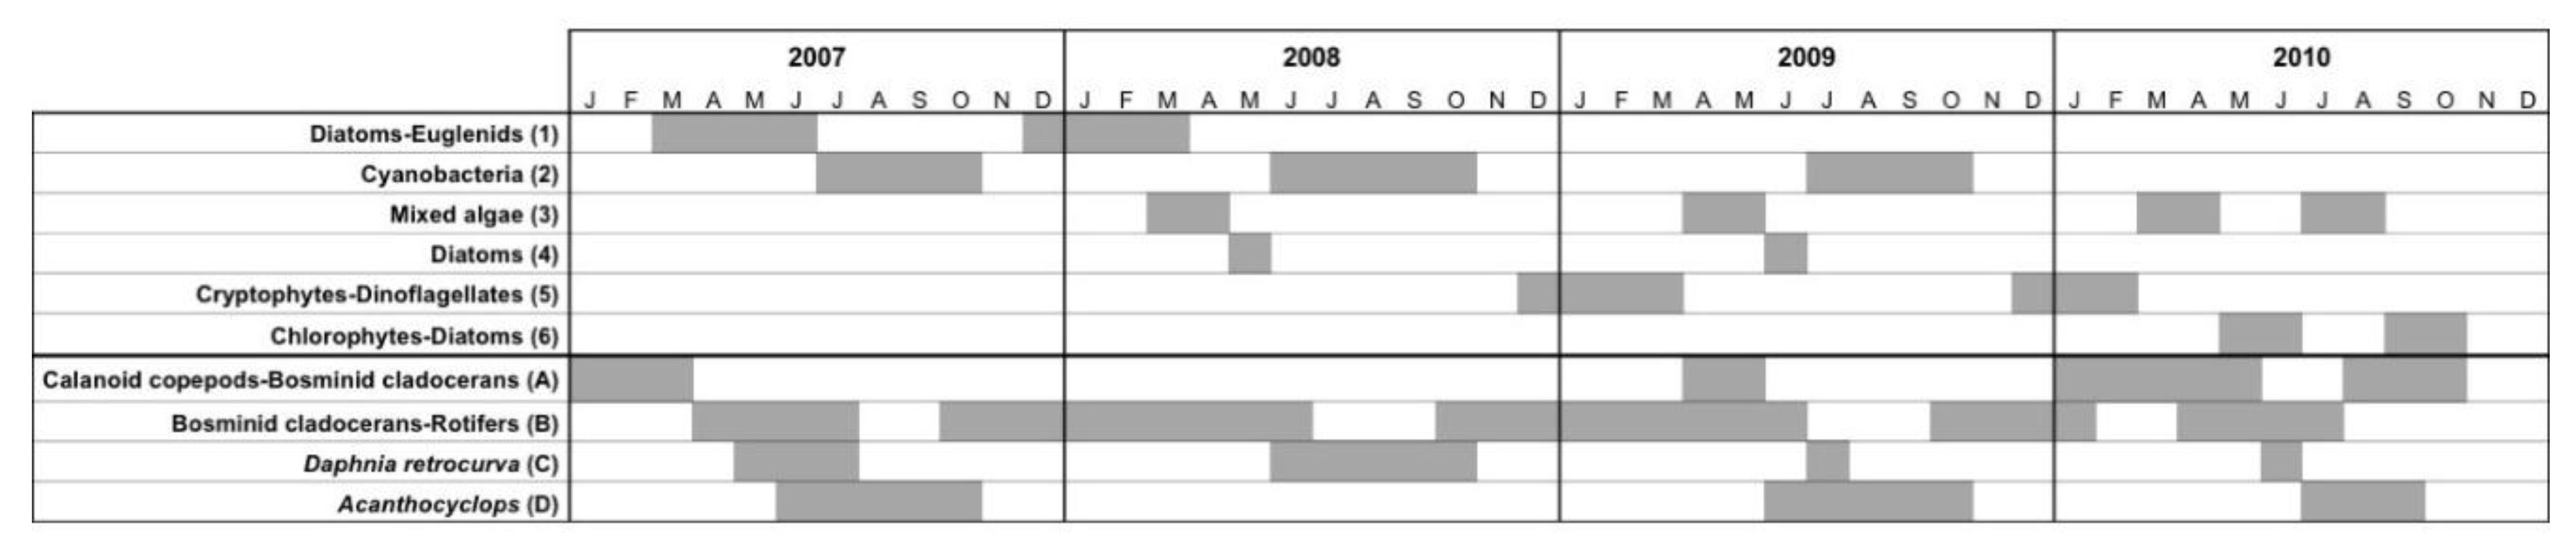
3.1.4. Seasonal Succession in the Phytoplankton and Zooplankton Assemblages of Vancouver Lake

Cluster analysis of phytoplankton assemblage biomass data and zooplankton assemblage abundance data, collected over the four-year period from February 2007 to October 2010, identified a range of significantly distinct clusters of taxa within each assemblage and a relatively consistent seasonal succession of these clusters, although with some notable inter-annual differences (Figure 7). Within the phytoplankton assemblage, six clusters were observed, each associated with a set of indicator species. For the first three years (2007–2009), the late winter-spring season was characterized by diatoms (mostly Cyclotella spp.) and euglenids (cluster 1) followed by a cyanobacteria-dominated assemblage (cluster 2) for the months of July–October. The exception was during spring 2010, when the phytoplankton assemblage was characterized by cryptophytes and dinoflagellates (cluster 6). In addition, the springtime assemblage of diatoms and the summertime cyanobacteria assemblage during 2008 and 2009 were separated by a period of chlorophytes (cluster 3) and Aulacoseira spp. diatoms (cluster 4) (Figure 7).
Within the mesozooplankton assemblage in Vancouver Lake, our analyses identified four clusters and associated indicator species. We also observed a relatively consistent pattern of seasonal succession among dominant mesozooplankton taxa from winter through autumn during most years of our program. Specifically, winter months were characterized by calanoid copepods and bosminid cladocerans (cluster A), followed by an early springtime assemblage of bosminid cladocerans and rotifers (particularly Kellicottia spp.; cluster B) and a late spring assemblage of daphnid cladocerans (especially Daphnia retrocurva; cluster C). The summer mesozooplankton assemblages were generally dominated by cyclopoid copepods (Acanthocyclops robustus; cluster D) (Figure 7).

3.2. Associations among Environmental Conditions, Community Composition and Cyanobacterial Blooms

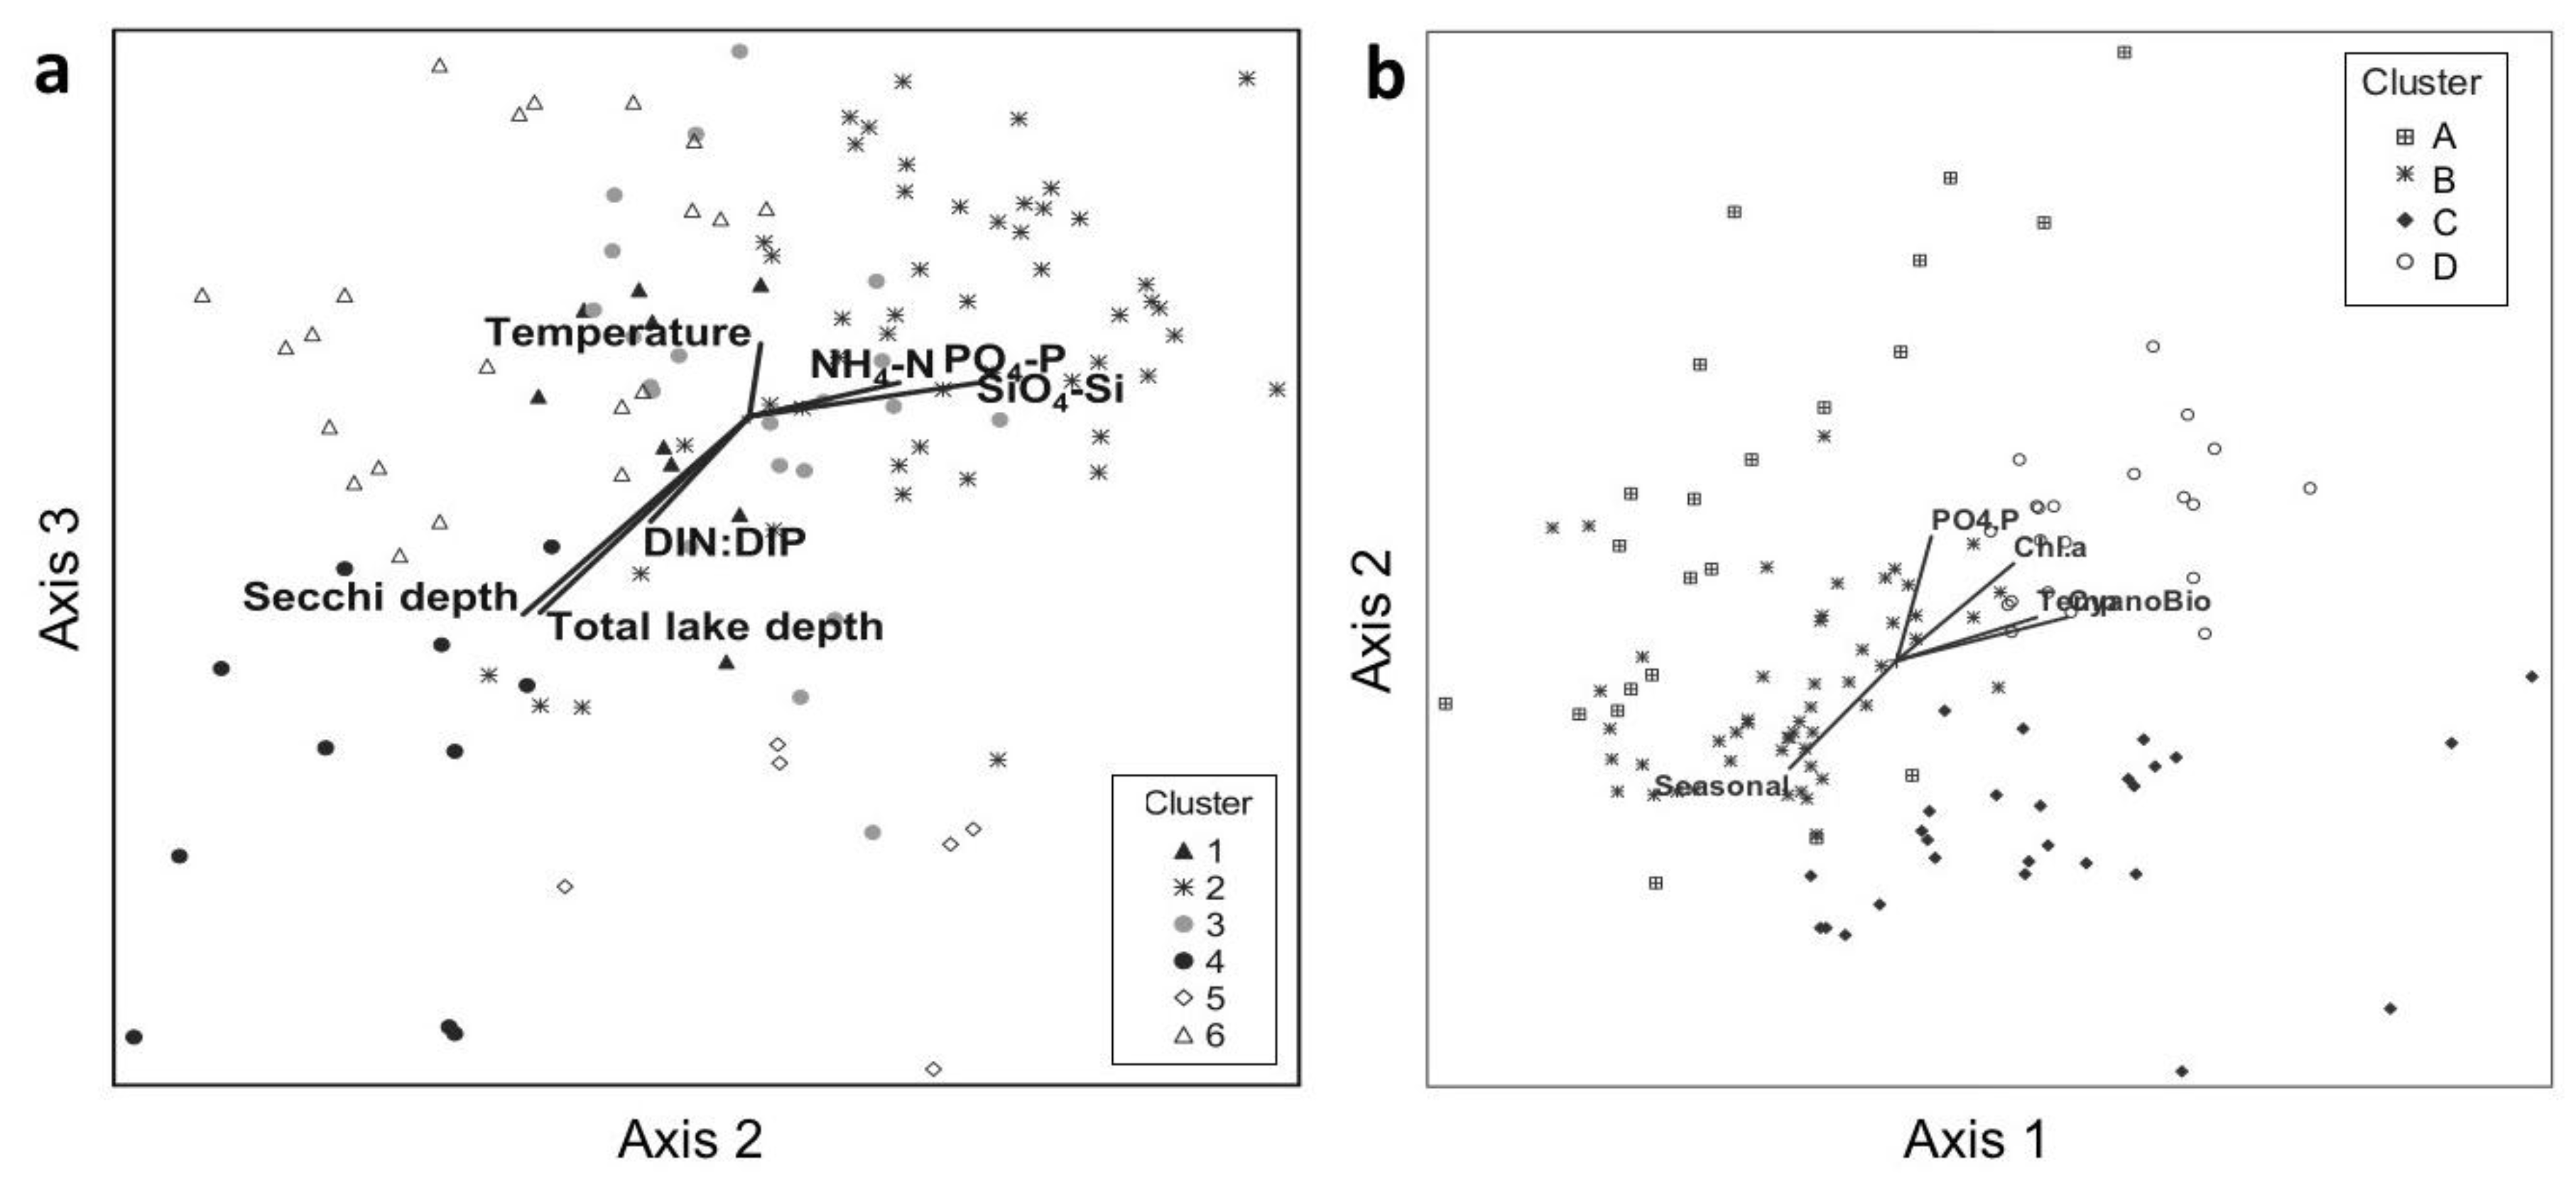
3.2.1. Associations with Abiotic Factors

We found the timing and biomass of the six phytoplankton assemblage clusters to be significantly related to several abiotic factors measured concurrent with the plankton sampling. Results from NMDS analyses of phytoplankton biomass from 2007 to 2010 (Figure 8a) showed that diatom biomass (clusters 4 and 6) was associated with increased total lake depth and Secchi depth, and high DIN:DIP ratios (>16:1). Cyanobacteria biomass (cluster 2) was negatively related to total lake depth, Secchi depth, and DIN:DIP during the late summer blooms in 2007–2009, and positively associated with increases in SiO4-Si, PO4-P, and NH4-N.
NMDS analyses performed on the mesozooplankton clusters also indicated significant relationships between the assemblage composition and environmental factors from 2007 to 2010 (Figure 8b). Calanoid copepods and bosminid cladocerans (clusters A and B) were strongly associated with season, while the summertime dominant Acanthocyclops robustus (cluster D) was significantly associated with elevated PO4-P and chl a concentrations, warm temperatures, and high cyanobacterial biomass.

3.2.2. Associations with Biotic Factors

Impact of microzooplankton grazing. Over the ~two-year period from February 2008–November 2009, intrinsic phytoplankton growth rates estimated from dilution experiments were generally low (~0.3 day−1 on average) in each late winter-early spring period, but increased to as high as 1.2 day−1 in the late spring (May-June) of both years (Figure 9). However, zero or negative phytoplankton growth rates were observed in early summer (June through mid-July) 2008, indicating that during those experiments, phytoplankton were actually decreasing in biomass over the course of the 24-h incubations. Intrinsic phytoplankton growth rates were relatively high during the late summer cyanobacteria blooms, but were highest (on average ~0.7 day−1) from the period just after the peak in chl a concentration through autumn, as the bloom declined (Figure 9).
Microzooplankton grazing rates estimated from the dilution experiments were low (−0.3 to 0.3 day−1) in spring 2008, and then became substantially negative (−0.5 to −1.5 day−1) in the six weeks preceding the initial chl a blooms during both 2008 and 2009 (Figure 9). Negative microzooplankton grazing rates indicate that net phytoplankton growth rates in each dilution treatment were lowest when the relative abundance of grazers was low (high dilution of lake water), and highest when the abundance of grazers was highest (low dilution). During experiments in the autumn of both 2008 and 2009, microzooplankton grazing rates quickly and dramatically increased after the chl a peak, more than doubling from late August to mid-September, and remained comparatively high (0.3 to 0.8 day−1) through the decline of the blooms in October and November (Figure 9).
Detailed analysis of taxon-specific grazing rates from the 2008 experiments indicated that microzooplankton were primarily consuming cyanobacteria in May, shifting to medium-sized (10–30 µm) diatoms in June, and then mainly consuming chlorophytes during the height of the bloom. As the 2008 cyanobacteria bloom declined, microzooplankton transitioned increasingly toward a mixed diet of diatoms, chlorophytes, cryptophytes, and cyanobacteria [71].
A more recent analysis of microzooplankton grazing rates on the daily standing stock of phytoplankton carbon biomass over the bloom periods in 2008 and 2009 showed that these small grazers were consuming as much as 60% of phytoplankton biomass per day during the spring. Furthermore, in the weeks following the peak of the late summer phytoplankton bloom, microzooplankton were consuming an average of ~70% of phytoplankton standing stock per day. However, during the height of the cyanobacterial blooms, even though microzooplankton abundance was generally low, they consumed 30–50% of phytoplankton biomass per day (Figure 10).
Impact of mesozooplankton feeding. Copepod feeding incubation experiments were conducted three times in Vancouver Lake during the summer-early autumn in 2008 and 2009, for a total of six experiments. Experiments were timed to capture the period prior to (June/July), during (August/September), and following (October) the cyanobacterial blooms each year. In the early summer of 2008 and 2009, A. robustus showed significantly higher clearance rates for ciliates <15 µm (2008) and diatoms > 15µm compared to all other prey available. However, following the blooms in both years, no significant differences in clearance rates between prey taxa were observed (Figure 11). We found similar results from our analyses of copepod feeding electivity calculated from the incubation experiments. Namely, A. robustus showed higher E* values for small ciliates prior to the 2008 and 2009 blooms, but there were no significant differences in electivity for particular prey types during and following the cyanobacterial blooms [46].
For each incubation experiment conducted in 2008 and 2009, we also estimated the potential grazing impact of adult female A. robustus by dividing their total ingestion rates on each prey category by the carbon biomass of each prey type present in Vancouver Lake before, during, and following each year’s bloom period. In July 2008, prior to the bloom, copepods were consuming ~25–80% of the standing prey biomass per day, with the highest grazing impact on ciliates and dinoflagellates. During the bloom in September, the copepod grazing impact was especially high upon diatoms (~100% of diatom biomass per day) and ~75–90% upon ciliates, dinoflagellates, and chlorophyte biomass per day. In October 2008, after the bloom had subsided, the copepod grazing impact was minimal across all prey categories (<15%) (Figure 12a).
The pattern of copepod grazing impact on particular prey types during the cyanobacterial bloom cycle in 2009 was similar to 2008; however, the overall magnitude of copepod ingestion rates and resulting impact on prey biomass was lower than in 2008. In June 2009, before the bloom, the copepod grazing impact was low to moderate (~15% prey biomass consumed), but once again targeted on non-algal or cyanobacterial prey categories. At the height of the 2009 cyanobacterial bloom in August, the copepod grazing impact was highest, and was approximately equally distributed across diatom, dinoflagellate, flagellate, and cyanobacterial biomass. In October 2009, the copepod grazing impact was once again low (<15% of biomass consumed per day) (Figure 12b).

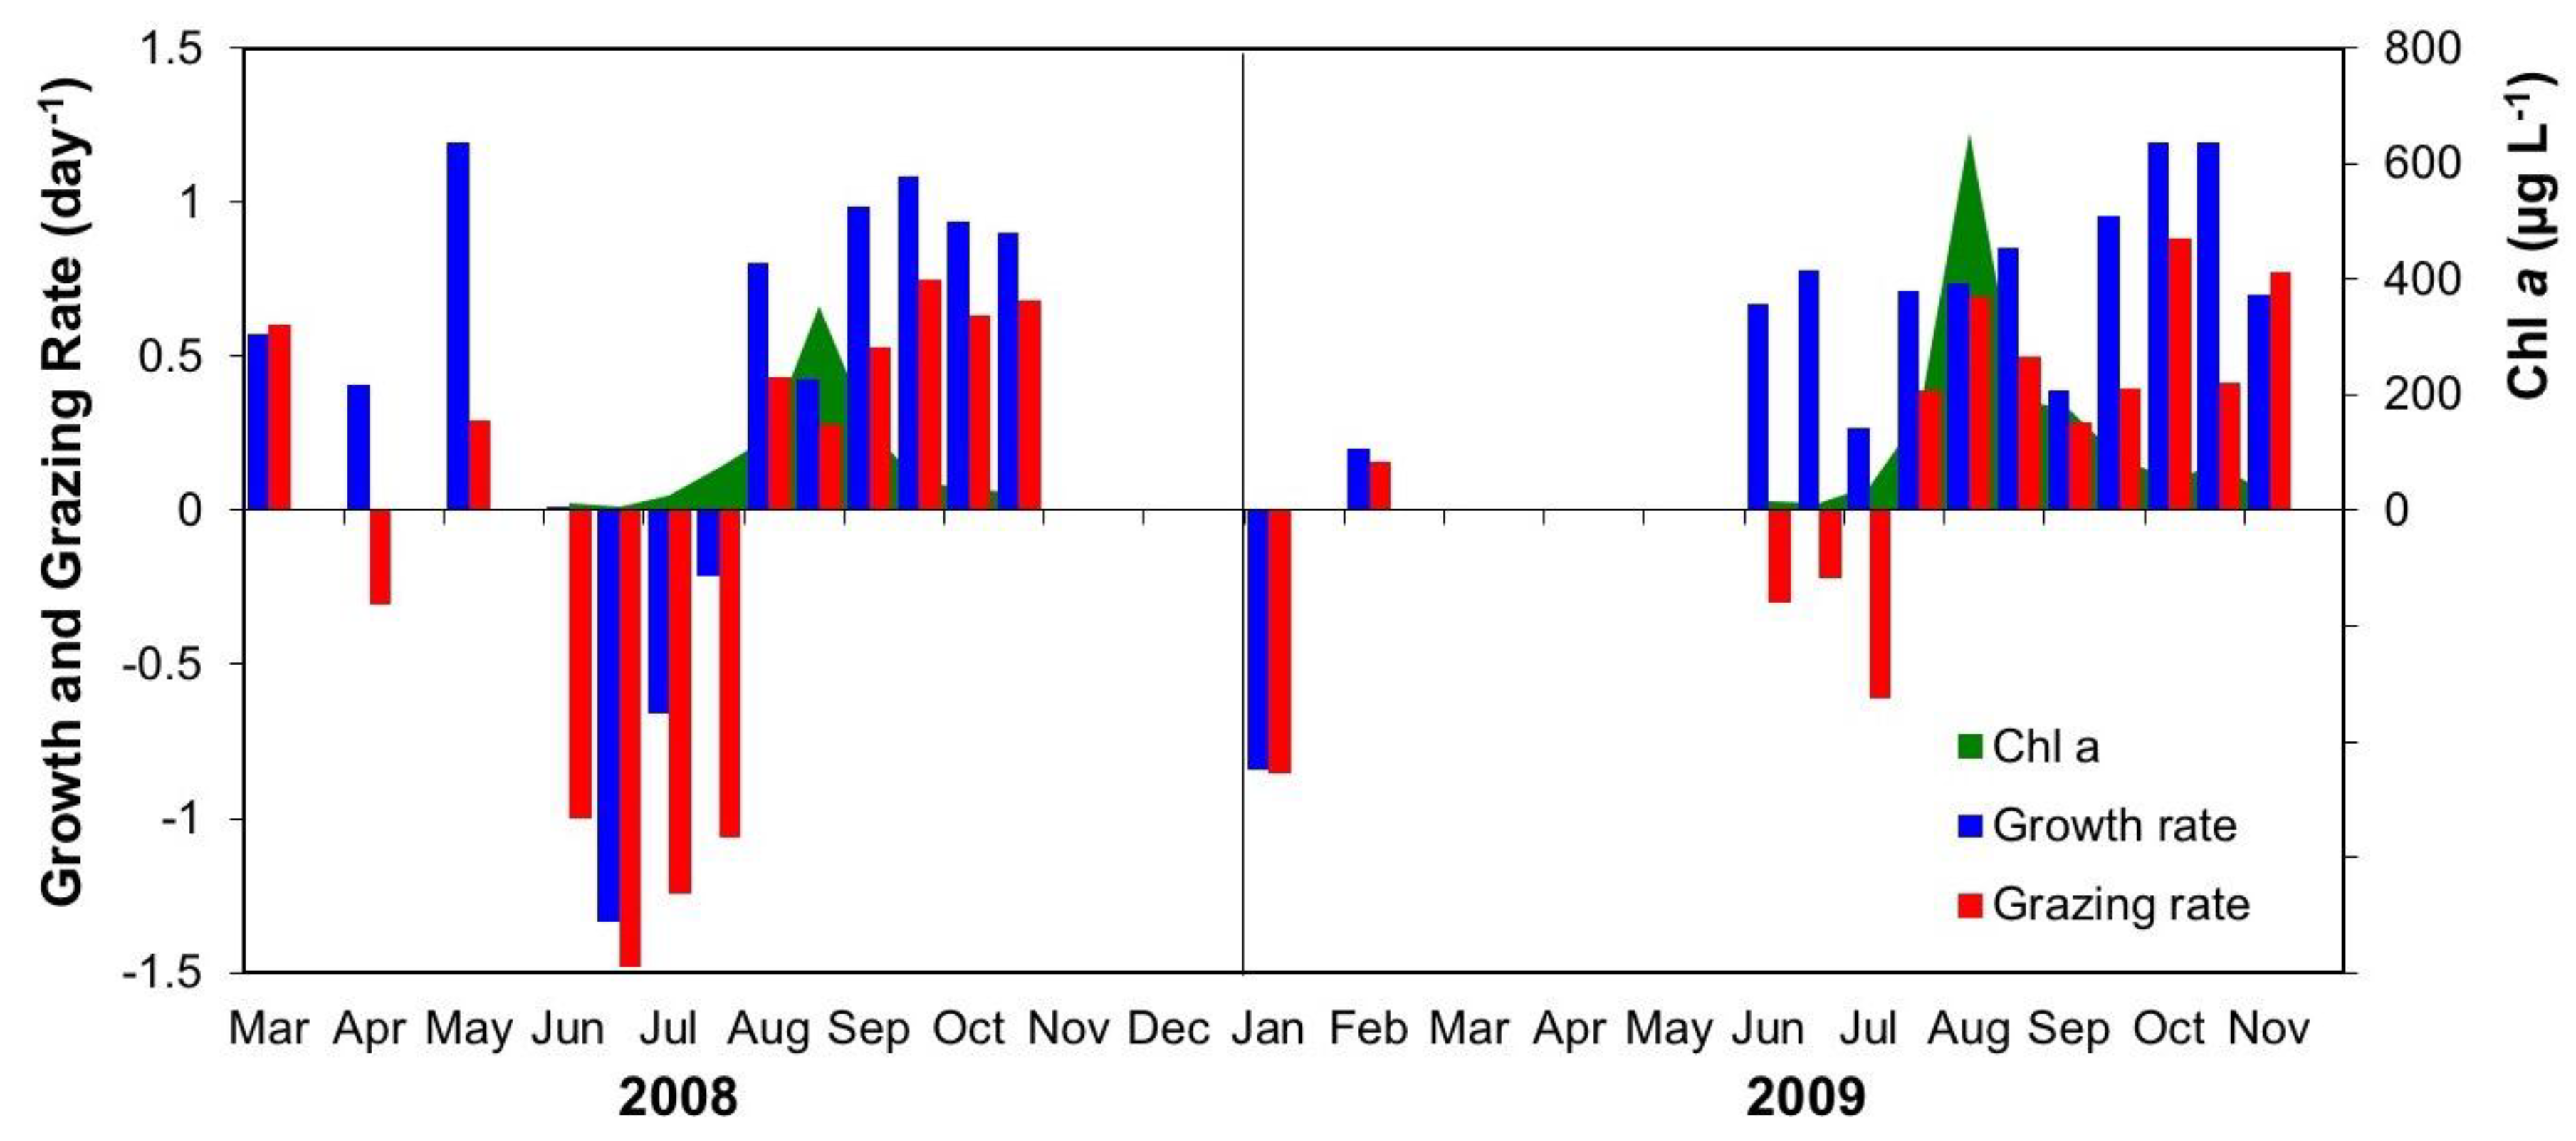
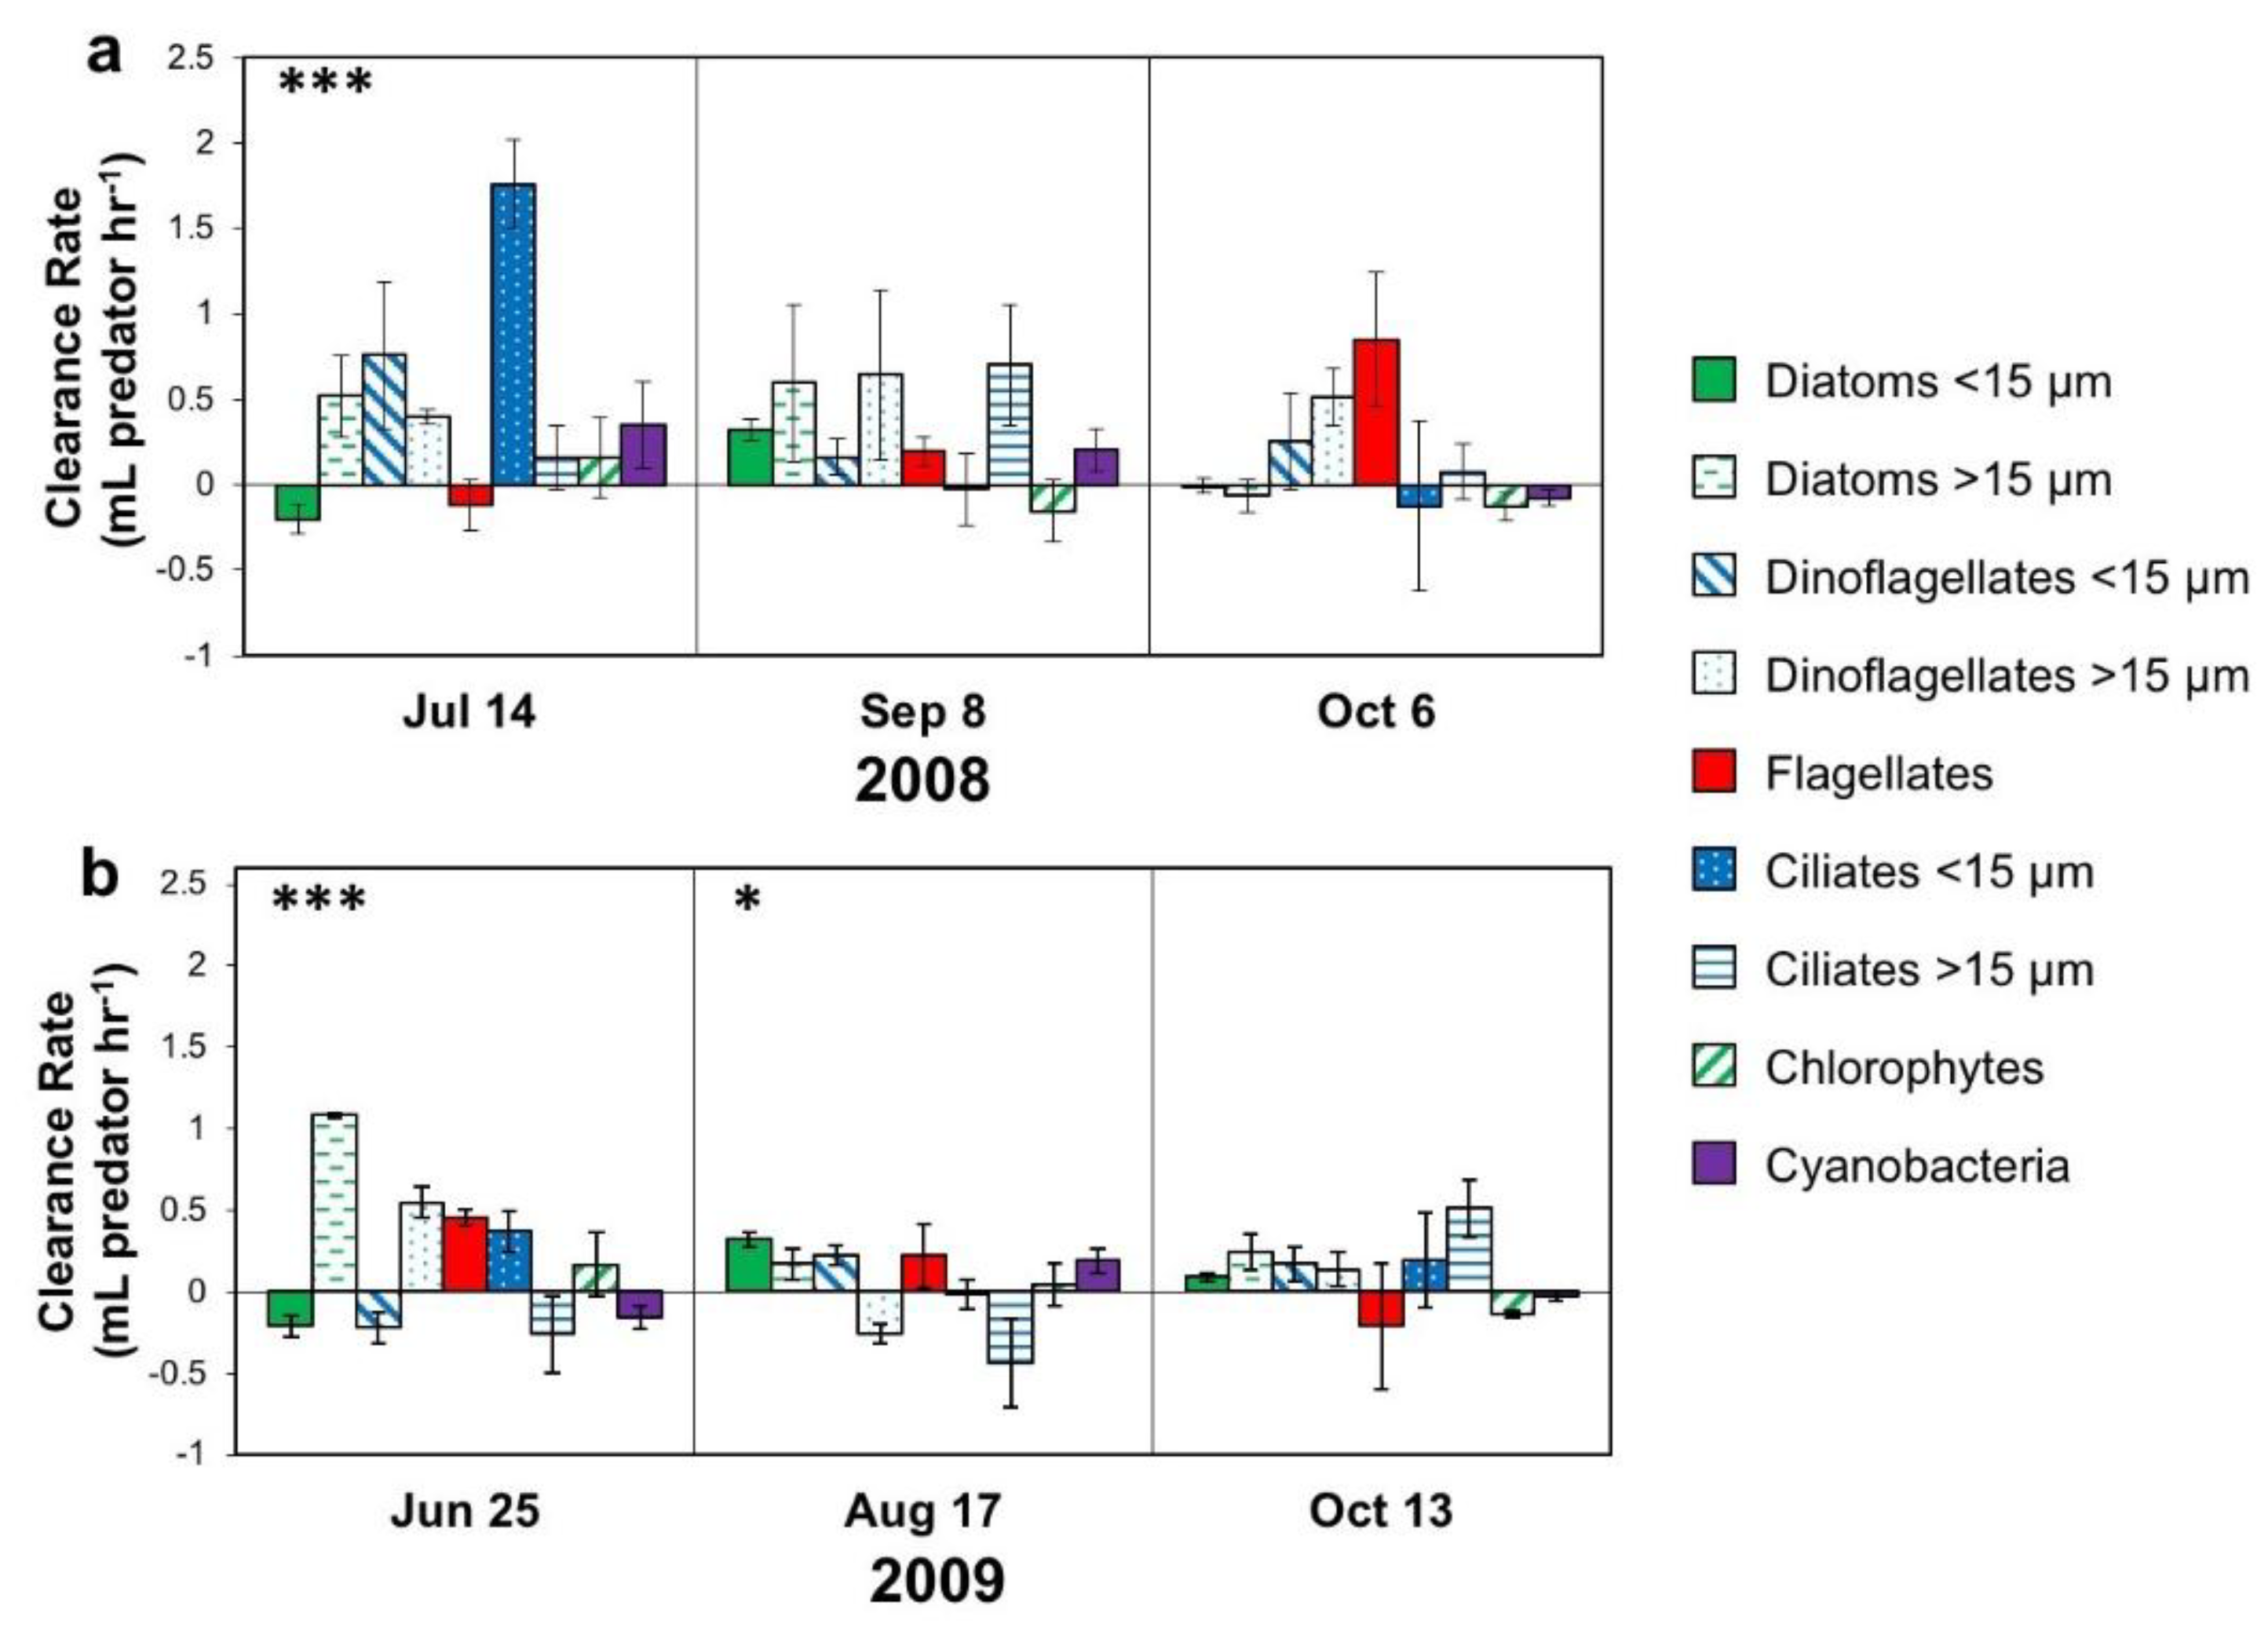
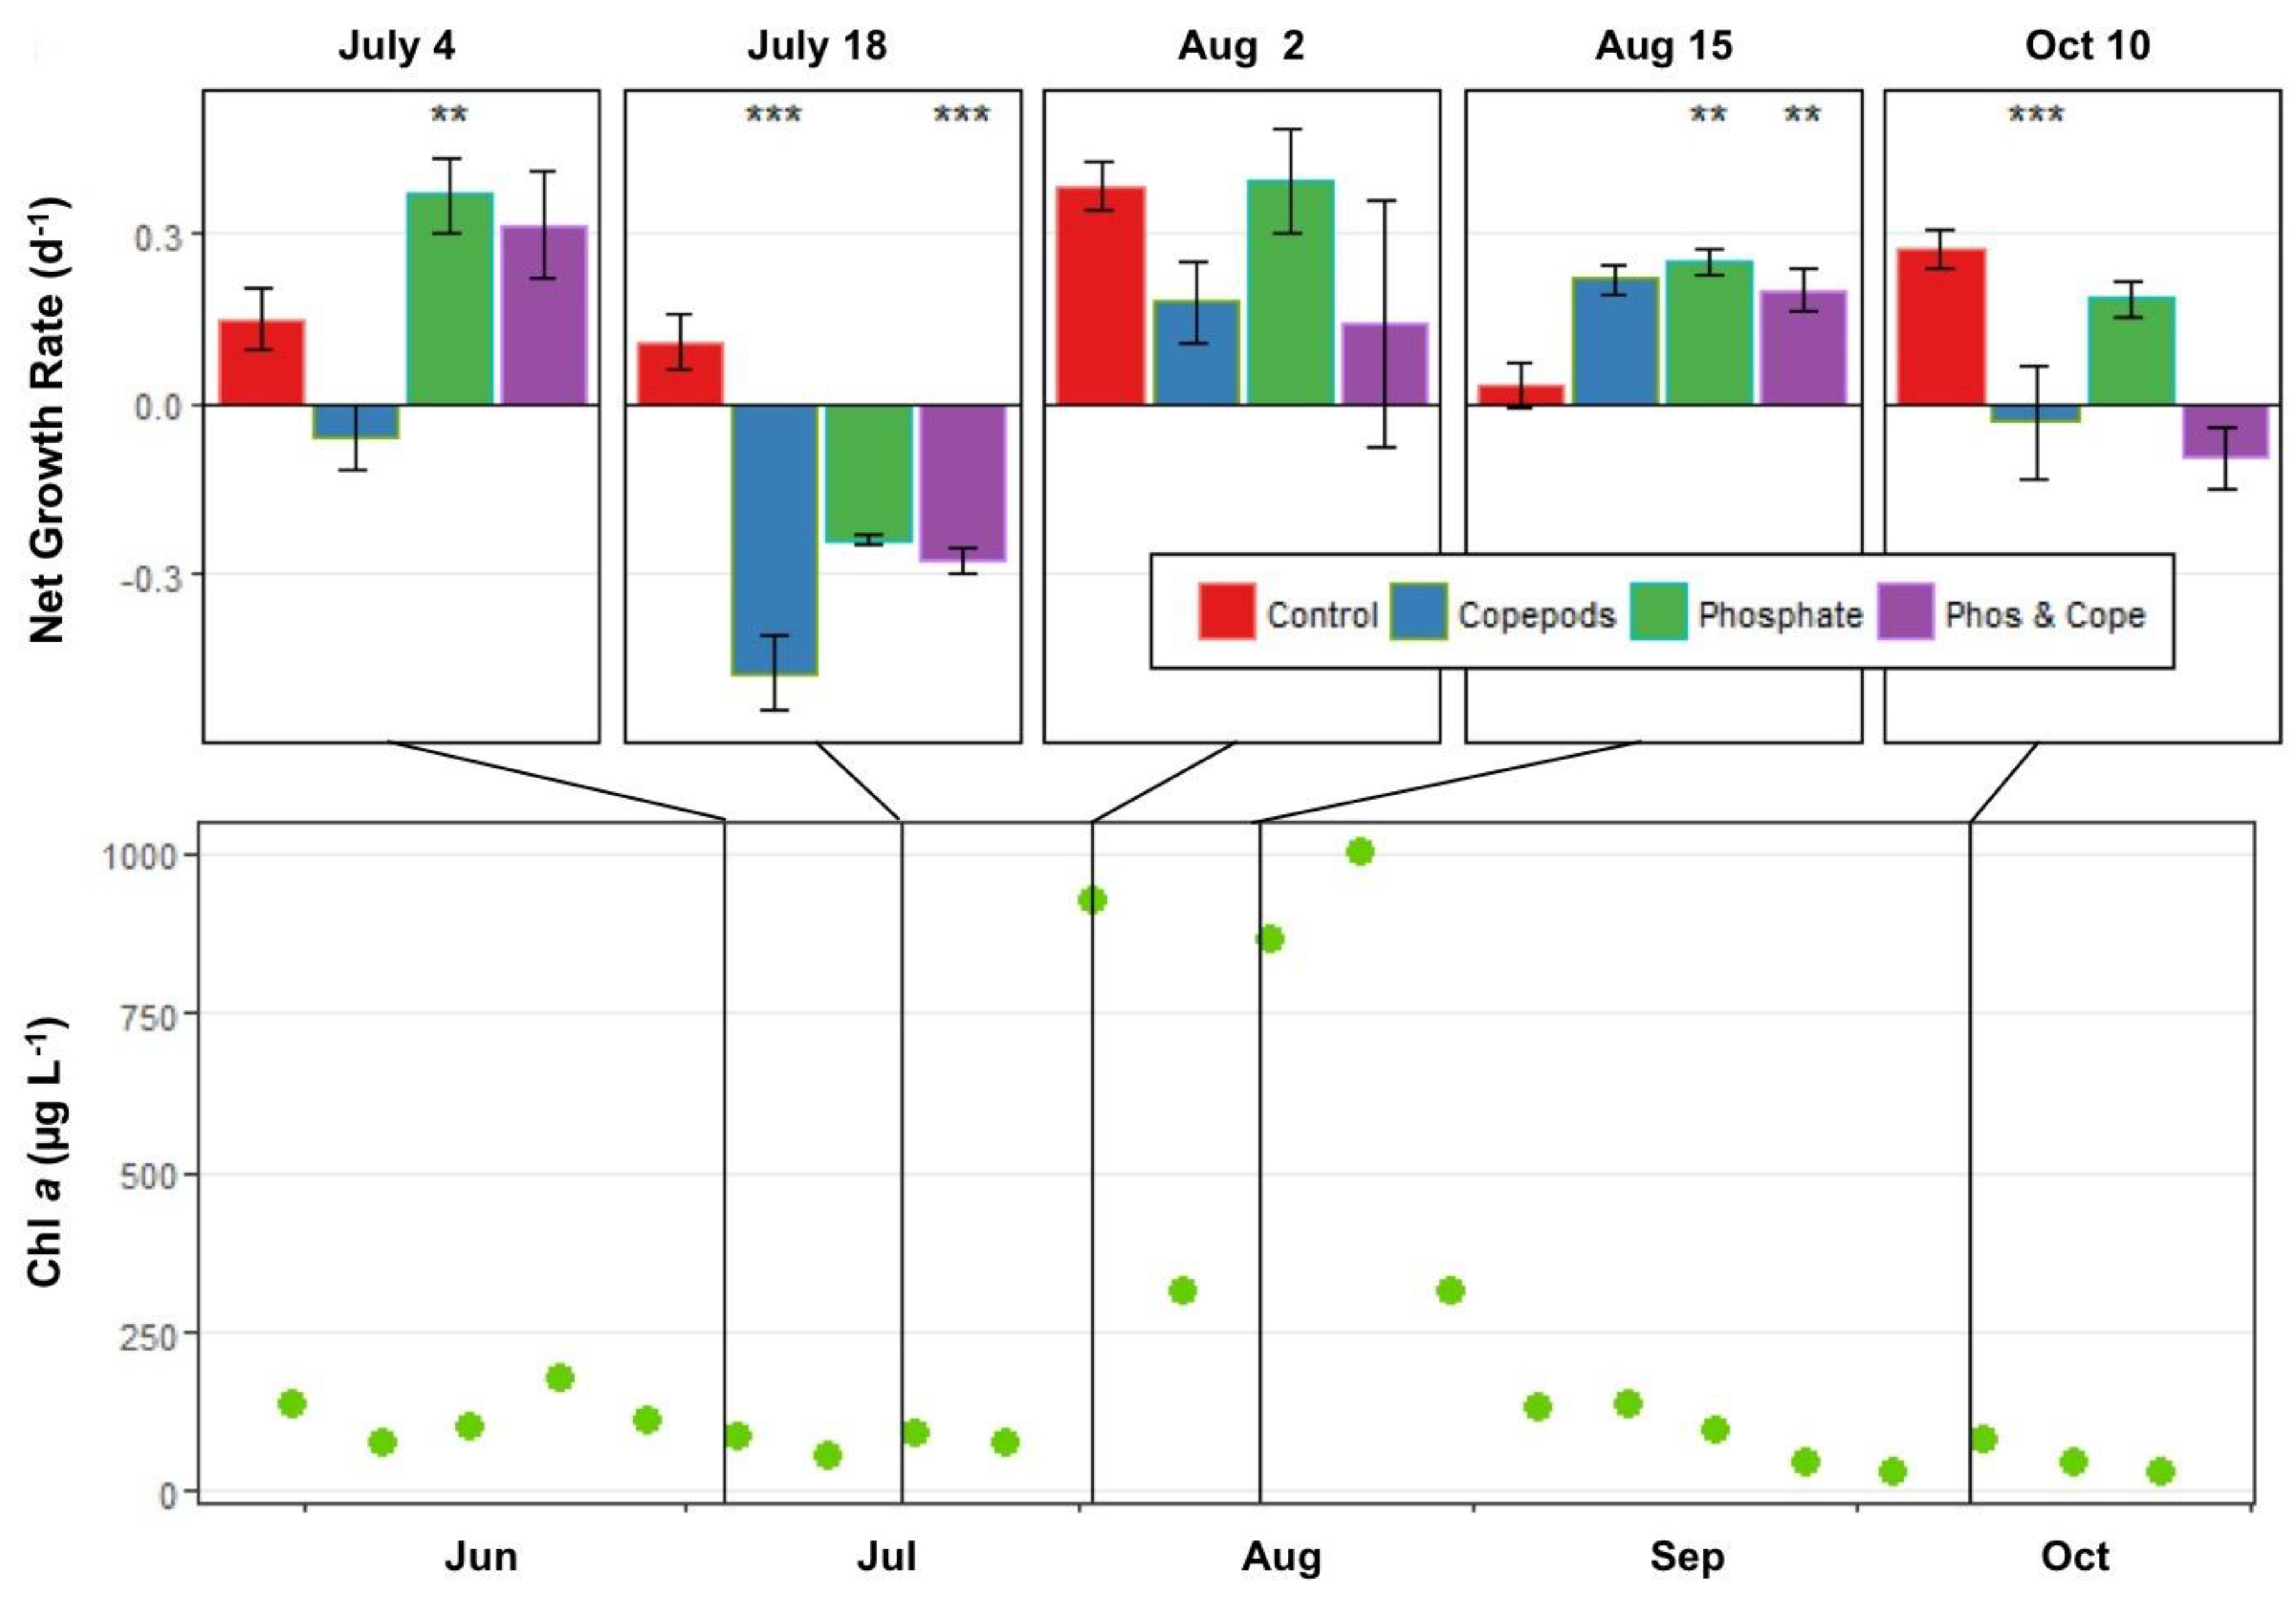
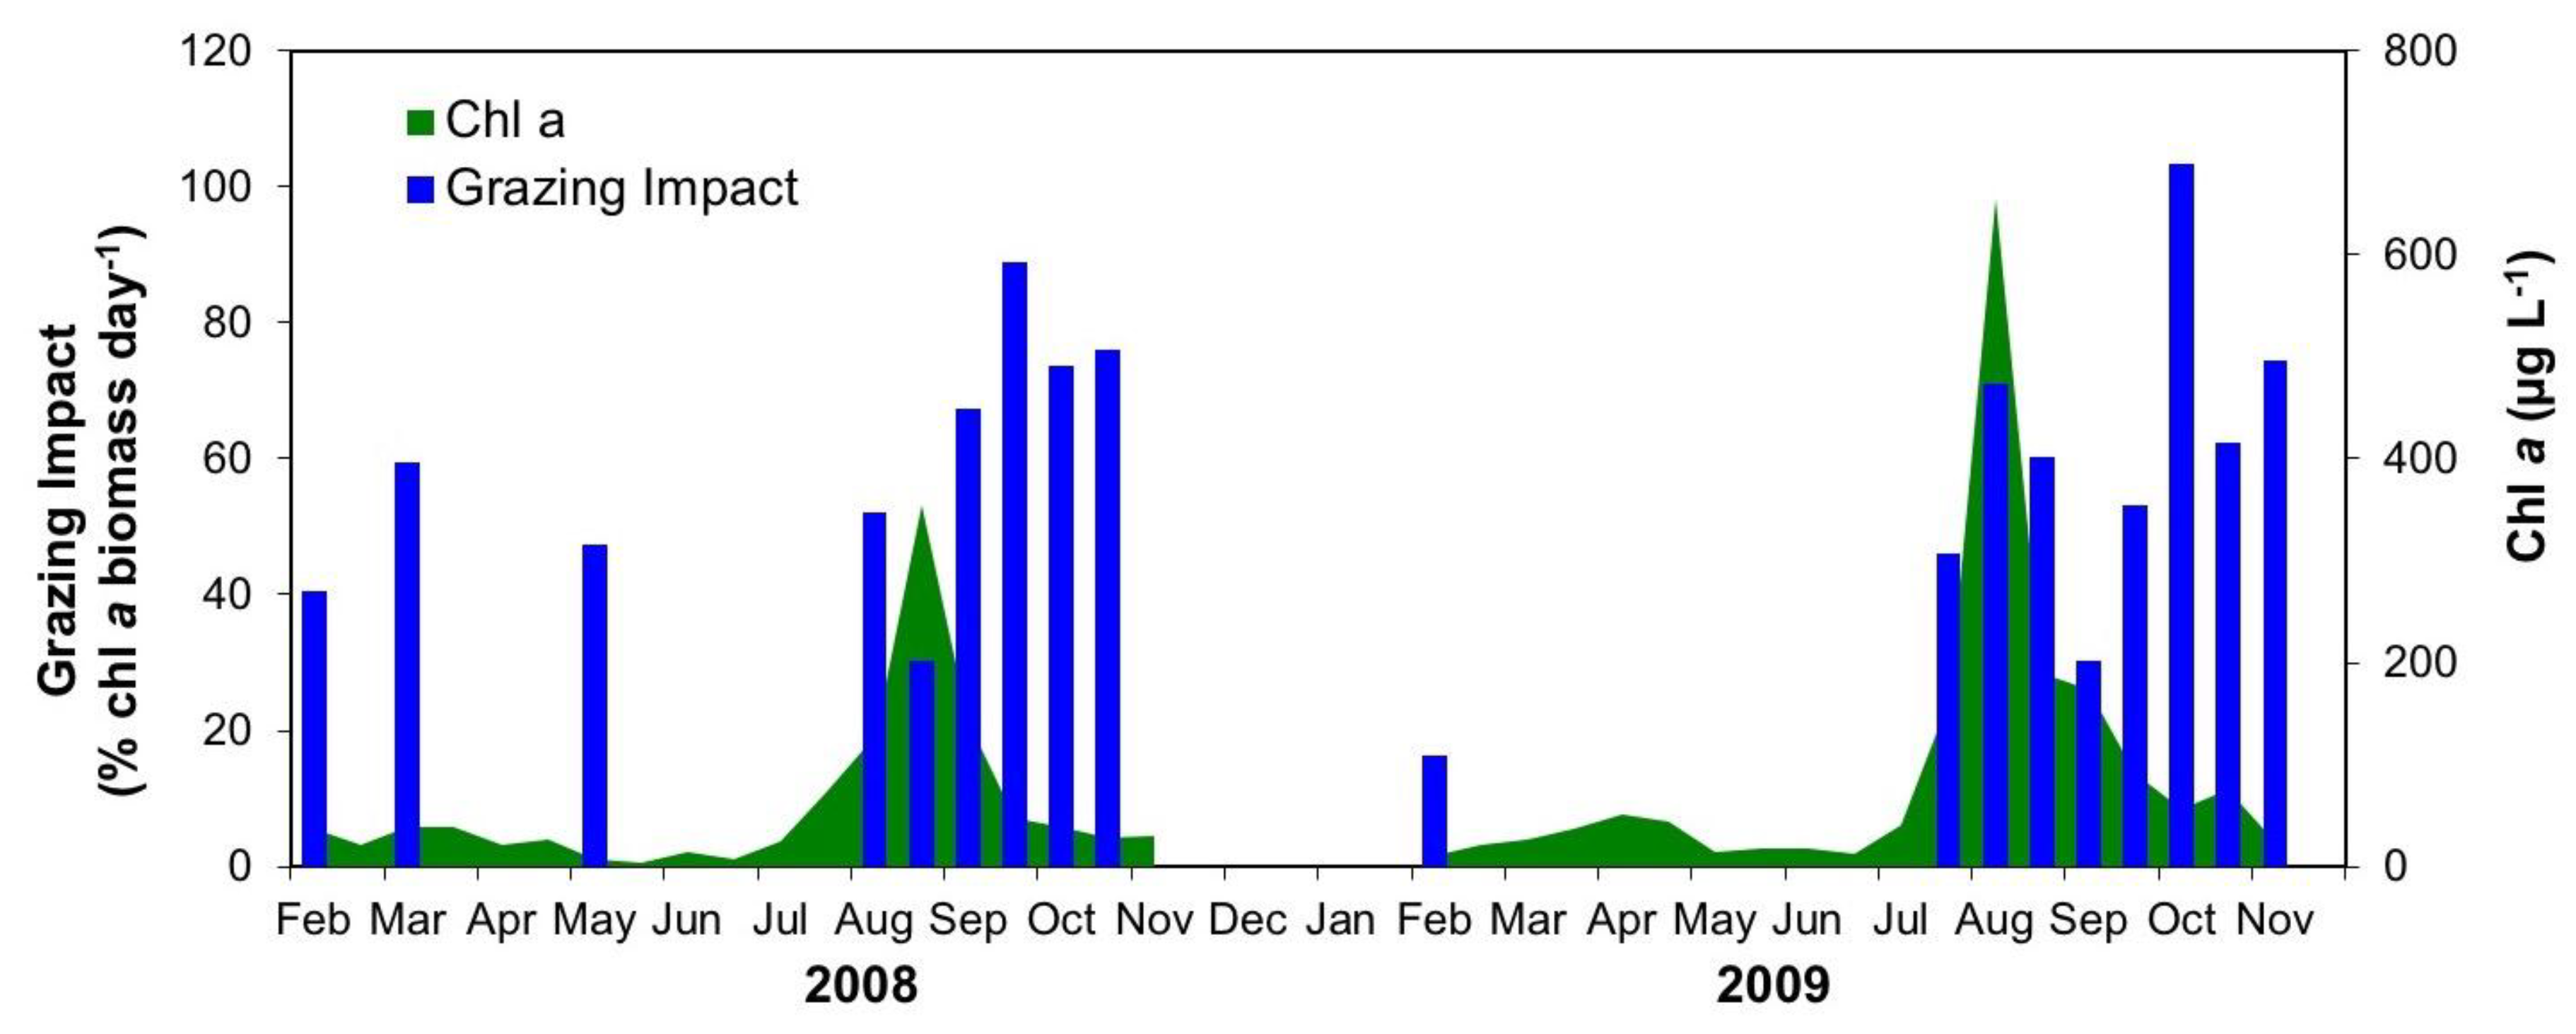
3.2.3. Interactive Effects of Copepod Grazing and Orthophosphate on Cyanobacterial Bloom Dynamics

We conducted a series of five incubation experiments between July and October 2013, which encompassed a very large cyanobacterial bloom in Vancouver Lake. We tested the effects of two factors (copepod grazing and orthophosphate amendment), as well as their interaction, on phytoplankton net growth rates (Figure 13). We observed a pattern of both positive and negative phytoplankton growth rates in the weeks prior to the cyanobacterial bloom that mirrored the results of dilution experiments conducted over the 2008 and 2009 blooms (Figure 9). Significantly higher phytoplankton net growth rates were observed when PO4-P was added to the treatment bottles during the July 4 experiment; however, in the two- to three-week period just before the cyanobacterial bloom began (July 18), net growth rates were negative for all three treatments (added nutrients, added grazers, added grazers + nutrients).
At the peak of the bloom (August 15), added orthophosphate (with or without the addition of copepod grazers) resulted in significantly higher net phytoplankton growth rates than in controls. During October, after the very strong bloom, the addition of copepods led to significantly reduced phytoplankton growth (Figure 13).

4. Discussion

Modification of the hydrology and subsequent shallowing of Vancouver Lake, along with increased development in the watershed surrounding the lake since the early 20th century, has resulted in substantial changes in the ecology of the lake, and coincided with the increased frequency of harmful cyanobacterial blooms [52,53,55]. The goal of our eight-year research program in Vancouver Lake was to examine the wide range of processes that could be driving these blooms, as well as variability in the plankton community more broadly. Our field and experimental results illustrate the dynamic interplay of abiotic and biotic forces whose influence on the timing and intensity of harmful cyanobacterial blooms varies on a seasonal and inter-annual basis.

4.1. Patterns of Plankton Community Change in Vancouver Lake

From 2005 to 2011, we observed a relatively consistent seasonal succession of plankton in Vancouver Lake, from a late winter-spring period characterized by diatoms, euglenids, bosmid cladocerans, and calanoid copepods, to a late spring-early summer dominated by a mixed assemblage of eukaryotic phytoplankton and large daphnid cladocerans, and to major blooms of cyanobacteria and high abundances of omnivorous cyclopoid copepods during late summer.
This successional pattern has become quite common for temperate-zone shallow urban lakes and reservoirs that have experienced increased nutrient inputs and other impacts of accelerating development in their watersheds over the past several decades (e.g., [37,82,83,84]). Two recent illustrative examples include a set of floodplain lakes in Illinois where the shift from diatom- to cyanobacteria-dominance in summer continued even after more than a year of restoration efforts [85], and the Tingxi Reservoir in southeastern China where the phytoplankton assemblage biomass rapidly transitioned from >90% diatoms to >90% cyanobacteria, raising serious management concerns for this large drinking water reservoir [86].
We also observed notable variation in the abundance and composition of the planktonic community between warm, dry years (in particular 2007, 2009, and 2013) and the coolest and wettest year in our eight-year program (2010). These results strongly align with trends observed across a wide range of lake types in temperate latitudes, where warmer temperatures have been associated with more severe cyanobacterial blooms [22,25]. The most notable interannual pattern among the zooplankton was the appearance of the invasive calanoid copepod Pseudodiaptomus forbesi in Vancouver Lake in 2011. This introduction coincided with extremely low abundances of normally dominant cladoceran and cyclopoid copepod populations in the lake. P. forbesi feeding rates and selectivity measured in the adjacent Columbia River indicate an avoidance of cyanobacteria by these copepods, and a higher preference for diatoms [47]. Continued investigation will be necessary to determine whether this invasive species maintains and/or increases its abundance in Vancouver Lake and therefore the potential for an impact on the dynamics of blooms over time.

4.2. Role of Eutrophication on Cyanobacterial Blooms in Vancouver Lake

The magnitudes of the summer cyanobacterial blooms in Vancouver Lake over most of our eight-year research program were significantly associated with increased concentrations of SiO4–Si, PO4–P, and NH4–N, and low levels of NO3–N and DIN:DIP. The association of bloom timing with increased dissolved silicate is most likely the outcome of a shift from a diatom-dominated phytoplankton assemblage to one dominated by cyanobacteria, and the resulting reduction in silicate uptake by diatoms [87]. However, the associations between increased dissolved organic P and N and cyanobacterial blooms reflect a more direct influence of these nutrients on bloom dynamics.
These results clearly support the substantial literature describing the association of cyanobacterial blooms with elevated inorganic N and P (e.g., [9,11,14,88,89,90]), and are comparable to patterns documented in freshwater lakes across the globe, e.g., Lake Cedrino in Italy [91], Lake Erie in the United States [18], and Lake Taihu in China [92].
Similarly, increased PO4–P availability may also influence the level of toxicity of cyanobacterial blooms. In a separate, related study to the one reported here from Vancouver Lake during 2008 and 2009, we observed a significant relationship between environmental factors (SiO4-Si, PO4-P, turbidity) and the abundance of toxic and non-toxic cyanobacterial taxa, as well as the concentration of microcystin toxin both internal and external to cyanobacterial cells (primarily Microcystis sp.) [55]. Such a relationship between environmental conditions and cyanobacterial bloom toxicity has also been reported in other lake and reservoir systems throughout the Mediterranean island of Sardinia [93], as well as in the US Pacific Northwest [94], with a strong relationship observed between high orthophosphorous levels and high internal microcystin concentrations [95].
What is less clear from our studies of environmental drivers of cyanobacterial blooms in Vancouver Lake, and others outlined in the aforementioned reviews, is the extent to which increases in inorganic N and P concentration were the driving force to initiate cyanobacterial blooms, and therefore whether and how other abiotic and biotic (i.e., non-eutrophication) processes may have influenced bloom timing and magnitude.

4.3. The Role of Zooplankton Grazing and Predation on Cyanobacterial Bloom Dynamics in Vancouver Lake

In our experimental program, we observed that microzooplankton grazing rates were low during the spring of 2008 and 2009, became strongly negative in the two to three weeks prior to each year’s cyanobacterial bloom, and then increased during and following the peak of cyanobacterial biomass.
These high grazing rates during and following the cyanobacterial blooms in Vancouver Lake compared favorably with the small number of similar investigations of microzooplankton grazing conducted in association with cyanobacterial blooms in other lake systems. For instance, Leonard and Paerl [96] measured relatively high microzooplankton grazing rates (~0.5 day−1) during a bloom of Cylindrospermopsis cyanobacteria in Lake George, Florida, USA. Gobler et al. [70] reported microzooplankton grazing rates of ~0.4 day−1 at the height of a Dolichospermum cyanobacterial bloom in Lake Agawam, New York, USA. Additionally, Davis et al. [97] measured microzooplankton grazing rates ranging from 0.4–0.6 day−1 during blooms of cyanobacteria dominated by Microcystis in Lake Erie, USA.
Our consistent finding of negative growth and grazing rates measured from dilution experiments conducted prior to two consecutive cyanobacterial blooms (2008 and 2009) in Vancouver Lake was initially surprising and perplexing. In our original publication of negative cyanobacterial growth and microzooplankton grazing rates in Vancouver Lake [71], we provided a lengthy interpretation of these results. Here, we reiterate our conclusion that these negative rates are most likely due to a cascading effect among zooplankton grazers, possibly in concert with toxic effects on grazers from high concentrations of cyanobacteria, that reduced the abundance and grazing activity of microzooplankton in successive dilutions of whole lake water (see further elaboration of this phenomenon in Section 4.4 below). Notably, since we published our original results, several investigators have reported similar negative rate measurements and positive slopes from dilution experiments conducted in both marine and freshwater systems, coming to the same general conclusions that trophic cascades within the dilution treatments, and to some extent interference from highly abundant and potentially toxic phytoplankton, were the cause of these negative rates [98,99,100].
With respect to mesozooplankton impacts on cyanobacterial blooms, in our copepod feeding incubation experiments conducted concurrent with the dilution experiments in 2008 and 2009, we found that A. robustus grazed directly on cyanobacteria during the late spring and early summer, and also selectively consumed ciliates and dinoflagellates. This likely allowed diatoms to successfully compete with cyanobacteria for nutrients and light prior to the late summer cyanobacterial blooms. But in the same two- to three-week period just before each bloom in which we observed negative microzooplankton grazing rates for cyanobacteria, A. robustus specimens shifted their diet toward diatoms and away from the diatoms’ ciliate and dinoflagellate consumers, which may have provided further release for cyanobacteria to grow rapidly and produce a bloom. Once the blooms reached their peaks, A. robustus specimens did resume grazing upon cyanobacteria, but their grazing impact was insufficient to control cyanobacterial abundance, and the copepods were minimal grazers of phytoplankton as the bloom dissipated.
Since we initially reported our copepod feeding results in Vancouver Lake [46], at least two studies of the potential for selective feeding by copepods to promote cyanobacteria growth in lakes have been published. Hong et al. [43] conducted laboratory experiments with the calanoid copepod Boeckella sp. from subtropical lakes in Australia feeding on mixed assemblages of algae and Cylindrospermopsis raciborskii, and found that C. raciborskii persistence was promoted by selective feeding of the copepod. Also, in a similar laboratory study conducted with copepods collected from Brazilian lowland lakes, Leitão et al. [101] showed that grazing of Notodiaptomus iheringi on co-occurring algae allowed Microcystis to proliferate.
An explicit test of the interactions between copepod grazing and nutrient (PO4-P) addition on cyanobacterial bloom dynamics in Vancouver Lake confirmed many of our interpretations from earlier, separate experiments [49]. We found that phytoplankton growth in the early summer was limited by PO4-P availability, but that in the weeks following the height of the bloom, phytoplankton growth rates were likely reduced by the grazing of microzooplankton (ciliates and dinoflagellates). Most notably, in the weeks leading up to the bloom, as well as at the height of the bloom, copepod grazing likely indirectly led to increased cyanobacteria abundances via trophic cascade effects by reducing the abundance (and thus grazing impacts) of dinoflagellates and ciliates. Our results indicated that as a result of indirect trophic cascades, nutrient addition and zooplankton grazing may act synergistically to maintain and even extend cyanobacterial blooms.

4.4. Interactive Effects of Eutrophication and Zooplankton Trophic Cascades on Cyanobacterial Blooms

The dynamics of cyanobacterial blooms in Vancouver Lake appear to be the result of a combination of interacting abiotic and biotic factors acting over the summer bloom cycle, which we have summarized in a conceptual diagram shown in Figure 14. During the spring-early summer, NO3-N concentrations are generally high enough to support a robust assemblage of diatoms and other algae. However, each year in the several weeks prior to the cyanobacteria bloom, we consistently observed dissolved inorganic nitrogen availability (as NO3–N, NO2–N, and NH4–N) to rapidly decrease. These low dissolved N conditions typically provide a competitive advantage to N-fixing cyanobacteria over diatoms and other eukaryotic algae.
Our experimental results also demonstrated that during this period prior to the blooms, cyclopoid copepods shifted away from consuming heterotrophic ciliates and dinoflagellates (which had been promoting diatom growth through a trophic cascade) to a diet more dominated by diatoms and other algae. This effectively reduced algal competition with cyanobacteria for limited nitrogen. Moreover, this transition in N availability and change in grazing patterns consistently occurred during late July-August, when we also observed sharp annual increases in PO4-P concentration. Preliminary results from a modeling study of nutrient dynamics in Vancouver Lake suggest that, during this late summer period, PO4-P is likely added to the water column from the sediments due to redox reactions at the sediment-water interface under low oxygen conditions, or through bioturbation, but not due to wind mixing that resuspends sediments and releases orthophosphate (G. Rollwagen-Bollens, unpublished data). Nevertheless, the combined effect of reduced dissolved N, a sudden increase of dissolved P, and a cascading effect of zooplankton grazing created a ‘perfect storm’ of conditions that promoted the rapid proliferation of cyanobacteria.
At the height of the late summer cyanobacterial blooms in Vancouver Lake, cyanobacterial carbon biomass reached as high as 20 µg L−1, with total chl a concentrations often exceeding 750 µg L−1. These levels are substantially higher than many other large lakes plagued by harmful cyanobacterial blooms, e.g., Lake Agawam in New York, USA [70], Lake Cedrino in Italy [91], Lake Taihu in China [102], Lake Erie in USA [103,104], and Lake Okeechobee in Florida, USA [105]. Yet the duration of the peaks in chl a biomass in Vancouver Lake was typically only 8-12 weeks, often shorter than in these other lakes. Such extreme phytoplankton biomass in Vancouver Lake was likely maintained because very high PO4-P and NH4-N concentrations were frequently observed at the same time as the peaks in chl a levels. Generally, we also measured very high microzooplankton and copepod grazing rates near the end of the periods of maximum chl a concentration, suggesting that once nutrient levels and cyanobacterial growth rates decreased, grazing impacts increased and accelerated the bloom decline.
Finally, in the weeks following cyanobacterial bloom maxima in Vancouver Lake, nutrient levels (in particular PO4-P and NH4-N) once again became quite low and copepod feeding rates fell to near zero. However, microzooplankton grazing rates remained quite high, and their grazing impact, combined with low nutrient availability, drove down cyanobacteria abundance.

4.5. Vancouver Lake as a Model System for Investigating Multiple, Interacting Drivers of Cyanobacterial Bloom Dynamics in Shallow, Temperate Lakes

Considerable effort has been made in the last several decades to better understand and quantify the drivers of freshwater cyanobacterial bloom dynamics—motivated in large part by the critical need to manage the many harmful ecological, economic, and health effects these blooms may cause. The majority of this research has focused on testing the role of single factors on bloom timing and magnitude, such as the role of enhanced dissolved inorganic P availability (e.g., [106,107]), the influence of dissolved inorganic N and N:P in lakes and reservoirs (e.g., [108,109]), the impact of physical environmental factors such as stratification and temperature (e.g., [110]), the role of microzooplankton (e.g., [71,97,111]) and mesozooplankton grazers (e.g., [46,112,113,114]), and more recently, the potential for climate change to exacerbate many of these drivers (e.g., [21]). Despite the acknowledgement by nearly all of these authors that cyanobacterial blooms are likely the result of a range of factors acting together, investigations that explicitly examine the interaction of multiple factors (especially abiotic and biotic factors together) were rare in the literature prior to the past 10–15 years.
We believe a set of themes about the dynamics of cyanobacterial blooms are now emerging from the growing number of extended research programs investigating this problem across marine and freshwater habitats [88,115], which point to some overarching patterns of interacting factors that are influencing bloom development and decline. There is little doubt about the role of increasing eutrophication and associated inputs of excessive dissolved inorganic N and P (and to some extent Si and important trace metals such as Fe) in creating conditions conducive to cyanobacterial dominance in lakes and reservoirs. However, in Vancouver Lake and many other large, shallow eutrophic systems, the presence of high nutrient concentrations is not always sufficient to consistently generate large blooms – trophic interactions and cascades within the plankton community must also be aligned to promote the growth of cyanobacteria.
In a recent review of the interactions between zooplankton and cyanobacterial blooms under eutrophic conditions, Ger et al. [35] pointed out that while cyanobacteria can at times limit zooplankton grazing due to the interference of feeding apparatus and/or release of toxins, both protozoan and crustacean grazers may effectively limit cyanobacterial growth directly, and cascading effects among zooplankton grazers can lead to indirect controls on cyanobacterial growth as well—particularly in more eutrophic lakes. The patterns that we observe in Vancouver Lake, i.e., the top-down influence of zooplankton feeding that promotes cyanobacterial abundance and bloom initiation, have also been demonstrated in several other systems, including Lake St. Lucia in South Africa [116], Lake Kinneret in Israel [113], Florida Bay [117], Lake Erie [97], and even during ‘brown tide’ (Aureoumbra lagunensis) blooms in Texas [118].
Due to the similar patterns of bloom development observed in other lakes throughout temperate latitudes worldwide, we believe Vancouver Lake serves as a model for investigating and understanding multiple, interacting drivers of cyanobacterial bloom dynamics in shallow, temperate lakes, and is therefore an important system in which to investigate new questions related to the science and management of harmful algal blooms.

4.6. Implications of Results for Management of Future Blooms in Vancouver Lake and Elsewhere

It has been nearly 20 years since Elser [119] proposed that cyanobacterial blooms in lakes are driven by inter-dependent factors, including mixing regimes and nutrient availability, as well as biotic interactions, but that food web interactions ultimately determine whether a bloom will occur. Our results in Vancouver Lake provide good evidence to support Elser’s prediction that trophic interactions strongly influence bloom dynamics, namely through top-down trophic cascade effects from mesozooplankton grazers that initiate blooms in the presence of increased orthophosphate, and then microzooplankton (ciliates and heterotrophic dinoflagellates) grazing of cyanobacterial biomass to end blooms as nutrient concentrations also decline. Our study further suggests that efforts to mitigate or eliminate cyanobacterial blooms in Vancouver Lake and other large, shallow lakes must consider the range of interacting factors that contribute to these blooms [120].
Ideally, managers should consider a combination of strategies to reduce cyanobacterial blooms, including the reduction of external nutrient loading into the lake [121,122], as well as biomanipulation approaches that target planktonic grazers through fish removal or addition. For example, in a 13-year study of Lake Ringsjön in Sweden, Ekvall et al. [38] found that the removal of cyprinid fish over the last eight years of the project resulted in higher abundances of large daphnid cladocerans relative to copepods and small cladocerans, and lower cyanobacterial biomass. They concluded that daphnid grazing directly upon cyanobacteria reduced not only cyanobacterial abundance, but also the concentrations of extracellular microcystin, and counteracted the cascading effect of copepod grazers which had been promoting cyanobacterial growth. Similarly, Jeppesen et al. [123] reviewed a range of studies in temperate lakes and found that the addition of piscivorous fish led to a decreased abundance of cyanobacteria through top-down predation on zooplanktivorous fish and a resulting increase in cladoceran abundance, which grazed down the cyanobacteria.
To date, very little research has been conducted in Vancouver Lake to quantify the fish community composition and abundance; thus, more investigations will be necessary to determine whether fish removal or addition would prove effective in reducing cyanobacterial blooms in this system. However, we believe such biomanipulation approaches may represent a promising management tool to augment current efforts to reduce nutrient inputs into Vancouver Lake and other temperate lakes in the region.

5. Summary and Conclusions

We conducted an eight-year (2005–2013) field and experimental research program in Vancouver Lake, WA, USA in order to quantify and assess the interaction of multiple biological and environmental factors that drive summertime cyanobacterial blooms in this large, shallow eutrophic lake. We observed a relatively consistent seasonal succession of phytoplankton and zooplankton assemblages in each year studied, and these seasonal assemblages were significantly associated with variability in temperature, nutrient concentrations (namely elevated PO4-P and NH4-N), turbidity, and chl a biomass. Our experimental program over three annual cyanobacterial bloom cycles also demonstrated the critical role of both direct and indirect (trophic cascade) impacts of zooplankton grazing on cyanobacteria bloom timing and magnitude.
Through our integrated research program, we have demonstrated that cyanobacterial blooms in Vancouver Lake are initiated as a result of concurrent reductions in NO3-N concentration and increased concentrations of PO4-P, coupled with a shift in the diet of copepods away from ciliates and dinoflagellates toward diatoms, all of which stimulates rapid cyanobacterial growth. The ultimate magnitude of cyanobacterial biomass and their toxicity during the blooms is strongly positively associated with PO4-P and NH4-N concentrations. Additionally, the bloom decline is driven by the grazing of heterotrophic protists as nutrient availability decreases.
Harmful cyanobacterial blooms are a pressing environmental problem worldwide, and the frequency and magnitude of these events is likely to increase under conditions of climate change. Many different biotic and abiotic factors influence the dynamics of cyanobacterial blooms, often acting synergistically. Therefore, the efforts to manage and mitigate the harmful effects of these blooms must take a holistic approach. We have developed an empirically-based picture of how biotic and abiotic factors interact to drive the development and decline of cyanobacterial blooms in Vancouver Lake, that aligns with patterns observed in other large lakes. As such, Vancouver Lake provides a model system in which to explore and test new questions related to cyanobacterial bloom dynamics, including bloom management strategies which may be applicable across a wide range of temperate, eutrophic lake systems.

Author Contributions

G.R.B. and S.M.B. together conceived of and led the research program, including the design of field sampling plans and experimental protocols. G.R.B. conceived the conceptual model, wrote the manuscript, and performed the mesozooplankton incubation experiments. T.L. conducted the field collections from 2008–2011, conceived the design of the toxin study, performed the statistical analyses, and edited the manuscript. V.R. conducted the field collections during 2013, performed the interaction experiments, and edited the manuscript. S.M.B. participated in data analysis and edited the manuscript.

Funding

Our research program in Vancouver Lake was financially supported by the Vancouver Lake Watershed Partnership, the Washington State Department of Ecology, the US Geological Survey in partnership with the State of Washington Water Research Center, the Clark County (WA) Department of Public Works, and the Murdock Charitable Trust through grants awarded to G.R.B. and S.M.B. This work was also partially supported by a US National Science Foundation Graduate Research Fellowship awarded to V.R.

Acknowledgments

We wish to thank the many Washington State University students and technical staff who contributed to our field and laboratory efforts, in particular Jennifer Boyer, Josh Emerson, Alejandro Gonzalez, and Josh Faber-Hammond. Special thanks go to Julie Zimmerman, research technician for our Aquatic Ecology Laboratory, who continues to ably manage the logistics of this complicated research program. Finally, we acknowledge the School of Civil, Environmental and Mining Engineering and the Oceans Institute at the University of Western Australia for providing office space to G.R.B. and S.M.B. during the preparation of this manuscript.

Conflicts of Interest

The authors declare no conflict of interest. The founding sponsors had no role in the design of the study; in the collection, analyses, or interpretation of data; in the writing of the manuscript, and in the decision to publish the results.

References

  1. Codd, G.A.; Morrison, L.F.; Metcalf, J.S. Cyanobacterial toxins: Risk management for health protection. Toxicol. Appl. Pharmacol. 2005, 203, 264–272. [Google Scholar] [CrossRef] [PubMed]
  2. The Ecology of Cyanobacteria: Their Diversity in Time and Space; Whitton, B.A.; Potts, M. (Eds.) Springer: Dordrecht, The Netherlands, 2000; ISBN 978-0-7923-4735-4. [Google Scholar]
  3. Havens, K.E. Cyanobacteria blooms: Effects on aquatic ecosystems. Adv. Exp. Med. Biol. 2008, 619, 733–747. [Google Scholar] [CrossRef] [PubMed]
  4. Moore, S.K.; Trainer, V.L.; Mantua, N.J.; Parker, M.S.; Laws, E.A.; Backer, L.C.; Fleming, L.E. Impacts of climate variability and future climate change on harmful algal blooms and human health. Environ. Health 2008, 7, S4. [Google Scholar] [CrossRef] [PubMed] [Green Version]
  5. Paerl, H.W.; Hall, N.S.; Calandrino, E.S. Controlling harmful cyanobacterial blooms in a world experiencing anthropogenic and climatic-induced change. Sci. Total Environ. 2011, 409, 1739–1745. [Google Scholar] [CrossRef] [PubMed]
  6. Carmichael, W.W.; Boyer, G.L. Health impacts from cyanobacteria harmful algae blooms: Implications for the North American Great Lakes. Harmful Algae 2016, 54, 194–212. [Google Scholar] [CrossRef] [PubMed]
  7. Toxic Cyanobacteria in Water: A Guide to Their Public Health Consequences, Monitoring, and Management; Chorus, I.; Bartram, J. (Eds.) E & FN Spon: London, UK; New York, NY, USA, 1999; ISBN 978-0-419-23930-7. [Google Scholar]
  8. Sigee, D.C.; Glenn, R.; Andrews, M.J.; Bellinger, E.G.; Butler, R.D.; Epton, H.A.S.; Hendry, R.D. Biological control of cyanobacteria: Principles and possibilities. Hydrobiologia 1999, 395, 161–172. [Google Scholar] [CrossRef]
  9. Paerl, H.W.; Otten, T.G. Harmful Cyanobacterial Blooms: Causes, Consequences, and Controls. Microb. Ecol. 2013, 65, 995–1010. [Google Scholar] [CrossRef] [PubMed]
  10. Bullerjahn, G.S.; McKay, R.M.; Davis, T.W.; Baker, D.B.; Boyer, G.L.; D’Anglada, L.V.; Doucette, G.J.; Ho, J.C.; Irwin, E.G.; Kling, C.L.; et al. Global solutions to regional problems: Collecting global expertise to address the problem of harmful cyanobacterial blooms. A Lake Erie case study. Harmful Algae 2016, 54, 223–238. [Google Scholar] [CrossRef] [PubMed] [Green Version]
  11. Glibert, P.; Seitzinger, S.; Heil, C.; Burkholder, J.; Parrow, M.; Codispoti, L.; Kelly, V. The Role of Eutrophication in the Global Proliferation of Harmful Algal Blooms. Oceanography 2005, 18, 198–209. [Google Scholar] [CrossRef] [Green Version]
  12. Jacoby, J.M.; Kann, J. The occurrence and response to toxic cyanobacteria in the Pacific Northwest, North America. Lake Reserv. Manag. 2007, 23, 123–143. [Google Scholar] [CrossRef] [Green Version]
  13. Anderson, D.M.; Glibert, P.M.; Burkholder, J.M. Harmful algal blooms and eutrophication: Nutrient sources, composition, and consequences. Estuaries 2002, 25, 704–726. [Google Scholar] [CrossRef]
  14. O’Neil, J.M.; Davis, T.W.; Burford, M.A.; Gobler, C.J. The rise of harmful cyanobacteria blooms: The potential roles of eutrophication and climate change. Harmful Algae 2012, 14, 313–334. [Google Scholar] [CrossRef]
  15. Paerl, H.W.; Scott, J.T.; McCarthy, M.J.; Newell, S.E.; Gardner, W.S.; Havens, K.E.; Hoffman, D.K.; Wilhelm, S.W.; Wurtsbaugh, W.A. It Takes Two to Tango: When and Where Dual Nutrient (N & P) Reductions Are Needed to Protect Lakes and Downstream Ecosystems. Environ. Sci. Technol. 2016, 50, 10805–10813. [Google Scholar] [CrossRef]
  16. Lewis, W.M.; Wurtsbaugh, W.A.; Paerl, H.W. Rationale for Control of Anthropogenic Nitrogen and Phosphorus to Reduce Eutrophication of Inland Waters. Environ. Sci. Technol. 2011, 45, 10300–10305. [Google Scholar] [CrossRef] [PubMed]
  17. Müller, S.; Mitrovic, S.M. Phytoplankton co-limitation by nitrogen and phosphorus in a shallow reservoir: Progressing from the phosphorus limitation paradigm. Hydrobiologia 2015, 744, 255–269. [Google Scholar] [CrossRef]
  18. Gobler, C.J.; Burkholder, J.M.; Davis, T.W.; Harke, M.J.; Johengen, T.; Stow, C.A.; Van de Waal, D.B. The dual role of nitrogen supply in controlling the growth and toxicity of cyanobacterial blooms. Harmful Algae 2016, 54, 87–97. [Google Scholar] [CrossRef] [PubMed]
  19. O’Farrell, I.; Bordet, F.; Chaparro, G. Bloom forming cyanobacterial complexes co-occurring in a subtropical large reservoir: Validation of dominant eco-strategies. Hydrobiologia 2012, 698, 175–190. [Google Scholar] [CrossRef]
  20. Moss, B.; Kosten, S.; Meerhoff, M.; Battarbee, R.W.; Jeppesen, E.; Mazzeo, N.; Havens, K.; Lacerot, G.; Liu, Z.; Meester, L.D.; et al. Allied attack: Climate change and eutrophication. Inland Waters 2011, 1, 101–105. [Google Scholar] [CrossRef]
  21. Kosten, S.; Huszar, V.L.M.; Bécares, E.; Costa, L.S.; Donk, E.; Hansson, L.-A.; Jeppesen, E.; Kruk, C.; Lacerot, G.; Mazzeo, N.; et al. Warmer climates boost cyanobacterial dominance in shallow lakes. Glob. Chang. Biol. 2012, 18, 118–126. [Google Scholar] [CrossRef]
  22. Jeppesen, E.; Meerhoff, M.; Davidson, T.A.; Trolle, D.; Søndergaard, M.; Lauridsen, T.L.; Beklioglu, M.; Brucet, S.; Volta, P.; González-Bergonzoni, I.; et al. Climate change impacts on lakes: An integrated ecological perspective based on a multi-faceted approach, with special focus on shallow lakes. J. Limnol. 2014, 73. [Google Scholar] [CrossRef] [Green Version]
  23. Coles, J.F.; Jones, R.C. Effect of temperature on photosynthesis-light response and growth of four phytoplankton species isolated from a tidal freshwater river. J. Phycol. 2000, 36, 7–16. [Google Scholar] [CrossRef]
  24. Reynolds, C.S. The Ecology of Phytoplankton. Available online: https://www.cambridge.org/core/books/the-ecology-of-phytoplankton/7E14FD43792ECC717C9E90E3519A1803 (accessed on 17 March 2018).
  25. Paerl, H.W.; Huisman, J. Climate. Blooms like it hot. Science 2008, 320, 57–58. [Google Scholar] [CrossRef] [PubMed]
  26. Jöhnk, K.D.; Huisman, J.; Sharples, J.; Sommeijer, B.; Visser, P.M.; Stroom, J.M. Summer heatwaves promote blooms of harmful cyanobacteria. Glob. Chang. Biol. 2008, 14, 495–512. [Google Scholar] [CrossRef] [Green Version]
  27. Davis, T.W.; Berry, D.L.; Boyer, G.L.; Gobler, C.J. The effects of temperature and nutrients on the growth and dynamics of toxic and non-toxic strains of Microcystis during cyanobacteria blooms. Harmful Algae 2009, 8, 715–725. [Google Scholar] [CrossRef]
  28. Paerl, H.W.; Paul, V.J. Climate change: Links to global expansion of harmful cyanobacteria. Water Res. 2012, 46, 1349–1363. [Google Scholar] [CrossRef] [PubMed]
  29. Visser, P.M.; Ibelings, B.W.; Bormans, M.; Huisman, J. Artificial mixing to control cyanobacterial blooms: A review. Aquat. Ecol. 2016, 50, 423–441. [Google Scholar] [CrossRef]
  30. Paerl, H.W. Controlling cyanobacterial harmful blooms in freshwater ecosystems. Microb. Biotechnol. 2017, 10, 1106–1110. [Google Scholar] [CrossRef] [PubMed] [Green Version]
  31. Visser, P.M.; Verspagen, J.M.H.; Sandrini, G.; Stal, L.J.; Matthijs, H.C.P.; Davis, T.W.; Paerl, H.W.; Huisman, J. How rising CO2 and global warming may stimulate harmful cyanobacterial blooms. Harmful Algae 2016, 54, 145–159. [Google Scholar] [CrossRef] [PubMed]
  32. Carey, C.C.; Ibelings, B.W.; Hoffmann, E.P.; Hamilton, D.P.; Brookes, J.D. Eco-physiological adaptations that favour freshwater cyanobacteria in a changing climate. Water Res. 2012, 46, 1394–1407. [Google Scholar] [CrossRef] [PubMed]
  33. Lampert, W. Laboratory studies on zooplankton-cyanobacteria interactions. N. Z. J. Mar. Freshw. Res. 1987, 21, 483–490. [Google Scholar] [CrossRef]
  34. Hansson, L.-A.; Gustafsson, S.; Rengefors, K.; Bomark, L. Cyanobacterial chemical warfare affects zooplankton community composition. Freshw. Biol. 2007, 52, 1290–1301. [Google Scholar] [CrossRef]
  35. Ger, K.A.; Urrutia-Cordero, P.; Frost, P.C.; Hansson, L.-A.; Sarnelle, O.; Wilson, A.E.; Lürling, M. The interaction between cyanobacteria and zooplankton in a more eutrophic world. Harmful Algae 2016, 54, 128–144. [Google Scholar] [CrossRef] [PubMed]
  36. Sarnelle, O. Initial conditions mediate the interaction between Daphnia and bloom-forming cyanobacteria. Limnol. Oceanogr. 2007, 52, 2120–2127. [Google Scholar] [CrossRef] [Green Version]
  37. Sommer, U.; Adrian, R.; De Senerpont Domis, L.; Elser, J.J.; Gaedke, U.; Ibelings, B.; Jeppesen, E.; Lürling, M.; Molinero, J.C.; Mooij, W.M.; et al. Beyond the Plankton Ecology Group (PEG) Model: Mechanisms Driving Plankton Succession. Annu. Rev. Ecol. Evol. Syst. 2012, 43, 429–448. [Google Scholar] [CrossRef]
  38. Ekvall, M.K.; Urrutia-Cordero, P.; Hansson, L.-A. Linking Cascading Effects of Fish Predation and Zooplankton Grazing to Reduced Cyanobacterial Biomass and Toxin Levels Following Biomanipulation. PLoS ONE 2014, 9, e112956. [Google Scholar] [CrossRef] [PubMed]
  39. Knisely, K.; Geller, W. Selective Feeding of Four Zooplankton Species on Natural Lake Phytoplankton. Oecologia 1986, 69, 86–94. [Google Scholar] [CrossRef] [PubMed]
  40. Panosso, R.; Lurling, M. Daphnia magna feeding on Cylindrospermopsis raciborskii: The role of food composition, filament length and body size. J. Plankton Res. 2010, 32, 1393–1404. [Google Scholar] [CrossRef]
  41. Epp, G.T. Grazing on filamentous cyanobacteria by Daphnia pulicaria. Limnol. Oceanogr. 1996, 41, 560–567. [Google Scholar] [CrossRef] [Green Version]
  42. Ghadouani, A.; Pinel-Alloul, B.; Prepas, E.E. Effects of experimentally induced cyanobacterial blooms on crustacean zooplankton communities. Freshw. Biol. 2003, 48, 363–381. [Google Scholar] [CrossRef]
  43. Hong, Y.; Burford, M.A.; Ralph, P.J.; Udy, J.W.; Doblin, M.A. The cyanobacterium Cylindrospermopsis raciborskii is facilitated by copepod selective grazing. Harmful Algae 2013, 29, 14–21. [Google Scholar] [CrossRef]
  44. Cowles, T.J.; Olson, R.J.; Chisholm, S.W. Food selection by copepods: Discrimination on the basis of food quality. Mar. Biol. 1988, 100, 41–49. [Google Scholar] [CrossRef]
  45. Olson, M.; Lessard, E.; Wong, C.; Bernhardt, M. Copepod feeding selectivity on microplankton, including the toxigenic diatoms Pseudo-nitzschia spp., in the coastal Pacific Northwest. Mar. Ecol. Prog. Ser. 2006, 326, 207–220. [Google Scholar] [CrossRef] [Green Version]
  46. Rollwagen-Bollens, G.; Bollens, S.; Gonzalez, A.; Zimmerman, J.; Lee, T.; Emerson, J. Feeding dynamics of the copepod Diacyclops thomasi before, during and following filamentous cyanobacteria blooms in a large, shallow temperate lake. Hydrobiologia 2013, 705, 101–118. [Google Scholar] [CrossRef]
  47. Bowen, A.; Rollwagen-Bollens, G.; Bollens, S.M.; Zimmerman, J. Feeding of the invasive copepod Pseudodiaptomus forbesi on natural microplankton assemblages within the lower Columbia River. J. Plankton Res. 2015, fbv078. [Google Scholar] [CrossRef]
  48. Urrutia-Cordero, P.; Ekvall, M.K.; Hansson, L.-A. Responses of cyanobacteria to herbivorous zooplankton across predator regimes: Who mows the bloom? Freshw. Biol. 2015, 60, 960–972. [Google Scholar] [CrossRef]
  49. Rose, V.; Rollwagen-Bollens, G.; Bollens, S.M. Interactive effects of phosphorus and zooplankton grazing on cyanobacterial blooms in a shallow temperate lake. Hydrobiologia 2017, 788, 345–359. [Google Scholar] [CrossRef]
  50. Jeppesen, E.; Sondergaard, M.; Jensen, J.P.; Havens, K.E.; Anneville, O.; Carvalho, L.; Coveney, M.F.; Deneke, R.; Dokulil, M.T.; Foy, B.; et al. Lake responses to reduced nutrient loading—An analysis of contemporary long-term data from 35 case studies. Freshw. Biol. 2005, 50, 1747–1771. [Google Scholar] [CrossRef]
  51. Paerl, H.W.; Scott, J.T. Throwing Fuel on the Fire: Synergistic Effects of Excessive Nitrogen Inputs and Global Warming on Harmful Algal Blooms. Environ. Sci. Technol. 2010, 44, 7756–7758. [Google Scholar] [CrossRef] [PubMed]
  52. Bhagat, S.; Orsborn, J. A Summary Report on Water Quantity and Quality Studies of Vancouver Lake; Washington State University: Pullman, WA, USA, 1971. [Google Scholar]
  53. Gorini, R. Lake restoration by dredging. In Proceedings of the Management of Bottom Sediments Containing Toxic Substances: Proceedings of the U.S./Japan Experts Meeting (13th), Baltimore, MD, USA, 3–5 November 1987; pp. 355–360. [Google Scholar]
  54. Sheibley, R.; Foreman, J.; Marshall, C.; Welch, W. Water and Nutrient Budgets for Vancouver Lake, Vancouver, Washington, October 2010–October 2012; U.S. Geological Survey Scientific Investigations Report 2014-5201; U.S. Geological Survey: Reston, VA, USA, 2014.
  55. Lee, T.A.; Rollwagen-Bollens, G.; Bollens, S.M.; Faber-Hammond, J.J. Environmental influence on cyanobacteria abundance and microcystin toxin production in a shallow temperate lake. Ecotoxicol. Environ. Saf. 2015, 114, 318–325. [Google Scholar] [CrossRef] [PubMed]
  56. Vancouver Lake Watershed Partnership. Vancouver Lake Partnership Planning Process and Recommendations Report 2013. Available online: http://www.vancouverlakepartnership.org/Partnership%20Planning%20Process%20and%20Recommendations%20Report.pdf.
  57. Strickland, J.; Parsons, T. A practical Handbook for Seawater Analysis; Fisheries Research Board of Canada Bulletin: Ottawa, ON, Canada, 1972; Volume 167. [Google Scholar]
  58. Hillebrand, H.; Dürselen, C.-D.; Kirschtel, D.; Pollingher, U.; Zohary, T. Biovolume calculation for pelagic and benthic microalgae. J. Phycol. 1999, 35, 403–424. [Google Scholar] [CrossRef]
  59. Menden-Deuer, S.; Lessard, E.J. Carbon to volume relationships for dinoflagellates, diatoms, and other protist plankton. Limnol. Oceanogr. 2000, 45, 569–579. [Google Scholar] [CrossRef] [Green Version]
  60. Thorp, J.H.; Covich, A.P. Ecology and Classification of North American Freshwater Invertebrates, 3rd ed.; Academic Press: Cambridge, MA, USA, 2010; ISBN 978-0-12-374855-3. [Google Scholar]
  61. Lee, T.A.; Rollwagen-Bollens, G.; Bollens, S.M. The influence of water quality variables on cyanobacterial blooms and phytoplankton community composition in a shallow temperate lake. Environ. Monit. Assess. 2015, 187. [Google Scholar] [CrossRef] [PubMed]
  62. Lee, T.A.; Bollens, S.M.; Rollwagen-Bollens, G.; Emerson, J.E. The effects of eutrophication and invasive species on zooplankton community dynamics in a shallow temperate lake. Fundam. Appl. Limnol. Für Hydrobiol. 2016, 188, 215–231. [Google Scholar] [CrossRef]
  63. Stroud, J.T.; Bush, M.R.; Ladd, M.C.; Nowicki, R.J.; Shantz, A.A.; Sweatman, J. Is a community still a community? Reviewing definitions of key terms in community ecology. Ecol. Evol. 2015, 5, 4757–4765. [Google Scholar] [CrossRef] [PubMed] [Green Version]
  64. Clarke, K.R. Non-parametric multivariate analyses of changes in community structure. Aust. J. Ecol. 1993, 18, 117–143. [Google Scholar] [CrossRef]
  65. Mielke, P.W.; Berry, K.J.; Brier, G.W. Application of Multi-Response Permutation Procedures for Examining Seasonal Changes in Monthly Mean Sea-Level Pressure Patterns. Mon. Weather Rev. 1981, 109, 120–126. [Google Scholar] [CrossRef] [Green Version]
  66. McCune, B.; Grace, J.B.; Urban, D.L. Analysis of Ecological Communities; MjM Software Design: Gleneden Beach, OR, USA, 2002; ISBN 978-0-9721290-0-8. [Google Scholar]
  67. Dufrene, M.; Legendre, P. Species Assemblages and Indicator Species: The Need for a Flexible Asymmetrical Approach. Ecol. Monogr. 1997, 67, 345–366. [Google Scholar] [CrossRef]
  68. Landry, M.R.; Hassett, R.P. Estimating the grazing impact of marine micro-zooplankton. Mar. Biol. 1982, 67, 283–288. [Google Scholar] [CrossRef]
  69. Landry, M.R.; Kirshtein, J.; Constantinou, J. A refined dilution technique for measuring the community grazing impact of microzooplankton, with experimental tests in the central Equatorial Pacific. Mar. Ecol. Prog. Ser. 1995, 120, 53–63. [Google Scholar] [CrossRef]
  70. Gobler, C.J.; Davis, T.W.; Coyne, K.J.; Boyer, G.L. Interactive influences of nutrient loading, zooplankton grazing, and microcystin synthetase gene expression on cyanobacterial bloom dynamics in a eutrophic New York lake. Harmful Algae 2007, 6, 119–133. [Google Scholar] [CrossRef]
  71. Boyer, J.; Rollwagen-Bollens, G.; Bollens, S.M. Microzooplankton grazing before, during and after a cyanobacterial bloom in Vancouver Lake, Washington, USA. Aquat. Microb. Ecol. 2011, 64, 163–174. [Google Scholar] [CrossRef] [Green Version]
  72. Rollwagen-Bollens, G.C.R.; Penry, D.L. Feeding dynamics of Acartia spp. copepods in a large, temperate estuary (San Francisco Bay, CA). Mar. Ecol. Prog. Ser. 2003, 257, 139–158. [Google Scholar] [CrossRef] [Green Version]
  73. Gifford, S.; Rollwagen-Bollens, G.; Bollens, S. Mesozooplankton omnivory in the upper San Francisco Estuary. Mar. Ecol. Prog. Ser. 2007, 348, 33–46. [Google Scholar] [CrossRef] [Green Version]
  74. Marin, V.; Huntley, M.; Frost, B.W. Measuring feeding rates of pelagic herbivores: Analysis of experimental design and methods. Mar. Biol. 1986, 93, 49–58. [Google Scholar] [CrossRef]
  75. Zar, J. Biostatistical Analysis, 3rd ed.; Pearson: Hong Kong, China, 1996. [Google Scholar]
  76. Vanderploeg, H.A.; Scavia, D. Two Electivity Indices for Feeding with Special Reference to Zooplankton Grazing. J. Fish. Res. Board Can. 1979, 36, 362–365. [Google Scholar] [CrossRef]
  77. Vanderploeg, H.A.; Scavia, D. Calculation and use of selectivity coefficients of feeding: Zooplankton grazing. Ecol. Model. 1979, 7, 135–149. [Google Scholar] [CrossRef]
  78. Bollens, S.M.; Breckenridge, J.K.; Cordell, J.R.; Rollwagen-Bollens, G.C.; Kalata, O. Invasive copepods in the Lower Columbia River Estuary: Seasonal abundance, co-occurrence and potential competition with native copepods. Aquat. Invasions 2012, 7, 101–109. [Google Scholar] [CrossRef] [Green Version]
  79. Breckenridge, J.K.; Bollens, S.M.; Rollwagen-Bollens, G.; Roegner, G.C. Plankton Assemblage Variability in a River-Dominated Temperate Estuary During Late Spring (High-flow) and Late Summer (Low-flow) Periods. Estuar. Coasts 2015, 38, 93–103. [Google Scholar] [CrossRef]
  80. Emerson, J.; Bollens, S.; Counihan, T. Seasonal dynamics of zooplankton in Columbia–Snake River reservoirs, with special emphasis on the invasive copepod Pseudodiaptomus forbesi. Aquat. Invasions 2015, 10, 25–40. [Google Scholar] [CrossRef] [Green Version]
  81. Dexter, E.; Bollens, S.M.; Rollwagen-Bollens, G.; Emerson, J.; Zimmerman, J. Persistent vs. ephemeral invasions: 8.5 years of zooplankton community dynamics in the Columbia River: Persistent vs. ephemeral invasions. Limnol. Oceanogr. 2015, 60, 527–539. [Google Scholar] [CrossRef]
  82. Sommer, U.; Gliwicz, Z.; Lampert, W.; Duncan, A. The PEG-model of seasonal succession of planktonic events in fresh waters. Arch. Hydrobiol. 1986, 106, 433–471. [Google Scholar]
  83. Kent, A.D.; Yannarell, A.C.; Rusak, J.A.; Triplett, E.W.; McMahon, K.D. Synchrony in aquatic microbial community dynamics. ISME J. 2007, 1, 38–47. [Google Scholar] [CrossRef] [PubMed] [Green Version]
  84. Fadda, A.; Markova, S.; Kotlik, P.; Luglie, A.; Padedda, B.; Buscarinu, P.; Sechi, N.; Manca, M. First record of planktonic crustaceans in Sardinian reservoirs. Biologia 2011, 66, 856–865. [Google Scholar] [CrossRef] [Green Version]
  85. Lemke, M.J.; Paver, S.F.; Dungey, K.E.; Velho, L.F.M.; Kent, A.D.; Rodrigues, L.C.; Kellerhals, D.M.; Randle, M.R. Diversity and succession of pelagic microorganism communities in a newly restored Illinois River floodplain lake. Hydrobiologia 2017, 804, 35–58. [Google Scholar] [CrossRef] [Green Version]
  86. Lv, H.; Yang, J.; Liu, L.; Yu, X.; Yu, Z.; Chiang, P. Temperature and nutrients are significant drivers of seasonal shift in phytoplankton community from a drinking water reservoir, subtropical China. Environ. Sci. Pollut. Res. 2014, 21, 5917–5928. [Google Scholar] [CrossRef] [PubMed]
  87. Rocha, C.; Galvão, H.; Barbosa, A. Role of transient silicon limitation in the development of cyanobacteria blooms in the Guadiana estuary, south-western Iberia. Mar. Ecol. Prog. Ser. 2002, 228, 35–45. [Google Scholar] [CrossRef] [Green Version]
  88. Hudnell, H.K.; Dortch, Q.; Zenick, H. An overview of the interagency, international symposium on cyanobacterial harmful algal blooms (ISOC-HAB): Advancing the scientific understanding of freshwater harmful algal blooms. In Cyanobacterial Harmful Algal Blooms: State of the Science and Research Needs; Springer: Berlin/Heidelberg, Germany, 2008; pp. 1–16. [Google Scholar]
  89. Heisler, J.; Glibert, P.M.; Burkholder, J.M.; Anderson, D.M.; Cochlan, W.; Dennison, W.C.; Dortch, Q.; Gobler, C.J.; Heil, C.A.; Humphries, E.; et al. Eutrophication and harmful algal blooms: A scientific consensus. Harmful Algae 2008, 8, 3–13. [Google Scholar] [CrossRef] [PubMed] [Green Version]
  90. Paerl, H.W.; Huisman, J. Climate change: A catalyst for global expansion of harmful cyanobacterial blooms. Environ. Microbiol. Rep. 2009, 1, 27–37. [Google Scholar] [CrossRef] [PubMed]
  91. Padedda, B.M.; Sechi, N.; Lai, G.G.; Mariani, M.A.; Pulina, S.; Sarria, M.; Satta, C.T.; Virdis, T.; Buscarinu, P.; Lugliè, A. Consequences of eutrophication in the management of water resources in Mediterranean reservoirs: A case study of Lake Cedrino (Sardinia, Italy). Glob. Ecol. Conserv. 2017, 12, 21–35. [Google Scholar] [CrossRef]
  92. Yang, J.; Gao, H.; Glibert, P.M.; Wang, Y.; Tong, M. Rates of nitrogen uptake by cyanobacterially-dominated assemblages in Lake Taihu, China, during late summer. Harmful Algae 2017, 65, 71–84. [Google Scholar] [CrossRef] [PubMed]
  93. Mariani, M.A.; Padedda, B.M.; Kaštovský, J.; Buscarinu, P.; Sechi, N.; Virdis, T.; Lugliè, A. Effects of trophic status on microcystin production and the dominance of cyanobacteria in the phytoplankton assemblage of Mediterranean reservoirs. Sci. Rep. 2015, 5, 17964. [Google Scholar] [CrossRef] [PubMed] [Green Version]
  94. Jacoby, J.M.; Collier, D.C.; Welch, E.B.; Hardy, F.J.; Crayton, M. Environmental factors associated with a toxic bloom of Microcystis aeruginosa. Can. J. Fish. Aquat. Sci. 2000, 57, 231–240. [Google Scholar] [CrossRef]
  95. Rapala, J.; Sivonen, K.; Lyra, C. Variation of Microcystins, Cyanobacterial Hepatotoxins, in Anabaena spp. as a Function of Growth Stimuli. Appl. Environ. Microbiol. 1997, 63, 2206–2212. [Google Scholar] [PubMed]
  96. Leonard, J.A.; Paerl, H.W. Zooplankton community structure, micro-zooplankton grazing impact, and seston energy content in the St. Johns river system, Florida as influenced by the toxic cyanobacterium Cylindrospermopsisraciborskii. Hydrobiologia 2005, 537, 89–97. [Google Scholar] [CrossRef]
  97. Davis, T.W.; Koch, F.; Marcoval, M.A.; Wilhelm, S.W.; Gobler, C.J. Mesozooplankton and microzooplankton grazing during cyanobacterial blooms in the western basin of Lake Erie. Harmful Algae 2012, 15, 26–35. [Google Scholar] [CrossRef]
  98. Landry, M.; Selph, K.; Yang, E.-J. Decoupled phytoplankton growth and microzooplankton grazing in the deep euphotic zone of the eastern equatorial Pacific. Mar. Ecol. Prog. Ser. 2011, 421, 13–24. [Google Scholar] [CrossRef] [Green Version]
  99. Calbet, A.; Saiz, E.; Almeda, R.; Movilla, J.I.; Alcaraz, M. Low microzooplankton grazing rates in the Arctic Ocean during a Phaeocystis pouchetii bloom (Summer 2007): Fact or artifact of the dilution technique? J. Plankton Res. 2011, 33, 687–701. [Google Scholar] [CrossRef]
  100. Calbet, A.; Saiz, E. Effects of trophic cascades in dilution grazing experiments: From artificial saturated feeding responses to positive slopes. J. Plankton Res. 2013, 35, 1183–1191. [Google Scholar] [CrossRef]
  101. Leitão, E.; Ger, K.A.; Panosso, R. Selective Grazing by a Tropical Copepod (Notodiaptomus iheringi) Facilitates Microcystis Dominance. Front. Microbiol. 2018, 9. [Google Scholar] [CrossRef] [PubMed] [Green Version]
  102. Li, Y.; Acharya, K.; Stone, M.C.; Yu, Z.; Young, M.H.; Shafer, D.S.; Zhu, J.; Gray, K.; Stone, A.; Fan, L.; et al. Spatiotemporal patterns in nutrient loads, nutrient concentrations, and algal biomass in Lake Taihu, China. Lake Reserv. Manag. 2011, 27, 298–309. [Google Scholar] [CrossRef] [Green Version]
  103. Kane, D.D.; Conroy, J.D.; Richards, R.P.; Baker, D.B.; Culver, D.A. Re-eutrophication of Lake Erie: Correlations between tributary nutrient loads and phytoplankton biomass. J. Gt. Lakes Res. 2014, 40, 496–501. [Google Scholar] [CrossRef]
  104. Reavie, E.D.; Cai, M.; Twiss, M.R.; Carrick, H.J.; Davis, T.W.; Johengen, T.H.; Gossiaux, D.; Smith, D.E.; Palladino, D.; Burtner, A.; et al. Winter–spring diatom production in Lake Erie is an important driver of summer hypoxia. J. Great Lakes Res. 2016, 42, 608–618. [Google Scholar] [CrossRef]
  105. McCarthy, M.J.; James, R.T.; Chen, Y.; East, T.L.; Gardner, W.S. Nutrient ratios and phytoplankton community structure in the large, shallow, eutrophic, subtropical Lakes Okeechobee (Florida, USA) and Taihu (China). Limnology 2009, 10, 215–227. [Google Scholar] [CrossRef]
  106. Schindler, D.W. Evolution of Phosphorus Limitation in Lakes. Sci. New Ser. 1977, 195, 260–262. [Google Scholar] [CrossRef] [PubMed]
  107. Schindler, D.W.; Hecky, R.E.; Findlay, D.L.; Stainton, M.P.; Parker, B.R.; Paterson, M.J.; Beaty, K.G.; Lyng, M.; Kasian, S.E.M. Eutrophication of lakes cannot be controlled by reducing nitrogen input: Results of a 37-year whole-ecosystem experiment. Proc. Natl. Acad. Sci. USA 2008, 105, 11254–11258. [Google Scholar] [CrossRef] [PubMed] [Green Version]
  108. Smith, V.H. Low Nitrogen to Phosphorus Ratios Favor Dominance by Blue-Green Algae in Lake Phytoplankton. Science 1983, 221, 669–671. [Google Scholar] [CrossRef] [PubMed]
  109. Elser, J.J.; Sterner, R.W.; Galford, A.E.; Chrzanowski, T.H.; Findlay, D.L.; Mills, K.H.; Paterson, M.J.; Stainton, M.P.; Schindler, D.W. Pelagic C:N:P Stoichiometry in a Eutrophied Lake: Responses to a Whole-Lake Food-Web Manipulation. Ecosystems 2000, 3, 293–307. [Google Scholar] [CrossRef]
  110. Bormans, M. Spatial and temporal variability in cyanobacterial populations controlled by physical processes. J. Plankton Res. 2004, 27, 61–70. [Google Scholar] [CrossRef] [Green Version]
  111. Davis, T.W.; Gobler, C.J. Grazing by mesozooplankton and microzooplankton on toxic and non-toxic strains of Microcystis in the Transquaking River, a tributary of Chesapeake Bay. J. Plankton Res. 2011, 33, 415–430. [Google Scholar] [CrossRef]
  112. Sterner, R.W. The Role of Grazers in Phytoplankton Succession. In Plankton Ecology; Brock/Springer Series in Contemporary Bioscience; Springer: Berlin/Heidelberg, Germany, 1989; pp. 107–170. ISBN 978-3-642-74892-9. [Google Scholar]
  113. Hambright, K.D.; Zohary, T.; Easton, J.; Azoulay, B.; Fishbein, T. Effects of zooplankton grazing and nutrients on the bloom-forming, N2-fixing cyanobacterium Aphanizomenon in Lake Kinneret. J. Plankton Res. 2001, 23, 165–174. [Google Scholar] [CrossRef]
  114. Smith, K.F.; Lester, P.J. Trophic interactions promote dominance by cyanobacteria (Anabaena spp.) in the pelagic zone of Lower Karori Reservoir, Wellington, New Zealand. N. Z. J. Mar. Freshw. Res. 2007, 41, 143–155. [Google Scholar] [CrossRef]
  115. Interagency Working Group on the Harmful Algal Bloom and Hypoxia Research and Control Act (IWG-HABHRCA). Harmful Algal Blooms and Hypoxia Comprehensive Research Plan and Action Strategy: An Interagency Report; US Office of Science and Technology Policy: Washington, DC, USA, 2016; p. 94. [Google Scholar]
  116. Du Plooy, S.J.; Carrasco, N.K.; Perissinotto, R. Effects of zooplankton grazing on the bloom-forming Cyanothece sp. in a subtropical estuarine lake. J. Plankton Res. 2017, 39, 826–835. [Google Scholar] [CrossRef]
  117. Goleski, J.A.; Koch, F.; Marcoval, M.A.; Wall, C.C.; Jochem, F.J.; Peterson, B.J.; Gobler, C.J. The Role of Zooplankton Grazing and Nutrient Loading in the Occurrence of Harmful Cyanobacterial Blooms in Florida Bay, USA. Estuar. Coasts 2010, 33, 1202–1215. [Google Scholar] [CrossRef]
  118. Buskey, E.J. How does eutrophication affect the role of grazers in harmful algal bloom dynamics? Harmful Algae 2008, 8, 152–157. [Google Scholar] [CrossRef]
  119. Elser, J.J. The pathway to noxious cyanobacteria blooms in lakes: The food web as the final turn. Freshw. Biol. 1999, 42, 537–543. [Google Scholar] [CrossRef]
  120. Paerl, H.W. Controlling harmful cyanobacterial blooms in a climatically more extreme world: Management options and research needs. J. Plankton Res. 2017, 39, 763–771. [Google Scholar] [CrossRef]
  121. Jeppesen, E.; Kronvang, B.; Olesen, J.E.; Audet, J.; Søndergaard, M.; Hoffmann, C.C.; Andersen, H.E.; Lauridsen, T.L.; Liboriussen, L.; Larsen, S.E.; et al. Climate change effects on nitrogen loading from cultivated catchments in Europe: Implications for nitrogen retention, ecological state of lakes and adaptation. Hydrobiologia 2011, 663, 1–21. [Google Scholar] [CrossRef]
  122. Cooke, G.D.; Welch, E.B.; Peterson, S.; Nichols, S.A. Restoration and Management of Lakes and Reservoirs, 3rd ed.; CRC Press: Bocaton, FL, USA, 2016; ISBN 978-1-4200-3210-9. [Google Scholar]
  123. Jeppesen, E.; Søndergaard, M.; Lauridsen, T.L.; Davidson, T.A.; Liu, Z.; Mazzeo, N.; Trochine, C.; Özkan, K.; Jensen, H.S.; Trolle, D.; et al. Biomanipulation as a Restoration Tool to Combat Eutrophication. In Advances in Ecological Research; Elsevier: New York, NY, USA, 2012; Volume 47, pp. 411–488. ISBN 978-0-12-398315-2. [Google Scholar]
Figure 1. Map of Vancouver Lake located in the city of Vancouver, WA, USA. The Columbia River is the boundary between the states of Washington (north) and Oregon (south). The river is also the boundary between the city of Vancouver, WA and the city of Portland, OR. Star indicates sampling location.
Water 10 00757 g001
Figure 2. Timeline and frequency of field sampling and plankton growth and grazing experiments conducted in Vancouver Lake, 2005–2013. Dilution = microzooplankton grazing; Incubation = mesozooplankton feeding; Interaction = mesozooplankton feeding x orthophosphate enrichment.
Water 10 00757 g002
Figure 3. Water quality measurements in Vancouver Lake from October 2005 to October 2013. (a) water depth and Secchi depth; (b) temperature and dissolved oxygen (DO) concentrations; (c) NH4-N and NO3-N concentrations; (d) SiO4-Si concentrations; (e) PO4-P concentrations; (f) chlorophyll a concentrations and DIN:DIP. Data from [49,62] and G. Rollwagen-Bollens et al. (unpublished).
Water 10 00757 g003
Figure 4. Taxonomic composition of microplankton sampled from Vancouver Lake from January 2007 to December 2010. (a) Total carbon biomass of major taxonomic categories of microplankton; (b) Relative biomass of each microplankton category. Data from [61], and used with permission.
Water 10 00757 g004
Figure 5. Taxonomic composition of cyanobacteria genera sampled from Vancouver Lake from January 2007 to December 2010. (a) Total carbon biomass of each cyanobacterial genus; (b) relative biomass of each cyanobacterial genus. Data from [62] and G. Rollwagen-Bollens et al. (unpublished).
Water 10 00757 g005
Figure 6. Density of major taxonomic categories of mesozooplankton sampled from Vancouver Lake from October 2005 to October 2011. Abundances are shown for (a) cladocerans; (b) cyclopoid copepods; (c) calanid copepods; and (d) rotifers. Data from [62].
Water 10 00757 g006
Figure 7. Seasonal succession of phytoplankton and mesozooplankton assemblage clusters identified from samples collected in Vancouver Lake between February 2007 and November 2010. Data from [61,62].
Water 10 00757 g007
Figure 8. Results of NMDS ordinations examining relationships between environmental variables and (a) phytoplankton and (b) mesozooplankton assemblage clusters observed in Vancouver Lake from 2007–2010. Each point represents a specific sampling date and each symbol represents a cluster group. The distance between points represents the amount of similarity or dissimilarity in phytoplankton assemblage composition. Vectors are environmental variables associated with each cluster. Data and figures from [61,62], and used with permission.
Water 10 00757 g008
Figure 9. Intrinsic phytoplankton growth rates (blue) and microzooplankton grazing rates (red) determined from dilution experiments conducted in Vancouver Lake from March 2008 to November 2009. Green area represents mean chl a concentration measured on the date of each experiment. Data from [71] and G. Rollwagen-Bollens et al. (unpublished).
Water 10 00757 g009
Figure 10. Microzooplankton grazing impact (blue bars), measured as the % of phytoplankton standing stock consumed per day, determined from dilution experiments conducted in Vancouver Lake from February 2008 to November 2009. Green area represents chl a concentration over the same period. Data from G. Rollwagen-Bollens et al. (unpublished).
Water 10 00757 g010
Figure 11. Clearance rates of Acanthocyclops robustus adult female copepods feeding on natural assemblages of plankton collected from Vancouver Lake before (June/July), during (August/September), and after (October) cyanobacterial blooms in (a) 2008 and (b) 2009. Error bars represent one standard error. ANOVA results: * = p < 0.05; *** = p < 0.001. Data from [46].
Water 10 00757 g011
Figure 12. Copepod grazing impact, measured as % of prey population biomass consumed per day by adult female Acanthocyclops robustus, determined from incubation experiments conducted in Vancouver Lake on three dates in (a) 2008 and (b) 2009. Data from [46].
Water 10 00757 g012
Figure 13. Mean (±SE) net growth rate (day−1) of phytoplankton biomass in the controls and three treatments from each of five experiments conducted over the 2013 bloom cycle (upper panel) [asterisks indicate significance of the treatments ‘copepods,’ ‘nutrients,’ and ‘copepods & nutrients,’ as analyzed by two-way ANOVA: p < 0.05 (*), p < 0.01 (**), and p < 0.001 (***)]. Chl a concentrations measured bi-weekly from June-October 2013 (lower panel). Data from [49].
Water 10 00757 g013
Figure 14. Conceptual diagram illustrating the interactive effects of food web interactions, trophic cascades, and changes in nutrient availability on the timing of cyanobacterial bloom initiation and decline in Vancouver Lake. Gray shading indicates the food web components with the strongest impact; wide arrows indicate high relative consumption or uptake rates; and enlarged diagrams or letters indicate high relative abundance or concentration.
Water 10 00757 g014

