Article

Application of Microbial Technology Used in Bioremediation of Urban Polluted River: A Case Study of Chengnan River, China

1
College of Hydrology and Water Resources, Hohai University, Nanjing 210098, China
2
National Engineering Research Center of Water Resources Efficient Utilization and Engineering Safety, Nanjing 210098, China
3
Department of Agricultural Engineering, Muhammad Nawaz Shareeef University of Agriculture, Multan 6000, Pakistan
4
School of Water Conservancy and Electric Power, Hebei University of Engineering, Handan 056038, China
*
Author to whom correspondence should be addressed.
Water 2018, 10(5), 643; https://doi.org/10.3390/w10050643
Submission received: 13 April 2018 / Revised: 10 May 2018 / Accepted: 13 May 2018 / Published: 16 May 2018
(This article belongs to the Section Water Quality and Contamination)

Abstract

:
Contrary to the constraints in time, investment, and management of the traditional technology for waste water treatment, this paper seeks to propose a more advanced, reliable, and affordable new technology to restore urban polluted rivers to pristine quality levels. The paper also presents new ideas on the selection and use of microbial agents to improve the efficiency of pollution removal. It presents the successful implementation of microbial technology (MT) on Chengnan River, which was heavily polluted before MT implementation. Without artificial aeration, sediment dredging, or complete sewage interception, we directly sprayed a previously configured HP-RPe-3 Microbial Agent into the water body and sediment. We considered the feasibility of MT for treating polluted urban rivers from the perspective of several water quality indices evaluation methods. After the treatment, the concentration of dissolved oxygen (DO) reached 5.0 mg/L, the removal rates of ammonia nitrogen (NH3-N) and chemical oxygen demand (COD) reached 20% and 38% respectively, and the average degradation rate of total phosphorus (TP) along river was close to 15%. Also, the Nemerow Index of the river was reduced from 2.7 to 1.9. The Fuzzy Comprehensive Index shows a tendency for improvement from Inferior Grade V to a better grade (approximately Grade III). The color of the river water changed, from black or dark green, to its original color. The results indicate that the bioremediation technology of directly adding microbial agents mainly aimed for the degradation of NH3-N can preliminarily eliminate the black-odor phenomenon of urban rivers, and improve their water quality. It is expected that the MT application, and the concept of how to select the corresponding microbial agents according to main pollutants, can be widely accepted and applied to similar cases.

1. Introduction

According to the United Nations Educational Scientific and Cultural Organization (UNESCO), water covers 72% of the earth surface; however, freshwater only accounts for 0.5% of all the water resources [1]. Despite the vast in quantity of water on earth, the portion which can be directly used is very small. In the 21st century, water is becoming a precious scarce resource. Problems with water resources are not only a problem of resources; they are also a major strategic issue related to the sustainable development of a country’s economy, society, and long-term stability [2,3,4]. With the global population explosion and rapid economic development, the demand for industrial water, agricultural water, and domestic water has increased rapidly, and the shortage of fresh water is becoming more and more serious [5,6]. At the same time, the deterioration of water quality is exacerbating the shortage of water resources. Indeed, quality-induced water shortages have recently been a matter of great concern at local, regional, and global levels, especially in developing countries [5,7,8]. Therefore, water resources protection and rational utilization, and the efficient restoration of polluted water, have become majors focuses of the world.
In China, freshwater resources total 2.8 trillion m3, or 6% of the global water, placing China 6th in the world, next to Brazil, Russia, Canada, USA and Indonesia. However, China’s per capita water resources only stand at 2100 m3, 28% of the world average, making China one of the most water scarce countries in the world [9]. Meanwhile, the deterioration of the aquatic environment has become more and more serious due to accelerated economic growth [10]. An increasing number of rivers and lakes have been under great threat of contamination, mainly due to the discharge of untreated wastewater, including industrial wastewater, agricultural pollution, domestic sewage, and the fragmentation of aquatic ecosystems [11,12]. A glance at the China Water Resources Bulletin published by the Ministry of Water Resources over the past twenty years from 1997 to 2016 showed that the proportion of the total river length in Inferior Grade V is first rising to 21.8%, and then gradually falling; it has been reduced by half in the past ten years. It has achieved tremendous improvements, but the proportion is still high, remaining at nearly 10% in 2016; the river pollution problem is still serious [13]. In 2016, rivers with a combined length of 235,000 km nationwide were monitored and assessed for their water quality. The findings indicated that, in terms of water quality, 76.9% of the total river length fell in Grade I-III, and the rest (23.1%) in Grade IV or below. For the whole year of 2016, water function zones achieved a water quality compliance rate of 58.7%, and provincial sections with Grade I-III water quality took up 67.1% of the total assessed sections [14]. All the above data indicate that water pollution control in China has made certain achievements, but the current situation of severe water pollution still cannot be ignored. The main causes of serious pollution in urban rivers are large sewage discharges and concentrations of pollution sources with the characteristics of slow velocity and small flow [15,16]. The deterioration of water quality makes the river body black and smelly, and the aquatic life around has trouble surviving, causing serious consequences on the lives of the residents on both sides of the rivers [12]. Therefore, finding ways to restore these heavily polluted rivers to relieve water pressure is essential in the present scenario.
There have been three kinds of methods to restore the water quality of polluted rivers at home and abroad. The first comprises physical methods, including artificial aeration [17,18], sediment dredging [19], water diversion [20], and mechanical algae removal [21], which are basic and traditional methods which take a lot of human, material, and financial resources, as well as time. They basically focus on treating symptoms but ignore the root causes of the pollution to some degree. Therefore, pollutants are not removed from the water body efficiently. The second approach comprises chemical methods [22,23], including chemical oxidation, enhanced flocculation, chemical precipitation, and chemical algae removal [24]. These methods are aimed at removing target pollutants, such as suspended solids and dissolved phosphorus and nitrogen, and improve the transparency of water. This process may need the aid of a large number of chemical agents, including coagulants such as iron and aluminum salts, oxidizing agents such as hydrogen peroxide, and precipitants such as lime, etc. Using these methods, there is no need for long-term maintenance. They are also applicable for emergency treatment. However, it is inevitable that secondary pollution is produced; thus, hidden dangers for the ecosystem remain [25]. The third approach comprises biological-ecological methods [26,27,28], including plant purification technology [29], microbial technology [30,31,32,33], biofilm technology, artificial wetland technology [34], and combinatorial biotechnology [35,36,37], which are all environmentally-friendly and aimed at enhancing the self-purification capacity of the river, and restoring its ecosystem. However, these methods still can be improved. For example, biofilm technology, artificial wetland technology, and combinatorial biotechnology are all effective, but the costs of implementation of such technology are high. We need to overcome technical difficulties and reduce costs in the future.
Among all the methods introduced above, microbial technology stands out for its advantages: high efficient degradation ability, low energy consumption, no secondary pollution, simple technical operation, long-term viability, and absence of need for additional constructions. It has been widely and successfully implemented for various purposes in many countries. The field treatment, carried by Sheng Yanqing, etc., showed that adding two kinds of microbial agents into heavily polluted tidal river could efficiently improve water quality where the removal rates of pollutants such as COD and BOD could reach 70% with the help of engineering initiatives [38]. Liu Junzhuo, etc. summarized attached microalgae-bacteria consortium for advanced nutrient removal from surface water [39]. The author in this research presented and reviewed the application of photosynthetic bacteria in bioremediation, which was confirmed to have both environmental and economic benefits, while expressing his concerns on the choice of easily grown, viable, and effective naturally occurring microorganisms a cleaning agents when applied to other cases [40]. All the treatments listed above demonstrate that microbial technology is indeed an effective and promising method for controlling river pollution, especially when combined with other measures. However, there are few studies on the field applications of microbial technology.
In view of the discussion above, this paper selects the heavily polluted Chengnan River as the object of research, whose management target is to promote water quality by directly adding into the river the microbial agents that were independently developed for specific pollutants, in order to verify whether the new ideas on the selection are suitable. Based on the governance concept, we first make a comprehensive diagnosis of the Chengnan River from several aspects, such as appearance, smell, monitoring data analysis, etc. The results show that the river is heavily polluted, with a black color and bad smell, most probably because the concentration of ammonia nitrogen seriously exceeds the standard. Then we selected the HP-RPe-3 compound microbial agent, designed for degradation of ammonia nitrogen, nitrate, and nitrite, as the main therapeutic reagent in this research. This agent was chosen from among all microbial agents which are produced for different purposes in our laboratory, such as HP-RPeII for the removal of COD and effective degradation of cellulose, HP-RPeIII for the effective removal of TP and etc. This paper proposes the new idea that applying MT with the selection of corresponding agents under the guidance of traditional Chinese medicine concepts for heavily polluted rivers, and preliminarily verifying its feasibility by practical application and corresponding analysis and evaluation. The findings are replicable for other urban polluted rivers in China and around the world.

2. Materials and Methods
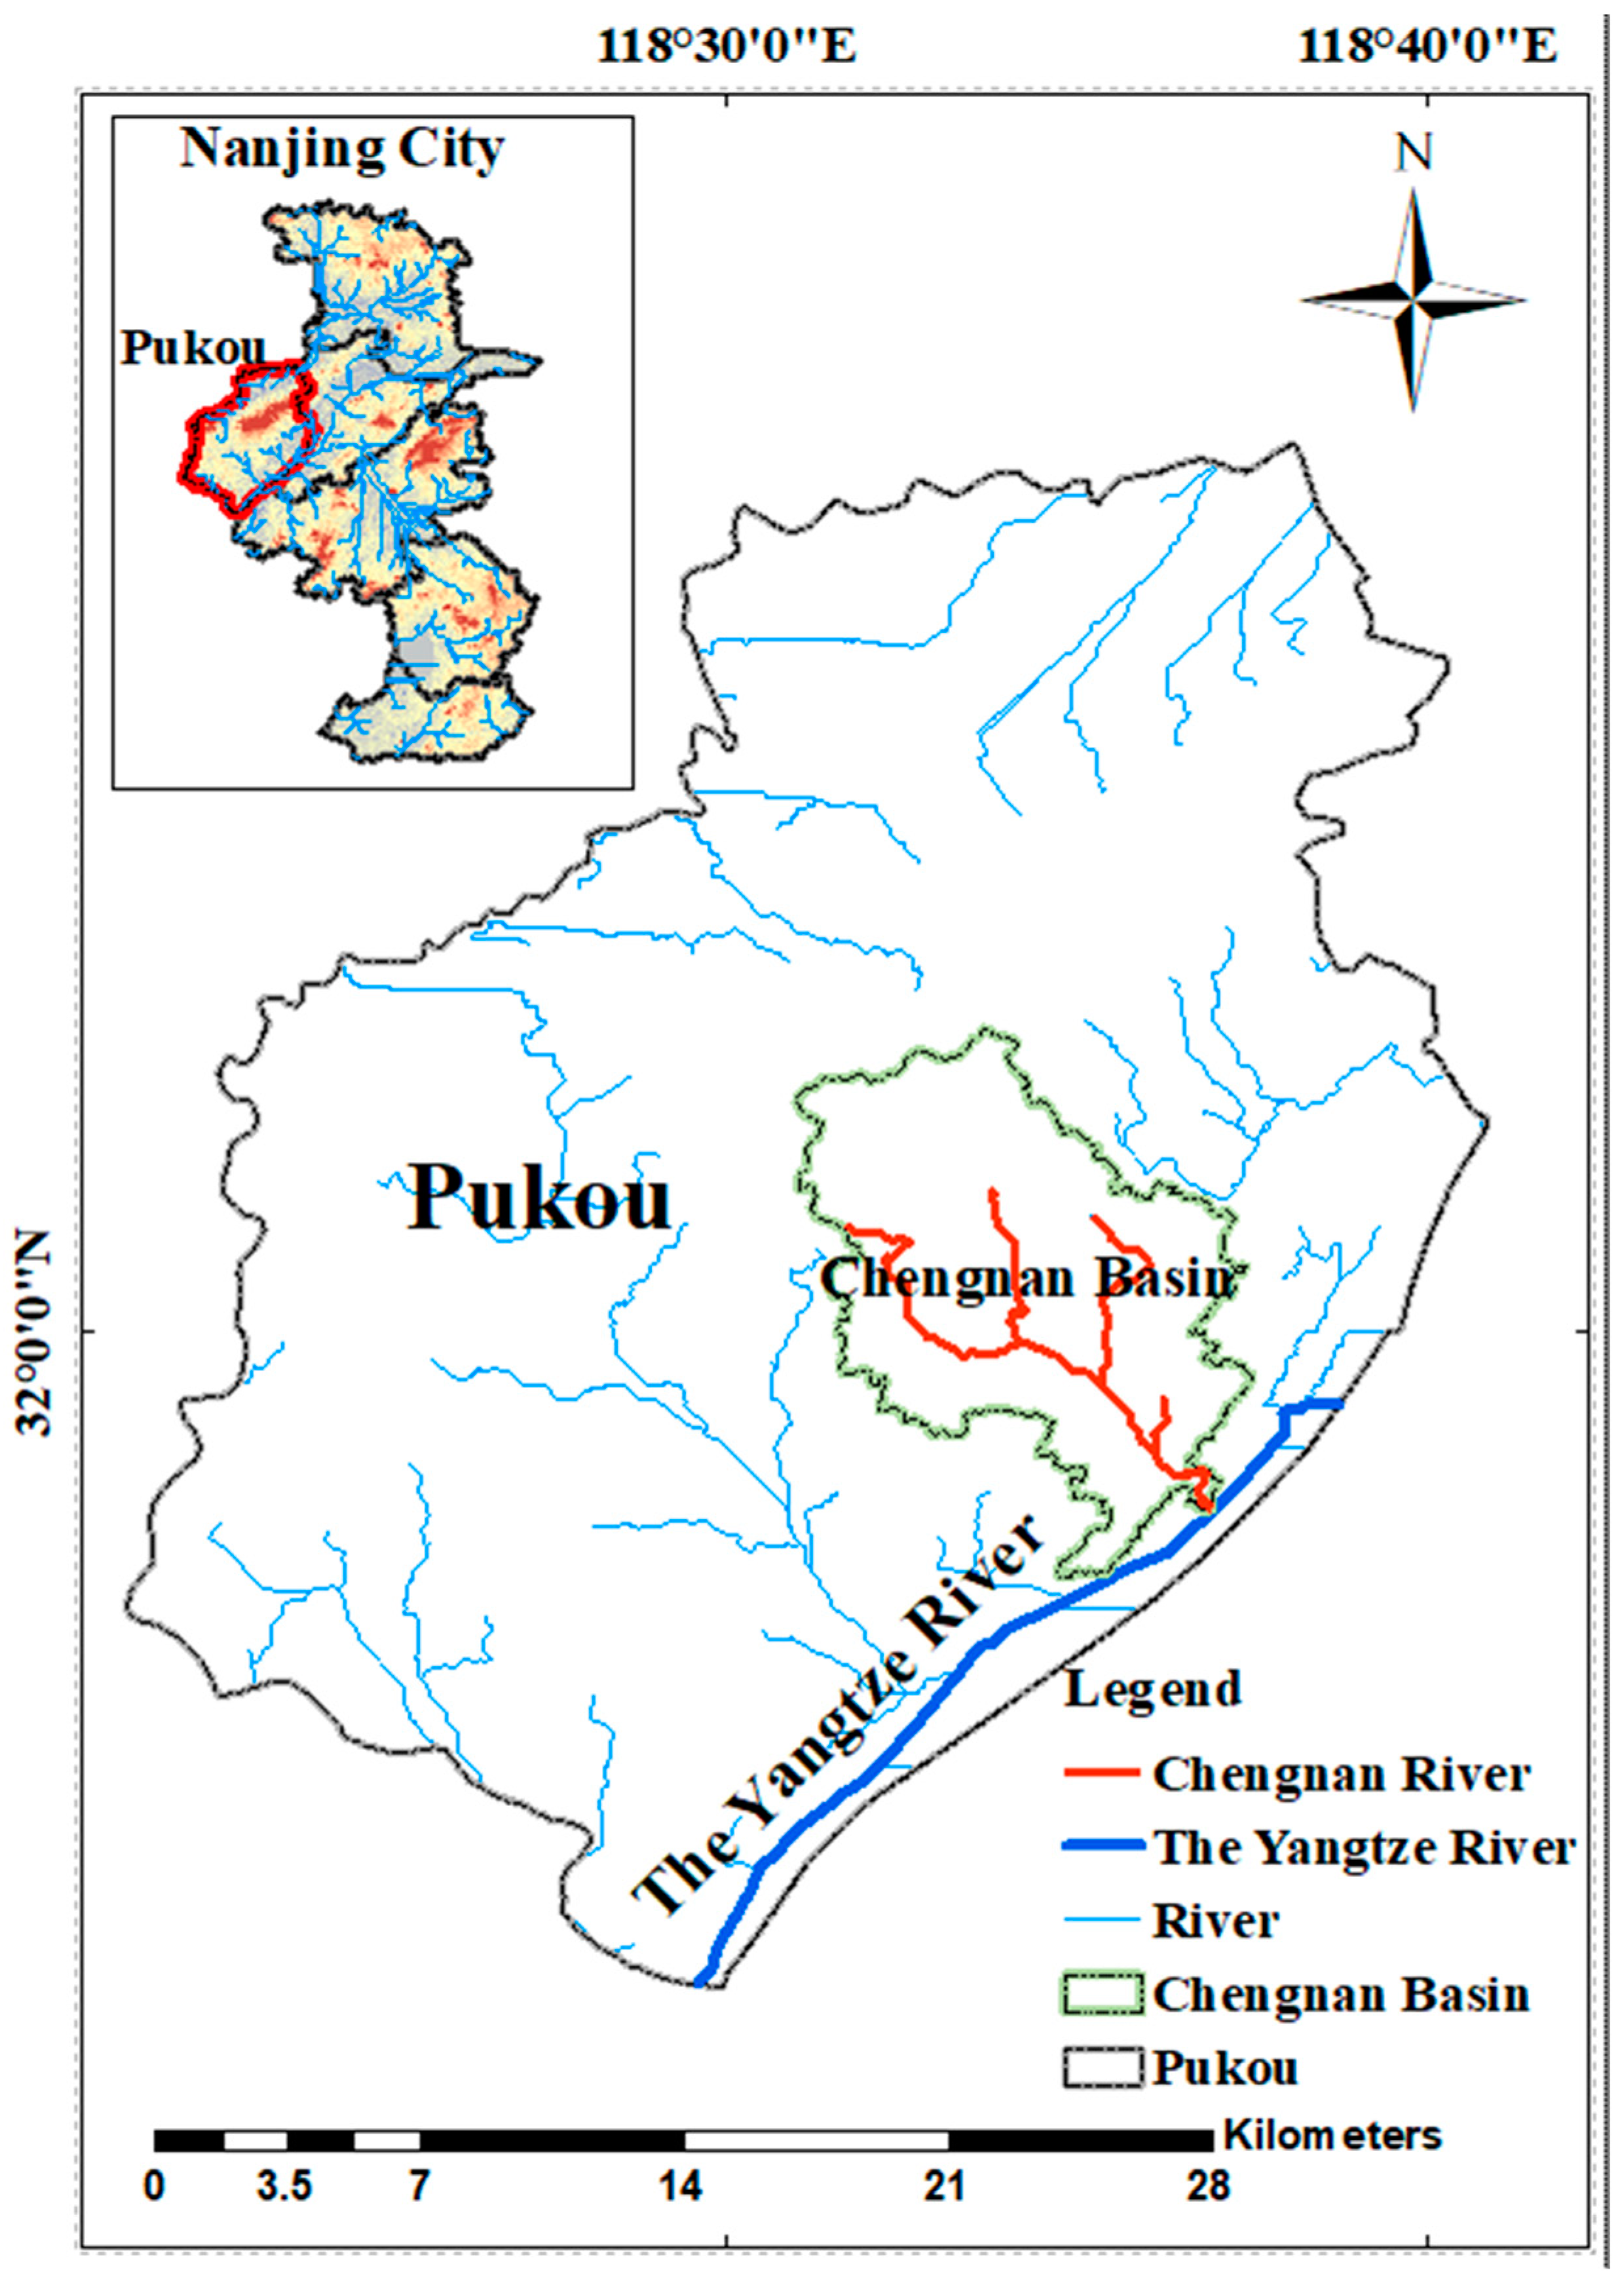
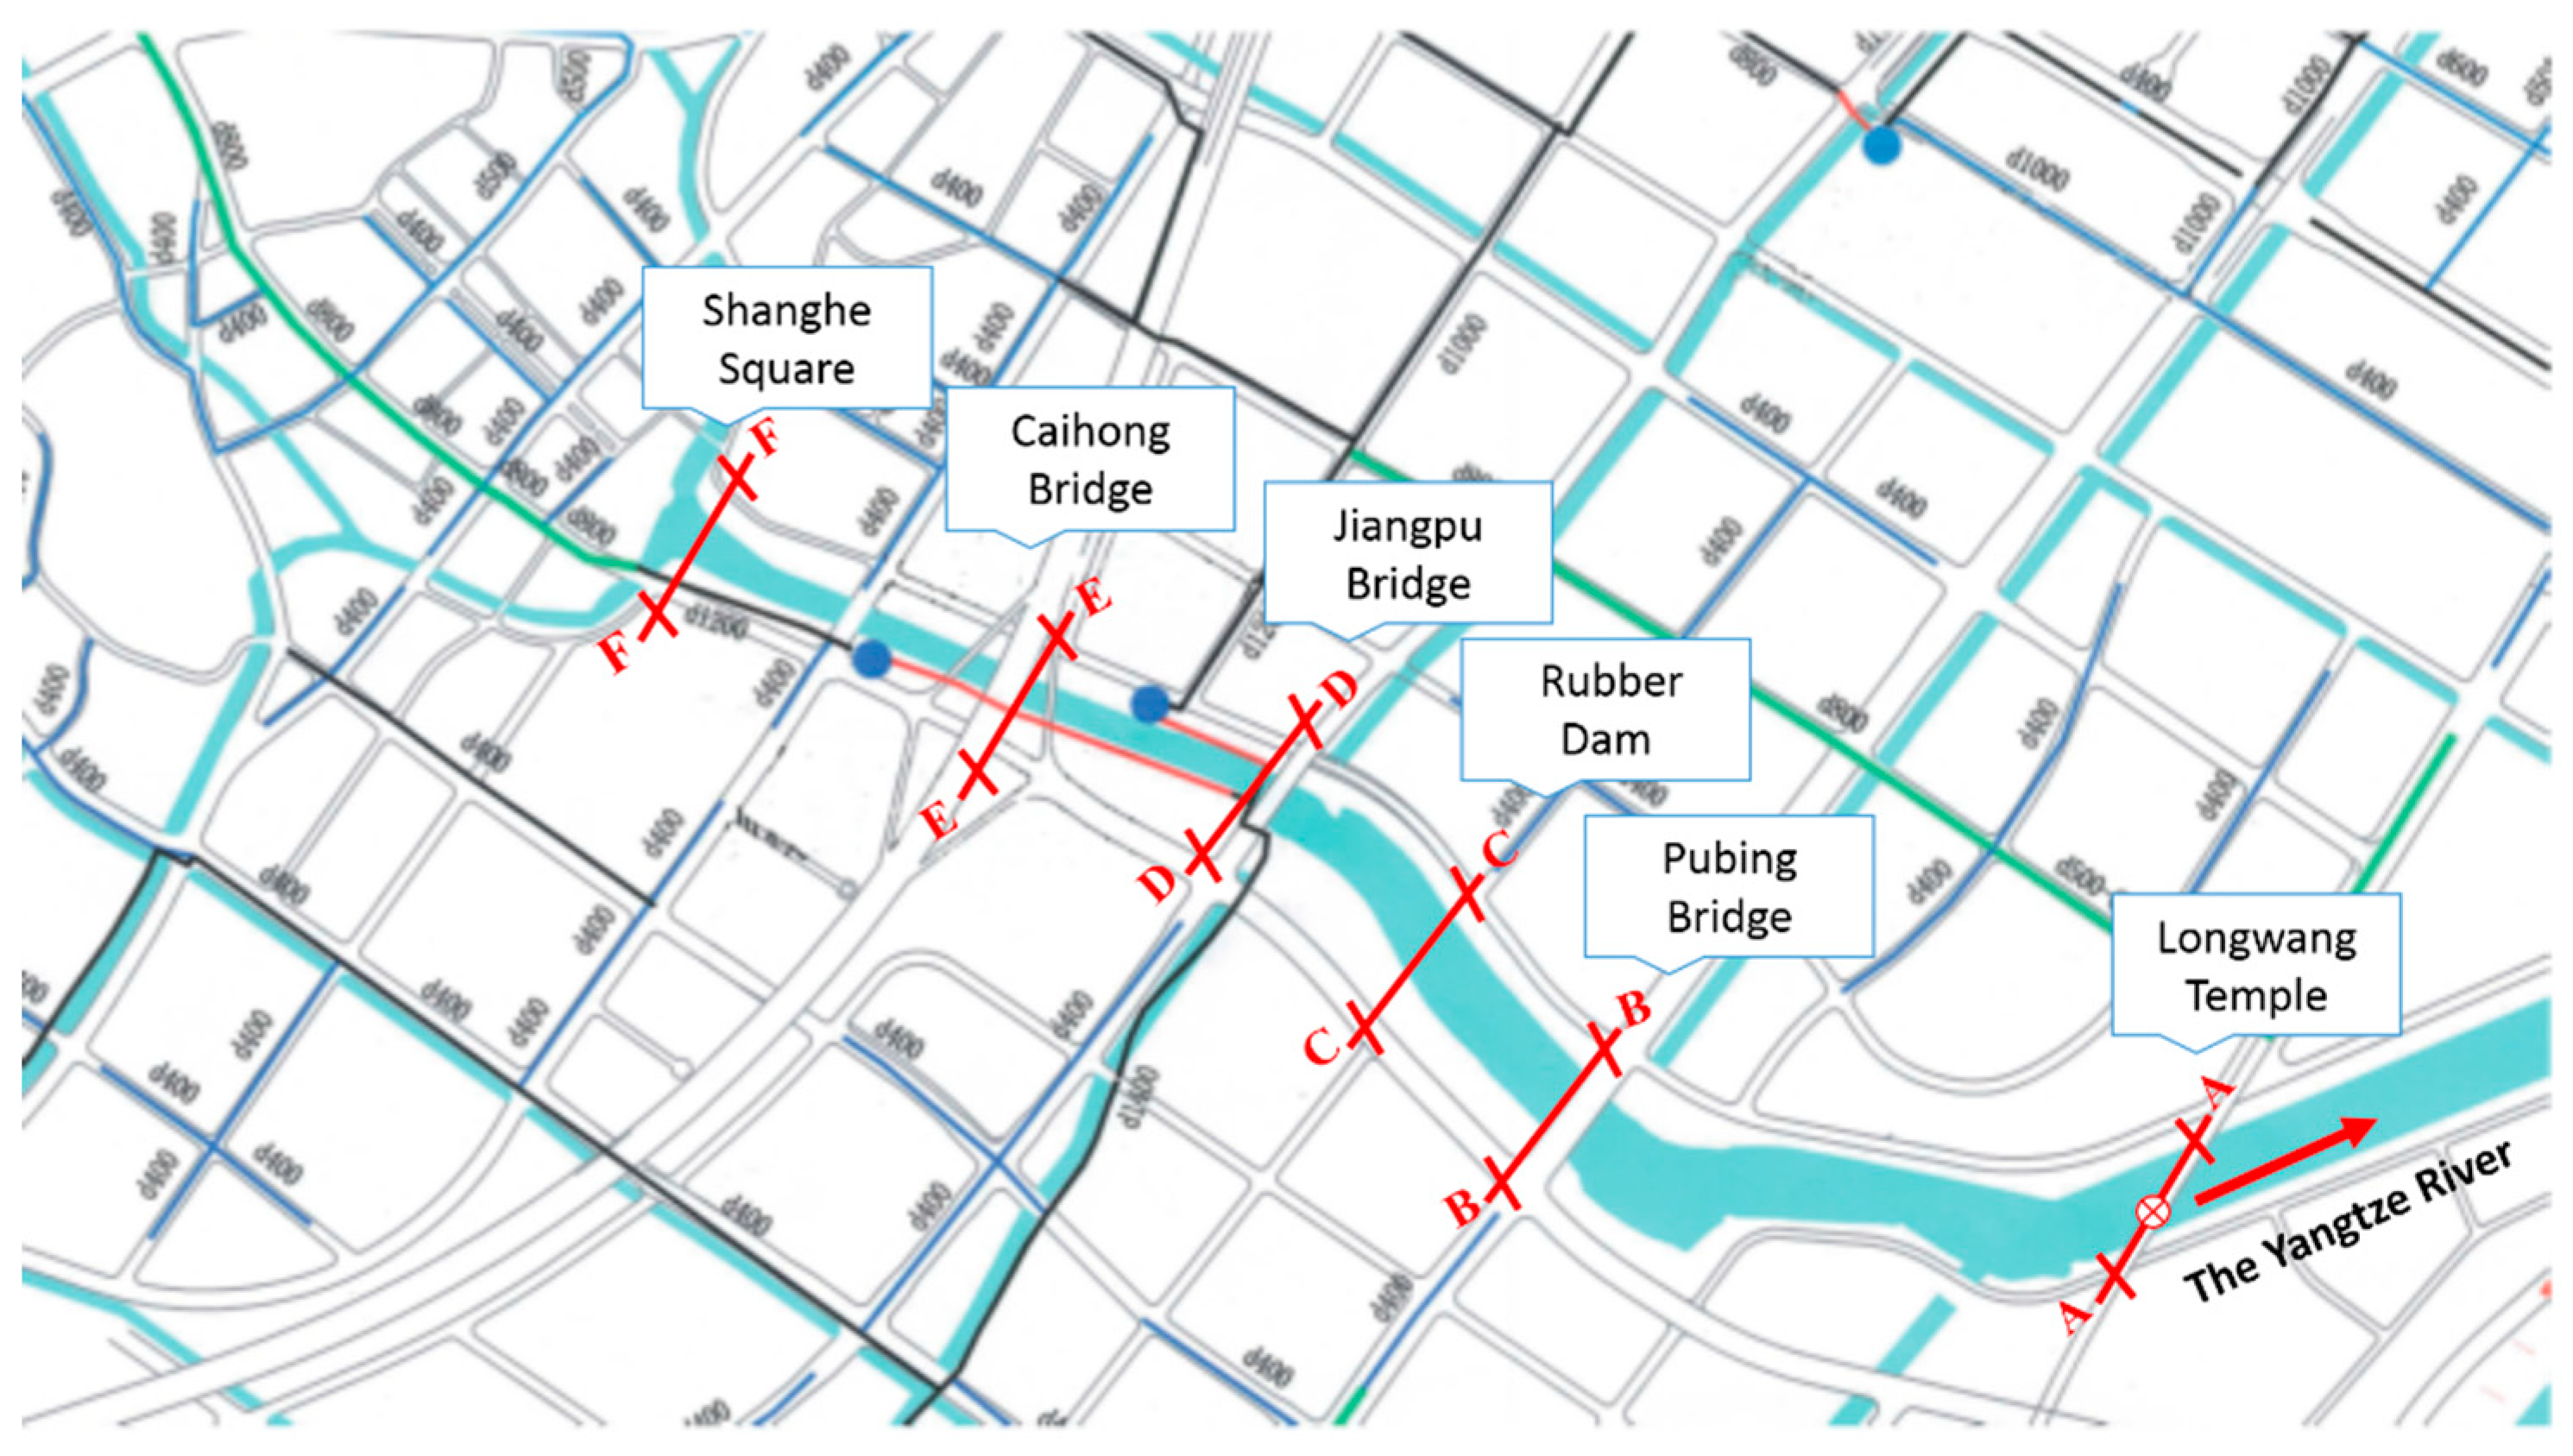
2.1. Study Area

Chengnan River is an urban river located in Pukou District, northwest of Nanjing City, Jiangsu Province, China. The total length of the river is about 12 km, and it has a catchment area of 62.8 km2 (Figure 1). The upstream West Branch water supplement channel is from Yushan Road to Wende Road, and the upstream East Branch water supplement channel is from the Xiangshan reservoir to Yanshan Road. These two tributaries converge into the main channel Chengnan River at Shanghe Square, which then winds its way to Yangtze River. The river shows a Y- shaped. A schematic map of the Chengnan River position is shown in Figure 1. The Pukou District is in the transition zone between the north subtropical zone and the warm temperate zone, with high temperatures and rainy seasons in sync. The Meiyu period, which lasts about 20 days at the beginning of summer, is the main precipitation period. The area has abundant rainfall and four distinct seasons. The annual average sunshine is 1987 h, the annual average temperature is 15.4 °C, and the annual total precipitation is 1149.8 mm.
The Chengnan River runs through the main city of Pukou District. Along the river, there are: 1 flood discharge trench, 3 drainage drains, 8 public toilets, 9 drainage pumping stations, and more than 100 sewage outlets. The population is concentrated, and the building density is high. Streams have always been the recipient of waste related to of human activities [41]. Most of the sewage and production wastes from the residential areas, schools, toilets, and three production services are directly discharged into the river. In particular, in the non-flood season, the upland water of Chengnan River is very small; thus, its fluidity is relatively low. As a result, pollutants cannot be washed away and are always deposited. With an increasing number of sewage discharged continuously and sludge precipitated, the river becomes black and malodorous, the water quality shows an increasing trend of deterioration, and its ecosystem has been seriously damaged.
The Chengnan River may be taken as representative case for urban polluted rivers which are in the Inferior Grade V (Table 1), and whose concentration values of NH3-N, TP and COD frequently exceed 2.0, 0.4 and 40 mg/L respectively; these are the standard limited values of water quality grade V for potable water sources, according to China Environmental Quality Standards for Surface Water (GB3838-2002) (Table 2). This means that the water is extremely unsuitable for any purpose, and is in dire need of treatment.

2.2. Main Microbial Agent

2.2.1. HP-RPe-3 Microbial Agent

The HP-RPe-3 compound microbial agent (National patent number: 2017114193785) is a kind of indigenous microorganism agent which is composed of bacillus, micrococcus, photosynthetic bacteria, nitrifying bacteria, denitrifying bacteria, lactic acid bacteria, yeasts, enzymes, bacterium pseudoanthracis, actinomycetes, acetobacter, and other 100 kinds of microorganisms which are all selected from nature and are prepared by domestication technology and unique enzyme treatment technology in the laboratory. In this research, we select the parent microbial agent taken from the place above the Tibetan Plateau snow line (altitude 4650 m), with the characteristics of extreme cold resistance, high enzyme activity, high value of target metabolite, phage resistant ability, and short training cycles, and then screen, domesticate, and cultivate them again. The maximum density of living bacteria of the HP-RPe-3 microbial agent can reach up to 2.1 × 10⁸/mL, which has strong adaptability to polluted water in different regions of China, and whose use can therefore be popularized. The HP-RPe-3 microbial agent can efficiently degrade and absorb ammonia nitrogen, nitrite, and nitrate, and improve the efficiency of nitrification and denitrification and maintain the long-term stability of the nitrification system. Depending on the propagation of the HP-RPe-3 microbial agent, degradation of NH3-N organic matter in water and sediment was rendering organic matter, inorganic, and toxic substances harmless, so as to achieve the purpose of degradation and reduction of NH3-N. More surprising that this is the fact that this compound is removes ammonia nitrogen, and also has a comprehensive effect on other parameters of water quality, such as TP and COD. The result of its toxicity test shows that the HP-RPe-3 microbial agent does no harm to human beings.

2.2.2. Microbial Accelerating Agent

A microbial accelerating agent is made up of a variety of enzymes, vitamins, amino acids, trace elements, and humic acid, in a specialized proportion which can provide nutrients to microorganisms to effectively stimulate and accelerate natural biological reactions. In this regard, it would stimulate the activity of indigenous microorganisms to promote the proliferation of effective microorganisms, such as aerobiotic and faculative aerobic bacteria, while inhibiting the metabolism of harmful microorganisms and the anaerobic decomposition of pollutants. At the same time, it remains harmless to plankton and the environment [42].

2.3. Methods

Water is the source of life, the key of production, and the foundation of ecology. Rivers nurture civilization, but at present, many small and medium rivers are suffering different degrees of pollution. With the release of the “Water Pollution Control Action Plan” or “Water Ten Item”, the state has invested vast sums in dealing with polluted rivers. The goal is to eliminate black and odorous rivers by 2020. The general idea of the government in this research is as follows (Figure 2).
According to field investigation and background values of the river, the main cause of water quality deterioration is domestic pollution; addistionally, obviously the ammonia nitrogen index seriously exceeds standards. Besides, considering its relatively low fluidity, the Chengnan River is suitable for treatment with microbial remediation technology. So, HP-RPe-3 microbial agents were specially prepared for the Chengnan River; they were inoculated into the river directly, without any other supporting measures. Finally, we need to continuously monitor water quality, and record and analyze the changes of several main water quality indexes in order to master the treatment effects of the bacteria, and determine whether we need to add HP-RPe-3 microbial agents or inoculate for other kinds of microbial agents for better treatment. In this research, we exclusively used the HP-RPe-3 microbial agents to achieve the treatment goals.

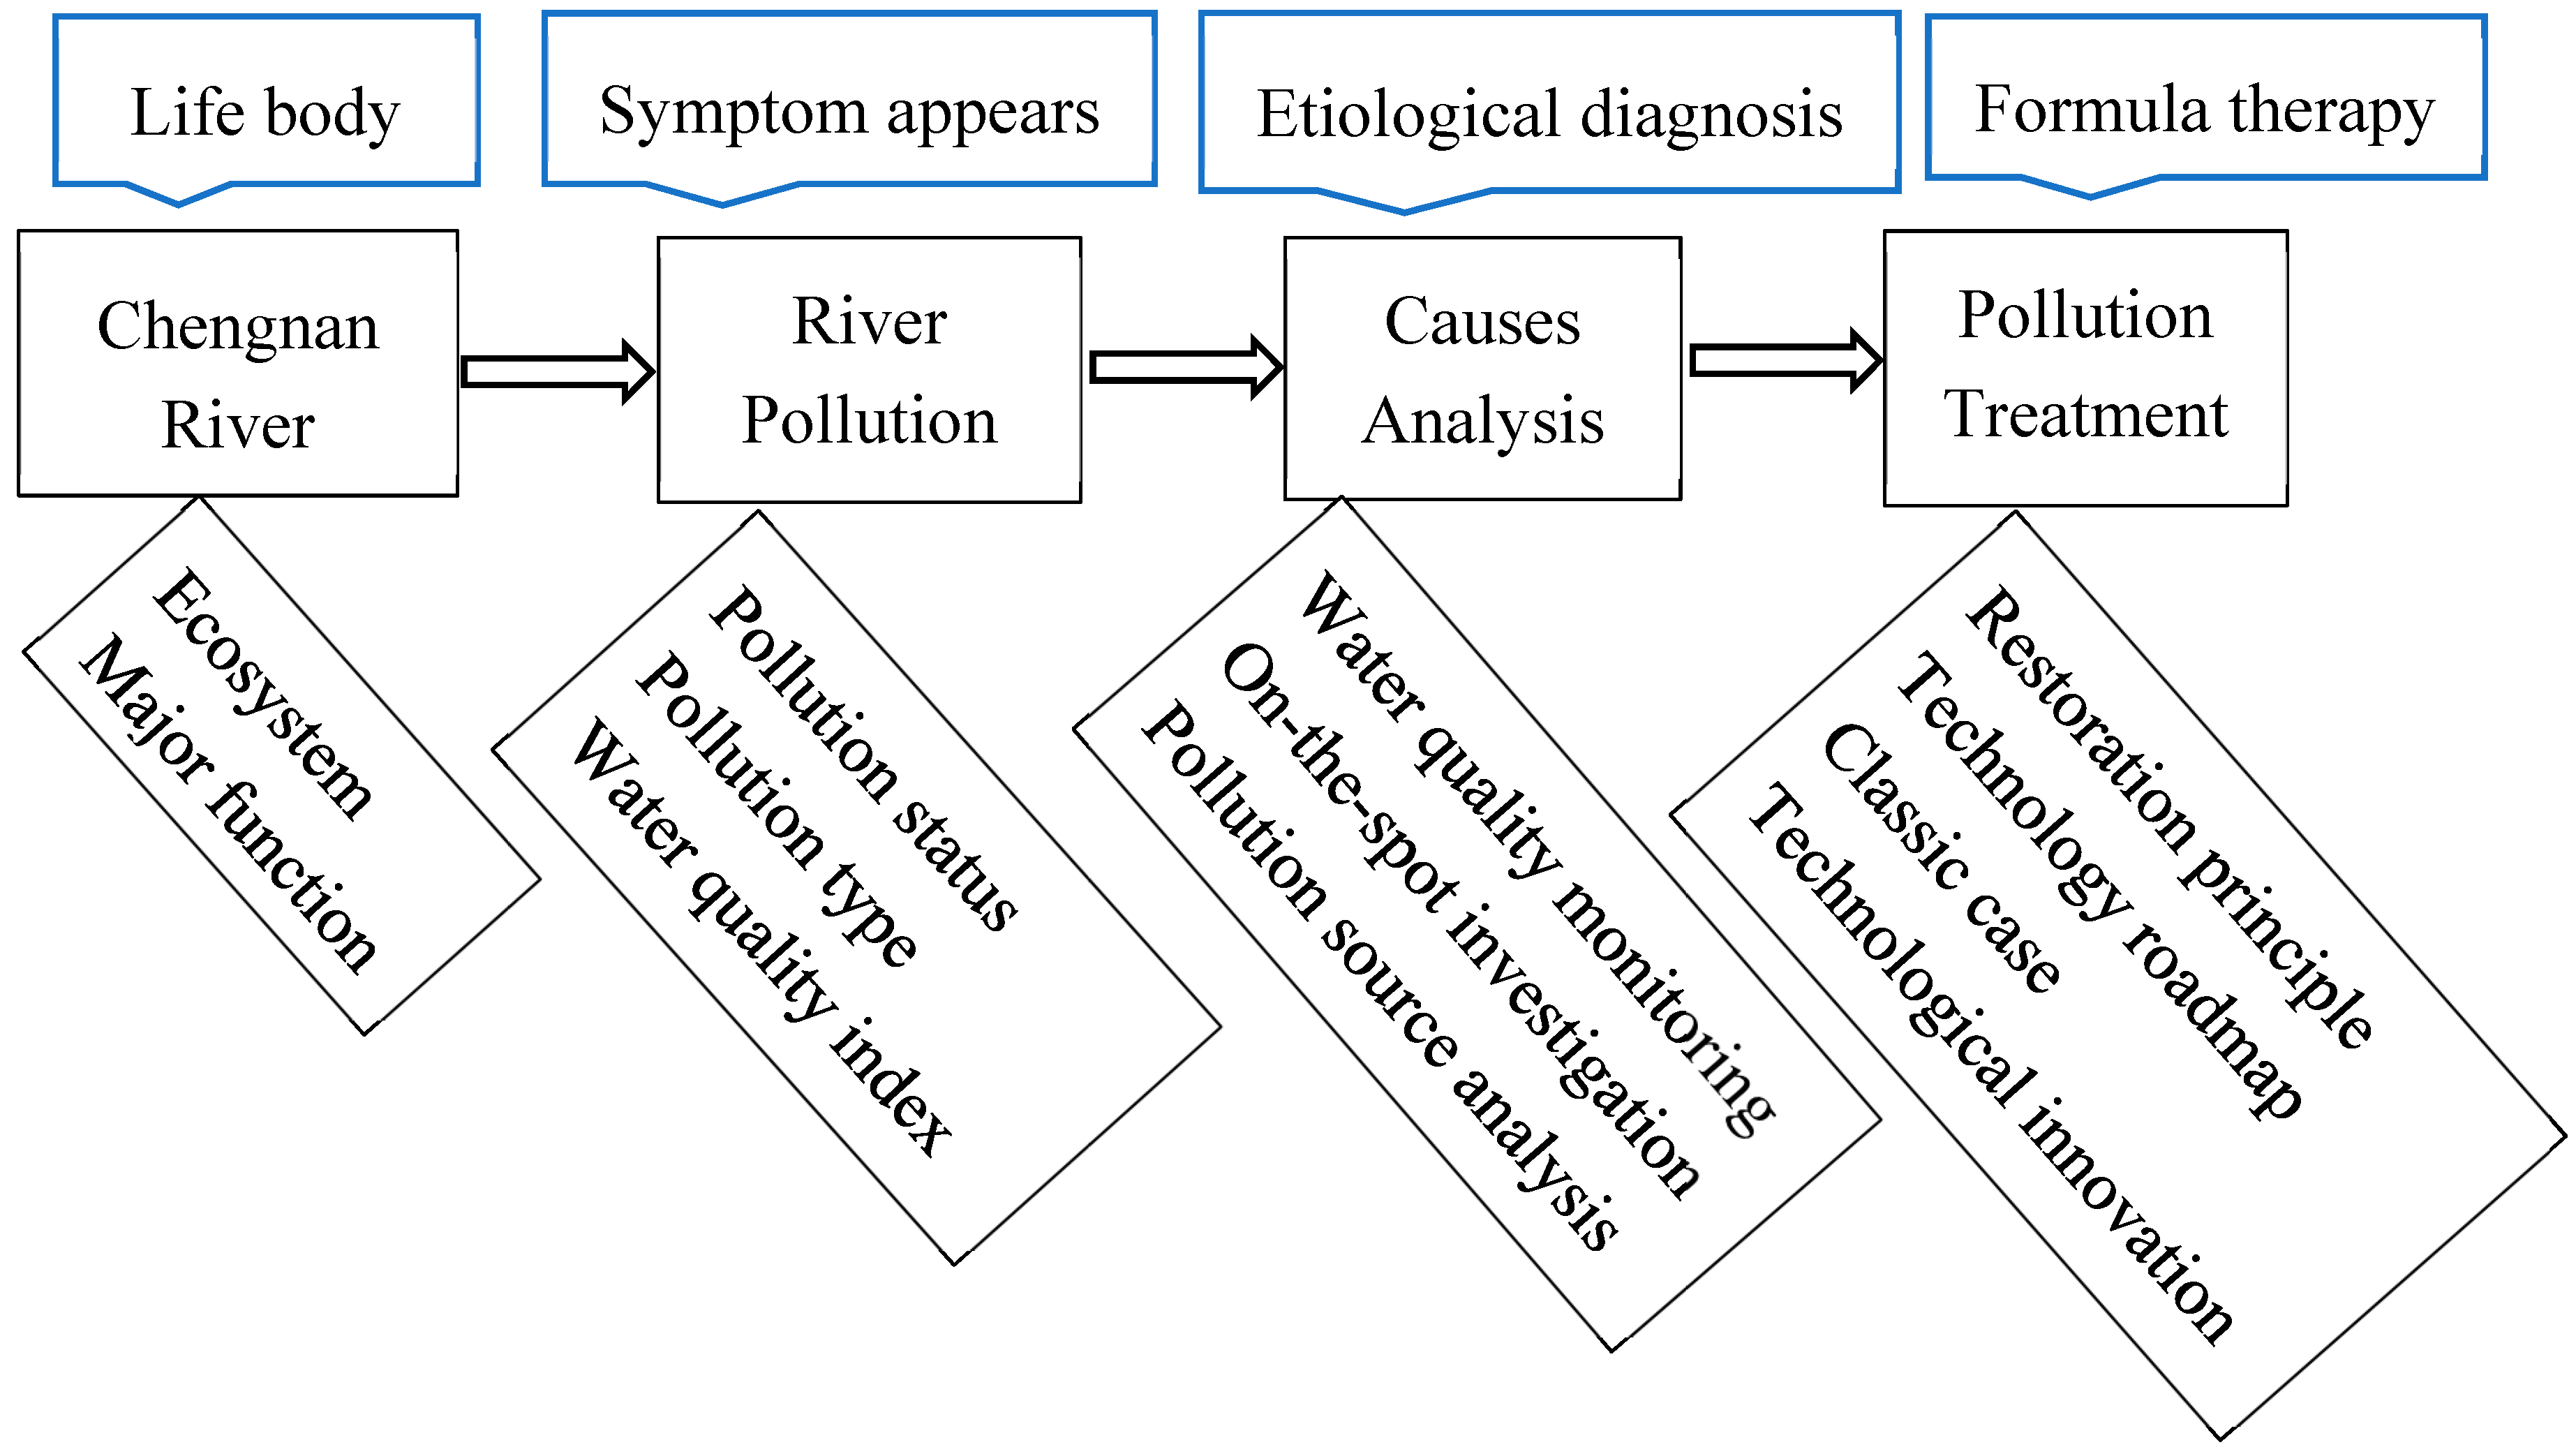
2.3.1. Microbial Technology Treatment Process

Product preparation
Firstly, 350 kg HP-RPe-3 microbial agent which was stored as a powder was chosen for use in this research. This microbial agent and 1400 kg of deionized pure water were mixed at a ratio of 1:4 in a filter tube, before eluviation into a compound bacterial liquid.
Secondly, this bacterial liquid was filtered under normal pressure in order to gradually remove the supernatant (of which 250 kg was retained in other container for later use). Finally, the pure bacterial liquid was left at the bottom, and amounted to about 350 kg, 1/5 of total amount.
Thirdly, the reserved 250 kg supernatant was mixed and stired well with 100 kg microbial accelerating agent for HP in powder form for easy storage and transportation. Then, the 350 kg nutrient solution was formed. After that, pure bacteria was mixed with the nutrient solution for strain rejuvenation.
Finally, 700 kg of the bacteria liquid was mixed, after rejuvenation, with 300 kg of sludge water, collected from Chengnan River. Then, with continuous stirring and domesticating for about 15 days (depending on temperature and weather), the 1.0 t HP-RPe-3 microbial agent was in a liquid state, and was easy to directly inoculate into the polluted river.
(2) Water Quality Monitoring
Monitoring points were set up at Shanghe Square, Caihong Bridge, Jiangpu Bridge, Rubber Dam, Pubing Bridge, and Longwang Temple from upstream to downstream (numbered F~A in turn in Figure 3). The Longwang Temple Section is the provincial section, and the ultimate goal of the study was to improve water quality in the Longwang Temple Provincial test section, to Grade V in one month. We labeled this section “Section A” and numbered it from this point to the upstream points successively. Water quality monitoring factors involve DO, NH3-N, TP, and COD. The test methods were: DO, the electrochemical probe method, NH3-N, spectrophotometric method with salicylic acid, TP, the ammonium molybdate spectrophoto metric method, and COD, the acidic potassium permanganate method. The test times were from 9:30 to 11:00 every working day, from April to December, 2017. In this research, the most important period for the treatment was from 15 April to 2 May 2017.

2.3.2. Water Quality Indices Evaluation Methods

A comprehensive evaluation of water pollution impact on the environment needs to integrate a number of water quality observation indices from the complex system of a water environment, and reduce them into a single index. It should be concise, exact, and representative to express the water quality status for a certain time and space range, so as to facilitate public understanding of water environmental problems, and to help the public participate in the work of water environmental protection. At the same time, the quantitative index also allows decision-makers to carry out more targeted water environmental protection work [43].
(1) Nemerow pollution index method
The concept of the “Nemerow pollution index method” was put forward for the first time in the book called “Scientific stream pollution analysis”, written by professor Nemerow in 1974 [44]. The Nemerow pollution index method is widely used in the field of water quality evaluation, and is one of the commonly used methods of comprehensive pollution index calculation at home and abroad; it has the advantages of a simple evaluation process and highly pertinent evaluation results.
This evaluation process is easy to operate; the method calculates the WQI as follows.
(1) Single factor evaluation index ( I i ): It is a dimensionless number that represents some evaluation factor to the extent to which its observational values in the environment are relative to the assessment criterion for environmental quality assessments.
I i = C i S i
where, C i   = the observational value of the i evaluation factor in the environment;   S i   = the evaluation criteria of the i evaluation factor in the environment.
The DO evaluation index uses the following formulas:
I D O = | D O f D O | D O f D O s , D O D O s
I D O = 10 9 D O D O s , D O < D O s
D O f = 468 ( 31.6 + t )
where, D O f   = the concentration of saturated dissolved oxygen (mg/L);   D O s = the evaluation criteria of dissolved oxygen in the surface water (mg/L); and t = water temperature (°C).
(2) The Nemerow pollution index ( I N ) may be calculated using the following equation:
I N = ( M a x I i ) 2 + ( A v e I i ) 2 2
A v e I i = 1 m i = 1 m I i
where, M a x I i = the maximum value in   I i ; A v e I i = the average value of   I i ; and m = the number of evaluation factors.
(3) By comparing the calculated Nemerow pollution index with the standard pollution index classification table, the water quality classification is determined. The classification of Nemerow pollution index is shown below (Table 3).
(2) Fuzzy comprehensive evaluation method
In many cases, the evaluation grade is difficult to represent with a simple numerical value. Based on the fuzzy mathematics theory, the fuzzy comprehensive evaluation method transfers the qualitative evaluation to the quantitative evaluation, and determines the water quality type by the calculation of the membership degree [45]. Using the membership degree to describe the evaluation grade can cause the depicted fuzziness at the boundary. When put into practical application, it can better demonstrate its objectivity and rationality. The specific steps of the method are as follows.
(1) Establish the factor set of the evaluation object U,
U = { u 1 , u 2 , , u n }
where u i is the numerical index (i is from 1 to n) involved in the evaluation.
(2) Determine the weight for each factor in U, then get a fuzzy subset A on U,
A = { a 1 / u 1 , a 2 / u 2 , , a n / u n }
where   a i = 1 , a i 0 .
(3) Select the reasonable and accurate membership function and obtain the fuzzy relation matrix R. A fuzzy evaluation model B for compound calculation between weighted vectors and fuzzy relation matrix was established.
B = A · R
where “ · ” can broadly understood as any of four kinds of fuzzy compound operations.
(4) Calculate the degree of membership B, obtain the comprehensive evaluation results of water quality, and further determine the water quality category according to water quality evaluation criteria. In the research, we selected GB3838-2002 as the standard.

3. Results and Discussion

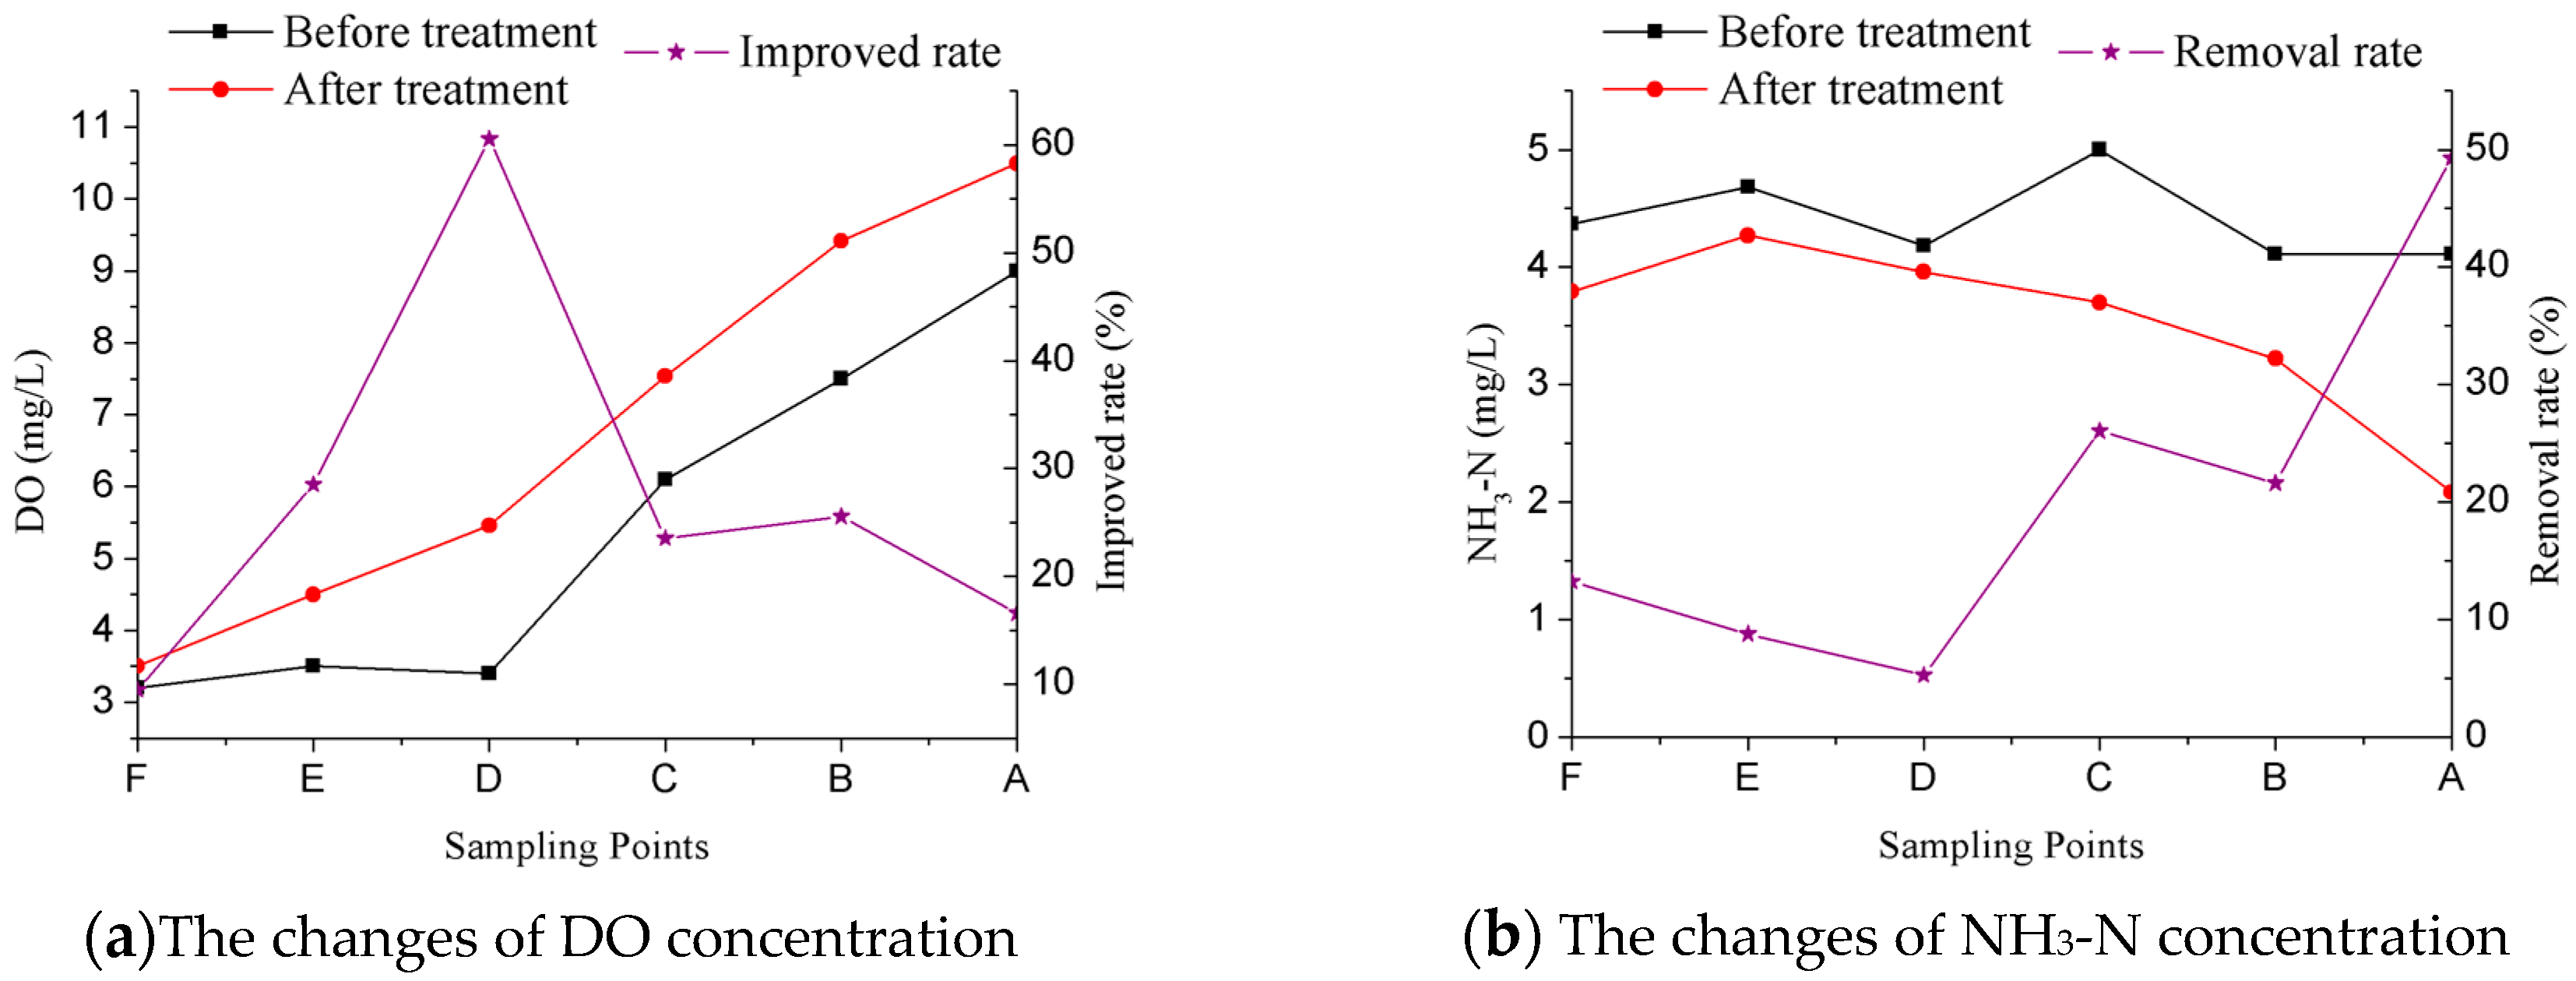
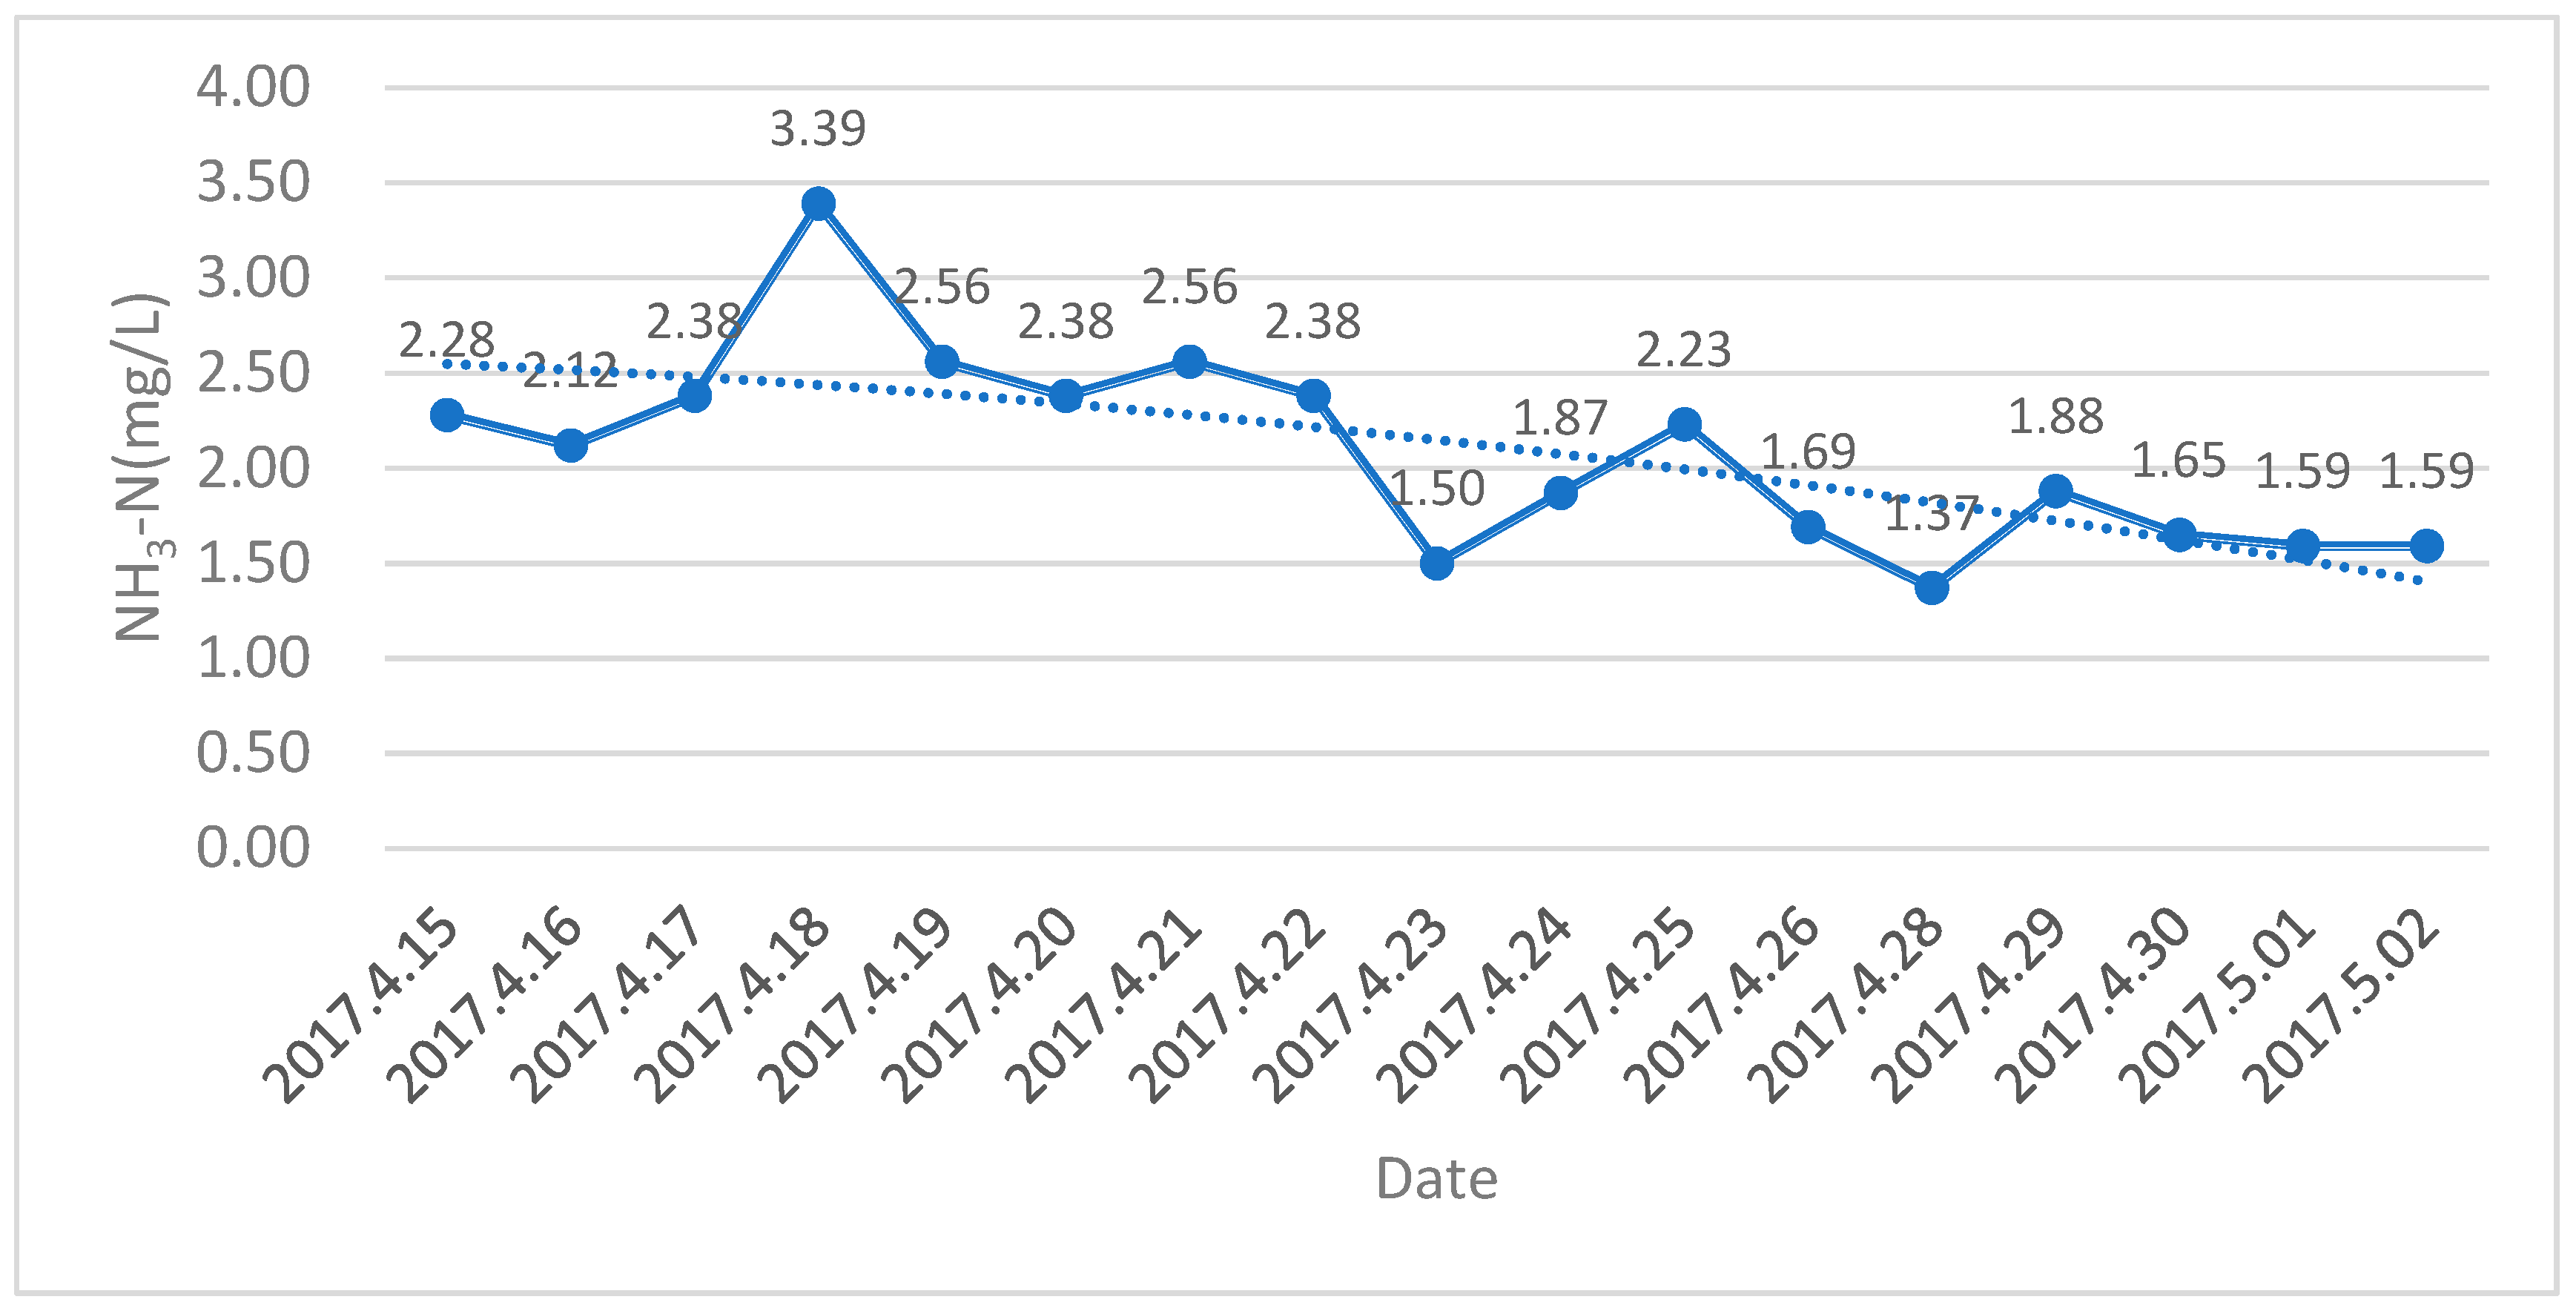
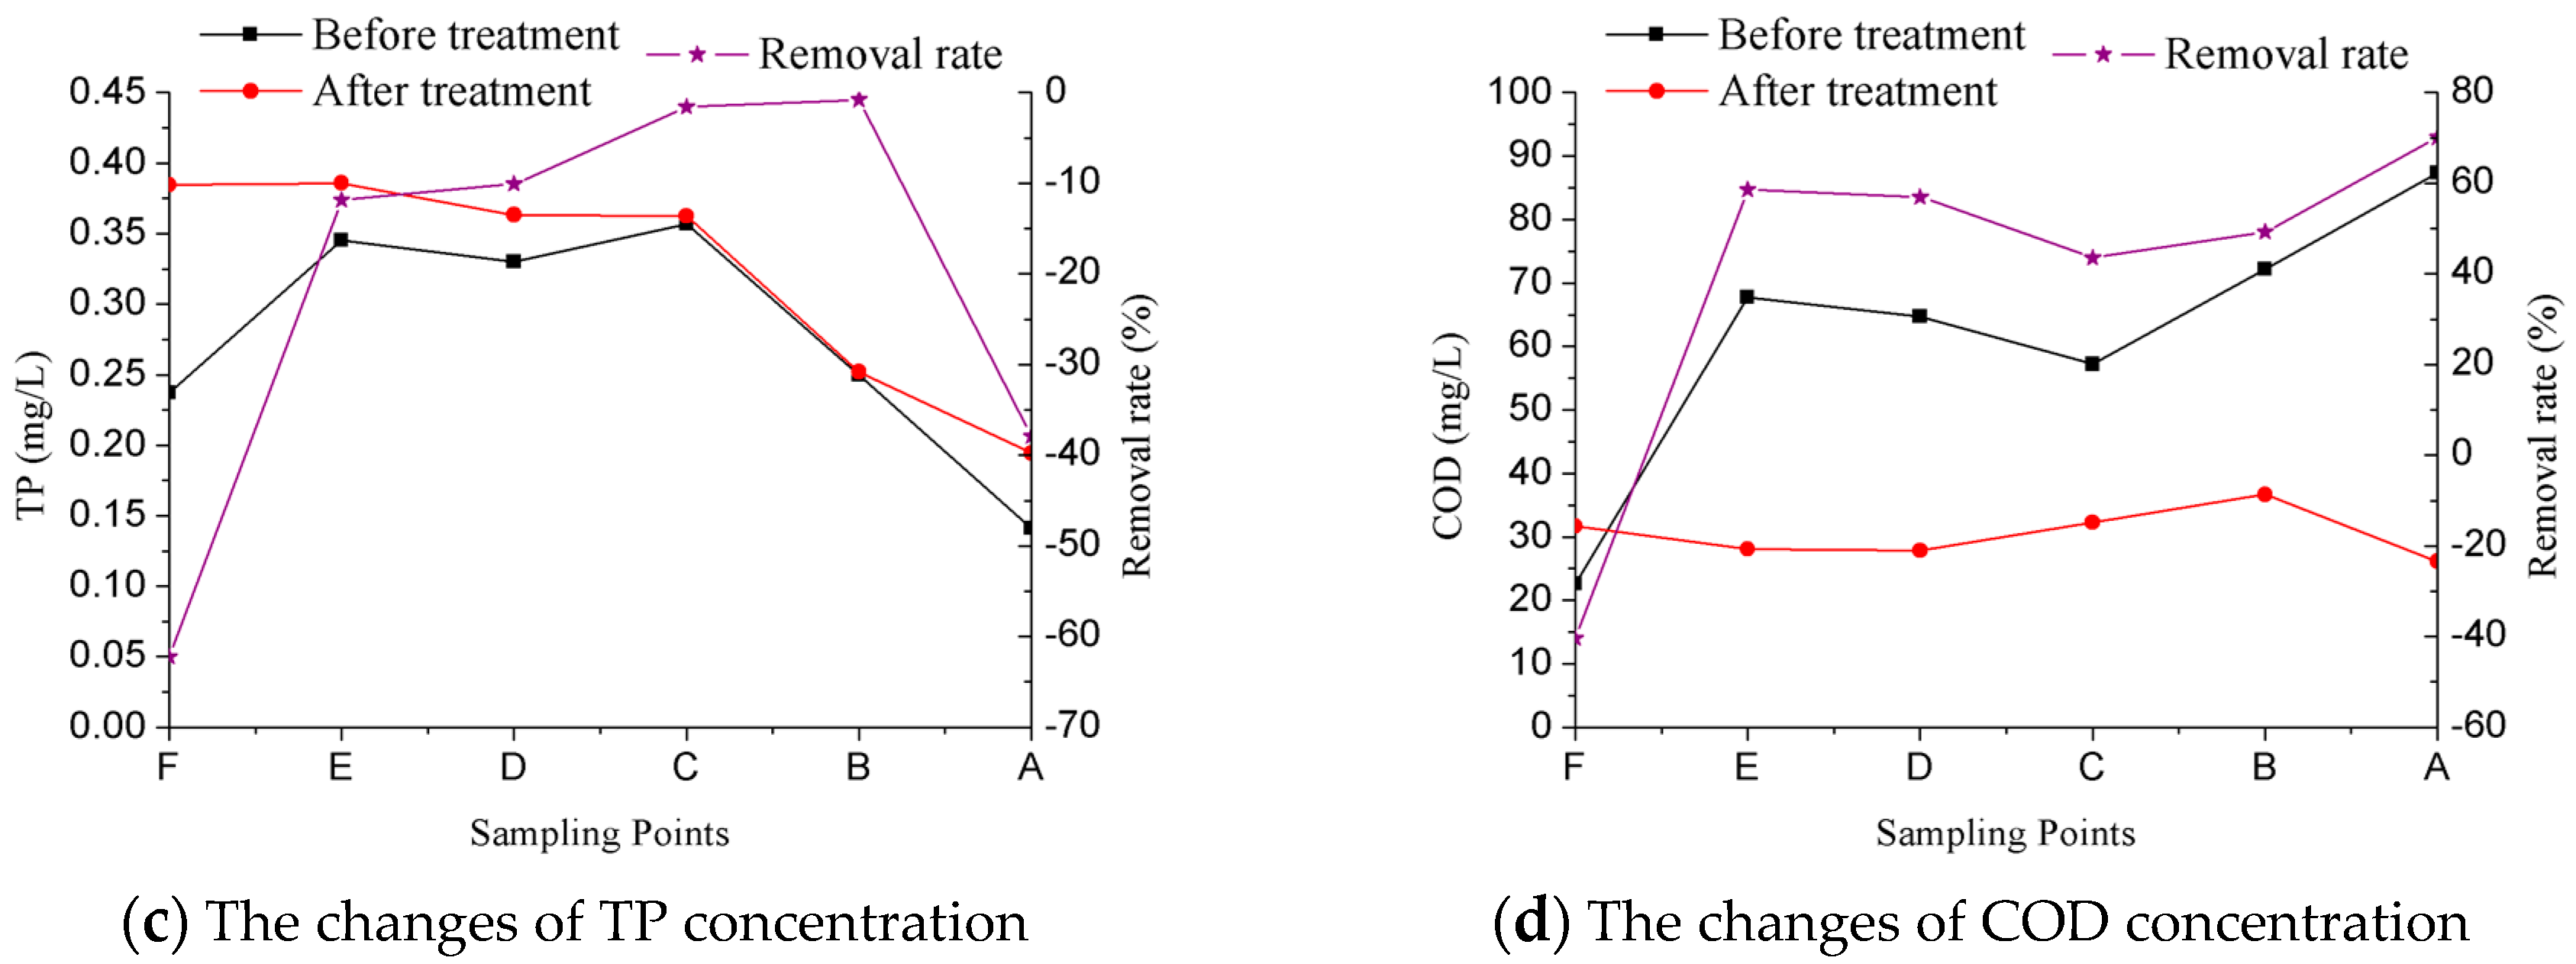
3.1. Analysis of Single Factor of Water Quality

The pollutant removal rate was determined by the average concentrations of the major water quality parameters before and after the microbial treatment, which can be calculated by the following equation:
R = ( C 0 C ) C 0 × 100 %
where, C = the concentration at time t after the microbial treatment (mg/L); C 0 = the initial background concentration before the microbial treatment.
Taking the DO into consideration, its improved rate can be calculated by the following equation:
IprR = ( C C 0 ) C 0 × 100 %
where, C = the concentration at time t after the microbial treatment (mg/L); C 0 = the initial background concentration before the microbial treatment.
The changes of DO, NH3-N, TP and COD concentrations and their respectively improved rates and removal rates before and after the microbial treatment are summarized in Figure 4. The effects of microbial treatment on pollutant removal are shown below.
(1) Analysis of DO from upstream to downstream
Before treatment, the concentration of DO at all the points was greater than 3 mg/L, reaching Grade IV of the surface water DO standard. It provided a good aerobic environment for the microbiological treatment applied in the black-odor river. After the microbial treatment, the values of DO of nearly 80% of the river were greater than 5 mg/L (Figure 4a), reaching Grade III of surface water DO standard. We can see that the dissolved oxygen increased steadily from upstream to downstream, reaching up to 10.5 mg/L at section A, far more than 7.5 mg/L, which is Grade I of the surface water DO standard. The average rising rate was up to 20%, and even reached 60% at section D. Without doubt, the application of the microbial technology used in bioremediation of Chengnan River showed a positive effect on DO treatment.
(2) Analysis of NH3-N from upstream to downstream
The background values of NH3-N were above 4.0 mg/L before treatment (Figure 4b) at each point, far exceeding the Inferior Grade V of surface water NH3-N standards; the concentrations of NH3-N stayed high and had a tendency to increase with the flow direction. After the microbial treatment, section E became a turning point where the concentration of NH3-N increased point, and then began to decline. Its average degeneration rate was close to 16%, most likely because the HP-RPe-3 compound microbial agent began to take effect after being poured into the river. The average removal rate of NH3-N reached more than 20%, and had a gentle upward trend in the flow direction. It even achieved up to 49% at section A. The minimum NH3-N value was up to 2.08 mg/L, close to 2.0 mg/L, which is Grade V in the surface water NH3-N standards. It can be seen that the effects of the microbial treatment on ammonia nitrogen in the whole river are relatively remarkable.
(3) Analysis of TP from upstream to downstream
Taking microbiological accelerating agents and temperatures into consideration, the trend shown in the Figure 4c can easily be understood. On the one hand, in the early stage of the treatment, the HP-RPe-3 microbial agent needed nutrition to adapt and survive in the river. This may be addressed by mixing it with an accelerating agent that is full of nutrition, and then putting the compound products into the river. On the other hand, the monitoring water temperature was higher than background values, as was the level phosphorus released from sediment to water body more frequently as the temperature increased. Inevitably, the TP concentrations were higher than the background values before treatment. However, the average degradation rate of TP after treatment was close to 15%, and TP decreased much more rapidly than before. The TP concentration was still below 0.4 mg/L, reaching Grade V of the TP surface water standard. This probably means that the river had a much greater capacity to decompose phosphorus after introducing microbial agent into it. From the decreasing trend of the TP along the river, we can predict that in the foreseeable future, the degradation of the phosphorus will be far more effective, without adding new compound products.
(4) Analysis of COD from upstream to downstream
The concentration of COD showed an overall upward trend, and stayed high before treatment, as shown in Figure 4d. As we can see, the values of COD were all greater than 40.0 mg/L, reaching almost 90.0 mg/L. However, after the treatment the concentration of COD declined significantly. In the process, average removal rates can reach 38% along the river, and the maximum removal rate of COD can reach 58% at section E. The values of COD remained in a low concentration state: all of them were below 40.0 mg/L, reaching Grade V of the surface water COD standard. Through a comparison before and after the treatment, we can conclude that the application of microbiological technology on the treatment of COD on Chengnan River was successful.
(5) Analysis of the provincial section A
The Longwang Temple Section is the provincial section. The ultimate goal of the treatment is to improve water quality, which mainly means reducing the NH3-N values in the provincial section to Grade V in one month. We got the mission in late March and began to make a comprehensive diagnosis of the river to get its background values. After that, we spent the first two weeks of April preparing the corresponding microbial agents. We then made use of the last two weeks of April to achieve the treatment goal. Figure 5 shows the changes of the NH3-N in Section A during the microbial treatment; the concentration of NH3-N is in an overall downtrend, as shown. The treatment therefore achieved its goal. The third-party institution, Nanjing Monitoring Center, provided its monitoring data (Table 4), which shows that the water quality in Section A was enhanced by at least 2 levels, and the concentration of NH3-N is relatively low, preliminarily proving that the microbial technology applied in the heavily polluted river was very successful, and that it demonstrates a durable sterilizing effect.

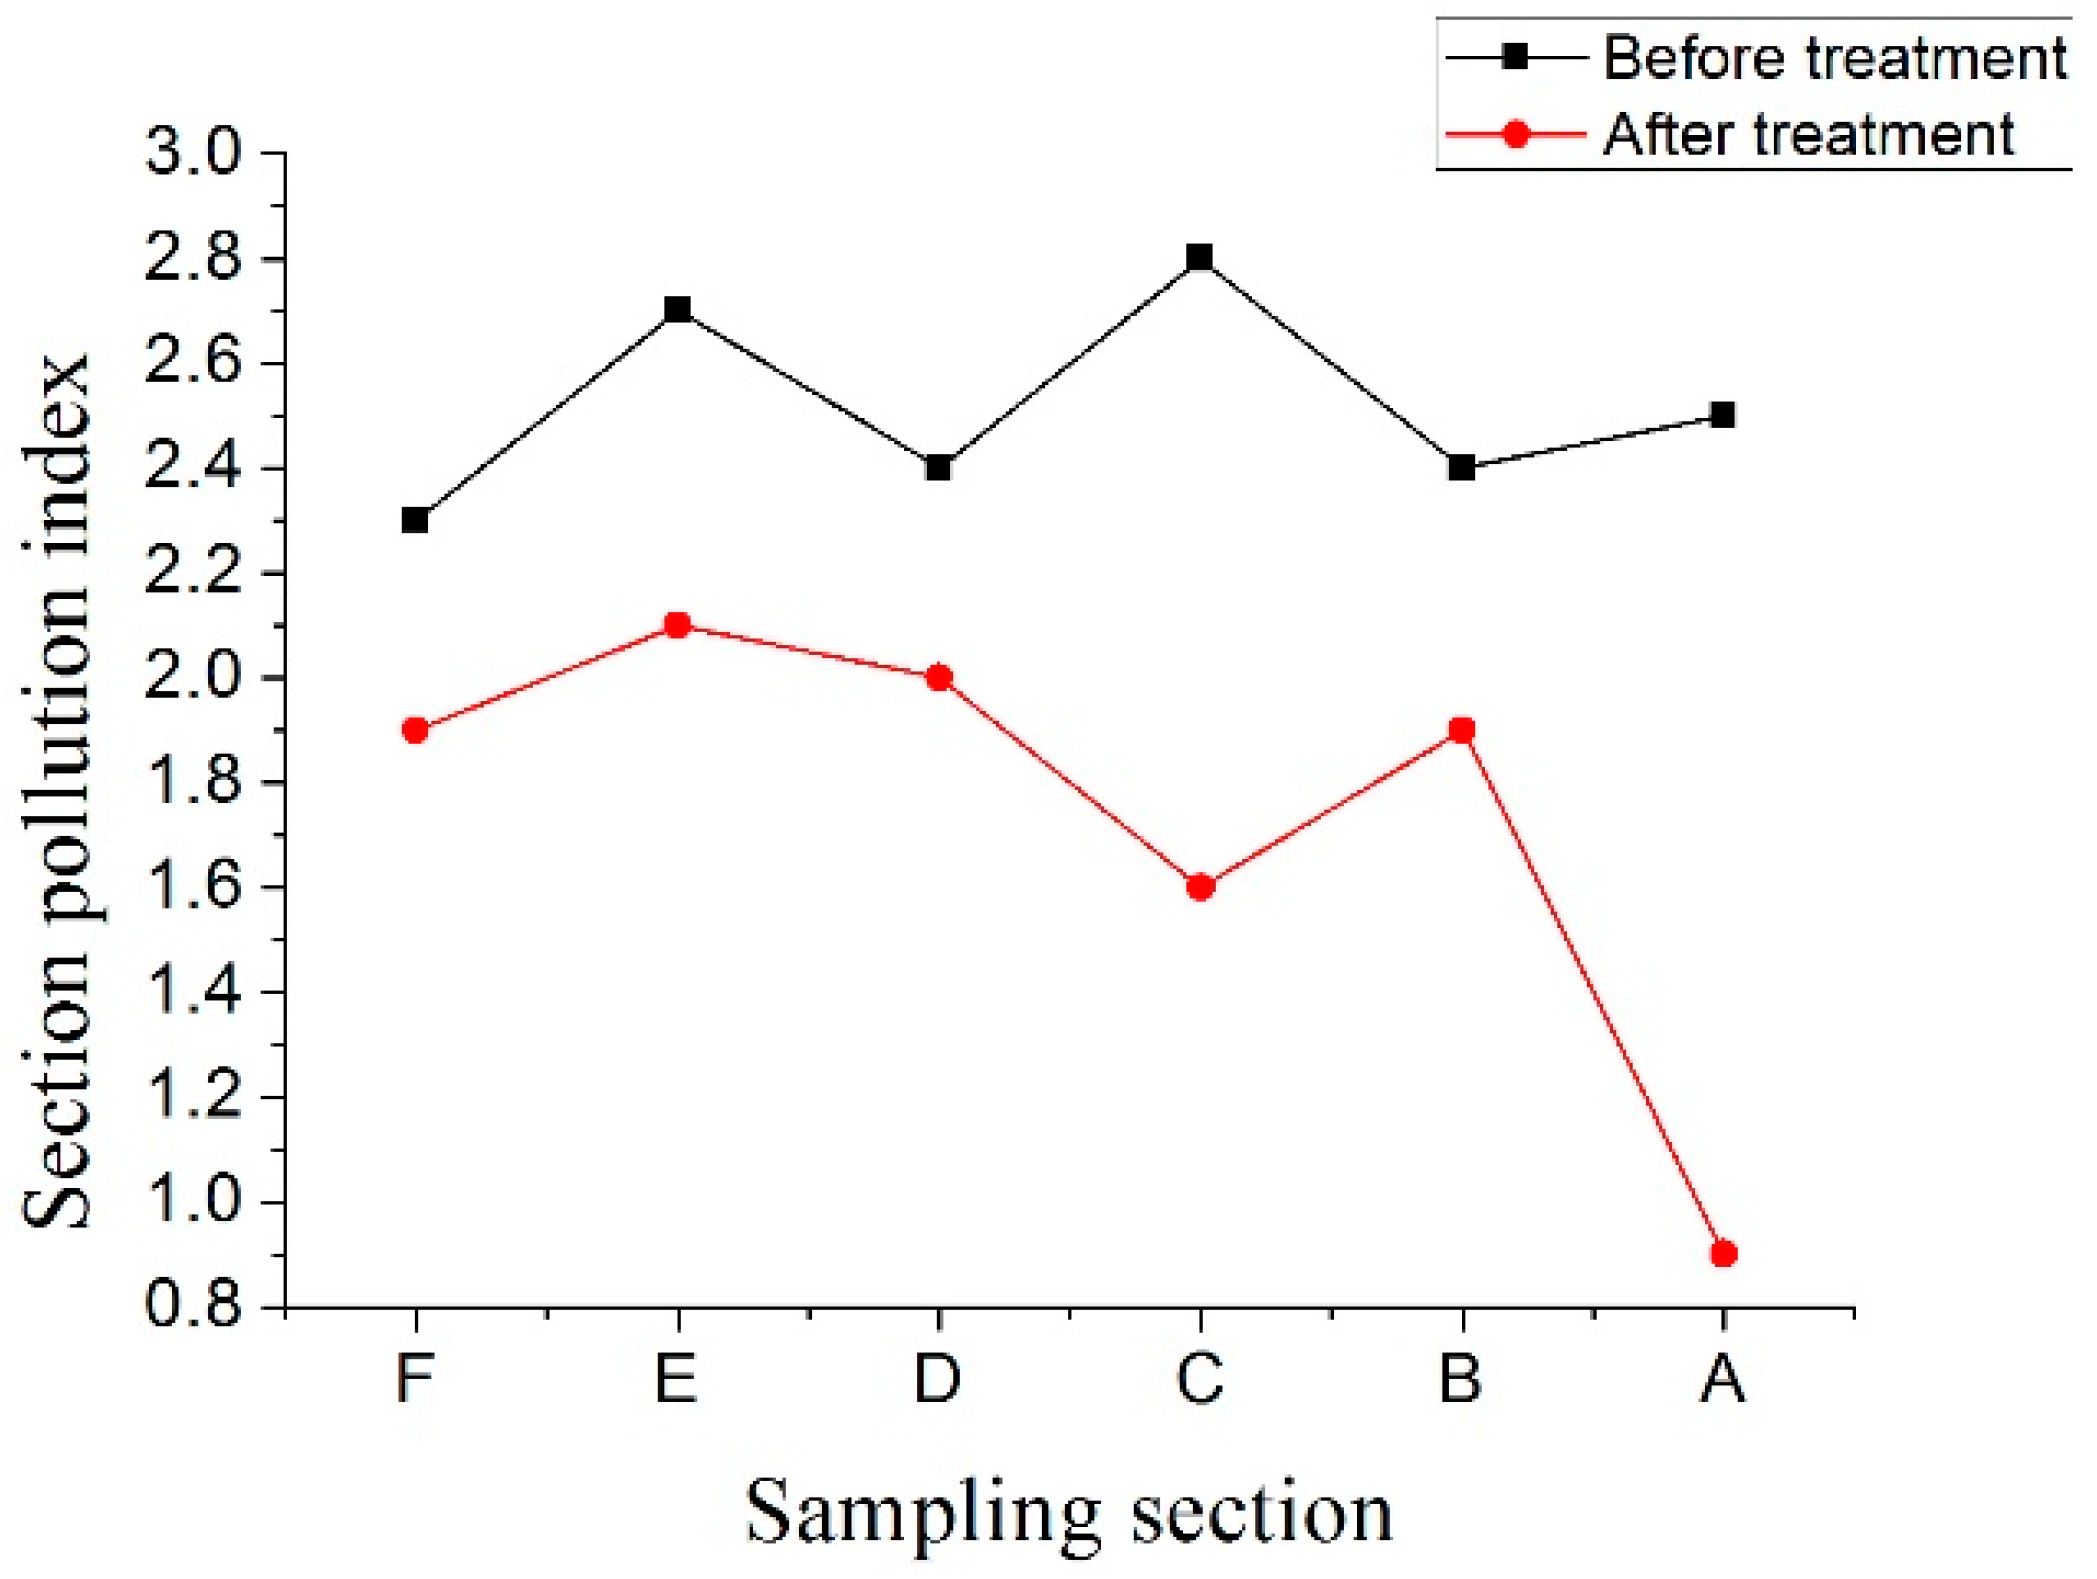
3.2. Analysis of Nemerow Index

Based on the Nemerow pollution index method and standard of classification, this part evaluates the comprehensive effects of the microbial technology on the river odor, from 15th April to 2nd May, and screens out major pollutants. During the process, firstly we evaluated each section from upstream to the downstream, and then calculated the water quality of the whole river. Additionally, in this part, we selected SDO = 3.0 mg/L, SNH3-N = 1.5 mg/L, STP = 0.3 mg/L and SCOD = 30.0 mg/L, which corresponds to Grade IV of surface water standard. Because more than 90% of the concentration of DO was greater than 3.0 mg/L, there was no need to calculate the DO pollution index there. The calculation of the results is listed as follows.
From the comparison of the two tables (Table 5 and Table 6) and the analysis of the figure (Figure 6), it was concluded that the pollution index remained at a high level before the treatment, and that there was no significant downward trend along the river. The Nemerow Index of Chengnan River was 2.7, which shows that the water quality of the river could be categorized as showing moderate pollution, and that its main pollution factors are NH3-N and COD, according to their pollution indexes. After the treatment, the Nemerow Index showed an overall downward trend, except for section B. The Nemerow Index of Chengnan River was 1.9, which is considerably lower than the value of 2.7 that was recorded before treatment. It shows that the water quality of the river may be categorized as demonstrating light pollution (therefore, an improvement of one rank). Thus, the application of the microbial technology achieved preliminary success, and the selection of the microbial agents was shown to be reliable for the current scenario.

3.3. Analysis of Fuzzy Comprehensive Evaluation Index

Based on the Fuzzy Comprehensive Evaluation Index method, this part evaluates the comprehensive effects of the microbial technology applied to the river odors. The calculation procedures use the equations from (12) to (24); the results are listed as follows.
(1) Establishment of the index set U:
In this part, four major water quality parameters were selected which are the most common monitoring indicators for measuring the quality of an aquatic environment.
UWater = (DO, NH3-N, TP, COD)
(2) Establishment of the evaluation set V:
The Chinese Environmental Quality Standards for Surface Water (GB3838-2002) were selected as the evaluation standard.
V = (I, II, III, IV, V, Inferior V)
(3) Establishment of the weight coefficient fuzzy subset A:
The following equations used to determine the weight for each factor in U.
W i = C i S i ¯ / i = 1 n C i S i ¯
S i ¯ = 1 5 j = 1 5 S i j
W = ( S ¯ D O / C D O , C N H 3 N / S ¯ N H 3 N , C T P / S ¯ T P , C C O D / S ¯ C O D ) = ( W D O , W N H 3 N , W T P , W C O D )
A = ( W D O / W i , W N H 3 N / W i , W T P / W i , W C O D / W i )
where, W i = W D O + W N H 3 N + W T P + W C O D ; S i j = the j evaluation standard value of the i index. Take the section F Shanghe Square as an example. The ultimate calculation process and the results are listed in the following tables.
The fuzzy subset A of the Section F was calculated, as shown below:
A F = ( 0.19 ,   0.54 , 0.15 , 0.12 )
These steps were repeated with the rest of the section’s before and after the treatment, and the following results were summarized as follows from Table 7, Table 8 and Table 9.
From the tables above, we concluded the weight coefficient fuzzy subset A of the six monitoring sections respectively before and after the MT treatment. The results are summarized and shown in the following table (Table 10).
(4) Select membership function and obtain the fuzzy relation matrix R.
As above, the China Environmental Quality Standards for Surface Water (GB3838-2002) was selected as the classification standard, and used to determine the membership function of various factors to various water quality levels using the following general formula.
(1) For the water quality belonging to Grade, that is j = 1, the membership function is:
R i j = { 1 , C i S j ( C i S j + 1 ) / ( S j S j + 1 ) , 0 ,       C i S j + 1 S j < C i < S j + 1
(2) For the water quality belonging to Grade II to Grade, that is j = 2~4, the membership function is:
R i j = { ( C i S j 1 ) / ( S j S j 1 ) , S j 1 < C i < S j ( C i S j + 1 ) / ( S j S j + 1 ) , S j < C i < S j + 1 0 ,   C i S j 1 , C i S j + 1
(3) For the water quality belonging to Grade, that is j = 5, the membership function is:
R i 5 = { ( C i S 4 ) / ( S 5 S 4 ) , S 4 < C i S 5 0 ,   C i S 4 , C i > S 5
(4) For the water quality belonging to the Inferior Grade, that is j = 6, the membership function is:
R i 6 = { 1 , C i > S 5 0 , C i < S 5
From this, we can get the following fuzzy relation matrix R:
R = ( I II III IV V Vi R 11 R 16 D O N H 3 N T P R 41 R 46 C O D )
According the equations above, these steps were repeated to obtain the fuzzy relation matrix R of six monitoring sections which were just listed, as follows (Table 11).
(5) The degree of membership B was calculated by the following equations:
B = A · R
The Model M(·,⊕) was selected as the fuzzy compound operation. We then obtained the membership, and determined its corresponding water quality level as follows (Table 12).
From the analysis of the table above, before the treatment, we can see that the degree of membership to Inferior Grade V is always the highest, and shows a general upward trend from section F to section A. After treatment, the degree of membership to the Inferior Grade V was still highest, except for section A, it was relatively smaller and showed a general downward trend along the river. Section A, where the degree of membership belonging to Grade IV was highest in the provincial test section. The treatment achieves a great success in this respect.
In this research, we discussed several existing mature evaluation methods from different perspectives, and the feasibility of microbial technology as a means of bioremediation for urban polluted rivers without artificial aeration, sediment dredging, or complete sewage interception. Additionally, we examined the question of whether the concept of microbial agent selection merits inclusion.
From the analysis of four single parameters, DO, NH3-N, TP and COD, we can generally perceive both the changes of the water quality parameters along the river before and after the treatment, and the means by which the microbial agent affects them. After the treatment, the average concentration of DO was up to 6.8 mg/L and its average improved rates reached up to 30%. The DO values for corresponding monitoring sections were all greater than before. Furthermore, for pollutant removal, the average removal rates of NH3-N were up to 20%, and the values of corresponding monitoring sections were all smaller than before. Also, the concentration of NH3-N showed a downward trend from section E to A, with an average degradation rate of about 16%, i.e., far beyond the natural degradation rate of NH3-N in river course. The average removal rates of COD were up to 38%, and the values of corresponding monitoring sections were all below 40.0 mg/L, i.e., much smaller than before treatment, except at section F. Finally, perhaps at first glance, the effect of microbial technology on TP treatment might appear to be no better than the other three indicators, for it introduces nutrients at the beginning in order to keep indigenous microorganisms alive and in proliferation in river. Furthermore, the water temperature rises. The concentration of TP is a little higher than before. In spite of this, the concentration of TP is still controlled at below 0.40 mg/L, and showed a downward trend, with an average degradation rate close to 15% in the flow direction, i.e., far beyond the natural degradation rate of TP in river course. From these analyses, it was concluded that the microbial agent did not completely disappear, but rather, diffused along with the movement of the water. It might be accumulated more downstream, since the application results become much better with flow. All the results indicate that the black-odor pollution of Chengnan River has been preliminarily eliminated, and that the river has become, in effect, a natural sewage treatment plant.
From the analysis of Nemerow pollution index, we can screen out major pollutants and remedy seriously polluted sections of the selected river. The most important pollutant was NH3-N, which affects water quality most, and needs to be eliminated. This provides a hopeful direction for water pollution elimination which is problem-oriented, for subsequent decision making. Therefore, to minimize the concentrations of NH3-N, we used specific microbial agents which have no adverse effects on other indicators, so as to improve the overall level of water quality. After the treatment, the Nemerow Indices of corresponding monitoring sections were all much smaller than before; the Nemerow Index of the whole river reduced from 2.7 to 1.9, which indicates that the classification of water quality improved by one rank. All results show that the capacity of dirt-admittance and self-purification of the river had been increased, and that its ecosystem had been restored.
From analysis of the Fuzzy Comprehensive Evaluation Index, both before and after treatment, the weight coefficient of NH3-N was exceeded on overall. This result is in accordance with the previous one, as determined by the Nemerow Index, which indicates that the concentration of NH3-N plays an important role in the overall water quality, and needs to be controlled. Accordingly, we selected the HP-RPe-3 microbial agent as the first-period treatment agent.
As we all know, there are many existing methods, and there will no doubt be countless new methods for water pollution control. Here, we will simply discussed some biological-ecological methods. Mei, etc. found that the biofilm technique would be more effective in purifying black-odor water with the application of sediment aeration techniques beforehand, through a laboratory experiment which showed that the removal rates of NH4+-N and COD reached up to 63.25% and 53.06% respectively [46]. Yucong Zheng, etc. showed that hybrid constructed wetland (HCW) systems had a higher treatment efficiency for organics and suspended solids than nutrients, with the average removal rates of NH3-N, COD were 74.5% and 57.5% respectively; these results were highly seasonal [34]. Y. Zimmels, etc. showed that naturally growing plants could enhance the removal of pollutants. Water hyacinths, with the characteristic of extensive roots and rapid growth rate, and duckweeds, with lower sensitivity to cold climates, were used extensively. The author indicated that this method could not be used in fresh water, but that it can be applied in small communities for the reduction of pollutants such as BOD, TSS, COD, and turbidity [47]. In this paper, we have discussed the field application of MT with the selected HP-RPe-3 microbial agent over 18 days, without any supporting measures. The results have shown that the average removal rates of NH3-N and COD were up to 20% and 38%. These methods are all eco-friendly. If we focus only on the removal rates, the 18-days application of MT is not ideal; however, everything taken into consideration, you may find that it is cost effective, energy saving, low-maintenance, effective, stable, and durable. We just used just one HP-RPe-3 microbial agent and achieved our treatment goals. In this research, the treatment concept is far more important. We treated polluted rivers and sought to restore the river ecosystem step by step. It is generally known that microorganisms have the characteristics of small volumes and large surface areas, greater absorption and faster transformation, vigorous growth and rapid propagation, strong adaptability and easy variation, wide distribution and diverse in terms of species. This is beneficial for the mass and energy exchange between microorganisms and their surrounding environment. In theory, microorganisms can decompose all pollutants. We should do what we can to make the best use of these microorganisms. In view of the river control targets, we can dynamically adjust treatment plans by selecting of microbial agents or combinations of selected microbial agents. Then, we can meet treatment goals and ensure that MT is affordable, environmentally sustainable, and socially acceptable, so as to promote the spread and application of this technology.

4. Conclusions

In this research, we are aimed to propose and promote the use of an affordable, simple, effective, and environment-friendly method for treating polluted urban rivers, coming up with the innovative idea for selecting the right microbial agents based on the concept of traditional Chinese medicine. We have prepared particular microbial agents for several basic pollutants, which also have positive effects on other pollutants in the river; e.g., the HP-RPe-3 microbial agent for the degradation of NH3-N; HP-RPeII for the removal of COD and effective degradation of cellulose; HP-RPeIII for the effective removal of TP, etc. In this field application, firstly we decided to use microbial technology due to the pollution source observed in the waterway, and on account of other basic parameters, such as flow velocity, discharge, etc. Then, we selected treatment agents according to an evaluation of the river pollution. Here, we selected the HP-RPe-3 microbial agent as a first-period treatment agent on account of the urgent need to degrade NH3-N; we also prepared HP-RPeII microbial agents in case of need. While, luckily, the HP-RPe-3 microbial agent worked well, it also has a certain effect on other indicators while reducing the concentration of NH3-N at the same time, thus restoring the ecosystem of the river and enabling its degradation systems to function. The field experiment shows the feasibility and validity of MT, i.e., applying microbial agents to treatment concepts in order to remediate heavily-polluted urban rivers. The Chengnan River also sets a good example of how to apply microbial technology. It is helpful for decision and policy makers who wish to design their specific biodegradation water management projects. It can also provide more choices for managers, yielding better decisions, especially under the circumstances of contrained time frames and low budgets.
In China, the release of the Water Pollution Control Action Plan has highlighted the responsibilities of local governments, strengthened the cooperative prevention and control of watershed water pollution and ecological conservation, improved the supervision and management system for water pollution control, highlighted the measures for prevention and control of water pollution in key areas, enhanced the drinking water safety support system, and specified more rigorous legal liabilities. The water treatment industry will usher in a golden period of development, especially with eco-friendly and cost-effective treatment technologies such as MT. In addition, One Belt And One Road foreign policy provides us a golden opportunity to popularize and export microbial technology to the world, especially to developing countries, seeking to help them to restore river systems. Water pollution is a global problem, and poor people from developing countries suffer most. Both policies provide a good environment for the research and development of microbial technologies. Therefore, further study should include more scenarios and elements, in order to improve the conditions which can more efficiently determine the input pollutants. Furthermore, we should continuously develop more microbial agents to meet various treatment requirements, and should show models supported by more theoretical components.

Author Contributions

H.G. conceived the study and analyzed the data; Y.X. performed the experiments and provided data; H.G. wrote the paper; S.H. and A.A.K. evaluate the results and improve the manuscript; H.X. and X.W. revised the paper. All the authors read and approved the final manuscript.

Funding

This research received no external funding.

Acknowledgments

All of the microbial agents are independently developed by the Laboratory of Water Pollution Control and Soil Remediation and Jiangsu Seaboard Biological Engineering Technology Co. Ltd. The authors are also grateful to all anonymous and proofreader that have helped to improve the condition of this manuscript.

Conflicts of Interest

The authors declare no conflict of interest.

References

  1. Unesco, P.E.; Wmo, G.E. International Glossary of Hydrology; World Meteorological Organization (WMO): Geneva, Switzerland, 1992. [Google Scholar]
  2. Saeijs, H.L.; Van Berkel, M.J. Global water crisis: The major issue of the 21st century, a growing and explosive problem. Eur. Water Pollut. Control Off. Publ. Eur. Water Pollut. Control Assoc. 1995, 5, 26–40. [Google Scholar]
  3. Linton, J.I. Global hydrology and the construction of a water crisis. Great Lakes Geogr. 2004, 11, 1–13. [Google Scholar]
  4. BellieSivakumar. Water crisis: From conflict to cooperation—An overview. Int. Assoc. Sci. Hydrol. Bull. 2011, 56, 531–552. [Google Scholar]
  5. De Azevedo, L.G.T.; Gates, T.K.; Fontane, D.G.; Labadie, J.W.; Porto, R.L. Integration of water quantity and quality in strategic river basin planning. J. Water Resour. Plann. Manag. 2000, 126, 85–97. [Google Scholar] [CrossRef]
  6. Kirshen, P.H.; Strzepek, K.M. Comprehensive Assessment of the Freshwater Resources of the World. Managing Water: Coping with Scarcity and Abundance; American Society of Civil Engineers (ASCE): Reston, VA, USA, 1997. [Google Scholar]
  7. Zeng, Z.; Liu, J.; Savenije, H.H.G. A simple approach to assess water scarcity integrating water quantity and quality. Ecol. Indicat. 2013, 34, 441–449. [Google Scholar] [CrossRef]
  8. Wan, L.; Cai, W.; Jiang, Y.; Wang, C. Impacts on quality-induced water scarcity: Drivers of nitrogen-related water pollution transfer under globalization from 1995 to 2009. Environ. Res. Lett. 2016, 11, 074017. [Google Scholar] [CrossRef]
  9. Water Resources in China. Available online: http://www.mwr.gov.cn/english/mainsubjects/201604/P020160406508110938538.pdf (accessed on 18 December 2017).
  10. Hashim, S.; Xie, Y.; Hashim, I. Comparative indices evaluation to restore urban rivers water quality by using bacterial technology. Rev. Kasmera 2015, 43, 198–209. [Google Scholar]
  11. Wu, Y.; Dai, H.; Wu, J. Comparative study on influences of bank slope ecological revetments on water quality purification pretreating low-polluted waters. Water 2017, 9, 636. [Google Scholar] [CrossRef]
  12. Wang, M.; Webber, M.; Finlayson, B.; Barnett, J. Rural industries and water pollution in China. J. Environ. Manag. 2008, 86, 648–659. [Google Scholar] [CrossRef] [PubMed]
  13. Water Resources Management and Protection in China. Available online: http://www.mwr.gov.cn/english/mainsubjects/201604/P020160406507020464665.pdf (accessed on 1 December 2017).
  14. China Water Resources Bulletin in 2016. Available online: http://www.mwr.gov.cn/sj/tjgb/szygb/201707/t20170711_955305.html (accessed on 1 December 2017).
  15. Baker, A.; Inverarity, R.; Charlton, M.; Richmond, S. Detecting river pollution using fluorescence spectrophotometry: Case studies from the Ouseburn, Ne England. Environ. Pollut. 2003, 124, 57–70. [Google Scholar] [CrossRef]
  16. Munafò, M.; Cecchi, G.; Baiocco, F.; Mancini, L. River pollution from non-point sources: A new simplified method of assessment. J. Environ. Manag. 2005, 77, 93–98. [Google Scholar] [CrossRef] [PubMed]
  17. Fast, A.W.; Moss, B.; Wetzel, R.G. Effects of artificial aeration on the chemistry and algae of two Michigan lakes. Water Resour. Res. 1970, 9, 624–647. [Google Scholar] [CrossRef]
  18. Ouellet, C. Artificial aeration to increase pollutant removal efficiency of constructed wetlands in cold climate. Ecol. Eng. 2006, 27, 258–264. [Google Scholar] [CrossRef]
  19. Mulligan, C.N.; Yong, R.N.; Gibbs, B.F. An evaluation of technologies for the heavy metal remediation of dredged sediments. J. Hazard. Mater. 2001, 85, 145–163. [Google Scholar] [CrossRef]
  20. Wang, Y.; Zhang, W.; Zhao, Y.; Peng, H.; Shi, Y. Modelling water quality and quantity with the influence of inter-basin water diversion projects and cascade reservoirs in the middle-lower Hanjiang river. J. Hydrol. 2016, 541, 1348–1362. [Google Scholar] [CrossRef]
  21. Wang, Z.; Li, D.; Qin, H.; Li, Y. An integrated method for removal of harmful cyanobacterial blooms in eutrophic lakes. Environ. Pollut. 2012, 160, 34–41. [Google Scholar] [CrossRef] [PubMed]
  22. Trivedy, R.K. Chemical and Biological Methods for Water Pollution Studies; Environmental Publications: Karad, India, 1984. [Google Scholar]
  23. Weaver, D.M.; Ritchie, G.S.P. Phosphorus removal from piggery effluents of varying quality using lime and physico-chemical treatment methods. Environ. Pollut. 1994, 84, 237–244. [Google Scholar] [CrossRef]
  24. Ma, X.; Wang, Y.; Feng, S.; Wang, S. Comparison of four flocculants for removing algae in Dianchi lake. Environ. Earth Sci. 2015, 74, 3795–3804. [Google Scholar] [CrossRef]
  25. Håkanson, L.; Bryhn, A. Water pollution—Methods and criteria to rank, model and remediate chemical threats to aquatic ecosystems. Q. Rev. Biol. 1999, 26, 225–227. [Google Scholar]
  26. Liqiang, X.U.; Haixia, Y.U.; Jianghua, Y.U.; Luo, H.; Zhaoxu, L.I. Study on ecological remediation method of purification of rural polluted slow-flow water. In Proceedings of the International Conference on Biological Engineering and Pharmacy, Wuhan, China, 15–17 December 2017. [Google Scholar]
  27. Guo, W.; Wang, Y.; Wang, H.; Run-Shui, M.A. Water pollution situation and domestic water ecological restoration method research situation. Water Sci. Eng. Technol. 2010, 2, 027. [Google Scholar]
  28. Li, M.C. The domestic and overseas research development in ecological restoration of water environment. China Water Resour. 2007, 11, 011. [Google Scholar]
  29. Sun, L.P.; Yang, L.; Hui, J. Nitrogen removal from polluted river by enhanced floating bed grown canna. Ecol. Eng. 2009, 35, 135–140. [Google Scholar] [CrossRef]
  30. Xie, Y.; Kabobah, A.T.; Song, Y. Bacterial technology as a sustainable solution to polluted urbanized rivers and wastewater treatment systems in China. J. Appl. Technol. Environ. Sanit. 2012, 2, 87–93. [Google Scholar]
  31. Hashim, S.; Xie, Y.; Bah, A. Beneficial bacteria helpful to restore water bodies. Orient. J. Chem. 2014, 30, 1397–1399. [Google Scholar] [CrossRef]
  32. Mani, P.; Keshavarz, T.; Chandra, T.S.; Kyazze, G. Decolourisation of acid orange 7 in a microbial fuel cell with a laccase-based biocathode: Influence of mitigating ph changes in the cathode chamber. Enzyme Microb. Technol. 2016, 96, 170–176. [Google Scholar] [CrossRef] [PubMed]
  33. Hechmi, N.; Bosso, L.; El-Bassi, L.; Scelza, R.; Testa, A.; Jedidi, N.; Rao, M.A. Depletion of pentachlorophenol in soil microcosms with byssochlamys nivea and scopulariopsis brumptii as detoxification agents. Chemosphere 2016, 165, 547–554. [Google Scholar] [CrossRef] [PubMed]
  34. Zheng, Y.; Wang, X.C.; Dzakpasu, M.; Ge, Y.; Zhao, Y.; Xiong, J. Performance of a pilot demonstration-scale hybrid constructed wetland system for on-site treatment of polluted urban river water in northwestern China. Environ. Sci. Pollut. Res. 2016, 23, 447–454. [Google Scholar] [CrossRef] [PubMed]
  35. Sheng, Y.; Qu, Y.; Ding, C.; Sun, Q.; Mortimer, R.J.G. A combined application of different engineering and biological techniques to remediate a heavily polluted river. Ecol. Eng. 2013, 57, 1–7. [Google Scholar] [CrossRef]
  36. Ravikumar, S.; Baylon, M.G.; Si, J.P.; Choi, J. Engineered microbial biosensors based on bacterial two-component systems as synthetic biotechnology platforms in bioremediation and biorefinery. Microb. Cell Factories 2017, 16, 62. [Google Scholar] [CrossRef] [PubMed]
  37. Bosso, L.; Scelza, R.; Testa, A.; Cristinzio, G.; Rao, M.A. Depletion of pentachlorophenol contamination in an agricultural soil treated with byssochlamys nivea, scopulariopsis brumptii and urban waste compost: A laboratory microcosm study. Water Air Soil Pollut. 2015, 226, 1–9. [Google Scholar] [CrossRef]
  38. Sheng, Y.; Chen, F.; Sheng, G.; Fu, J. Water quality remediation in a heavily polluted tidal river in Guangzhou, south China. Aquat. Ecosyst. Health Manag. 2012, 15, 219–226. [Google Scholar] [CrossRef]
  39. Liu, J.; Wu, Y.; Wu, C.; Muylaert, K.; Vyverman, W.; Yu, H.Q.; Muñoz, R.; Rittmann, B. Advanced nutrient removal from surface water by a consortium of attached microalgae and bacteria: A review. Bioresour. Technol. 2017, 241, 1127–1137. [Google Scholar] [CrossRef] [PubMed]
  40. Idi, A.; Nor, M.H.M.; Wahab, M.F.A.; Ibrahim, Z. Photosynthetic bacteria: An eco-friendly and cheap tool for bioremediation. Rev. Environ. Sci. Bio/Technol. 2015, 14, 271–285. [Google Scholar] [CrossRef]
  41. Yudianto, D.; Xie, Y.B. Feasibility of bacterial technology for treating a polluted urban streams from the perspective of numerical modelling. Pol. J. Environ. Stud. 2010, 19, 419–427. [Google Scholar]
  42. Wu, X.; Xie, Y.B. The field application of microbial technology used in bioremediation of urban polluted river. Adv. Mater. Res. 2012, 518–523, 2906–2911. [Google Scholar] [CrossRef]
  43. Qian, Y.; Migliaccio, K.W.; Wan, Y.; Li, Y. Surface water quality evaluation using multivariate methods and a new water quality index in the Indian River Lagoon, Florida. Water Resour. Res. 2007, 43, 199–212. [Google Scholar] [CrossRef]
  44. Luo, F.; Guorong, W.U.; Wang, C.; Zhang, L. Application of nemerow pollution index method and single factor evaluation method in water quality evaluation. Environ. Sustain. Dev. 2016, 2, 026. [Google Scholar]
  45. Jin, J.L.; Wei, Y.M.; Ding, J. Fuzzy comprehensive evaluation model based on improved analytic hierarchy process. J. Hydraul. Eng. 2004, 3, 65–70. [Google Scholar]
  46. Pan, M.; Zhao, J.; Zhen, S.; Heng, S.; Wu, J. Effects of the combination of aeration and biofilm technology on transformation of nitrogen in black-odor river. Water Sci. Technol. 2016, 74, 655–662. [Google Scholar] [CrossRef] [PubMed]
  47. Zimmels, Y.; Kirzhner, F.; Roitman, S. Use of naturally growing aquatic plants for wastewater purification. Water Environ. Res. 2004, 76, 220–230. [Google Scholar] [CrossRef] [PubMed]
Figure 1. The Location of the Chengnan River.
Water 10 00643 g001
Figure 2. Integrated management ideas in combination with traditional Chinese Medicine.
Water 10 00643 g002
Figure 3. The Location of Monitoring Sections in the Main Channel of Chengnan River.
Water 10 00643 g003
Figure 4. The changes of four major water quality parameters before and after microbial treatment: (a) The changes of DO concentration and its improved rate over 18 days; (b) The changes of NH3-N concentration and its removal rate over 18 days; (c) The changes of TP concentration and its removal rate over 18 days; (d) The changes of COD concentration and its removal rate over 18 days.
Water 10 00643 g004aWater 10 00643 g004b
Figure 5. The changes of NH3-N in section A and its trend line.
Water 10 00643 g005
Figure 6. The changes of Nemerow pollution index before and after the microbial treatment.
Water 10 00643 g006
Table 1. Background Values of Water Quality of Chengnan River.
NumberSampling PointsDO
mg/L
NH3-N
mg/L
TP
mg/L
COD
mg/L
FShanghe Square3.24.370.23722.57
ECaihong Bridge3.54.680.34567.72
DJiangpu Bridge3.44.180.33064.71
CRubber Dam6.15.000.35757.19
BPubing Bridge7.54.110.25072.24
ALongwang Temple9.04.110.14187.29
Table 2. China Environmental Quality Standards for Surface Water (GB3838-2002).
ClassificationDO
mg/L
NH3-N
mg/L
TP
mg/L
COD
mg/L
PH
Grade I7.50.150.02156~9
Grade II60.50.115
Grade III51.00.220
Grade IV31.50.330
Grade V22.00.440
Table 3. The Classification of Nemerow Index.
ClassificationCleanLight PollutionModerate PollutionHeavy PollutionMalignant Pollution
Pollution Index≤11~22~33~5>5
Table 4. The monitoring data in Section A from Nanjing Environmental Monitoring Center.
DateNH3-NDOTPCODPHEvaluation Results
(mg/L)(mg/L)(mg/L)(mg/L)6~9
2 May 20171.365.280.1605.807.77GB3838-2002 Grade IV
2 June 20170.307.200.1604.407.65GB3838-2002 Grade IV
Table 5. Water Quality Evaluation of Chengnan River with Nemerow Index Method before treatment.
NumberSampling PointsSingle Factor Evaluation IndexSection Pollotion IndexClassification
NH3-N
mg/L
TP
mg/L
COD
mg/L
FShanghe Square2.90.80.82.3Moderate
ECaihong Bridge3.11.22.32.7Moderate
DJiangpu Bridge2.81.12.22.4Moderate
CRubber Dam3.31.21.92.8Moderate
BPubing Bridge2.70.82.42.4Moderate
ALongwang Temple2.70.52.92.5Moderate
River pollution index3.11.12.52.7Moderate
Table 6. Water Quality Evaluation of Chengnan River with Nemerow Index Method after treatment.
NumberSampling PointsSingle Factor Evaluation IndexSection Pollotion IndexClassification
NH3-N
mg/L
TP
mg/L
COD
mg/L
FShanghe Square2.11.41.41.9Light
ECaihong Bridge2.51.30.72.1Moderate
DJiangpu Bridge2.41.30.92.0Light
CRubber Dam1.71.50.81.6Light
BPubing Bridge2.40.80.51.9Light
ALongwang Temple1.10.70.50.9Clean
River pollution index2.31.31.11.9Light
Table 7. Weight coefficient of water quality evaluation of Section F before treatment.
ParametersDO
mg/L
NH3-N
mg/L
TP
mg/L
COD
mg/L
Sum
Ci3.24.370.23722.57
Si4.71.030.20424
Wi1.474.241.160.947.81
ai0.190.540.150.121.0
Table 8. The calculation results of weight coefficient of six sections before treatment.
NumberSampling PointsDO
mg/L
NH3-N
mg/L
TP
mg/L
COD
mg/L
Sum
FShanghe Square0.190.540.150.121.0
ECaihong Bridge0.130.440.160.271.0
DJiangpu Bridge0.140.410.170.281.0
CRubber Dam0.080.500.180.241.0
BPubing Bridge0.070.450.140.341.0
ALongwang Temple0.060.450.080.411.0
Average0.110.460.150.281.0
Table 9. The calculation results of weight coefficient of six sections after treatment.
NumberSampling PointsDO
mg/L
NH3-N
mg/L
TP
mg/L
COD
mg/L
Sum
FShanghe Square0.120.400.260.221.0
ECaihong Bridge0.130.490.260.121.0
DJiangpu Bridge0.110.480.260.161.0
CRubber Dam0.130.390.330.151.0
BPubing Bridge0.090.590.210.111.0
ALongwang Temple0.140.420.260.181.0
Average0.120.460.260.161.0
Table 10. The weight coefficient fuzzy subset A of the six monitoring sections.
NumberSampling PointsA
Before TreatmentAfter Treatment
FShanghe Square(0.19, 0.54, 0.15, 0.12)(0.12, 0.40, 0.26, 0.22)
ECaihong Bridge(0.13, 0.44, 0.16, 0.27)(0.13, 0.49, 0.26, 0.12)
DJiangpu Bridge(0.14, 0.41, 0.17, 0.28)(0.11, 0.48, 0.26, 0.16)
CRubber Dam(0.08, 0.50, 0.18, 0.24)(0.13, 0.39, 0.33, 0.15)
BPubing Bridge(0.07, 0.45, 0.14, 0.34)(0.09, 0.59, 0.21, 0.11)
ALongwang Temple(0.06, 0.45, 0.08, 0.41)(0.14, 0.42, 0.26, 0.18)
Average(0.11, 0.46, 0.15, 0.28)(0.12, 0.46, 0.26, 0.16)
Table 11. The fuzzy relation matrix R of the six monitoring sections.
NumberSampling PointsR
Before TreatmentAfter Treatment
FShanghe Square [ 0 0 0.1 0.9 0 0 0 0 0 0 0 1 0 0 0.63 0.37 0 0 0 0 0.74 0.26 0 0 ] [ 0 0 0.95 0.05 0 0 0 0 0 0 0 1 0 0 0 0 0 1 0 0 0 0 0 1 ]
ECaihong Bridge [ 0 0 0.75 0.25 0 0 0 0 0 0 0 1 0 0 0 0.55 0.45 0 0 0 0 0 0 1 ] [ 0 0 0.85 0.15 0 0 0 0 0 0 0 1 0 0 0 0.02 0.98 0 0 0 0.8 0.2 0 0 ]
DJiangpu Bridge [ 0 0 0.8 0.2 0 0 0 0 0 0 0 1 0 0 0 0.7 0.3 0 0 0 0 0 0 1 ] [ 0.87 0.13 0 0 0 0 0 0 0 0 0 1 0 0 0 0.23 0.77 0 0 0 0.32 0.68 0 0 ]
CRubber Dam [ 0.07 0.93 0 0 0 0 0 0 0 0 0 1 0 0 0 0.43 0.57 0 0 0 0 0 0 1 ] [ 0 0.7 0.3 0 0 0 0 0 0 0 0 1 0 0 0 0 0 1 0 0 0.57 0.43 0 0 ]
BPubing Bridge [ 1 0 0 0 0 0 0 0 0 0 0 1 0 0 0.5 0.5 0 0 0 0 0 0 0 1 ] [ 1 0 0 0 0 0 0 0 0 0 0 1 0 0 0.52 0.48 0 0 0 0.86 0.14 0 0 0 ]
ALongwang Temple [ 1 0 0 0 0 0 0 0 0 0 0 1 0 0.59 0.41 0 0 0 0 0 0 0 0 1 ] [ 1 0 0 0 0 0 0 0 0 0.82 0.18 0 0 0.01 0.99 0 0 0 0 0.77 0.23 0 0 0 ]
Average [ 0 0.5 0.5 0 0 0 0 0 0 0 0 1 0 0 0.23 0.77 0 0 0 0 0 0 0 1 ] [ 0.4 0.6 0 0 0 0 0 0 0 0 0 1 0 0 0 0.55 0.45 0 0 0 0.57 0.43 0 0 ]
Table 12. The degree of membership before and after treatment.
NumberSampling PointsB
Before TreatmentAfter Treatment
FShanghe Square { 0 , 0 , 0.20 , 0.26 , 0 , 0.54 } { 0 , 0 , 0.11 , 0.01 , 0 , 0.88 }
ECaihong Bridge { 0 , 0 , 0.10 , 0.12 , 0.07 , 0.71 } { 0 , 0 , 0.21 , 0.05 , 0.25 , 0.49 }
DJiangpu Bridge { 0 , 0 , 0.11 , 0.15 , 0.05 , 0.69 } { 0.10 , 0.01 , 0.04 , 0.17 , 0.20 , 0.48 }
CRubber Dam { 0.01 , 0.07 , 0 , 0.08 , 0.10 , 0.74 } { 0 , 0.10 , 0.12 , 0.06 , 0 , 0.72 }
BPubing Bridge { 0.07 , 0 , 0.07 , 0.07 , 0 , 0.79 } { 0.09 , 0.10 , 0.12 , 0.10 , 0 , 0.59 }
ALongwang Temple { 0.06 , 0.05 , 0.03 , 0 , 0 , 0.86 } { 0.14 , 0.14 , 0.30 , 0.34 , 0.08 , 0 }
Average { 0 , 0.06 , 0.09 , 0.12 , 0 , 0.74 } { 0.05 , 0.07 , 0.09 , 0.21 , 0.12 , 0.46 }

