Computational Fluid Dynamics for Modeling Gravity Currents in the Presence of Oscillatory Ambient Flow


Department of Civil Engineering and Architecture, Via Santa Sofia 64, 95125 Catania, Italy
*
Author to whom correspondence should be addressed.
†
These authors contributed equally to this work.
Water 2018, 10(5), 635; https://doi.org/10.3390/w10050635
Submission received: 15 February 2018
/
Revised: 7 May 2018
/
Accepted: 8 May 2018
/
Published: 14 May 2018
(This article belongs to the Special Issue Turbulence in River and Maritime Hydraulics)
Abstract
:Gravity currents generated by lock release are studied in the case of initially quiescent ambient fluid and oscillating ambient fluid (regular surface waves). In particular, the dynamics of the density currents are investigated by means of CFD numerical simulations. The aim is to evaluate the influence of the ambient fluid velocity field on the observed mixing and turbulent processes. Results of two different turbulence closure models, namely the standard turbulence model and the LES model, are analyzed. Model predictions are validated through comparison with laboratory measurements. Results show that the model is able to catch the main current propagation parameters (e.g., front velocity at the different phases of the evolution of the current, gravity current depth, etc.), but that a LES model provides more realistic insights into the turbulent processes (e.g., formation of interfacial Kelvin–Helmholtz billows, vortex stretching and eventual break up into 3D turbulence). The ambient fluid velocity field strongly influences the dynamics of the gravity currents. In particular, the presence of an oscillatory motion induces a relative increase of mixing at the front (up to 25%) in proximity of the bottom layer, and further upstream, an increase of the mixing process (up to 60%) is observed due to the mass transport generated by waves. The observed mixing phenomena observed are also affected by the ratio between the gravity current velocity and the horizontal orbital velocity induced by waves , which has a stronger impact in the wave dominated regime (< 1).
1. Introduction
Gravity currents are mainly horizontal flows moving under the influence of gravity and generated by buoyancy differences. Gravity currents are phenomena of great interest in the field of engineering and geophysics with numerous important environmental and industrial applications [1,2]. These include: the outflow of brackish waters [3] referred to as viscous gravity currents, pyroclastic flows [4] referred to as particle-laden gravity currents and mud and debris flows [5,6] referred to as concentrated flows.
The propagation of gravity currents under oscillatory wave regimes is quite relevant in coastal regions, especially to understand the processes acting during the continuous natural or artificial discharges of fluids having a different density than the ambient fluid, e.g., river plumes, desalination plant, industrial discharges, etc. [3,7]. Notwithstanding the fact that the discharge of fresh or brackish water in the sea is frequent, the effect of the wave motion on the propagation in coastal regions of the salt-brackish wedge has not been systematically investigated yet [8].
In the absence of waves, extensive laboratory investigations have been carried out in the field of viscous gravity currents. Several geometries of the flow domain have been investigated, for example: smooth bottom [9], rough beds [10], sloping bottoms [11,12,13,14], the presence of obstacles [15] and stratified ambient fluid [16]. Experimental studies usually involve hydraulic flumes filled with a lower density fluid, and the current is generated by means of lock or point release of a higher density fluid. In the former approach, the heavier fluid is contained in a lock, whose gate is suddenly removed, while in the latter approach, the heavier fluid is released from a point source. The analysis of the advancing front and of the instabilities has often been carried out through image analysis. In this case, images are acquired from the side glass wall of the tank. Such an experimental setting allows for width-averaged density measurements in a 2D configuration, which could result in a limited analysis in terms of turbulence structures. Indeed, studies adopting 2D numerical simulation were successful in the description of turbulence structures; for example, Dai [17] describes the gravity current propagation in the acceleration phase, during which three-dimensional interactions are not important. However, Cantero et al. [18] points out the importance of three-dimensional processes governing the interface between heavy and light fluids, which first roll up by baroclinic generation of Kelvin–Helmholtz vortices and then undergo sudden breakup and decay to small-scale turbulence. In such a case, numerical three-dimensional analyses, as the one carried out by Ottolenghi et al. [19], should be applied. In fact, unless one adopts a very complex and expensive high-speed camcorder and 3D particle image velocimetry [20], it is extremely difficult to have information on the 3D turbulent processes that influence mixing by just considering 2D lab data. Measurements of the instantaneous bed shear stress distribution are nearly impossible to achieve experimentally [21]. Indeed, detailed measurements of the velocity and density fields within the gravity current are seldom available from experimental studies [21]. High-resolution numerical simulations can overcome the lack of information previously mentioned, providing also information on the global energy balance at different stages of the density current evolution [22,23,24,25,26]. In the past, numerical simulations provided important information of the entrainment mechanisms characteristic of the gravity current, and important progress is summarized as follows. The application of direct numerical simulations provided important results in order to clarify the instability mechanism that governs the formation of the complex lobe-and-cleft pattern commonly observed at the leading edge of gravity currents [22,23]. Ooi et al. [21] investigated, using large eddy simulations (LES), the compositional gravity current flows produced by the instantaneous release of a finite volume and heavier lock fluid in a rectangular horizontal plane channel. The LES numerical simulations provided insightful results, describing the development of turbulent structures during the slumping phase and the buoyancy-inertia phase. High-resolution two-dimensional Navier–Stokes simulations provided interesting results on the entrainment mechanisms governing the gravity current propagating downslope. In particular, the interface roll-up and vortex overturns were studied varying parameters as the depth ratio and the slope angle [17]. The entrainment and mixing in unsteady gravity currents were studied by Ottolenghi et al. [19] performing LES simulations, focusing on the influence of the aspect ratio and density difference. The results showed that irreversible mixing is detected during the entire development of the flow, not only during self-similar phases, but also during the slumping phase.
The interaction between gravity currents and oscillatory motion has been investigated only in a few works [8,27,28,29]. Ng and Fu [27] studied numerically the spreading of viscous gravity currents propagating in intermediate and deep water depth conditions, observing that wave-induced streaming flow acting at the bottom is responsible for changes in the gravity current velocity speed. Robinson et al. [8] were the first to analyze in laboratory the influence of the orbital motion induced by the presence of regular progressive free-surface water waves on the gravity current propagation. They adopted a point release technique and observed the self-similar phase of the two fronts respectively propagating under regular surface waves in deep water condition. Musumeci et al. [28] investigated the propagation of gravity currents under regular surface waves, modeling the phenomenon both experimentally and numerically. The gravity currents were modeled assuming low density difference and intermediate water depth conditions and adopted the lock-exchange problem for the generation of the gravity current. They focused on the front spreading evolution, comparing the experimental evidence with numerical results, and on the capability of the numerical model to reproduce the 2D turbulence at the interface. Viviano et al. [30] investigated the turbulence observed during the interaction between waves and gravity currents. They adopted a simple 2D numerical model that couples a Boussinesq-type of model for surface waves and a gravity current model for stratified flows. The velocity is decoupled into a wave-related component and a density gradient-related component. Turbulence is described by two alternative approaches: a simple subgrid Smagorinsky formulation, and the Smagorinsky formulation with a depth uniform eddy viscosity. Such a model designed for engineering applications needs a previous careful calibration process to choose the calibration parameters of the Smagorinsky formulation. The recent work of Stancanelli et al. [29] has explored a larger dataset compared to the one presented by Musumeci et al. [28] evaluating the change of front velocity and mixing at the front of the current for a large number of wave types and different density fluid ratio conditions. They show that the front velocity is related to the Lagrangian mass transport induced by the surface waves, while the mixing observed at the front is related to the orbital motion.
The aim of the present work is to numerically investigate the influence of the ambient fluid velocity field on the mixing processes and the formation of three-dimensional turbulent structures generated by the density current propagation. The objective of the present study is also to explore the dynamics of density currents adopting different turbulence models and to discuss the possibility to adopt them for engineering applications. The numerical simulation of high Reynolds number flows is hampered by model accuracy if the Reynolds-averaged Navier-Stokes (RANS) equations are used, and by computational cost if a more sophisticated model, such as direct or large-eddy simulations (LES), is adopted [31]. Here, we highlight the performance of numerical models in a very complex flow, such as the superimposition of gravity currents and surface waves. 3D flow structures are discussed not only at the front, but also along the entire gravity current and at the bottom boundary. To the authors’ knowledge, this has never been attempted before. Indeed, previous works [28,29,30] were able only to comment on the 2D features of the turbulence structures, not taking into account small-scale structures. Numerical modeling is carried out by means of a computational fluid dynamics model (CFD). Two different turbulence closure schemes are used, namely the standard turbulence model [32] and the LES model [33]. A volume of fluid (VOF) model is used to account for free surface effects [34]. The capability of the two turbulence closures to predict various important dynamics of density current propagation in the presence of waves (i.e., propagation speed, gravity current height and density profile) is discussed by comparing the numerical results with the laboratory experiments of Stancanelli et al. [29]. Results highlight how not only the current propagation, but also the turbulent structures and consequently the density field are significantly affected by the nonlinear interaction between the gravity current and the regular surface waves.
2. Materials and Methods
2.1. Model Description
The CFD computational model used in the present work is the FLOW-3D model distributed by Flow Science Inc., which is considered a powerful tool thanks to its capabilities of accurately predicting free-surface flows. In particular, in FLOW-3D, the free surface is modeled by the volume of fluid (VOF) technique. The VOF method consists of three ingredients: a scheme to locate the surface, an algorithm to track the surface as a sharp interface moving through a computational grid and a means of applying boundary conditions at the surface. Such a model is described in Hirt and Nichols [34]. Since its commercial release, FLOW-3D has been used in research, providing to engineers valuable insight into many physical flow processes [35,36,37,38].
A variety of turbulence models for simulating turbulent flows, including the Prandtl mixing length model, the one-equation model and the standard two-equation model, the re-normalization group (RNG) scheme and the large eddy simulation (LES) model, are available within FLOW-3D. These turbulence models have been well tested and documented in the relevant technical literature [1].
The standard model and the LES model are considered here, since the first one is able to catch the main characteristics of the flow at a relatively low computational cost, while the LES scheme is more sophisticated and is able to account in a physical way for the effect of the smallest unresolved scales on the larger ones in a flow. FLOW-3D employs the finite difference/control volume method to discretize the computational domain. In particular, the physical domain to be simulated is decomposed by using Cartesian grids composed of variable size hexahedral cells. Applications are presented later in Section 3.
The following continuity equation and momentum equations are solved along with the turbulent closure equations:
where:
where is the mean velocity, p is the pressure, is the fractional open area open to flow in the i direction, is the fractional volume open to flow, g represents the gravity acceleration, represents the viscous acceleration, is the strain rate tensor, is the wall shear stress, is the density of water, is the total dynamic viscosity including the effect of turbulence , with being the dynamic viscosity and the eddy viscosity. For the model, the eddy viscosity is approximated as:
where the following closure equations for the turbulent kinetic energy k and the dissipation rate are:
The constant coefficients are chosen based on the classical model of Launder and Spalding [39]: = 0.09 ( = 1.44, = 1.92, = 1.00, = 1.30).
Regarding the LES model [40,41], a Smagorinsky approach [42] is used to approximate the eddy viscosity as:
where the constant c = 0.2, = 0.09 as in the model, the strain rate tensor is given by:
and the characteristic length scale is defined as:
It is worth pointing out that the two different turbulence models have different computational costs. Piomelli [31] argued that the cost of a calculation scales like the Reynolds number to the power 2.4 for LES. The computational cost of LES model is about 4–100-times higher than that required by the RANS model [43,44].
Additionally, FLOW-3D is able to simulate the free surface wave motion, considering both regular linear [45] or nonlinear waves and irregular waves. In particular, three nonlinear wave theories are used for nonlinear wave generation: the fifth-order Stokes wave theory [46], the Fourier series method for Stokes and cnoidal waves [47] and McCowan’s theory for solitary waves [48,49].
2.2. Flume Tests
The experiments presented here, used for validating the numerical results, are those carried out at the small-scale wave flume of the Hydraulic Laboratory of the University of Catania. The experimental apparatus is the one adopted and presented by Musumeci et al. [28] and Stancanelli et al. [29]. In the following, we present a brief description of the experimental apparatus and of the experimental procedure, as well as the controlling parameters of the tests used for validation. More detailed information can be found in the cited literature.
The flume is 9 m long, 0.5 m wide and 0.7 m high. A piston-type wave maker is located at the initial section (x = 0 m) of the flume, while at the opposite side, a porous beach minimizes wave reflection. In order to carry out classical lock exchange tests, the flume is partitioned by a Perspex sluice gate (at x = 5.10 m). Salt water, having density , is present at the wave maker side of the gate and fresh water, having density , at the onshore side.
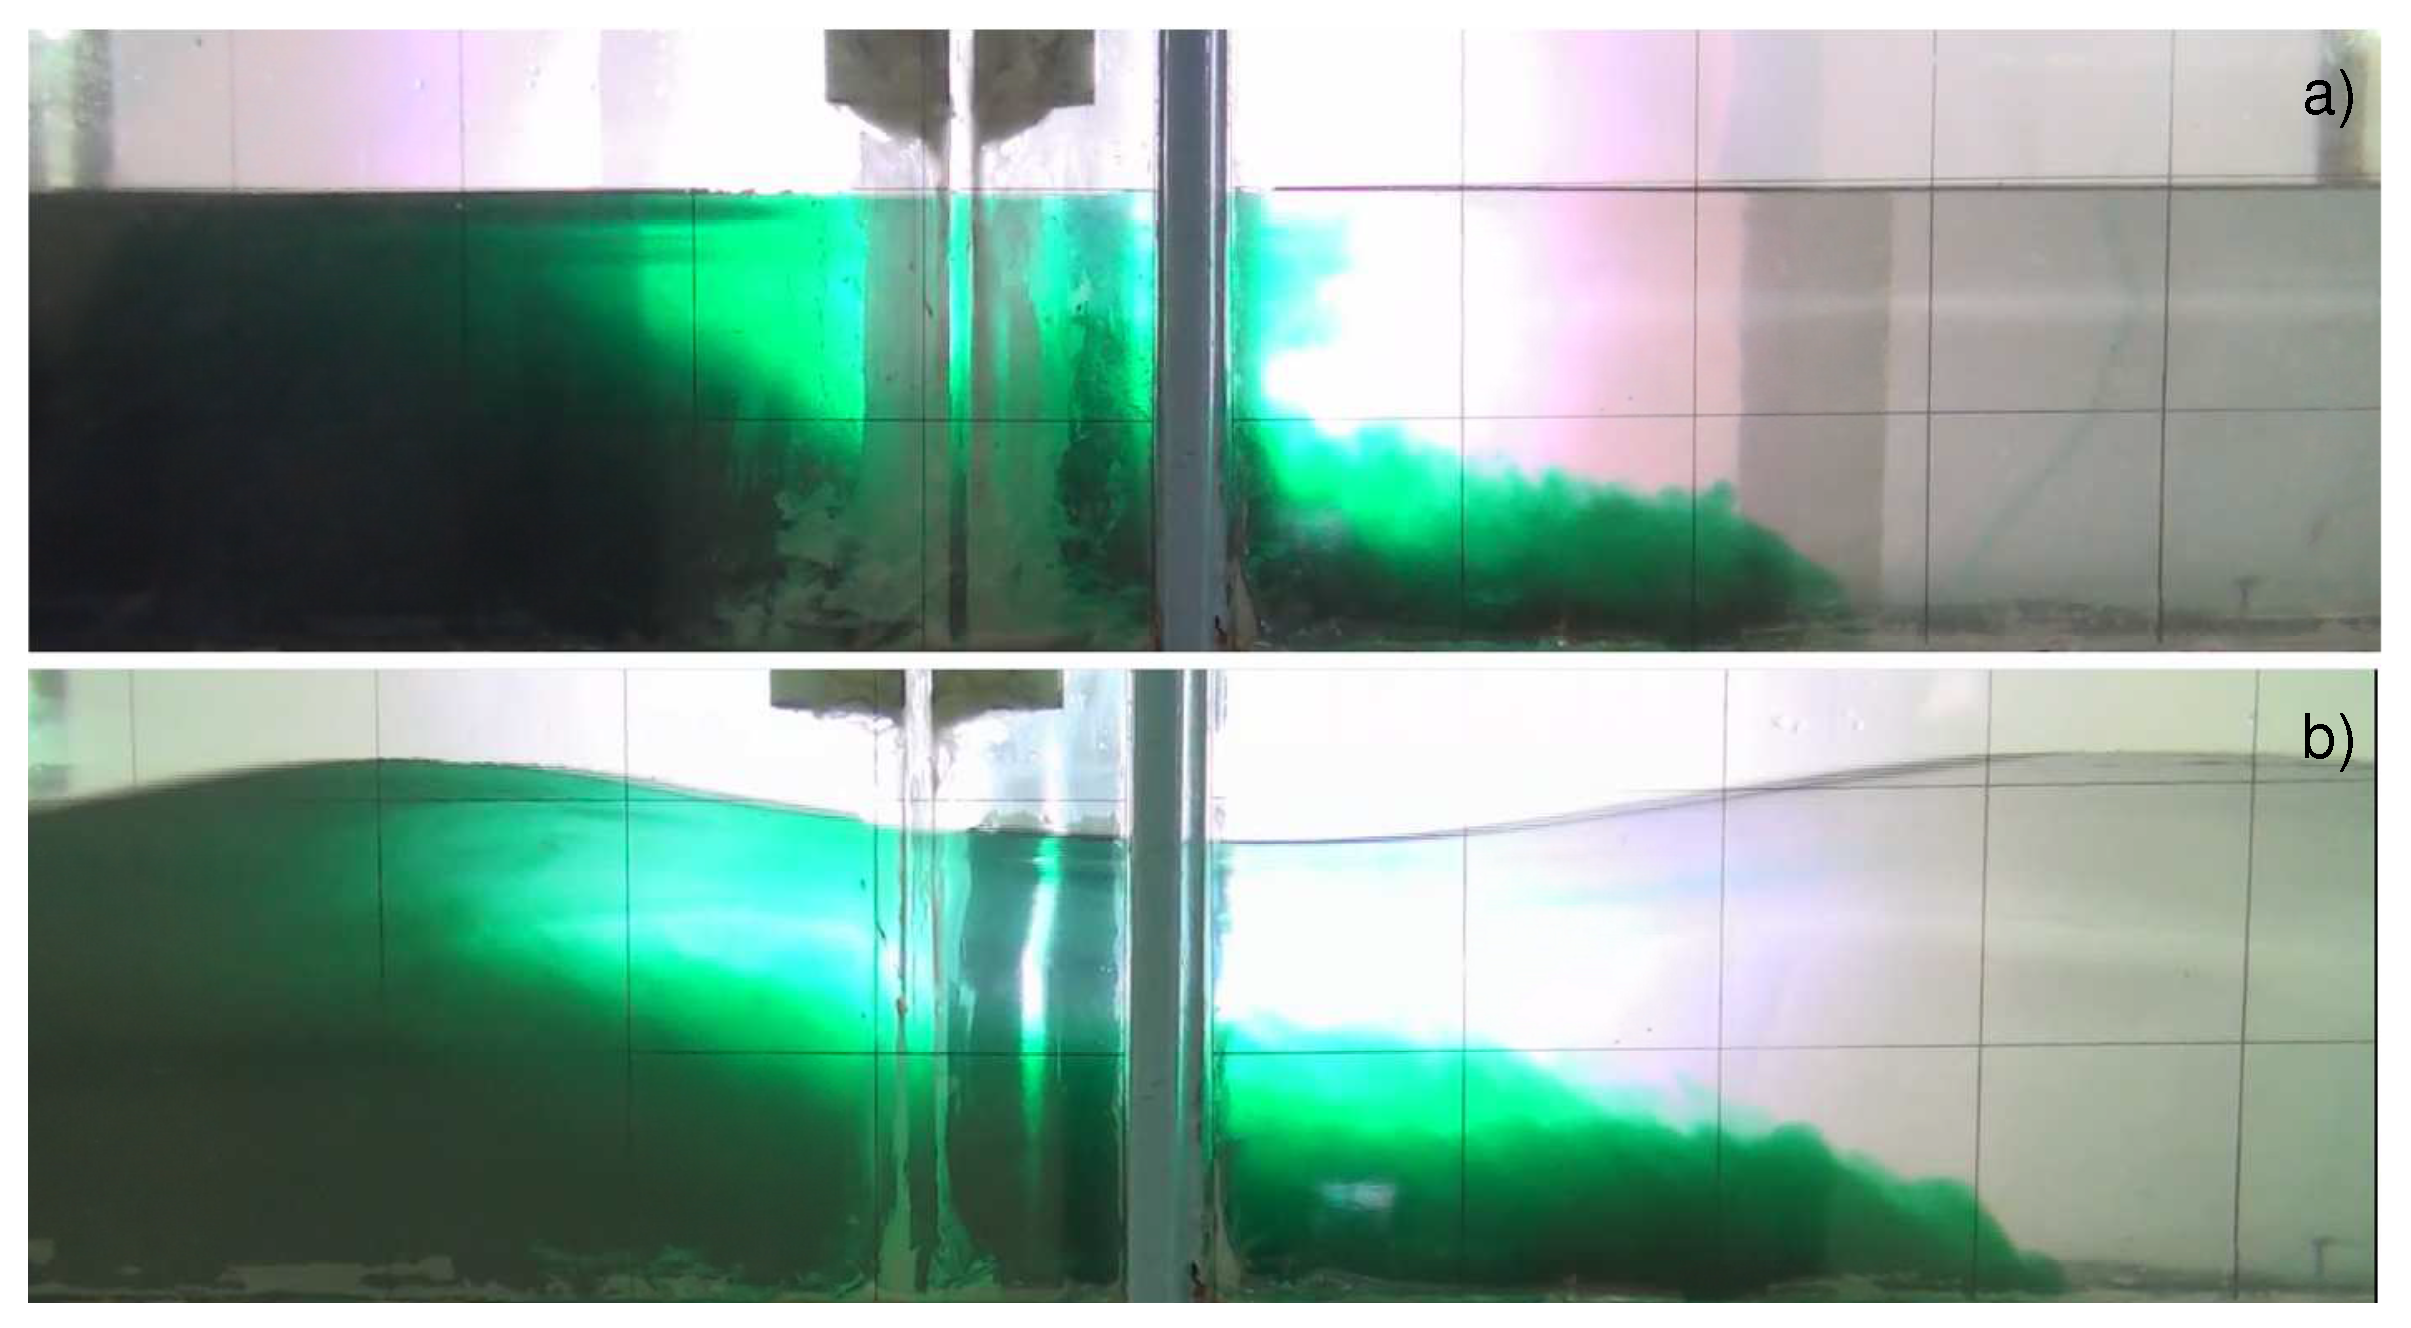
Full-depth two-dimensional lock-exchange experiments have been carried out with and without regular waves (see Figure 1). At the beginning of each test, samples of the two fluids are collected and then analyzed to measure the density difference. The generation of the gravity currents is performed by manually opening the sluice gate. During the tests performed in the presence of regular waves, the wave maker is activated and the sluice gate is removed only when the first wave is approaching the lock position. The laboratory experimental observations, video-recorded from the side wall, provide information about the geometric and kinematic characteristics of the front propagation. The parameters investigated are the shape, depth and velocity of the current, as well as width-averaged maps of the density field.
The controlling parameters of the experiments are the initial still water level within the flume H, the salt water density , the fresh water density , the reduced gravity where g is the gravitational acceleration, the wave height and the wave period . All experimental results refer to gravity current propagation during the slumping phase, characterized by a constant velocity advancement of the front. The density difference is always such that the Boussinesq approximation (∼ 1) is satisfied. Table 1 reports the values of the controlling parameters of the tests used for model validation. The selected tests include gravity currents characterized by different reduced gravity and different wave conditions. From the dataset of Stancanelli et al. [29], the particular case of the current-dominated regime () has been investigated here (Case No. 6 with = ), as well as different wave-dominated regimes (Case Nos. 2, 4, 5 with = 0.7–0.8). The wave conditions correspond to: shorter regular surface waves (i.e., Case Nos. 2, 4, 5) and longer surface waves (i.e., Case No. 6). Test cases in the absence of waves are also presented as a benchmark (i.e., Case 1 and Case 3).
3. Numerical Simulations
Simulations are performed for flow conditions that correspond to the laboratory experimental setup described in Section 2.2. The computational flume is 9 m long, 0.5 m wide and 0.7 m high. The dimensions are the same as the experimental flume.
The computational grid system is composed of different nested meshes (see Figure 2): two coarser ones (Mesh 1 and Mesh 2, with cubic cells having size 0.01 m) for defining the two different fluid regions, namely the saltier water and the fresh water; a finer grid to more accurately solve the interface region between the two fluids (Mesh 3, whose cell size is 0.005 m); and a finer grid at the bottom (Mesh 4, with cell size 0.003 m). The latter grid permits one to better investigate turbulent structures that develop at the bottom, as lobe and cleft instabilities. The choice of the grid size is the result of a preliminary analysis carried out following the suggestions of Ooi et al. [21], Boris et al. [50], Kyrousi et al. [51] (grid spacing is equal to 0.01–0.05 H).
All boundaries of the flow domain are defined as no-slip smooth walls, except the free surface where a constant pressure is selected as the boundary condition. A zero-gradient boundary condition is used at the initial interface of the two fluid mesh blocks. The dynamics of the gravity currents is considered independent of the gate opening operation, since the time scale of current propagation and wave-current interaction is larger than the time scale of gate opening. Moreover, the analysis is carried out about a water depth of 10 from the lock position. Therefore, in the measuring area, the effects of operations at the gate can be assumed to be negligible.
For the case of gravity currents in the presence of waves, at the offshore end of the saltier side, a regular wave field is generated and enters the domain. The wave is assumed to come from a flat bottom reservoir, which is located outside the computational domain. For the description of the wave motion, the Fourier series method for Stokes and cnoidal waves, which possesses higher order of accuracy than other wave theories [52], is selected. Such a method is selected since in intermediate waters, as the present ones, cnoidal waves are a better representation than linear waves of the experimentally-generated constant-shape waves [53]. Moreover, in such a case, in order to avoid wave reflection from the onshore boundary, an absorbing layer at the end of the tank is adopted. Such an absorbing layer mimics the effect of the porous beach in the experiments.
4. Results
The CFD model was used to simulate different experimental tests characterized by different density ratios and different ambient fluid conditions (presence and absence of waves). The model is applied both to a classical lock exchange problem with initially quiescent ambient fluid (see Test No. 1 and No. 3) and to reproduce lock exchange experiences in the presence of short regular surface waves (i.e., Case Nos. 2, 4, 5) and long surface waves (i.e., Case No. 6). The simulated flow conditions (i.e., water depth, salinity difference, wave characteristics, etc.) are the same as the experimental ones reported in Table 1. Simulations adopting the turbulence model and the LESturbulence model are compared. An Intel(R) Core(TM) i7-4790 CPU 3.60-GHz processor has been used to run all the numerical simulations. On this processor, simulations adopting the turbulence model required about × of CPU time, whereas the LES turbulence model required about × of CPU time.
The validation of the numerical model is performed by comparing the experimental results of Stancanelli et al. [29] of the front position with the numerical results. Figure 3 reports the experimental results, the numerical results and the predictions of the model of Huppert and Simpson [54] for Test No. 1 and No. 3, which are characterized by different reduced gravity values. The well-known model of Huppert and Simpson [54] has been proposed to predict the front evolution in the slumping phase, and it has been calibrated on a set of experimental data. A linear behavior is recognizable, indicating that the observed gravity currents are in the constant-velocity phase (slumping phase). The and the LES simulations agree fairly well with each other in terms of the front positions. Indeed, both numerical results show a linear trend characterized by the same angular coefficient. The slope of the linear trend of the front advancement indicates that for lower reduced gravity (Test No. 3), the averaged front velocity is of about 5.4 cm/s, which is equal to the value measured in the lab ( = 5.4 cm/s); while for higher reduced gravity (Test No. 1), it indicates an averaged velocity of 6.2 cm/s, which is slightly smaller than the measured value reported in Stancanelli et al. [29] ( = 6.4 cm/s). In general, as should be expected, an increase of the reduced gravity is responsible for an increase of the front velocity.
The influence of the adopted closure schemes is appreciable when comparing the front shape. Figure 4 shows the gravity current front after t = 12.8 s from the sluice gate opening respectively for (a) the experimental results of Stancanelli et al. [29], the numerical results applying (b) the model and (c) the LES model. The gravity current shape of the experimental evidence, defined applying a density concentration threshold equal to 0.96, is reported as a dash-dotted green line over the numerical results. As expected, the model tends to smooth out the shape of the interface showing also a front with a round shape (Figure 4b). The LES turbulence model, instead, reproduces a sharper front (Figure 4c), which agrees better with the experimental observations (Figure 4a). Furthermore, the dynamics at the interface between the two fluids is better reproduced by the LES model, since mixing processes induced by the shear between the two fluids and at the bottom induced by the wall effect are better represented.
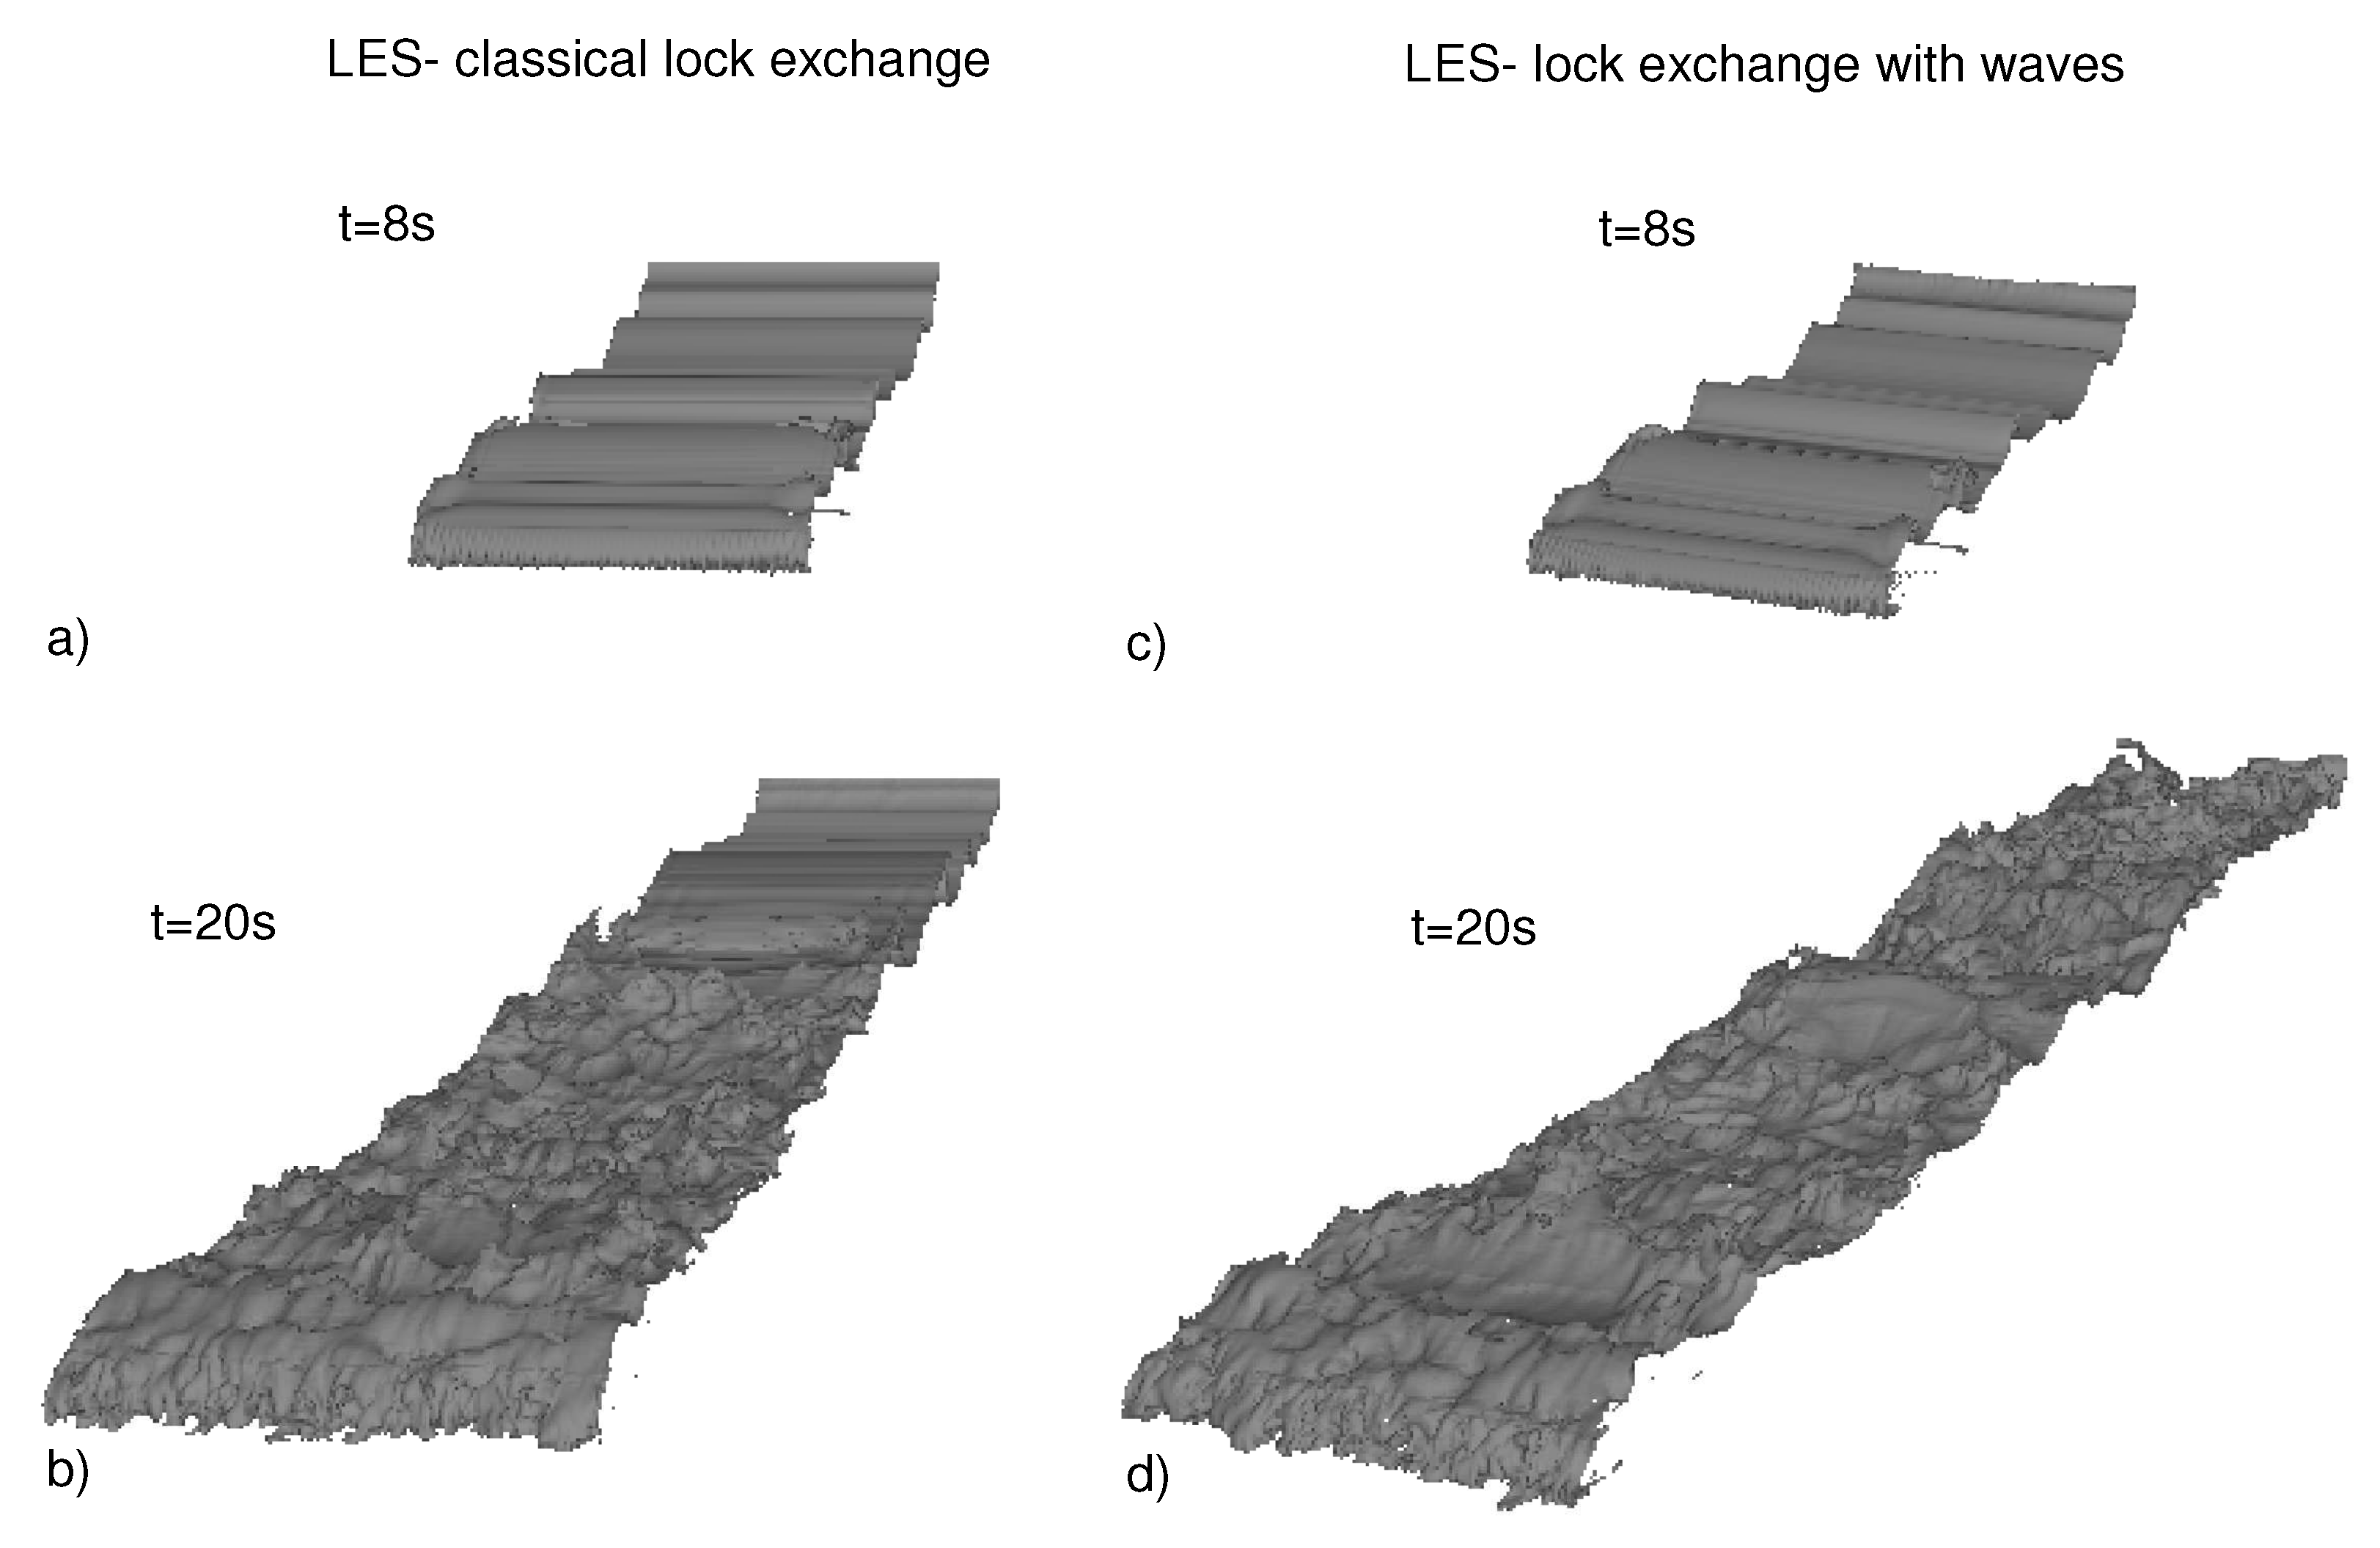
Both turbulence models are able to reproduce the development of K-H billows. Such turbulent structures are mainly 2D. This allows one to investigate them also using width-average measurements acquired at the side wall. However, the experimental observations fail to describe small-scale instabilities. For investigating such instabilities, we analyze the results of the LES model, which is more reliable, and it enables us also to observe the presence of 3D structures, such as lobe and cleft instabilities interacting with K-H billows. In the numerical simulations, the lobe and cleft development is observed 5 s after the sluice gate opening. The development of these instabilities caused the loss of the coherent structure of the K-H billows. In Test 1, when the density current propagates in initially quiescent ambient fluid, the small instabilities at the interface appear first in the region just behind the front and then propagate further downstream (see Figure 5a,b). This result is in agreement with the results of Cantero et al. [18], which observed firstly that fluids roll up by baroclinic generation of Kelvin–Helmholtz vortices and then the breakup and decay of these vortices into small-scale turbulence structures, which propagate upstream with time. In the presence of waves (Test 2), a similar generation of K-H billows at the interface and of lobe and clefts at the bottom occurs only during an initial phase. After such a short transitory, the effects of the wave-induced motion can be clearly recognized. In particular, 3D instabilities are formed all over the interface of the gravity current as the response of the non-linear interaction with the superimposed wave field (see Figure 5c,d). It appears that for an experimental duration less than 4 s, the presence of waves does not play a role; while for longer durations, a significant contribution of the orbital motion is observed. In particular, the intensity of the turbulence is reduced at the interface near the saltier front.
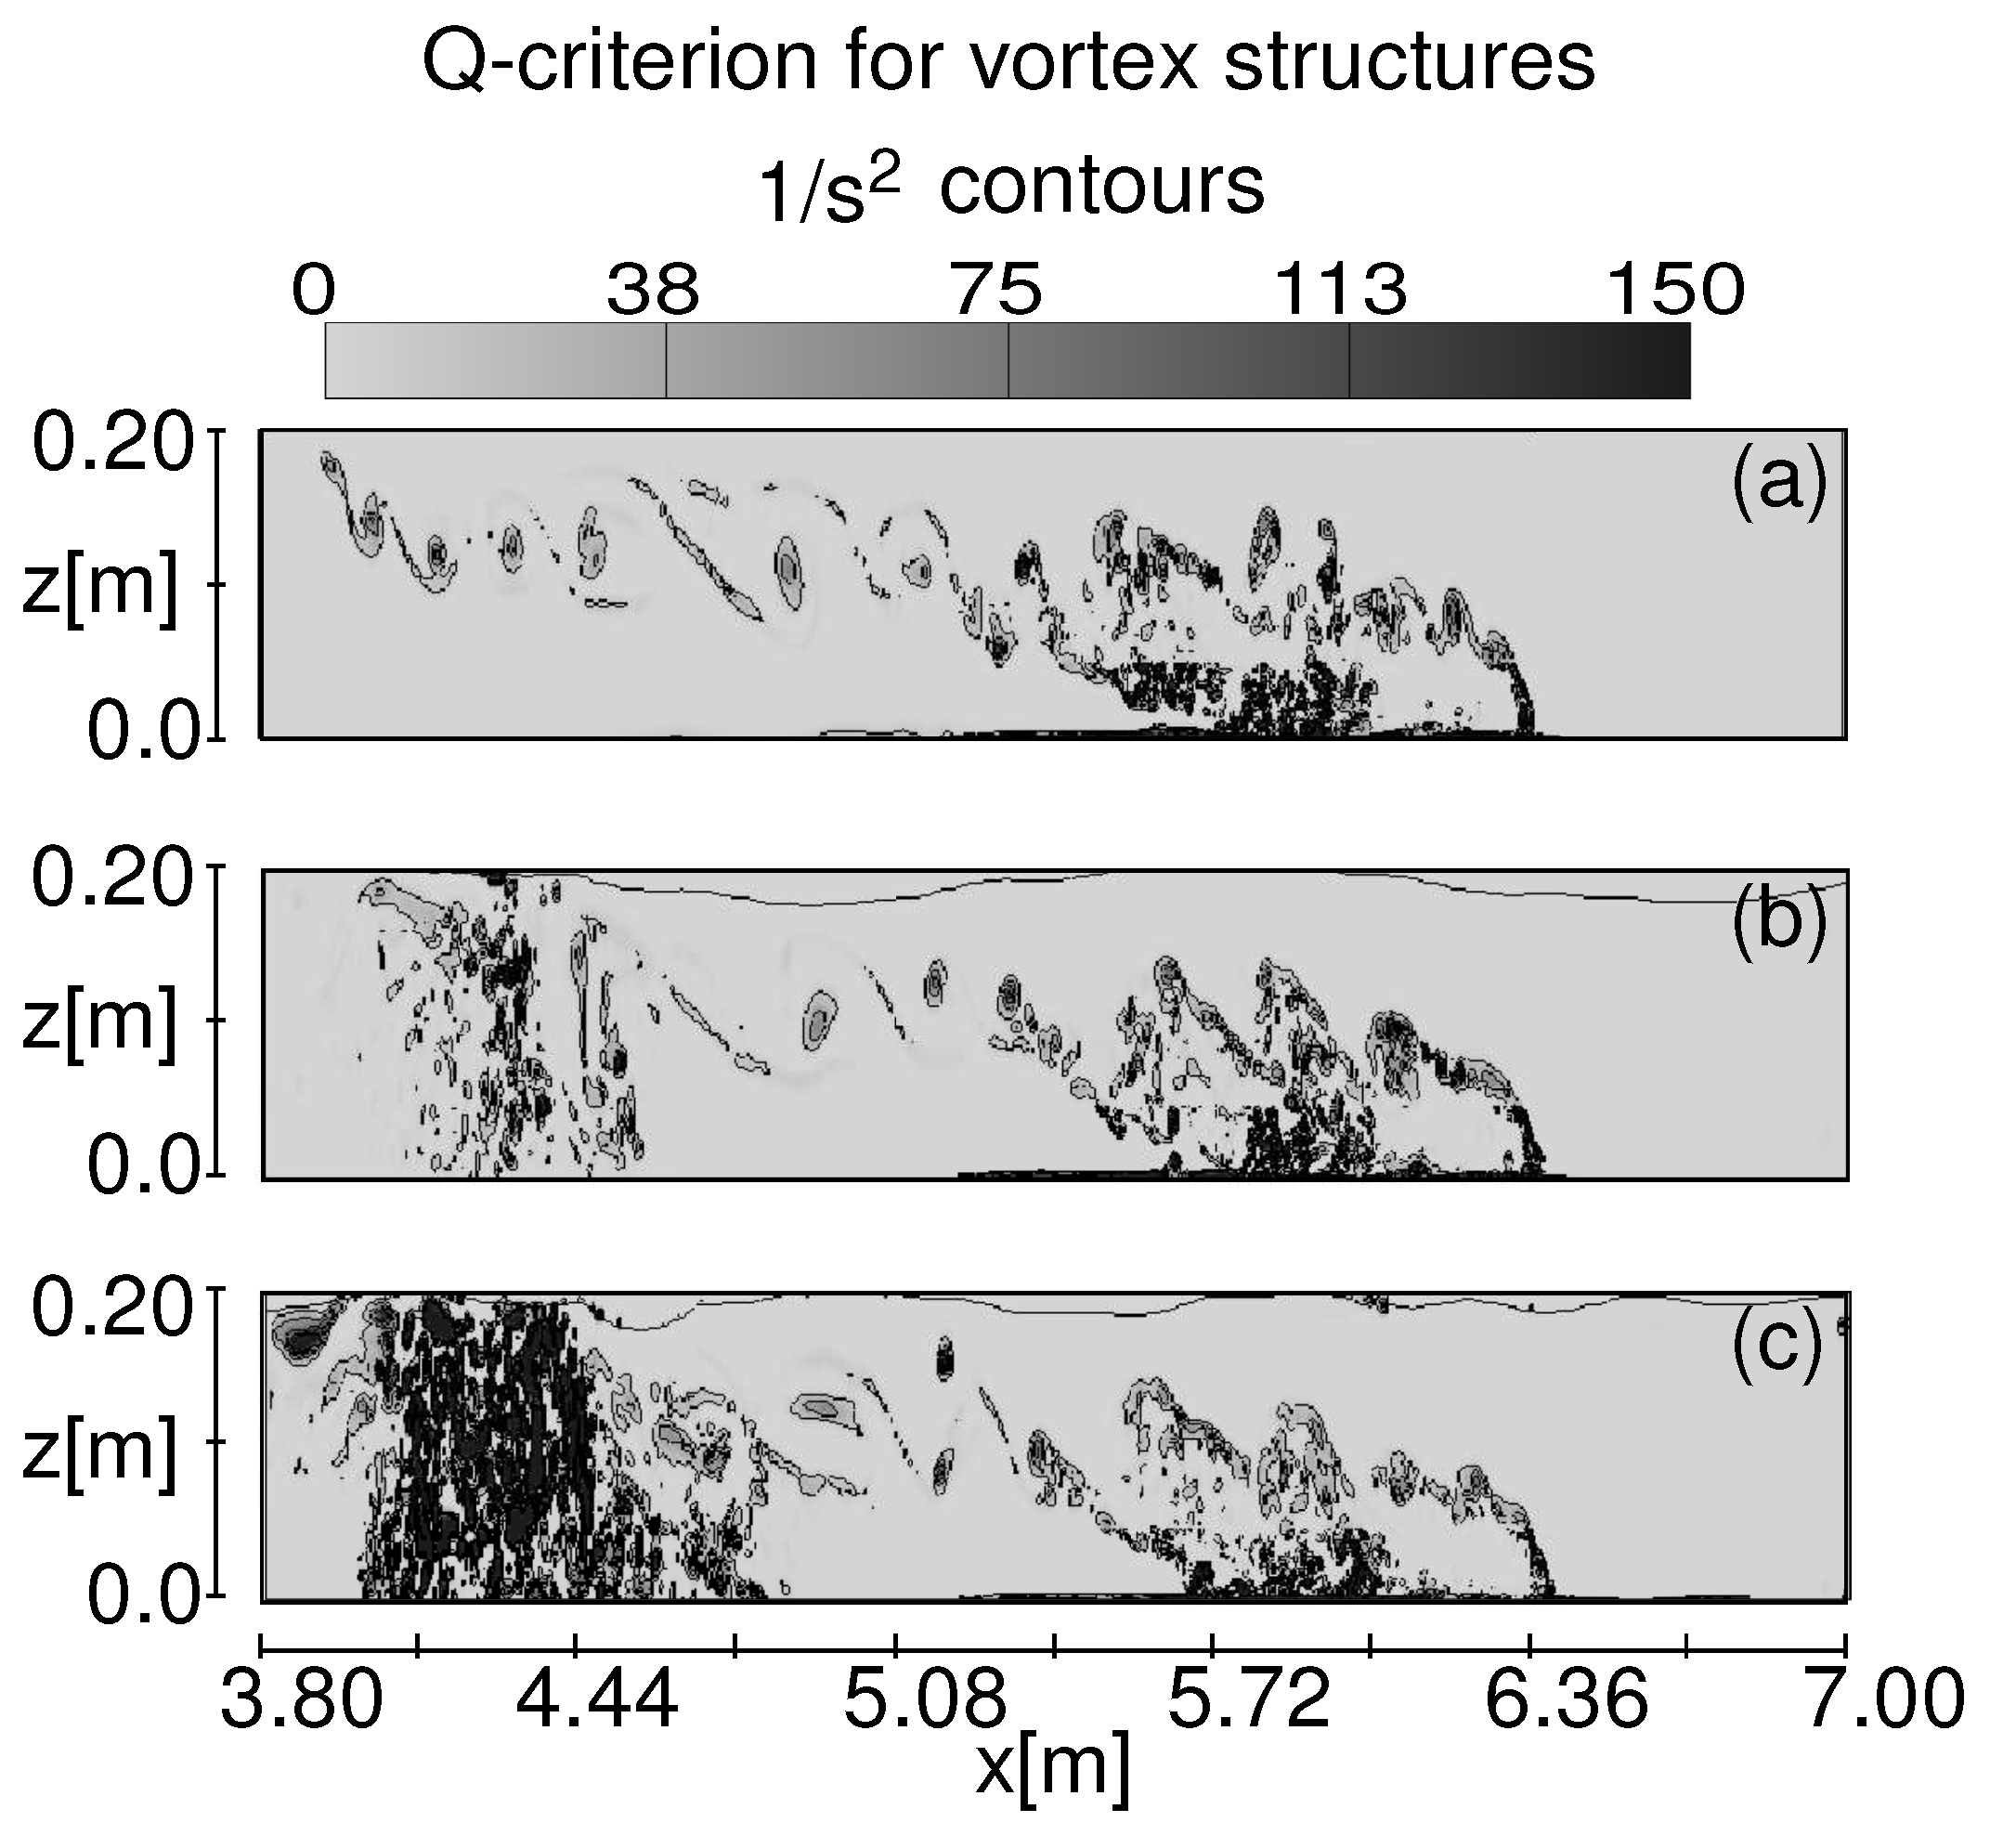
In order to better clarify the influence of the wave motion, the turbulent structures observed at the middle longitudinal section are represented adopting the Q-criterion (see Figure 6). Also in this case, we can compare the condition of quiescent ambient fluid (Case 1) and of superimposed surface waves (Cases 5 and 6). It can be noticed for all cases presented that the region behind the front (linear extension of about 0.6 m) is strongly turbulent. In particular, a turbulent layer close to the bottom boundary of the channel is identified along the x-axis from the front (x = 6.36 m) until behind the section x = 5.50 m. Such a turbulent layer, responsible for quasi-streamwise vortices and hairpin vortices, was also observed in the experimental and numerical analysis of Cantero et al. [18] and of Kyrousi et al. [51], and it will be further discussed in the following. Turbulence structures that govern the region upstream (4.50 m < x < 5.50 m) show a regular pattern with cores of the vortices alined along an ideal horizontal in the presence of quiescent ambient fluid. Instead, for both analyzed wave conditions, the cores of the vortices are losing the coherent characteristic of the K-H billows. Relevant differences between the absence and the presence of waves can be noticed in the upstream region (3.80 m < x < 4.50 m) where the appearance of numerous small turbulence structures is identified in the presence of the oscillatory motion. Such phenomena are responsible for an increased mixing in the presence of waves (see Figure 7b,c), which is predominantly for the test case characterized by a wave-dominated ( > ) regime (Figure 7c). As could be reasonably expected, the current-dominated () regime shows turbulence features more similar to the quiescent ambient fluid case. The spatial distribution of these wave-induced small-scale vortices differs for the two type of waves. In particular, for the longer wave case, they are distributed vertically along the water column, while for shorter waves, an increment of the presence of small structures close to the bottom boundary layer is observed. We believe that the generation of the small-scale vortices, in Test No. 5 and No. 6, is dependent on the mass transport induced by the wave propagation. This assumption is also supported by different studies [55,56,57,58] on the wave-induced turbulence, which argued that the turbulent kinetic energy dissipation rate is mainly influenced by a component of the mass transport, the Stokes drift.
In the upper layer, the waves induce a mass transport in the opposite direction of the lighter front propagation (offshore direction), which results in a rearrangement of the density gradient (see Figure 7). In the lower region, in the case of shorter waves, the mass transport has a stronger offshore-directed negative component, while in the presence of longer waves, it could have a positive component close to the bottom [29]. The presented results (Figure 6 and Figure 7) show that the different wave regime is responsible for a change of the density gradient that changes the density field with a variation up to 60% compared to the case in the absence of waves.
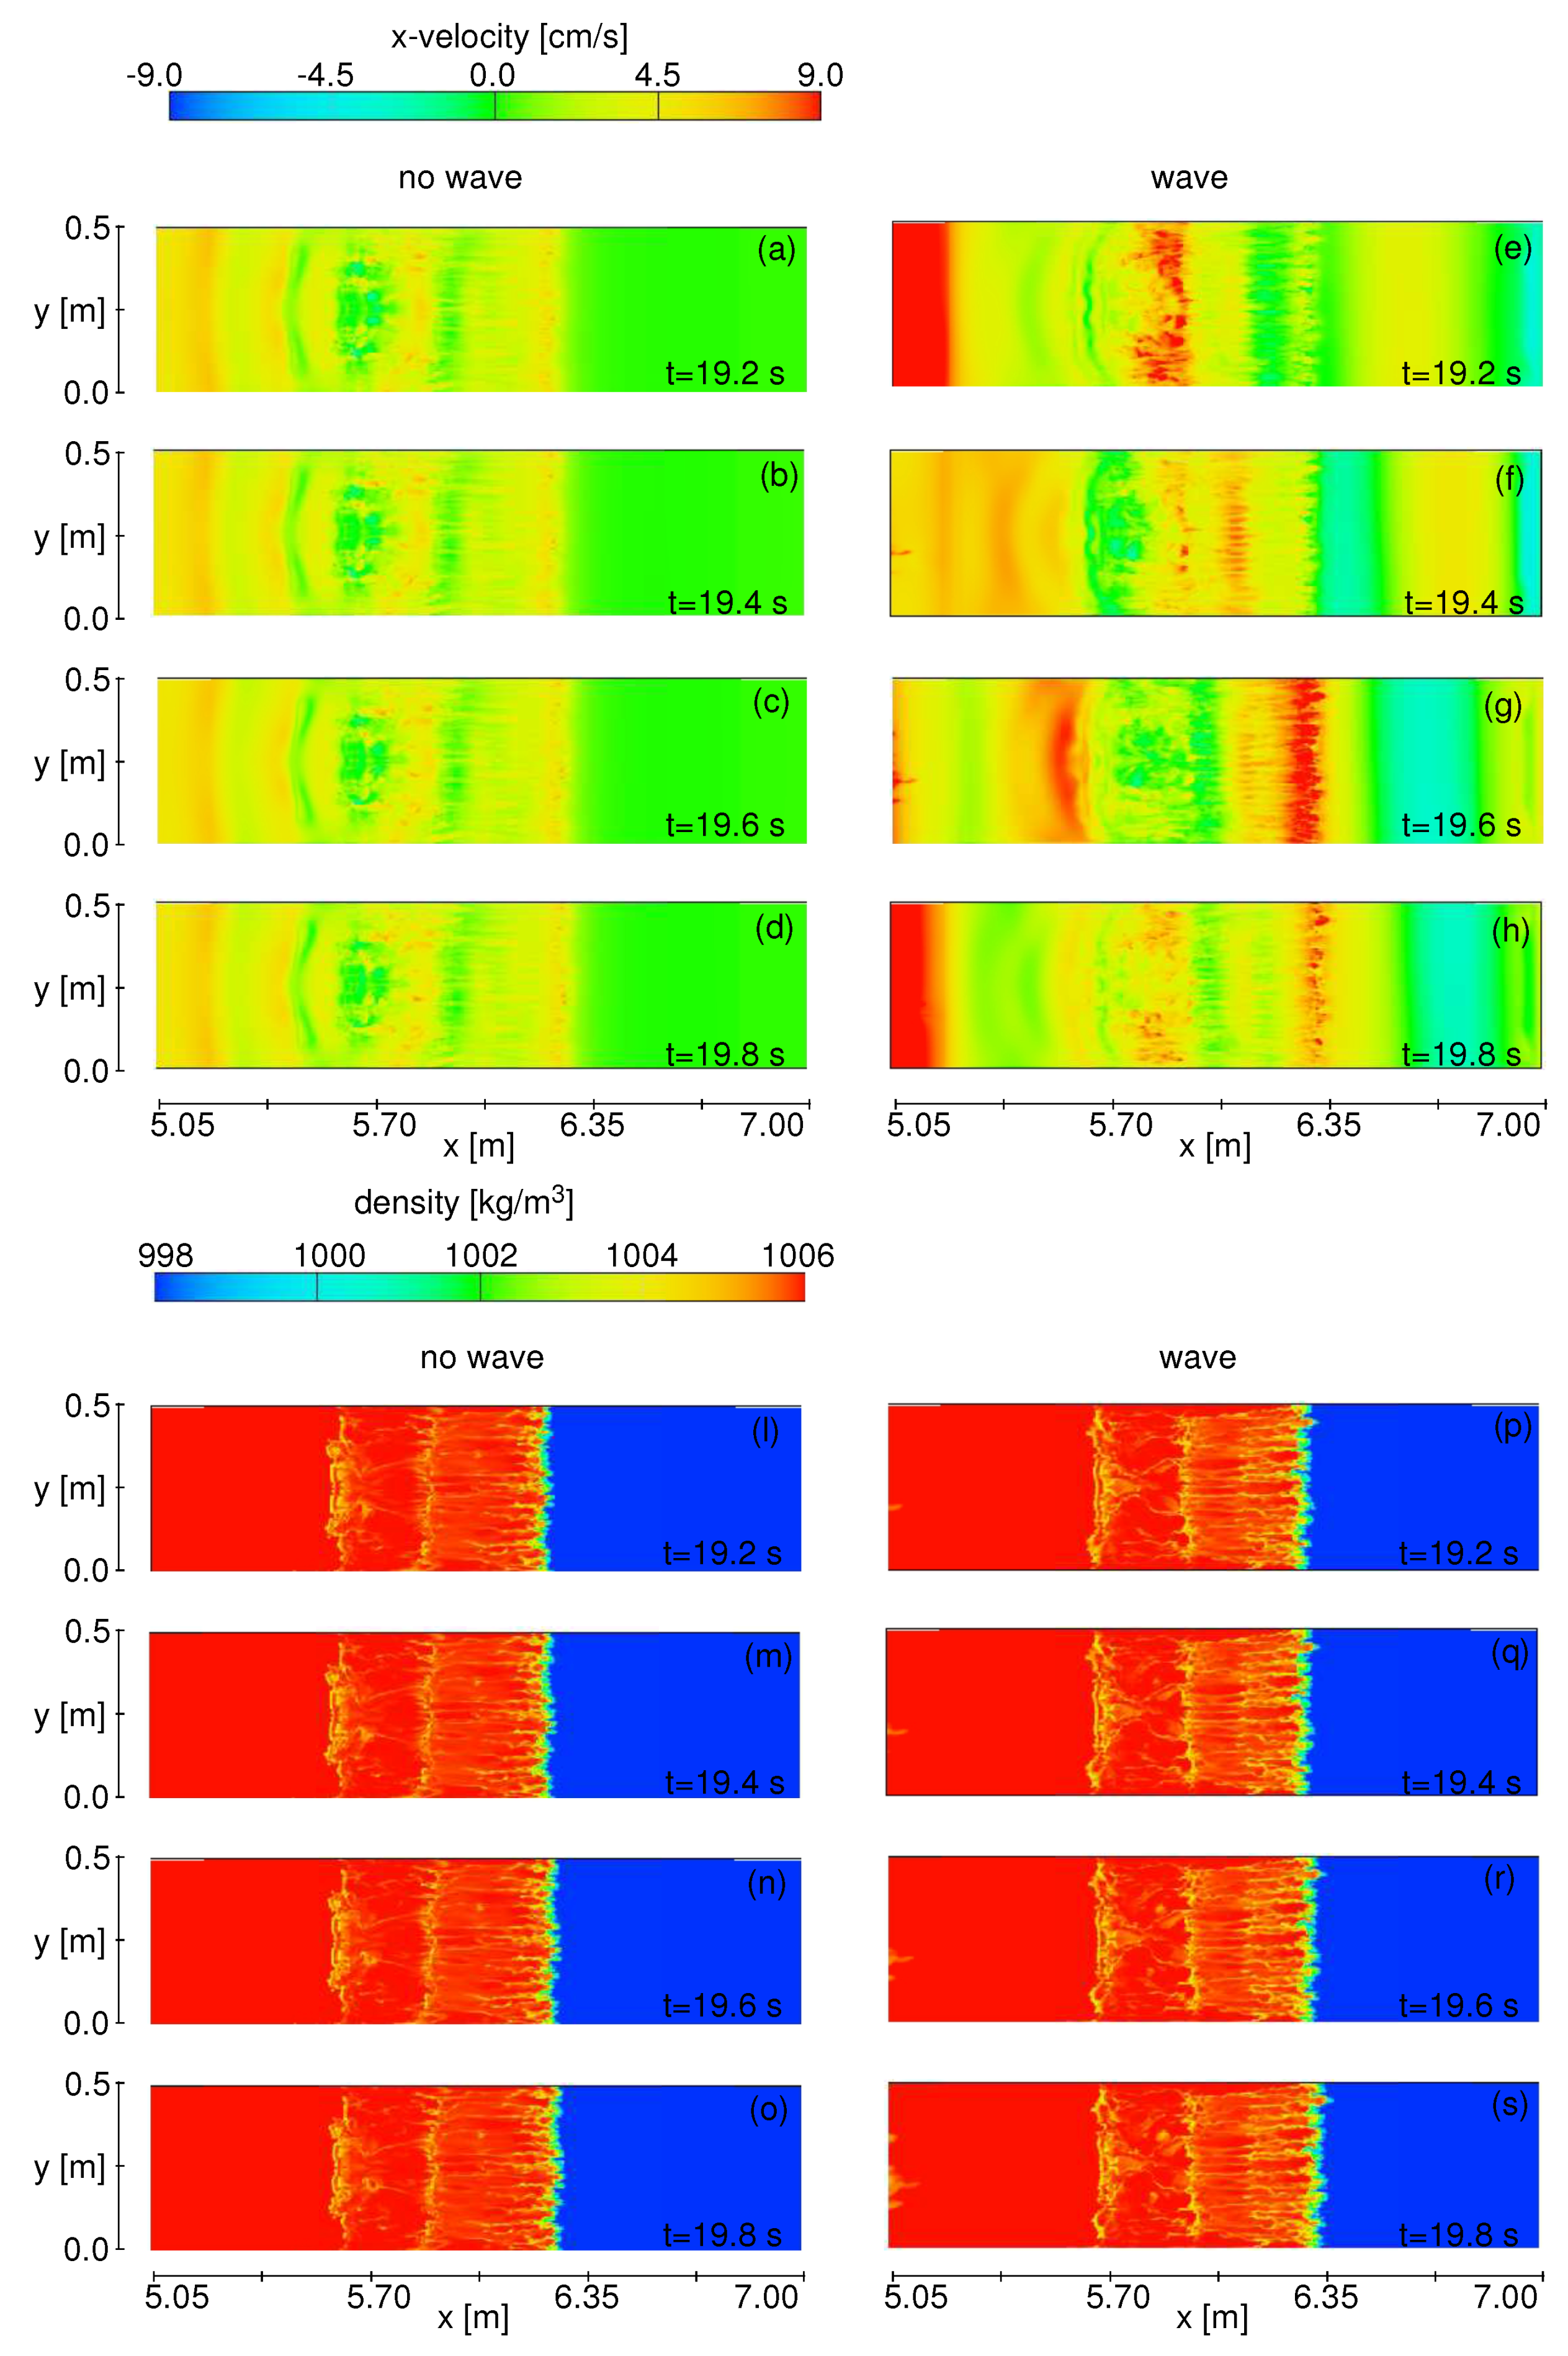
The processes at the bottom are herein described through x-velocity and density maps, presented in Figure 8. Velocity maps show characteristic features of gravity current propagation [18] in the absence of waves, with a mean component similar to the front velocity. For the wave combined flow, spatial velocity oscillations are in accordance with the wave phase. The amplitude of velocity oscillations is of the same order of the maximum horizontal orbital velocity at the bottom ( = 8 cm/s). For the gravity current propagation in the absence of waves and in the presence of waves in all cases, the shape of quasi-streamwise vortices is recognizable from the density maps acquired during a wave period (Figure 8). For the case in the presence of waves, the mixing process is slightly enhanced, and such a phenomenon could be due to shear velocity induced by the presence of waves in the bottom boundary layer.
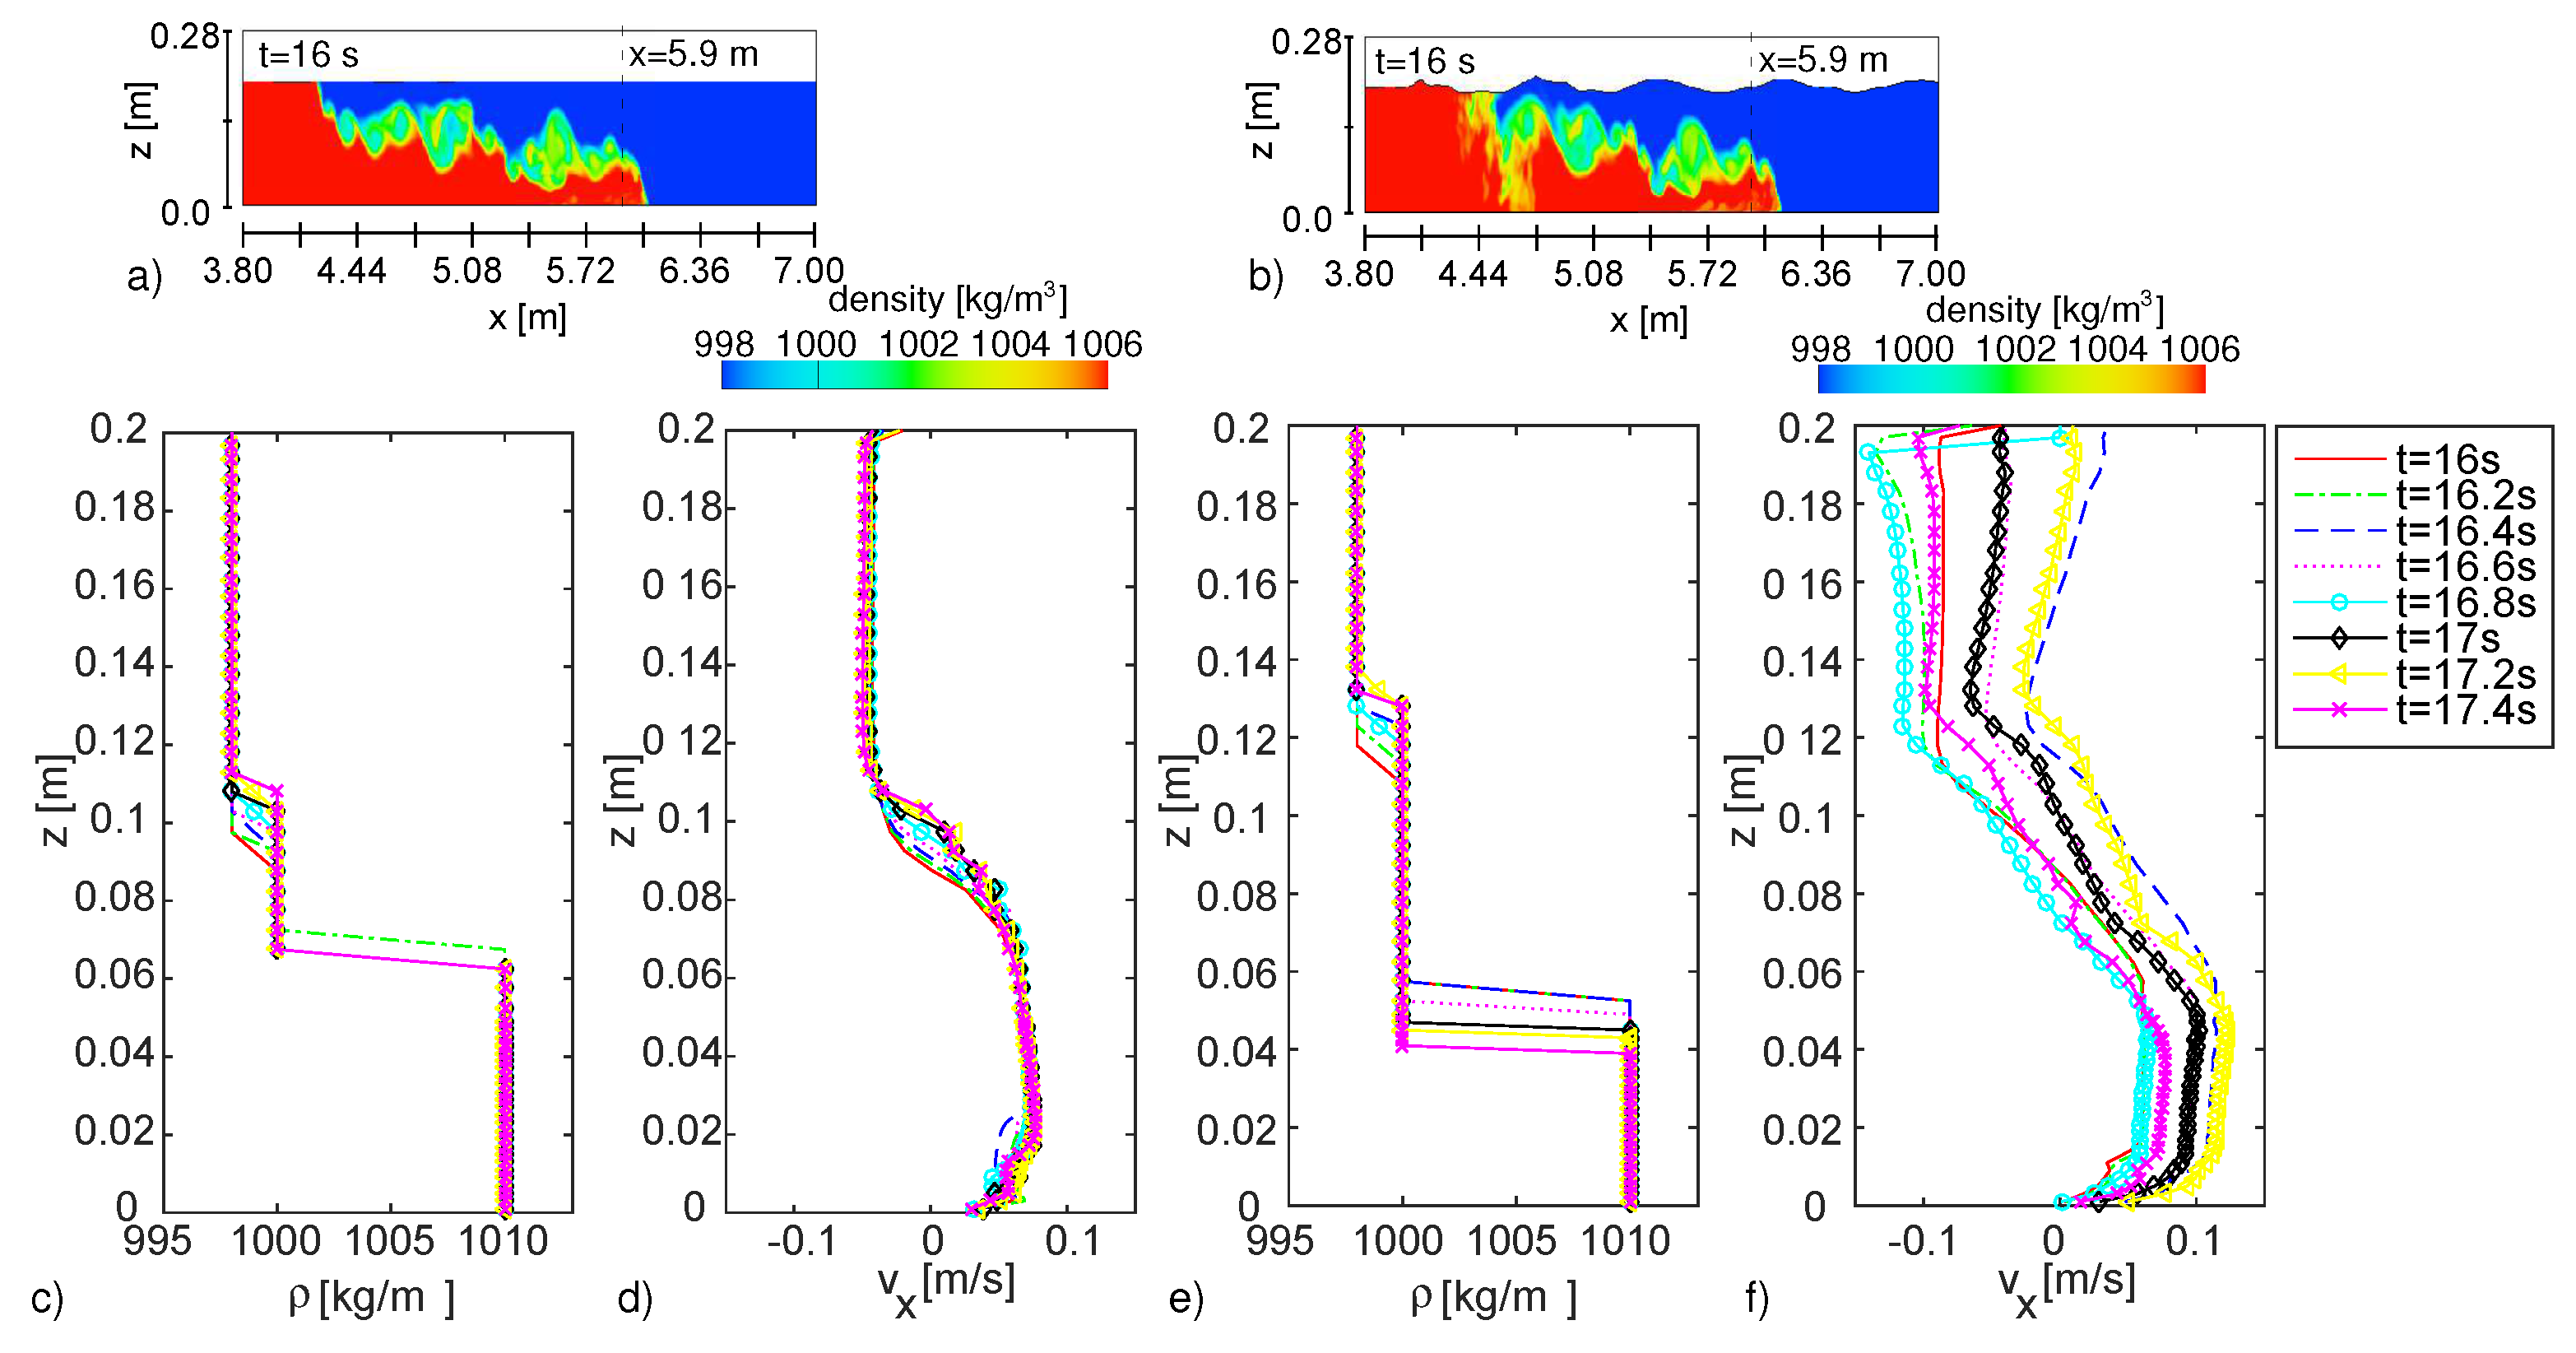
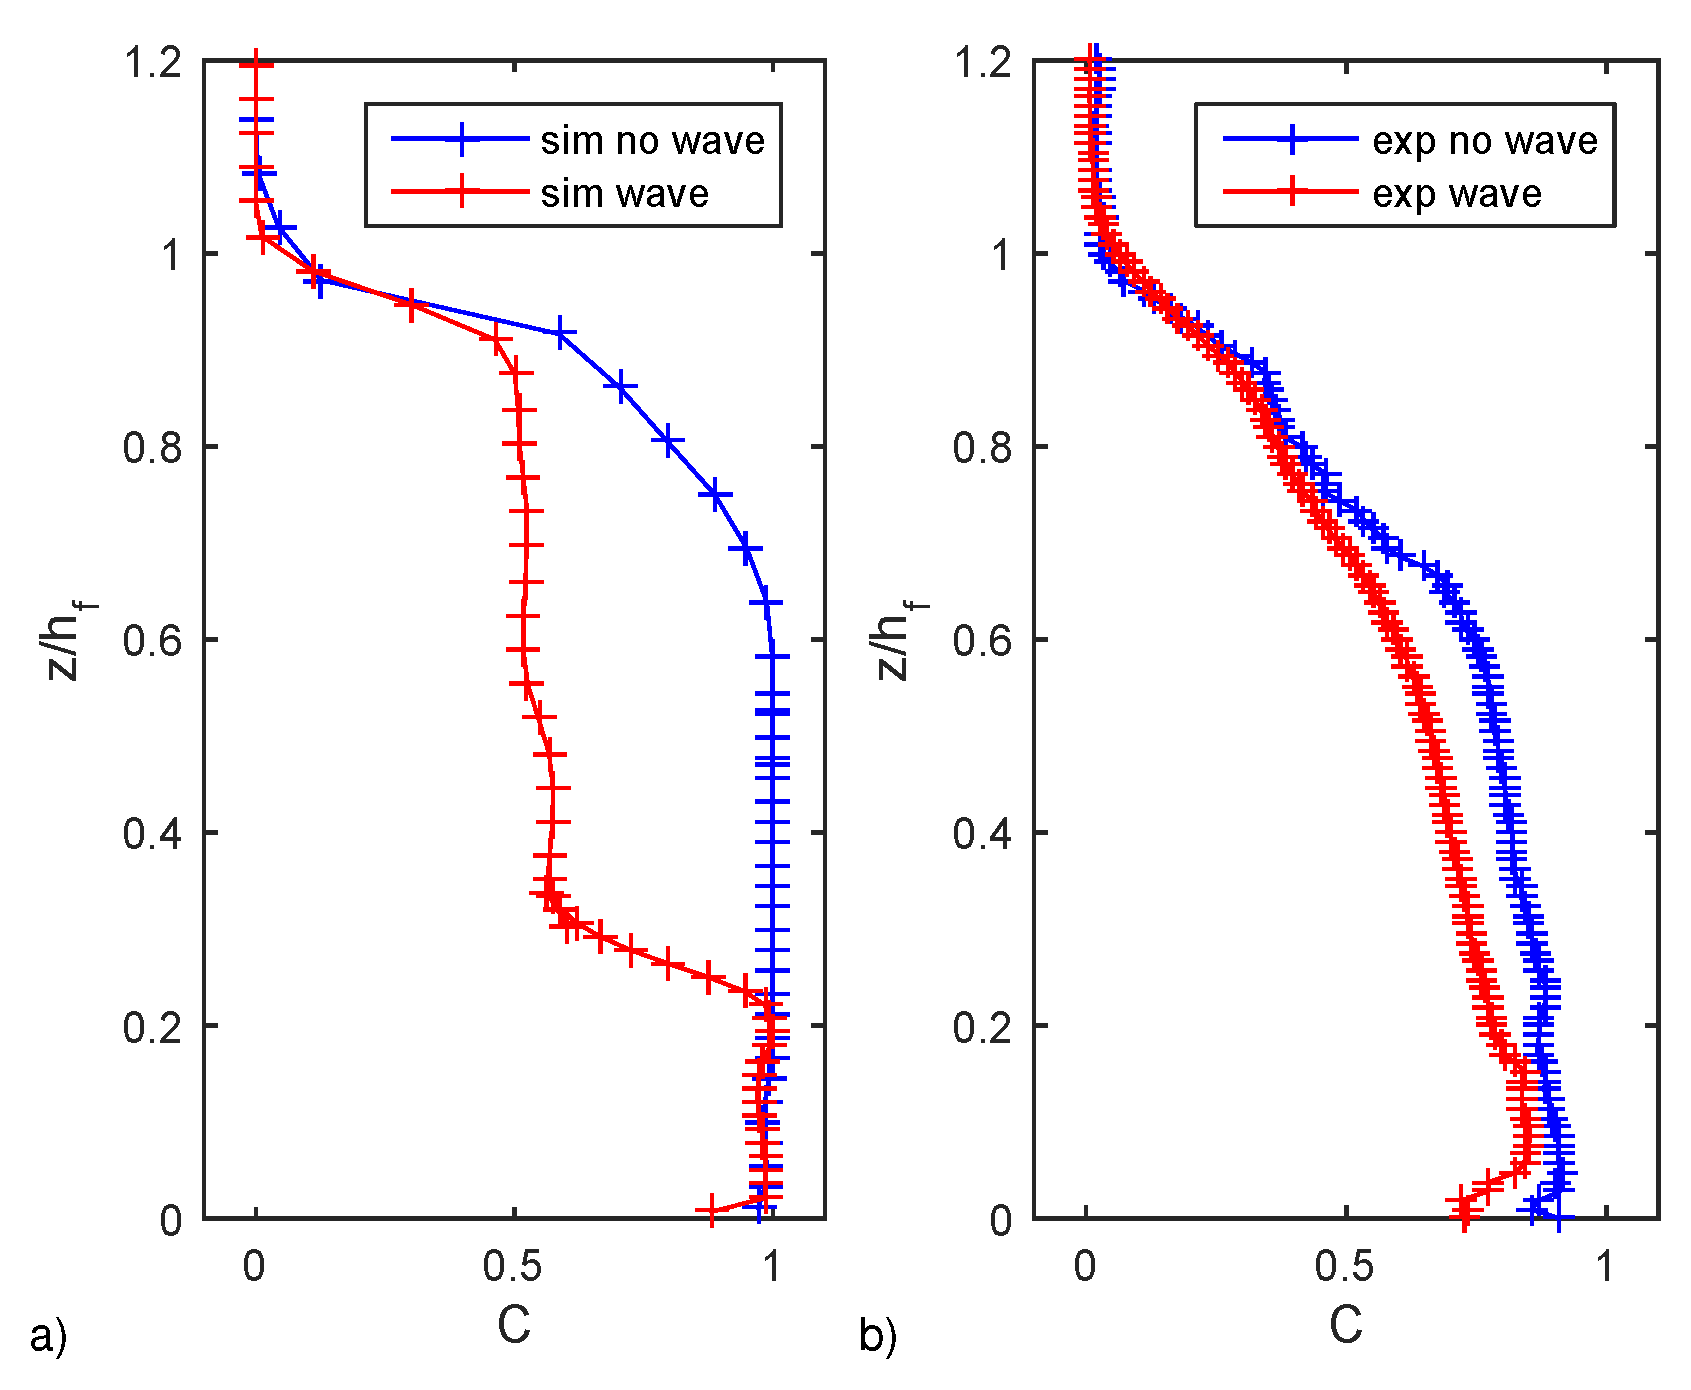
Results in terms of vertical profiles of density and horizontal velocity are presented for the front region, always comparing simulations in the absence and in the presence of waves (see Figure 9). Figure 9a,b shows the 2D density maps indicating with a dash line the section where the profiles presented in Figure 9e,f are gathered during a time period of 1.2 s (about 2 ) 16 s < t < 17.2 s after gate opening. Simulation results show that oscillatory motion induces a thicker mixing layer. Indeed, in the absence of waves, the mixing layer thickness is about 20% of the water depth H (Figure 9c), while in the presence of waves it increases up to 50% of the water depth H (Figure 9e). Symmetric velocity profiles are recovered for quiescent ambient fluid, while asymmetric ones are obtained in the presence of waves. In initially quiescent ambient fluid, the velocity profiles collapse onto each other, confirming that the density current is in the constant velocity phase (slumping) (Figure 9d). The asymmetry of the velocity profiles in the presence of waves is caused by the propagation of waves under intermediate water depth that induces a velocity field within a wave cycle, varying in relation to the wave period (i.e., crest, though, etc) and influencing the flow along the entire water depth. Moreover, focusing on the lower part of Figure 9f, which describes the velocity of the heavier fluid, we observe an oscillation of the velocity values reaching peak values (13 cm/s), which are two-times greater than the mean velocity observed in the absence of waves (6.5 cm/s). Comparison between experimental results and simulation of gravity currents characterized by the same reduced gravity (0.13 m/s) and the same ambient flow conditions is presented in Figure 10. Both the initially quiescent fluid and the presence of waves, = 0.06, are considered here. Results are in dimensionless form at a section located upstream of the front, with the elevation scaled by the local current depth . Both numerical and experimental profiles confirm that the presence of waves is responsible for an increased mixing compared to the no wave case. The model tends to overestimate such an effect. However, it should be also considered that numerical results are obtained at the centerline of the flume, while the measured concentration profiles are width-averaged.
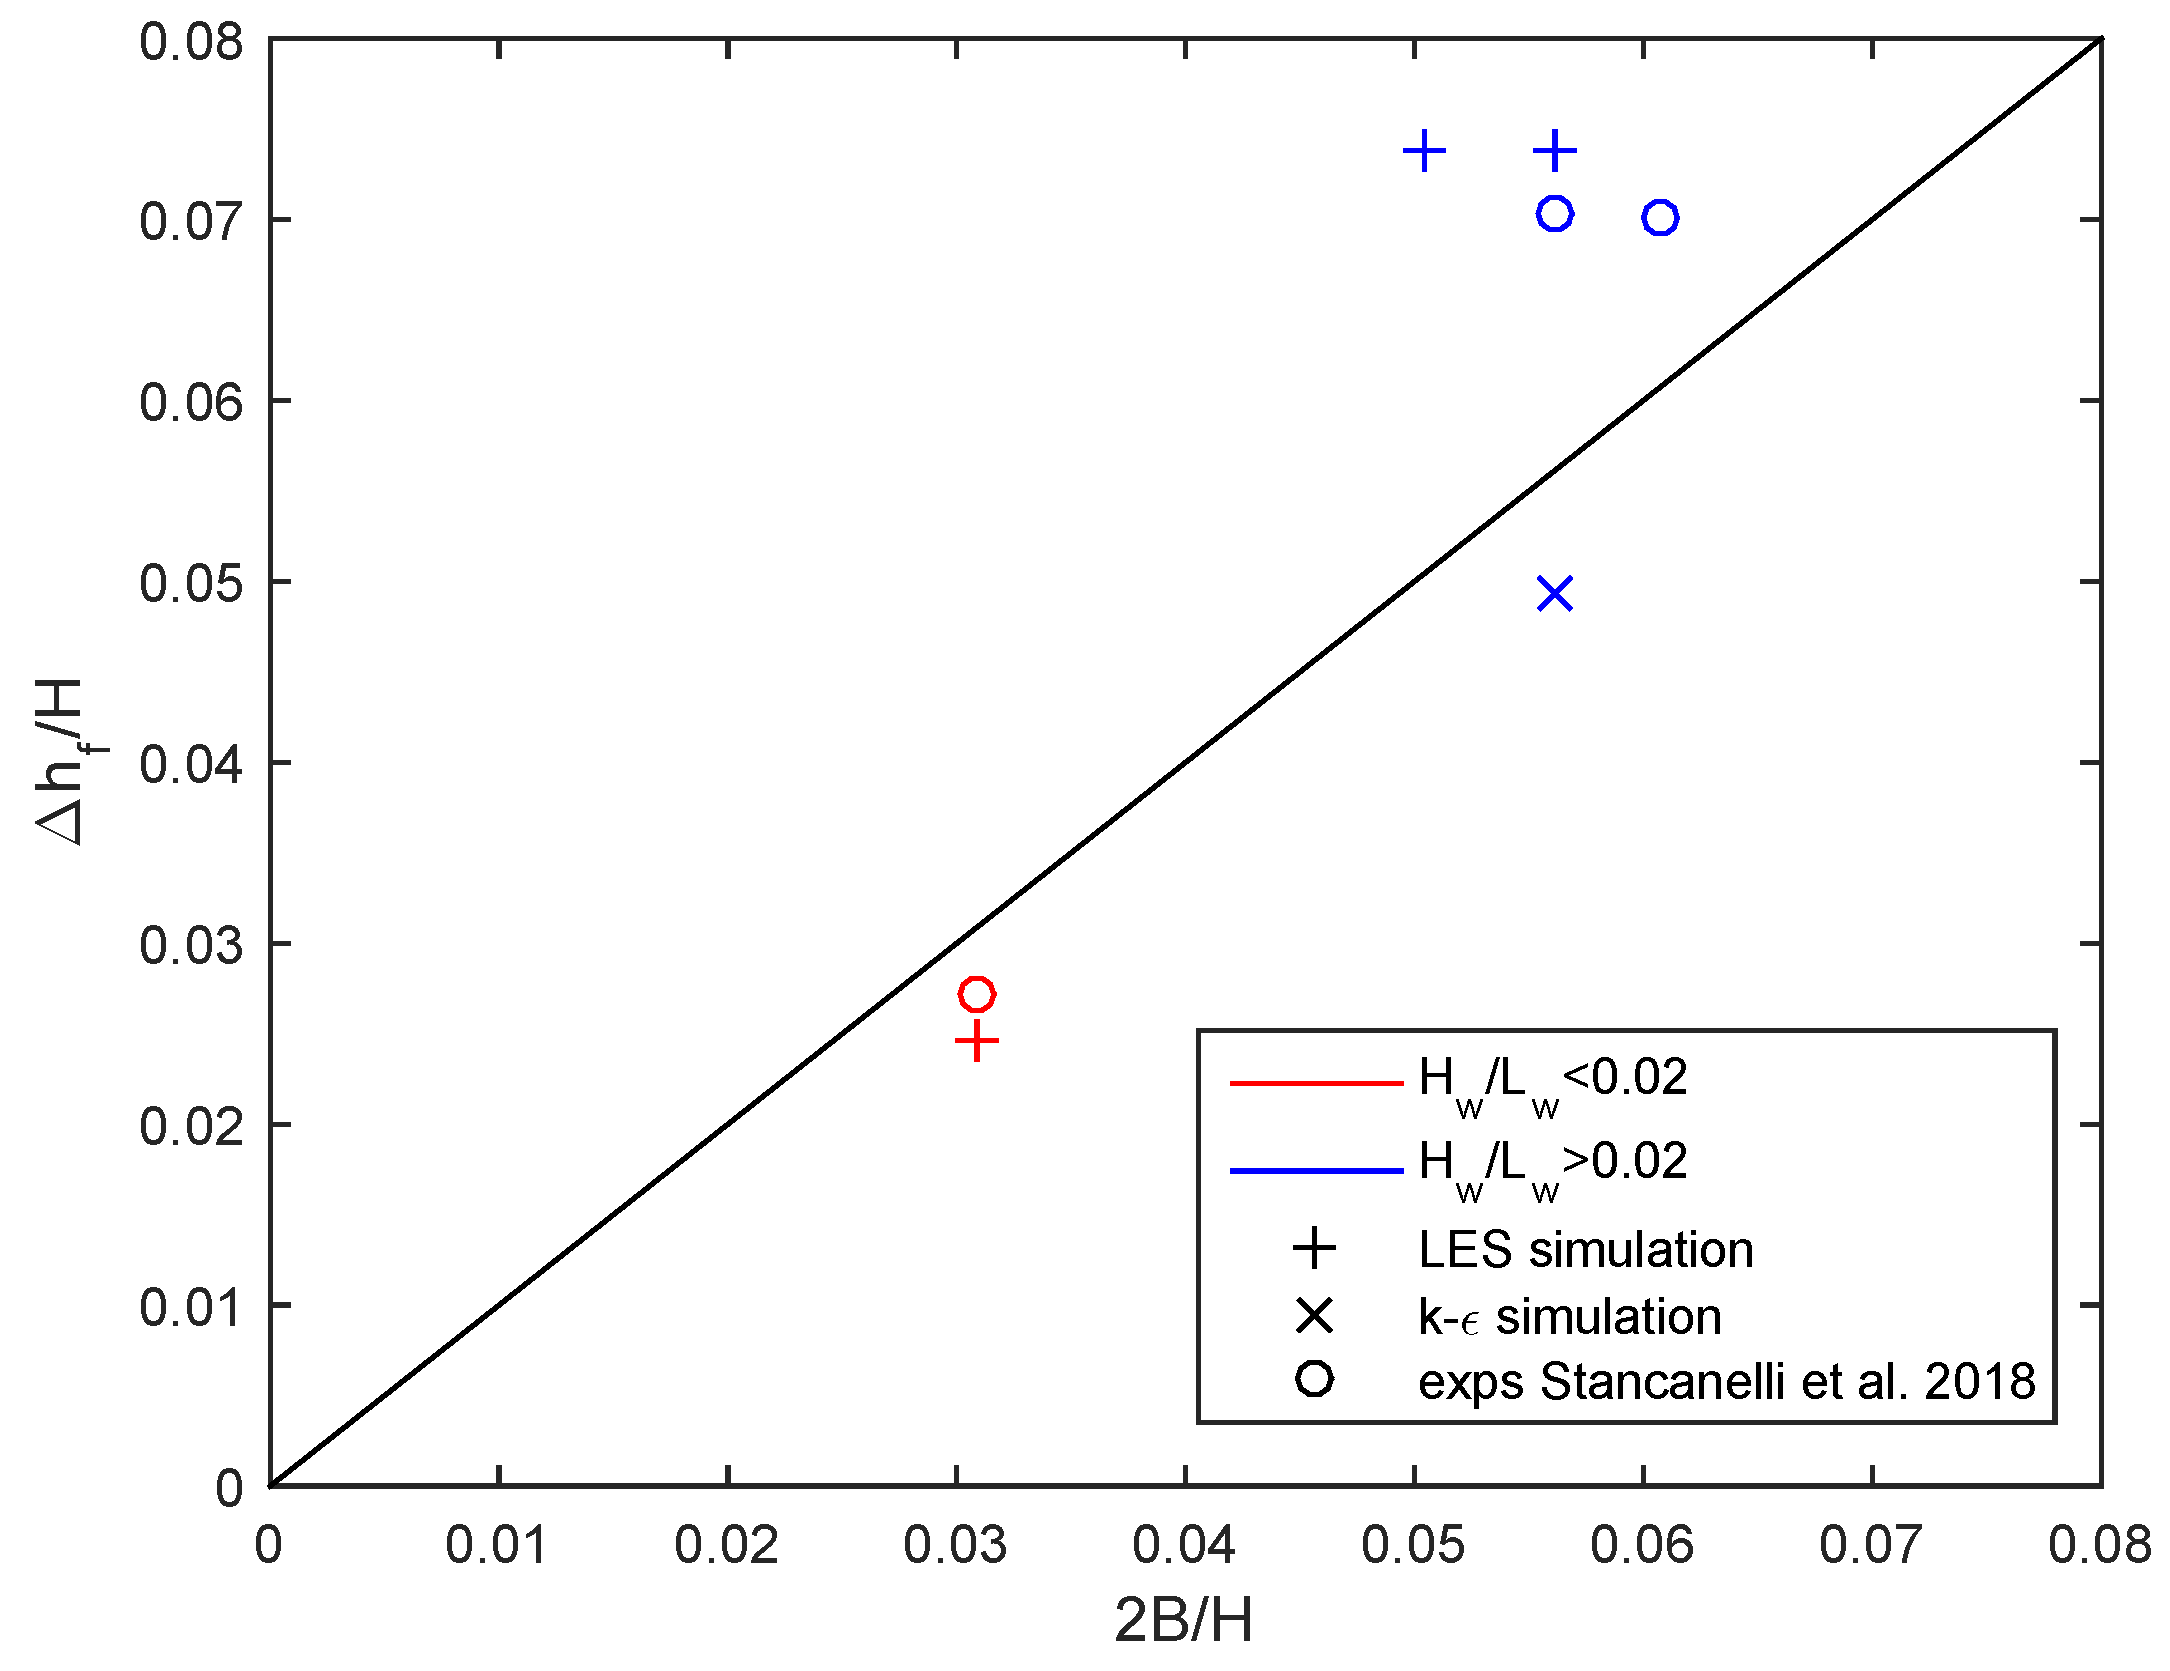
Analysis of the gravity current within a wave cycle shows the time and spatial oscillation of the depth of the gravity current . Stancanelli et al. [29] have observed this phenomenon and have also evaluated it in relation to the orbital particle trajectory under the water waves. Figure 11 shows data from both the experimental campaign of Stancanelli et al. [29] and the simulations, which are compared with the maximum vertical displacement of the wave-induced particle trajectory [29,59]. The comparison between the gravity current depth oscillations predicted by the model and the LES model with the experimental results (Case 2) shows a small overprediction for the LES model (5%) and a quite substantial under-prediction (30%) for the model. The numerical results of the LES simulations agree fairly well with the experimental observations (errors less than 10%). For shorter waves ( < 0.02), both numerical and experimental results show a stronger relationship , indicating a greater dependency on the wave regimes.
5. Conclusions
Gravity currents in the absence and in the presence of regular surface waves are investigated by means of a CFD model, focusing on understanding the physics that governs the gravity current dynamics in relation to the ambient fluid field velocity.
Comparisons with experimental data are carried out in order to validate the capability of the adopted CFD model. The influence of the adopted turbulence closure method on the description of the dynamics of the propagation of the gravity current is evaluated. The computational cost required for the LES model is more then twice that needed for running the model. The gravity current development in terms of the average velocity of the front is well reproduced by both the model and the LES model. The prediction of average front velocity is equal for both models, although it is slightly underestimated, , in the case of higher reduced gravity by both models. Differences are noticed in terms of shear-induced instabilities causing a different mixing pattern at the interface. Comparison with the experimental shape of the gravity current shows that the location of the K-H billows is better reproduced by the LES model. The influence of the ambient fluid on the dynamics of the gravity currents is then analyzed with the more reliable LES scheme. The presence of lobe and clefts at the bottom of the front is visible after a few seconds from the generation of the gravity currents (5 s) for both conditions of ambient flow (Case 1 No. waves, Case 2 with waves). The density iso-surfaces show the formation of both K-H billows and 3D turbulent instabilities at the interface of the gravity current. The first ones appear suddenly after the front generation, while the latter ones are observed later. In the case of density currents in quiescent ambient fluid, the 3D instabilities develop at the front and propagate further upstream. In the presence of waves, such instabilities are present along all the density current, showing a lower intensity if compared with the case in the absence of waves. Moreover, the lighter front propagating in the opposite direction of the waves generates small-scale turbulent structures. Such turbulent structures are presented in both cases of shorter and longer waves, and their distribution is influenced by the mass transport induced by the wave propagation. Such evidence is also supported by the studies of Huang and Qiao [60], who observed that the turbulence induced by the surface wave decays in relation to the Stokes drift. The latter together with the Eulerian velocity describes the mass transport. The number of such small vortices seems to be related to the ratio between the front velocity and the horizontal orbital velocity (). For the wave-dominated regime (), a much larger number of vortices appear, also close to the bottom. It follows that in the presence of waves, the dynamics of the propagating density current appears strongly modified. The orbital motion is responsible for the increase of the mixing processes at the front. This is clearly observed at the bottom, where the relative density difference between the no wave and the wave case is about . In the region of the negative front, the difference between the no wave and the wave case is even larger, reaching up to . Further analyses on the mixing process acting at the front are carried out in terms of the vertical profiles of density and horizontal velocity. The density profiles show that the thickness of the observed mixing layer is equal to 20% of the water depth H in initially quiescent ambient fluid and to 50% of the water depth H in the presence of waves. The velocity profiles indicate that the gravity currents in the presence of waves advance following a periodic development, which is repeated for each wave cycle. The velocity values of the heavier fluid oscillate reaching peak values two-times greater than the velocity values in the absence of waves. Finally, wave-induced oscillation of the gravity current depth has been analyzed in comparison with the experimental results, and the LES model is more accurate (error less than 10%), showing results in accordance with the experimental evidence. For shorter waves, the gravity current depth oscillation is mainly influenced by the orbital motion, while for longer waves, phenomena such as instantaneous mixing or diffusion can influence the measure of the gravity current depth.
The present research allowed also the analysis of the small-scale vortices induced by waves, which are responsible for the development of different mixing processes. This phenomenon was never observed in previous works dealing with gravity current in the presence of waves. Indeed, due to the instrumentation constraints, the experimental campaign [28,29] could not investigate such phenomena. Previous numerical investigations [27] were focused on the propagation velocity, or just on larger structures captured by a simplistic turbulence closure [30] where calibration procedure are needed prior to application. Certainly, further investigations are needed for a more comprehensive understanding of the interaction between the wave-induced turbulence with the gravity current turbulence.
Future works will investigate the dynamics of density current propagation combined with oscillatory wave motion during the buoyancy-inertia phase. In initially quiescent ambient fluid, the density current during the buoyancy–inertia phase is composed by a heavier fluid head and a diluted tail, and the front velocity is no longer constant, as it was during the slumping phase. In such a highly variable system, it would be interesting to evaluate the effects on the gravity current dynamics of the periodic disturbances induced by the superimposed surface wave field. Moreover, the process of energy exchanges will be investigated, considering the balance between the kinetic and the potential energy.
Author Contributions
R.E. Musumeci has conceived of and designed the experiments. L.M. Stancanelli has performed the experimental tests and the numerical simulations. R.E. Musumeci and L.M. Stancanelli have analyzed the data. All three authors have equally contributed to writing the paper.
Acknowledgments
This work has been partly funded by the EU-funded project HYDRALAB PLUS (Proposal Number 64110) and by the INTERREG Italia-Malta project NEWS ().
Conflicts of Interest
The authors declare no conflict of interest. The founding sponsors had no role in the design of the study; in the collection, analyses or interpretation of data; in the writing of the manuscript; nor in the decision to publish the results.
References
- Ooi, S.K.; Constantinescu, G.; Weber, L. A numerical study of intrusive compositional gravity currents. Phys. Fluids (1994–Present) 2007, 19, 076602. [Google Scholar] [CrossRef]
- Huppert, H.E. Gravity currents: A personal perspective. J. Fluid Mech. 2006, 554, 299–322. [Google Scholar] [CrossRef]
- Stancanelli, L.M.; Musumeci, R.E.; Cavallaro, L.; Foti, E. A small scale Pressure Retarded Osmosis power plant: Dynamics of the brackish effluent discharge along the coast. Ocean Eng. 2017, 130, 417–428. [Google Scholar] [CrossRef]
- Cagnoli, B.; Piersanti, A. Stresses at the base of dry and dense flows of angular rock fragments in 3-D discrete element modeling: Scaling of basal stress fluctuations versus grain size, flow volume and channel width. J. Volcanol. Geotherm. Res. 2018, 349, 230–239. [Google Scholar] [CrossRef]
- Stancanelli, L.M.; Lanzoni, S.; Foti, E. Mutual interference of two debris flow deposits delivered in a downstream river reach. J. Mt. Sci. 2014, 11, 1385–1395. [Google Scholar] [CrossRef]
- Lanzoni, S.; Gregoretti, C.; Stancanelli, L.M. Coarse-grained debris flow dynamics on erodible beds. J. Geophys. Res. Earth Surf. 2017, 122, 592–614. [Google Scholar] [CrossRef]
- Palomar, P.; Losada, I. Desalination in Spain: Recent developments and recommendations. Desalination 2010, 255, 97–106. [Google Scholar] [CrossRef]
- Robinson, T.; Eames, I.; Simons, R. Dense gravity currents moving beneath progressive free-surface water waves. J. Fluid Mech. 2013, 725, 588–610. [Google Scholar] [CrossRef]
- Rottman, J.W.; Simpson, J.E. Gravity currents produced by instantaneous releases of a heavy fluid in a rectangular channel. J. Fluid Mech. 1983, 135, 95–110. [Google Scholar] [CrossRef]
- Nogueira, H.I.; Adduce, C.; Alves, E.; Franca, M.J. Image analysis technique applied to lock-exchange gravity currents. Meas. Sci. Technol. 2013, 24, 047001. [Google Scholar] [CrossRef]
- Britter, R.; Linden, P. The motion of the front of a gravity current travelling down an incline. J. Fluid Mech. 1980, 99, 531–543. [Google Scholar] [CrossRef]
- Choi, S.U.; Garcia, M. Spreading of gravity plumes on an incline. Coast. Eng. J. 2001, 43, 221–237. [Google Scholar] [CrossRef]
- Lombardi, V.; Adduce, C.; Sciortino, G.; La Rocca, M. Gravity currents flowing upslope: Laboratory experiments and shallow-water simulations. Phys. Fluids 2015, 27, 016602. [Google Scholar] [CrossRef]
- He, Z.; Zhao, L.; Lin, T.; Hu, P.; Lv, Y.; Ho, H.C.; Lin, Y.T. Hydrodynamics of Gravity Currents Down a Ramp in Linearly Stratified Environments. J. Hydraul. Eng. 2017, 143, 04016085. [Google Scholar] [CrossRef]
- Lane-Serff, G.; Beai, L.; Hadfield, T. Gravity Current Flow Over Obstacles. J. Fluid Mech. 1995, 292, 39–53. [Google Scholar] [CrossRef]
- Maxworthy, T.; Leilich, J.; Simpson, J.E.; Meiburg, E.H. The propagation of a gravity current into a linearly stratified fluid. J. Fluid Mech. 2002, 453, 371–394. [Google Scholar] [CrossRef]
- Dai, A. High-resolution simulations of downslope gravity currents in the acceleration phase. Phys. Fluids 2015, 27, 076602. [Google Scholar] [CrossRef]
- Cantero, M.I.; Balachandar, S.; García, M.H.; Bock, D. Turbulent structures in planar gravity currents and their influence on the flow dynamics. J. Geophys. Res. Oceans 2008, 113. [Google Scholar] [CrossRef]
- Ottolenghi, L.; Adduce, C.; Inghilesi, R.; Armenio, V.; Roman, F. Entrainment and mixing in unsteady gravity currents. J. Hydraul. Res. 2016, 54, 541–557. [Google Scholar] [CrossRef]
- Akutina, Y.; Mydlarski, L.; Gaskin, S.; Eiff, O. Error analysis of 3D-PTV through unsteady interfaces. Exp. Fluids 2018, 59, 53. [Google Scholar] [CrossRef]
- Ooi, S.K.; Constantinescu, G.; Weber, L. Numerical simulations of lock-exchange compositional gravity current. J. Fluid Mech. 2009, 635, 361–388. [Google Scholar] [CrossRef]
- Härtel, C.; Meiburg, E.; Necker, F. Analysis and direct numerical simulation of the flow at a gravity-current head. Part 1. Flow topology and front speed for slip and no-slip boundaries. J. Fluid Mech. 2000, 418, 189–212. [Google Scholar] [CrossRef]
- Härtel, C.; Carlsson, F.; Thunblom, M. Analysis and direct numerical simulation of the flow at a gravity-current head. Part 2. The lobe-and-cleft instability. J. Fluid Mech. 2000, 418, 213–229. [Google Scholar] [CrossRef]
- Blanchette, F.; Strauss, M.; Meiburg, E.; Kneller, B.; Glinsky, M.E. High-resolution numerical simulations of resuspending gravity currents: Conditions for self-sustainment. J. Geophys. Res. Oceans 2005, 110. [Google Scholar] [CrossRef]
- Cantero, M.I.; Balachandar, S.; García, M.H.; Ferry, J.P. Direct numerical simulations of planar and cylindrical density currents. J. Appl. Mech. 2006, 73, 923–930. [Google Scholar] [CrossRef]
- Ottolenghi, L.; Adduce, C.; Inghilesi, R.; Roman, F.; Armenio, V. Mixing in lock-release gravity currents propagating up a slope. Phys. Fluids 2016, 28, 056604. [Google Scholar] [CrossRef]
- Ng, C.O.; Fu, S.C. On the propagation of a two-dimensional viscous density current under surface waves. Phys. Fluids (1994–Present) 2002, 14, 970–984. [Google Scholar] [CrossRef] [Green Version]
- Musumeci, R.E.; Viviano, A.; Foti, E. Influence of regular surface waves on the propagation of gravity currents: experimental and numerical modeling. J. Hydraul. Eng. 2017, 143, 04017022. [Google Scholar] [CrossRef]
- Stancanelli, L.M.; Musumeci, R.E.; Foti, E. Dynamics of gravity currents in the presence of surfface waves. J. Geophys. Res. Oceans 2018. [Google Scholar] [CrossRef]
- Viviano, A.; Musumeci, R.E.; Foti, E. Interaction between waves and gravity currents: description of turbulence in a simple numerical model. Environ. Fluid Mech. 2018, 18, 117–148. [Google Scholar] [CrossRef]
- Piomelli, U. Wall-layer models for large-eddy simulations. Prog. Aerosp. Sci. 2008, 44, 437–446. [Google Scholar] [CrossRef]
- Harlow, F.H.; Nakayama, P.I. Turbulence Transport Equations. Phys. Fluids 1967, 10, 2323–2332. [Google Scholar] [CrossRef]
- Spalart, P. Strategies for turbulence modeling and simulations. Int. J. Heat Fluid Flow 2000, 21, 252–263. [Google Scholar] [CrossRef]
- Hirt, C.; Nichols, B.D. Volume of fluid (VOF) method for the dynamics of free boundaries. J. Comput. Phys. 1981, 39, 201–225. [Google Scholar] [CrossRef]
- Parsaie, A.; Haghiabi, A.H.; Moradinejad, A. CFD modeling of flow pattern in spillway’s approach channel. Sustain. Water Resour. Manag. 2015, 1, 245–251. [Google Scholar] [CrossRef]
- Tsai, C.P.; Chen, Y.C.; Sihombing, T.O.; Lin, C. Simulations of moving effect of coastal vegetation on tsunami damping. Nat. Hazards Earth Syst. Sci. 2017, 17, 693–702. [Google Scholar] [CrossRef]
- Bayon, A.; Valero, D.; García-Bartual, R.; Vallés-Morán, F.J.; López-Jiménez, P.A. Performance assessment of OpenFOAM and FLOW-3D in the numerical modeling of a low Reynolds number hydraulic jump. Environ. Model. Softw. 2016, 80, 322–335. [Google Scholar] [CrossRef]
- Bayon, A.; Toro, J.P.; Bombardelli, F.A.; Matos, J.; López-Jiménez, P.A. Influence of VOF technique, turbulence model and discretization scheme on the numerical simulation of the non-aerated, skimming flow in stepped spillways. J. Hydro-Environ. Res. 2018, 19, 137–149. [Google Scholar] [CrossRef]
- Launder, B.E.; Spalding, D. The numerical computation of turbulent flows. Comput. Methods Appl. Mech. Eng. 1974, 3, 269–289. [Google Scholar] [CrossRef]
- Pope, S.B. Turbulent Flows; Cambridge University Press: Cambridge, UK, 2000. [Google Scholar]
- Sagaut, P. Large Eddy Simulation for Incompressible Flows: An Introduction; Springer Scientific Computation: Berlin/Heidelberg, Germany, 2006. [Google Scholar]
- Smagorinsky, J. General circulation experiments with the primitive equations: I. The basic experiment. Mon. Weather Rev. 1963, 91, 99–164. [Google Scholar] [CrossRef]
- Cheng, Y.; Lien, F.; Yee, E.; Sinclair, R. A comparison of large eddy simulations with a standard k–ε Reynolds-averaged Navier–Stokes model for the prediction of a fully developed turbulent flow over a matrix of cubes. J. Wind Eng. Ind. Aerodyn. 2003, 91, 1301–1328. [Google Scholar] [CrossRef]
- Meiburg, E.; Radhakrishnan, S.; Nasr-Azadani, M. Modeling gravity and turbidity currents: Computational approaches and challenges. Appl. Mech. Rev. 2015, 67, 040802. [Google Scholar] [CrossRef]
- Airy, G. Tides and Waves. Encycl. Metrop. 1845, 102, 241–396. [Google Scholar]
- Fenton, J.D. A Fifth-Order Stokes Theory for Steady Waves. J. Waterw. Port Coast. Ocean Eng. 1985, 111, 361–388. [Google Scholar] [CrossRef]
- Fenton, J.D. Numerical methods for nonlinear waves. In Advances in Coastal and Ocean Engineering; World Scientific: Singapore, 2011; pp. 241–324. [Google Scholar]
- McCowan, J. On the solitary wave. Lond. Edinb. Dublin Philos. Mag. J. Sci. 1891, 32, 45–58. [Google Scholar] [CrossRef]
- Munk, W. The solitary wave theory and its application to surf problems. Ann. N. Y. Acad. Sci. 1949, 51, 376–424. [Google Scholar] [CrossRef]
- Boris, J.P.; Grinstein, F.F.; Oran, E.S.; Kolbe, R.L. New insights into large eddy simulation. Fluid Dyn. Res. 1992, 10, 199–228. [Google Scholar] [CrossRef]
- Kyrousi, F.; Leonardi, A.; Roman, F.; Armenio, V.; Zanello, F.; Zordan, J.; Juez, C.; Falcomer, L. Large Eddy Simulations of sediment entrainment induced by a lock-exchange gravity current. Adv. Water Resour. 2018, 114, 102–118. [Google Scholar] [CrossRef]
- USACE. Coastal Engineering Manual, EM 1110-2-1100; U.S. Army Corps of Engineers: Washington, DC, USA, 2006.
- Svendsen, I.A. Introduction to Nearshore Hydrodynamics; World Scientific: Singapore; Hackensack, NJ, USA, 2006; Volume 24. [Google Scholar]
- Huppert, H.E.; Simpson, J.E. The slumping of gravity currents. J. Fluid Mech. 1980, 99, 785–799. [Google Scholar] [CrossRef]
- Mcwilliams, J.C.; Sullivan, P.P.; Moeng, C.H. Langmuir turbulence in the ocean. J. Fluid Mech. 1997, 334, 1–30. [Google Scholar] [CrossRef]
- Teixeira, M.; Belcher, S. On the distortion of turbulence by a progressive surface wave. J. Fluid Mech. 2002, 458, 229–267. [Google Scholar] [CrossRef]
- Kantha, L.H.; Clayson, C.A. On the effect of surface gravity waves on mixing in the oceanic mixed layer. Ocean Model. 2004, 6, 101–124. [Google Scholar] [CrossRef]
- Ardhuin, F.; Jenkins, A.D. On the interaction of surface waves and upper ocean turbulence. J. Phys. Oceanogr. 2006, 36, 551–557. [Google Scholar] [CrossRef]
- Dalrymple, R.A.; Dean, R.G. Water Wave Mechanics for Engineers and Scientists; Prentice-Hall: Englewood Cliffs, NJ, USA, 1991. [Google Scholar]
- Huang, C.J.; Qiao, F. Wave-turbulence interaction and its induced mixing in the upper ocean. J. Geophys. Res. Oceans 2010, 115. [Google Scholar] [CrossRef]
Figure 1.
Gravity current propagation during full-depth two-dimensional lock-exchange experiments: (a) in the presence of initially quiescent ambient fluid; (b) when regular surface waves are superimposed on the current.
Figure 1.
Gravity current propagation during full-depth two-dimensional lock-exchange experiments: (a) in the presence of initially quiescent ambient fluid; (b) when regular surface waves are superimposed on the current.
Figure 2.
Computational domain and boundary conditions used for the CFD simulations of gravity currents.
Figure 2.
Computational domain and boundary conditions used for the CFD simulations of gravity currents.

Figure 3.
Front position of the gravity current in quiescent ambient fluid. The numerical results are compared with the results of the experimental campaign of Stancanelli et al. [29] and with the model of Huppert and Simpson [54]: (a) Test No. 3, reduced gravity equal to 0.08 m/s; (b) Test No. 1, reduced gravity equal to 0.10 m/s.
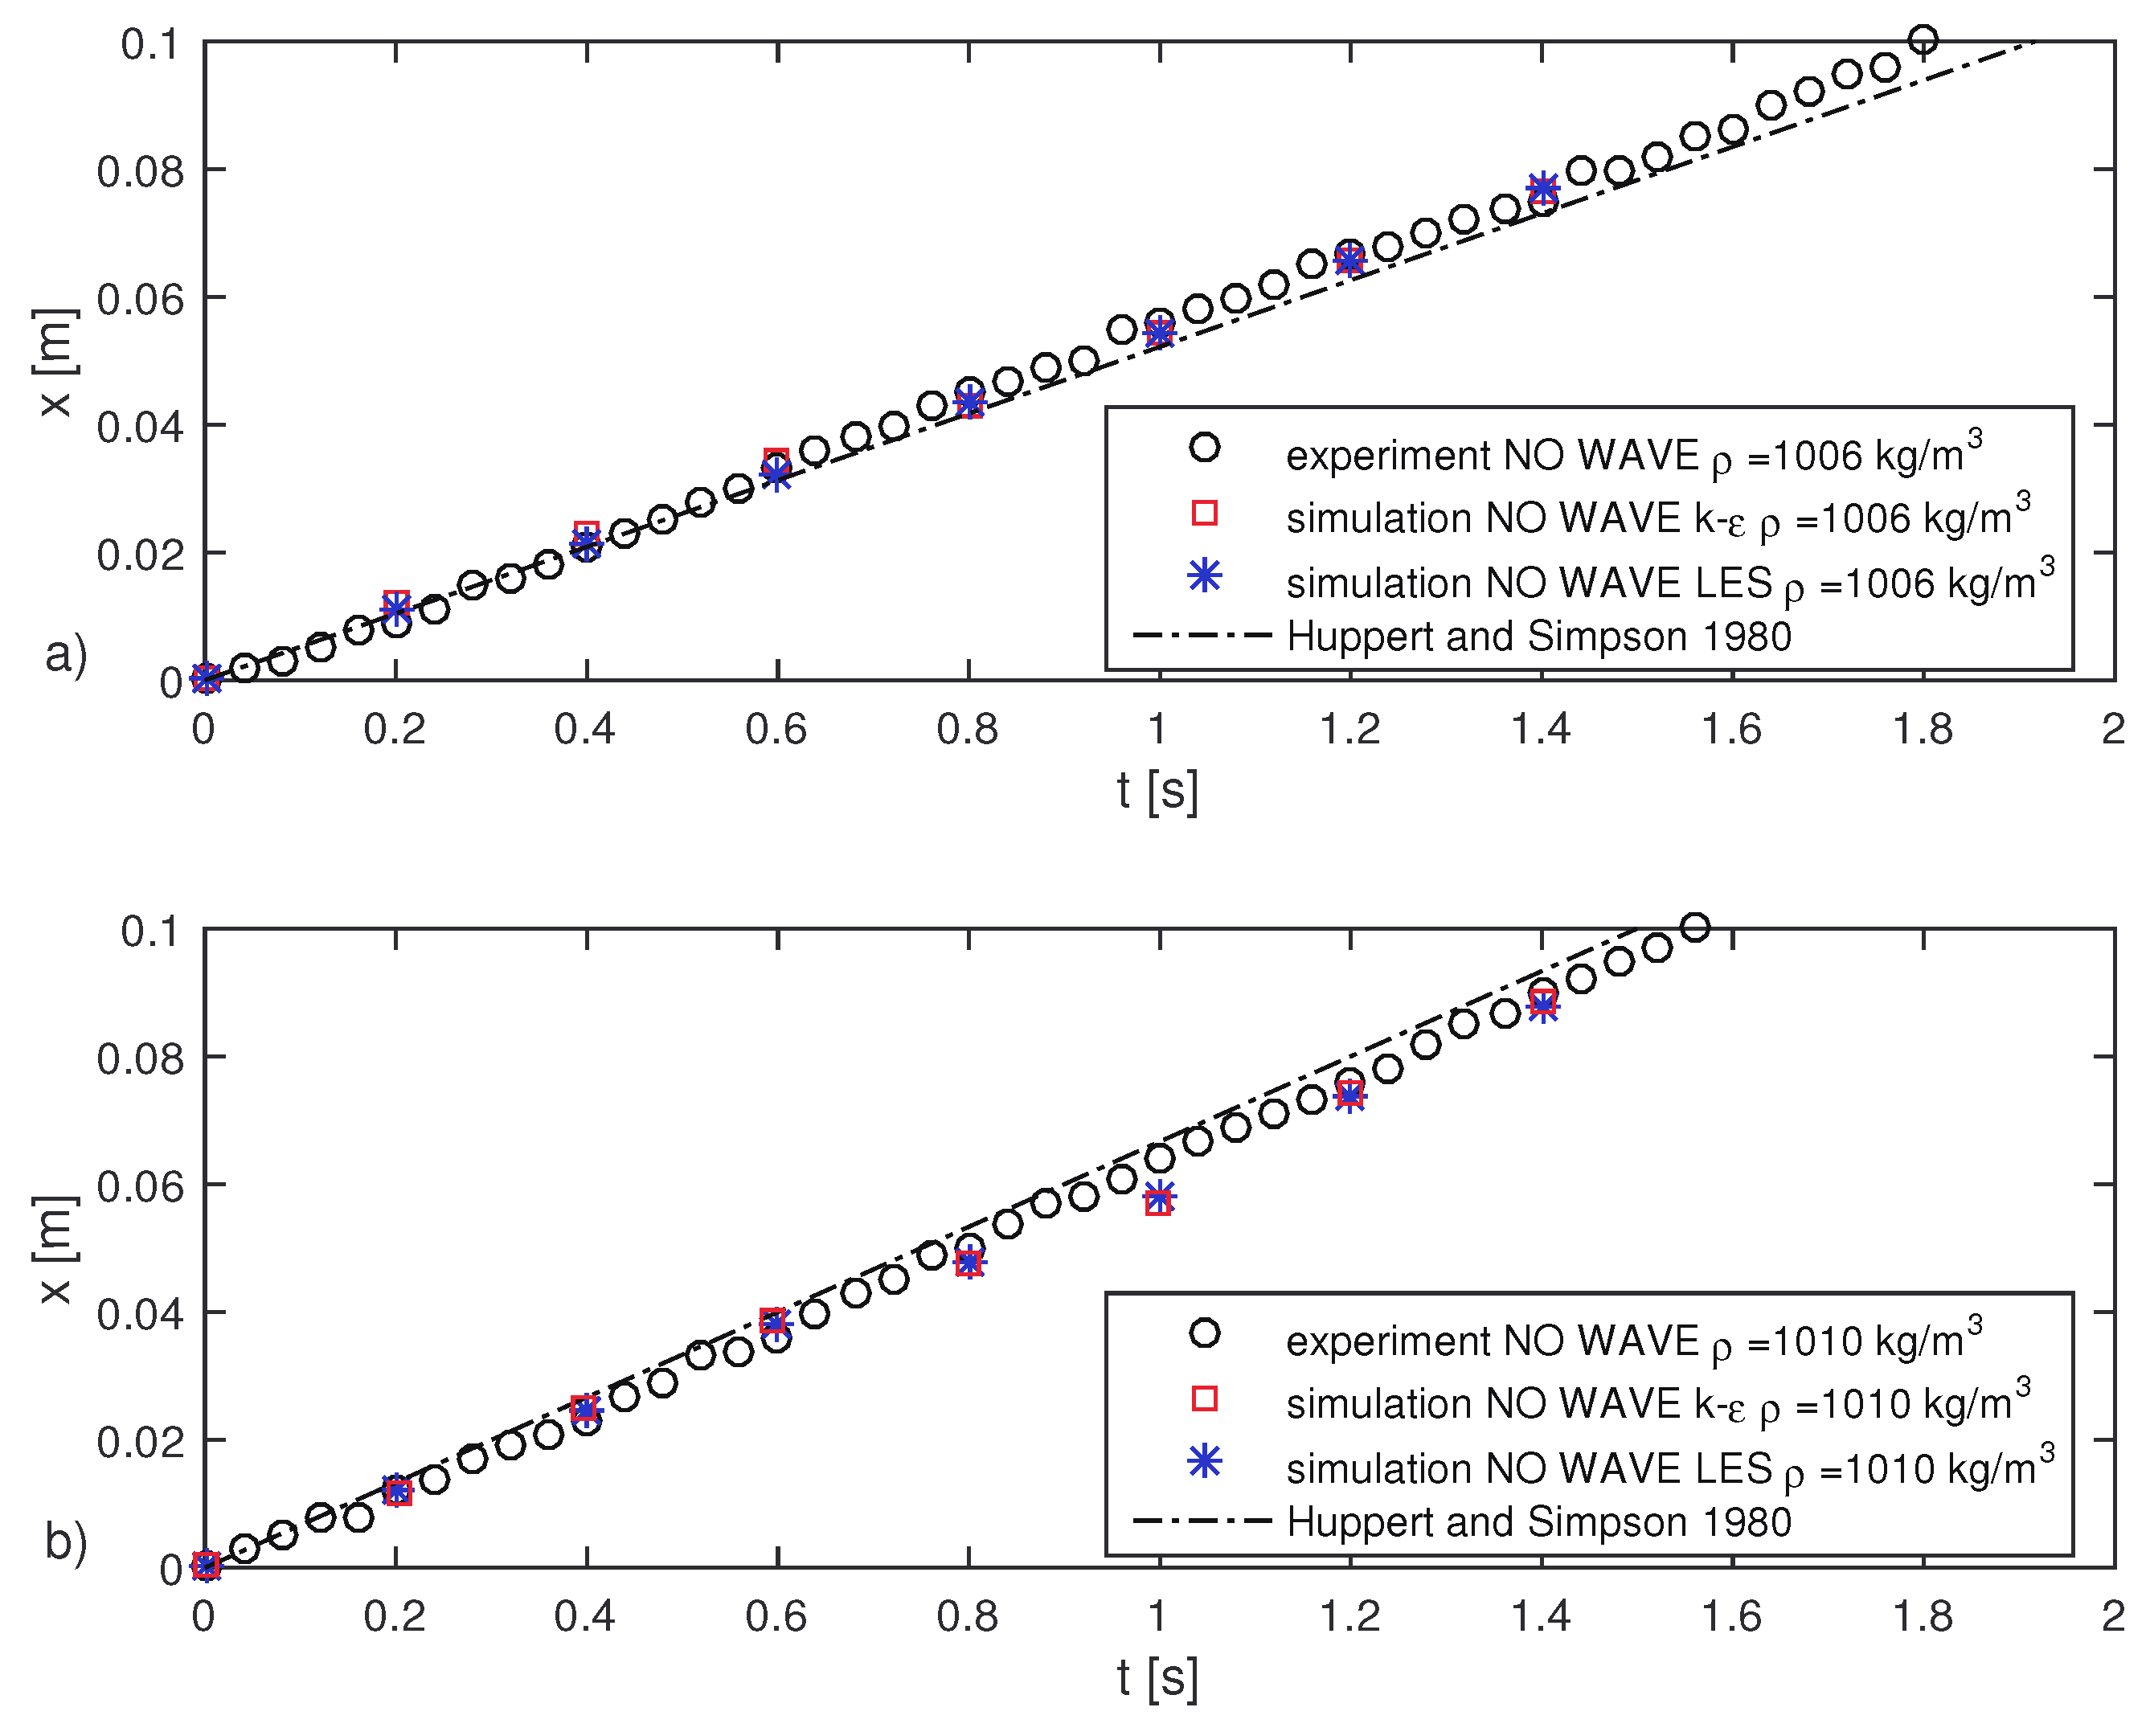
Figure 4.
Density contour map observed and calculated for Case 3 after t = 12.8 s from the gate opening: (a) using the light intensity to infer the dye (salt) concentration during the experiments; (b) model simulation; (c) LES model simulation. In both density maps, 10 contour layers are used, with values in the range 998–1006 kg/m. The shape of the experimental gravity current (density concentration threshold 0.96) is indicated with a dash-dotted green line on the numerical results.
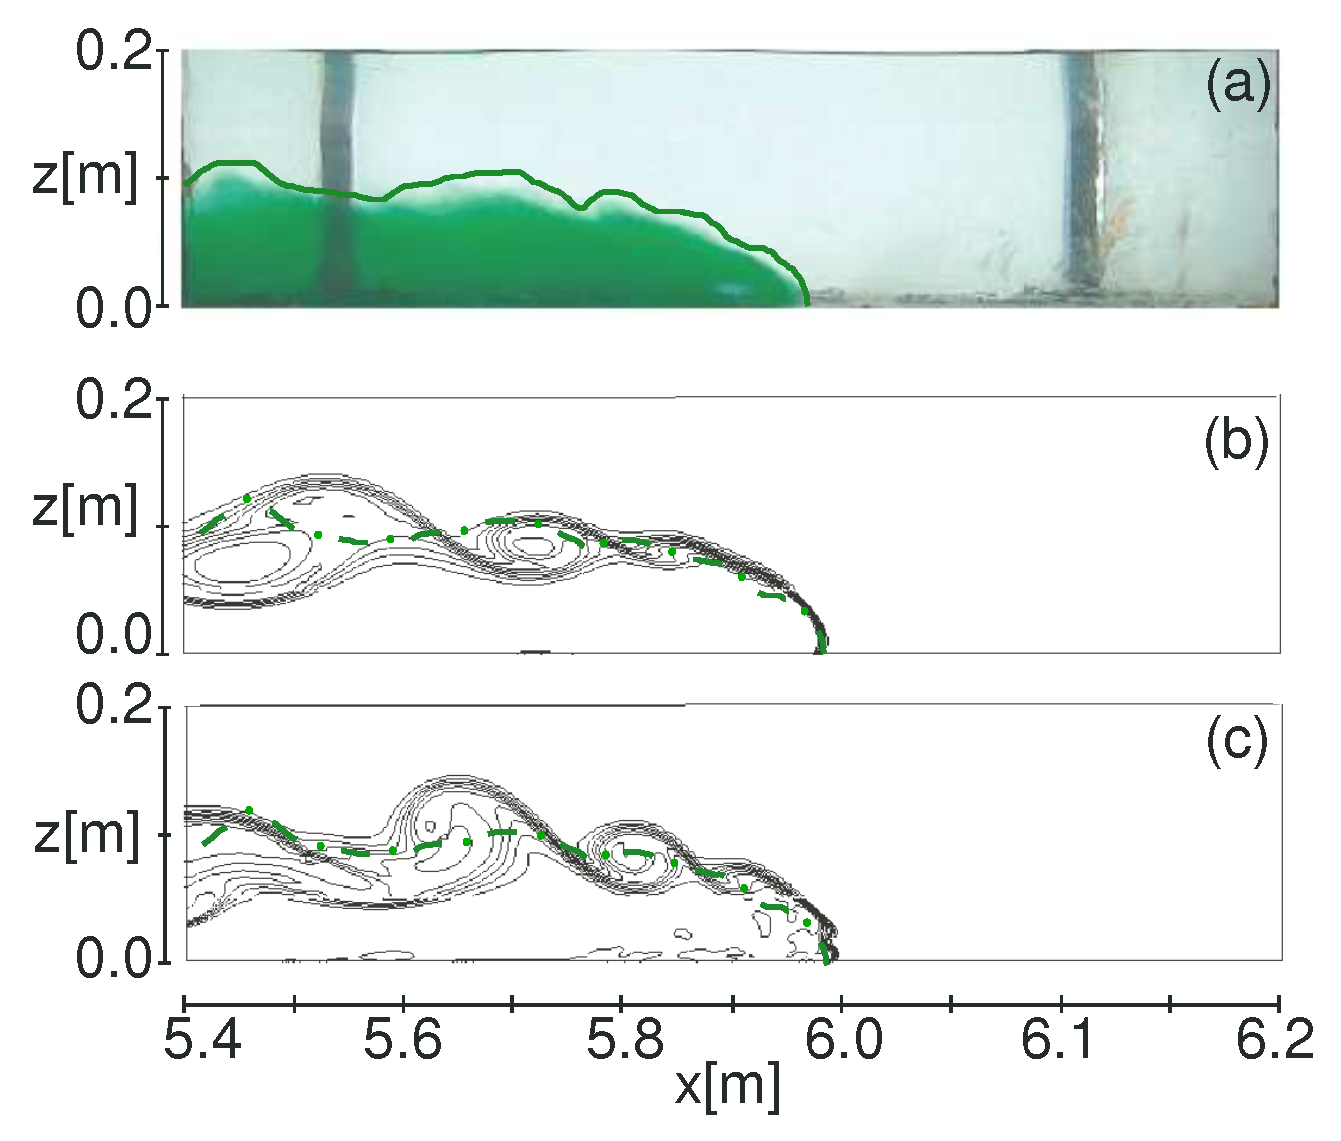
Figure 5.
Iso-surface representation of density current ( = 1004 kg/m) adopting the LES turbulence model, respectively: for the Test 1 simulation modeled at the following time steps: (a) t = 8 s and (b) t = 20 s; for the Test 2 simulation modeled at the following time steps: (c) t = 8 s and (d) t = 20 s.

Figure 6.
Q-criterion representation of vortex structures at the time step t = 17.4 s (LES model) for gravity current characterized by the same reduced gravity value (0.13 m/s), but different ambient fluid regimes, respectively for: (a) quiescent ambient fluid; (b) presence of shorter regular waves (Case 5); (c) presence of longer regular waves (Case 6).
Figure 7.
Density maps at different time steps (LES model) for gravity current characterized by the same reduced gravity value (0.13 m/s), but different ambient fluid regimes, respectively for: (first row) quiescent ambient fluid (Case 1); (second row) presence of shorter regular waves (Case 5); (third row) presence of longer regular waves (Case 6).
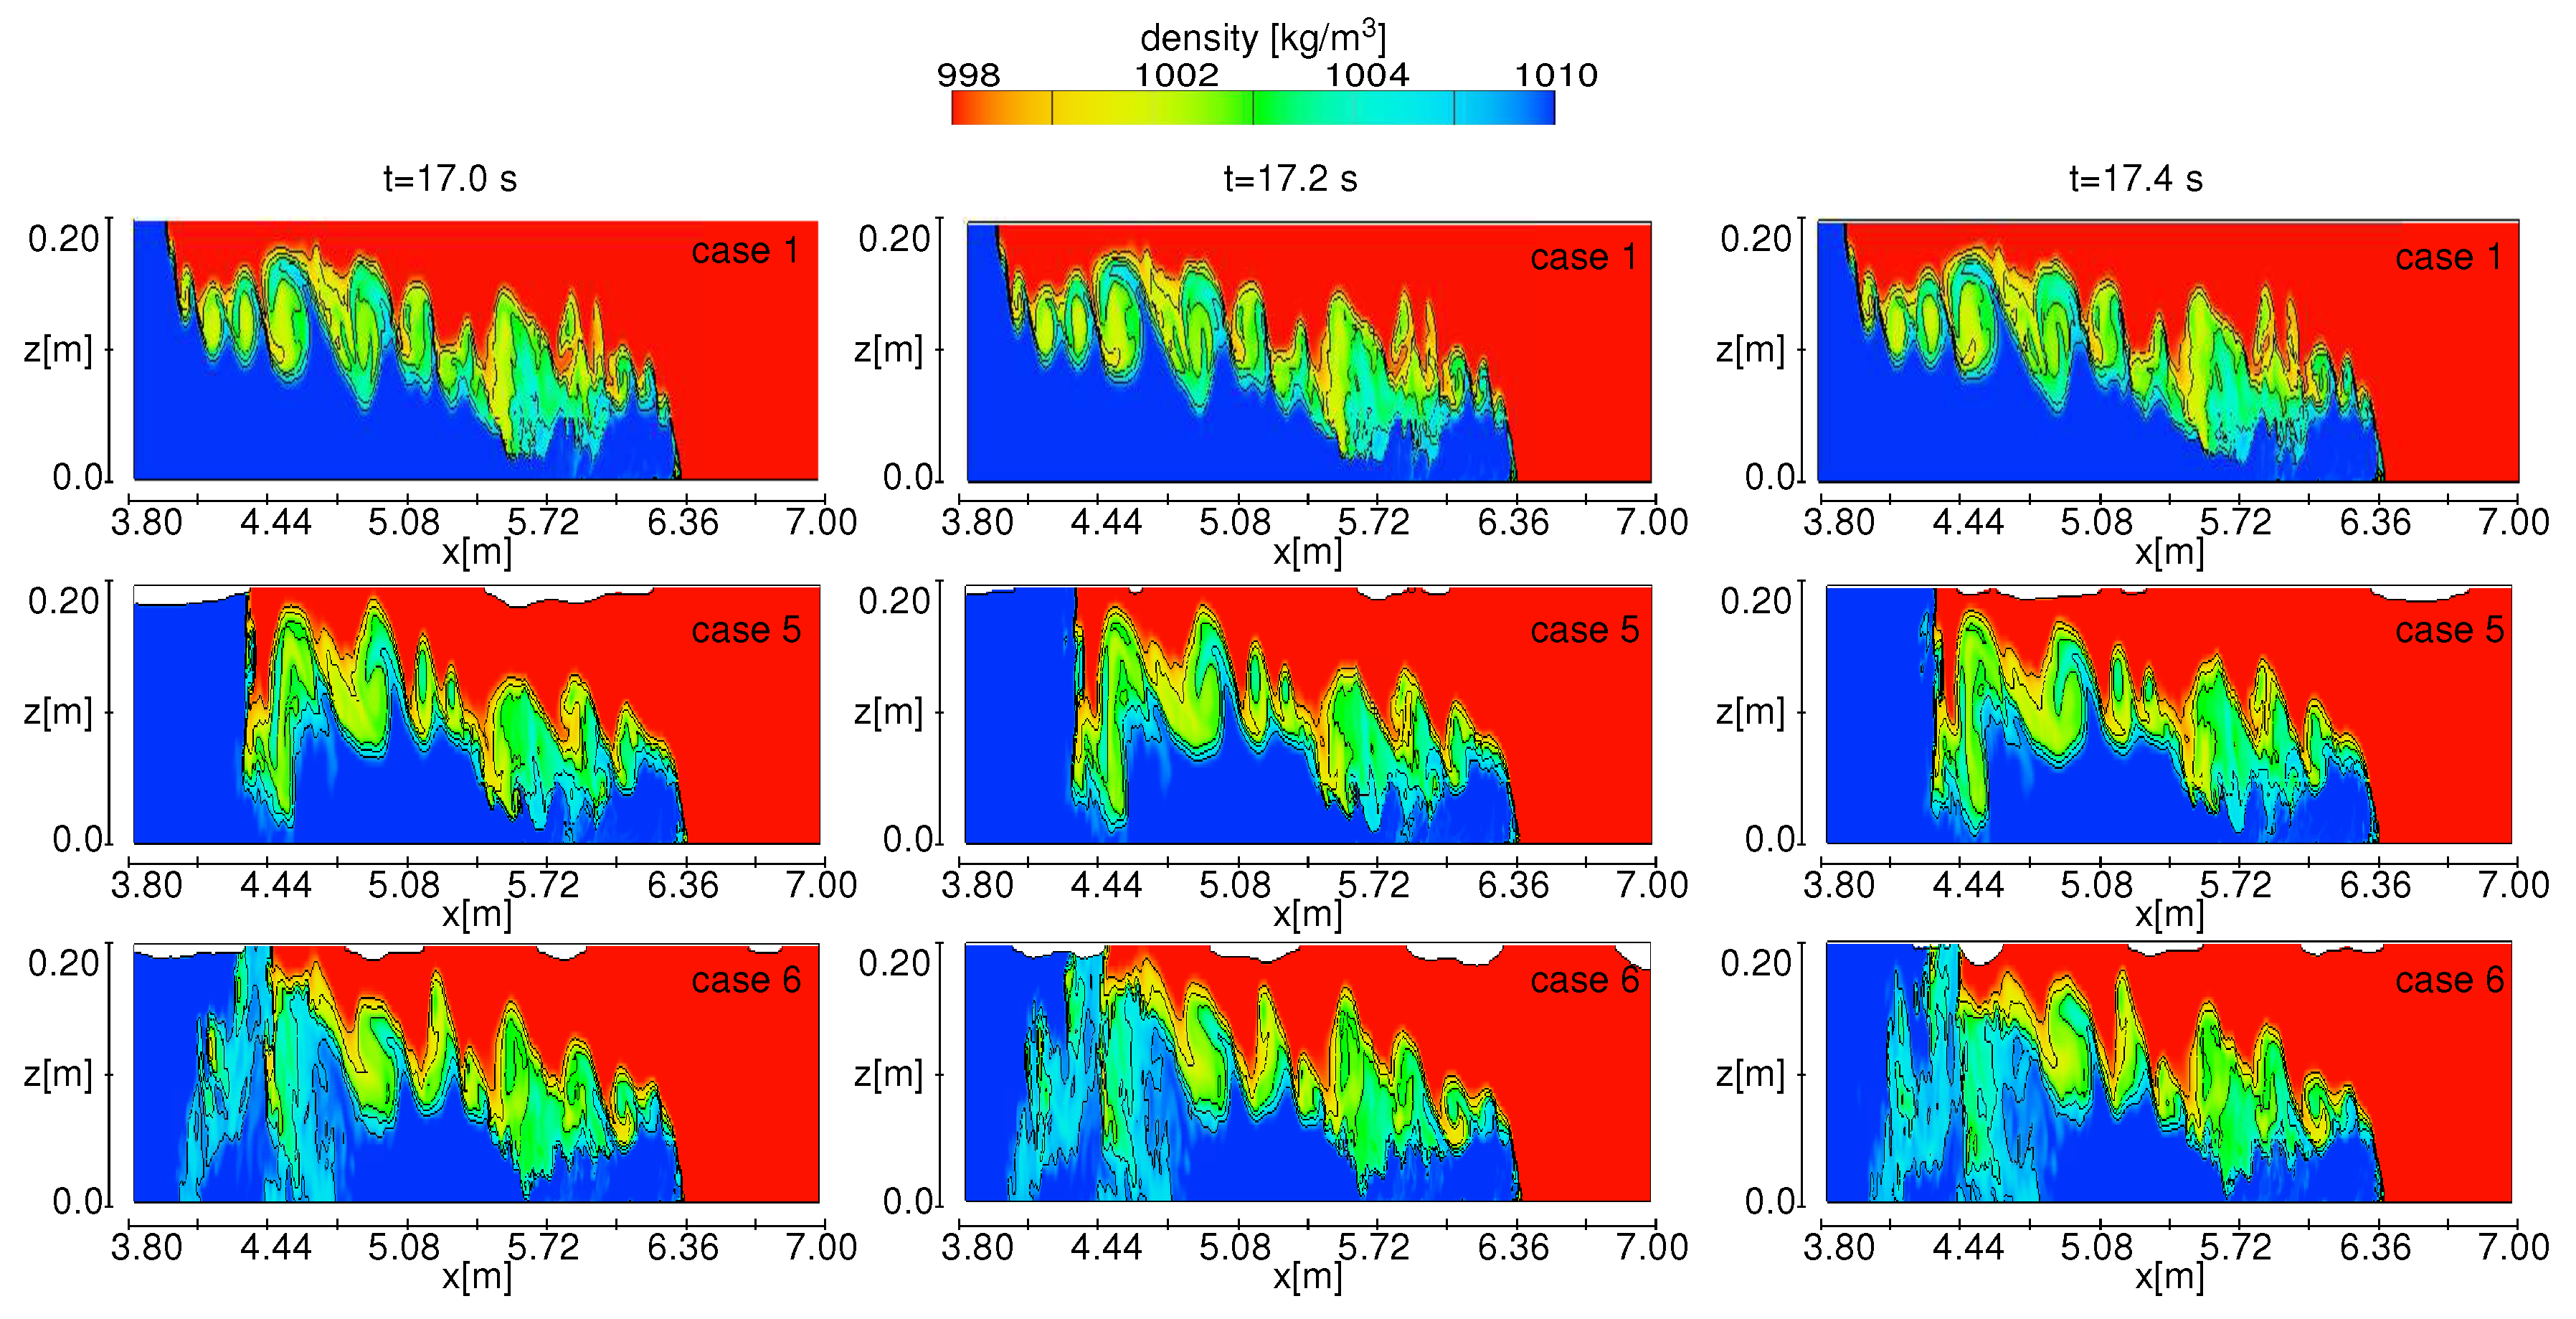
Figure 8.
Maps of the x-velocity component and density at the bottom, respectively for Test No. 3 (absence of wave) and Test No. 4 (presence of waves). The maps are presented with a time interval of 0.2 s covering the time period of 0.8 s, a duration equal to the wave period of Test No. 4.
Figure 8.
Maps of the x-velocity component and density at the bottom, respectively for Test No. 3 (absence of wave) and Test No. 4 (presence of waves). The maps are presented with a time interval of 0.2 s covering the time period of 0.8 s, a duration equal to the wave period of Test No. 4.
Figure 9.
LES simulation results of gravity currents. Case 3: (a) density map at t = 16 s reporting the section x = 5.9 m of the profiles; (c) density profiles and (d) velocity profiles acquired from t = 16 s to t = 17.2 s with a time step of 0.2 s. Case 4: (b) density map at t = 16 s reporting the section x = 5.9 m of the profiles; (e) density profiles and (f) velocity profiles acquired from t = 16 s to t = 17.2 s with a time step of 0.2 s.

Figure 10.
Comparison between concentration profiles acquired at t = 11.6 s and at a section located upstream of the front respectively for LES simulations (a) and for the experimental results of Stancanelli et al. [29] (b). The profiles refer to the gravity currents with reduced gravity of 0.13 m/s propagating in quiescent ambient fluid (no wave) and in the presence of regular surface waves ( = 0.06). For the numerical simulations, they are relative to the centerline of the flume, while for the experimental results, they are width average measurements.
Figure 11.
Comparison between the observed maximum oscillation of the gravity current depth (at x = 5.10 m) and the maximum vertical displacement of the wave-induced particle trajectory 2B. Data from the experimental campaign of Stancanelli et al. [29] and the simulation results.
Figure 11.
Comparison between the observed maximum oscillation of the gravity current depth (at x = 5.10 m) and the maximum vertical displacement of the wave-induced particle trajectory 2B. Data from the experimental campaign of Stancanelli et al. [29] and the simulation results.


Table 1.
Controlling parameters of the experimental tests selected to validate the numerical simulations.
Table 1.
Controlling parameters of the experimental tests selected to validate the numerical simulations.
| H | ||||||
|---|---|---|---|---|---|---|
| (cm) | (kg/m) | (kg/m) | (m/s) | (cm) | (s) | |
| Case 1 | 20.3 | 1010 | 998 | 0.13 | - | - |
| Case 2 | 20.3 | 1010 | 998 | 0.13 | 4.22 | 0.71 |
| Case 3 | 20.3 | 1006 | 998 | 0.08 | - | - |
| Case 4 | 20.3 | 1006 | 998 | 0.08 | 4.22 | 0.71 |
| Case 5 | 20.3 | 1010 | 998 | 0.13 | 2.86 | 0.84 |
| Case 6 | 20.3 | 1010 | 998 | 0.13 | 1.50 | 1.32 |
© 2018 by the authors. Licensee MDPI, Basel, Switzerland. This article is an open access article distributed under the terms and conditions of the Creative Commons Attribution (CC BY) license (http://creativecommons.org/licenses/by/4.0/).
Share and Cite
MDPI and ACS Style
Stancanelli, L.M.; Musumeci, R.E.; Foti, E. Computational Fluid Dynamics for Modeling Gravity Currents in the Presence of Oscillatory Ambient Flow. Water 2018, 10, 635. https://doi.org/10.3390/w10050635
AMA Style
Stancanelli LM, Musumeci RE, Foti E. Computational Fluid Dynamics for Modeling Gravity Currents in the Presence of Oscillatory Ambient Flow. Water. 2018; 10(5):635. https://doi.org/10.3390/w10050635
Chicago/Turabian StyleStancanelli, Laura Maria, Rosaria Ester Musumeci, and Enrico Foti. 2018. "Computational Fluid Dynamics for Modeling Gravity Currents in the Presence of Oscillatory Ambient Flow" Water 10, no. 5: 635. https://doi.org/10.3390/w10050635
Note that from the first issue of 2016, this journal uses article numbers instead of page numbers. See further details here.