Article

Hidden Cost of Drinking Water Treatment and Its Relation with Socioeconomic Status in Nepalese Urban Context

1
Interdisciplinary Graduate School of Medicine and Engineering, University of Yamanashi, 4-4-37 Takeda Kofu, Yamanashi 400-8510, Japan
2
International Water Management Institute (IWMI), Nepal Office, GPO Box- 8975, EPC 416 Kathmandu, Nepal
3
Kobe Gakuin University, Kobe City, Hyogo 651-2180, Japan
4
Interdisciplinary Centre for River Basin Environment, University of Yamanashi, Kofu, Yamanashi 400-8511, Japan
5
The Small Earth Nepal (SEN), Tripureshwor, GPO Box-20533 Kathmandu, Nepal
6
Graduate Faculty of Interdisciplinary Research, University of Yamanashi, 4-4-37 Takeda Kofu, Yamanashi 400-8510, Japan
*
Author to whom correspondence should be addressed.
Water 2018, 10(5), 607; https://doi.org/10.3390/w10050607
Submission received: 3 April 2018 / Revised: 28 April 2018 / Accepted: 4 May 2018 / Published: 6 May 2018
(This article belongs to the Section Urban Water Management)

Abstract

:
Kathmandu Valley faces water scarcity from decades of the added burden of water storage and treatment, which imposed cost. We estimated the method-specific cost of in-house drinking water treatment (9 L/day used) based on equipment price and life, daily operation time, fuel used, and consumables replacement frequency, which were Nepalese Rupees (NRs) 23, 57, 392, 586 and 799 for chemicals, ceramic filter, boiling, Euro-Guard and reverse osmosis-ultraviolet (RO-UV) water purification, respectively. The monthly average water treatment cost was estimated based on these estimates and treatment methods used in households, obtained from a questionnaire survey of 1500 households, and its socioeconomic relationship in a Nepalese urban context was investigated. Of the households, 75% practiced at least one treatment method, (average, 1.4). The estimated monthly average cost per household was NRs 380. The fixed effects model showed that the cost was significantly higher in Lalitpur district, and in high school education households. Higher water insecurity perception of respondents was the main determinant of higher treatment cost, which was especially true in Lalitpur district. Water treatment added extra financial burden, especially for the poor households which should be averted or minimized by concerned authorities to provide adequate quantity, quality, and access to drinking water for all.

1. Introduction

Clean, safe water is essential for human life and has high social, economic, and cultural importance for people. Access to safe drinking water and sanitation is a basic human right recognized by the United Nations in 2010 [1]. Everyone has the right to sufficient, safe, acceptable, continuous, physically accessible, and affordable water for personal and domestic use [2]. However, 2.1 billion people globally and >140 million in the Southeast Asia region still do not have access to safely-managed water services, and approximately 80% of illnesses are linked with poor water and sanitation in developing countries [3]. In Southeast Asia (population nearly 1.6 billion), water availability has decreased nearly 80% per capita since the 1950s [4]. To address the water security and accessibility of safe water worldwide, the sustainable development goal (SDG) target 6 focused on “ensuring availability and sustainable management of water and sanitation for all” by the year 2030.
Provision of adequate, safe, and affordable drinking water for the whole population is the responsibility of the government. Nepal’s National Urban Water and Sanitation Sector Policy 2009 highlighted the full commitment to provide safe drinking water and sanitation services for all citizens and emphasized it as a fundamental human need and basic human right [5] to achieve the SDG targets. However, several research reports emphasized the poor water supply situation of the Kathmandu Valley, which had been experiencing water scarcity for decades. This problem persisted due to increased population, urbanization [6], compromised infrastructure, and an intermittent water supply [7,8]. The total water demand in the Kathmandu Valley is 370 million liters per day (MLD), while the supply from the Kathmandu Upatyaka Kanepani Limited (KUKL) is only 86 and 144 MLD during the dry and wet seasons, respectively, demonstrating a large supply deficit [9]. Thapa et al. (2018) estimated that the KUKL supplies only 19% and 31%, respectively, of total water demand in the service areas of the Kathmandu Valley [10]. The Melamchi Water Supply Project (MWSP), which was initiated in 1998 and expected to be completed by 2014, is a key initiative of the Government of Nepal for the long-term alternative to ease the chronic water shortage situation [11]. However, it was delayed due to several factors, such as the decision-making process of the MWSP, Gorkha Earthquake in 2015, fuel crisis, and a slow tunnel digging process, all of which lengthened the waiting period for the valley residents [12]. Since the MWSP is significantly delayed, it forces people to depend more on poor quality water sources, such as wells, stone spouts, vendors and tanker water. Research done by Pattanayak et al. (2005) concluded that households engaged in collecting, pumping, treating, storing, and purchasing to cope with the water scarcity situation incurred a cost of $3 per month (1% of current income), representing hidden, but real costs of poor infrastructure services [13].
Similarly, the quality of water found in the Kathmandu Valley was heavily contaminated with physical, chemical, and biological parameters that exceeded the World Health Organization (WHO) standards. Warner et al. (2007) showed that 94% of the samples contained coliform and 72% of samples had Escherichia coli bacteria from piped and ground water sources collected at 100 places in the Kathmandu Valley [14]. Pant (2011) highlighted ground water sources vulnerable to drink due to contamination with iron and coliform bacteria [8], and Subedi and Aryal concluded that jar water is not safe for drinking without treatment [15]. In such situations, water quality must be improved at both the supply point and the household level.
Treating drinking water in households can lead to improvements in the drinking water quality as well as protection of the residents from waterborne diseases. The WHO and United Nations Children’s Fund (UNICEF) adopted a seven-point strategy for comprehensive diarrhea control in 2009, which includes household water treatment and safe storage [16]. However, the adoption of water treatment in households requires knowledge, willingness, cost, and time. In many developing countries, cost is a major challenge for using treated drinking water [17]. In the Kathmandu Valley, most households use different treatment methods to cope with this situation. Boiling and using a ceramic filter are the most common methods of water treatment [18]. However, recently, costly methods, such as those of the Euro-Guard and Domestic Treatment Plant (RO-UV), are becoming popular. Additionally, chemical treatment, especially with chlorine, is used in emergency situations [19] and in a few households. Water treatment may seem common and normal to conduct in water-scarce locations, but it regularly increases the household’s expenditure. The cost incurred by the water treatment method is not planned, estimated, or recorded anywhere by any households or any organizations.
Several social, economic, and cultural factors may influence the attitudes and behavioral changes, and facilitate or inhibit the decision, selection, and use of drinking water treatment practice in the households [20]. Research done by McGarvey et al. (2008) also suggested that socioeconomic factors indirectly influenced the use of water source, water quality, and treatment behavior [21]. Most of the research focused on the water quantity, quality, and coping strategies applied for the poor water quality in the Kathmandu Valley, but very limited research was done to measure the cost of the in-house water treatment burden. Pattanayak et al. (2005) estimated that $0.79 was spent for water treatment every month by households in Kathmandu [13]. They considered only boiling and filtering for treatment and assumed either of these methods was used in a household. In recent years, however, households of the Kathmandu Valley were more concerned with safe drinking water and its health benefits; thus, more expensive and sophisticated methods have been emerging and often more than one method is used. In this context, our objectives were to identify the household water treatment practices, associated costs, and how these costs are associated with the urban socioeconomic context of the Kathmandu Valley.

2. Materials and Methods
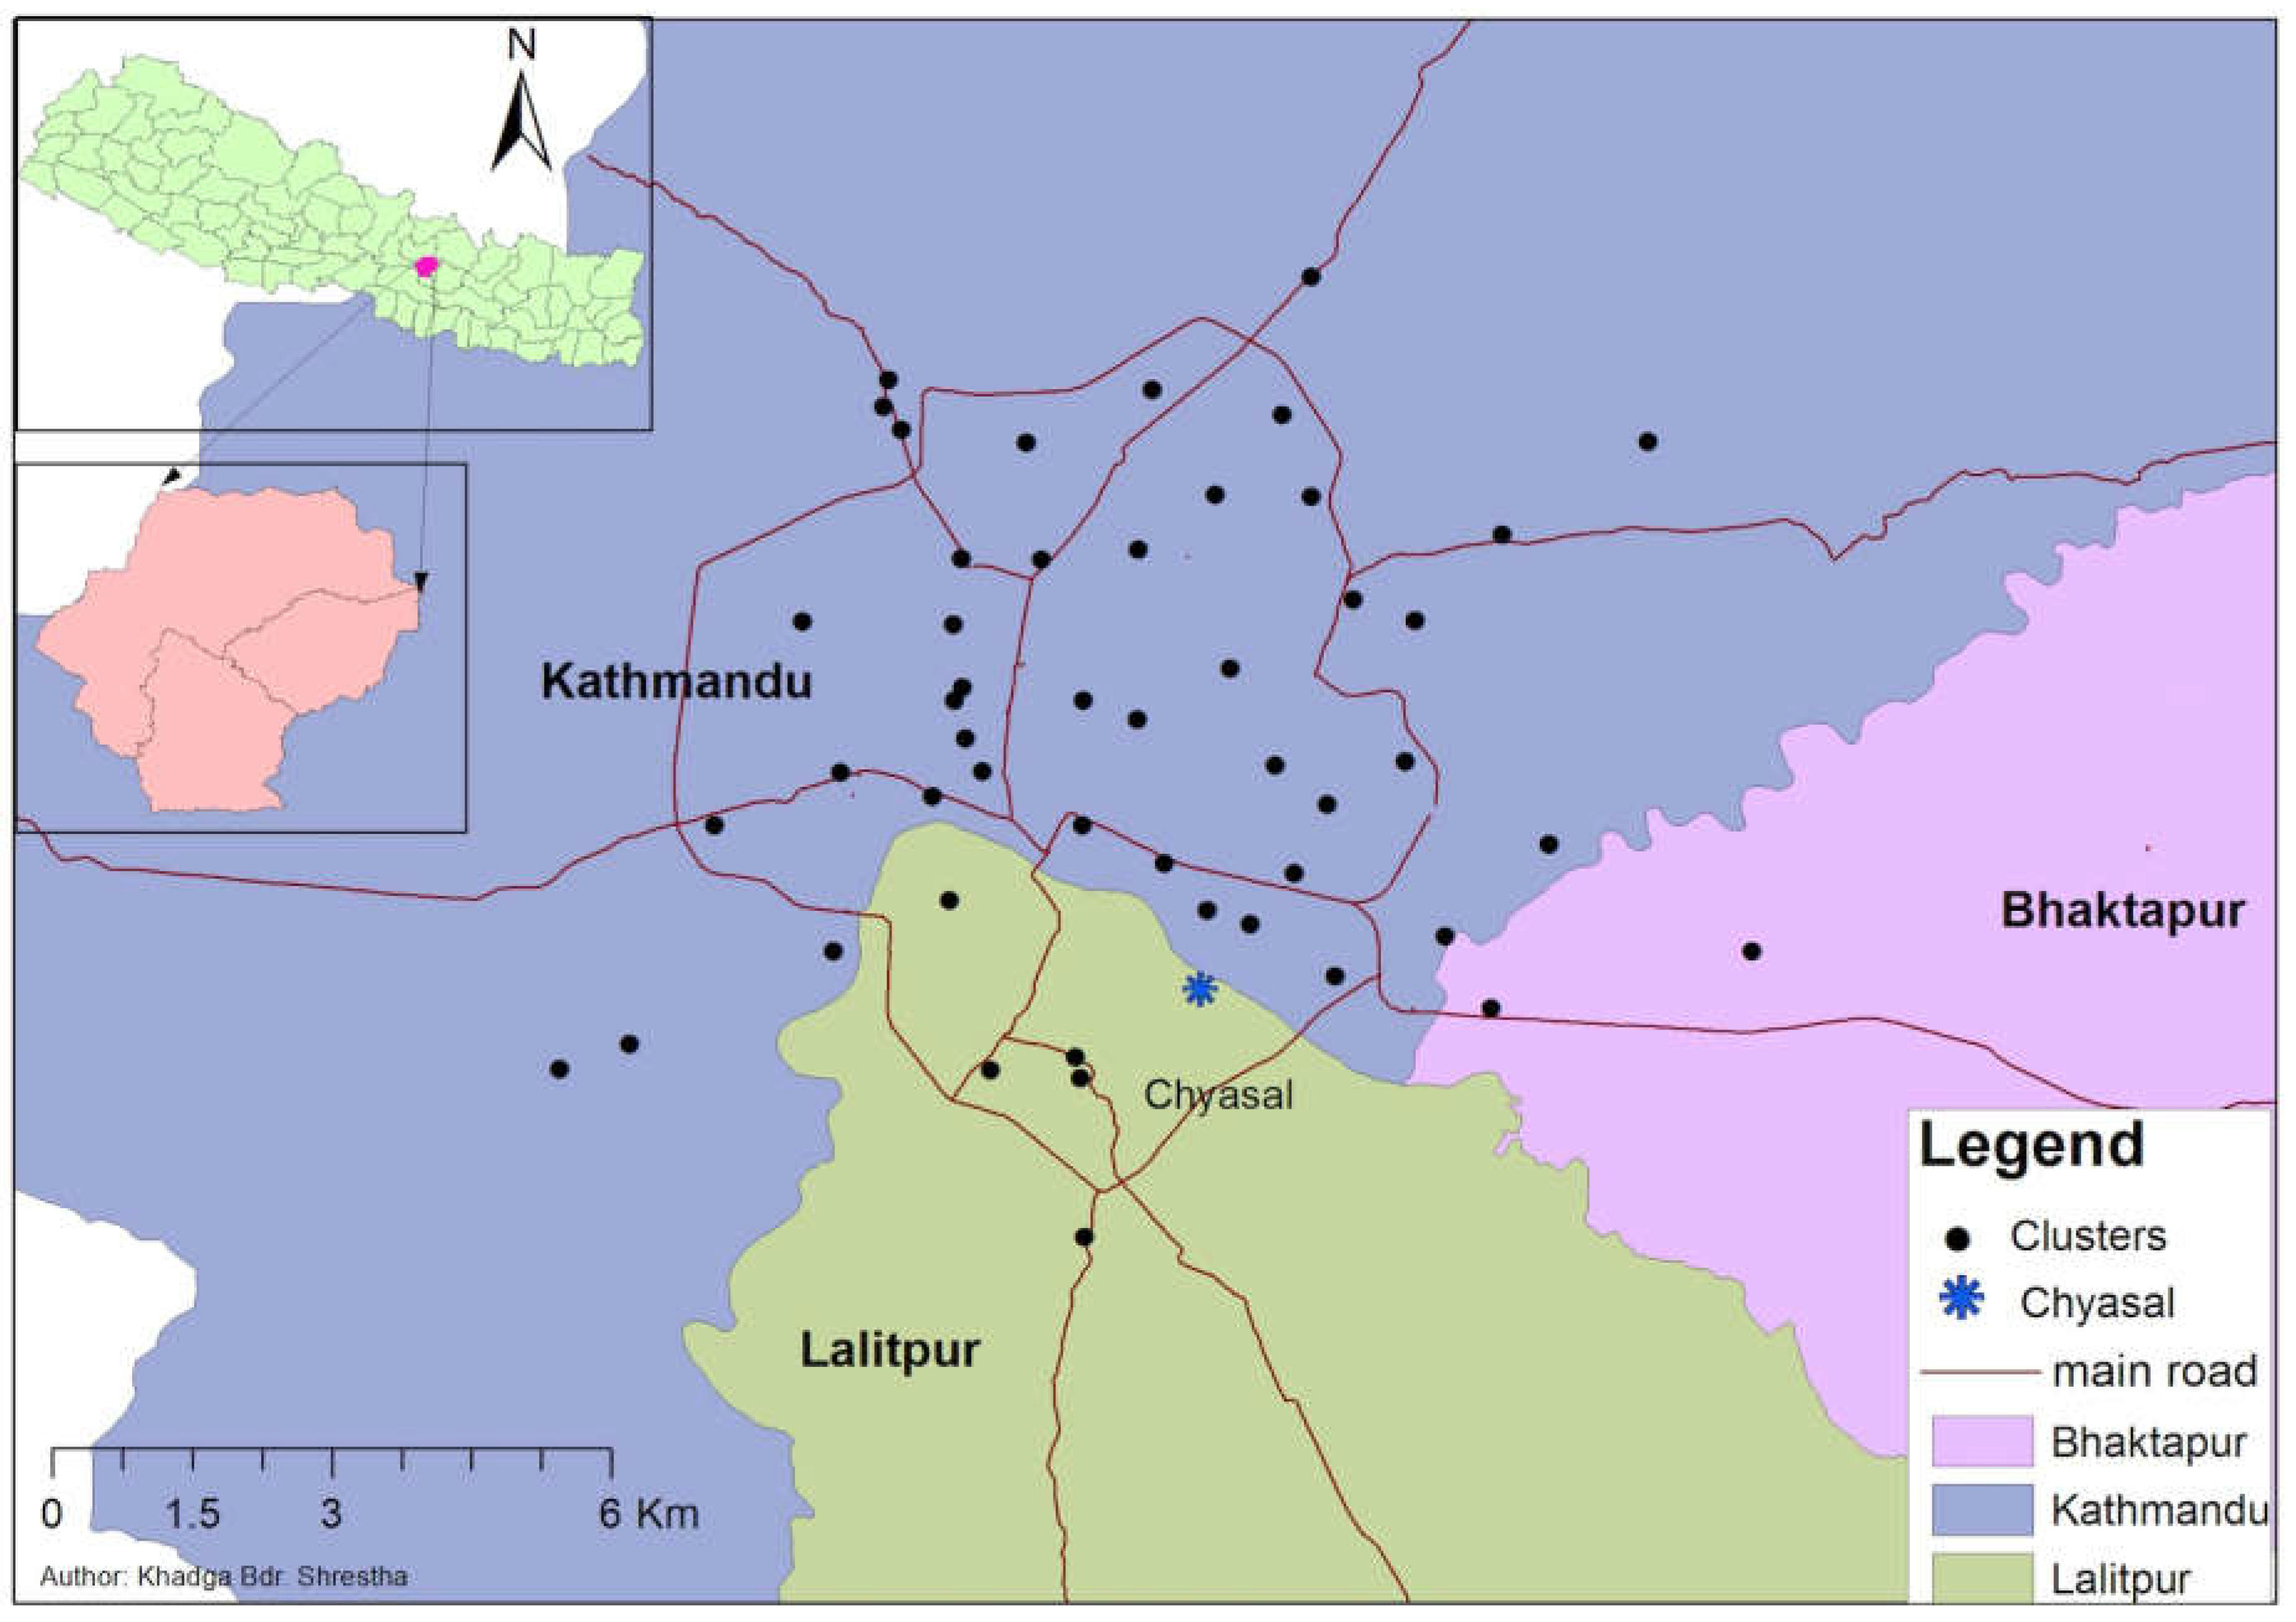
2.1. Study Area:

This study was conducted in the Kathmandu Valley in the upper part of the Bagmati River Basin in the central part of Nepal, composed of three districts (Kathmandu, Lalitpur, and Bhaktapur). The valley covers an area of 665 km2 [22], has a total population of 2.56 million [9], and has unique traditions and a rich heritage. However, rapid expansion and modernization have added serious social, economic, environmental, and ecological challenges leading to chronic water scarcity [23]. To explore the method-specific treatment cost, interviews with household’s heads were conducted in Chyasal, Lalitpur (star in Figure 1). A questionnaire survey was conducted at the 50 clusters (dots in Figure 1), to estimate the average monthly treatment cost in the households of the Kathmandu Valley households as well as to evaluate the socioeconomic association with treatment practices.

2.2. Methods

2.2.1. Estimation of Method-Specific Water Treatment Cost

In October 2017, the heads of 10 randomly-selected households at Chyasal Lalitpur were interviewed to explore the cost of the equipment (initial and installation), average equipment life, daily operation time, yearly maintenance cost, and the current unit price of fuel (gas per cylinder and electricity per unit kilowatt (kW)). Variations in cost due to type of equipment, brand, quality, and supplier were minimized by comparison with data from local vendors and adjusting outlier values.
From the questionnaire survey data described below, the calculated average amount of drinking water was 9.4 L per family per day (rounded to 9 L). The method-specific monthly cost for 9 L/day water treatment was calculated by the sum of initial, operating and maintenance costs of the particular method. The initial cost was calculated from averaged hardware cost and installation costs divided by the average life:
Cinitial = (CEQ + CIN)/LEQ
where Cinitial indicates monthly initial cost (NRs/month), CEQ (NRs) is the cost of equipment, CIN (NRs) is the cost of installation, and LEQ (month) is the average life of the equipment.
The operating cost included cost of fuel (gas or electricity) and chemicals used. For boiling, operating cost was calculated using the energy demanded to raise the temperature of 9 L water from 20 to 100 °C, thermal efficiency, and unit cost of gas and electricity as shown in Equations (2) and (3), respectively:
Cop, gas = Wv × Ed × UCgas × 30/TEgas
Cop, elect = Wv × Ed × F × UCelec × 30)/TEelec
where Cop, gas and Cop, elect indicate operating cost by gas and by electricity, respectively; Wv is volume of water per day (9 L); Ed indicates energy demand for raising temperature of 1 L water from 20 to 100 °C (80 kcal); TEgas and TEelec are thermal efficiency of gas stoves (66%) [24] and electric kettles (85%); F denotes conversion factor from kcal to kWh (0.00116222); and UCgas and UCelec are unit cost of gas (0.008648 NRs/kcal) and electricity (12 NRs/kWh). The present unit cost in Kathmandu, UCelec and UCgas, was derived from the weight of gas and the price of a cylinder (14.2 kg and 1400 NRs) and unit energy of LPG (11,400 kcal/kg).
Cost of electricity used for Euro-Guard and RO-UV systems were estimated based on the wattage of instruments and operation time for 9 L water treatment, the values that were obtained by interview with households possessing the instruments and local vendors, and unit electricity cost.
Lastly, the maintenance cost was calculated by the average cost of consumables changed per average duration as shown in Equation (4):
Cma = ∑Ci × Fi/12
where Cma indicates maintenance cost, Ci (NRs) is the cost of consumable i, and Fi (times per year) indicates frequency of consumable changed per year.

2.2.2. Estimation of Average Monthly Treatment Cost

The questionnaire survey was conducted in urban areas of the valley in Kathmandu Metropolitan city, Kritipur municipality, Lalitpur sub-metropolitan city, and Thimi municipality in the wet season from August to November 2016. Details of this survey have been reported by Shrestha et al. (2016) [18]. The multistage cluster sampling technique was used for households sampling. More specifically, 50 clusters (wards) were selected based on the probability proportional to household number in wards (two or more clusters were selected in a populated ward), a random geographical location was selected from each cluster, and 30 houses around the location were surveyed. Trained interviewers conducted face-to-face interviews with family members aged 15–60 years, who had the capability of understanding and answering the questions. A house usually had more than one family, but only one family was selected for the interview. The structured questionnaire included various household water related data as shown in Shrestha et al. (2016) [18]. Among them, data on social and demographic characteristics, such as district, ethnicity, education level of respondent and household head, occupation of respondent and household head, and household possession of amenities, and water-relating parameters, such as water sources, drinking water consumption, treatment practices, household expenditure to purchase water, and water insecurity perception were used in this study, which likely affect in-house water treatment practice. Average monthly water treatment cost per household was calculated based on the types used in each household and method-specific cost estimated.

2.2.3. Socioeconomic Status Variables

Socioeconomic variables basically represent the status of a person or family within society, which constitute the major social basis for inequalities [25]. We considered district (location), ethnicity, occupation, education, wealth quintile, and water insecurity index, which can have a dominant role in determining the cost of water treatment cost within the household. Ethnicity represents the tribal identity of a Nepalese family, which is very diverse and complex, based on the four principles of castes similar to that of India. In the ethnicity hierarchy, Brahmin is the highest caste, followed by Chhetri (the Royal families), then Baise, and finally Sudra (colloquially known as untouchable or Dalit), which technically was abolished but is still observed in some parts of the country. In this study, ethnicity was categorized mainly into five groups: Brahmin/Chhetri, Newar, Janajati, Teraibasi, and Dalit.
Regarding education status, the higher education of the respondent or household’s head was chosen and categorized into five groups: illiterate (cannot read and write), literate only (no formal schooling), primary and secondary school (1–10 class), high school (11–12 class), and university level (Bachelor, Master, and PhD). Occupation was defined as unemployed (housewife, retired, and no job), daily employed (domestic work, skilled and unskilled worker, agriculture, and remittance), student, business, and service (receive a regular monthly salary as manager, professional, clerical and service (regular work in public or private organizations) workers).
Similarly, wealth quintile index was derived from the possession of 14 household amenities (freezer, fan, radio, television, land phone, mobile phone, bicycle, motorbike, car, computer, electric stove, gas stove, kerosene stove, and domestic helper) and categorized into five groups (poorest, poor, middle, rich, and richest) by using principal components analysis [26]. In addition, the water insecurity index was calculated based on 15 statements related to access, adequacy, safety, and lifestyle with six option ratings (1, never; 2, rarely; 3, sometimes; 4, often; 5, mostly; and 6, always) by summing up the score and categorizing it into three groups: high (>45 score), medium (30–45 score), and low (<30 score) (Table S1).

2.3. Statistical Analysis

The questionnaire survey data were entered in EpiData version 3.1 (EpiData Association, Odense, Denmark) and exported into IBM SPSS Statistics version 20 (SPSS, Inc., Chicago, IL, USA) for analysis. Descriptive statistics were used to summarize the water treatment cost and socioeconomic status variables: district, ethnicity, education, occupation of household head, wealth quintile, and water insecurity index. To estimate the average treatment cost and effect of socioeconomic factors on the cost, the association of monthly water treatment cost with socioeconomic parameters was analyzed by using a fixed effect model [27] in a linear mixed model procedure of IBM SPSS Statistics. Pairwise comparisons were performed based on adjusted p value by Bonferroni correction for multiple pairwise test [28].
Among 1500 households, four with mismatched identification numbers and one with missing values were excluded from the analysis, leaving 1495 households for analysis.

2.4. Ethical Considerations

The ethical review board of the University of Yamanashi (Japan) and Nepal Health Research Council (NHRC) reviewed and approved the study protocol (application numbers 1 (28 November 2014) and 262/2014 (18 January 2015), respectively). The trained enumerators informed the respondents about the objectives and procedures of this research and requested their voluntary participation in the interview. Respondents were informed about withdrawal from the study as well as skipping questions that they were unwilling to answer at any time during the interview. The confidentiality and anonymity of the respondent were assured. Informed written consent was obtained from all participants.

3. Results

3.1. Estimation of Method-Specific Cost

Households in the Kathmandu Valley used one or more methods for drinking water treatment. Table 1 shows the estimates of method-specific monthly cost for the treatment of 9 L water per family per day (270 L/month) and the summarized base data for calculations.

3.1.1. Cost for Chlorine Use

Piyush” and “Water-guard” are the most widely available chlorine solutions in the market. Households purchased a 60 mL of bottle “Piyush” for NRs 25, which was used to treat 300 L of water. To treat 9 L water, 1.8 mL chlorine solution is required per day. Thus, the average cost for chlorine use was NRs 22.5 per family per month.

3.1.2. Cost for Ceramic Filter

The filter with ceramic candles was the most common method of water treatment in the Kathmandu Valley. Its initial cost was NRs 800 (NRs 500 for ceramic body or NRs 1,125 for stainless steel body), with an average life of five years (2–8 years). Operating cost is not necessary, but the maintenance cost to replace two filter candles, twice a year (every 3–12 months) was NRs 520 (NRs 260 (NRs 190–320) × 2). Candle replacement depends on the water quality, clogging, cleaning (reuse), and breakage during washing or changing. The average cost for the ceramic filter use was calculated as NRs 57 per month.

3.1.3. Cost for Boiling

Boiling of water with gas or electricity was another common method in the Kathmandu Valley. Approximately 70% of households used gas for boiling water and the remaining 30% used electricity, according to information from vendors. Fewer households used electricity for boiling water due to the uncertainty of load shedding, the frequent breakage of the heater (generally ceramic), and need to change the heater coil frequently.
The initial cost of the gas stove, which was used on average 30% of the time to boil water based on daily gas used (averaged life five years; ranged 2–8 years), was NRs 1500 (NRs 600–7000). Therefore, the monthly initial cost was NRs 7.5 ((NRs 1500 × 0.3)/(12 × 5 years)). Operating cost calculated by Equation (2) was NRs 283 and monthly maintenance cost (one stainless steel pot with one-year life was considered) was NRs 600 (NRs 450–900). The total monthly cost, then became NRs 340.5.
Similarly, the initial cost for an electric heater was NRs 200 (NRs 150–300; average life one year), the monthly maintenance cost for one electric coil was NRs 90 and the yearly cost of one stainless steel pot was NRs 600 (NRs 450–900). Therefore, the operating cost calculated by Equation (3) was NRs 354.4 and the total cost was NRs 511.1.
Therefore, the weighted average cost for gas and electricity was NRs 391.7 per month.

3.1.4. Cost for Euro-Guard

The Euro-Guard is an expensive and electricity requiring device. The price and electricity requirement differ based on the brands. This method was less popular among households, but was used in offices, schools, and universities. The initial cost was NRs 20,000 (NRs 8000–23,000) with an average life of five years (3–7 years). The water filter required changing yearly (5–12 months) and the Ultraviolet (UV) light bulb every two years (1–4 years). Euro-Guard produces a large volume of water, so households can use treated water for other purposes, such as cooking, washing vegetables, and bathing. We asked the average time for drinking water treatment from the respondents. According to the respondents, the average time required for drinking water treatment was 8 min (5–12 min) twice a day. Average wattage of the best-selling appliance was 28 W, thus per month electricity cost was calculated as NRs 2.7, and the total cost for Euro-Guard use was NRs 586 per month.

3.1.5. Cost for Domestic Treatment Plant (RO-UV)

The domestic RO-UV treatment was the most advanced, complex, expensive, and sophisticated method used by some households. The averaged initial cost was NRs 30,000 (NRs 25,000–37,000) with an average life of seven years (5–10 years) and the averaged operation time was 60 min per day with 71 W (60 W for RO and 11 W for UV), which costed NRs 25.6 per month. The yearly maintenance cost for changing the filtration unit was NRs 5000 per year. The average cost of domestic RO-UV treatment was NRs 799 per month.

3.2. Estimation of Average Monthly Treatment Cost in Households

According to the questionnaire survey, 75% of households practiced at least one water treatment method before drinking, and the ceramic filter (64%) and boiling (60%) were the most common methods (Table 2). A considerable portion of households (13%) used the Euro-Guard, while ratios of those using chemicals and domestic RO-UV treatment was less than 4%. Approximately 25% of households do not practice any treatment. Average number of treatment methods used in a household were 1.4 for all households and it was 1.9 for households practicing at least one method.
The average monthly household water treatment cost was NRs 380 (±393) among the all surveyed households and NRs 503 (±378) among households practicing any of the treatment methods (Table 2). These water treatment costs were comparable with the averaged total water expenditure, which included the cost of buying piped, bottle/jar and tanker/vendor water for the household (NRs 496).

3.3. Socioeconomic Situation and Water Insecurity Perception in Surveyed Households

Table 3 shows the distribution of households’ socioeconomic status and water insecurity perception. Most respondents (82%) were from the Kathmandu, 12% Lalitpur and 6% Bhaktapur districts. Ethnicity showing social stratification, was highest from Brahmin/Chhetri (43%) followed by Newar (37%), and the lowest from Dalit (2.7%). Most families had primary and secondary school education levels (41%) followed by university level (26%), and the fewest were illiterate (3%). Kathmandu Valley became the center of attraction for higher education and a better earning place for many local residents and newcomers. The major occupation categories of the household’s head were business (42%) and service (27%) categories, which were the highest earning occupations.
Water insecurity index denotes the insecurity perception of respondents, derived from water insecurity statements related to access, adequacy, safety, and lifestyle. Each statement was scored on a scale of 1–6, and the scores were summed for each household and categorized into high, medium, and low insecurity indices. The total score ranged 15–62 (higher value, more insecurity), which should have been 15–90, indicating that the perception of water insecurity was not very bad. Table 3 also shows that the majority of households (42%) perceived low insecurity (<30 score), but 26% felt the highest insecurity (>45 score), and 32% felt medium insecurity (30–45 score).

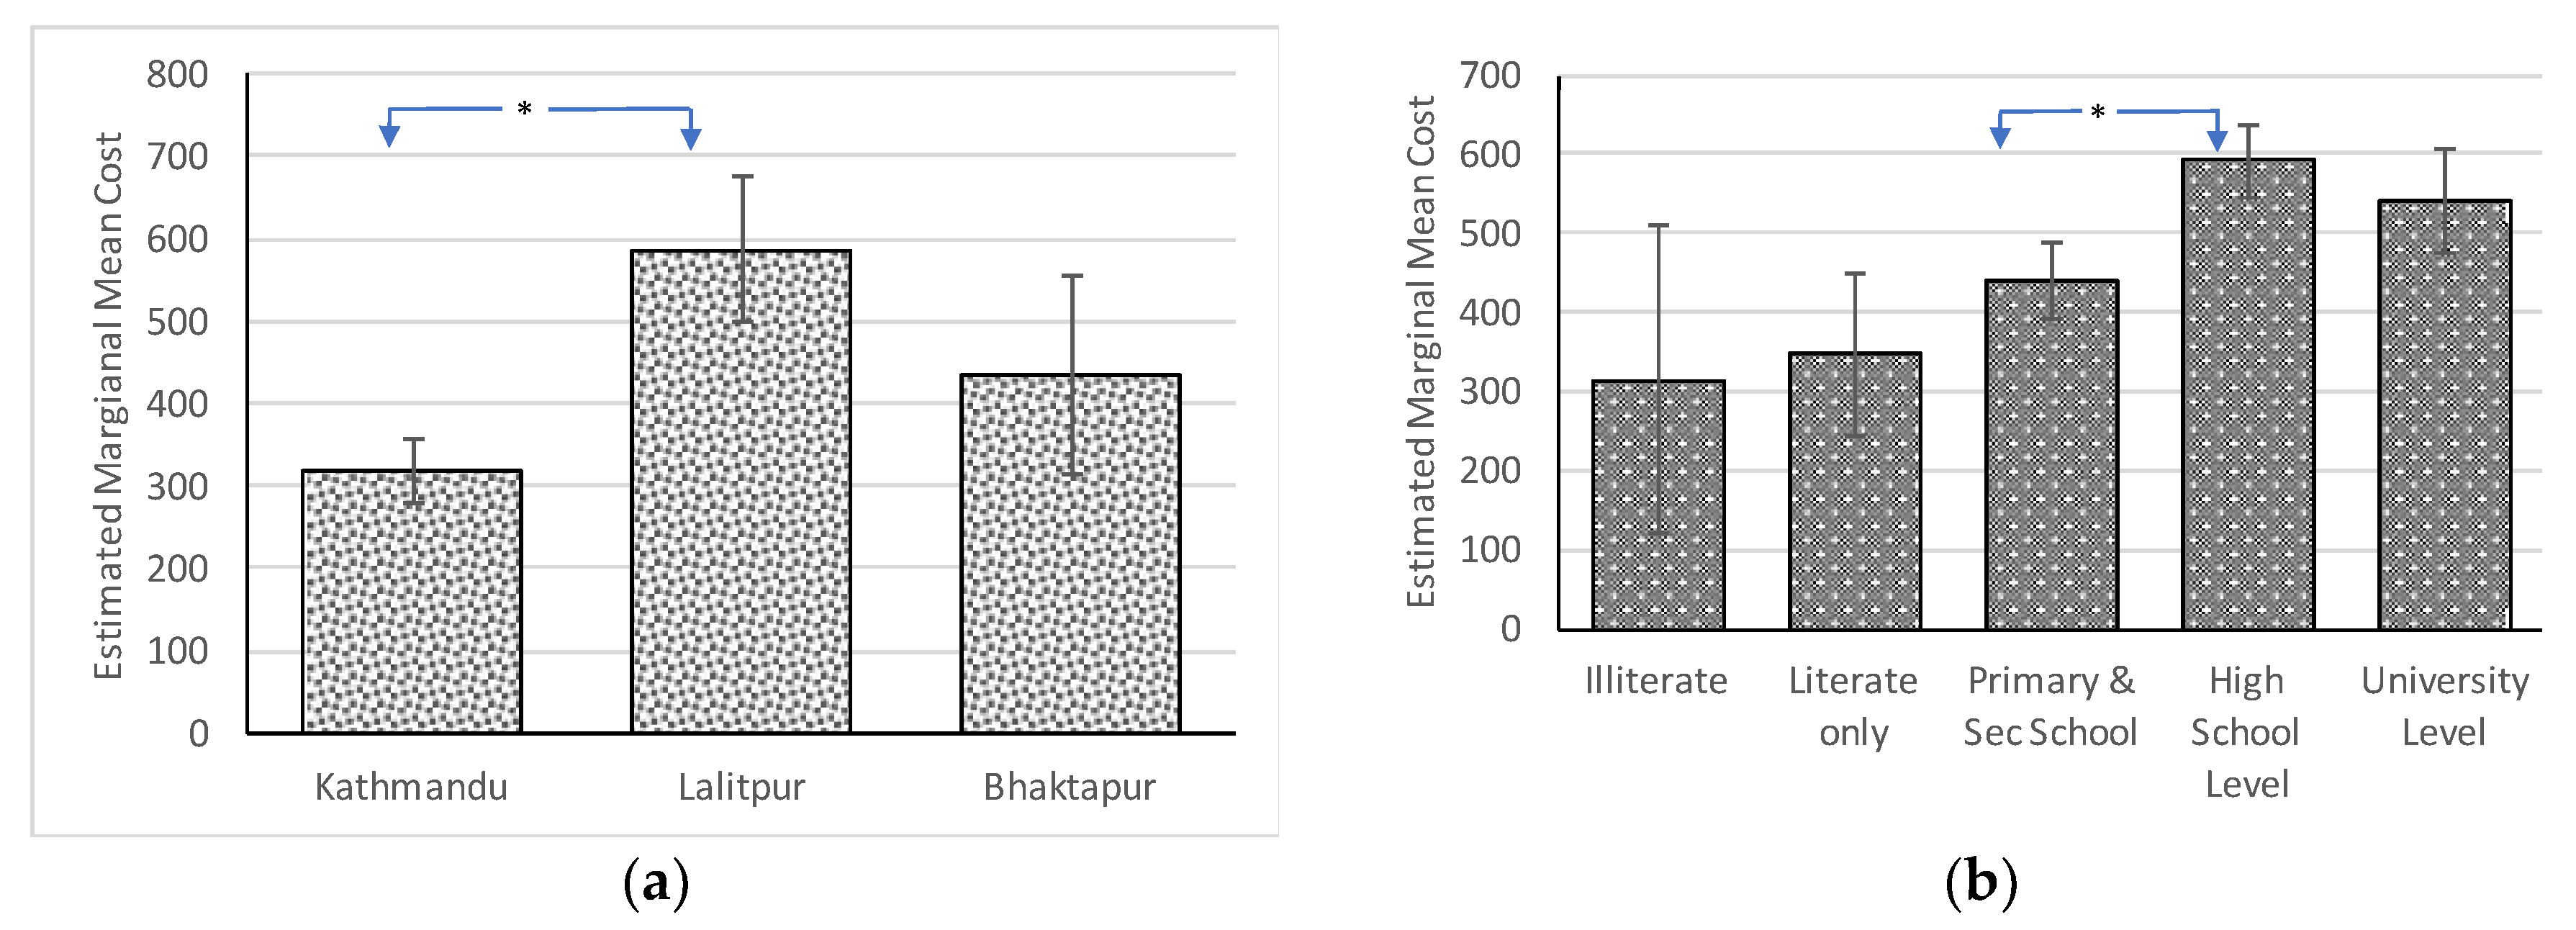
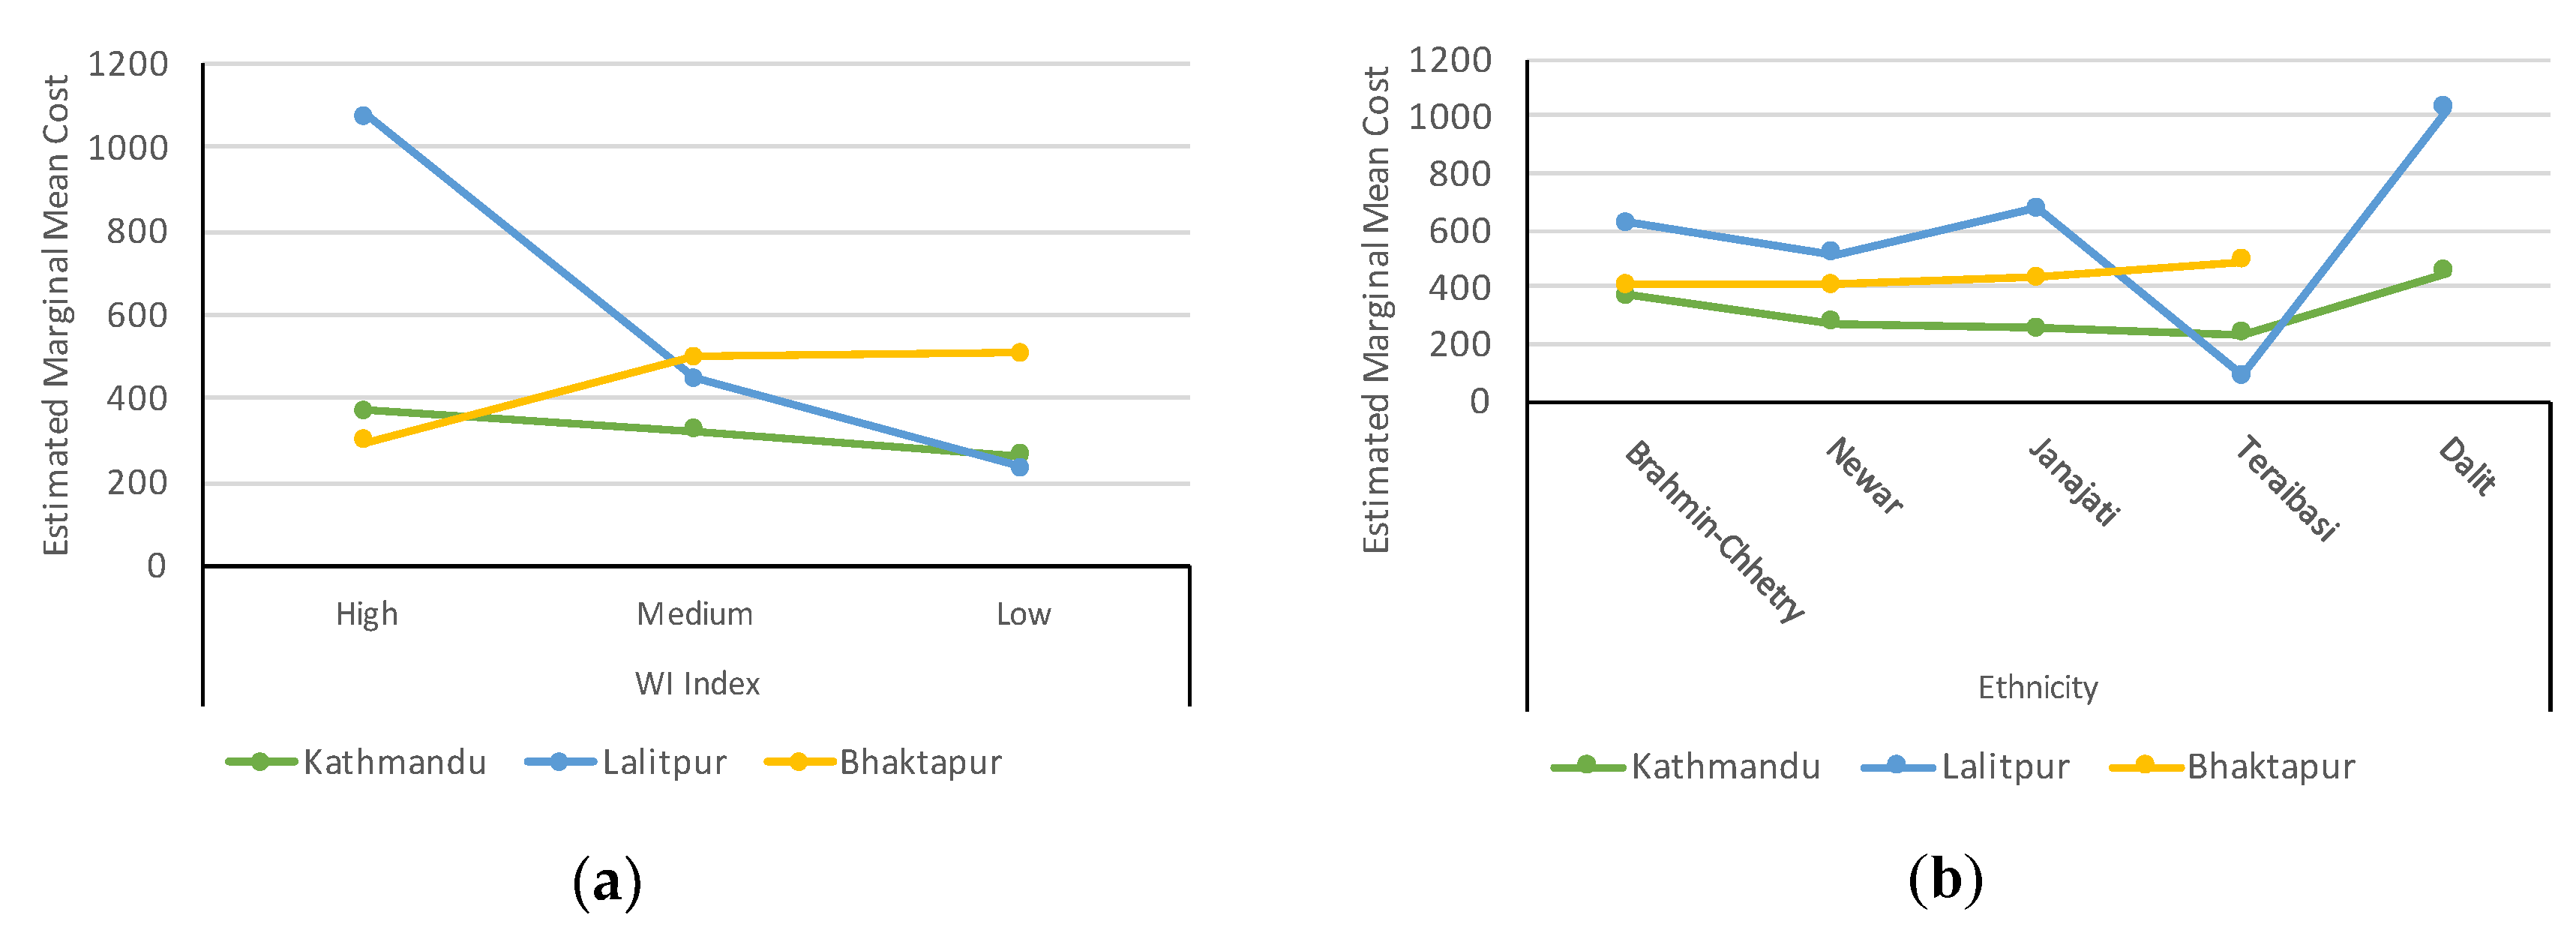
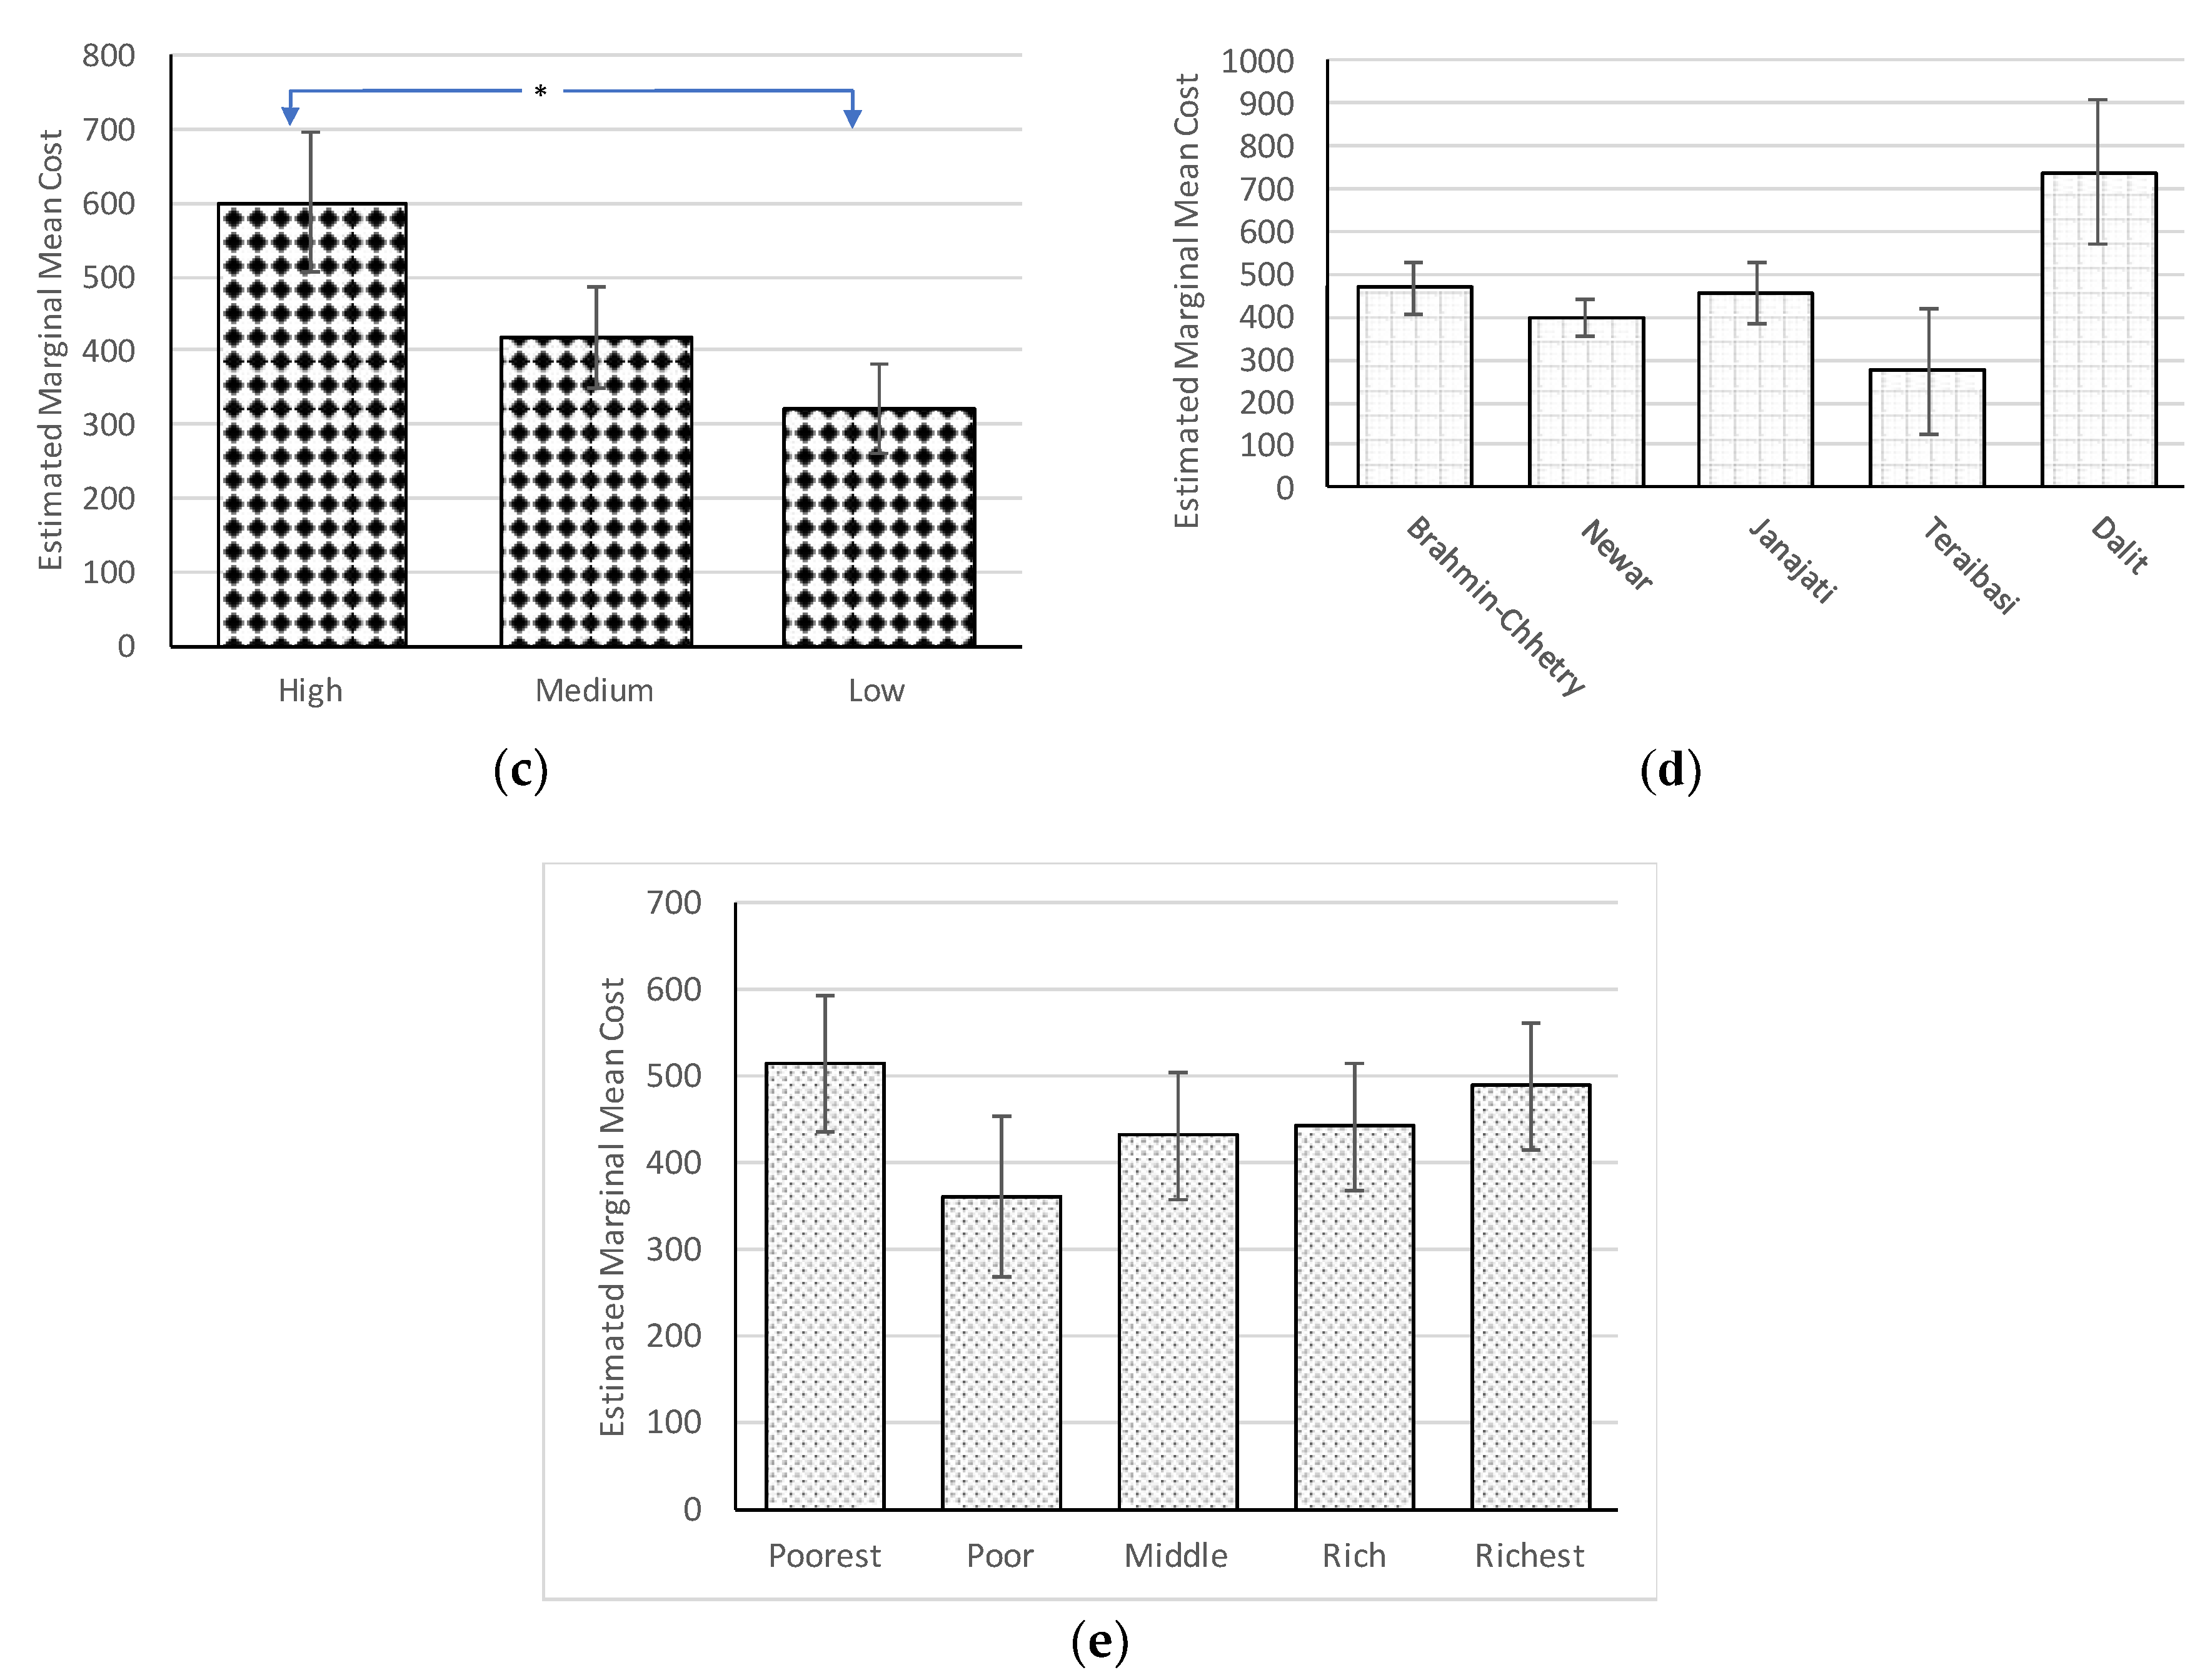
3.4. Association of Water Treatment Cost with Socioeconomic Variables

The relation of household water treatment cost with socioeconomic variables was analyzed by a fixed effects model. We took main effects and two-way interactions into consideration. We found that district, education, and water insecurity index, and the interactions of district × ethnicity, and district × water insecurity index were significantly associated with water treatment cost at the 95% confidence level (p < 0.05; Table 4). The estimates of these fixed effects are shown in Table S2.
Figure 2 shows the comparison of estimated marginal mean (modified population marginal mean). Monthly water treatment cost was found to be significantly higher in the Lalitpur district (NRs 586) compared to the Kathmandu district (NRs 318; Figure 2a). Figure 2b shows that water treatment cost tends to increase with education level, and households with at least a high school education (NRs 591) spent significantly more than those with just primary and secondary school levels (NRs 440). The water insecurity index also had a significant association with treatment cost: more insecurity perception caused more treatment cost. This was especially true in the Lalitpur district (Figure 3a). Ethnicity did not show a significant main effect on water treatment cost, but Dalit ethnicity (NRs 739) tended to show higher cost than the remaining ethnicities (Figure 2d). Figure 3b shows the marginal mean of interaction between district and ethnicity, and the pattern of ethnicity effects was different between Lalitpur and other districts. Although the highest cost was incurred by Dalit in Lalitpur, this result was largely uncertain because there were only four Dalit families among our surveyed households. The association of expenditure for water treatment among wealth quintile groups was not significant, which indicated that all groups spent nearly the same. This showed a serious concern for the poorest group, which had more economic burden.

3.5. Situation of Water Treatment Cost in Alternative Sources Users

The questionnaire survey showed that the major drinking water source was jar/bottled water and piped water, which were used in 63% and 39% of households, respectively. The quality of ground water and Tanker/Vendor water sources were found contaminated and considered as poor sources for drinking. However, 7.8% of the surveyed households (6.5% in Kathmandu, 21% in Lalitpur, and 0% in Bhaktapur) were still using these sources for drinking purposes. The water treatment cost was also higher among users in Kathmandu (NRs 488 ± 356) and Lalitpur (NRs 1225 ± 688) than among non-users (NRs 358 ± 372 and NRs 234 ± 314, respectively; Table 5). Among users, the Lalitpur district spent more than double for water treatment than the Kathmandu district.

4. Discussion

In the urban areas of the Kathmandu Valley, the quantity and quality of water had been low for many years and households must use treatment methods to improve the quality of drinking water. Application of a household level treatment method incurred cost, but how much was unknown. Researchers could not determine an established method to measure the method-specific cost. Therefore, we attempted to estimate such cost expended at the household level. We found the monthly method-specific cost to treat 9 L water per day ranged from NRs 23 to NRs 799, with a wide range based on simple (chemical treatment) method versus advanced (RO-UV) methods. These estimates, however, also may be uncertain. The estimation of initial and maintenance costs of boiling and ceramic filter methods was based on the information provided by the memory of the heads of few households, which may have some recall bias. We tried to minimize such variation by verifying and modifying data with local vendors, but the estimation can be improved by maximizing sample size. The cost of Euro-Guard and RO-UV methods was higher and divergent from the households, thus, we collected data from vendors. However, the data provided by the vendors were based on the current popular equipment model, which may vary from the data of older models. Household drinking water consumption and treatment cost varies depending on number of family members and per capita consumption. However, the calculation was based on the average per family drinking water consumption (9 L per day), because per capita drinking water consumption data for some household has larger uncertainty. The result of the average cost for all households will not vary much from the estimate based on the number of family members and per capita consumption of each household, because the average per family drinking water use was estimated based on these data. The estimates of the cost in each socioeconomic group (district, ethnicity group, etc.), however, may deviate due to a different number of family and different per capita consumption in each group. The result showed some deviation: higher family size found in Bhaktapur district (26% higher than average) and highest water insecurity group (21%), but lower in illiterate education (18%). Similarly, the per capita consumption is high in the Dalit ethnicity (57%), but low in the Bhaktapur district (33%), illiterate education (15%) and the richest quintile (13%) (data not shown). A large discrepancy of per capita consumption in Dalit ethnicity may be caused by small sample size and large uncertainty of data, as mentioned earlier.
According to our questionnaire survey, 75% of households used single to multiple water treatment methods to purify their drinking water in the urban areas of the Kathmandu Valley. However, Rosa and Clasen (2010) also showed that 15.4% (Urban, 42%; and Rural, 10%) of the households in Nepal treated their water before drinking [29]. In a recent report of demographic and health survey of Nepal (2016), water treatment was practiced in only 30% of urban households and overall 23% of households practiced at a national level [30]. These results showed that in-house water treatment is much more popular in urban areas in the Kathmandu valley compared to other areas in Nepal and households in the Kathmandu valley spending more money for treatment. Monthly household water treatment expenditure estimated from method-specific cost and treatment practice data obtained by our questionnaire survey was approximately NRs 400, which was considered relatively high compared to that for buying water (NRs 496) and considering the average income of a Nepali family (NRs 30,000) [31]. Pattanayak et al. (2005) reported that the additional cost for water coping (including water treatment) was twice as much as the current water utility bill of households in the Kathmandu Valley [13], although their estimate of treatment costs is much lower than ours. The major reason for high water treatment cost in the Kathmandu Valley was the application of water treatment in a higher proportion of households, using multiple treatment methods. The increased use of multiple methods or expensive methods, such as RO-UV, was related to the desire for safer drinking water due to the high insecurity perception.
Social, economic, and cultural settings influenced greatly the preference, choice, decision, and practice of water treatment in households. Irianti et al. (2016), in Indonesia, highlighted the higher socioeconomic status of households using improved sources of water [32]. In this study, the fixed effect model analysis found that district, education, and water insecurity index were the significant predictors of water treatment cost in the urban areas of the Kathmandu Valley.
Households among the districts used different sources of drinking water and had different insecurity perceptions which leads to the application of water treatment methods. Shrestha et al. (2017) found that water distribution, consumption, quality, and risk perception varied by geographical locations within the Kathmandu Valley [33]. In our study, the average cost of water treatment varies among the districts, and was highest in Lalitpur and lowest in Kathmandu (Figure 2a). The high average cost in the Lalitpur district was due to greater use of alternative sources of drinking water, especially ground water and tanker/vendor water. Table 5 shows that those households who used alternate water sources for drinking spent much more for water treatment than those who did not use water from these sources, and approximately 21% of households surveyed in Lalitpur district used such water sources for drinking, a higher ratio than in other districts. However, Table 5 shows much higher cost for users of alternative water sources in Lalitpur than for those in the Kathmandu district, the reason for which remains unclear, but possibly might be due to the lower quality of alternative water in Lalitpur. Alternative sources of drinking water and water insecurity perception were strongly correlated in Lalitpur (Figure 4a): ratio of households with high water insecurity index was significantly larger for alternative water sources users than for the non-users (p < 0.001). Higher insecurity perception by users of alternative sources of water in Lalitpur was associated with increased cost of water treatment using multiple or expensive methods, such as Euro-Guard and domestic RO-UV treatments. However, in the Kathmandu district, the high insecurity perception was rather seen among the non-users (Figure 4b). The water insecurity index is based on 15 statements related to accessibility, adequacy, safety, and lifestyle (inconvenience), as shown in Table S1, and dominant factors of perceived water insecurity might be different between these districts.
Higher-educated households more often practiced water treatment and spent more than those with lower education. The better-educated people recognized the possible harm of contaminated water, were more health conscious, and had a better economic position. Some studies [34,35] reported that education creates more awareness and concern with water quality and purification practices. Better education helps to know the advantages of household water treatment, which helps to improve the household water quality [36]. The WHO also stressed that households that depend on unimproved water sources as well as unsafe and unreliable piped water supplies should perform household water treatment. In-house water treatment can lead to dramatic improvements in drinking water quality and protection from waterborne diseases [37]. Hence, as an immediate action, an awareness campaign should be conducted on the benefits of water treatment, especially for illiterate and lower education status households.
Water is a social commodity necessary for different domains of social life and vital to all [38]. The use of water sources [39] and application of treatment are influenced by social status. Farzin and Grogan (2013) also highlighted the relations among education, income and ethnicity in which they explained that rich people with a strong preference for good quality of water move to more expensive areas with better water quality than poor people, who tend to move to more polluted, but less expensive areas [35]. In this study, however, the expenditure for water treatment was not associated significantly with the wealth quintile and the poorest group tended to spend more for the treatment, which clearly indicated that the poorest quintile group copes with a greater water treatment expenditure compared to their income than the richest quintile. This is a form of social inequality. Similarly, the Dalit ethnicity belongs to the lowest social group, who had the highest expenditure for water treatment (not significant). Water treatment at household level adds the treatment responsibility and financial burden. However, in 2012, Lantagne and Clasen highlighted the water treatment responsibility at the centralized level, rather than the household level [19]. Therefore, water treatment at the household level should be averted or minimized from the equity perspective. Thus, the Nepalese government urgently needs to take action to ensure the supply of adequate quantity, quality, and access to drinking water in a sustainable manner.

5. Conclusion

In the urban areas of the Kathmandu Valley, the practice of in-house water treatment was relatively high as compared to that in rural areas and urban areas outside the valley due to water scarcity and risk perception. Household water treatment cost was unknown and we attempted to estimate the expenditure based on the practiced popular method. Our results showed that water treatment expenditure per households was NRs 380, which was relatively high in Nepalese context compared to the cost of buying water and considering monthly income. The higher water treatment cost was associated with geographical location, education, and water insecurity index. The high in-house water treatment cost was due to the use of alternative sources of water for drinking. Multiple water treatment methods were practiced due to a high perceived risk and insecurity situation. The wealth quintile was not significantly associated with the household water treatment cost, and the poorest quintile spent as much as the richest quintile. This shows that a serious inequality exists in water treatment expenditure, which is a real but hidden expenditure drained from the households. This gap in water treatment expenditure should be addressed urgently by concerned authorities (governmental or local level) by managing adequate quantity, quality, and access to drinking water for all.

Supplementary Materials

The following are available online at https://www.mdpi.com/2073-4441/10/5/607/s1.

Author contributions

K.B.S. and J.S. conceived this research theme; J.S., F.K., S.S., Y.A. and K.B.S. designed the survey and prepared questionnaire; A.P.B. and N.B. implemented the questionnaire survey and entered data; K.B.S. and J.S. performed the statistical analysis; K.B.S. prepared manuscript; and J.S., F.K., B.R.T., Y.A., and S.S. developed the concept and revised the manuscript.

Funding

This research received no external funding.

Acknowledgments

We appreciate questionnaire respondents and interviewees for their cooperation and Milan Awale and Pragya Awale in Chyasal for their support during interviews. We would like to thank Anil Aryal for support in making an ArcGIS map and Niva Sthapit for language editing. This study was supported by the Science and Technology Research Partnership for Sustainable Development (SATREPS) program of JICA and JST, titled “Hydro-microbiological Approach for Water Security in Kathmandu Valley, Nepal”.

Conflicts of Interest

The authors declare no conflict of interests.

References

  1. Hutton, G. Global costs and benefits of reaching universal coverage of sanitation and drinking-water supply. J. Water Health 2013, 11, 1–12. [Google Scholar] [CrossRef] [PubMed]
  2. United Nations. The Human Right to Water and Sanitation. Available online: http://www.un.org/waterforlifedecade/human_right_to_water.shtml (accessed on 29 December 2017).
  3. The World Bank Water Overview. Available online: http://www.worldbank.org/en/topic/water/overview (accessed on 28 December 2017).
  4. Brighty, P. Water Security in South Asia: Geo Factsheet. Available online: https://intranet.royalhospitalschool.org/resource.aspx?id=672068 (accessed on 9 March 2018).
  5. MoUD Government of Nepal. National Urban Water Supply and Sanitation Sector Policy Final Draft; MoUD Government of Nepal: Kathmandu, Nepal, 2009.
  6. Thapa, B.R.; Ishidaira, H.; Pandey, V.P.; Shakya, N.M. A multi-model approach for analyzing water balance dynamics in Kathmandu Valley, Nepal. J. Hydrol. Reg. Stud. 2017, 9, 149–162. [Google Scholar] [CrossRef]
  7. Yoden, K. Kathmandu Valley Water Distribution, Sewerage and Urban Development; ADB: Kathmandu, Nepal, 2010. [Google Scholar]
  8. Pant, B.R. Ground water quality in the Kathmandu valley of Nepal. Environ. Monit. Assess. 2011, 178, 477–485. [Google Scholar] [CrossRef] [PubMed]
  9. Tamrakar, N.K.; Manandhar, K.C. Institutional Capacity Assessment of KUKL; Ministry of Urban Development (MoUD): Kathmandu, Nepal; Japan International Cooperation Agency (JICA): Tokyo, Japan, 2016.
  10. Thapa, B.R.; Ishidaira, H.; Pandey, V.P.; Bhandari, T.M.; Shakya, N.M. Evaluation of Water Security in Kathmandu Valley before and after Water Transfer from another Basin. Water 2018, 10, 24. [Google Scholar] [CrossRef]
  11. MWSP Melamchi Water Supply Project Description. Available online: http://www.melamchiwater.gov.np/about-us/melamchi-ws-project/project-description/ (accessed on 4 February 2018).
  12. Thapa, P. Delay in Melamchi Water Supply Project in Nepal: An Analysis of the Decision Making Process since 1998 under Application of Teisman’s Rounds Model. 2012. Available online: https://www.scribd.com/document/106089175/Delay-in-Melamchi-Project-in-Nepal (accessed on 5 May 2018).
  13. Pattanayak, S.K.; Yang, J.-C.C.; Whittington, D.; Bal Kumar, K.C. Coping with unreliable public water supplies: Averting expenditures by households in Kathmandu, Nepal. Water Resour. Res. 2005, 41, 1–11. [Google Scholar] [CrossRef]
  14. Warner, N.R.; Levy, J.; Harpp, K.; Farruggia, F. Drinking water quality in Nepal’s Kathmandu Valley: A survey and assessment of selected controlling site characteristics. Hydrogeol. J. 2008, 16, 321–334. [Google Scholar] [CrossRef]
  15. Subedi, M.; Aryal, M. Public perception about drinking jar water and its bacteriological analysis. Nepal Med. Coll. J. 2010, 12, 110–114. [Google Scholar] [PubMed]
  16. WHO. UNICEF Diarrhoea: Why Children Are Still Dying and What Can Be Done; WHO: Geneva, Switzerland, 2009. [Google Scholar]
  17. PATH. Perspectives: Commercial Approaches to Delivering Household Water Treatment and Safe Storage Products and Solutions to Low-Income Households; PATH: Seattle, WA, USA, 2012. [Google Scholar]
  18. Shrestha, S.; Aihara, Y.; Kondo, N.; Rajbhandari, S.; Bhattarai, A.P.; Bista, N.; Kazama, F.; Nishida, K.; Timilsina, H.P.; Shindo, J. Household Water Use in the Kathmandu Valley: A Dry Season Survey; Interdisciplinary Center for River Basin Environment: Kofu Yamanashi, Japan, 2016. [Google Scholar]
  19. Lantagne, D.S.; Clasen, T.F. Use of household water treatment and safe storage methods in acute emergency response: Case study results from Nepal, Indonesia, Kenya, and Haiti. Environ. Sci. Technol. 2012, 46, 11352–11360. [Google Scholar] [CrossRef] [PubMed]
  20. Rojas, L.F.R.; Megerle, A.; Araral, E. Perception of Water Quality and Health Risks in the Rural Area of Medellín. Am. J. Rural Dev. 2010, 12, 106–115. [Google Scholar]
  21. McGarvey, S.T.; Buszin, J.; Reed, H.; Smith, D.C.; Rahman, Z.; Andrzejewski, C.; Awusabo-Asare, K.; White, M.J. Community and household determinants of water quality in coastal Ghana. J. Water Health 2008, 6, 339–349. [Google Scholar] [CrossRef] [PubMed]
  22. ICIMOD. Kathmandu Valley Environment Outlook; International Centre for Integrated Mountain Development: Kathmandu, Nepal, 2007. [Google Scholar]
  23. Adhikari, A. Towards Developing Indicators of Environmental Sustainability for Kathmandu, Nepal. Int. J. Humanit. Soc. Sci. 2012, 2, 192–196. [Google Scholar]
  24. Gohil, P.P.; Channiwala, S.A. Experimental Investigation of Performance of Conventional Lpg Cooking Stove. Fundam. J. Therm. Sci. Eng. 2011, 1, 25–34. [Google Scholar]
  25. Waters, T.; Waters, D. Are the terms “socio-economic status” and “class status” a warped form of reasoning for Max Weber? Palgrave Commun. 2016, 2, 16002. [Google Scholar] [CrossRef]
  26. Vyas, S.; Kumaranayake, L. Constructing socio-economic status indices: How to use principal components analysis. Health Policy Plan. 2006, 21, 459–468. [Google Scholar] [CrossRef] [PubMed]
  27. Allison, P.D. Fixed Effects Regression Models (Quantitative Applications in the Social Sciences), 1st ed.; Sage Publications Inc.: Thousand Oaks, CA, USA, 2009. [Google Scholar]
  28. Armstrong, R.A. When to use the Bonferroni correction. Ophthalmic Physiol. Opt. 2014, 34, 502–508. [Google Scholar] [CrossRef] [PubMed]
  29. Rosa, G.; Clasen, T. Estimating the scope of household water treatment in low- and medium-income countries. Am. J. Trop. Med. Hyg. 2010, 82, 289–300. [Google Scholar] [CrossRef] [PubMed]
  30. Ministry of Health Ramshah Path; New ERA; ICF DHS Program. Nepal Demographic and Health Survey 2016; Ministry of Health Ramshah Path: Kathmandu, Nepal; New ERA: Kathmandu, Nepal; The DHS Program ICF: Rockville, MD, USA, 2017; pp. 9–10. Available online: https://www.dhsprogram.com/pubs/pdf/fr336/fr336.pdf (accessed on 5 May 2018).
  31. Nepal Rastra Bank. Fifth Household Budget Survey Nepal 2014/15; Nepal Rastra Bank: Kathmandu, Nepal, 2016. [Google Scholar]
  32. Irianti, S.; Prasetyoputra, P.; Sasimartoyo, T.P. Determinants of household drinking-water source in Indonesia: An analysis of the 2007 Indonesian family life survey. Cogent Med. 2016, 3, 1–13. [Google Scholar] [CrossRef]
  33. Shrestha, S.; Aihara, Y.; Bhattarai, A.P.; Bista, N.; Rajbhandari, S.; Kondo, N.; Kazama, F.; Nishida, K.; Shindo, J. Dynamics of Domestic Water Consumption in the Urban Area of the Kathmandu Valley: Situation Analysis Pre and Post 2015 Gorkha Earthquake. Water 2017, 9, 222. [Google Scholar] [CrossRef]
  34. McLennan, J.D. To boil or not: Drinking water for children in a periurban barrio. Soc. Sci. Med. 2000, 51, 1211–1220. [Google Scholar] [CrossRef]
  35. Farzin, Y.H.; Grogan, K.A. Socioeconomic factors and water quality in California. Environ. Econ. Policy Stud. 2013, 15, 1–37. [Google Scholar] [CrossRef]
  36. Clasen, T.F. Household Water Treatment and the Millennium Development Goals: Keeping the Focus on Health. Environ. Sci. Technol. 2010, 44, 7357–7360. [Google Scholar] [CrossRef] [PubMed]
  37. Clasen, T.F.; Cairncross, S. Household water management: Refining the dominant paradigm. Trop. Med. Int. Health 2004, 9, 187–191. [Google Scholar] [CrossRef] [PubMed]
  38. Whiteford, L.M.; Vindrola-Padros, C. Water, Health and Social Inequality. In International Encyclopedia of the Social & Behavioral Sciences; Elsevier Ltd.: New York, NY, USA, 2015; Volume 25, pp. 428–436. ISBN 9780080970875. [Google Scholar]
  39. Johns, H. Stigmatization of Dalits in Access to Water and Sanitation in India; National Campaign on Dalit Human Rights (NCDHR): New Delhi, India, 2012. [Google Scholar]
Figure 1. Locations of interviews and distributions of selected 50 clusters for questionnaire survey in Kathmandu Valley.
Water 10 00607 g001
Figure 2. Comparison of estimated marginal mean cost of water treatment with socioeconomic variables: (a) districts; (b) education level; (c) water insecurity index; (d) ethnicity; and (e) wealth quintile. The error bar represents the standard error. Asterisk (*) indicates significant at 95% confidence level.
Water 10 00607 g002aWater 10 00607 g002b
Figure 3. Comparison of estimated marginal mean cost of water treatment with two-way interactions with socioeconomic variables: (a) District × Water Insecurity Index; and (b) District × Ethnicity.
Water 10 00607 g003
Figure 4. Proportion of households with each water insecurity index in users and non-users of alternate sources of drinking water in: (a) Lalitpur district; and (b) Kathmandu district.
Water 10 00607 g004
Table 1. Estimation of method-specific monthly cost of drinking water treatment.
SNMethodInitial CostOperating CostMaintenance CostTotal CostSummary Base Data for Cost Calculation
1Chemical0.022.50.022.5Operating cost:
Cost for chlorine (Piyush) = NRs 25/60 mL bottle (used for 300 L of water)
2Ceramic Filter13.30.043.456.7Initial cost:
Filter = NRs 800; Average Life = 5 years (2–8).
Maintenance cost:
Candles (2) = NRs 260 × 2 times (change 3–12 months).
3Boiling (Gas)7.5283.0450.0340.5Initial cost:
Gas stove = NRs 1500; Average Life = 5 years; 30% used for boiling.
Operating cost:
Thermal efficiency = 0.66; Unit Cost for gas = 0.008648 NRs/kcal
Maintenance cost:
Boiling pot = NRs 600; Average life = 1 year.
Boiling (Electricity)16.7354.4140.0511.1Initial cost:
Electric heater = NRs 200; Average Life = 1 year.
Operating cost:
Thermal efficiency = 0.85
Unit Cost for electricity = 12 NRs/kWh
Maintenance cost:
Heater coil = NRs 90 (1 coil per month), Boiling pot = NRs 600 for 1 year.
4Euro-Guard333.32502.7586.0Initial cost:
Euro-Guard = NRs 20,000; Average Life = 5 years;
Operating cost:
Wattage = 28 W, Average operation time = 16 min/day, Unit Cost for electricity = NRs 12/kWh
Maintenance cost:
Filter = NRs 1000 per year; Lamp + technician = NRs 4000 per 2 years.
5Domestic Treatment Plant (RO-UV)357.125.6416.6799.3Initial cost:
Treatment plant = NRs 30,000; Average Life = 7 years
Operating cost:
Wattage 60 W for RO and 11 W for UV,
Average operation time = 60 min/day, Unit Cost for electricity = NRs 12/kWh
Maintenance cost:
Filter + technician = NRs 5000 per year.
Table 2. Estimated monthly average cost for water treatment (n = 1496).
Water Treatment MethodFrequencyPercentage of HHMethod-Specific Cost (NRs)Total Monthly Cost (NRs) #
Chemicals (Chlorine)593.922.51327.5
Ceramic filter95663.956.754,173.3
Boiling89359.7391.7349,788.1
Euro-Guard19713.2586.0115,442.0
Domestic RO-UV treatment 493.3799.439,170.6
No treatment36624.50.00.0
Per household cost (All HH) 379.7 (393.1)
Per household cost (Treatment method applied HH only) 502.8 (377.8)
Average water expenditure(Piped water, Bottle/Jar, Tanker/Vendor water)496.0 (909.4)
# Values in parentheses are standard deviation (sd).
Table 3. Social and economic situation and water insecurity perception.
VariablesCategoriesFrequencyPercentage
District (n = 1495)Kathmandu122882.1
Lalitpur17811.9
Bhaktapur896.0
Ethnicity (n = 1495)Brahmin/Chhetri64042.8
Newar55136.9
Janajati20013.4
Teraibasi634.2
Dalit412.7
Higher Education (n = 1483)Illiterate453.0
Literate only1047.0
Primary and Secondary School60040.5
High school (+2 level)34823.5
University Level38626.0
Occupation of HH head (n = 1475)Unemployed24816.8
Daily employed1057.1
Students1026.9
Business62342.2
Service39726.9
Wealth Quintile (n = 1495)Poorest29920.0
Poor30820.6
Middle29519.7
Rich28919.3
Richest30420.3
Water Insecurity Index (n = 1493)High (>45)38926.1
Medium (30–45)47731.9
Low (<30)62742.0
Table 4. Result of Type III test of Fixed Effects.
ParameterNumerator DfDenominator DfF (Statistics)p Value
Intercept1136657.580.00
DISTRICT213666.040.00
Ethnicity413661.680.15
EduHigher413662.930.02
WQuin413660.560.69
WIIndex213663.670.03
DISTRICT × Ethnicity713662.280.03
DISTRICT × EduHigher813661.100.36
DISTRICT × WQuin813661.530.14
DISTRICT × WIIndex4136616.380.00
Ethnicity × EduHigher1613660.870.61
Ethnicity × WQuin1613660.880.59
Ethnicity × WIIndex813661.180.31
EduHigher × WQuin1613661.090.36
EduHigher × WIIndex813661.500.15
WQuin × WIIndex813661.510.15
Df indicates degree of freedom.
Table 5. District-wise use of alternate sources of drinking water and average treatment cost.
Water SourcesKathmandu (n = 1228)Lalitpur (n = 178)
UserNon-User User Non-User
HH (%)ATC (sd)HH (%)ATC (sd)HH (%)ATC (sd)HH (%)ATC (sd)
Ground water20 (1.6)489.4 (286.9)1208 (98.4)364.1 (373.2)13 (7.3)1340.3 (670.2)165 (92.7)368.8 (511.2)
Tanker/ Vendor60 (4.9)488.3 (378.6)1168 (95.1)359.9 (370.9)34 (19.1)1288.7 (669.5)144 (80.9)239.3 (319.0)
Ground or Tanker water 80 (6.5)488.6 (356.2)1148 (93.5)357.6 (371.9)37 (20.8)1224.9 (687.9)141 (79.2)233.8 (314.0)
ATC = Average Treatment Cost, sd = standard deviation.

