Risk Analysis for Reservoir Real-Time Optimal Operation Using the Scenario Tree-Based Stochastic Optimization Method

1
College of Hydrology and Water Resources, Hohai University, No.1 Xikang Road, Nanjing 210098, China
2
State Key Laboratory of Hydrology Water Resources and Hydraulic Engineering, Hohai University, No.1 Xikang Road, Nanjing 210098, China
3
School of Earth Sciences and Engineering, Hohai University, No.1 Xikang Road, Nanjing 210098, China
4
Department of Civil and Environmental Engineering, University of California, Los Angeles, CA 90095, USA
*
Author to whom correspondence should be addressed.
Water 2018, 10(5), 606; https://doi.org/10.3390/w10050606
Submission received: 23 March 2018
/
Revised: 26 April 2018
/
Accepted: 4 May 2018
/
Published: 6 May 2018
(This article belongs to the Section Water Resources Management, Policy and Governance)
Abstract
:The inherent uncertainty of inflow forecasts hinders the reservoir real-time optimal operation. This paper proposes a risk analysis model for reservoir real-time optimal operation using the scenario tree-based stochastic optimization method. We quantify the probability distribution of inflow forecast uncertainty by developing the relationship between two forecast accuracy metrics and the standard deviation of relative forecast error. An inflow scenario tree is generated via Monte Carlo simulation to represent the uncertain inflow forecasts. We establish a scenario tree-based stochastic optimization model to explicitly incorporate inflow forecast uncertainty into the stochastic optimization process. We develop a risk analysis model based on the principle of maximum entropy (POME) to evaluate the uncertainty propagation process from flood forecasts to optimal operation. We apply the proposed methodology to a flood control system in the Daduhe River Basin, China. In addition, numerical experiments are carried out to investigate the effect of two different forecast accuracy metrics and different forecast accuracy levels on reservoir optimal flood control operation as well as risk analysis. The results indicate that the proposed methods can provide decision-makers with valuable risk information for guiding reservoir real-time optimal operation and enable risk-informed decisions to be made with higher reliabilities.
1. Introduction
Flooding in a river system is one of the most damaging natural disasters that humanity faces. Floods have enormous destructive strength, and usually cause serious consequences in terms of economic loss and human fatalities [1,2]. In order to prevent floods, many river basins have built dams and reservoirs to store and control flood water. Reservoir flood control operation, a typical combination of engineering and non-engineering measures, plays an important role in the flood management of river basins [3].
Traditionally, reservoir flood control operation is limited to deterministic environments, where reservoir release decisions are implemented without consideration of uncertainties [4,5,6]. Hence, no risk information is provided to decision-makers, which usually causes a false impression of certainty. However, plenty of uncertainties exist in the reservoir flood control operation [7,8]. For example, in reservoir flood routing, there are uncertainties in the reservoir storage capacity curve and discharge curve. In the collection of hydrologic observation data, uncertainties include information unavailability, poor communication, and insufficient measure range [9,10]. The delay time of operation is also a potential uncertainty source. Furthermore, reservoir inflow forecasts are inherently uncertain due to the uncertainties of hydrologic observations, forecast model structure and parameter estimation, imperfect initial and boundary conditions, and the necessary simplification of physical processes [11,12,13,14,15]. Among all of the above uncertainties, it has been proved that inflow forecast uncertainty is the primary uncertainty source [16], which leads to challenges for reservoir flood control operation because a reservoir release decision is determined on the basis of forecasted inflows. Information on uncertainty does not make decision-making easier, but ignoring it neglects reality. Therefore, it is very important to trace the source of uncertainties and assess the uncertainty propagation process from flood forecast to reservoir operation.
Over the past two decades, risk analysis of reservoir flood control operation has been of considerable interest to the reservoir operation community [17,18,19,20,21]. A multitude of risk analysis methods have been published in the literature. Jiang developed a risk analysis method for reservoir flood releases using the stochastic differential equation of reservoir flood routing, in which the risk is calculated by a Fokker–Planck equation [22]. Yan et al. estimated flood control risks by solving the stochastic differential equation via the forward Euler method [16,23]. Li et al. proposed a risk analysis model for dynamic control of the flood limited water level based on Monte Carlo simulations [23]. We proposed a risk analysis method for reservoir real-time flood control operation by deriving the relationship between reservoir water levels and inflow forecast errors [24]. In addition, we also formulated an analytical method to calculate the risk of joint operation of a reservoir and its downstream river [25]. Generally, existing risk analysis methods can be divided into (1) direct integration method; (2) stochastic differential equation method; (3) Monte Carlo simulation; (4) structural reliability analysis method; and (5) fuzzy-sets based method. Choosing an appropriate risk analysis approach depends on the characteristic of the problem, the availability of data, and the accuracy requirement of results. Although plenty of methods are available to estimate the risk of reservoir flood control operation, risk analysis has been carried out based on fixed operation rules without adopting any of the optimization strategies of previous studies. Labadie emphasized that the fixed operation rule is out-of-date and should be replaced by real-time optimization models, which are more flexible and efficient for using inflow forecasts [26]. Therefore, it is essential to consider optimal operation and explicitly incorporate inflow forecast uncertainty into the optimization process when conducting risk analysis for reservoir real-time flood control operation.
In the field of mathematical optimization, stochastic optimization is a framework for modeling optimization problems that involve uncertainties. Stochastic optimization has applications in a broad range of areas, ranging from finance to transportation to energy optimization [27,28,29,30,31]. Stochastic optimization has been found to be an effective tool to address uncertainties within the model and provide a better understanding of optimization results. Implicit and explicit stochastic optimization methods have been established for deriving optimal reservoir management strategies under uncertainty. Although both consider reservoir inflow and other uncertain variables, the implicit stochastic optimization implicitly incorporates the stochastic nature of the system by solving a suite of deterministic problems, using regression analysis on the optimization results to infer reservoir operating rules [32]. On the contrary, explicit stochastic optimization operates directly on a probabilistic description of random variables, such as probability distributions, a set of statistical moments, or scenarios. This means that the uncertain future is explicitly considered in the optimization process. In the field of reservoir operation, the most widely used explicit stochastic optimization methods include stochastic dynamic programming (SDP), sampling stochastic dynamic programming (SSDP), and scenario tree-based methods. In order to solve an SDP model, the reservoir inflow is treated as a Markov chain with its serial correlation represented by a transition probability with the state variables discretized. For large reservoir operation problems, the construction of the Markov chain and the state variable discretization often cause the so-called curse of dimensionality. SSDP is an improved version of SDP, in which scenarios are used to represent possible future outcomes of random variables. Compared to Markov chains, more information can be collected via well-constructed scenarios. Scenario tree-based methods address inflow forecast uncertainty through tree-node structured scenarios. An inflow scenario tree starts from the root node at the first period and eventually branches into nodes at the next period. Each root–leaf path of the tree represents a scenario, and corresponds to a possible realization of the stochastic process. Côté and Leconte compared SDP, SSDP, and the scenario tree-based method in a hydropower reservoir operation problem with ensemble streamflow forecasts [33]. Their results indicated that the scenario tree-based method was better than those based on probability distributions.
This paper proposes a risk analysis model for reservoir real-time optimal operation using the scenario tree-based stochastic optimization method. This helps gain valuable risk information and improves the reliability of optimal flood control decision-making. The novel aspects and main contributions of this study are summarized as follows. First, we quantify the probability distribution of inflow forecast uncertainty by developing the relationship between two forecast accuracy metrics and the standard deviation of relative forecast error. We then generate the inflow scenario tree via Monte Carlo simulation to represent the uncertain inflow forecasts. Second, we establish a scenario tree-based stochastic optimization model to explicitly incorporate inflow forecast uncertainty into the stochastic optimization process. Third, we develop a risk analysis model based on the principle of maximum entropy (POME) to evaluate the uncertainty propagation process from flood forecast to optimal operation. The proposed methodology is applied to a flood control system in the Daduhe River Basin, China. Furthermore, we conduct numerical experiments to investigate the effect of two different forecast accuracy metrics and different forecast accuracy levels on reservoir optimal flood control operation as well as risk analysis.
The rest of this paper is organized as follows. Section 2.1 presents quantification of the probability distribution of inflow forecast uncertainty. Section 2.2 formulates the scenario tree-based stochastic optimization model for flood control operation. Section 2.3 introduces the risk analysis model based on the principle of maximum entropy (POME). Section 3 presents the results of the case study and discussion. Finally, Section 4 provides the summary and conclusions.
2. Methodology
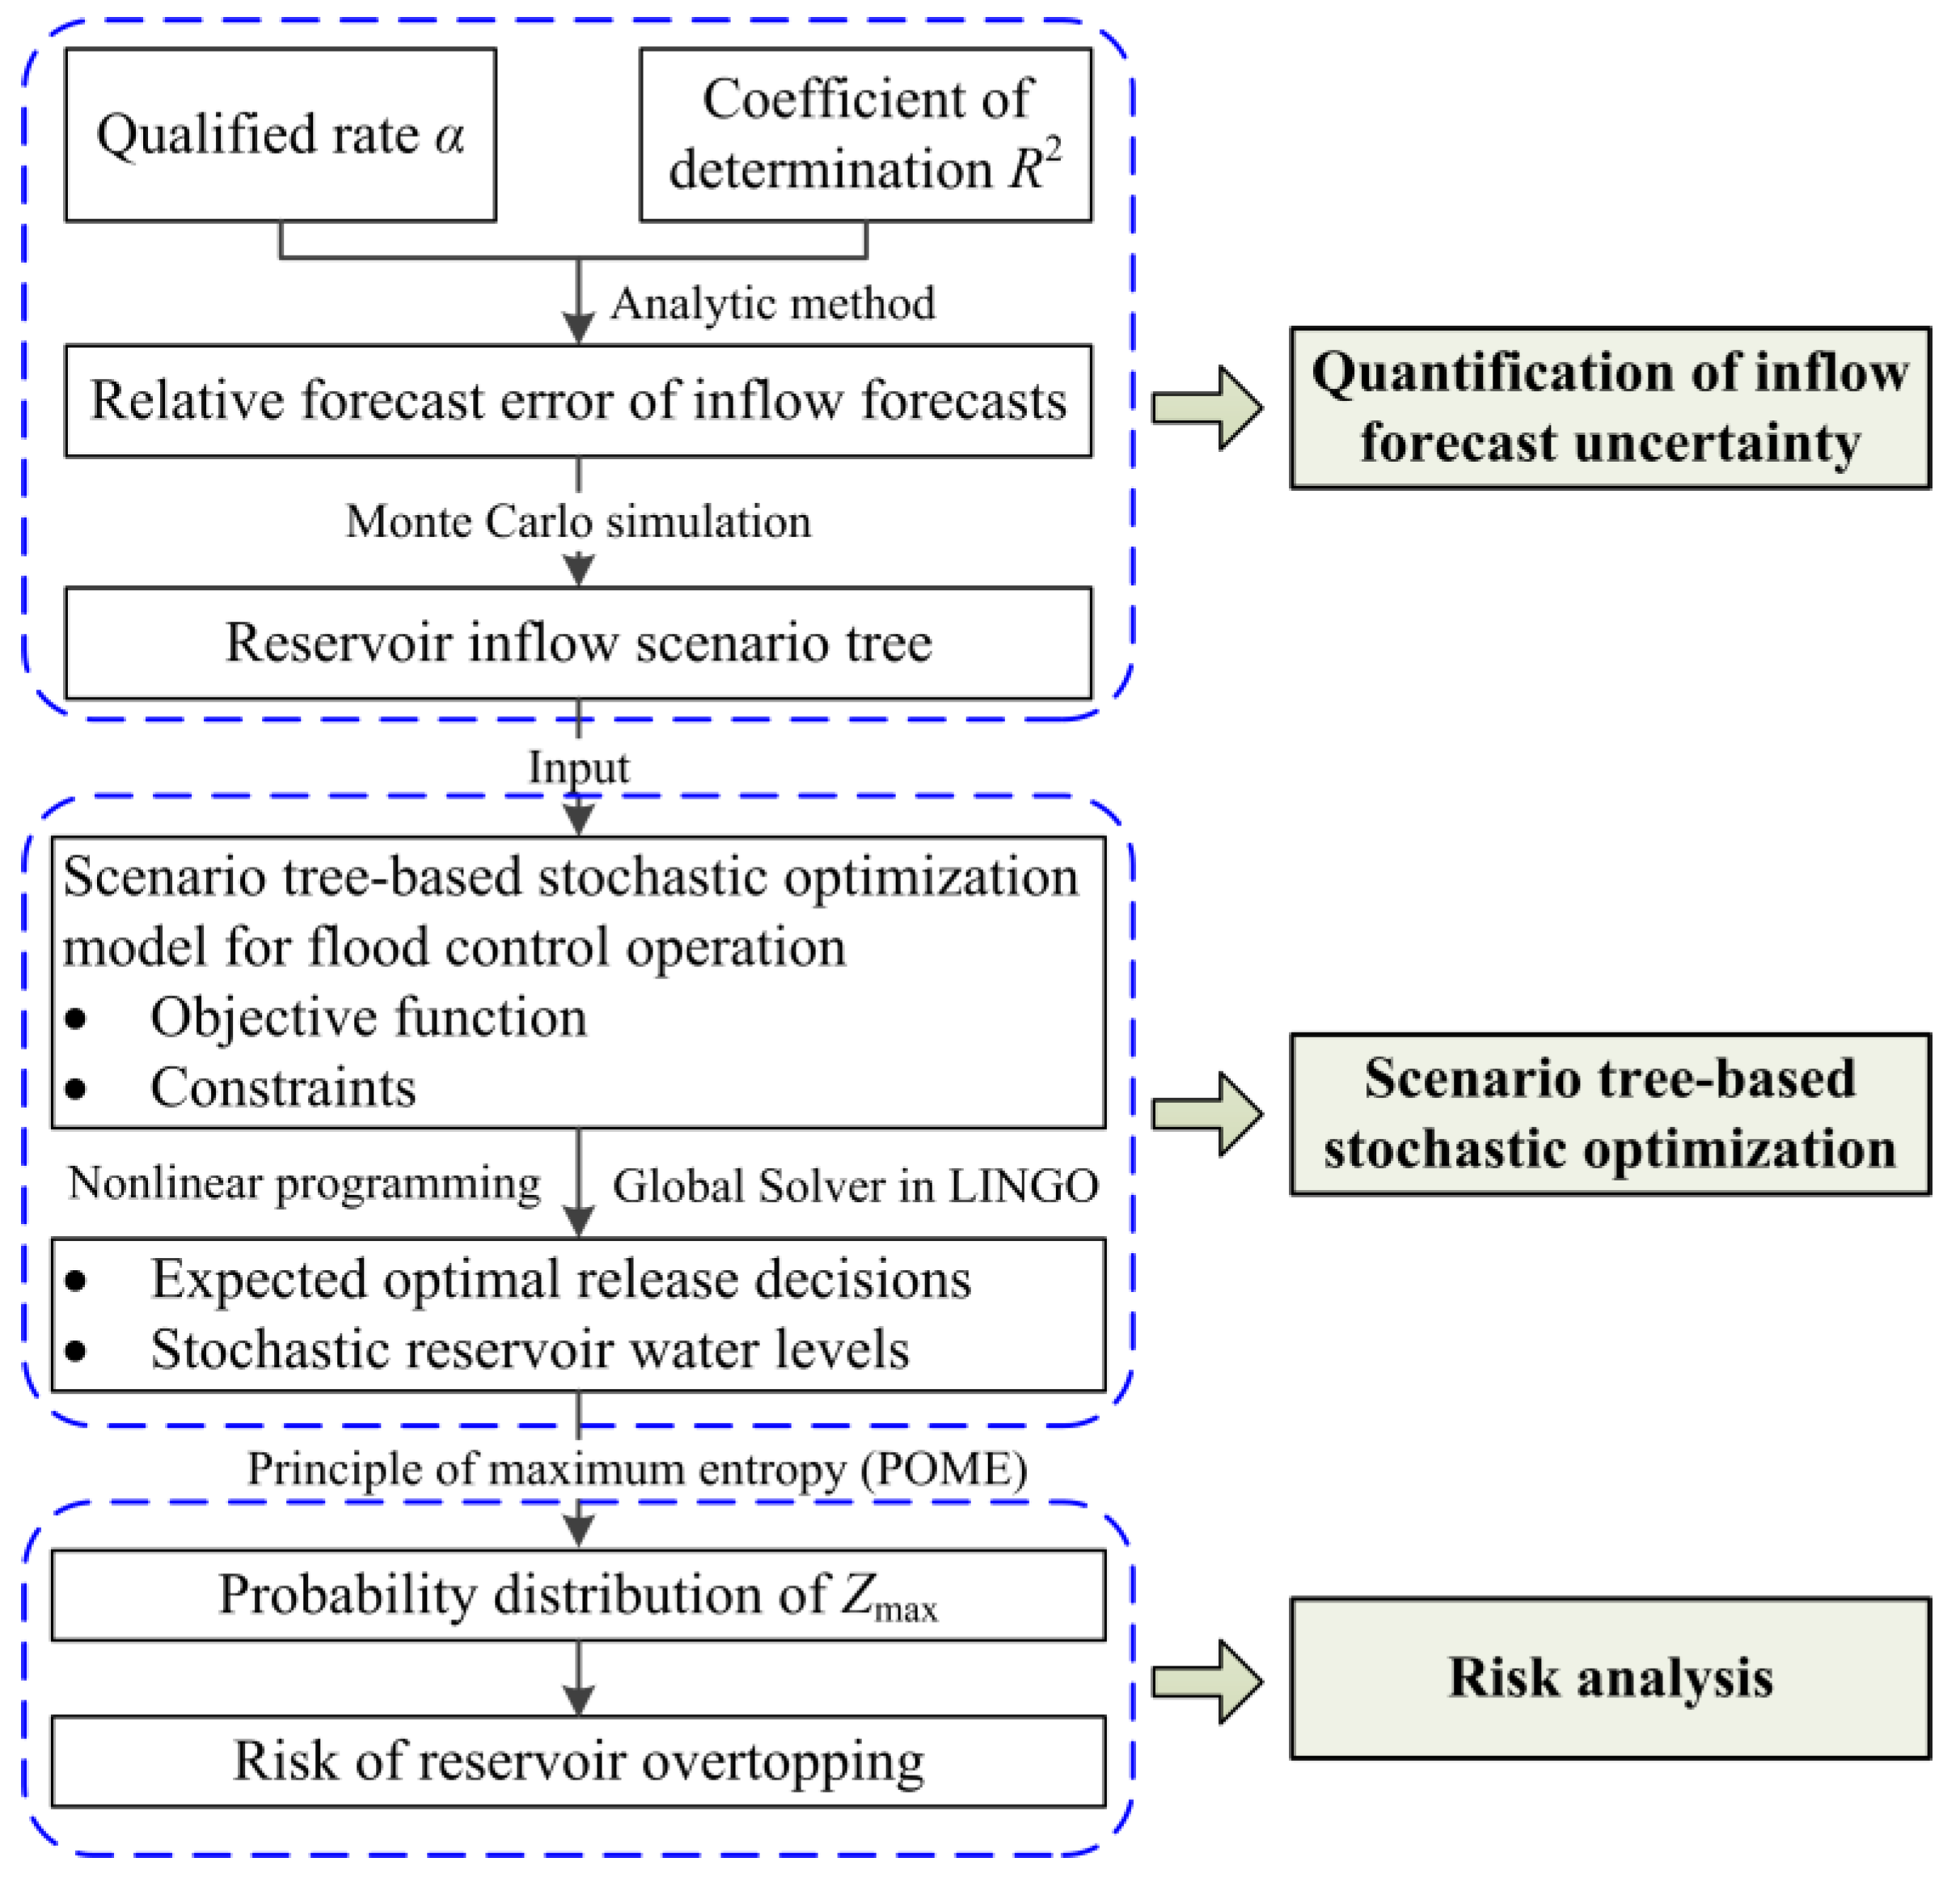
Figure 1 shows the flowchart of the proposed methodology for reservoir real-time optimal operation considering inflow forecast uncertainty. As shown in Figure 1, the proposed methodology consists of three components: quantification of inflow forecast uncertainty, scenario tree-based stochastic optimization, and risk analysis. First, we quantify the probability distribution of inflow forecast uncertainty based on two forecast accuracy metrics: the qualified rate (α) and the coefficient of determination (R2). We then generate an inflow scenario tree via Monte Carlo simulation to represent the uncertain inflow forecast. Second, we establish a scenario tree-based stochastic optimization model with the input of the inflow scenario tree. Third, we perform a risk analysis to estimate the risk of the reservoir overtopping based on the principle of maximum entropy (POME). Details of each step are given in the following subsections.
2.1. Quantify the Probability Distribution of Inflow Forecast Uncertainty
Reservoir inflow forecasts are inherently uncertain due to the uncertainties of hydrologic observations, forecast model structure and parameter estimation, imperfect initial and boundary conditions, and the necessary simplification of physical processes. The Ministry of Water Resources of China (MWR) specifies two forecast accuracy metrics to assess the performance of a hydrological model, which include the qualified rate (α) and the coefficient of determination (also referred to as the Nash–Sutcliffe efficiency coefficient, R2). According to the value of α and R2, three grade levels (Grade A, B, C) representing the different forecast accuracy levels are defined in Table 1. This study derives the probability distribution of the inflow forecast uncertainty based on the qualified rate (α) and the coefficient of determination (R2), respectively. In addition, we investigate the effect of the two different metrics and different forecast accuracy levels on reservoir optimal flood control operation and risk analysis.
2.1.1. Based on the Qualified Rate
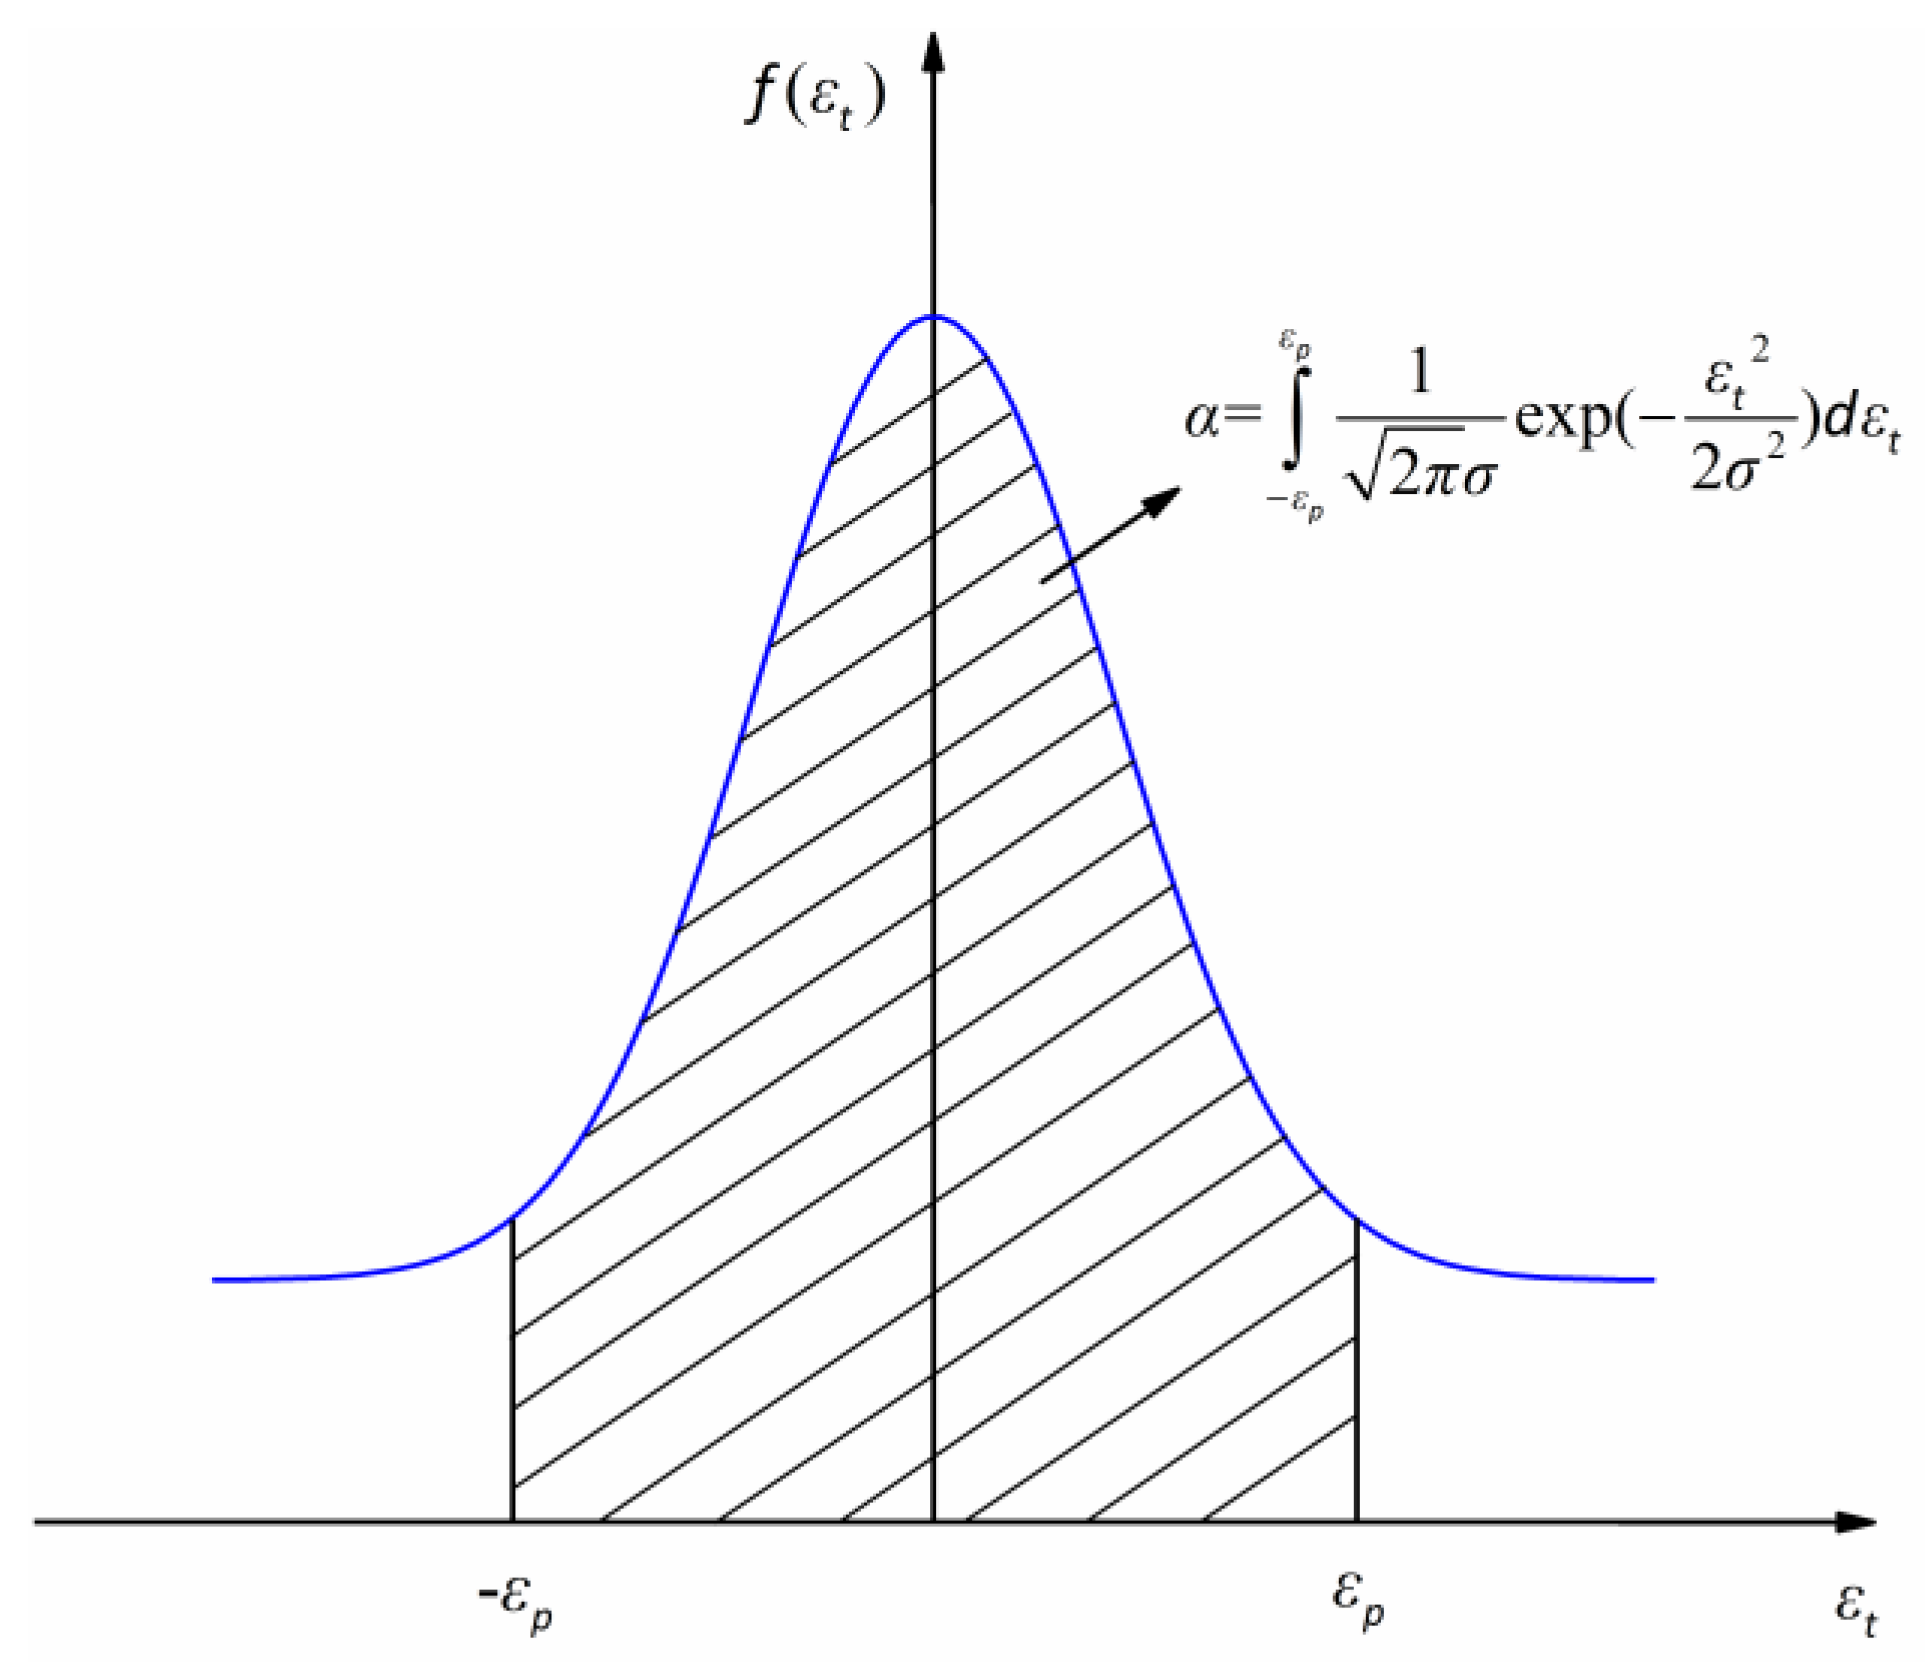
The qualified rate α is defined as the percentage rate that the forecast error of inflow peak discharge is within a permitted error εp. As a result of this definition, a flood forecast can be viewed as qualified if the difference between the forecasted value and the observed value is within (εp equals 20% in Chinese practice). The qualified rate α is illustrated in Figure 2 and can be calculated by:
where εt is the relative forecast error, which can be expressed as:
where and represent the forecasted and observed value of reservoir inflow at time t, respectively. We assume that the relative forecast error εt follows a normal distribution with mean of zero and standard deviation of σ, i.e., . The standard deviation σ is related to inflow forecast accuracy, a large σ corresponds to a poor forecast accuracy level and vice versa. Based on the Gaussianity assumption of εt, the standard deviation σ can be derived by:
where εp equals 0.2; denotes the standard normal quantile at the (1+α)/2 exceedance probability.
Based on Equation (3), we can derive the probability distribution of εt, since σ is the unique parameter of the distribution. The qualified rate α can be estimated via analyzing historical observations and forecasted inflow records. In addition, we can also determine the range of α through qualitative analysis of the forecast accuracy grade level as shown in Table 1.
2.1.2. Based on the Coefficient of Determination
The other way to derive the probability distribution of εt (namely to calculate σ) is using the coefficient of determination (R2) [16]. The coefficient of determination is a measure of the goodness-of-fit between the observed and forecasted inflows, which has been widely used for performance assessment of a hydrological model. R2 can be expressed as:
where is the mean of observed inflow; T is the forecast horizon.
Substituting Equation (2) into Equation (4) yields:
Taking the mean of both sides in Equation (5) yields:
As stated previously, , so , where represents the variance of εt. Equation (6) can be further expressed as:
Finally, we can derive the relationship between the standard deviation σ and the coefficient of determination R2 as follows:
Similar to the qualified rate, we can estimate R2 by analyzing historical data or through qualitative analysis of the forecast accuracy grade level. Then, the probability distribution of εt can be obtained using Equation (8).
2.1.3. Inflow Scenario Tree Generation via Monte Carlo Simulation
An inflow scenario tree, represented by a finite set of nodes, is used to quantify the uncertainty of reservoir inflow forecasts. It starts from the root node at the first period and eventually branches into nodes at the next period. Each root–leaf path of the tree is denoted as an inflow scenario, and corresponds to a possible realization of the stochastic process over the entire forecast horizon. In the case of continuous variables, the tree is a discrete approximation to the distribution.
After determining the standard deviation σ through Equation (3) or (8), we use a Monte Carlo simulation to synthesize ensemble inflow forecasts:
where represents the synthetic reservoir inflow at time t; et is a standard normal variable.
In this study, the generated inflow forecasts are further defined as a scenario tree , i = 1, 2, …, I, where I is the total number of scenarios. The term represents the ith inflow scenario that consists of a sequence of nodes, starting from the first time period and ending at the end of the forecast horizon T. The generated inflow scenario tree serves as the input to the stochastic optimization model described in Section 2.2.
2.2. Scenario Tree-Based Stochastic Optimization Model for Flood Control Operation
In order to deal with inflow forecast uncertainty, and to explicitly incorporate the associated uncertainty into the optimization process, we established a scenario tree-based stochastic optimization model for reservoir flood control operation.
2.2.1. Objective Function
For a reservoir flood control system, the objective is to minimize the expected highest water level over all inflow scenarios to ensure the safety of the reservoir and its upstream area. The objective function can be expressed as:
where t is the time period; is the reservoir water level in scenario at time t (m); represents the probability of scenario ; and denotes the objective function value associated with the scenario tree . It should be noted that is a stochastic process associated with each specific scenario and its probability , which is different from the fixed operation rules and deterministic optimization models used in previous studies.
2.2.2. Constraints
The following constraints are considered:
- (1)
- Water balance equationwhere and are reservoir storage variables at the ending and beginning of time t − 1 under scenario , respectively (m3); and represent reservoir inflow and outflow at time t under scenario , respectively (m3/s); and is the time interval (s).
- (2)
- Reservoir water level boundswhere and are the lower and upper bounds of reservoir water level at time t, respectively (m).
- (3)
- Reservoir release limitswhere and are the lower and upper bounds of reservoir release at time t, respectively (m3/s).
- (4)
- Reservoir release capacity limitswhere is a function of the reservoir release capacity, which represents the maximum limit of outflow that can be released to the downstream river when all spillways reach their release capacities (m3/s).
- (5)
- Reservoir release fluctuation limitswhere is the permitted maximum release fluctuation (m3/s). To ensure the safety of downstream navigation and avoid the sediment erosion of levee systems, the reservoir release should not fluctuate sharply. We use this constraint to restrict the difference of reservoir release between two adjacent time periods within a given range.
- (6)
- Initial and boundary conditionswhere and represent the initial and target end water level, respectively (m). The end water level is expected to fall back to the target water level. For long-term hydropower operations, this should be a hard constraint which must be strictly satisfied. However, for short-term real-time flood control operations, this is usually treated as a soft constraint and loosened, since the end water level sometimes cannot reach the target water level in a limited operation horizon if the initial water level is high or the peak inflow discharge is huge and occurs late.
2.2.3. Algorithm
As mentioned previously, the inflow scenario tree is a discrete approximation of the probability distribution of continuous random variables. A stochastic optimization model is established to deal with inflow forecast uncertainty which is modeled by a scenario tree consisting of a set of inflow scenarios. Therefore, we can convert the original stochastic model to the corresponding deterministic equivalent formulation via inflow scenarios and associated probabilities. Under deterministic environments, reservoir releases at each time period are often selected as decision variables. For the established stochastic optimization model, we specify reservoir releases at each time period under all inflow scenarios as decision variables, which yields a T × I-dimensional decision space, T is the operation horizon and I is the total number of inflow scenarios. The reservoir storage is updated based on the water balance equation, i.e., Equation (11). In this study, we use nonlinear programming (the Global Solver available in LINGO 17.0) to solve the nonlinear deterministic equivalent, and determine the expected reservoir releases over all scenarios to guide real-time reservoir operations.
The Global Solver in LINGO 17.0 is a high-performance solver, which contains features designed to sift through the local points, used to find globally optimal solutions to nonlinear models. The Global Solver uses range bounding and reduction techniques within a branch-and-bound framework to convert a non-convex model into a series of smaller, convex models. This divide-and-conquer strategy ultimately results in convergence to the guaranteed globally optimal point. For more details about the Global Solver, refer to http://www.lindo.com.
2.3. Risk Analysis Based on the Principle of Maximum Entropy (POME)
2.3.1. Risk Source of Reservoir Optimal Flood Control Operation
In previous studies, risk analysis has been carried out based on fixed operation rules without adopting any optimization strategy. However, this paper is different from these studies since we explicitly incorporate the inflow forecast uncertainty into the stochastic optimization process. Specifically, an inflow scenario tree, consisting of a set of scenarios, is used to quantify inflow forecast uncertainty. In order to deal with the uncertainty of future inflows, we established a stochastic optimization model to base the release decisions on minimizing the expected highest upstream water level over all inflow scenarios. To enhance the adaptability to inflow forecast uncertainty, the optimal release decisions under different scenarios will be different from each other since the stochastic optimization model aims to derive an expected optimal decision over all scenarios that ensures, on average, that the objective function can reach its optimal value. Therefore, the risk results from the differences among the optimal release decisions under different inflow scenarios. In the next two sections, we introduce a risk analysis model to calculate the risk of optimal reservoir operation and evaluate the uncertainty propagation process from flood forecast to optimal operation.
2.3.2. Risk Definition of Reservoir Optimal Flood Control Operation
Strictly speaking, risk is related to the probability of an uncertain event happening and the consequences if it does happen, which can be defined as Risk = f (P, C), where P is the probability, C is the consequence. However, for many real-world problems, it is difficult to estimate the consequences of an uncertain event, especially when the pre-event evaluation is required (before the uncertain event happens) [34,35,36,37]. For instance, in real-time flood control operations, pre-evaluating the consequences of an operation strategy is very challenging because of the time limits and complexity of the problem. Therefore, researchers usually simplify the risk definition as the probability of an uncertain event happening. This simplified risk definition has been widely accepted in the field of reservoir operation [16,20,21].
Under the influence of inflow forecast uncertainty, the reservoir water level becomes a stochastic process, which further leads to the risk of reservoir overtopping. In this study, we define the risk of reservoir overtopping as the probability of the loading L exceeding the resistance R, where L is the reservoir highest water level (Zmax) and R is the safe water level (Zs) specified by decision-makers, such as the design flood water level, check flood water level, or dam crest height. The risk of reservoir overtopping can be calculated by:
where f (Zmax) is the probability density function of Zmax.
2.3.3. Derive the Probability Distribution of Zmax Using POME
As Equation (17) shows, derivation of the probability density function of Zmax is the key to calculate the risk. We achieve this by using the principle of maximum entropy (POME). The maximum entropy theory was first expounded by Jaynes in 1957; he emphasized a natural correspondence between statistical mechanics and information theory. POME states that the probability distribution which best represents the current state of knowledge is the one with the largest entropy, in the context of precisely stated prior data (e.g., a proposition that expresses testable information). Until now, POME has been extensively employed to derive the probability distribution functions of hydrologic variables, especially in the absence of sufficient data. According to POME, the probability density function of Zmax can be formulated as:
where (h = 0, 1, …, n) is the Lagrange multiplier; h is the order number of the original moments of Zmax. It has been proved that in real-world engineering applications taking an h value of 3 or 4 is appropriate, which can reduce computational burden without losing too much accuracy of the results. Many methods are available to determine the Lagrange multiplier in Equation (18), such as the structural equation method, maximum likelihood estimation method, etc. This study employs the Newton–Raphson method to calculate the Lagrange multiplier, and thereby, derives the probability density function f (Zmax).
3. Results and Discussion
3.1. Introduction to the Study Area
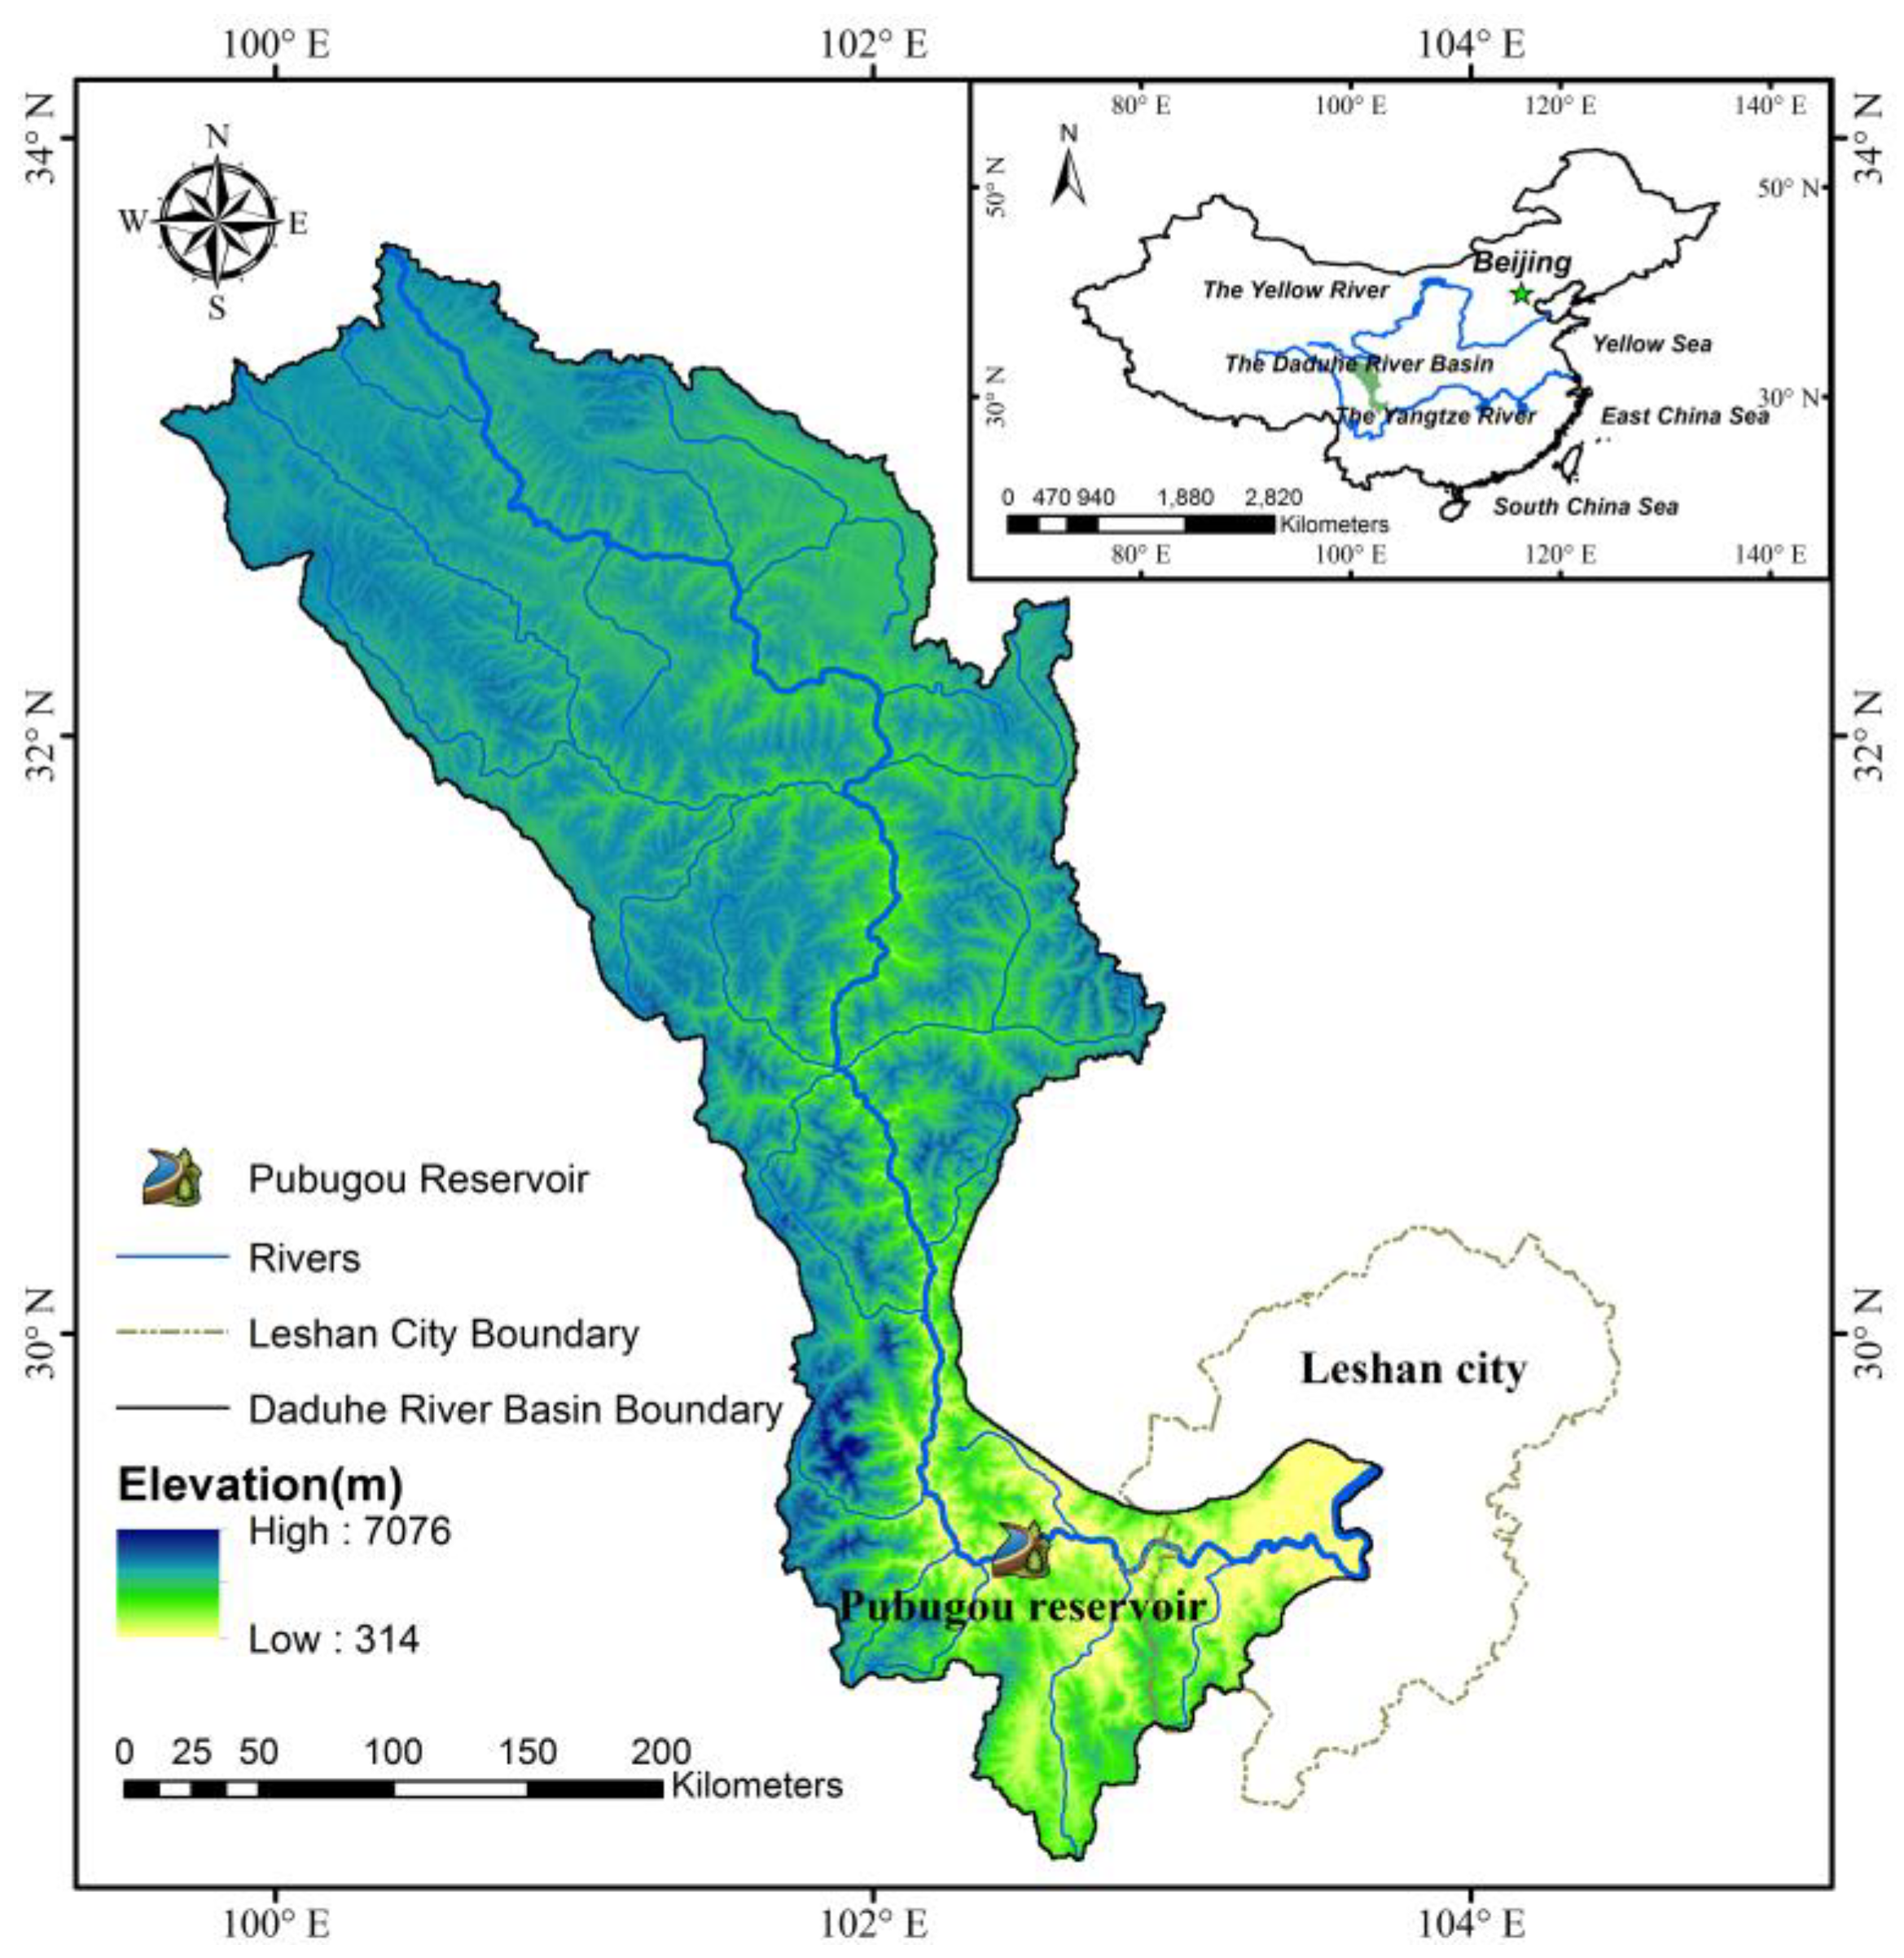
We carried out the case study in the Daduhe River Basin, China. The Daduhe River is one of the most important tributaries of the Yangtze River and covers a basin area of 90,000 km2. Floods occur frequently in the main flood season between June and September, and the annual maximum inflow occurs mainly in July. The considered flood control system consists of the Pubugou reservoir and Leshan city. Figure 3 shows the location of the Daduhe River Basin and the flood control system. Table 2 lists the main characteristics of the Pubugou reservoir. The Pubugou reservoir is an important reservoir located in the lower reaches of the Daduhe River, which is built for multiple purposes, including flood control, irrigation, water supply, hydropower generation, and navigation. Leshan city, located downstream of the Pubugou reservoir, is an important flood control region with a population size of 3,544,000 and GDP of 24.21 billion USD. We use quartic polynomials to fit the storage capacity curve and discharge curve of the Pubugou reservoir. The obtained quartic polynomials fit the original data very well.
A real-time optimal flood control operation model is operated on the basis of forecasted inflows. The anthropogenic water use (such as upstream reservoir release and upstream agricultural and drinking water withdrawal) has certain impacts on reservoir operation and also increases the difficulty of flood forecasts. In real-world applications, the impact of anthropogenic water use is usually considered in hydrological forecasting models. In the Daduhe River Basin, the water resources are mainly used for hydropower generation, and a small portion is used for agricultural irrigation. The upstream reservoir release, lateral inflow, and agricultural water use are considered in the hydrological model to determine the inflow of the Pubugou reservoir.
3.2. Demonstration of the Proposed Methodology
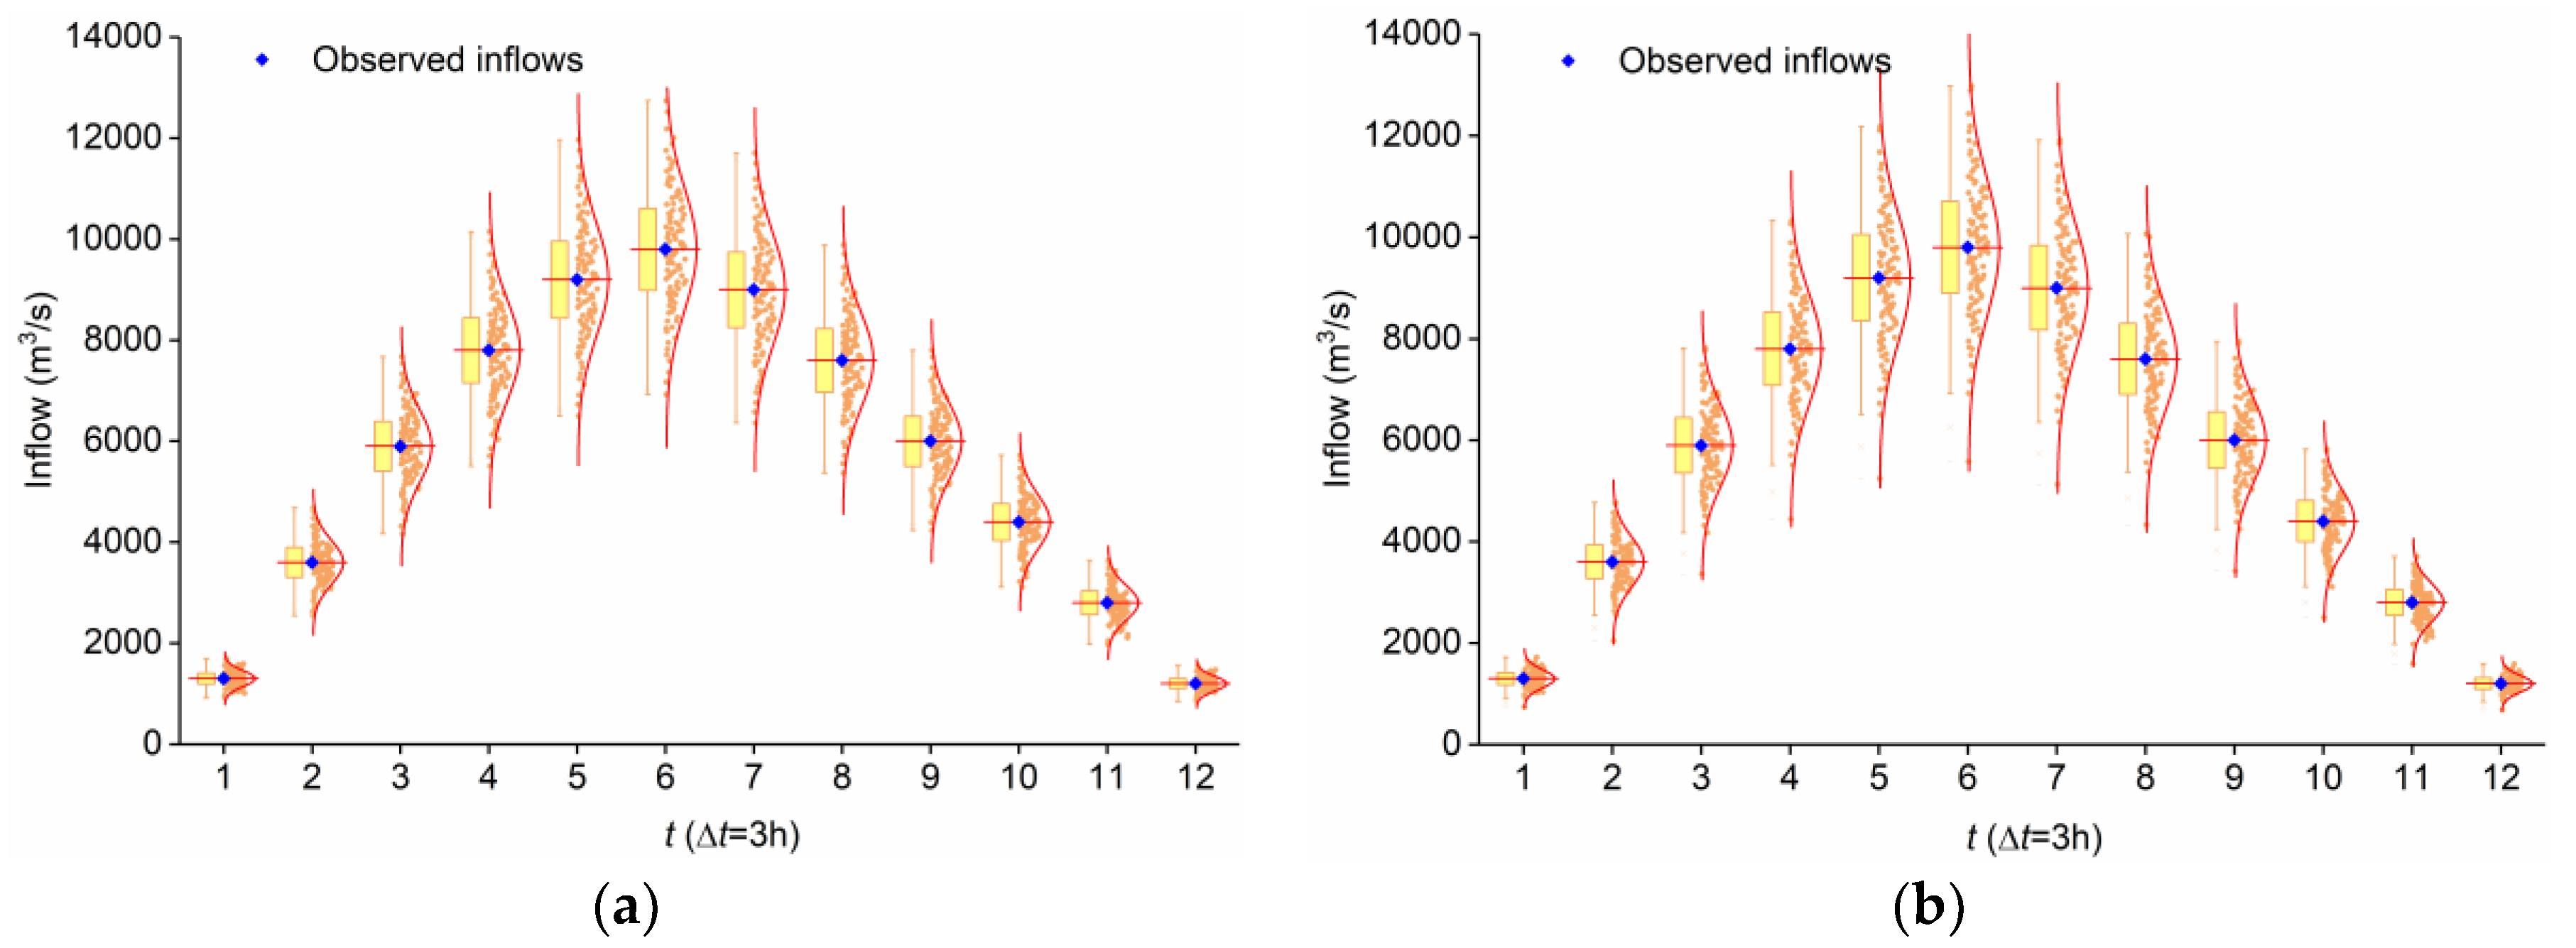
In order to demonstrate the proposed methodology, we selected 159 historical flood observations and the corresponding forecasted inflow records to perform statistical analysis. The results indicate that α and R2 in the Pubugou reservoir equal 89.5% and 91%, respectively, and the performance of the hydrological model belongs to Grade A. The standard deviation σ calculated by Equations (3) and (8) were 0.122 and 0.146 respectively. We then used the Monte Carlo simulation to generate synthetic inflow forecasts based on a historical flood event of the flood control system. The forecast horizon is 36 h, which is divided into 12 time periods with a time interval of 3 h. The synthetic inflow forecasts are further represented by an inflow scenario tree , the total number of scenarios is 100. Figure 4 illustrates the box plot of the synthetic inflow forecasts based on α and R2, which clearly shows the probability distributions of the inflow discharge at each time period. We found that the uncertainty level of the synthetic inflow forecasts based on R2 was slightly greater than those based on α, since the distribution curves in Figure 4b covered wider ranges than Figure 4a.
Next, the inflow scenario tree (i = 1, 2, …, 100) was used as the inputs into the stochastic optimization model. We assumed that the scenarios are equally likely to occur, namely, the probability of the ith scenario . We used the Global Solver available in LINGO 17.0 to solve the nonlinear deterministic equivalent of the stochastic optimization model. The model was run on a personal computer with an Intel Xeon E3-1505M eight-core 2.8 GHz CPU and 16 GB RAM. Table 3 lists the dimensionality of the nonlinear deterministic equivalents. Compared to the fixed operation rules and deterministic optimization employed in previous studies, using the stochastic optimization technique yielded a much larger high-dimensional mathematical model with a multitude of nonlinear variables and constraints, since the inflow forecast uncertainty was explicitly incorporated in the stochastic optimization model. The CPU time required for finding the globally optimal solutions was approximately one minute.
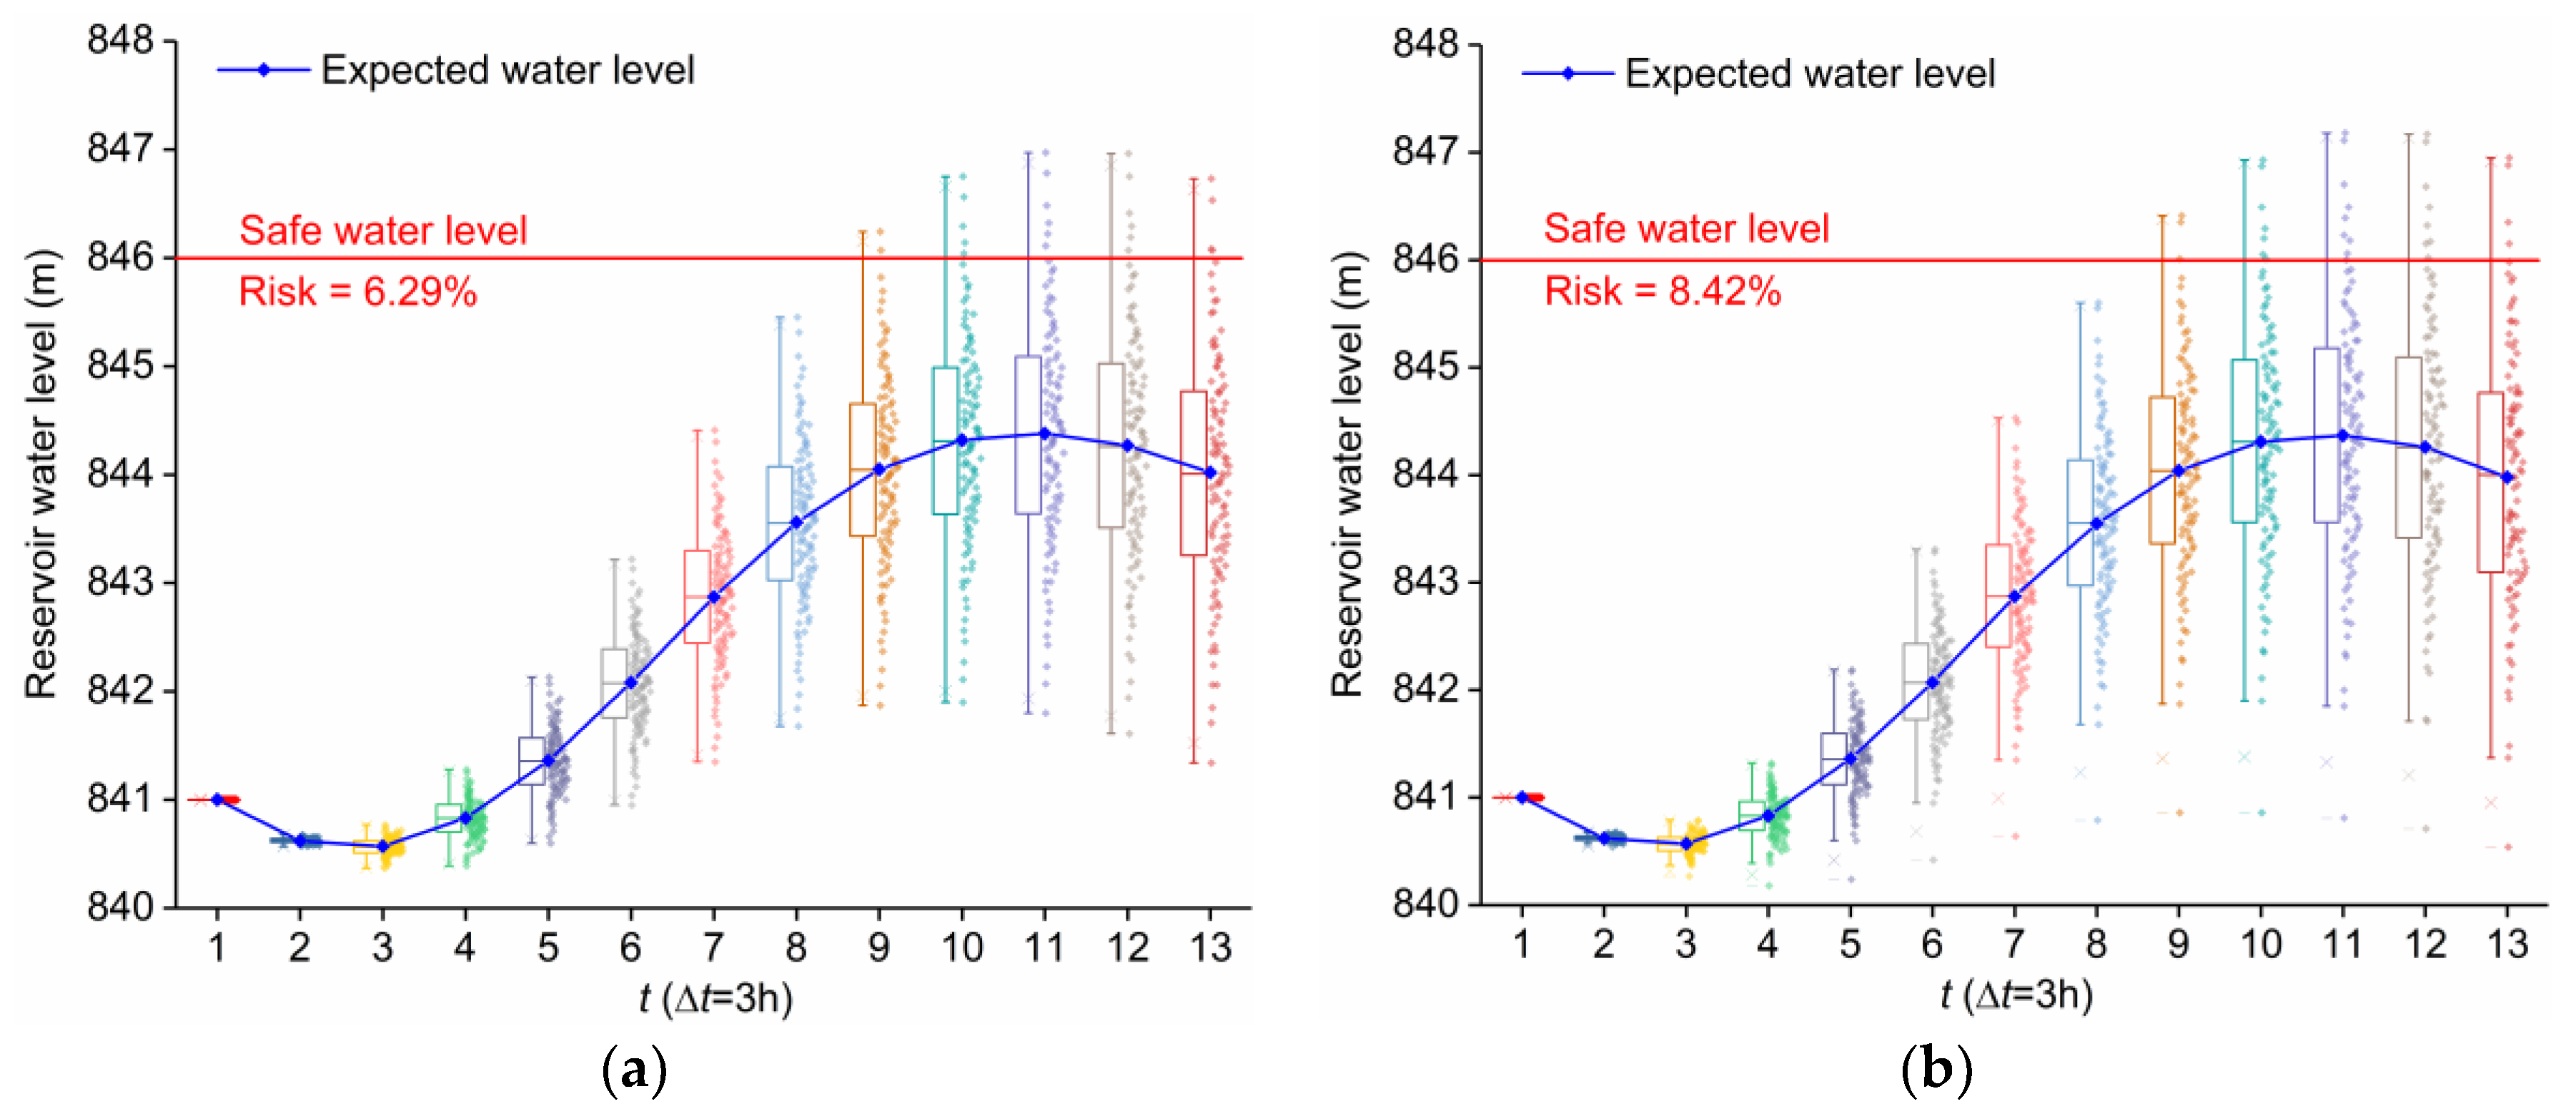
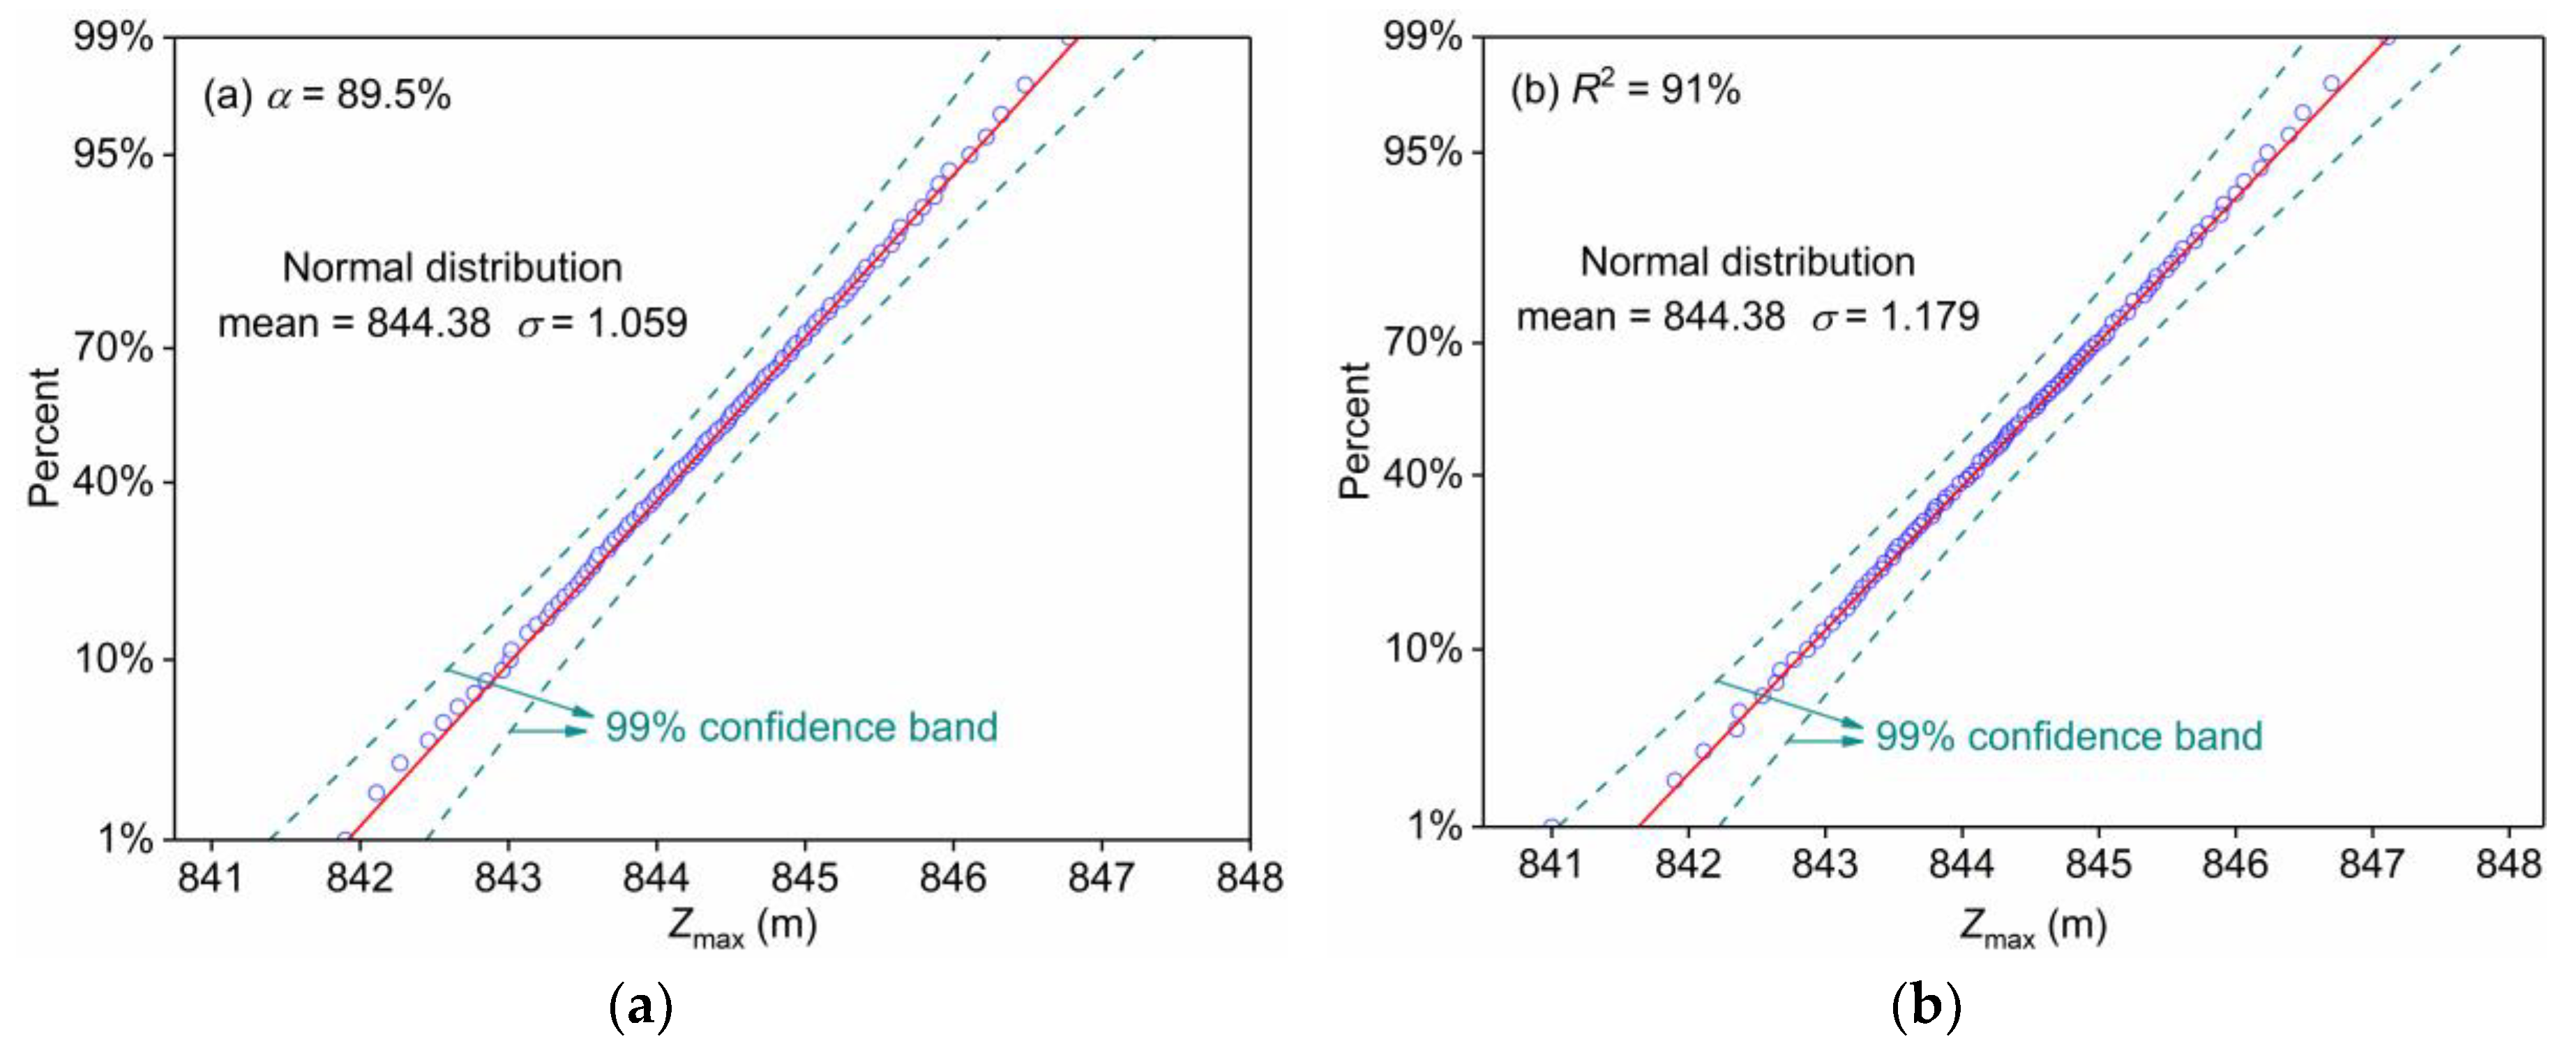
As can be seen from Figure 5, the reservoir water level is a stochastic process with explicit consideration of inflow forecast uncertainty in the stochastic optimization model, which further results in the risk of reservoir overtopping. In order to estimate the risk, we used POME (i.e., Equation (18)) to derive the probability density function of the highest water level Zmax. The POME distribution curve is shown in Figure 6, and we also plotted the theoretical normal distribution curve for comparison. Figure 6 indicates that the POME distribution curve and the theoretical normal distribution curve are almost the same. In addition, the uncertainty degree of Zmax, as estimated by R2, is slightly greater than that estimated by α. We then use the P–P plot to examine whether Zmax follows normal distributions. In statistics, a P–P plot is a probability plot for assessing how closely two data sets agree, which plots the two cumulative distribution functions against each other. P–P plots are widely used to evaluate the skewness of a distribution. Figure 7 indicates that Zmax follows the normal distribution at the significance level of 0.01.
According to Equation (17), the safe water level (Zs) was set as 846.00 m, and the risks estimated by α and R2 were 6.29% and 8.42%, respectively, as shown in Figure 5. This result is interesting in that the risk estimated by R2 is greater than that determined by α, although both of the forecast accuracy metrics (i.e., α and R2) are obtained based on the statistical analysis of the same historical dataset. The reason lies in the fact that the coefficient of determination R2 measures the goodness-of-fit based on the whole inflow hydrograph, while the qualified rate α only considers the inflow peak discharge. The risk estimation method based on R2 incorporates the uncertain information of all time periods, while the risk estimation method based on α only considers the uncertain information at the time period of the inflow peak, thus underestimates the risk.
3.3. Effect of Forecast Accuracy Level on Optimal Flood Control Operation
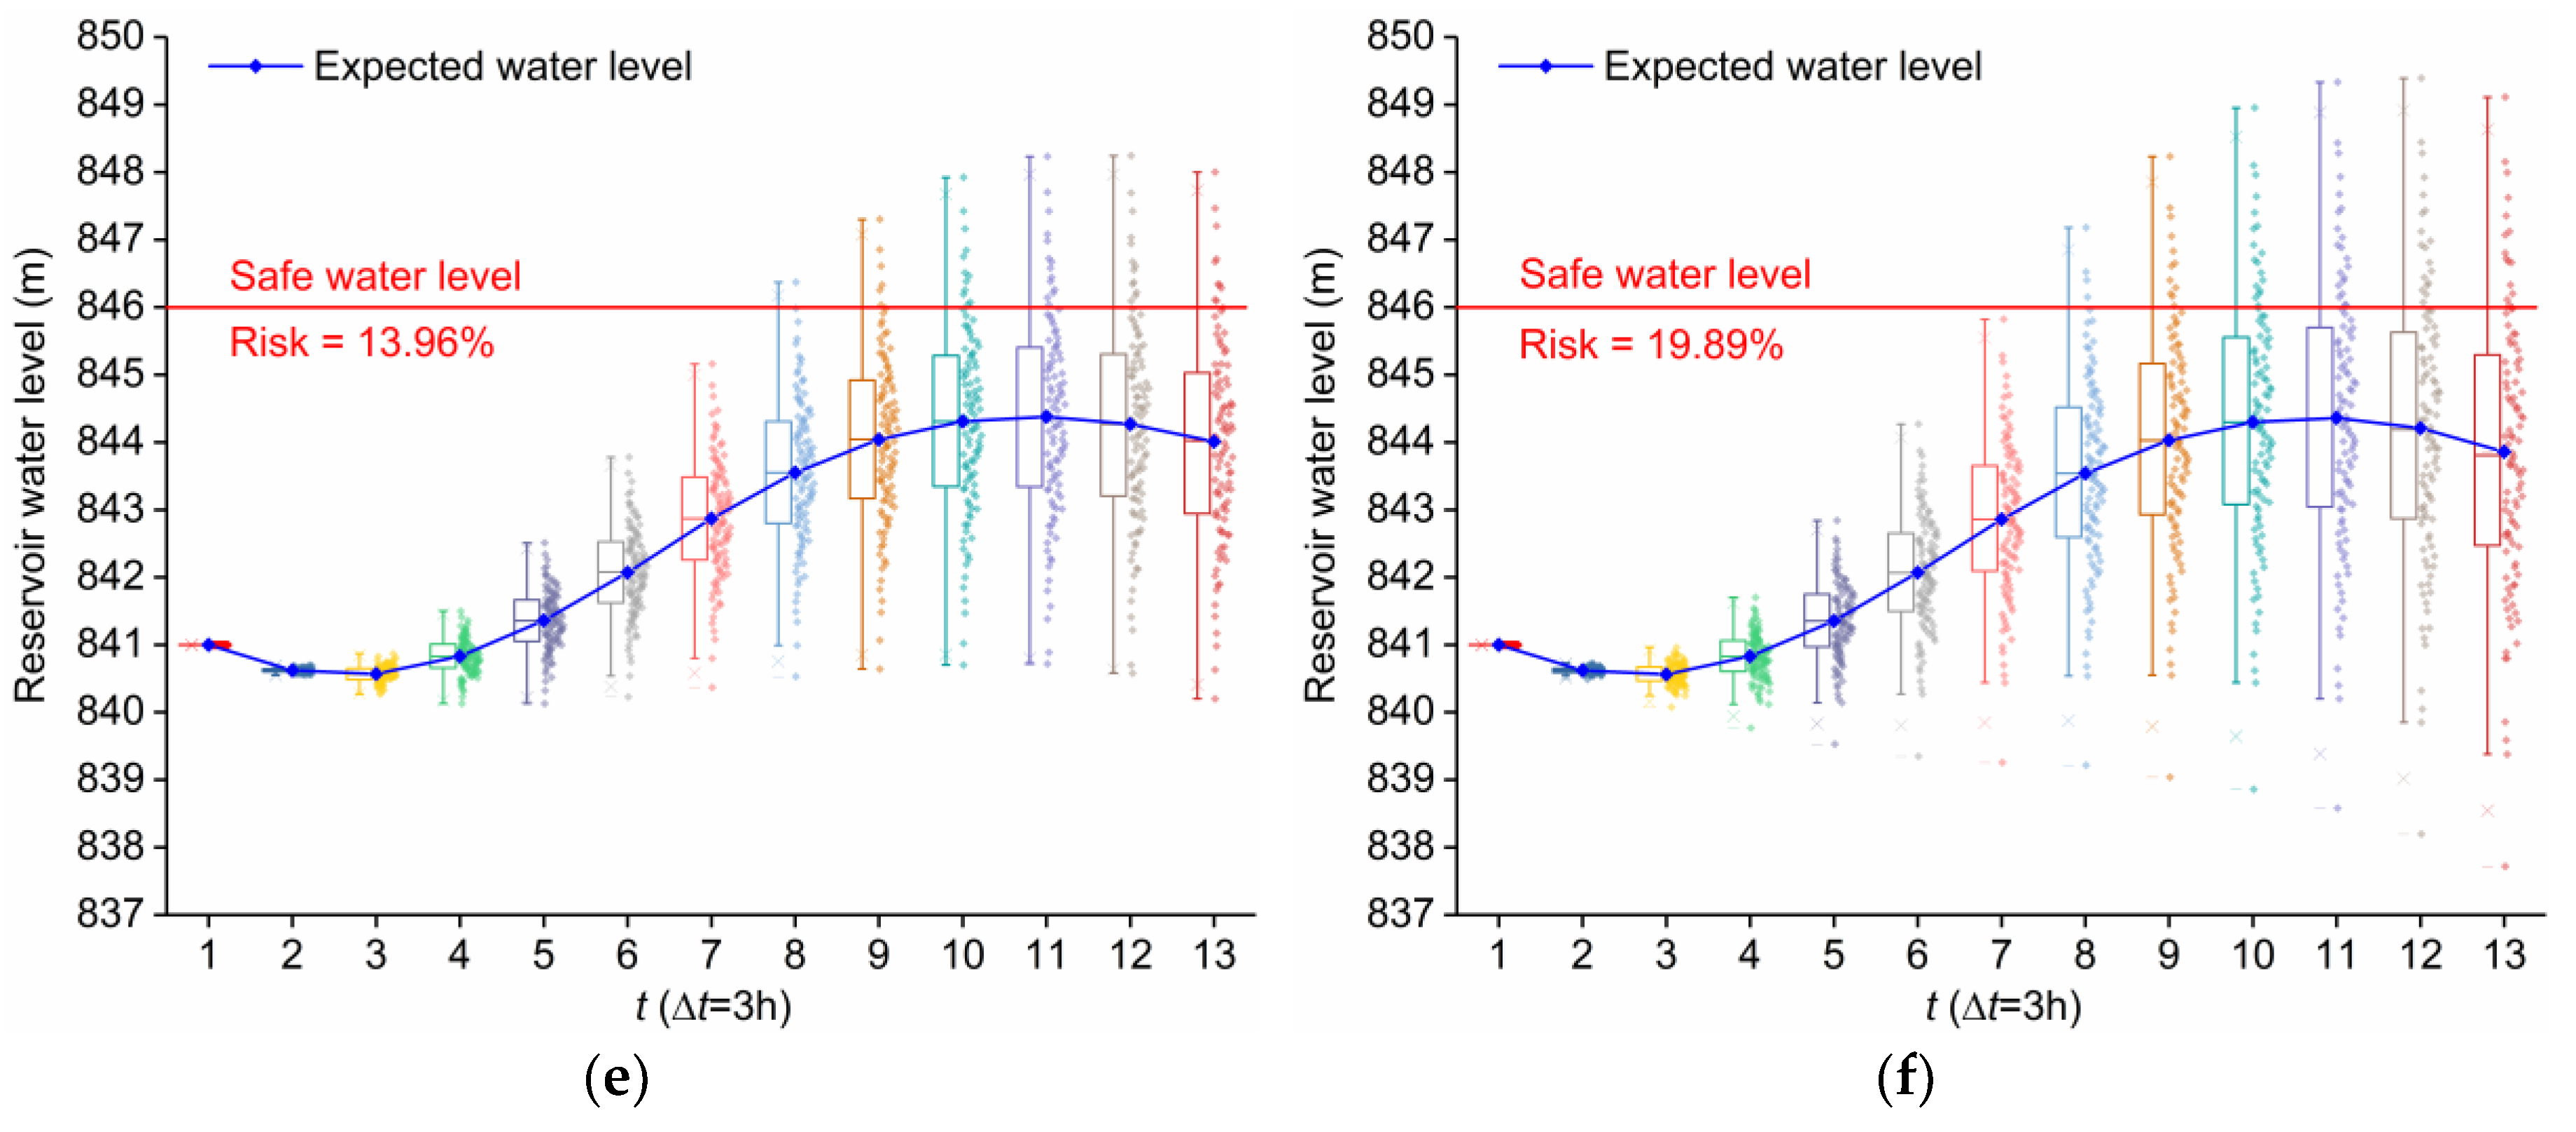
In order to examine the effect of forecast accuracy level on optimal flood control operation, we conducted a numerical experiment by varying α and R2 from 0.70 to 0.95. Figure 8 provides the box plot of reservoir water levels and related risks under six forecast accuracy levels. It is clear that the dispersion degrees of the reservoir water level exhibit an increasing trend as the forecast accuracy level (represented by α or R2) decreases, which indicates that a lower forecast accuracy level will lead to a higher uncertainty level of stochastic optimization results. In addition, the risk propagated from the flood forecast and optimal operation tends to increase as the forecast accuracy level decreases.
By comparing the results under the same grade level (e.g., Figure 8c,d), we found that the dispersion degree of reservoir water level and the risk obtained by R2 is greater than that obtained by α when α and R2 take the same value. This can be explained by Figure 9 which illustrates the relationship between the forecast accuracy level and standard deviation of inflow forecast errors. It is evident that R2 corresponds to a larger standard deviation of inflow forecast errors than α under the same forecast accuracy level.
As Figure 10 shows, the risk tends to decrease as the forecast accuracy level increases. This finding highlights the importance of developing a reliable and accurate hydrological model for reservoir optimal operation. This relationship curve is also very useful to help improve the forecast model to meet the specified safety requirement, such as the acceptable risk. For example, if the acceptable risk given by decision-makers is 6%, the forecast accuracy level must be greater than 90.7% in terms of α and greater than 94.1% in terms of R2 (see points A and B in Figure 10). Unfortunately, the current forecast accuracy level (i.e., α = 89.5%, R2 = 91%) of the Pubugou reservoir obviously cannot meet the safety requirement. The above results imply that the risk of reservoir overtopping can be reduced by improving the forecast accuracy of the hydrological model.
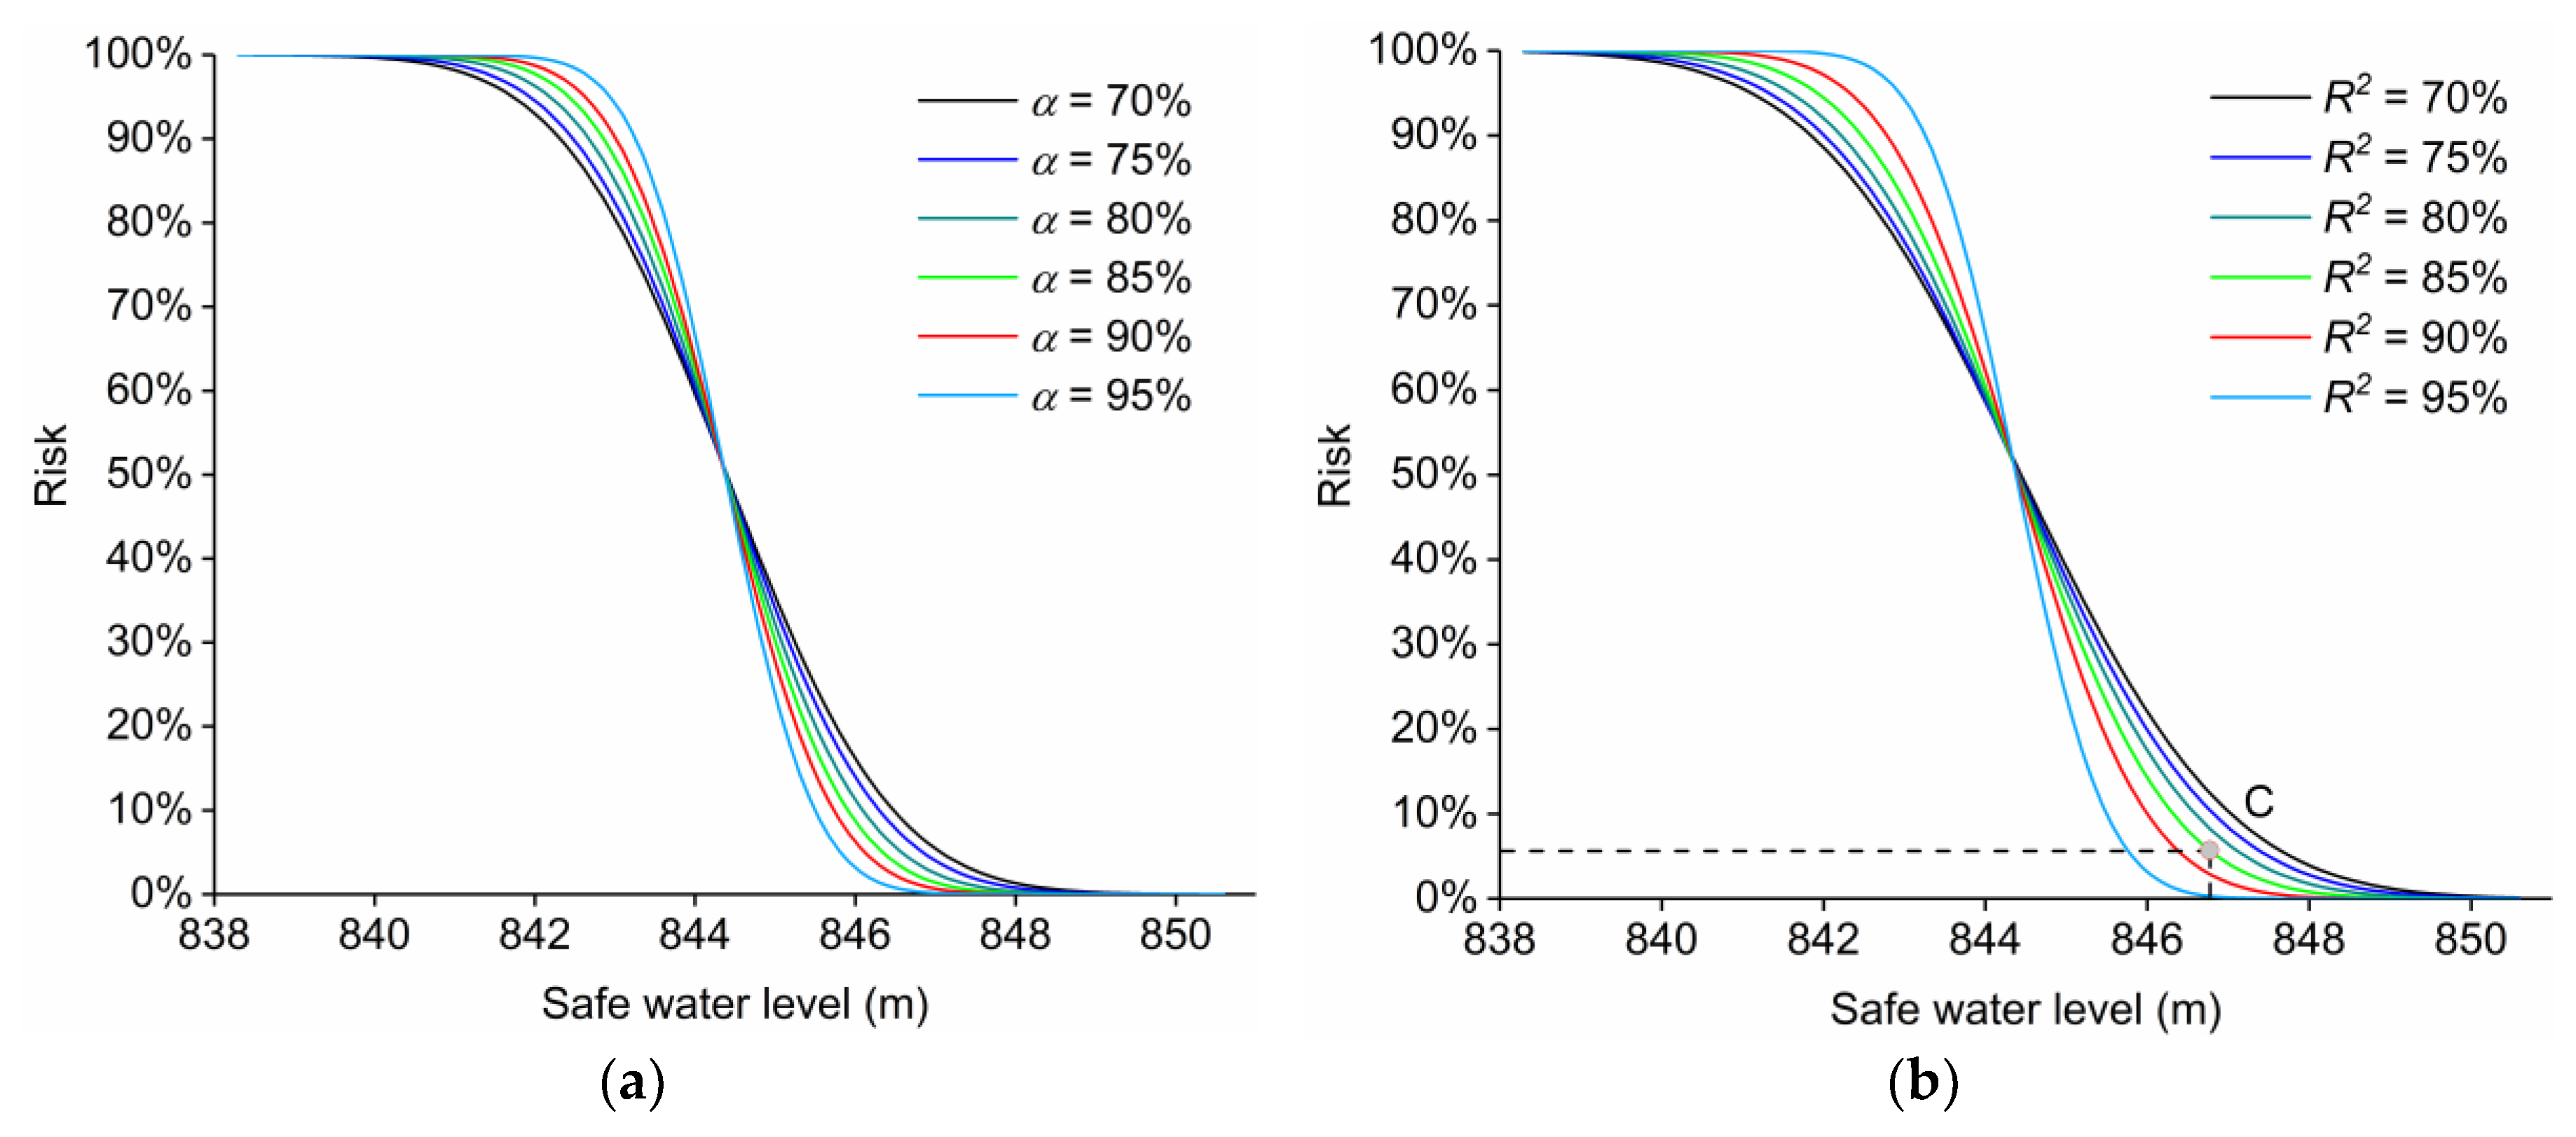
Finally, we set different safe water levels for the Pubugou reservoir and calculated the corresponding risks based on Equations (17) and (18). Figure 11 shows the relationship between the selected safe water level and risk under different flood forecast accuracy levels. It is clear that the risk tends to decrease as the selected safe water level increases. The relationship curve can provide decision-makers with valuable risk information for guiding real-time optimal reservoir operation. For instance, if the acceptable risk of decision-makers is 6% and the coefficient of determination R2 is 85%, the corresponding safe water level is 846.85 m, as shown in point C of Figure 11b. In real-time reservoir optimal operation, decision-makers can set the upper bound of reservoir water level as 846.85 m to control the risk under the acceptable risk.
4. Summary and Conclusions
The inflow forecast is characterized by its inherent uncertainty, which hinders the reservoir real-time optimal operation. In this study, we proposed a risk analysis model for reservoir real-time optimal operation using the scenario tree-based stochastic optimization method. This study explicitly linked the inflow forecast uncertainty with the stochastic optimization, and evaluated the uncertainty propagation process from flood forecast to optimal operation. The main points and conclusions are summarized as follows:
- (1)
- We derived the probability distribution of inflow forecast uncertainty by developing the relationship between two forecast accuracy metrics (i.e., the qualified rate α and the coefficient of determination R2) and the standard deviation of relative forecast error. The inflow scenario tree, used to represent the uncertain inflow forecasts, was generated via Monte Carlo simulation.
- (2)
- We established the scenario tree-based stochastic optimization model to explicitly incorporate inflow forecast uncertainty into the stochastic optimization process. Nonlinear programming (the Global Solver available in LINGO 17.0) was employed to solve the model and to find the globally optimal solutions.
- (3)
- We carried out risk analysis to estimate the risk of reservoir overtopping based on the principle of maximum entropy (POME).
- (4)
- We applied the proposed methodology to the flood control system in the Daduhe River Basin, China. Additionally, we conducted numerical experiments to investigate the effect of two different forecast accuracy metrics and different forecast accuracy levels on reservoir optimal flood control operation as well as risk analysis.
The results from the case study indicated that the uncertainty level of Zmax and the risk of reservoir overtopping based on R2 are slightly greater than that based on α, although both forecast accuracy metrics were obtained from the same historical dataset. As the forecast accuracy level decreases, the dispersion degree of the stochastic water level and associated risk exhibit an increasing trend, indicating that the uncertainty propagated from flood forecast to optimal operation tends to increase with a decrease in forecast accuracy level. In addition, the dispersion degree of the stochastic water level and the risk obtained by R2 are greater than that obtained by α under the same forecast accuracy level, since R2 corresponds to a larger standard deviation of inflow forecast errors than α. The relationship curve between the forecast accuracy level and risk is very useful to help improve the hydrological model to meet the specified safety requirement. Furthermore, the risk tends to decrease as the selected safe water level increases. The results can provide decision-makers with valuable risk information for guiding reservoir real-time optimal operation and enable risk-informed decisions to be made with higher reliabilities.
In this paper, the proposed methodology was demonstrated based on the synthetic inflow forecasts. The growing ensemble forecasts’ availability and accuracy would provide a new way for real-time reservoir optimal operation. Ensemble flood forecasts, consisting of different trajectories of possible future outputs of a hydrological model, have been proved to be an effective method of quantifying forecast uncertainty [38]. Operational forecasting systems employ numerical weather predictions to drive hydrological models and to obtain ensemble flood forecasts. In fact, we are now studying how to combine real-time ensemble flood forecast techniques with the proposed framework, in which the grand-ensemble weather forecast (the TIGGE dataset, available at https://software.ecmwf.int/wiki/display/TIGGE) will be used. Effective use of ensemble flood forecasts in real-time reservoir optimal operation deserves to be further studied. It should be noted that we only considered the flood control objective, but for practical use, multiple objectives (e.g., hydropower generation, water supply, ecological water demand, navigation, etc.) can be easily incorporated within the proposed framework using the constraint method.
Author Contributions
This study was carried out through collaboration among all authors. Y.S. conceived the experiments and wrote the paper; F.Z. performed the experiments and wrote the paper; J.C. contributed to the results and discussion; J.L. analyzed the data.
Funding
This research was funded by the National Key R&D Program of China (Grant No. 2017YFC0405606), the National Natural Science Foundation of China (Grant Nos. 51579068, 51609062), the Special Fund for Public Welfare Industry of the Ministry of Water Resources of China (Grant No. 201501007), the Fundamental Research Funds for the Central Universities (Grant Nos. 2017B40614, 2018B18214), and the China Postdoctoral Science Foundation (Grant No. 2017M621612).
Conflicts of Interest
The authors declare no conflicts of interest.
References
- Zhu, F.L.; Zhong, P.A.; Xu, B.; Wu, Y.N.; Zhang, Y. A multi-criteria decision-making model dealing with correlation among criteria for reservoir flood control operation. J. Hydroinf. 2016, 18, 531–543. [Google Scholar] [CrossRef]
- Zhu, F.L.; Zhong, P.A.; Sun, Y.M.; Xu, B. Selection of criteria for multi-criteria decision making of reservoir flood control operation. J. Hydroinf. 2017, 19, 558–571. [Google Scholar] [CrossRef]
- Yeh, W.W.G. Reservoir management and operations models: A state-of-the-art review. Water Resour. Res. 1985, 21, 1797–1818. [Google Scholar] [CrossRef]
- Chou, F.N.F.; Wu, C.W. Stage-wise optimizing operating rules for flood control in a multi-purpose reservoir. J. Hydrol. 2015, 521, 245–260. [Google Scholar] [CrossRef]
- Hsu, N.S.; Huang, C.L.; Wei, C.C. Multi-phase intelligent decision model for reservoir real-time flood control during typhoons. J. Hydrol. 2015, 522, 11–34. [Google Scholar] [CrossRef]
- Jia, B.Y.; Simonovic, S.P.; Zhong, P.A.; Yu, Z.B. A multi-objective best compromise decision model for real-time flood mitigation operations of multi-reservoir system. Water Resour. Manag. 2016, 30, 3363–3387. [Google Scholar] [CrossRef]
- Zhu, F.L.; Zhong, P.A.; Wu, Y.N.; Sun, Y.M.; Chen, J.; Jia, B.Y. SMAA-based stochastic multi-criteria decision making for reservoir flood control operation. Stoch. Environ. Res. Risk Assess. 2017, 31, 1485–1497. [Google Scholar] [CrossRef]
- Zhu, F.L.; Zhong, P.A.; Sun, Y.M. Multi-criteria group decision making under uncertainty: Application in reservoir flood control operation. Environ. Model. Softw. 2018, 100, 236–251. [Google Scholar] [CrossRef]
- Kumar, A.; Sharma, M.P. Assessment of risk of GHG emissions from Tehri hydropower reservoir, India. Hum. Ecol. Risk Assess. 2016, 22, 71–85. [Google Scholar] [CrossRef]
- Kumar, A.; Sharma, M.P. A modeling approach to assess the greenhouse gas risk in Koteshwar hydropower reservoir, India. Hum. Ecol. Risk Assess. 2016, 22, 1651–1664. [Google Scholar] [CrossRef]
- Bogner, K.; Pappenberger, F. Multiscale error analysis, correction, and predictive uncertainty estimation in a flood forecasting system. Water Resour. Res. 2011, 47. [Google Scholar] [CrossRef]
- Qu, B.; Zhang, X.N.; Pappenberger, F.; Zhang, T.; Fang, Y.H. Multi-model grand ensemble hydrologic forecasting in the Fu river basin using Bayesian model averaging. Water 2017, 9, 74. [Google Scholar] [CrossRef]
- Schoups, G.; Vrugt, J.A. A formal likelihood function for parameter and predictive inference of hydrologic models with correlated, heteroscedastic, and non-Gaussian errors. Water Resour. Res. 2010, 46. [Google Scholar] [CrossRef]
- McInerney, D.; Thyer, M.; Kavetski, D.; Lerat, J.; Kuczera, G. Improving probabilistic prediction of daily streamflow by identifying Pareto optimal approaches for modeling heteroscedastic residual errors. Water Resour. Res. 2017, 53, 2199–2239. [Google Scholar] [CrossRef]
- Roy, T.; Serrat-Capdevila, A.; Gupta, H.; Valdes, J. A platform for probabilistic multimodel and multiproduct streamflow forecasting. Water Resour. Res. 2017, 53, 376–399. [Google Scholar] [CrossRef]
- Yan, B.W.; Guo, S.L.; Chen, L. Estimation of reservoir flood control operation risks with considering inflow forecasting errors. Stoch. Environ. Res. Risk Assess. 2014, 28, 359–368. [Google Scholar] [CrossRef]
- Kumar, A.; Sharma, M.P. Estimation of soil organic carbon in the forest catchment of two hydroelectric reservoirs in Uttarakhand, India. Hum. Ecol. Risk Assess. 2016, 22, 991–1001. [Google Scholar] [CrossRef]
- Rajaram, H.; Bahr, J.M.; Bloschl, G.; Cai, X.M.; Mackay, D.S.; Michalak, A.M.; Montanari, A.; Sanchez-Villa, X.; Sander, G. A reflection on the first 50 years of Water Resources Research. Water Resour. Res. 2015, 51, 7829–7837. [Google Scholar] [CrossRef] [Green Version]
- Zhu, F.L.; Zhong, P.A.; Sun, Y.M.; Yeh, W.W.G. Real-time optimal flood control decision making and risk propagation under multiple uncertainties. Water Resour. Res. 2017, 53, 10635–10654. [Google Scholar] [CrossRef]
- Chen, J.; Zhong, P.A.; Zhang, Y.; Navar, D.; Yeh, W.W.G. A decomposition-integration risk analysis method for real-time operation of a complex flood control system. Water Resour. Res. 2017, 53, 2490–2506. [Google Scholar] [CrossRef]
- Chen, J.; Zhong, P.A.; Wang, M.L.; Zhu, F.L.; Wan, X.Y.; Zhang, Y. A risk-based model for real-time flood control operation of a cascade reservoir system under emergency conditions. Water 2018, 10, 167. [Google Scholar] [CrossRef]
- Jiang, S. Application of stochastic differential equations in risk assessment for flood releases. Hydrol. Sci. J. 1998, 43, 349–360. [Google Scholar] [CrossRef]
- Li, X.; Guo, S.L.; Liu, P.; Chen, G.Y. Dynamic control of flood limited water level for reservoir operation by considering inflow uncertainty. J. Hydrol. 2010, 391, 124–132. [Google Scholar] [CrossRef]
- Chen, J.; Zhong, P.A.; Xu, B.; Zhao, Y.F. Risk analysis for real-time flood control operation of a reservoir. J. Water Resour. Plan. Manag. 2015, 141. [Google Scholar] [CrossRef]
- Chen, J.; Zhong, P.A.; Zhao, Y.F.; Xu, B. Risk analysis for the downstream control section in the real-time flood control operation of a reservoir. Stoch. Environ. Res. Risk Assess. 2015, 29, 1303–1315. [Google Scholar] [CrossRef]
- Labadie, J.W. Optimal operation of multireservoir systems: State-of-the-art review. J. Water Resour. Plan. Manag. 2004, 130, 93–111. [Google Scholar] [CrossRef]
- Xu, B.; Zhong, P.A.; Zambon, R.C.; Zhao, Y.F.; Yeh, W.W.G. Scenario tree reduction in stochastic programming with recourse for hydropower operations. Water Resour. Res. 2015, 51, 6359–6380. [Google Scholar] [CrossRef]
- Xu, B.; Boyce, S.E.; Zhang, Y.; Liu, Q.; Guo, L.; Zhong, P.A. Stochastic programming with a joint chance constraint model for reservoir refill operation considering flood risk. J. Water Resour. Plan. Manag. 2016, 143. [Google Scholar] [CrossRef]
- Bozorg-Haddad, O.; Azarnivand, A.; Hosseini-Moghari, S.M.; Loaiciga, H.A. Optimal operation of reservoir systems with the symbiotic organisms search (SOS) algorithm. J. Hydroinf. 2017, 19, 507–521. [Google Scholar] [CrossRef]
- Housh, M. Non-probabilistic robust optimization approach for flood control system design. Environ. Model. Softw. 2017, 95, 48–60. [Google Scholar] [CrossRef]
- Chen, D.; Leon, A.S.; Engle, S.P.; Fuentes, C.; Chen, Q.W. Offline training for improving online performance of a genetic algorithm based optimization model for hourly multi-reservoir operation. Environ. Model. Softw. 2017, 96, 46–57. [Google Scholar] [CrossRef]
- Liu, P.; Li, L.P.; Chen, G.J.; Rheinheimer, D.E. Parameter uncertainty analysis of reservoir operating rules based on implicit stochastic optimization. J. Hydrol. 2014, 514, 102–113. [Google Scholar] [CrossRef]
- Côté, P.; Leconte, R. Comparison of stochastic optimization algorithms for hydropower reservoir operation with ensemble streamflow prediction. J. Water Resour. Plan. Manag. 2016, 142. [Google Scholar] [CrossRef]
- Unami, K.; Abagale, F.K.; Yangyuoru, M.; Alam, A.H.M.B.; Kranjac-Berisavljevic, G. A stochastic differential equation model for assessing drought and flood risks. Stoch. Environ. Res. Risk Assess. 2010, 24, 725–733. [Google Scholar] [CrossRef]
- Camacho, R.A.; Martin, J.L.; Wool, T.; Singh, V.P. A framework for uncertainty and risk analysis in Total Maximum Daily Load applications. Environ. Model. Softw. 2018, 101, 218–235. [Google Scholar] [CrossRef]
- Joyce, J.; Chang, N.B.; Harji, R.; Ruppert, T. Coupling infrastructure resilience and flood risk assessment via copulas analyses for a coastal green-grey-blue drainage system under extreme weather events. Environ. Model. Softw. 2018, 100, 82–103. [Google Scholar] [CrossRef]
- Lam, D.; Thompson, C.; Croke, J.; Sharma, A.; Macklin, M. Reducing uncertainty with flood frequency analysis: The contribution of paleoflood and historical flood information. Water Resour. Res. 2017, 53, 2312–2327. [Google Scholar] [CrossRef]
- Cloke, H.L.; Pappenberger, F. Ensemble flood forecasting: A review. J. Hydrol. 2009, 375, 613–626. [Google Scholar] [CrossRef]
Figure 1.
Flowchart of the proposed methodology for reservoir real-time optimal operation considering inflow forecast uncertainty.
Figure 1.
Flowchart of the proposed methodology for reservoir real-time optimal operation considering inflow forecast uncertainty.

Figure 2.
Probability distribution of the relative forecast error εt.

Figure 3.
Location of the Daduhe River Basin and the flood control system.

Figure 4.
Box plot of the synthetic inflow forecasts based on α and R2. (a) α = 89.5%; (b) R2 = 91%.
Figure 4.
Box plot of the synthetic inflow forecasts based on α and R2. (a) α = 89.5%; (b) R2 = 91%.
Figure 5.
Box plot of reservoir water levels and related risks under two forecast accuracy levels. (a) α = 89.5%; (b) R2 = 91%.
Figure 5.
Box plot of reservoir water levels and related risks under two forecast accuracy levels. (a) α = 89.5%; (b) R2 = 91%.
Figure 6.
Comparison of the principle of maximum entropy (POME) distribution curve and the theoretical normal distribution curve under two forecast accuracy levels. (a) α = 89.5%; (b) R2 = 91%.
Figure 6.
Comparison of the principle of maximum entropy (POME) distribution curve and the theoretical normal distribution curve under two forecast accuracy levels. (a) α = 89.5%; (b) R2 = 91%.
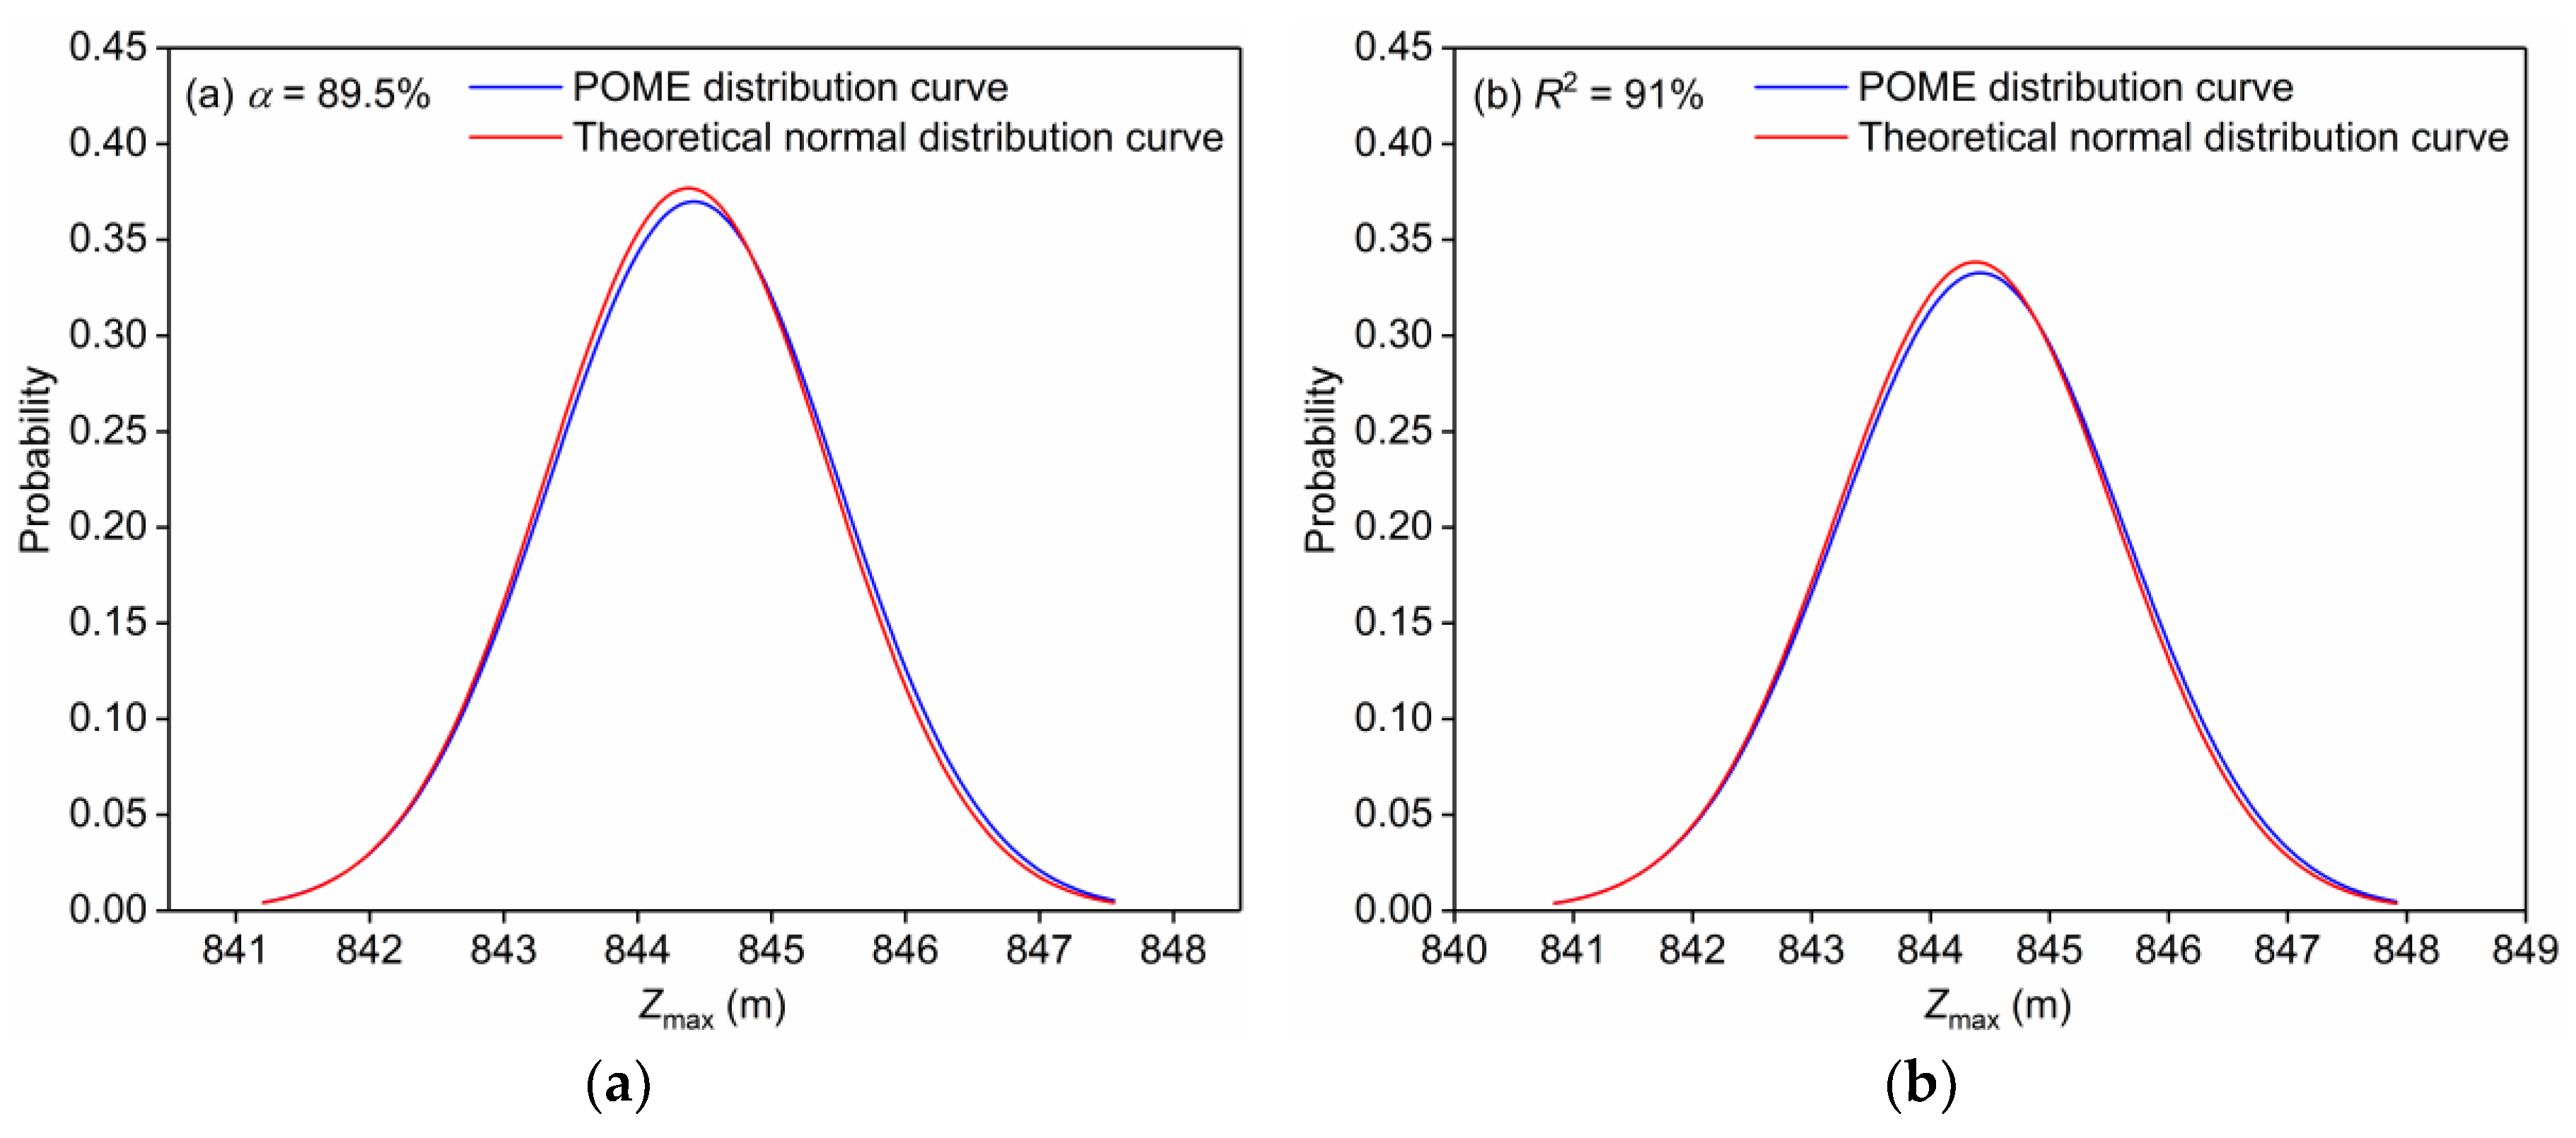
Figure 7.
P–P plot of the highest water level under two forecast accuracy levels. (a) α = 89.5%; (b) R2 = 91%.
Figure 7.
P–P plot of the highest water level under two forecast accuracy levels. (a) α = 89.5%; (b) R2 = 91%.
Figure 8.
Box plot of reservoir water levels and related risks under different forecast accuracy levels. (a) α = 95%; (b) R2 = 95%; (c) α = 85%; (d) R2 = 85%; (e) α = 75%; (f) R2 = 75%.
Figure 8.
Box plot of reservoir water levels and related risks under different forecast accuracy levels. (a) α = 95%; (b) R2 = 95%; (c) α = 85%; (d) R2 = 85%; (e) α = 75%; (f) R2 = 75%.
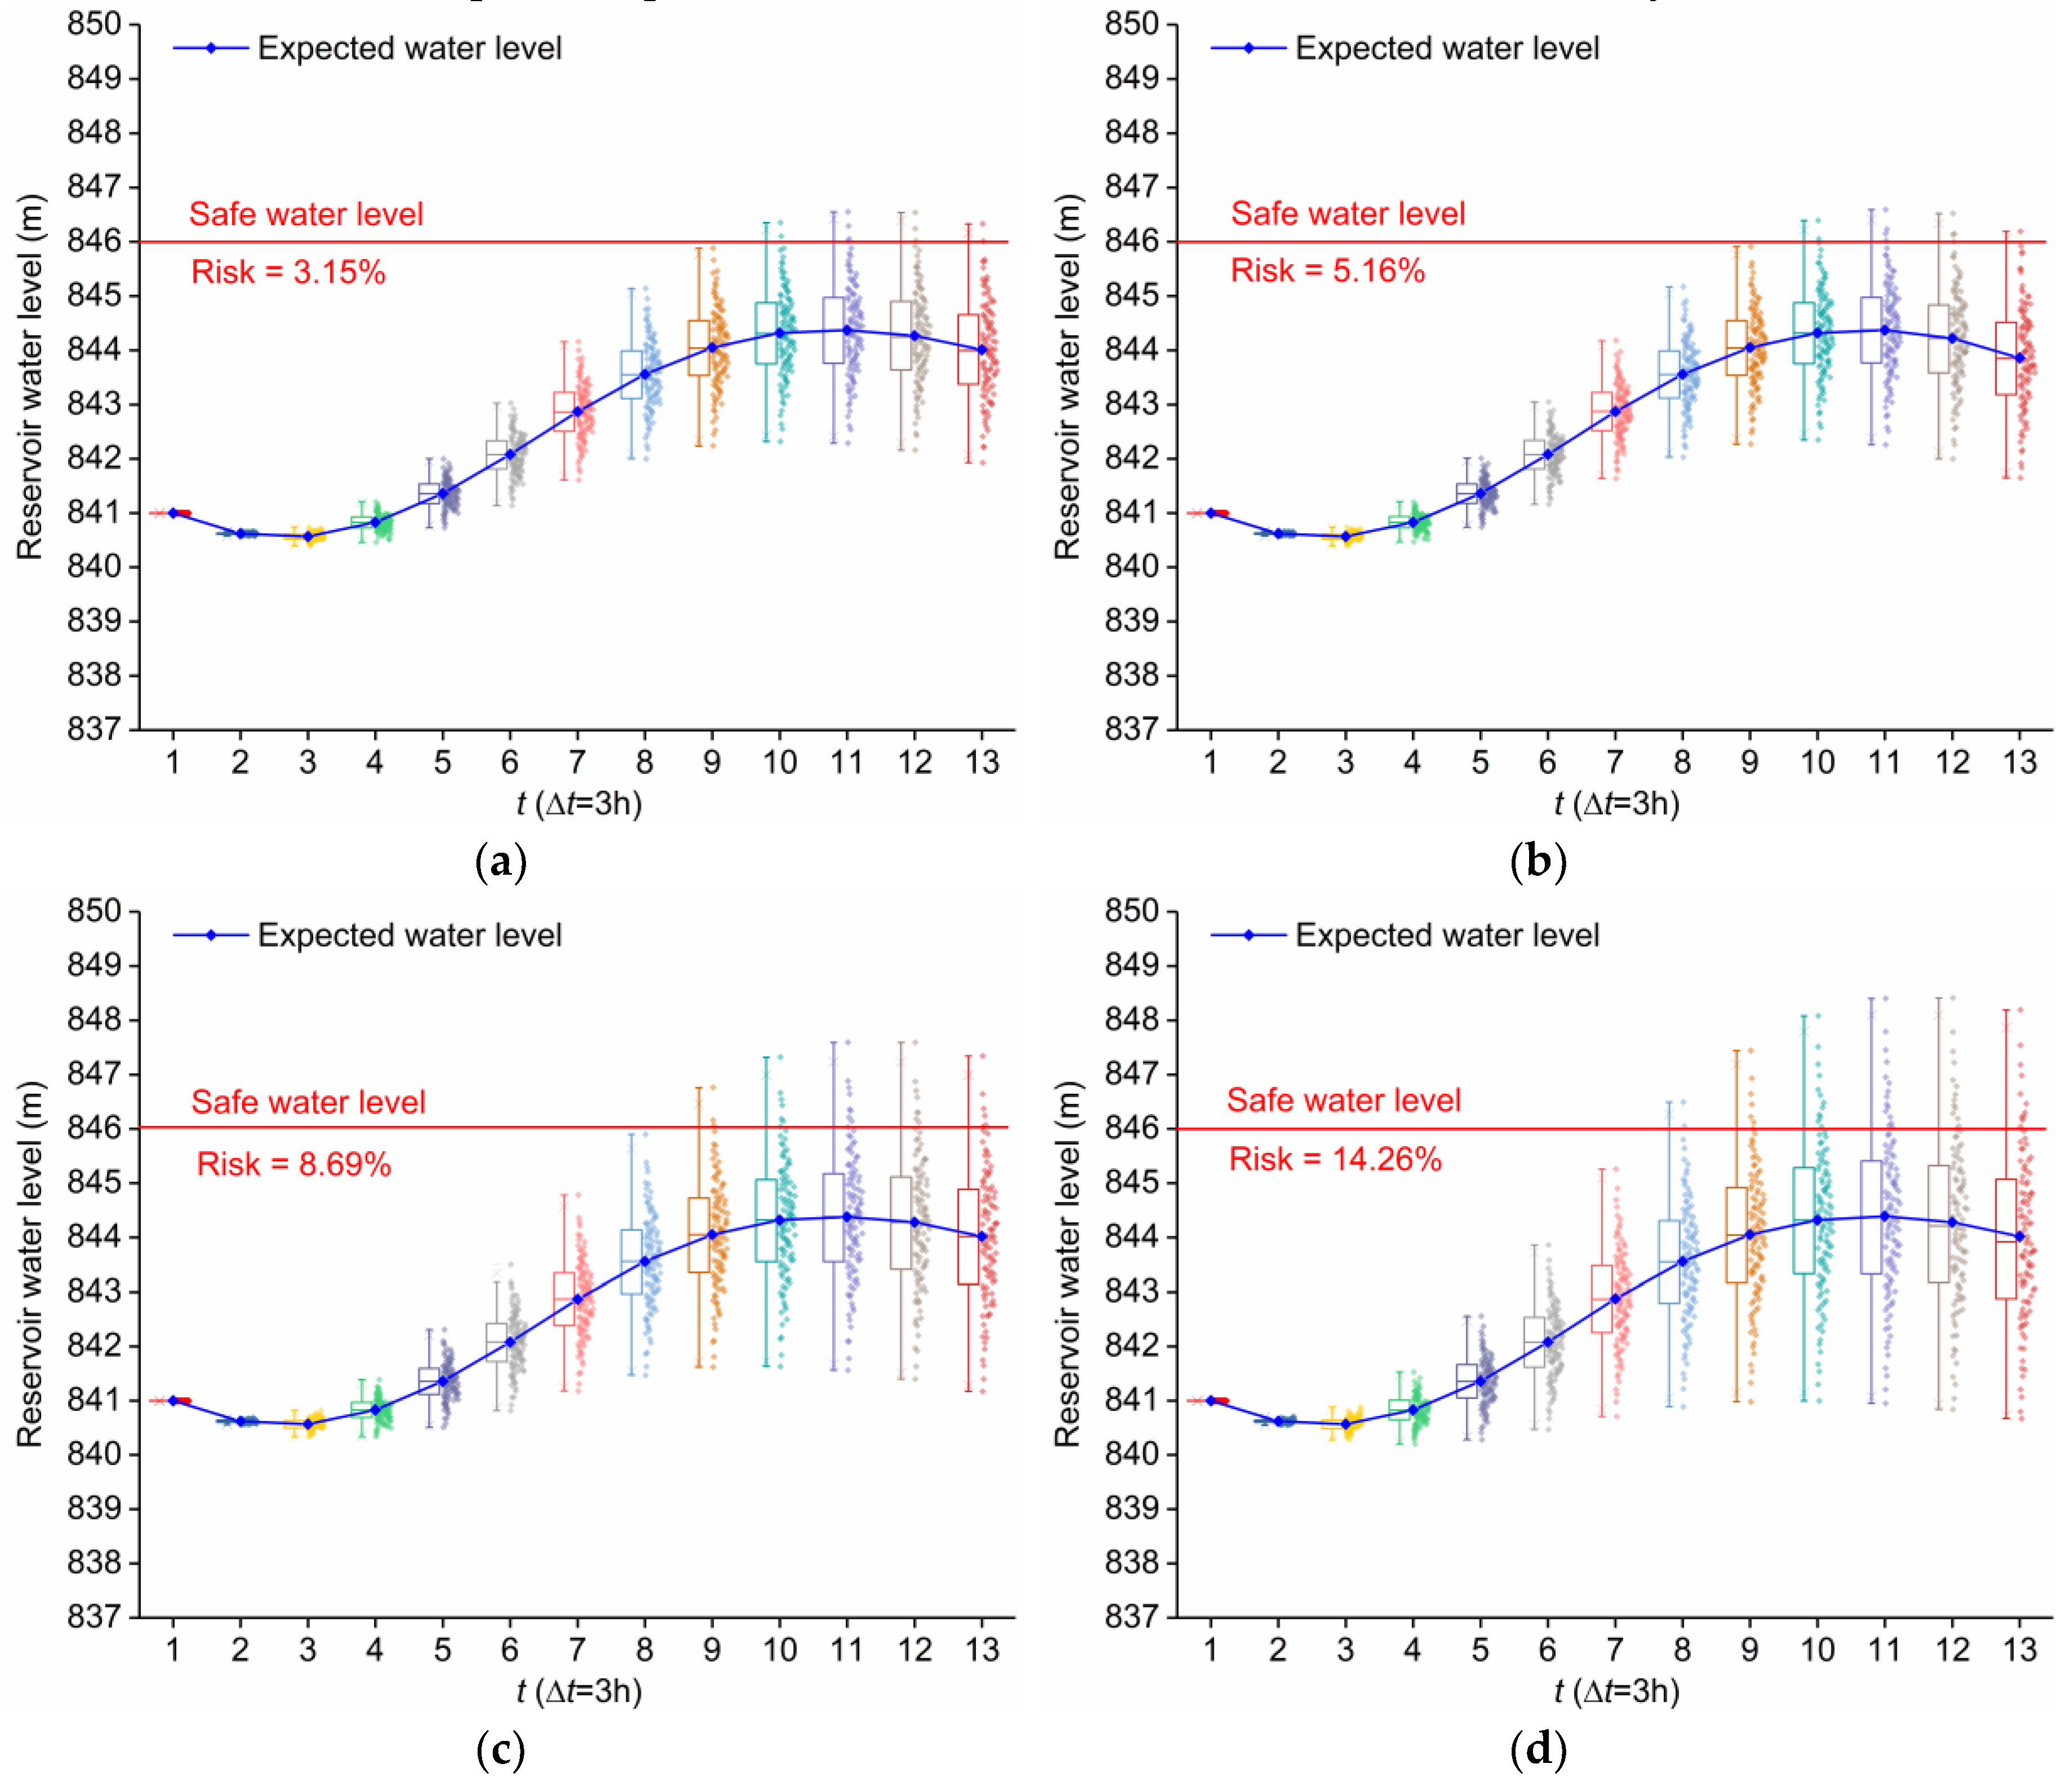
Figure 9.
The relationship between forecast accuracy level and standard deviation of inflow forecast errors.
Figure 9.
The relationship between forecast accuracy level and standard deviation of inflow forecast errors.
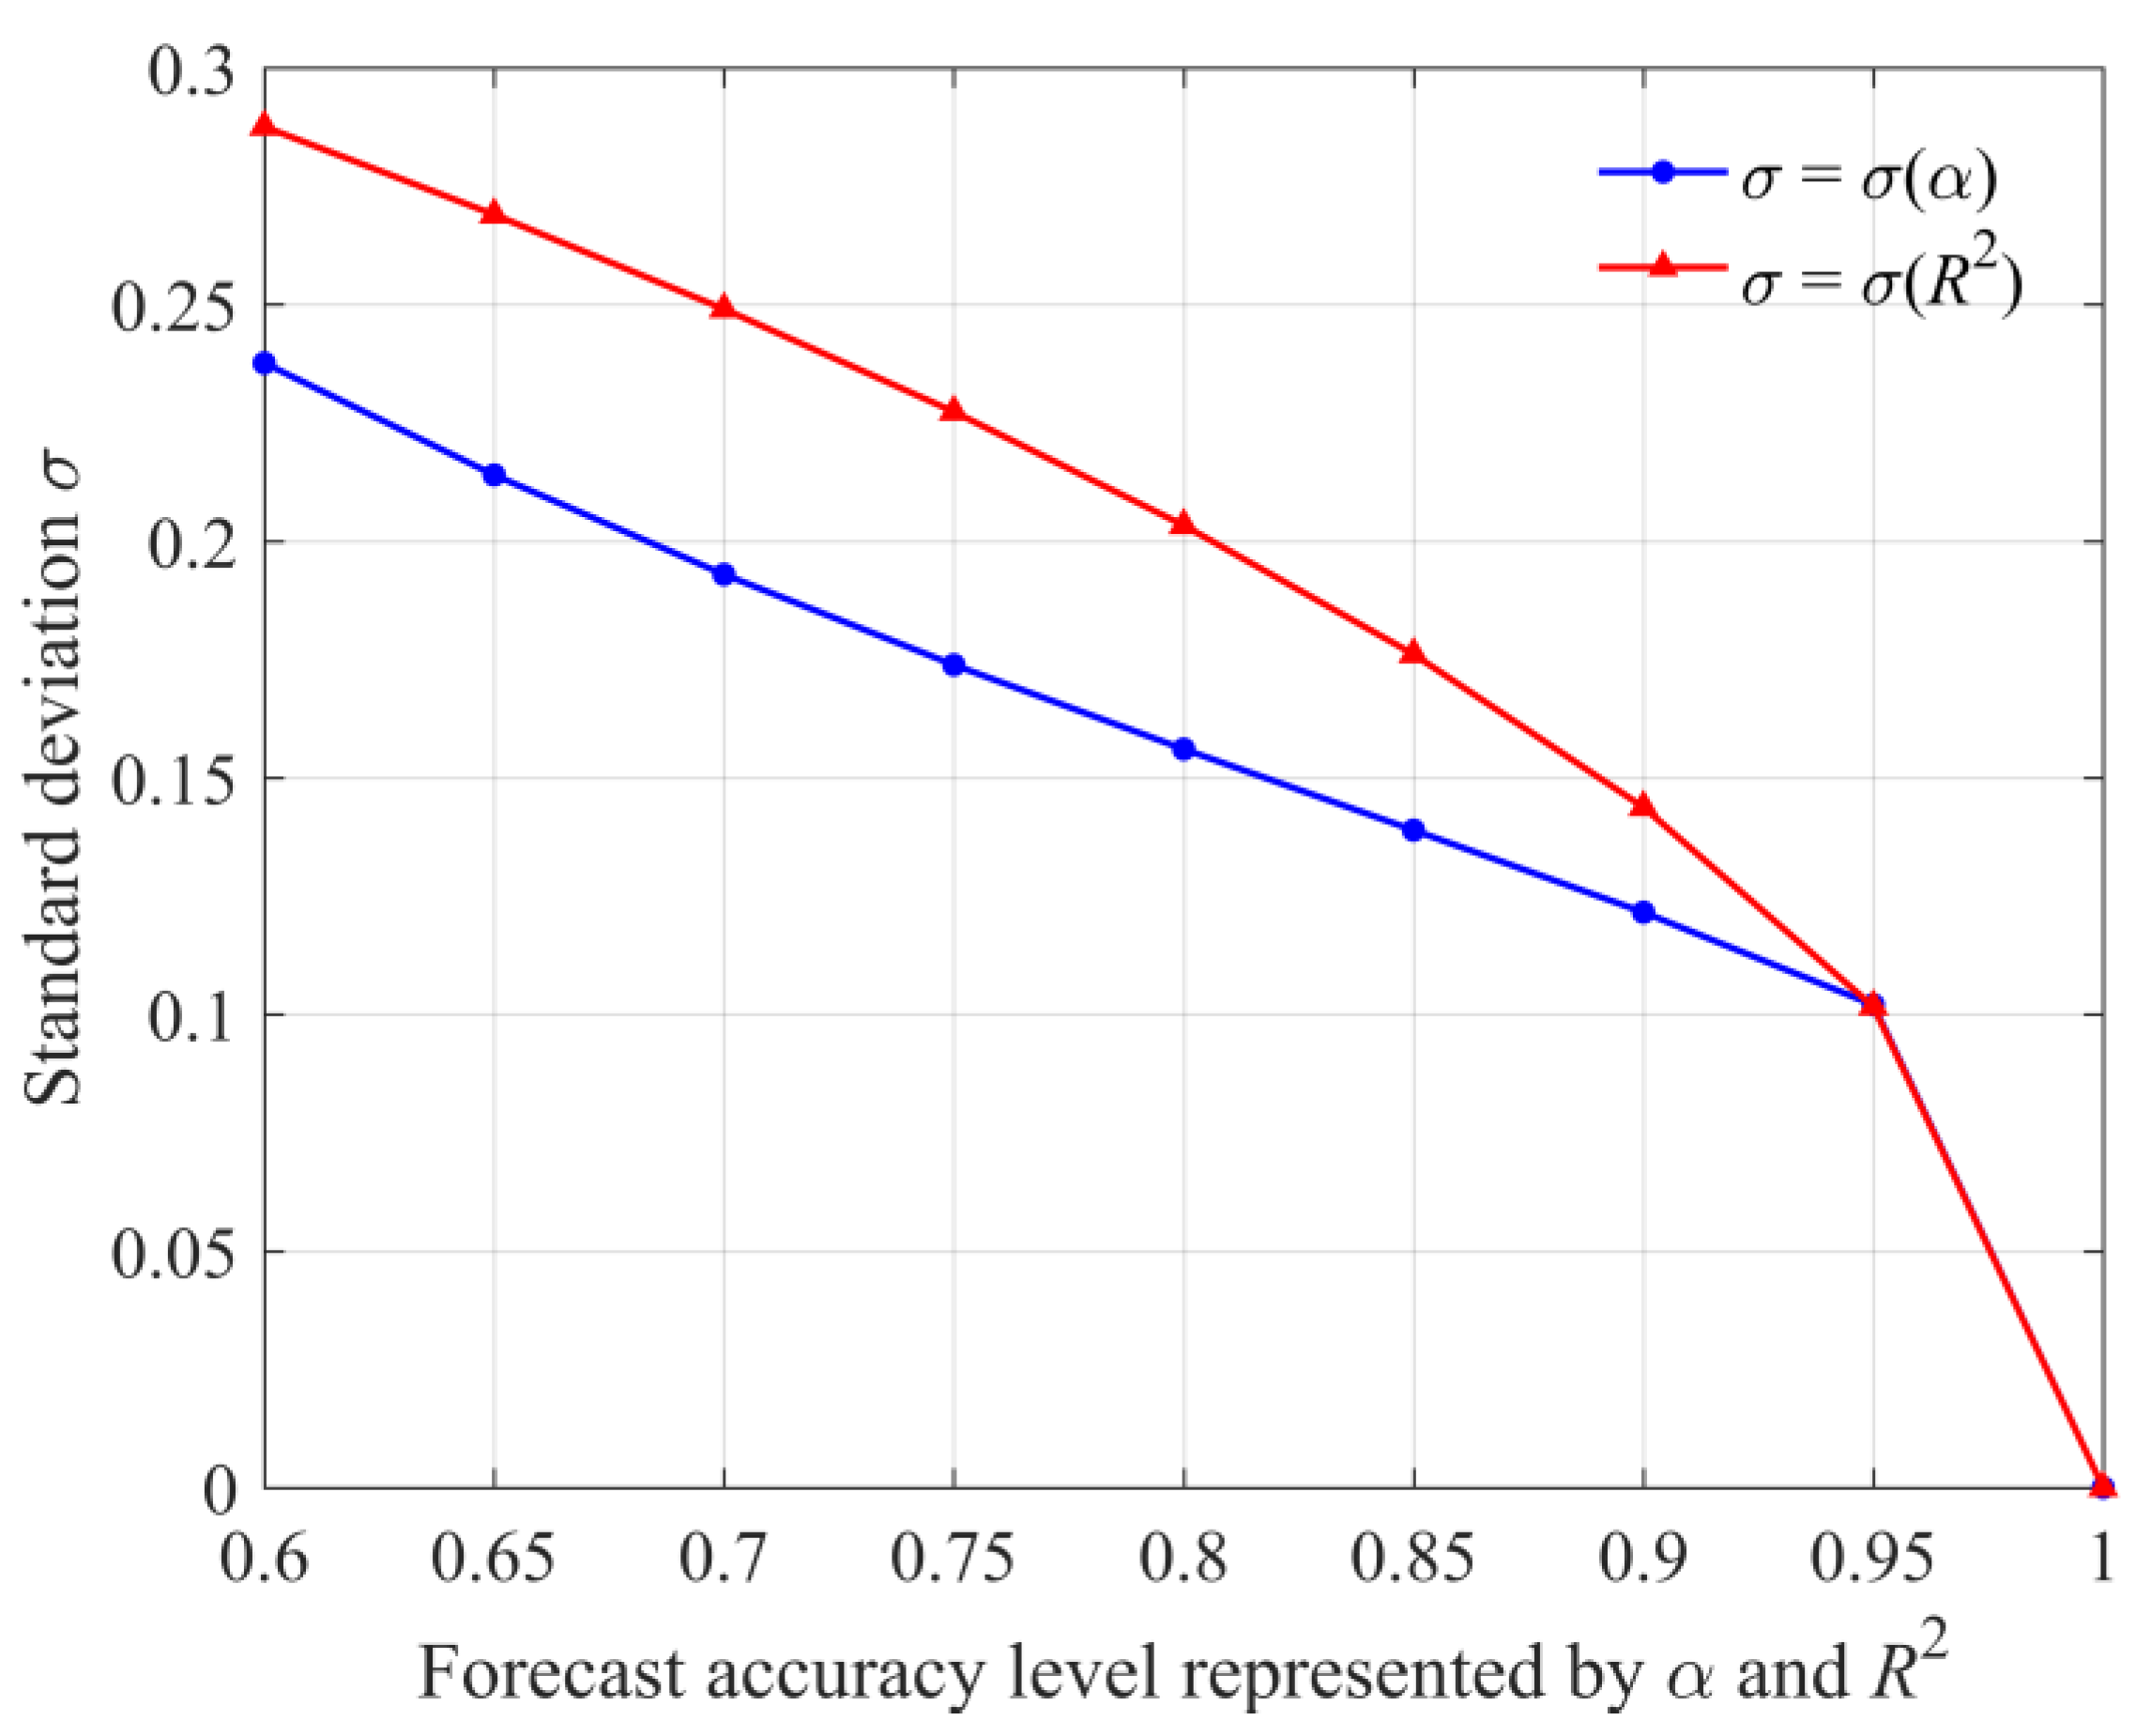
Figure 10.
Relationship between forecast accuracy level and risk.
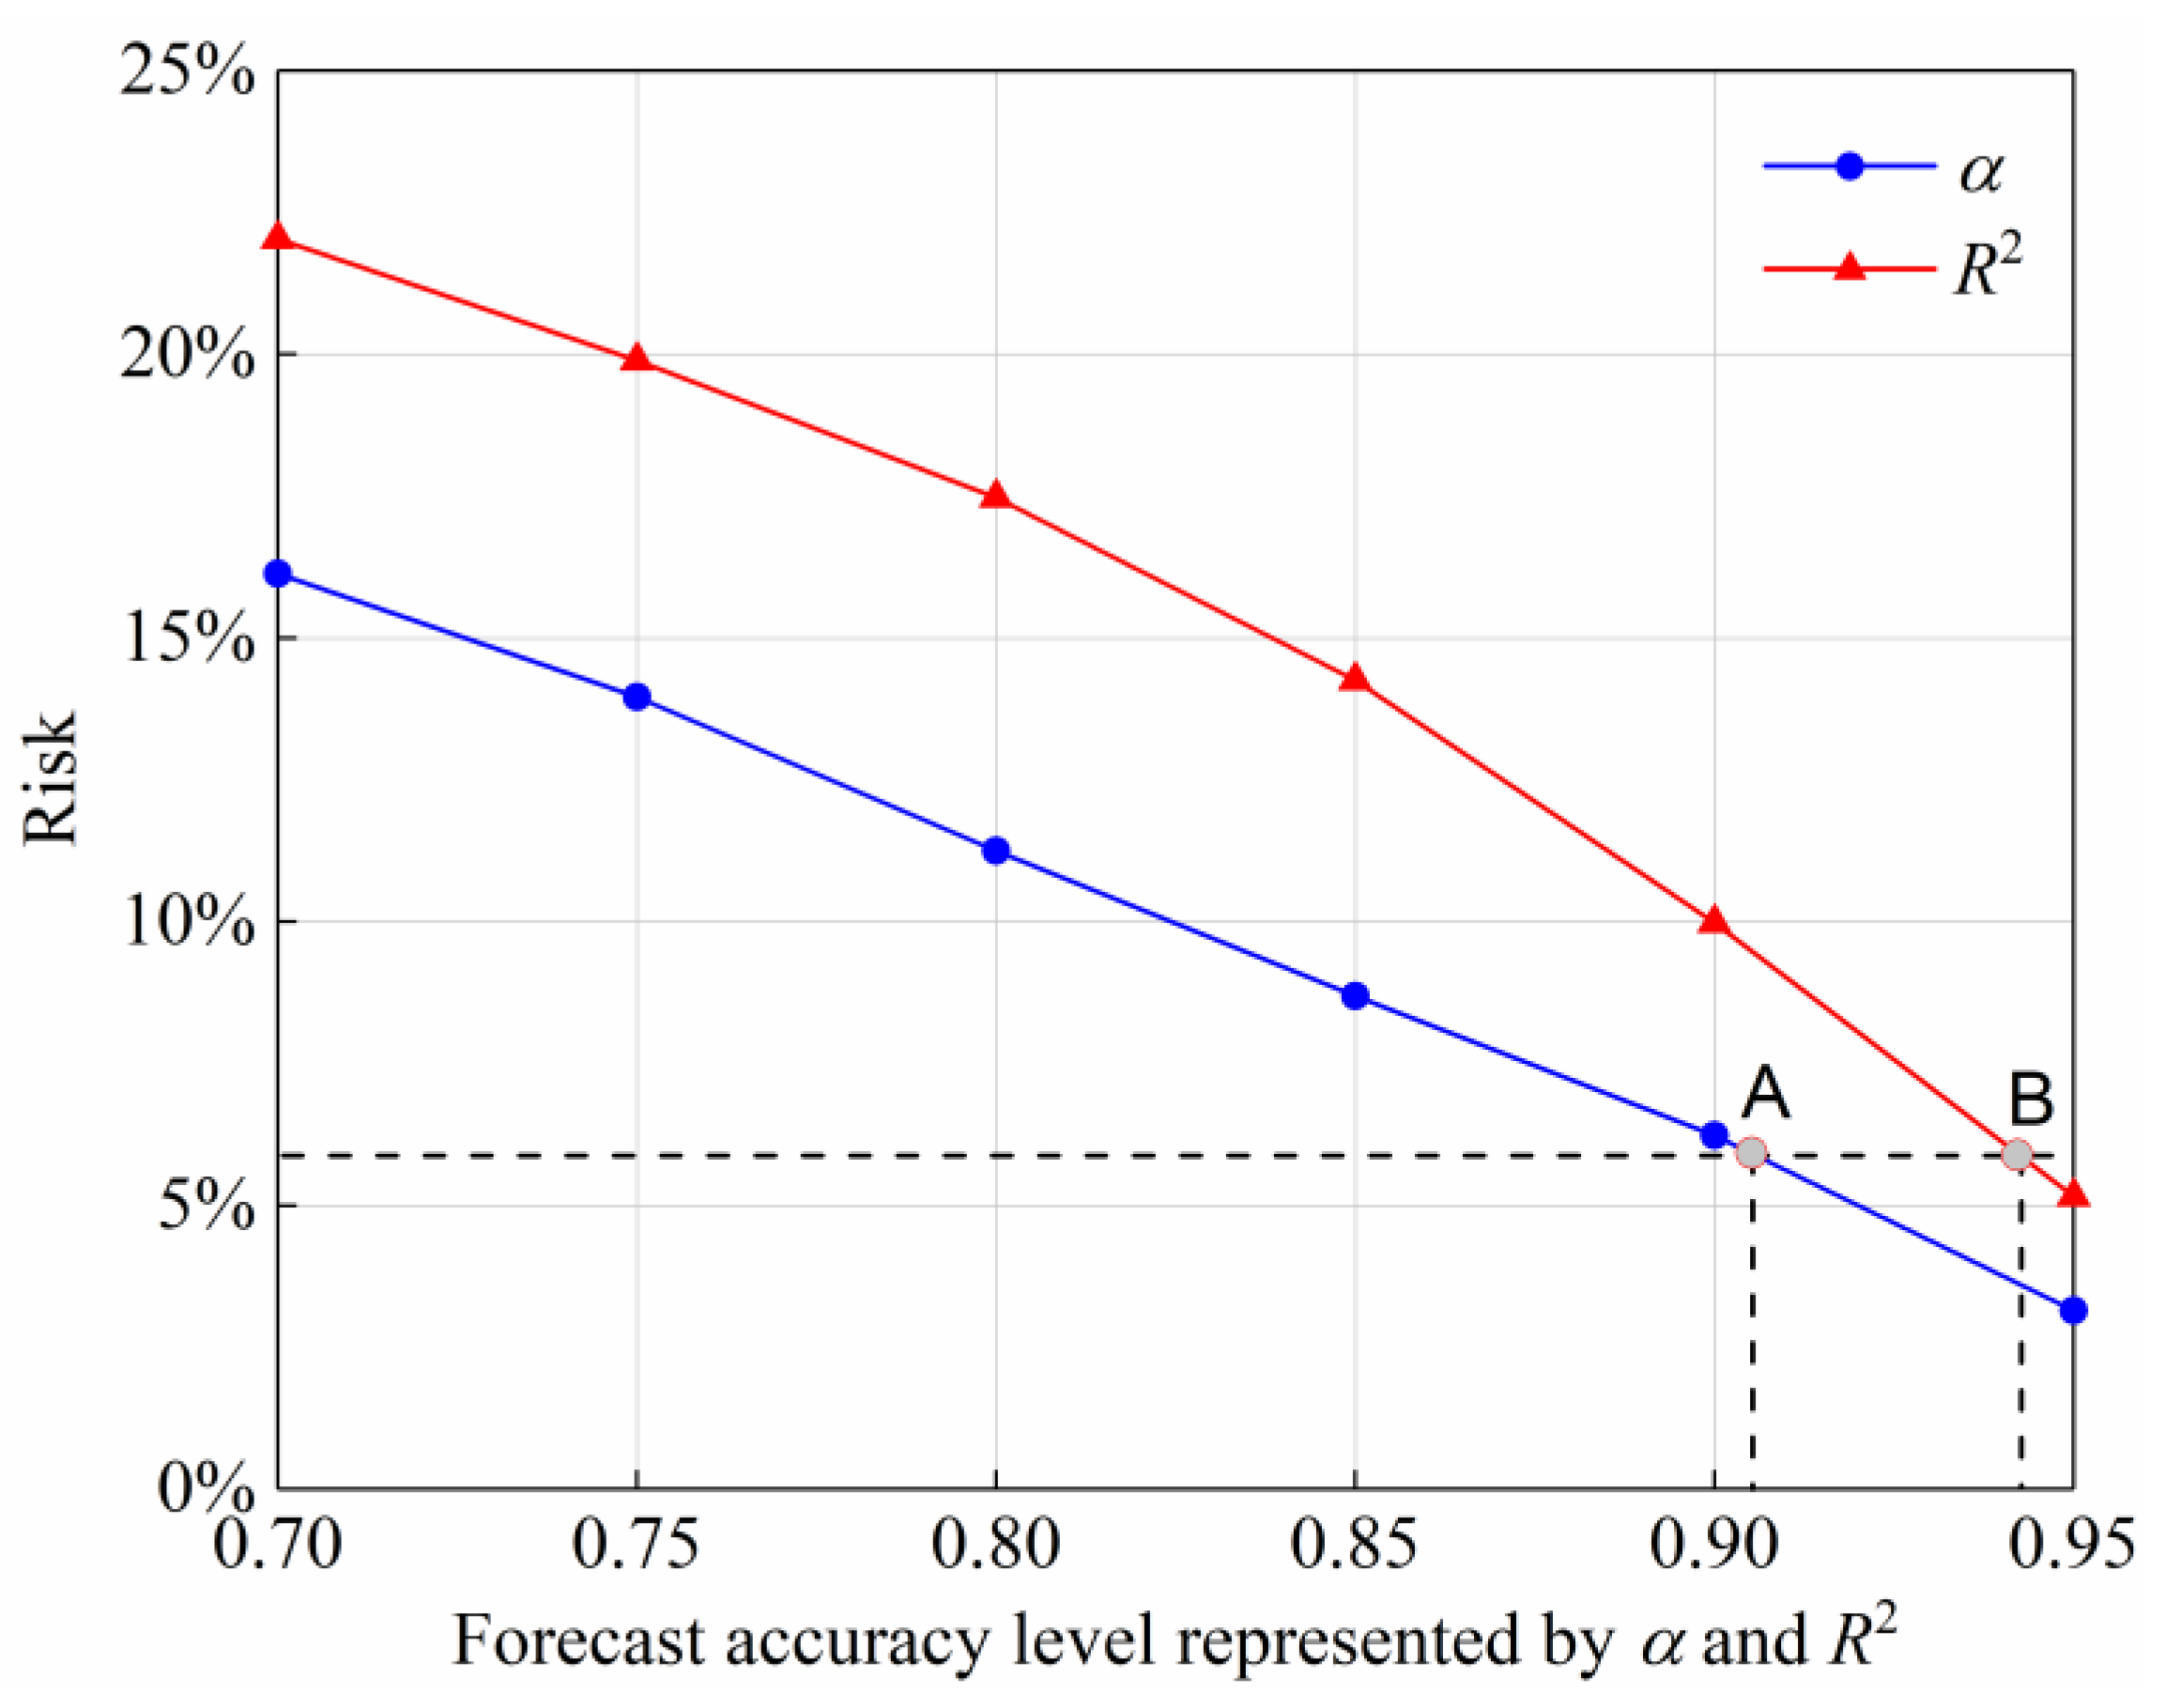
Figure 11.
Relationship between the selected safe water level and risk under different flood forecast accuracy levels. (a) Results based on α; (b) results based on R2.
Figure 11.
Relationship between the selected safe water level and risk under different flood forecast accuracy levels. (a) Results based on α; (b) results based on R2.


Table 1.
Three forecast accuracy grade levels defined by the Ministry of Water Resources of China (MWR).
Table 1.
Three forecast accuracy grade levels defined by the Ministry of Water Resources of China (MWR).
| Forecast Accuracy Metrics (%) | Grade A | Grade B | Grade C |
|---|---|---|---|
| Qualified rate | α ≥ 85 | 70 ≤ α < 85 | 60 ≤ α < 70 |
| Coefficient of determination | R2 ≥ 90 | 70 ≤ R2 < 90 | 50 ≤ R2 < 70 |
Table 2.
Main characteristics of the Pubugou reservoir.
| Parameters | Values | Parameters | Values |
|---|---|---|---|
| Crest elevation of dam | 856 m | Gross storage capacity | 53.32 × 10⁸ m3 |
| Normal water level | 850 m | Regulation storage capacity | 38.85 × 10⁸ m3 |
| Flood limit water level | 841 m | Dead storage capacity | 11.17 × 10⁸ m3 |
| Dead water level | 790 m | Installed capacity | 3300 MW |
| Designed discharge capacity | 8464 m3/s |
Table 3.
Dimensionality of the nonlinear deterministic equivalents of the scenario tree-based stochastic optimization model.
Table 3.
Dimensionality of the nonlinear deterministic equivalents of the scenario tree-based stochastic optimization model.
| Forecast Accuracy | Total Variables | Nonlinear Variables | Total Constraints | Nonlinear Constraints | Iteration Numbers | CPU Time (s) |
|---|---|---|---|---|---|---|
| α = 89.5% | 3805 | 3600 | 9901 | 3600 | 18,522 | 61.4 |
| R2 = 91% | 3805 | 3600 | 9901 | 3600 | 18,325 | 60.2 |
© 2018 by the authors. Licensee MDPI, Basel, Switzerland. This article is an open access article distributed under the terms and conditions of the Creative Commons Attribution (CC BY) license (http://creativecommons.org/licenses/by/4.0/).
Share and Cite
MDPI and ACS Style
Sun, Y.; Zhu, F.; Chen, J.; Li, J. Risk Analysis for Reservoir Real-Time Optimal Operation Using the Scenario Tree-Based Stochastic Optimization Method. Water 2018, 10, 606. https://doi.org/10.3390/w10050606
AMA Style
Sun Y, Zhu F, Chen J, Li J. Risk Analysis for Reservoir Real-Time Optimal Operation Using the Scenario Tree-Based Stochastic Optimization Method. Water. 2018; 10(5):606. https://doi.org/10.3390/w10050606
Chicago/Turabian StyleSun, Yimeng, Feilin Zhu, Juan Chen, and Jinshu Li. 2018. "Risk Analysis for Reservoir Real-Time Optimal Operation Using the Scenario Tree-Based Stochastic Optimization Method" Water 10, no. 5: 606. https://doi.org/10.3390/w10050606
Note that from the first issue of 2016, this journal uses article numbers instead of page numbers. See further details here.