Article

Quantitative Evaluation of the Impact of Climate Change and Human Activity on Runoff Change in the Dongjiang River Basin, China

1
School of Civil Engineering, Hefei University of Technology, Hefei 230009, China
2
School of Civil Engineering and Transportation, South China University of Technology, Guangzhou 510641, China
3
Center for Water Resource and Environment, Sun Yat-Sen University, Guangzhou 510275, China
4
Department of Environmental Engineering, School of Environmental Science and Engineering, Guangdong University of Technology, Guangzhou 510006, China
*
Author to whom correspondence should be addressed.
Water 2018, 10(5), 571; https://doi.org/10.3390/w10050571
Submission received: 30 March 2018 / Revised: 24 April 2018 / Accepted: 26 April 2018 / Published: 27 April 2018
(This article belongs to the Special Issue Water Quality: A Component of the Water-Energy-Food Nexus)

Abstract

:
Climate change and human activity are typically regarded as the two most important factors affecting runoff. Quantitative evaluation of the impact of climate change and human activity on runoff is important for the protection, planning, and management of water resources. This study assesses the contributions of climate change and human activity to runoff change in the Dongjiang River basin from 1960 to 2005 by using linear regression, the Soil and Water Assessment Tool (SWAT) hydrologic model, and the climate elasticity method. Results indicate that the annual temperature in the basin significantly increased, whereas the pan evaporation in the basin significantly decreased (95%). The natural period ranged from 1960 to 1990, and the affected period ranged from 1991 to 2005. The percentage of urban area during the natural period, which was 1.94, increased to 4.79 during the affected period. SWAT modeling of the Dongjiang River basin exhibited a reasonable and reliable performance. The impacts induced by human activity on runoff change were as follows: 39% in the upstream area, 13% in the midstream area, 77% in the downstream area, and 42% in the entire basin. The impacts of human activity on runoff change were greater in the downstream area than in either upstream and midstream areas. However, the contribution of climate change (58%) is slightly larger than that of human activity (42%) in the whole basin.

1. Introduction

Extreme weather and climate events have occurred frequently in recent decades because of global warming. Intense rainfall and changing runoff have attracted considerable attention worldwide [1,2,3] as flooding induced by intense rainfall can result in significant loss to human beings [4,5,6].
Rainfall and runoff patterns are attributed to numerous factors, with climate change and human activity being two of the major ones [7,8,9]. Given these observations, three main viewpoints can be concluded: (1) climate variability is more dominant in runoff change [10,11,12,13,14,15]; (2) human activity is more significant [16,17,18,19,20]; and (3) the effects of the two factors vary in different areas during different periods [21]. Kelly et al. [22] suggested that a warming climate would lead to an increase in environmental melting and the disappearance of surface hail, which might cause hail damage and increase flood risk; Sterling et al. [23] indicated that human activity could considerably affect evapotranspiration, which is one of the factors for runoff change on the basis of a water balance equation. These findings indicate that land use change induced by human activity on water cycle should not be ignored. Lu et al. [24] considered that both climate variability and human activity played key roles in the hydrologic system as they changed over time. Regardless, either viewpoint acknowledges that runoff has undergone significant alteration under either climate change or human activity in recent decades. Therefore, the quantitative assessment of the impact of climate variability and human activity on runoff change is important for water resource planning and management.
The importance of the topic has led to the application of many effective methods for assessing the influence of climate change and human activity on runoff. Statistical methods have been used to analyze the sensitivity of runoff to precipitation and potential evapotranspiration under climate change [25,26,27,28]. Generally, these statistical methods are sufficiently convenient and efficient; however, they fail to reflect the actual hydrologic progress and tend to describe the relation between factors and runoff as a simple linear relationship. The climate elasticity method, another simple method, has developed rapidly in recent years [29,30]. Although this approach requires less data, its accuracy requires improvement. The numerical model is another technique for simulating runoff change caused by climate variability or human activity, such as the Soil and Water Assessment Tool (SWAT) model [31,32,33], the Variable Infiltration Capacity (VIC) model [34,35,36], the Hydrologic Engineering Center’s-Hydrologic Modeling System (HEC-HMS) [37,38], and the Generalized Watershed Loading Function (GWLF) [39,40]. These models may require a large amount of data and hefty workload, but they can reflect the hydrologic process and obtain adequately accurate results, rendering them a good choice for analyzing the contribution of climate change and human activity to runoff change [1].
As a major tributary of the Pearl River (southern China), the Dongjiang River basin has frequently experienced flooding and drought in recent years because of climate or land use change [41,42,43]. Several studies have shown the significantly change induced by climate in the Pearl River basin over the past 50 years, including a temperature increase of 0.38 °C/10a [44], suggesting that climate change can also alter runoff in Dongjiang River; the climate change projection has indicated the precipitation and temperature may show unstable change during 2021–2100 in southern China, which may also influence the Dongjiang River [45]. In addition, the intensity of human activity in this basin varies and exhibits a gradient development trend—a gradual increase from the upstream area to the downstream area [42,46]; that is, the impact of human activity in the downstream area is larger than those in the upstream and midstream areas, causing a variation in the effects of human activity on different river sections. However, the quantitative impact of climate change and human activity on runoff in the Dongjiang River basin has yet to be clearly determined and presents a challenging topic for the planning and management of water resources in a gradient development basin.
Thus, the major objective of this study was to assess the quantitative impact of climate change and human activity on runoff in the Dongjiang River basin. To achieve this goal, we first used the Mann–Kendall (M–K) test to determine the abrupt point of hydrologic progress; second, we applied the three methods (i.e., linear regression, hydrologic model, and climate elasticity method) to quantitatively analyze runoff change; third, we used the Nash–Sutcliffe efficiency coefficient (Ens) and correlation coefficient (Cor) to validate the accuracy of the simulated results; and finally, we explained how human activity could impact runoff change. The results of this study aimed to provide a comprehensive understanding of the impact of climate and land use change on runoff in a gradient development basin and to provide a reference for water resource management in the Dongjiang River basin.

2. Study Area and Data
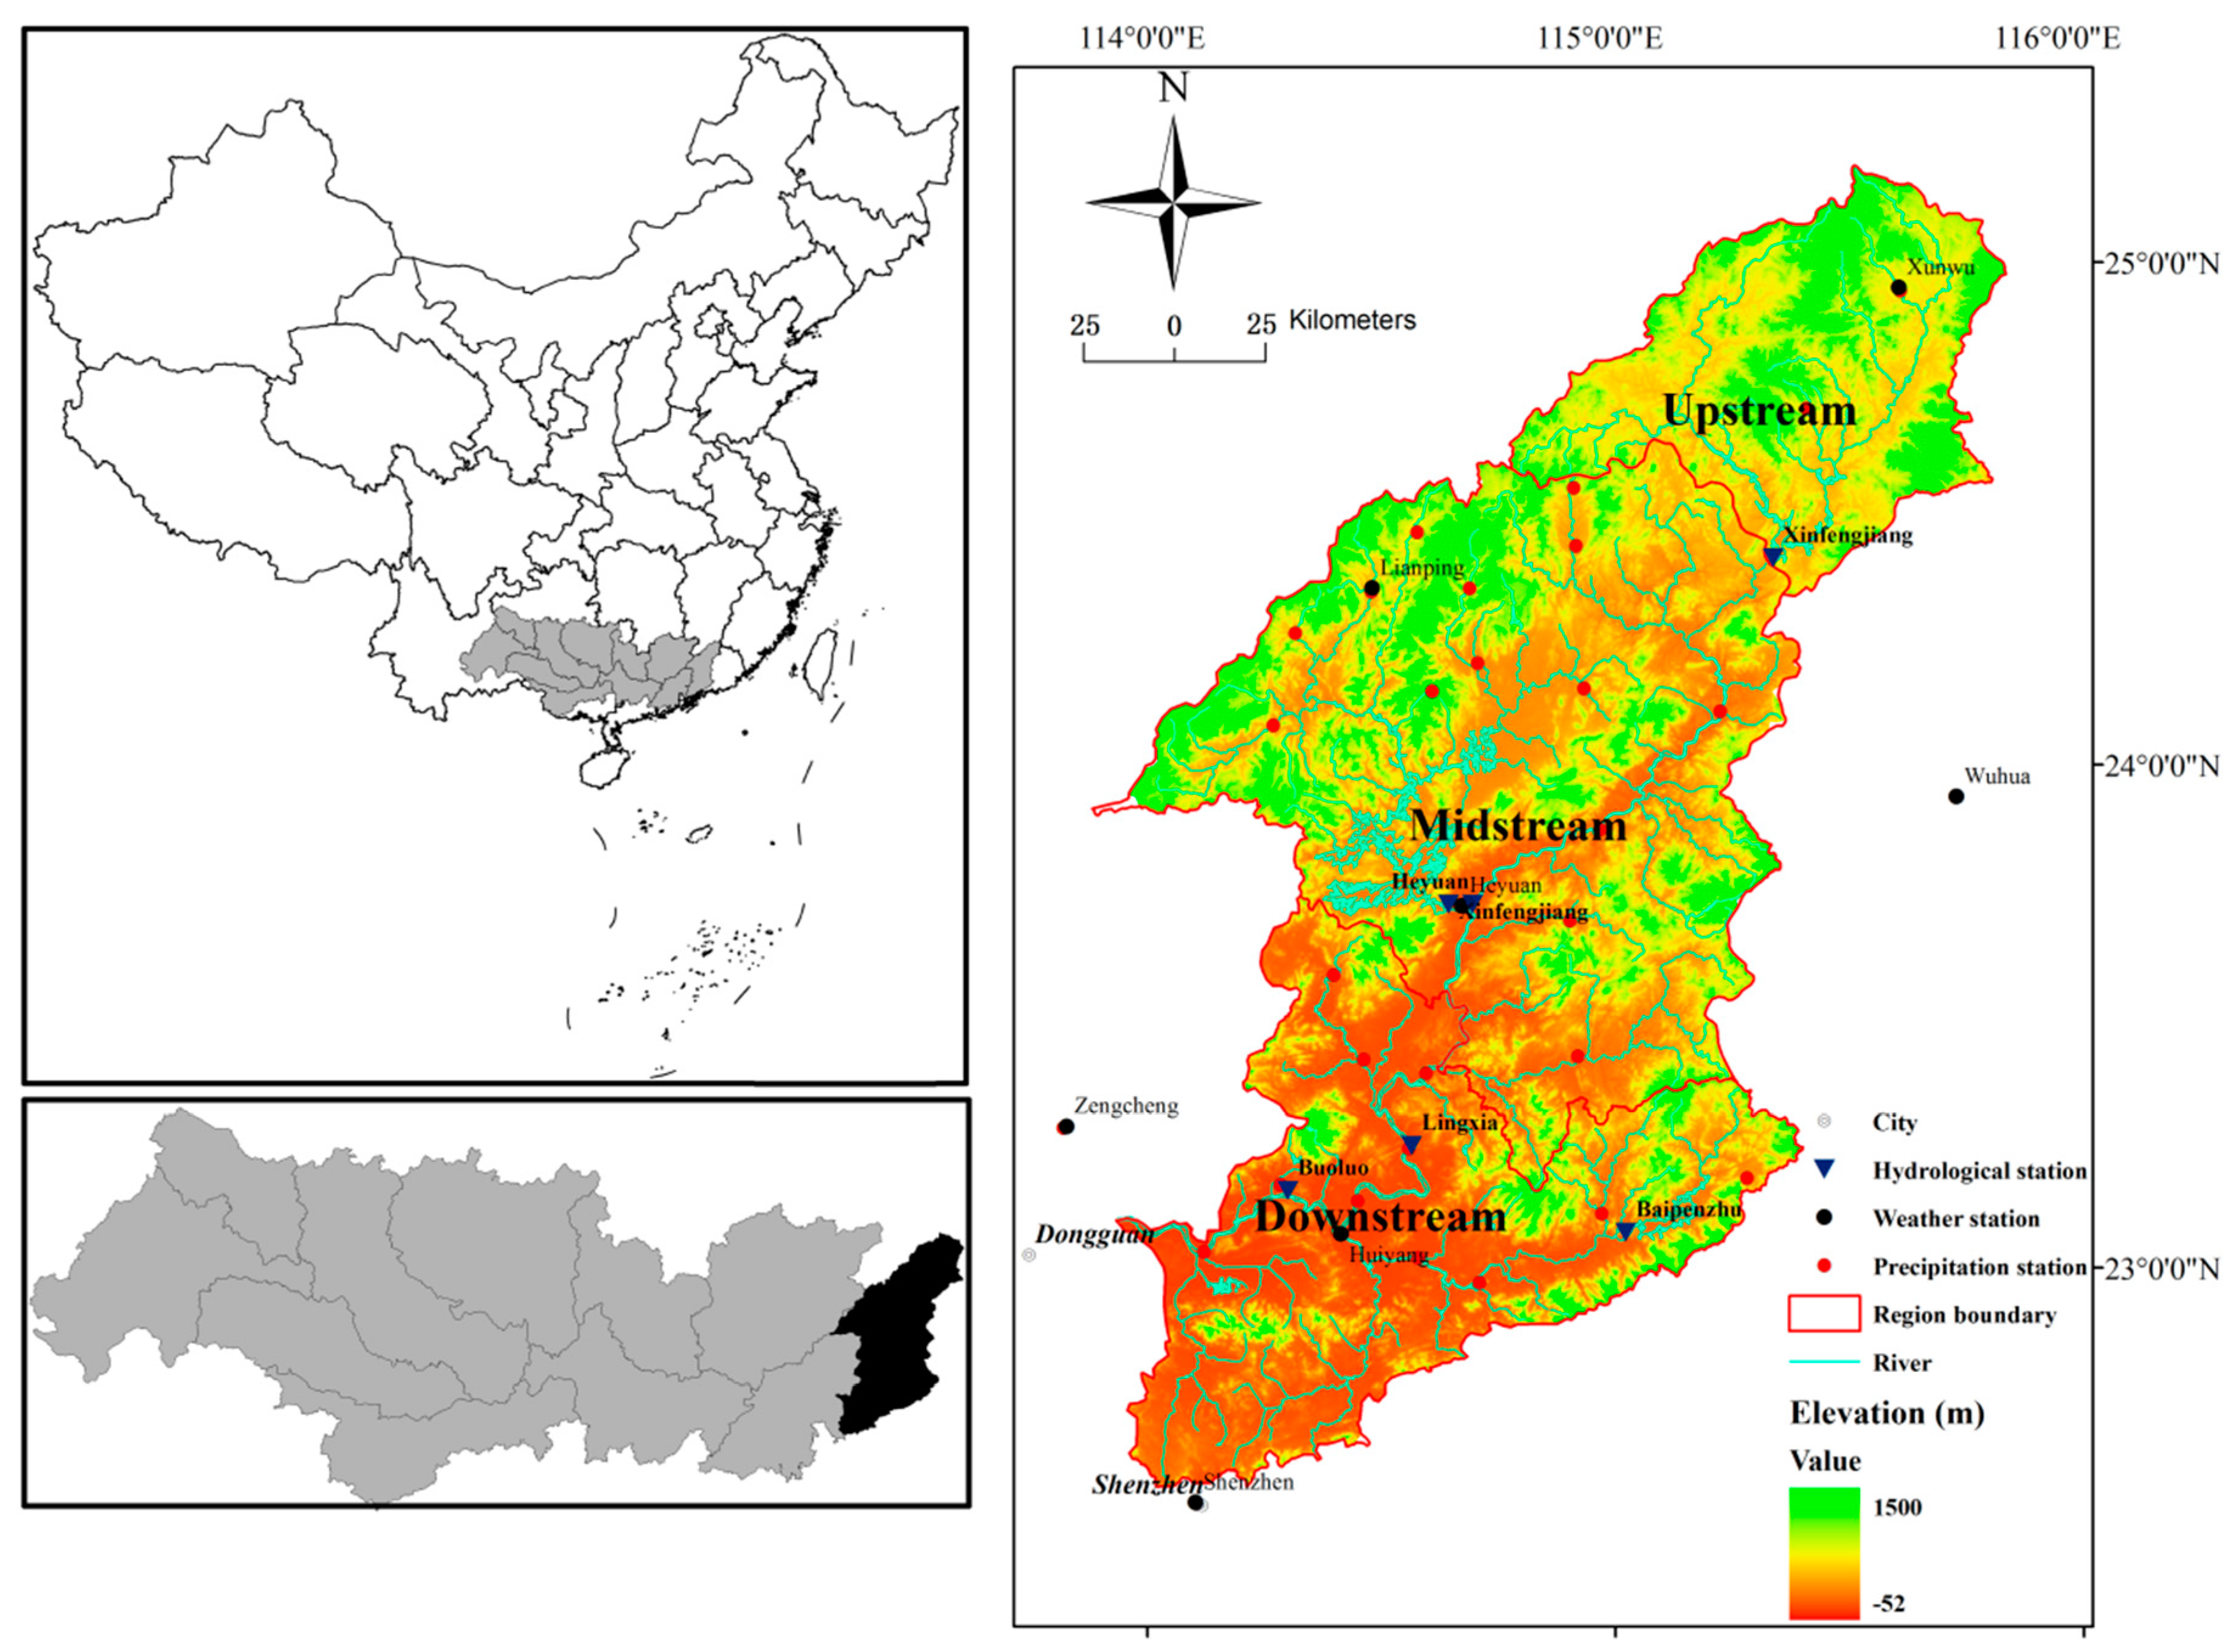
2.1. Study Area

The Dongjiang River basin is located northeast of the Pearl River basin between 113°52′–115°52′ E and 22°38′–25°14′ N. The river originates from Yajibo Mountain and flows into Canton Province from northeast to southwest, with a total catchment area of 27,040 km2 [42], as shown in Figure 1. This basin has a subtropical climate with a mean annual precipitation of 1750 mm and a mean annual temperature of 21 °C. Vegetation in the Dongjiang River basin is generally satisfactory, except for some local areas. The forest is the major land use type, whereas the urban area shows a rapid expansion, especially in the downstream areas.
For convenience, we divided the Dongjiang River basin into three areas: the upstream, midstream, and downstream areas, as shown in Figure 1. The quantity and quality of water are regarded as major concerns in the Dongjiang River basin, which is the most important source of fresh water in major cities in the Pearl River Delta, such as Hong Kong, Guangzhou, Shenzhen, and Dongguan. Meanwhile, a mismatch between supply and demand becomes increasingly serious because of rapid population expansion and urbanization, particularly in the downstream area of the basin. By contrast, the upstream and midstream areas in this basin, featuring a vast rice field and forest land, develop relatively slowly.

2.2. Data

A digital elevation model at a resolution of 90 m, which was downloaded from the U.S. Geological Survey (USGS) website (http://www.usgs.gov/), was used to extract topographic information, such as the elevation and slope for the hydrological model. Land use data at a resolution of 30 m covered the year 1990 and 2010 (Figure 2), and soil type data were provided by the Data Center for Resources and Environmental Sciences, Chinese Academy of Sciences (http://www.resdc.cn), and the Food and Agriculture Organization of the United Nations (FAO) (http://www.fao.org/home/en/). All spatial data were converted into the same geographic coordinates and projections.
The continuous daily time series data from 1960 to 2005 at seven weather stations, including Lianping, Xunwu, Heyuan, Huiyang, Wuhau, Shenzhen, and Zengcheng stations, were downloaded from the China Meteorological Administration (http://www.cma.gov.cn/). Such dataset consisted of humidity, precipitation, temperature, wind speed, and pan evaporation. Moreover, 32 precipitation stations and 6 hydrologic stations (Fengshuba, Xinfengjiang, Heyuan, Lingxia, Baipenzhu, and Boluo) with monthly runoff data were provided by Guangdong Hydrology Administration (http://www.gdsw.gov.cn/).

3. Methodology

3.1. Variation Trend Analysis

Linear regression was used to analyze the temperature, precipitation, and pan evaporation trends in the Dongjiang River basin in order to evaluate climate change trends. This study quantitatively assessed the impact of climate change and human activity on runoff mainly by contrasting two different periods: the natural period and the affected period. The natural represents the period when runoff is limitedly influenced by human activity, whereas the affected period represents the period when runoff is considerably changed by human activity. Thus, the abrupt point has to be detected to divide the time series into two periods. We used the M–K test to achieve this objective.
The M–K test is one of the most commonly used methods for abrupt point analysis. Owing to its robustness to outliers and solution to missing data, the M–K test exhibits numerous applications [47,48,49]. First, Sk is defined as a variable by using the M–K test, as follows:
S k = i = 1 k r i                                         k = 2 ,   ,   n ,
r i = { 1             x j < x i 0               x j x i                     j = 1 , ,   i ,
where x i and x j are the hydrologic variables when the time series data are i and j, and S k is the counts for x series when x i is larger than x j .
Subsequently, UFk is used to evaluate the positive sequence of the variable x:
U F k = S k E ( S k ) V a r ( S k )                     k = 1 ,   , n ,
where E ( S k ) and V a r ( S k ) represent the mean and variance of S k , respectively.
The time series is reversed and the aforementioned procedure is repeated to yield UBk in order to evaluate the inverted sequence.
Lastly, UFk and UBk curves are generated. If these two curves intersect, and the U value of the intersection satisfies | U | < 1.96 , then that point can be regarded as the abrupt point with a confidence interval of 0.05. As the time series of precipitation, temperature, and pan evaporation meet the conditions required by M–K test, we used this method to detect the abrupt points of the three series.

3.2. Evaluation of Climate and Human Activity Contribution

3.2.1. Linear Regression

As the easiest and the most fundamental technique, linear regression was proposed by Jiang et al. [50] to analyze the sensitivity of monthly runoff to precipitation and potential evapotranspiration:
Q i = a P i + b P i 1 + c P E T i + d
where Qi, Pi, Pi−1, and PETi represent monthly runoff, precipitation at month i, precipitation at month i − 1 and potential evapotranspiration at month i, respectively; PETi is calculated using the Penman formula. We then used the data corresponding to the natural period to evaluate coefficients a, b, c, and d on the basis of least square estimation. The coefficients were then applied in Equation (4) to simulate the monthly runoff during the affected period. The contributions of climate and human activity could be determined using the following equations:
Δ Q c l i m a t e = | O n ¯ S m ¯ |
Δ Q h u m a n = | O m ¯ S m ¯ |
Δ Q t o t a l = Δ Q c l i m a t e + Δ Q h u m a n
R a t e c l i m a t e = Δ Q c l i m a t e Δ Q t o t a l × 100 %
R a t e h u m a n = Δ Q h u m a n Δ Q t o t a l × 100 %
where Δ Q c l i m a t e , Δ Q h u m a n , and Δ Q t o t a l represent the runoff change influenced by climate, human activity, and the total, respectively; O ¯ and S ¯ denote the monthly average of the observed runoff and that of the simulated runoff. The subscripts n and m denote runoff during the natural period and runoff during the affected period. Rateclimate and Ratehuman are the effects of the rate of climate change and human activity on runoff. The aforementioned equations can quantitatively analyze the impacts of runoff change induced by climate change and human activity.

3.2.2. Hydrologic Simulation

The relation between runoff and hydrologic variables, such as precipitation and potential evapotranspiration, cannot be simply described by linear regression. Thus, many hydrologic models have been proposed for accurate simulation. As a hydrologic model, SWAT was chosen to simulate runoff change in this study.
This model included numerous parameters, and calibrating them would involve a hefty amount of workload and would be unnecessary because the errors in the observed data and model would result in a number of parameter uncertainties. Therefore, this study used the sensitivity of the SWAT model to determine some of the most sensitive parameters. We then calibrated the chose parameters based on the data during the natural period and simulated the monthly runoff during the affected period. The impact of climate and human activity on runoff change can thus be calculated using Equations (5)–(9).
Three indexes—the Nash–Sutcliffe efficiency coefficient (Ens), relative error (Re), and coefficient of determination (R2)—were selected to evaluate the simulated results. The indexes are calculated as follows:
E n s = 1 ( Q o Q s ) 2 ( Q o Q o ¯ ) 2
R e = ( Q s Q o ) 2 Q o × 100 %
  R 2 = ( ( Q o Q o ¯ ) ( Q s Q s ¯ ) ) 2 ( Q o Q o ¯ ) 2 ( Q s Q s ¯ ) 2
where Q o and Q s are the monthly observed runoff and the monthly simulated runoff respectively;   Q o ¯ and Q s ¯ are the average observed runoff and the monthly observed runoff, respectively.

3.2.3. Climate Elasticity Method

This study also used the climate elasticity method to quantitatively analyze the impacts of climate change and human activity on runoff. Hu et al. [51] proposed that runoff change can be expressed as a function of climate change and human activity:
Δ R = Δ R C + Δ R H
where Δ R C and Δ R C are the runoff changes caused by climate and human activity respectively; Δ R represents total runoff change, calculated as follows:
Δ R = R n + R m
where R n and R m represent the observed runoff during the natural period and the affected period, respectively.
Runoff sensitivity to climate variation can then be assessed using the climate elasticity method [30]. Runoff change caused by climate can be expressed based on precipitation and potential evapotranspiration:
Δ R C = ε p R P Δ P + ε P E T R P E T Δ P E T
where ∆P and ∆PET denote the changes in precipitation and potential evapotranspiration; ε p and ε P E T are the elastic coefficients of precipitation and potential evapotranspiration, which represent the sensitivities of runoff change and can be expressed as follows:
ε p = 1 + ϕ F ( ϕ ) 1 F ( ϕ )
ε P E T = ϕ F ( ϕ ) 1 F ( ϕ )
ε p + ε P E T = 1
where   ϕ represents the dryness coefficient, given by ϕ = P E T / P . Zhang et al. [52] suggested that F ( ϕ ) and F ( ϕ ) . are expressed as follows:
F ( ϕ ) = 1 + ω ϕ 1 + ω ϕ + 1 ϕ
F ( ϕ ) = ω + 2 ω ϕ 1 + 1 ϕ 2 ( 1 + ω ϕ + 1 ϕ ) 2
where ω . is the plant available water capacity coefficient, and it ranges between 0.01 and 2.0. The coefficient can be estimated using Excel with a 0.01 increment according to the following equation:
E P = 1 + ω × P E T P 1 + ω × P E T P + P P E T
where E, P, and PET are the average annual evapotranspiration, precipitation, and potential evapotranspiration, respectively; in addition, the interactions of E, P, and R can be expressed as a water balance equation:
E = P R S .
where S is the soil moisture content and can be considered as 0 when E is calculated over a long period.

4. Results and Discussion

4.1. Variation Trend and Abrupt Point

The linear regression results for the annual temperature and pan evaporation are shown in Figure 3. The annual temperature increased, whereas evaporation decreased significantly (95%) relative to the precipitation from 1960 to 2005.
The results of the M–K test are also shown in Figure 3. As observed, the precipitation is almost within the limit of ± 1.96, which indicates that the precipitation change is stable, and no obvious abrupt point is observed in the precipitation series. By contrast, some points in the temperature and pan evaporation series exceed the limit line, which suggests that both change at the confidence level of 0.05. Notably, the two curves intersect around 1995 in the temperature and evaporation series, which suggests the occurrence of the abrupt point of the climate factor series in 1995. Considering the land use data of 1990, 2000, and 2010, we finally set the year 1990 as the critical time point. Therefore, in the present study, the natural period ranged from 1960 to 1990, and the affected period ranged from 1991 to 2005.

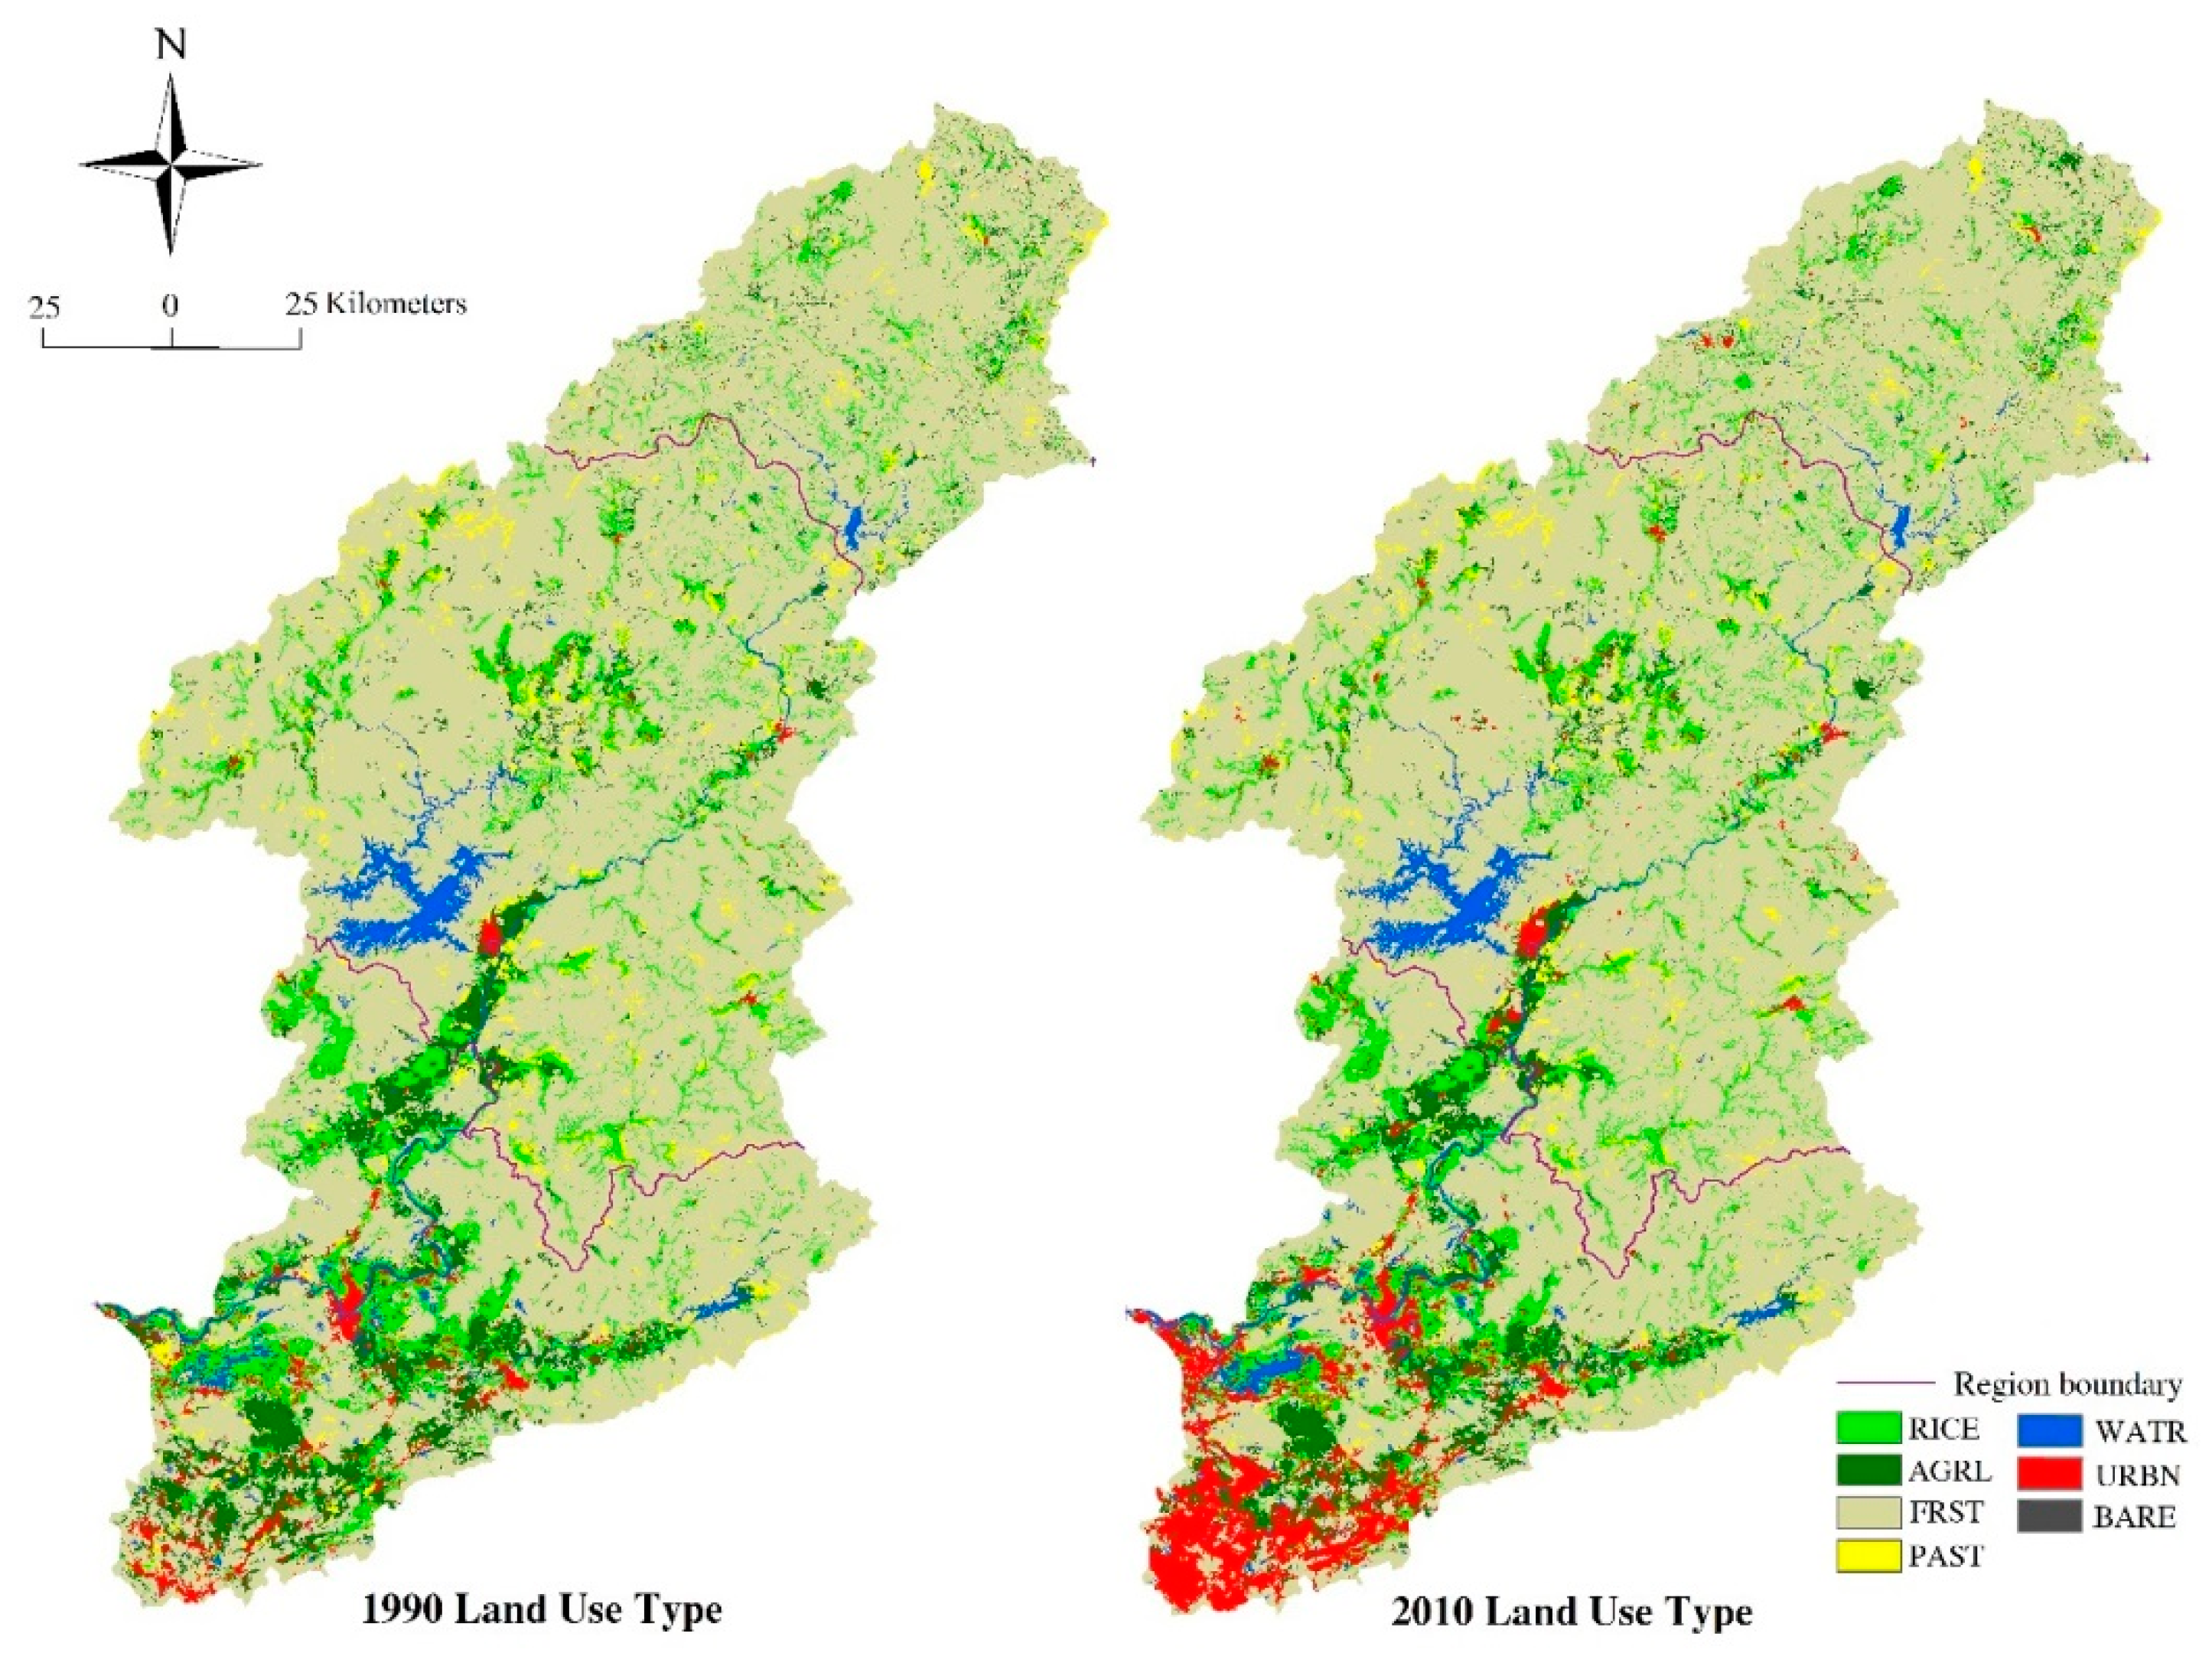
4.2. Land Use Change Analysis

One of the most important signs of human activity is land use change. To determine the land use change induced by human activity, we used the Raster Calculator tool for ArcGIS to analyze the conversion condition between the year 1990 and 2010 land use type. Table 1 describes the conversion percentage of each land use type from 1990 to 2010 in the whole basin. In Table 1, the total rates in 1990 and 2010 represent the amounts of each land use type during the natural period and the affected period, respectively. Both the water body and the urban areas increased, whereas the remaining types (e.g., rice field, agriculture, forest, and pasture) decreased. The percentage of urban area was 1.94 during the natural period, and this percentage increased to 4.79 during the affected period, indicating rapid urban expansion during the years. In addition, the detailed conversion of each land use type from 1990 to 2010 is described in Table 2.
Figure 2 and Table 1 show that the urban areas and the water body mainly expanded in the developed cities of the downstream areas, such as Shenzhen and Dongguan. The urban downstream area mainly encroached into the rice field, agricultural area, and forest land. The increased water body in the downstream area was also mainly converted from bare land.
Benefitting from the significant growth of population and Gross Domestic Product (GDP), improvement of water ecology, and technological progress and policy support, the downstream areas have accelerated the pace of urbanization since 1990s [53]. By contrast, despite the rapid rise in population and GDP in the upstream and midstream areas, land use conversion mainly occurred in the mutual transformation between the rice field and forest area rather than the urban area. These observations may be attributed to the following: first, the adverse geographic environment, mainly consisting of hills and mountains, greatly restricts the development of local economy in these areas. Second, the midstream and upstream areas, particularly the upstream areas, belong to the water source region of large cities in the downstream area; then the local government pursued targeted measures to protect the local ecology and environment, such as establishing the mechanism for ecological compensation and a strict water resource management system, thereby limiting the development of targeted industries and returning farmland to forests or grassland, and so on.

4.3. Impacts on Runoff Change

4.3.1. SWAT Calibration and Validation

The parameters of the SWAT model require calibration prior to simulation. We used the SWAT sensitivity tool to select the parameters that require calibration and ultimately identified the seven most sensitive parameters (Table 3). To assess the impacts of land use change, the parameters we calibrated were based on the land use data in 1990 that belonged to the natural period. To validate the model, we kept the calibrated parameters unchanged and simulated the runoff during the affected period.
The three indexes for assessing the practicability of the model (i.e., Ens, Re, R2) for the six stations are shown in Table 4. The natural and affected periods, the indexes for the six stations were as follows: Ens, 0.70–0.93; Re, 2.26–14.50%; and R2, 0.75–0.94. These values fell within a reasonable range and reached a satisfactory level. For the Boluo station (the control station of the whole Dongjiang River) (Figure 4), the simulated data and the observed data were highly consistent during the calibration period (1961–1990) and the validation period (1961–1975). The linear regression curve (Figure 5) also shows that the simulated data are well fitted with the observed data during both the calibration period and the validation period.
The overall performance of the 6 stations was highly satisfactory; however, the performance levels of the three stations that mainly monitored reservoir runoff—the Fengshuba, Xinfengjiang, and Baipenzhu stations—were not as satisfactory as those of the other three stations. The discrepancy might be attributed to the influence of human activity on the runoff of the three stations. For example, the reservoir administrators could easily change the runoff by controlling the sluice and pumping station, which largely disturbed the natural runoff. By contrast, the stations located in the downstream areas, such as the Lingxia and Boluo stations, had Ens values of about 90%. This finding can be attributed to the location of these two stations in the downstream areas and sufficiently large flows, resulting in lack of sensitivity of reservoir management to runoff change.
Generally, the three indexes (i.e., Ens, Re, R2) in the six hydrological stations fell within the acceptable extent, and the linear fittings between the simulated and observed values were close to 0.9. In addition, the peaks of the simulated result were almost synchronous with the peak of precipitation (Figure 4). Therefore, the performance of the SWAT model applied in the Dongjiang River basin was reasonable and reliable. After calibration and validation, the model could be used to assess the contribution of climate change and human activity to runoff change in the study area.

4.3.2. Contributions of Climate Change and Human Activity to Runoff Change

According to the climate elasticity analysis of the whole basin, the ω ranges 0.01–0.561, the parameters PET/P, E/P, ∆P, and ∆PET are 0.671, 0.436, 128.98, and 31.415, respectively. The climate elasticity method is known to calculate the impact of climate on runoff change without simulating the timely runoff. Thus, no suitable index can evaluate the accuracy of the method, which is also its greatest weakness. Two indexes, Ens and Cor (correlation coefficient), were used to determine whether the other two methods (i.e., linear regression and the SWAT model) could better simulate runoff. The assessment results are listed in Table 5.
The simulated runoff of the two methods in the upstream, midstream, and downstream areas showed satisfactory performance levels similar to that of the whole basin (all indexes were greater than 0.6, p < 0.01). Generally, the simulated results of the SWAT model were better than those obtained by linear regression in the subregions and the whole basin. That is, the quantitative assessment of the impact on runoff change as determined using the SWAT model was more accurate than that obtained by linear regression.
We detected the contributions of climate change and human activity to runoff change. The results are listed in Table 6. We also used the runoff coefficient α , expressed as α = r u n o f f / p r e c i p i t a t i o n , to evaluate runoff changes (Table 7). This coefficient can eliminate the effects induced by differences in precipitation among the three sub-basins. A positive coefficient α implies an increase in runoff, and vice versa.
According to Table 6, the results for the three methods vary to a certain extent, and the average contributions of human activity and climate change to runoff change in the whole basin are 42% and 58%, respectively. The impacts of human activity on runoff were as follows: 77% in the downstream area, 39% in the upstream area, and 13% in the midstream area. In the downstream area, all contributions of human activity, calculated using the three methods, were greater than 50%, with urbanization being the main reason for runoff change. Figure 2 and Table 2 show that the number of urban areas in the downstream area markedly increases from 1990 to 2010. The urban expansion suggested that the permeable stratum areas increased and thus increased the surface runoff. The runoff coefficient during the affected period increased by 0.006 (Table 7). We also analyzed the growth of population and GDP during this period to further reveal the intensity of urbanization (Table 8). We observed that the population and GDP in the downstream area changed the most, increasing to approximately 168 × 104 persons and 3062 × 105 thousand yuan, respectively, from 1990 to 2010. The downstream cities, such as Shenzhen, Dongguan, and Huizhou, developed rapidly during the affected period [54]. During urban expansion, the runoff pattern was markedly changed by pumping of water from the river, changing of the channel shape, building of hydraulic structures, return of water from sewage disposal works, and so on. Accordingly, the downstream area was seriously affected by urbanization.
Both the upstream and midstream areas showed decreases in runoff coefficients by 0.097 and 0.028, respectively (Table 7), and average contributions of human activity of 39% and 13%, respectively. These findings suggest that the impacts induced by human activity are relatively weaker in the downstream area than in the upstream area; that is, climate change played a dominant role in the two subregions. A possible explanation is that although both the population and GDP exhibited significantly increasing trends in the two subregions (Table 8), less conversion from different land use types to urban areas occurred in the upstream area than in the downstream area (Figure 2 and Table 2). Moreover, some biological measures, such as returning rice field to forest and pasture, were taken in the upstream and midstream areas [42], which could also help decrease the runoff coefficient.
Overall, the contribution of climate change (58%) was slightly larger than that of human activity (42%), which was consistent with other studies on the Dongjiang River basin [41,46]. Therefore, we should pay close attention not only to human activity but also to climate change for the protection, planning, and management of water resources.

5. Summary and Conclusions
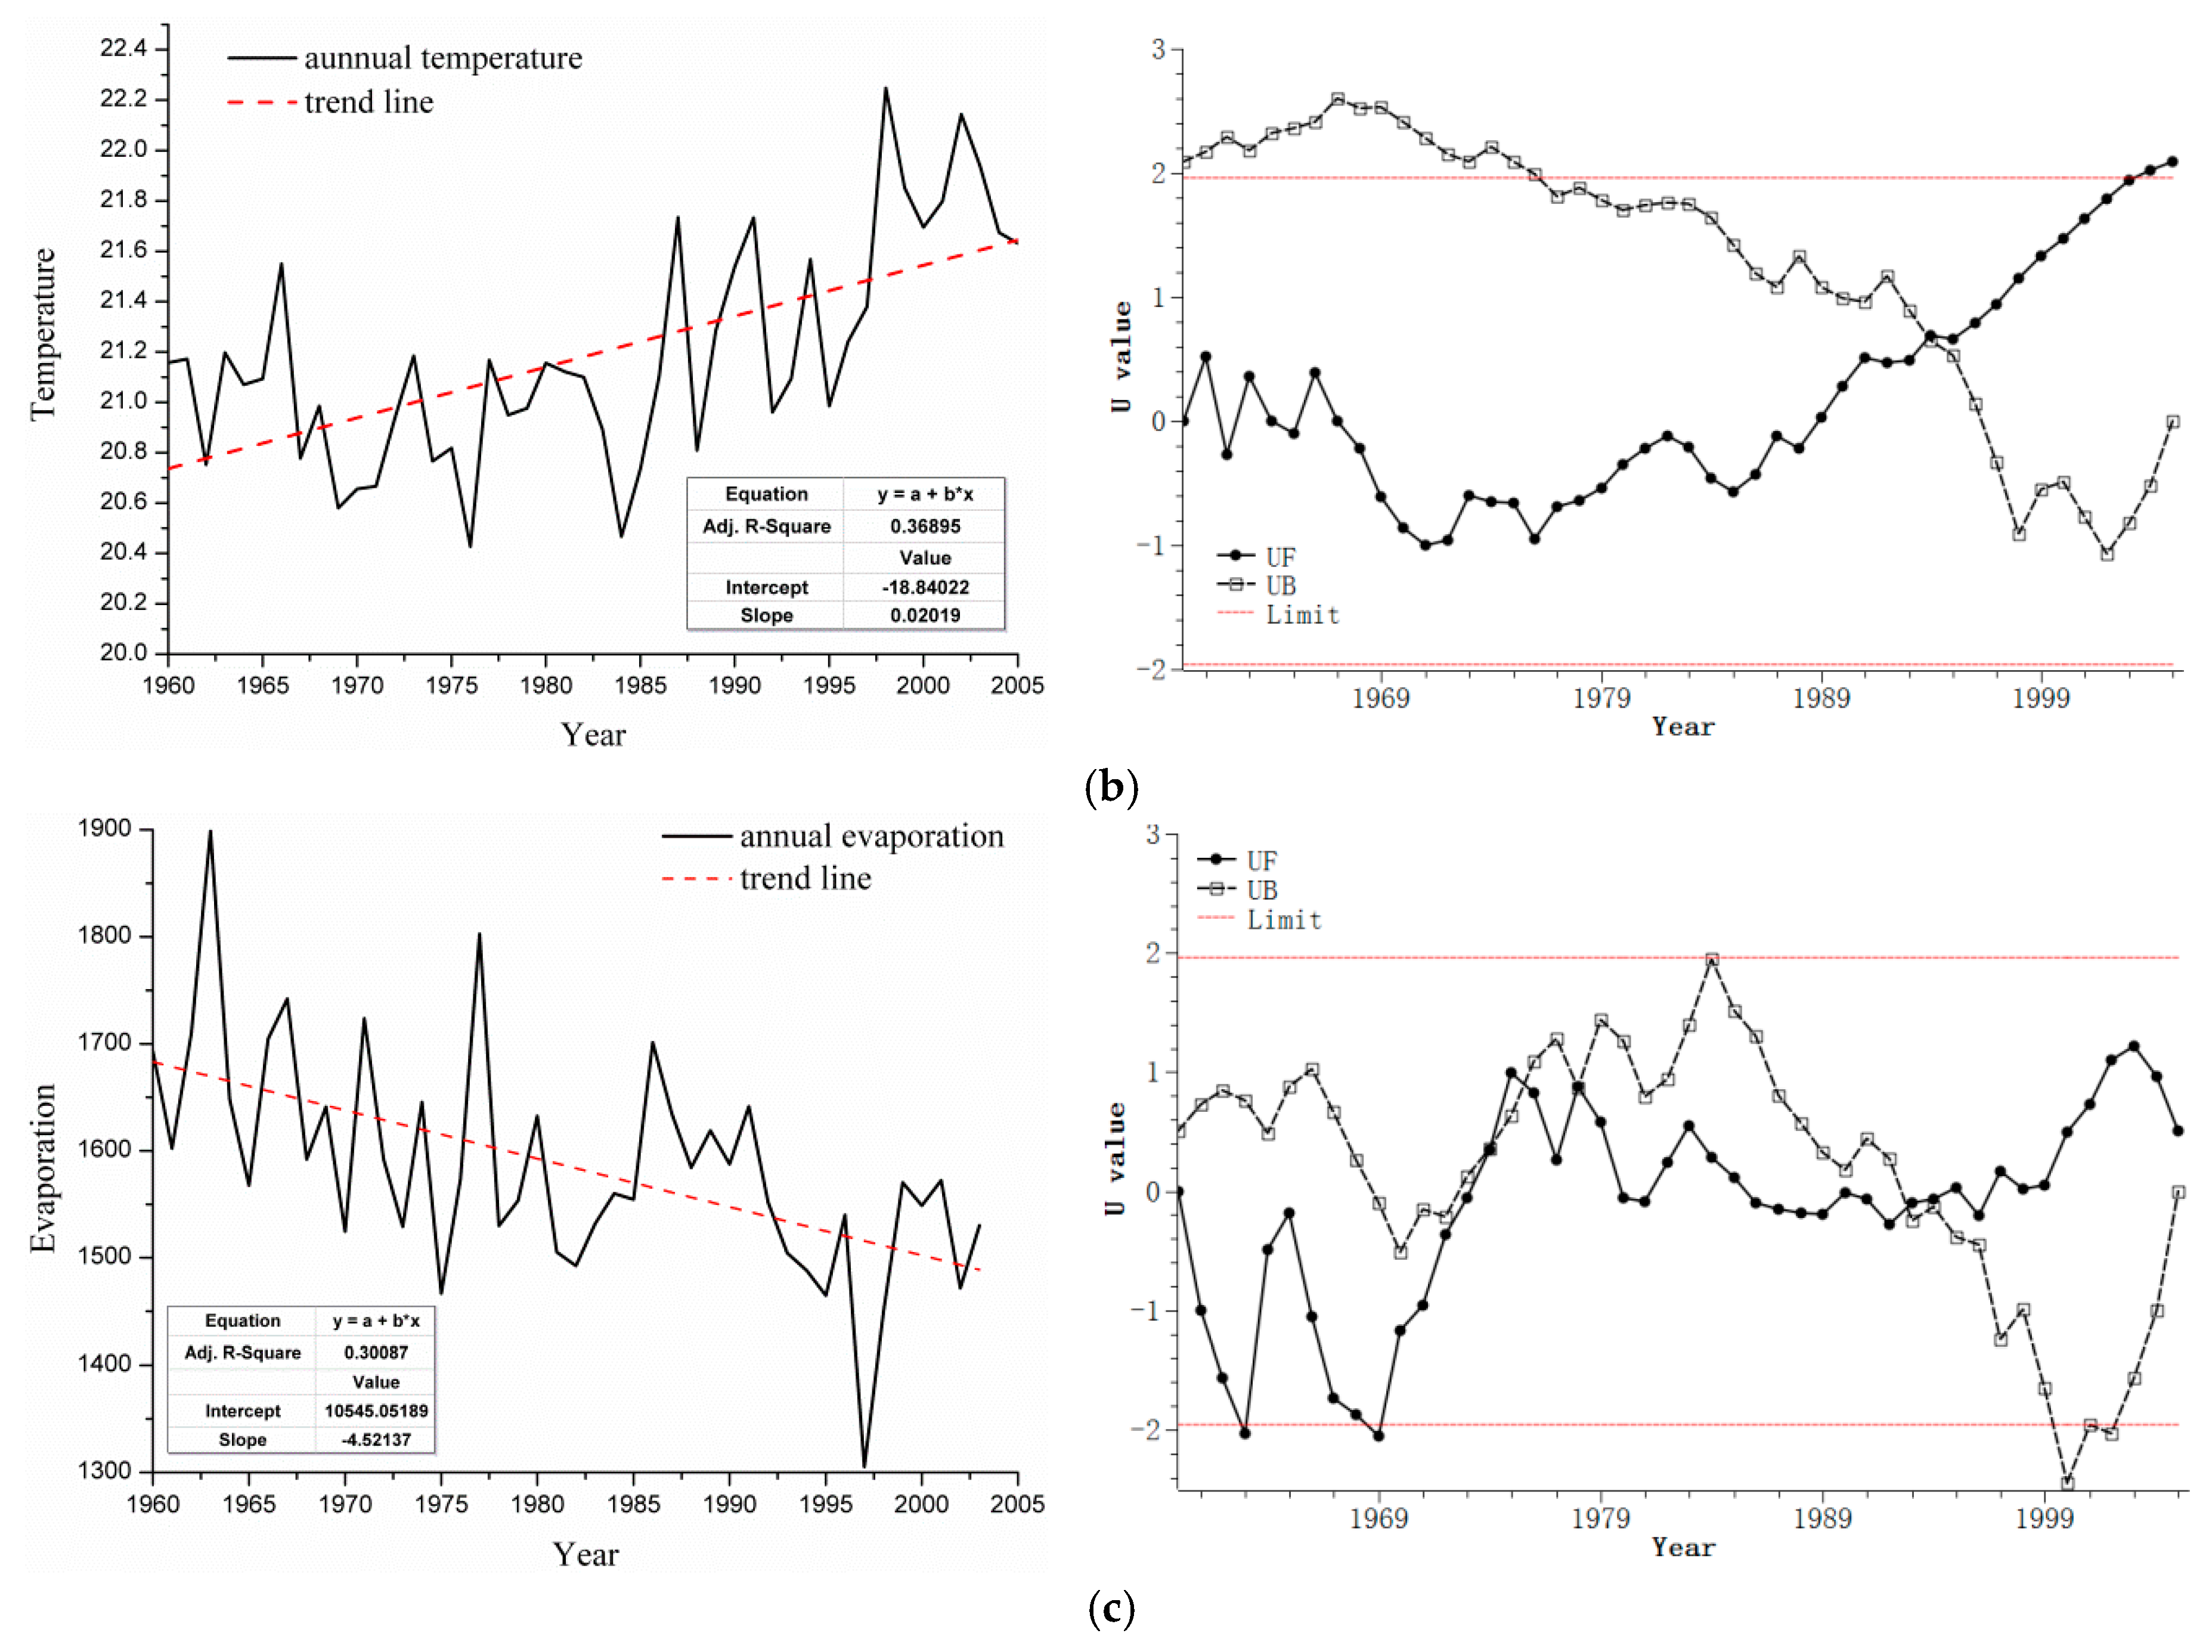
The goal of this study was to quantitatively evaluate the impact of climate change and human activity on runoff change in the Dongjiang River basin (including the upstream, midstream, and downstream areas as well as the whole basin). By using the data from seven weather stations, 32 precipitation stations, and six hydrologic stations, the trend and abrupt points of precipitation, temperature, and evaporation were determined by linear regression and the M–K test. After dividing the study time series into two periods (i.e., natural period and affected period), three methods (i.e., linear regression, SWAT hydrologic model, and the climate elasticity method) were used to assess the contribution to runoff change induced by climate change and human activity. The conclusions can be summarized as follows:
(1)
Annual temperature significantly increased, and pan evaporation significantly decreased in the Dongjiang River basin (95%) from 1960 to 2005. The abrupt points of temperature and pan evaporation series could be detected using the M–K test. We finally established the year 1990 as the critical time point. The natural period ranged from 1960 to 1990, and the affected period ranged from 1991 to 2005.
(2)
The percentage of urban area during the natural period, which was 1.94, increased to 4.79 during the affected period. Compared with the upstream and midstream areas, the urban area downstream expanded most rapidly mainly by encroaching into the rice field, agricultural area, and forest land.
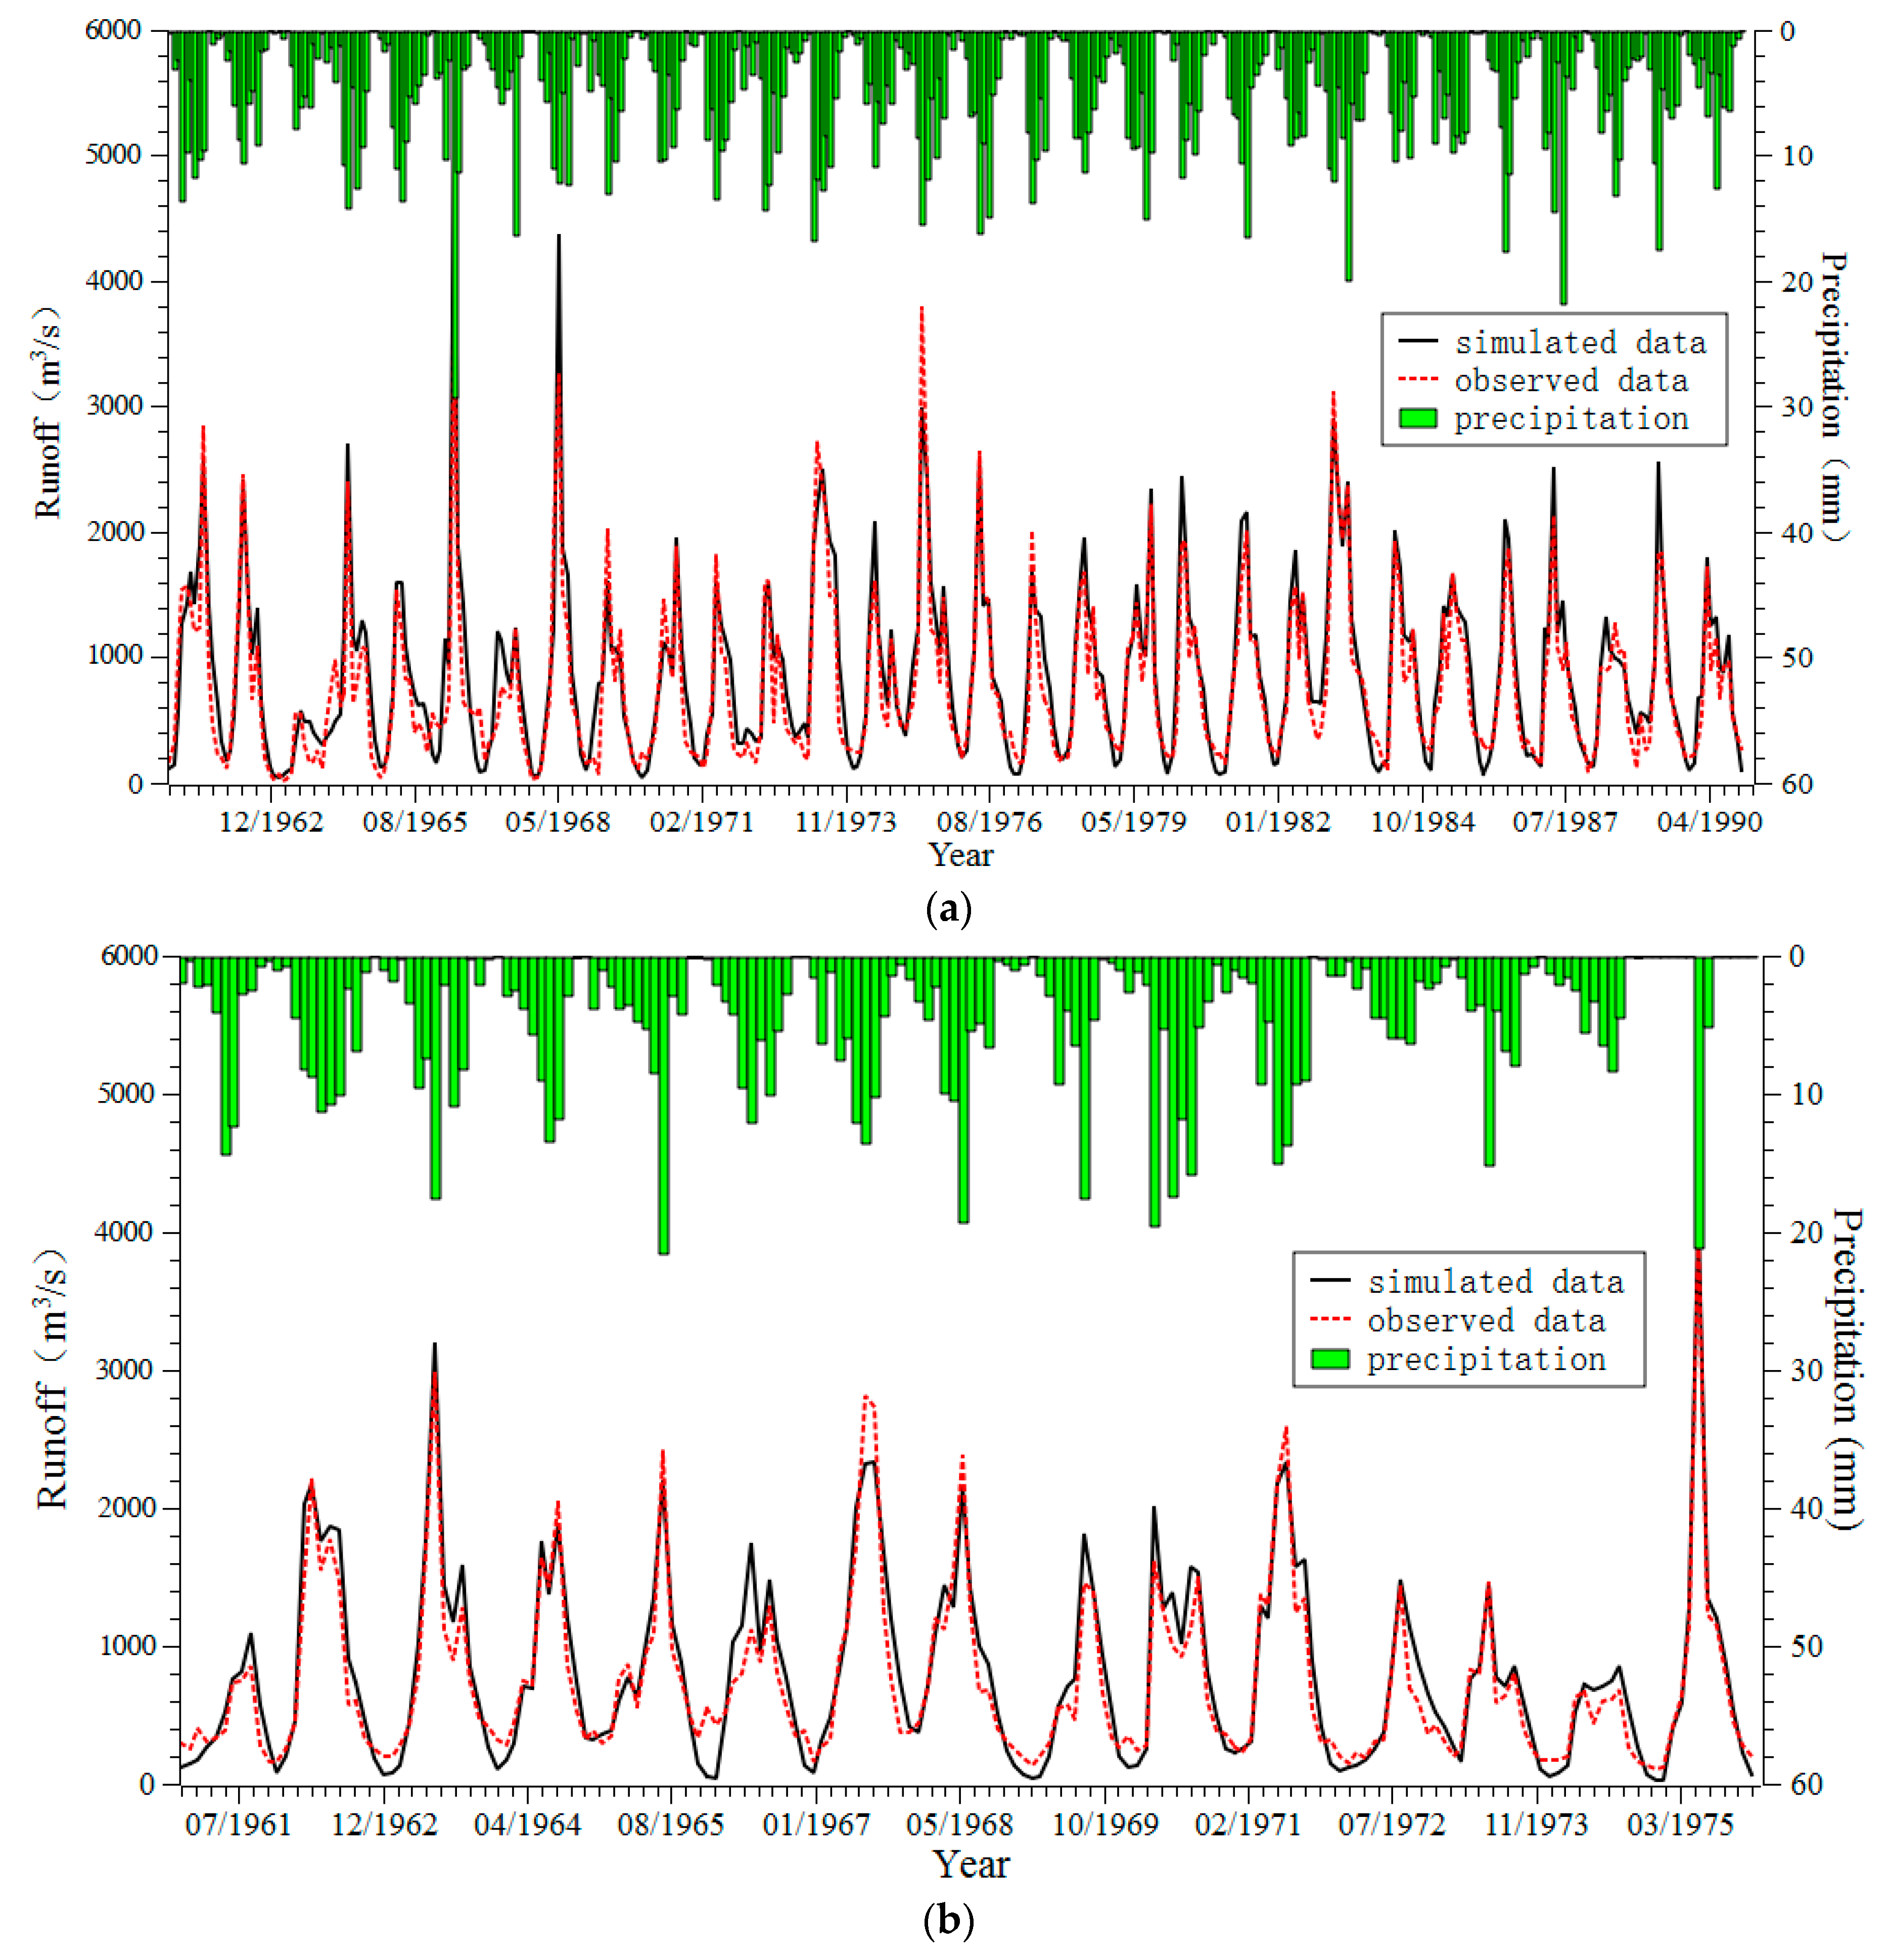
(3)
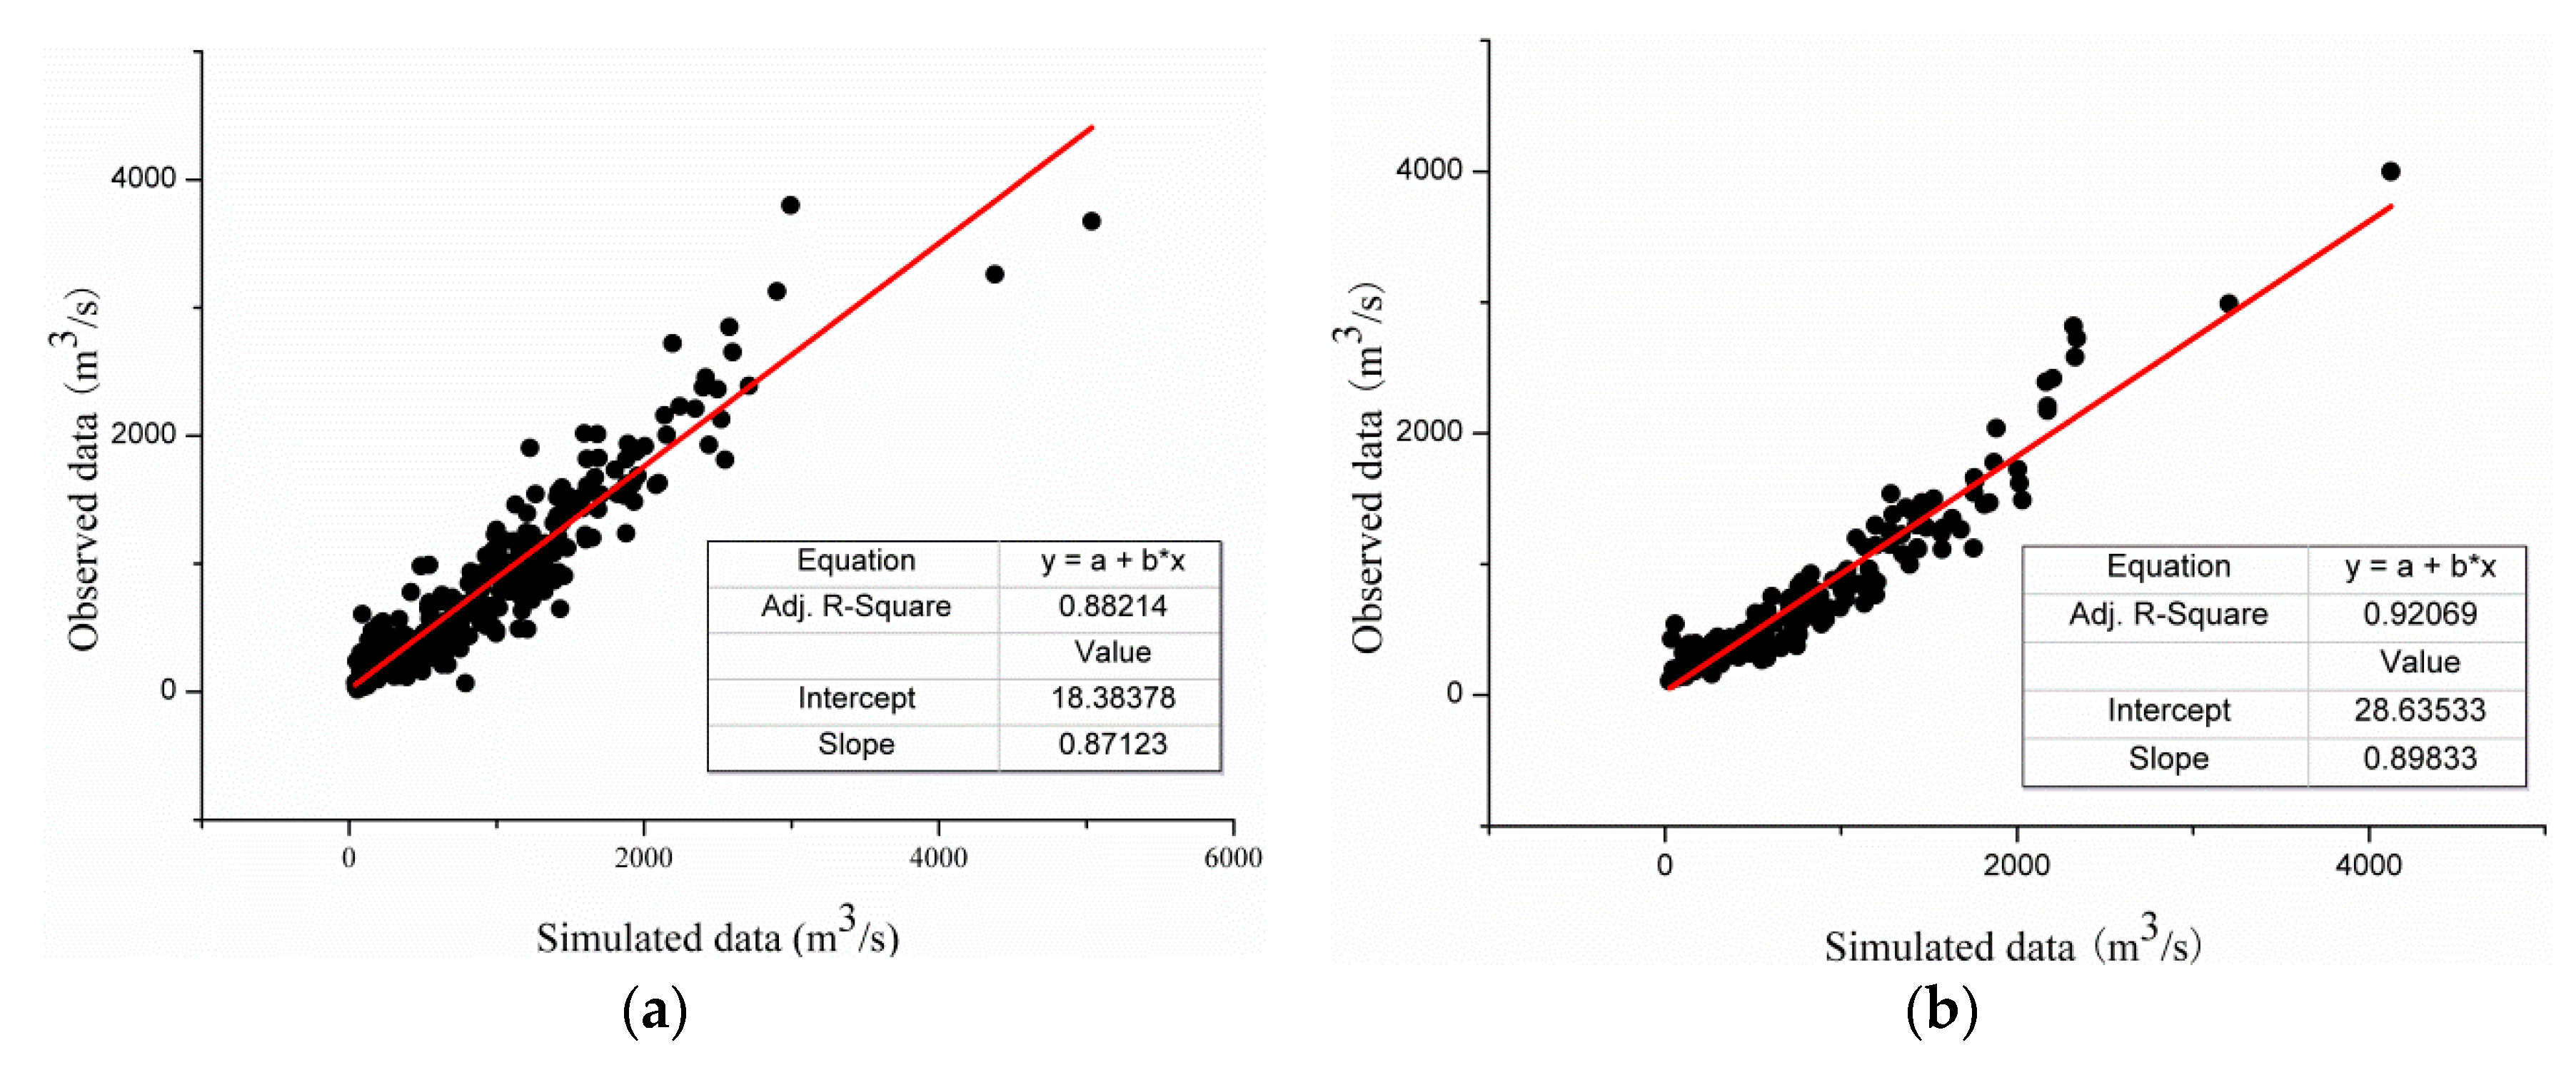
All three indexes (i.e., Ens, Re, R2) of the six hydrologic stations fell within the acceptable extent, and the linear fittings between the simulated and actual values were close to 0.9; the peaks of the simulated result were almost synchronous with the peak of precipitation. The performance of the SWAT model applied in the Dongjiang River basin was reasonable and reliable.
(4)
The impacts on runoff change induced by human activity in different areas were as follows: 39% in the upstream area; 13% in the midstream area; 77% in the downstream area; and 42% in the whole basin. The human activity in the downstream area exerted greater impacts on runoff change, compared with the upstream and midstream areas. However, for the entire basin, the contribution of climate change (58%) was slightly larger than that of human activity (42%). Therefore, both human activity and climate change should be given considerable attention for the protection, planning, and management of water resources.

Author Contributions

Chengguang Lai and Zhaoli Wang conceived and designed the research; Yuliang Zhou performed the data analysis and wrote the manuscript; extensive editing and revisions to the final manuscript and conclusions were contributed by Chengguang Lai and Xiaoyan Bai; Xiaohong Chen proposed some constructive suggestions about the research; Zhaoyang Zeng and Jiachao Chen help to collect and analyze the data. All authors read and approved the manuscript.

Funding

This research was funded by the National Natural Science Foundation of China (Grant Nos. 51579060, 51509065, 51779067, 91547202, and 51509040), the China Postdoctoral Science Foundation (2017M612662), the Water Resource Science and Technology Innovation Program of Guangdong Province (2016-25), the Science and Technology Program of Guangzhou City (201707010072), the Science and Technology Planning Project of Guangdong Province, China (2017A040405020), and the special fund of water resources conservation and protection of Guangdong Province (2017).

Conflicts of Interest

The authors declare no conflict of interest.

References

  1. Ahn, K.H.; Merwade, V. Quantifying the relative impact of climate and human activities on streamflow. J. Hydrol. 2014, 515, 257–266. [Google Scholar] [CrossRef]
  2. Lai, C.G.; Shao, Q.X.; Chen, X.H.; Wang, Z.L.; Zhou, X.W.; Yang, B.; Zhang, L. Flood risk zoning using a rule mining based on ant colony algorithm. J. Hydrol. 2016, 542, 268–280. [Google Scholar] [CrossRef]
  3. Wang, Z.L.; Zeng, Z.Y.; Lai, C.G.; Lin, W.; Wu, X.; Chen, X. A regional frequency analysis of precipitation extremes in Mainland China with fuzzy c-means and L-moments approaches. Int. J. Climatol. 2017, 37, 429–444. [Google Scholar] [CrossRef]
  4. Cui, P.; Dang, C.; Zhuang, J.Q. Flood disaster monitoring and evaluation in China. Environ. Hazards 2002, 4, 33–43. [Google Scholar]
  5. Gaume, E.; Basin, V.; Bernardara, P.; Newinger, O.; Barbuc, M.; Bateman, A.; Blaskovicova, L.; Bloschl, G.; Borga, M.; Dumitrescu, A. A compilation of data on European flash floods. J. Hydrol. 2009, 367, 70–78. [Google Scholar] [CrossRef]
  6. Wang, Z.L.; Lai, C.G.; Chen, X.H.; Yang, B.; Zhao, S.W.; Bai, X.Y. Flood hazard risk assessment model based on random forest. J. Hydrol. 2015, 527, 1130–1141. [Google Scholar] [CrossRef]
  7. Legesse, D.; Vallet-Coulomb, C.; Gasse, F. Hydrological response of a catchment to climate and land use changes in Tropical Africa: Case study South Central Ethiopia. J. Hydrol. 2003, 275, 67–85. [Google Scholar] [CrossRef]
  8. Wagener, T.; Sivapalan, M.; Troch, P.A.; McGlynn, B.L.; Harman, C.J.; Gupta, H.V.; Kumar, P.; Rao, P.S.C.; Basu, N.B.; Wilson, J.S. The future of hydrology: An evolving science for a changing world. Water Resour. Res. 2010, 46, 1369–1377. [Google Scholar] [CrossRef]
  9. Lai, C.G.; Chen, X.H.; Chen, X.Y.; Wang, Z.L.; Wu, X.S.; Zhao, S.W. A fuzzy comprehensive evaluation model for flood risk based on the combination weight of game theory. Nat. Hazards 2015, 77, 1243–1259. [Google Scholar] [CrossRef]
  10. Milly, P.C.D.; Dunne, K.A.; Vecchia, A.V. Global pattern of trends in streamflow and water availability in a changing climate. Nature 2005, 438, 347–350. [Google Scholar] [CrossRef] [PubMed]
  11. Mengistu, D.T.; Sorteberg, A. Sensitivity of SWAT simulated streamflow to climatic changes within the Eastern Nile River basin. Hydrol. Earth Syst. Sci. 2012, 16, 391–407. [Google Scholar] [CrossRef]
  12. Chien, H.; Yeh, J.F.; Knouft, J.H. Modeling the potential impacts of climate change on streamflow in agricultural watersheds of the Midwestern United States. J. Hydrol. 2013, 491, 73–88. [Google Scholar] [CrossRef]
  13. Tang, Y.; Tang, Q.; Tian, F.; Zhang, Z.; Liu, G. Responses of natural runoff to recent climatic variations in the Yellow River basin, China. Hydrol. Earth Syst. Sci. 2013, 17, 4471–4480. [Google Scholar] [CrossRef]
  14. Begueria, S.; Lopez-Moreno, J.I.; Lorente, A.; Seeger, M.; Garcia-Ruiz, J.M. Assessing the effect of climate oscillations and land-use changes on streamflow in the central Spanish pyrenees. AMBIO J. Hum. Environ. 2003, 32, 283–286. [Google Scholar] [CrossRef]
  15. Wang, Z.L.; Xie, P.W.; Lai, C.G.; Chen, X.H.; Zeng, Z.Y.; Li, J. Spatiotemporal variability of reference evapotranspiration and contributing climatic factors in China during 1961–2013. J. Hydrol. 2017, 544, 97–108. [Google Scholar] [CrossRef]
  16. Zhang, Y.K.; Schilling, K.E. Increasing streamflow and baseflow in Mississippi River since the 1940s: Effect of land use change. J. Hydrol. 2006, 324, 412–422. [Google Scholar] [CrossRef]
  17. Cho, J.; Barone, V.A.; Mostaghimi, S. Simulation of land use impacts on groundwater levels and streamflow in a Virginia watershed. Agric. Water Manag. 2009, 96, 1–11. [Google Scholar] [CrossRef]
  18. Randhir, T.O.; Tsvetkova, O. Spatiotemporal dynamics of landscape pattern and hydrologic process in watershed systems. J. Hydrol. 2011, 404, 1–12. [Google Scholar] [CrossRef]
  19. Renner, M.; Brust, K.; Schwaerzel, K.; Volk, M.; Bernhofer, C. Separating the effects of changes in land cover and climate: A hydro-meteorological analysis of the past 60 year in Saxony, Germany. Hydrol. Earth Syst. Sci. 2013, 10, 8537–8580. [Google Scholar] [CrossRef]
  20. Rougé, C.; Cai, X. Crossing-scale hydrological impacts of urbanization and climate variability in the Greater Chicago Area. J. Hydrol. 2014, 517, 13–27. [Google Scholar] [CrossRef]
  21. Huntingford, C.; Marsh, T.; Scaife, A.A.; Kendon, E.J.; Hannaford, J.; Kay, A.L.; Lockwood, M.; Prudhomme, C.; Reynard, N.S.; Parry, S. Potential influences on the United Kingdoms floods of winter 2013/14. Nat. Clim. Chang. 2014, 4, 769–777. [Google Scholar] [CrossRef]
  22. Kelly, M.; Michael, A.A.; Gregory, T.; Joseph, J.B.; James, D.S. Changes in hail and flood risk in high-resoulution simulations over Colorado’s mountains. Nat. Clim. Chang. 2012, 2, 125–131. [Google Scholar]
  23. Sterling, M.S.; Ducharne, A.; Polcher, J. The impact of global land-cover change on the terrestrial water cycle. Nat. Clim. Chang. 2013, 3, 385–390. [Google Scholar] [CrossRef]
  24. Lu, S.L.; Wu, B.F.; Wei, Y.P.; Yan, N.N.; Wang, H.; Guo, S.Y. Quantifying impacts of climate variability and human activities on the hydrological system of the Haihe River Basin, China. Environ. Earth Sci. 2015, 73, 1491–1503. [Google Scholar] [CrossRef]
  25. Li, L.J.; Zhang, L.; Wang, H.; Wang, J.; Yang, J.W.; Jiang, D.J.; Li, J.Y.; Qin, D.Y. Assessing the impact of climate variability and human activities on streamflow from the Wuding River basin in China. Hydrol. Process. 2007, 21, 3485–3491. [Google Scholar] [CrossRef]
  26. Cioffi, F.; Conticello, F.; Lall, U.; Marotta, L.; Telesca, V. Large scale climate and rainfall seasonality in a Mediterranean Area: Insights from a non-homogeneous Markov model applied to the Agro-Pontino plain. Hydrol. Process. 2017, 31, 668–686. [Google Scholar] [CrossRef]
  27. Neiva, H.D.S.; da Silva, M.S.; Cardoso, C. Analysis of climate behavior and land use in the city of Rio de Janeiro, RJ, Brazil. Climate 2017, 5, 52. [Google Scholar] [CrossRef]
  28. Pan, S.; Liu, D.; Wang, Z.; Zhao, Q.; Zou, H.; Hou, Y.; Liu, P.; Xiong, L. Runoff responses to climate and land use/cover changes under future scenarios. Water 2017, 9, 475. [Google Scholar] [CrossRef]
  29. Fu, G.; Charles, S.P.; Chiew, F.H.S. A two-parameter climate elasticity of streamflow index to assess climate change effects on annual streamflow. Water Resour. Res. 2007, 43, 2578–2584. [Google Scholar] [CrossRef]
  30. Zhan, C.S.; Jiang, S.S.; Sun, F.B.; Jia, Y.W.; Niu, C.W.; Yue, W.F. Quantitative contribution of climate change and human activities to runoff changes in the Wei River basin, China. Hydrol. Earth Syst. Sci. 2014, 11, 2149–2175. [Google Scholar] [CrossRef]
  31. Guo, H.; Hu, Q.; Jiang, T. Annual and seasonal streamflow responses to climate and land-cover changes in the Poyang Lake basin, China. J. Hydrol. 2008, 355, 106–122. [Google Scholar] [CrossRef]
  32. Ha, L.T.; Bastiaanssen, W.G.M.; van Griensven, A.; van Dijk, A.I.J.M.; Senay, G.B. Calibration of Spatially Distributed Hydrological Processes and Model Parameters in SWAT Using Remote Sensing Data and an Auto-Calibration Procedure: A Case Study in a Vietnamese River Basin. Water 2018, 10, 212. [Google Scholar] [CrossRef]
  33. Bajracharya, A.R.; Bajracharya, S.R.; Shrestha, A.B.; Maharjan, S.B. Climate change impact assessment on the hydrological regime of the Kaligandaki Basin, Nepal. Sci. Total Environ. 2018, 625, 837–848. [Google Scholar] [CrossRef] [PubMed]
  34. Bao, Z.X.; Zhang, J.Y.; Wang, G.Q.; Fu, G.B.; He, R.M.; Yan, X.L.; Jin, J.L.; Liu, Y.L.; Zhang, A.J. Attribution for de-creasing runoff of the Haihe River baisn, northern China: Climate variability or human activities? J. Hydrol. 2012, 460–461, 117–129. [Google Scholar] [CrossRef]
  35. Wang, Z.L.; Zhong, R.D.; Lai, C.G. Evaluation and hydrologic validation of TMPA satellite precipitation product downstream of the Pearl River Basin, China. Hydrol. Process. 2017, 31, 4169–4182. [Google Scholar] [CrossRef]
  36. Wang, Z.L.; Zhong, R.D.; Lai, C.G.; Chen, J.C. Evaluation of the GPM IMERG satellite-based precipitation products and the hydrological utility. Atmos. Res. 2017, 196, 151–163. [Google Scholar] [CrossRef]
  37. Teng, F.; Huang, W.R.; Ginis, I. Hydrological modeling of storm runoff and snowmelt in Taunton River Basin by applications of HEC-HMS and PRMS models. Nat. Hazards 2018, 91, 179–199. [Google Scholar] [CrossRef]
  38. Dvory, N.Z.; Ronen, A.; Livshitz, Y.; Adar, E.; Kuznetsov, M.; Yakirevich, A. Quantification of Groundwater Recharge from an Ephemeral Stream into a Mountainous Karst Aquifer. Water 2018, 10, 79. [Google Scholar] [CrossRef]
  39. Tu, J. Combined impact of climate and land use changes on streamflow and water quality in eastern Massachusetts, USA. J. Hydrol. 2009, 379, 268–283. [Google Scholar] [CrossRef]
  40. Wu, R.S.; Lin, I.W. Modification of generalized watershed loading functions (GWLF) for daily flow simulation. Paddy Water Environ. 2015, 13, 269–279. [Google Scholar] [CrossRef]
  41. Liu, D.; Chen, X.; Lian, Y.; Lou, Z.H. Impacts of climate change and human activities on surface runoff in the Dongjiang River basin of China. Hydrol. Process. 2010, 24, 1487–1495. [Google Scholar] [CrossRef]
  42. Lai, C.G.; Wang, Z.L.; Chen, X.H.; Xu, C.-Y.; Yang, B.; Meng, Q.Q.; Huang, B. A procedure for assessing the impacts of land-cover change on soil erosion at basin scale. Hydrol. Res. 2016, 47, 903–918. [Google Scholar] [CrossRef]
  43. Wang, Z.L.; Zhong, R.D.; Lai, C.G.; Zeng, Z.Y.; Lian, Y.Q.; Bai, X.Y. Climate change enhances the severity and variability of drought in the Pearl River Basin in South China in the 21st century. Agric. For. Meteorol. 2018, 249, 149–162. [Google Scholar] [CrossRef]
  44. Lai, C.G.; Chen, X.H.; Wang, Z.L.; Wu, X.S.; Zhao, S.W.; Wu, X.Q.; Bai, W.K. Spatio-temporal variation in rainfall erosivity during 1960–2012 in the Pearl River Basin, China. Catena 2016, 137, 382–391. [Google Scholar] [CrossRef]
  45. Reder, A.; Rianna, G.; Vezzoli, R.; Mercogliano, P. Assessment of possible impacts of climate change on the hydrological regimes of different regions in China. Adv. Clim. Chang. Res. 2016, 7, 169–184. [Google Scholar] [CrossRef]
  46. He, Y.H.; Lin, K.R.; Chen, X.H. Effect of land use and climate change on runoff in the Dongjiang Basin of South China. Math. Probl. Eng. 2013, 2013, 471429. [Google Scholar] [CrossRef]
  47. Wang, Z.L.; Li, J.; Lai, C.G.; Wang, R.Y.; Chen, X.H.; Lian, Y.Q. Drying tendency dominating the global grain production area. Glob. Food Secur. 2018, 16, 138–149. [Google Scholar] [CrossRef]
  48. Wu, X.S.; Wang, Z.L.; Zhou, X.W.; Zeng, Z.Y.; Lai, C.G.; Chen, X.H. Variability of annual peak flows in the Beijiang River Basin, South China, and possible underlying causes. Hydrol. Res. 2017, 48, 442–454. [Google Scholar] [CrossRef]
  49. Wang, Z.L.; Li, J.; Lai, C.G.; Zeng, Z.Y.; Zhong, R.D.; Chen, X.H.; Zhou, X.W.; Wang, M.Y. Does drought in China show a significant decreasing trend from 1961 to 2009? Sci. Total Environ. 2016, 579, 314–324. [Google Scholar] [CrossRef] [PubMed]
  50. Jiang, S.; Ren, L.; Yong, B.; Singh, V.P.; Yang, X.L.; Yuan, F. Quantifying the effects of climate variability and human activities on runoff from the Laohahe basin in northern China using three different methods. Hydrol. Process. 2011, 25, 2492–2505. [Google Scholar] [CrossRef]
  51. Hu, S.S.; Zheng, H.X.; Liu, C.M.; Yu, J.J.; Wang, Z.G. Assessing the impacts of climate variability and human activities on streamflow in the water source area of Baiyangdian Lake. Acta Geogr. Sin. 2012, 67, 62–70. [Google Scholar] [CrossRef]
  52. Zhang, L.; Dawes, W.R.; Walker, G.R. Response of mean annual evapotranspiration to vegetation changes at catchment scale. Water Resour. Res. 2001, 37, 701–708. [Google Scholar]
  53. Liu, X.P.; Li, X.; Liu, L.; He, J.; Ai, B. An innovative method to classify remotesensing images using ant colony optimization. IEEE Trans. Geosci. Remote Sens. 2008, 46, 4198–4208. [Google Scholar] [CrossRef]
  54. Liu, X.; Liang, X.; Li, X.; Xu, X.; Ou, J.; Chen, Y.; Li, S.; Wang, S.; Pei, F. A future land use simulation model (FLUS) for simulating multiple land use scenarios by coupling human and natural effects. Landsc. Urban Plan. 2017, 168, 94–116. [Google Scholar] [CrossRef]
Figure 1. Location, topography and stations of the Dongjiang River basin.
Water 10 00571 g001
Figure 2. Land use type of the year 1990 and 2010 in Dongjiang River basin. RICE, AGRC, FRST, PAST, WATR, URBN, and BARE are short for rice field, agriculture, forest, pasture, water body, urban, and bare land, respectively.
Water 10 00571 g002
Figure 3. Trend and M–K test analysis of the three climatic factors in the Dongjiang River basin: (a) Precipitation; (b) temperature; (c) pan evaporation.
Water 10 00571 g003aWater 10 00571 g003b
Figure 4. The calibration (a) and validation (b) results of SWAT model in Boluo station.
Water 10 00571 g004
Figure 5. The linear regression between the simulated and observed data in calibration (a) and validation (b) period in Boluo station.
Water 10 00571 g005
Table 1. The conversion percentage (%) of each land use type from 1990 to 2010.
1990/2010RICEAGRCFRSTPASTWATRURBNBARETotal Rate (2010)
RICE9.590.111.070.110.060.090.0011.03
AGRC0.094.720.530.050.030.040.005.46
FRST1.110.5170.100.600.190.070.0072.58
PAST0.090.040.322.870.020.010.003.35
WATR0.150.050.220.032.330.020.002.8
URBN0.670.911.240.200.061.710.004.79
BARE0.000.000.000.000.000.000.000
Total rate (1990)11.76.3473.483.862.691.940
Notes: RICE, AGRC, FRST, PAST, WATR, URBN, and BARE are short for rice field, agricultural district, forest, pasture, water body, urban, and bare land, respectively.
Table 2. The conversion percentage of each land use type from 1990 to 2010 in different sub-regions.
UpstreamRate (%)MidstreamRate (%)DownstreamRate (%)
1→15376.7117888.61179213.79
1→220.02130.06160.12
1→3891.112321.12800.62
1→450.06290.1410.01
1→500.0070.03550.42
1→640.05410.202351.81
1→700.0000.0000.00
2→180.10160.08220.17
2→22222.775182.4912169.36
2→3470.59810.39780.60
2→420.0290.0430.02
2→500.0030.01170.13
2→610.01320.153602.77
2→700.0000.0000.00
3→11011.262451.18920.71
3→2770.96660.32760.58
3→3659282.3815,71375.63701954.02
3→4140.171050.51150.12
3→5100.12460.22310.24
3→6120.15500.244703.62
3→700.0000.0000.00
4→160.07330.1670.05
4→220.02180.0990.07
4→3140.171730.83580.45
4→41642.057793.752541.95
4→520.0230.0190.07
4→610.01160.08550.42
4→700.0000.0000.00
5→110.0140.02220.17
5→210.0170.0360.05
5→370.09550.26140.11
5→400.0050.0220.02
5→5620.775572.683963.05
5→600.0010.00220.17
5→700.0000.0000.00
6→100.0000.0010.01
6→200.0000.0000.00
6→310.0100.0020.02
6→400.0000.0000.00
6→500.0000.0040.03
6→630.04530.262001.54
6→700.0000.00190.15
7→110.0140.0280.06
7→210.0120.01160.12
7→310.0120.0140.03
7→400.0000.0040.03
7→500.0000.003032.33
7→6120.15710.3400.00
7→700.0000.0000.00
Notes: The Roman numeral on the left of “→” represents the land use type in the year 1990, while that on the right represents the type in the year 2010. 1 to 7 represent the land use type of rice field, agricultural district, forest, pasture, water body, urban, and bare land.
Table 3. The most sensitive parameters in the SWAT model.
ParameterInput DataDefinitionLower LimitUpper Limit
CN2.mgtInitial SCS curve CNII value3598
ESCO.hruSoil evaporation compensation factor01
CANMX.hruMaximum canopy storage0100
ALPHA_BF.gwBaseflow alpha factor01
GW_DELAY.gwGroundwater delay time0500
GWQMN.gwThreshold water depth in shallow aquifer05000
SOL_AWC.solAvailable water capacity01
Table 4. Model practicability assessment in six stations.
StationPeriodEnsReR2
FengshubaNatural period0.792.26%0.80
Affected period0.7614.50%0.82
XinfengjiangNatural period0.785.03%0.79
Affected period0.909.09%0.91
HeyuanNatural period0.7011.87%0.77
Affected period0.867.10%0.89
LingxiaNatural period0.917.56%0.92
Affected period0.937.29%0.94
BaipenzhuNatural period0.8017.02%0.77
Affected period0.738.12%0.75
BoluoNatural period0.8412.07%0.88
Affected period0.907.06%0.92
Table 5. Practicability evaluation of the linear regression and SWAT model.
Evaluation IndexEnsCor
Linear RegressionSWAT ModelLinear RegressionSWAT Model
Dongjiang River basin0.86 *0.850.86 *0.89
Upstream0.66 *0.790.68 *0.81
Midstream0.71 *0.820.72 *0.84
Downstream0.64 *0.770.66 *0.79
Note: the asterisk represents p < 0.01.
Table 6. The contribution of human activity and climate change to runoff change using three methods.
Contribution (%)-Human Activity/Climate ChangeLinear RegressionSWAT ModelClimate Elasticity MethodAverage
Dongjiang River basin49/5142/5836/6442/58
Upstream34/6646/5437/6339/61
Midstream6/9430/703/9713/87
Downstream87/1361/3984/1677/23
Table 7. Average precipitation and runoff coefficient change between natural and affected period.
RegionPrecipitation ChangeRunoff Coefficient α in Natural PeriodRunoff Coefficient α in Affected PeriodRunoff Coefficient α Change
Upstream−13.550.6080.510−0.097
Midstream−12.420.5880.560−0.028
Downstream−7.110.4590.4650.006
Table 8. The trend analysis of population (POP, per unit person) and the gross domestic product (GDP, 10,000 yuan (RMB)).
Region1990 POP
( × 10 4 )
2010 POP
( × 10 4 )
POP Total Change1990 GDP
( × 10 4 )
2010 GDP
( × 10 4 )
GDP Total Change
Upstream144.7321169.324124.59224.60954156.9948132.3853
Midstream171.9268209.166937.240139.14305332.22293.077
Downstream285.2654452.7741167.5087610.26143672.3073062.046

