Translocation of Soil Particles during Secondary Soil Tillage along Contour Lines

Faculty of Engineering, Czech University of Life Sciences Prague, Kamýcká 129, 165 21 Prague 6, Suchdol, Czech Republic
*
Author to whom correspondence should be addressed.
Water 2018, 10(5), 568; https://doi.org/10.3390/w10050568
Submission received: 27 March 2018
/
Revised: 18 April 2018
/
Accepted: 24 April 2018
/
Published: 27 April 2018
(This article belongs to the Special Issue Soil Water Conservation: Dynamics and Impact)
Abstract
:A high percentage of arable land and erosion risk on agricultural land are typical of current agriculture. While tillage erosion is a less frequently studied issue, it impacts vast areas of agricultural land. Not all relationships between cultivation equipment, the gradient of the plot and other factors have been known until now. Intensive soil tillage can be a crucial erosive factor mainly when the cultivation equipment moves in a fall line direction. Nevertheless, even when the equipment moves along contour lines, soil particles can be translocated perpendicular to the direction of the equipment movement (in a fall line direction). This phenomenon has not yet been adequately studied. For measurements, a field trial with secondary tillage of soil was laid out (a seedbed preparation implement was used). The objective of the trial was to evaluate the effect of the working tools of the cultivation equipment on the crosswise and lengthwise translocation of soil particles during soil tillage. Aluminium cubes, with a side length of 16 mm, were used as tracers. Before the operation, the tracers were inserted in a row perpendicular (at a right angle) to a direction of the equipment passes. After the equipment passes, position of tracers was evaluated within a two-axis grid. The trial was performed at three gradients of the plot (2°, 6° and 11°). For each gradient, the 1-pass, 2-pass and 3-pass treatments were tested. The equipment always moved along the plot contour line. After the equipment passes in all treatments, all tracers were localized on an orthogonal grid. The results of the trial demonstrate the effect of the slope gradient on the crosswise translocation of particles during secondary tillage of soil in the slope direction. The tillage equipment translocated particles in the fall line direction even if it passed along the contour line. With the increasing intensity of passes, the effect of the equipment on crosswise translocation increases. During secondary tillage of soil, the working tools of the equipment have an erosive effect (causing tillage erosion), even though the equipment moves along the contour line.
1. Introduction
High average gradients of plots are typical of conditions of the Czech Republic. Janeček et al. [1] and Novotný et al. [2] stated that up to a half of the farmland in the CR is exposed to erosion. In addition, a high percentage of arable land in the total agricultural land is characteristic of the CR. It is also the largest average field size in the EU. Besides water and wind erosion of soil, in Central Europe conditions, the soil quality and productivity are impaired by the operation of farm machines during soil tillage. The term ‘tillage erosion’ expresses the undesirable translocation of soil particles in the course of soil tillage. Interest in the study of tillage erosion has increased in the last fifteen years. Govers’ paper [3] was a great stimulus to begin to study tillage erosion.
There is a mutual relationship between water erosion and tillage erosion, but these processes are usually studied separately [4,5,6]. The translocation of soil particles during primary tillage of soil was studied in relatively great detail, mainly during ploughing with a share plough, and during soil tillage with disk harrows and tine cultivators. Fewer experimental results of soil particle translocation by the cultivation equipment are available for secondary tillage of soil [7]. It is of note that some operations of secondary tillage have greater erosive impacts than primary tillage. The risk of tillage erosion was documented by Lobb et Kachanoski [8]. In the Ontario province in Canada, tillage erosion causes at least 70% of the total soil loss on hilltops. For the North American Great Plains and Canadian Prairies regions, Li et al. [9] used the term scalping of hilltops in relation to the use of the equipment with a large working width for soil tillage and sowing.
Van Muysen et al. [10] investigated tillage erosivity in the course of three years. Results of their evaluation were applied to determine the annual tillage transport coefficient that was associated with mechanized operations in agriculture, amounting to 781 kg m−1 year−1. The authors stated that this coefficient can be determined from the previously computed values of tillage transport coefficients for particular operations of soil tillage. For example, for mouldboard ploughing, Van Muysen et al. [11] reported the value of 270 kg m−1 per tillage pass (up and downslope tillage direction) and 197 kg m−1 (contour line direction). For rotary harrow and seeding equipment, the tillage transport coefficient of 123 kg m−1 was computed. Other authors reported lower values of the annual tillage transport coefficient: 300 kg m−1 year−1 [12], 523 kg m−1 year−1 [13], and 133 kg m−1 year−1 [14]. The lowest annual tillage transport coefficient was computed for no-till drill—below 5 kg m−1.
The majority of the authors documented the lower undesirable translocation of soil particles during contour tillage compared to up- and downslope tillage. Lindstrom et al. [15] believed that contour tillage can be moderately more erosive than up- and downslope tillage. This is confirmed by other results [16]. Nevertheless, there have been some objections to contour tillage: The tillage transport coefficient as an indicator of tillage erosivity was used by Van Muysen et al. [10].
where D is the depth of tillage (m), ρb is the soil bulk density (kg m−3) and b is the slope of the linear regression equation of the relationship between soil displacement (m) and slope gradient (m m−1).
k = −D∙ρb∙b
The modelling of edge effects of tillage erosion using the results from two field studies from the area of North America was done by Vieira et Dabney [17].
From the aspect of undesirable translocation of soil particles, the risk of secondary tillage is that the soil is usually loose at the time of seedbed preparation, and soil particles are translocated not only in the direction of the cultivation equipment passes but also in the downslope direction due to gravitation. Another risk is that the operations of seedbed preparation are repeated in a short time. Therefore, the undesirable gradual downslope translocation of soil particles also occurs when the equipment for seedbed preparation passes in the contour line direction, which is generally recommended. Their results lack exact measurements for repeated passes during seedbed preparation on plots of different gradients and at different directions of the equipment passes on slopes.
In general, the extent of tillage erosion is related to the erodibility of the landscape and to the erosivity of tillage operations. According to Li et al. [7], tillage erosivity is a result of the way in which the working tools are constructed and their arrangement in the equipment, while the geometry of the cutting tools is also important. Other parameters playing a role are tillage frequency, tillage speed and depth, the type of hitch for attaching the cultivation equipment to a tractor, and behaviour of the tractor driver.
According to available literature, the effect of farm machines exerted in the lengthwise direction has been solved. There is very little study on crosswise translocation, especially on slopes. However, this phenomenon occurs during soil tillage and should be further investigated. Of course, the existence of crosswise translocation has been reported by many authors [13,17,18,19,20]. However, it is difficult to find studies describing the characteristics of lengthwise and crosswise translocation of soil particles during secondary tillage. The objective of this paper is to assess the effect of the slope gradient on lengthwise and especially crosswise translocation of soil particles during secondary tillage of soil.
2. Materials and Methods
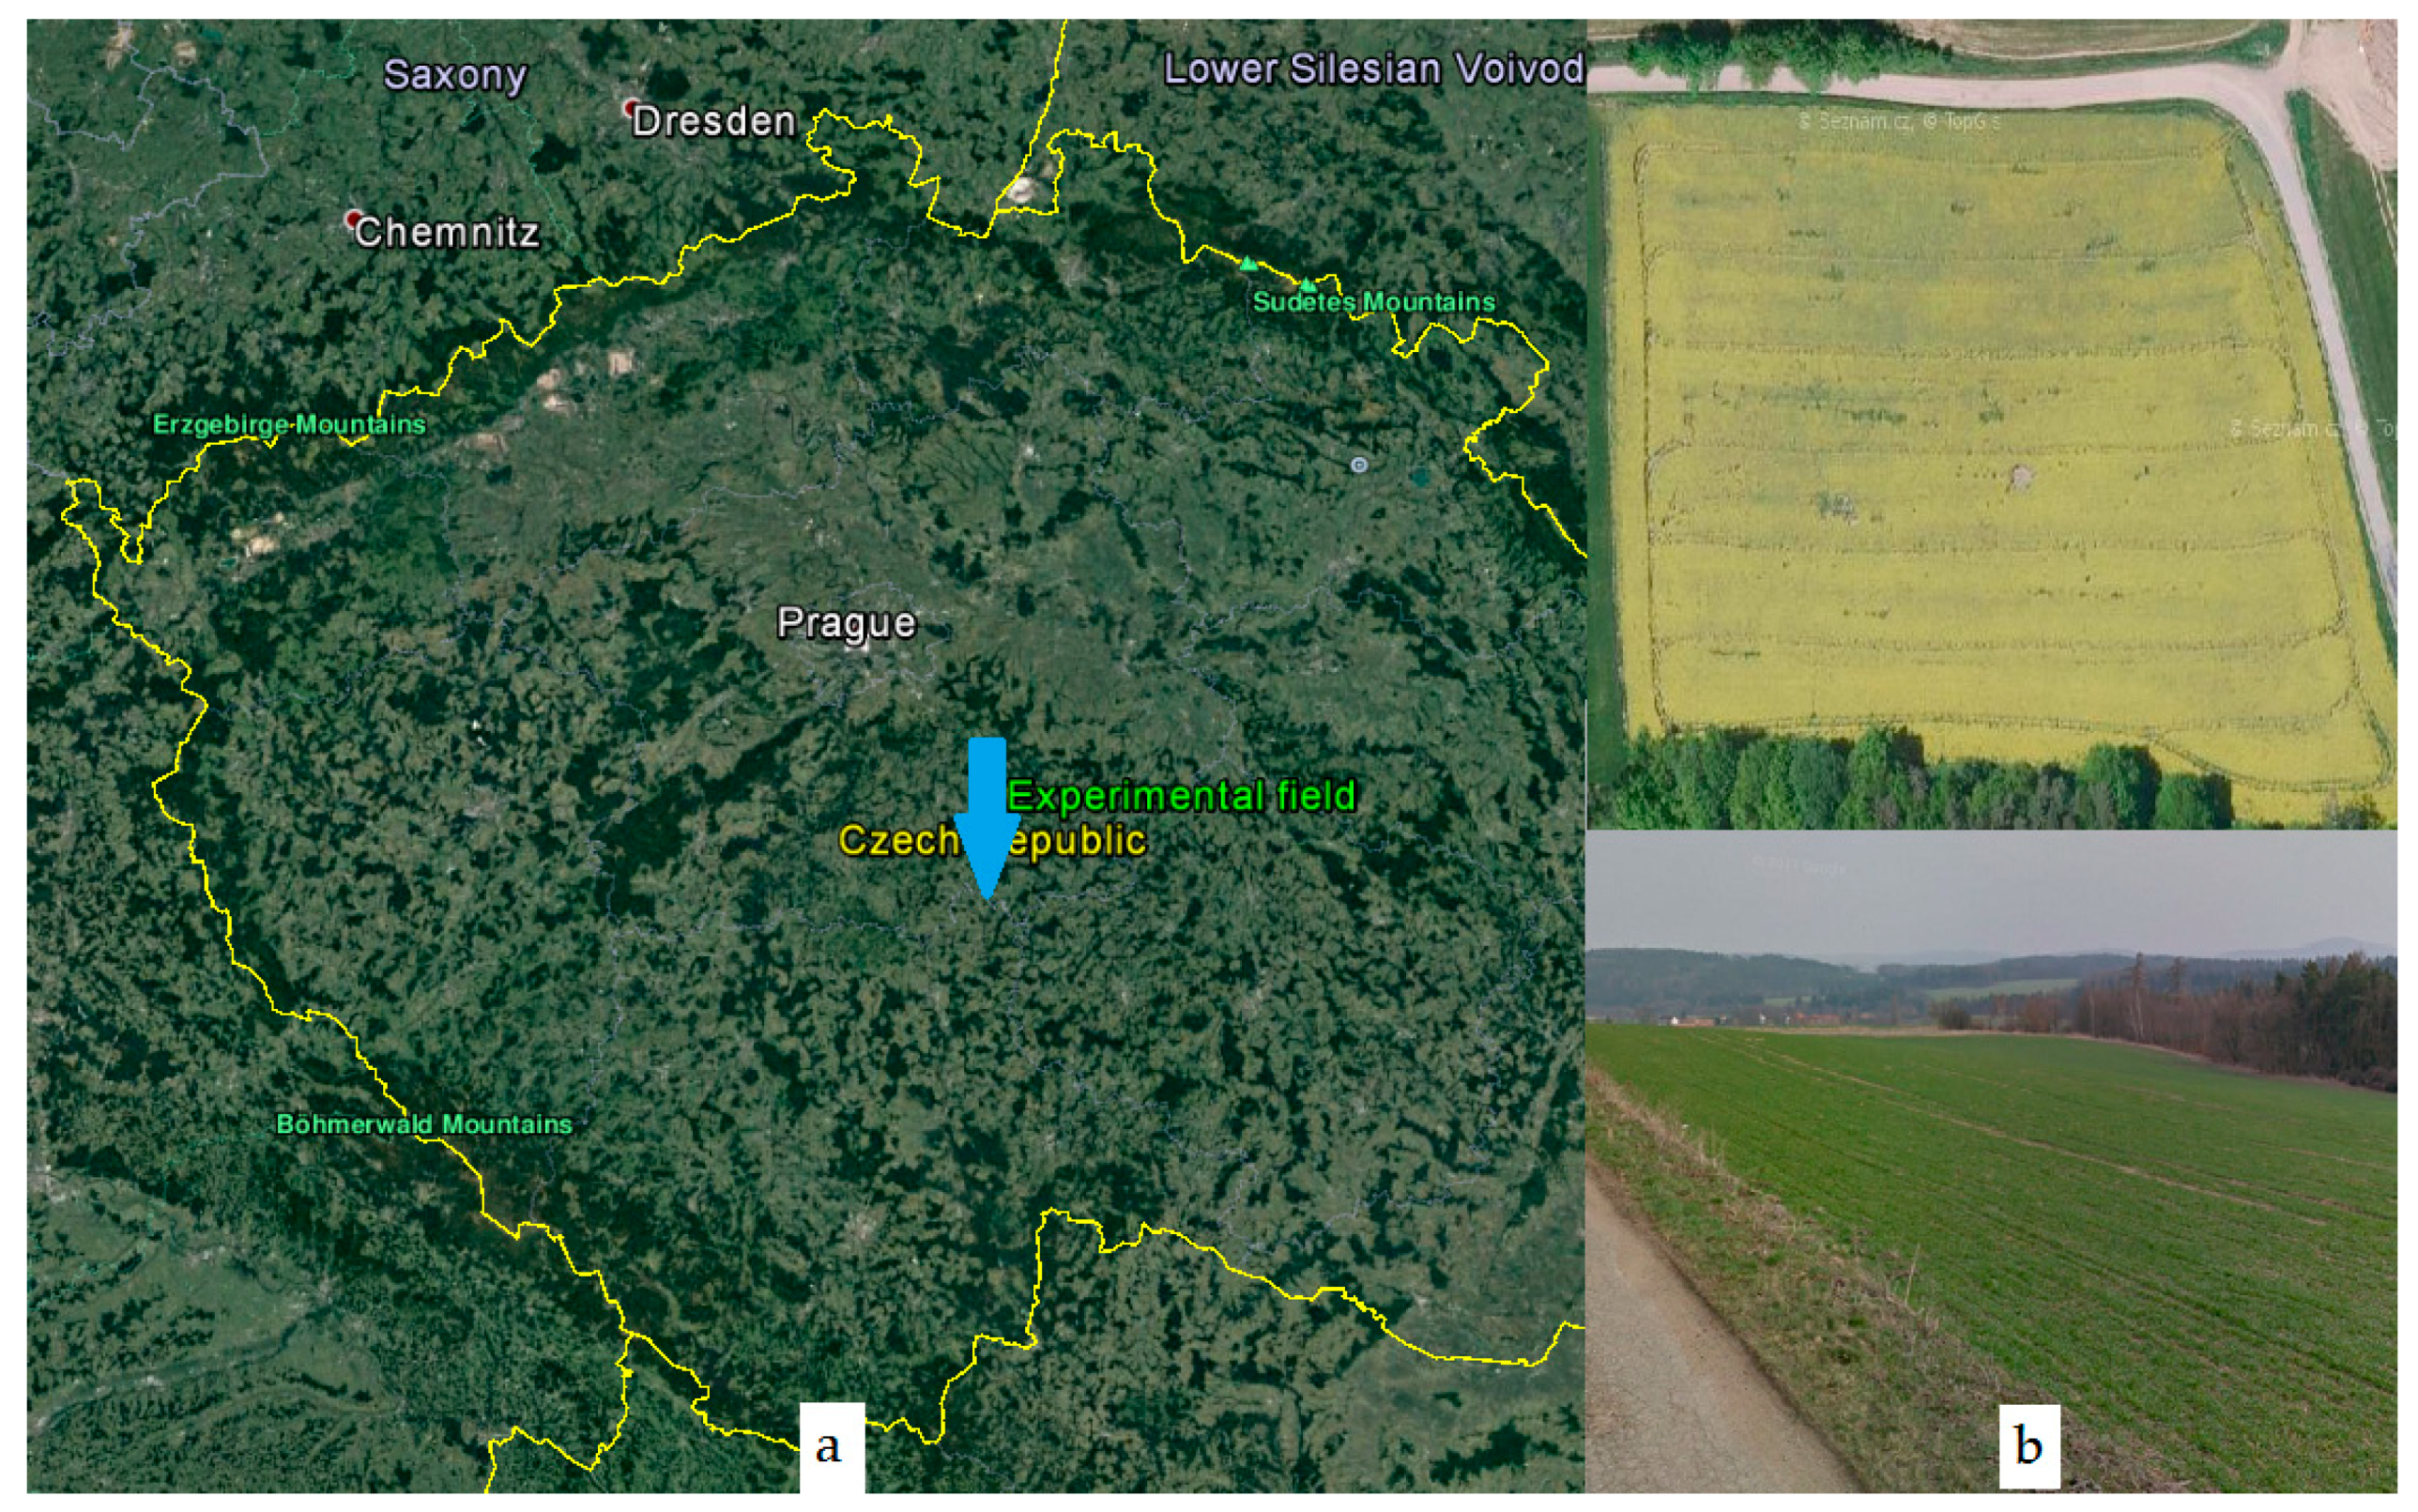
For the purposes of measurements, a field trial was laid out in the Nesperská Lhota locality in Central Bohemia. The altitude of the plot is 420 m a.s.l. The plot is situated on the border of the Vlašimská pahorkatina Hills (see Figure 1).
The plot has a north–south aspect. The area of the plot is 2.2 ha. Topographically, it is a slope with an average gradient of 9.6°. The soil on the plot is arenic cambisol. The texture class is sandy loam. Soil particle-size in topsoil is <0.002 mm—8.3% weight, 0.002–0.05 mm—36.1%, 0.05–2.0 mm—55.6%; Cox—1.23%; pHH2O—6.15. After the harvest of winter wheat (on 1st of August 2017), with an average yield of 5.5 t/ha, the straw was crushed and the plot was tilled with an Akpil disc harrow to a depth of 0.1 m (on 3 August 2017). In the second half of August, a nonselective herbicide (glyphosate) was applied to this plot to destroy sprouted grains. In early September, ploughing with a Ross plough was done to a depth of 0.22 m. After ploughing (direction along the contour), the plot was treated with levelling bars and harrow. The soil was left in this condition until the end of September 2017. In the meantime, natural soil subsidence was taking place. Undisturbed soil samples were taken at three depths before measurements—see Table 1. Kopecky cylinders of 100 cm3 in volume were used. Soil samples were also taken after the first series of measurements (determining values after the first pass by a combinator—see Table 2). The Kopecky cylinders were analyzed in laboratories of CULS in Prague. Soil moisture was measured with a ThetaProbe sensor (Delta-T Devices, Cambridge, UK). The plot slope was measured with a digital clinometer (BMI, Hersbruck, Germany).
The trial was aimed at assessing soil dislocation during secondary tillage of soil. The average soil moisture before tillage was 12.1% volume. For measurements, a Zetor 130 HSX tractor and a Lemken Kompaktor seedbed preparation combinator were used with a working width of 6 m. The working tools of the cultivator were as follows: levelling bars, a back-up roller of 0.33 m in diameter, 2-row section with duck-foot shares (with spring protection), the second back-up roller of 0.33 m in diameter, and a Crosskill roller with cleaners (diameter 0.35 m). The tillage depth (applicable to tines) was set at 0.1 m. The working speed was 7 km·h−1 in all cases. During measurements, this cultivation equipment always travelled along the contour line at three gradients of the plot (three treatments).
The trial had three treatments in relation to the cross slope of the plot (perpendicular to the direction of the equipment movement:
- Treatment 1: 2°
- Treatment 2: 6°
- Treatment 3: 11° (maximum allowable tilt range of the machine).
Metallic tracers were used for the indication of soil translocation. Aluminium cubes with a side length 16 mm were used. Poesen et al. [21] used 8-mm thick steel hexagonal nuts with a diameter of 20 mm. They seemed to be the most appropriate aluminium cubes. Van Muysen et al. [10] used numbered aluminium cubes with a side length of 15 mm. The tracer technique is described by Govers et al. [14]. The advantage is that the aluminium density is similar to the density of the mineral particles in the soil. The tracers were marked with numbers and colour. At first, a furrow 0.08 m in depth was made perpendicular (at a right angle) to the direction of the equipment movement. One series of tracers (yellow colour, numbers 1–20) was inserted in this furrow. Tracer spacing was 0.2 m. The original position was plotted in an orthogonal grid for the later measurement of translocation. Then, the furrow with located tracers was refilled with soil. The other series of 20 tracers at a spacing of 0.2 m was placed on the soil surface (tracers of silver colour, numbered 1–20 again). The two series were located at the same position and in the same order, but at two depths: 0.08 m and soil surface (see Figure 2). The original position of tracers was plotted in an orthogonal grid for all treatments. The original situation was a row of tracers perpendicular to the direction of the equipment movement at two depths for each treatment of the cross slope.
Then, the equipment passed across all three treatments. The position of individual tracers was determined with an M6 metal detector (Whites Devices). After each tracer was detected, its lengthwise and crosswise displacement in the orthogonal grid was measured. The displacement was individually assigned to each tracer from the two series. It was possible thanks to the numbers on all tracers.
After all three treatments were assessed, the original situation was renewed. The two series of tracers were located again into two perpendicular rows to the direction of passes. Two passes of the equipment for each treatment followed. The same process was repeated for three passes of the equipment.
The repeated measurements were done because multiple passes of the equipment at the same place often occur in the field during secondary tillage of soil. These operations are performed to reach better disintegration of soil aggregates (clod size).
Data were processed using the MS Excel (Microsoft Corp., Redmond, WA, USA), Statistica 12 (Statsoft Inc., Tulsa, OK, USA) and Oriana (Kovach Computing Services, Pentraeth, UK). The following kind of statistical analyses were used: descriptive statistics, ANOVA.
3. Results and Discussion
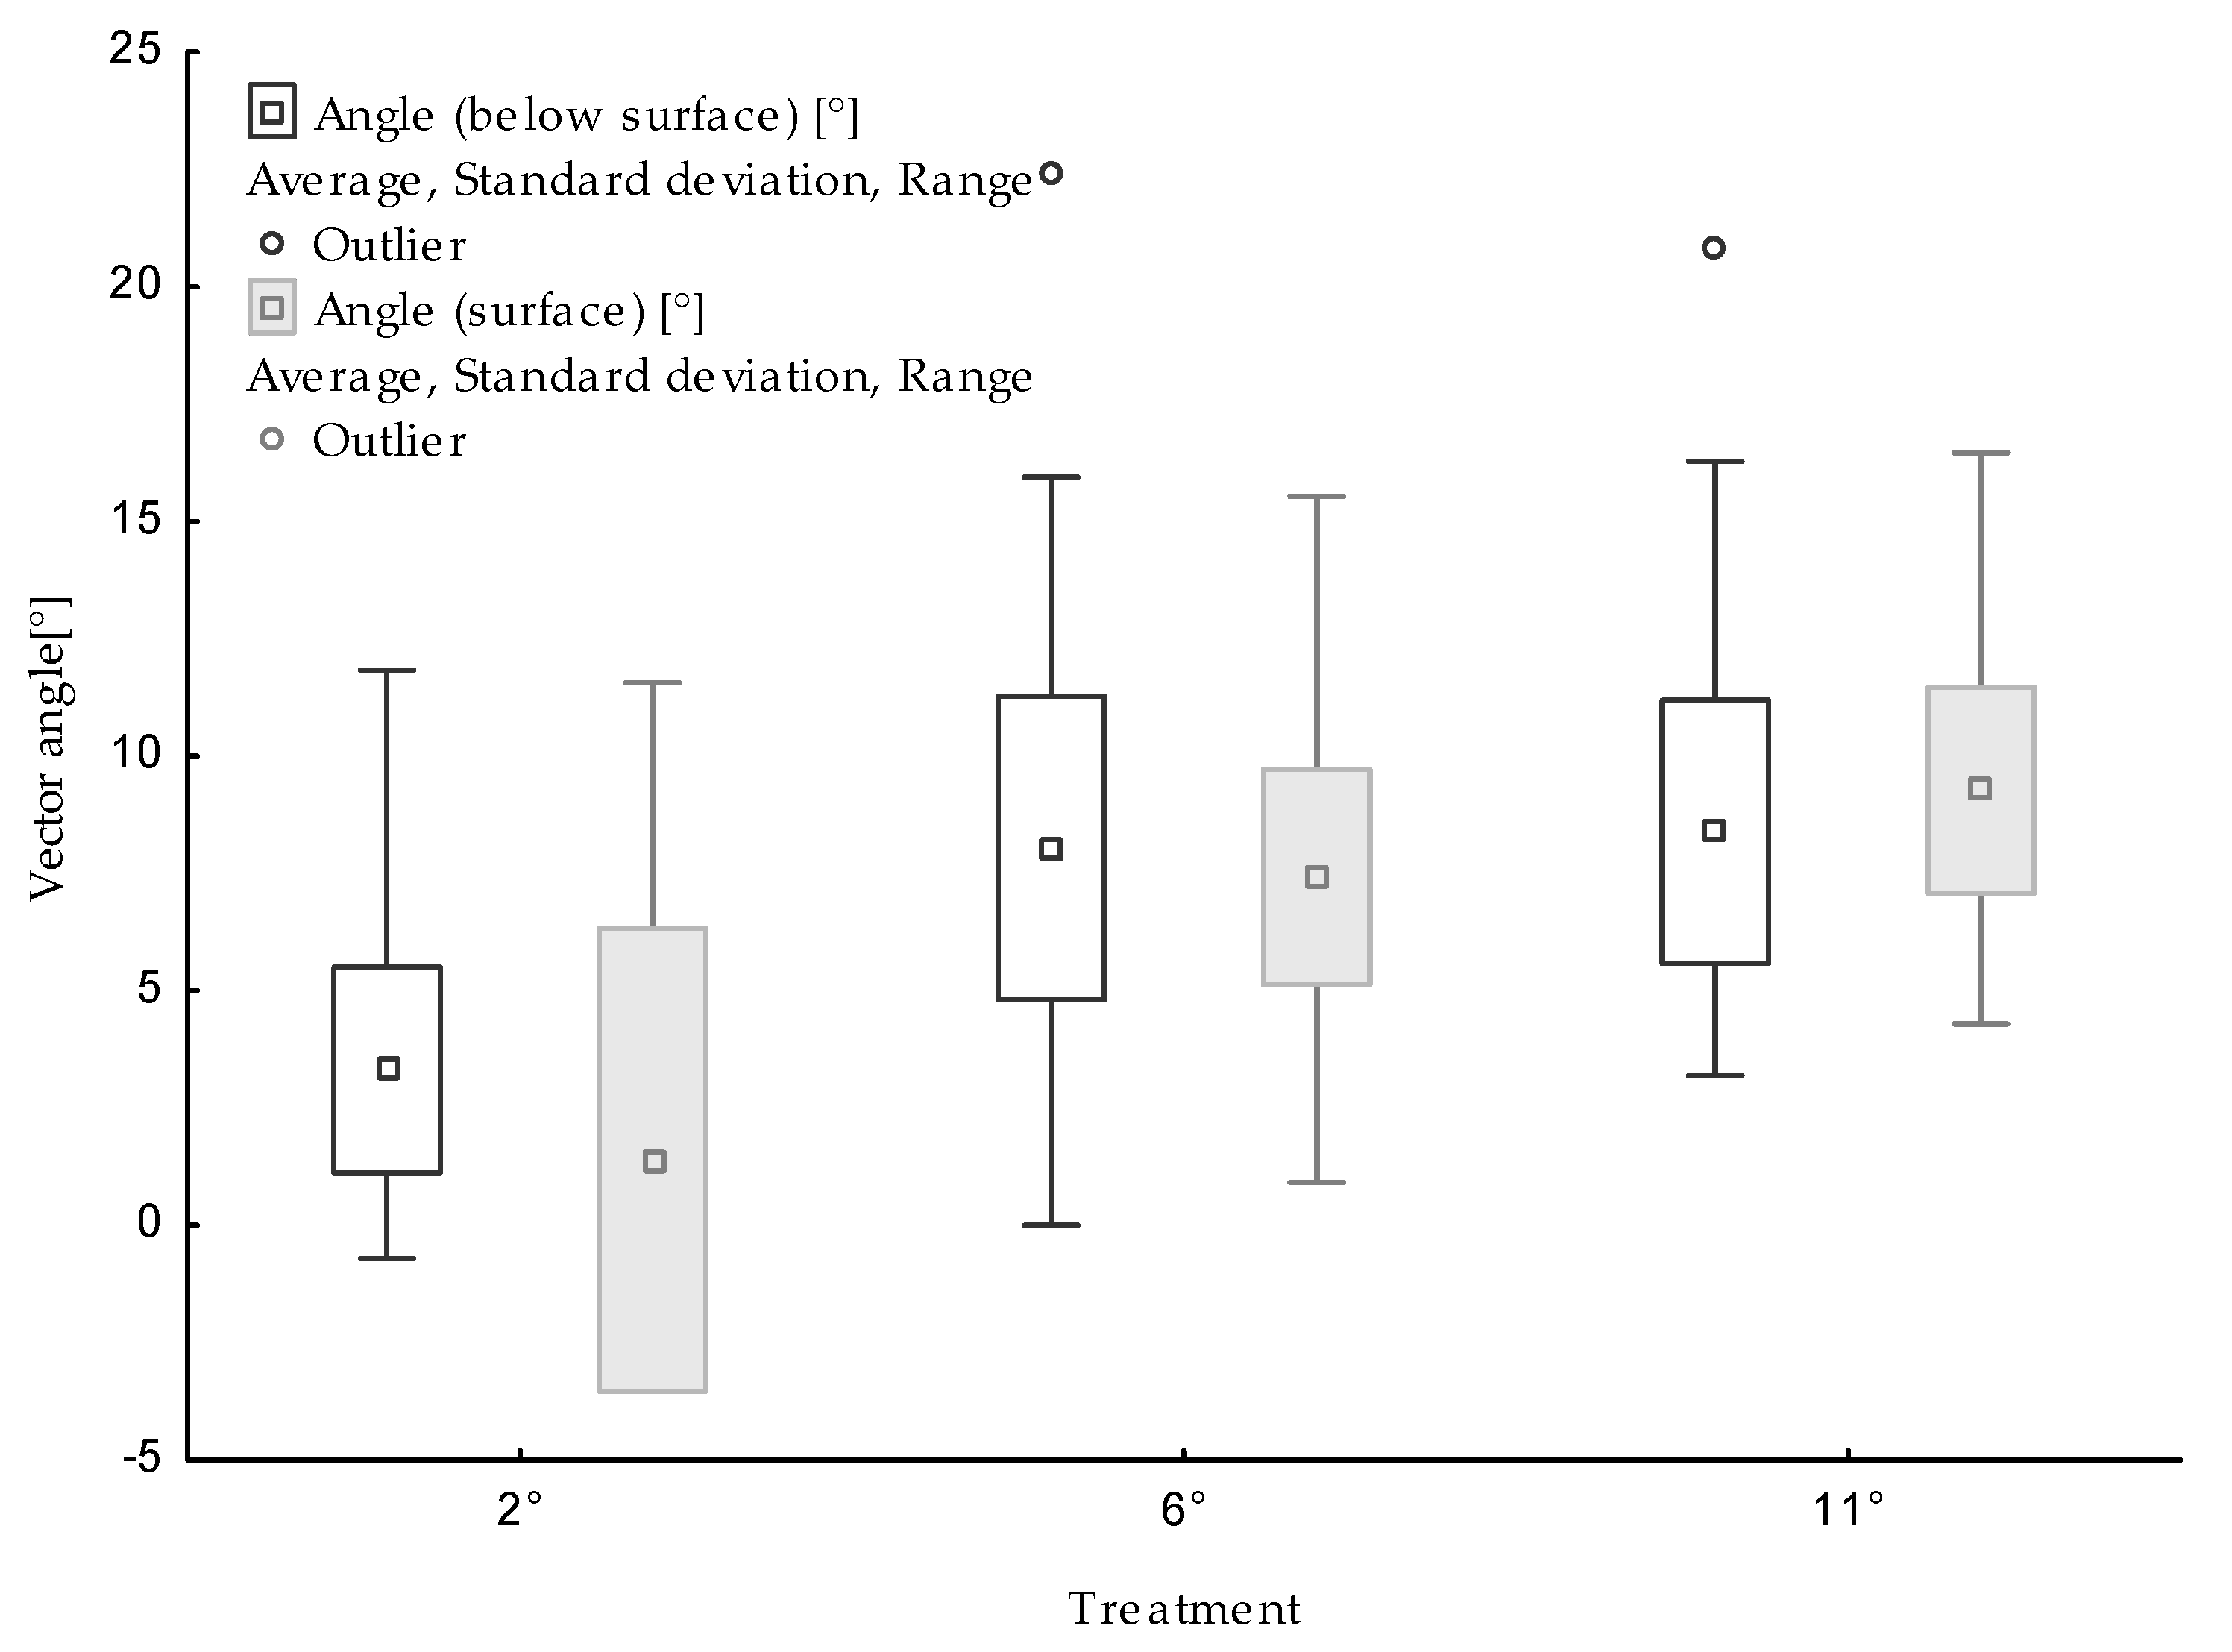
Data were evaluated with respect to the length of particle translocation and direction angle of this translocation. After the first pass, the effect of the cross slope on the direction vector of particle translocation was revealed. The length of the direction vector represents the length of translocation of particular tracers from the original location. The direction vector is the angle of the vector that indicates a difference from the direction of the equipment movement. The positive value of this angle expresses translocation in a fall line direction (perpendicular to the direction of the equipment movement). The method of measurement is described in Figure 1. The results after one pass are shown in Table 3 and in Figure 3 and Figure 4. At first, data of tracer sets from the soil surface and tracer sets located below the soil surface were compared. Tukey’s HSD test did not show a statistically significant difference between the two sets. The original location of particular tracers did not significantly influence the length of the translocation vector or its angle.
Table 3 shows the negative effect of the plot’s cross slope on the direction vector of translocation of particular tracers in all cases. In both sets of tracers, the angle increased along with the increasing cross slope. At the measurement of angles of particular tracers, a relatively high variance was observed in all cases, therefore the differences are below the level of statistical significance (Tukey’s HDS test was used again). Nevertheless, the results demonstrate the effect of the slope on particle translocation in the slope direction, even when the cultivator equipment moved along the contour lines.
The effect of the slope on the average vector length was also observed. Such an effect is not unambiguous. In the surface set of tracers, the longest average vector was found for the medium gradient of the slope. In the set of tracers located below the soil surface, a gradual increase in the average length of the translocation vector was observed. It can probably be explained by the effect of the slope on the particular sections of the cultivation equipment. Penetration of working tools (mainly tines) to a slightly greater depth was observed due to the crosswise position of the whole equipment on the slope. It causes a larger soil layer to be carried away with tines, which is related with an increase in the translocation distance.
It was also observed that the plot slope greatly influences the direction angle of the vector. It was applicable to both sets of tracers. The angle value in both sets of tracers was found to increase in relation to the slope gradient (see Table 3). It is interesting that an opposite movement of tracers against the cross slope was recorded in the smallest slope gradient (2°). In total, it applied to three tracers out of 20 in the set located on the surface and two tracers in the set below the soil surface. It was caused by the contact of tracers with the cultivator tines. On steeper slopes (6° and 11°), this phenomenon was not observed in any case, which is surprising in the treatment with one pass. Each tine from the last row can move particular tracers in both directions with the same probability.
Table 4 and Figure 5 and Figure 6 contain the results of measurements after two passes. No statistically significant differences were revealed between both segments. It is not possible to find any relationship between the cross slope gradient and the vector length in either set of tracers. In general, there was an increase in the vector length, which was due to two passes and could be expected. However, an increase in the translocation distance was not great. It can probably be explained by the fact that the cultivator works with smaller soil aggregates during the second pass when most clods have already been disintegrated. Smaller soil aggregates are carried away by working tools of the equipment to a lesser extent.
This is consistent with the results of the vector angle evaluation. Here, a direct effect of the cross slope on the direction vector during particle translocation was confirmed again. In this case, unambiguously in both sets, an increase in the angle value in the cross slope direction was observed in the course of secondary tillage. The direction angle was generally larger in one pass of the equipment. As in the first case, a high variance of the values was found. The crosswise movement against the slope was also recorded after two passes. Such movement was recorded in one tracer during measurements on the slope of 2° and also in one tracer on the medium slope. However, the repeated pass causes a more pronounced downslope translocation of particles when the cultivator for secondary tillage moves along the contour line.
Table 5 and Figure 7 and Figure 8 contain the results from measuring three passes of the equipment. There were no distinct differences between the two sets of tracers, even in the third case. Relatively large differences (but below the statistical significance level) were found in the vector length. The absolutely longest average translocation of the set of tracers was observed in below-surface tracers on the smallest cross slope—on average more than 5 m. However, in three passes of the equipment, it is not possible to find a relationship between the vector length and the cross slope gradient.
The results of the evaluation of direction vectors are quite surprising. Contrary to the preceding treatment, there was a decrease in the average value of the vector angle. Such a decrease occurred in all three gradients of the cross slope. This decrease is probably caused by the disintegration of soil aggregates. During the third pass, the cultivator tills the soil without larger fractions and the soil layer is not carried away with working tools. Paradoxically, in no tracer was the crosswise translocation against the slope revealed even though the average value dropped. The variance of values was lowest for treatments with three passes.
4. Discussion
Many authors have dealt with the longitudinal translocation of particles during tillage [10,11,12,13,19]. The longitudinal translocation of particles is always more significant. Studies on tillage erosion have so far been devoted to the longitudinal effects of individual machines, or their combinations [3,4,7,18]. Many studies also assess the effect of the slope on the range of particle translocation [10,11,19,20]. The influence of sloping land on the quantity of translocated particles is evident. Conclusively, downslope movement of the machine indicated a higher potential of particle translocation than movement on the flat ground or upslope. A conclusion is drawn that the upslope movement of the machine cannot be understood as a full-value corrective measure to the incorrectly chosen direction of downslope movement [20]. An optimization of the movement direction when the land topography is respected seems to be the most effective measure.
However, this recommended procedure does not involve the transverse translocation of particles. Crosswise translocation, especially on slopes, has been studied very little. However, this phenomenon occurs during soil tillage and should be further investigated. Of course, the existence of crosswise translocation has been reported by many authors [13,17,18,19,20]. Hůla et al. [22] found that the soil pollination may translocate soil particles to a different extent, both in the direction of the machine movement and in a crosswise direction. In their study, they describe the longitudinal and transverse displacement of soil particles for three basic machines of primary soil tillage (disc harrow, tine cultivator and five-share plough). However, the transverse effect was not quantified in this study. This study demonstrates the downslope translocation of particles during the work of the cultivator along the contour. Nevertheless, this study is the first step in exploring this phenomenon, and it is necessary to subdue it to further exploration for multiple soil tillage machines and technologies.
Measurement results can be affected by the properties of used tracers. In this case, aluminium cubes were used. The same material of tracers was used by Van Muysen et al. [10]. Aluminium density is greater than soil density, but the difference between is not too great. Some authors also use steel nuts for example [21]. The difference in density, in this case, is far greater. However, Rahman et al. [23] found no significant difference due to the tracer size or density. The result of this study is quite surprising. Other authors admit possible variation in size and material of tracers [20,24]. The influence of used tracers on the direction of transfer of the particles during tillage will need to be further investigated.
5. Conclusions
Particle translocation, particularly in the tillage direction, is evaluated in commonly available studies. Crosswise movement belongs among phenomena that have been studied very little until now. Our measurements indicate the effect of the cross slope gradient on the direction of particle translocation during secondary tillage of soil. The effect of multiple passes was not directly demonstrated. Neither was the effect of the cross slope on the average length of particle movement observed. The study of crosswise translocation phenomena is only at its beginning. It is necessary to further investigate the effect of other equipment and technologies of soil tillage. Obviously, the recommended contour farming on slopes can have impacts on downslope particle translocation. Of course, crosswise translocation and its effect will always be smaller than lengthwise movement, i.e., in the soil tillage direction.
Author Contributions
N.P. and H.J. designed the experiments, together performed the experiments and analyzed the data; N.P. contributed trial plot, tractor and all equipment; N.P. and H.J. wrote the paper.
Acknowledgments
Supported by the Ministry of Agriculture of the Czech Republic—Project No. QJ1520028.
Conflicts of Interest
The authors declare no conflict of interest. The founding sponsors had no role in the design of the study; in the collection, analyses, or interpretation of data; in the writing of the manuscript, and in the decision to publish the results.
References
- Janeček, M.; Bohuslávek, J.; Dumbrovský, M.; Gergel, J.; Hrádek, F.; Kovář, P.; Kubátová, E.; Pasák, V.; Pivcová, J.; Tippl, M.; et al. Anti-Erosion Protection of Agricultural Land; ISV: Prague, Czech Republic, 2002; pp. 21–23. ISBN 85866-85-8. (In Czech) [Google Scholar]
- Novotný, I.; Mistr, M.; Papaj, V.; Kristenová, H.; Váňová, V.; Kapička, J.; Vlček, V.; Vopravil, J.; Kulířová, P.; Kadlec, V.; et al. Guide of Protection against Water Erosion; Ministry of Agriculture of the Czech Republic: Prague, Czech Republic, 2014; 72p, ISBN 978-80-87361-33-7. (In Czech)
- Govers, G.; Lobb, D.A.; Quine, T.A. Tillage erosion and translocation: Emergence of new paradigm in soil erosion research. Soil Tillage Res. 1999, 51, 167–174. [Google Scholar]
- Wang, Y.; Zhang, J.H.; Zhang, Z.H.; Jia, L.Z. Impact of tillage erosion on water erosion in a hilly landscape. Sci. Total Environ. 2016, 551, 522–532. [Google Scholar] [CrossRef] [PubMed]
- Morgan, R.P.C. Soil Erosion and Conservation; Wiley-Blackwell: Hoboken, NJ, USA, 2005; 304p, ISBN 978-1-405-11781-4. [Google Scholar]
- Takken, I.; Govers, G.; Jetten, V.; Nachtergaele, J.; Steegen, A.; Poesen, J. Effect of tillage on runoff and erosion patterns. Soil Tillage Res. 2001, 61, 55–60. [Google Scholar] [CrossRef]
- Li, S.; Lobb, D.A.; Lindstrom, M.J. Tillage translocation and tillage erosion in cereal-based production in Manitoba, Canada. Soil Tillage Res. 2007, 94, 164–182. [Google Scholar] [CrossRef]
- Lobb, D.A.; Kachanoski, R.G. Modelling tillage erosion in topographically complex landscapes of southwestern Ontario, Canada. Soil Tillage Res. 1999, 51, 261–278. [Google Scholar] [CrossRef]
- Li, S.; Lobb, D.A.; Lindstrom, M.J.; Papiernik, S.K.; Farenhorst, A. Modeling tillage-induced redistribution of soil mass and its constituents within different landscapes. Soil Sci. Soc. Am. J. 2008, 1, 167–179. [Google Scholar] [CrossRef]
- Van Muysen, W.; Oost, K.; Govers, G. Soil translocation resulting from multiple passes of tillage under normal field operating conditions. Soil Tillage Res. 2006, 87, 218–230. [Google Scholar] [CrossRef]
- Van Muysen, W.; Govers, G.; Van Oost, K. Identification of important factors in the process of tillage erosion: The case of mouldboard tillage. Soil Tillage Res. 2002, 65, 77–93. [Google Scholar] [CrossRef]
- Quine, T.A.; Govers, G.; Poessen, G.; Walling, D.; van Wesemael, B.; Martinez-Fernandez, J. Fine-earth translocation by tillage in stony soils in the Guadelentin, south-east Spain: An investigation using caesium-1341. Soil Tillage Res. 1999, 51, 279–301. [Google Scholar] [CrossRef]
- Van Oost, K.; Govers, G.; de Alba, S.; Quine, T.A. Tillage erosion: A review of controlling factors and implications for soil quality. Prog. Phys. Geogr. 2006, 4, 443–466. [Google Scholar] [CrossRef] [Green Version]
- Govers, G.; Vandaele, K.; Desmet, P.; Poesen, J.; Bunte, K. The role of tillage in soil redistribution on hillslopes. Eur. J. Soil Sci. 1994, 45, 469–478. [Google Scholar] [CrossRef]
- Lindstrom, M.J.; Nelson, W.W.; Schumacher, T.E. Quantifying tillage erosion rates due to moldboard plowing. Soil Tillage Res. 1992, 24, 243–255. [Google Scholar] [CrossRef]
- Novák, P.; Hůla, J. Translocation of the upper soil layer in multiple operations of seedbed preparation. Res. Agric. Eng. 2017, 63, S46–S52. [Google Scholar]
- Vieira, D.A.N.; Dabney, S.M. Modeling edge effects of tillage erosion. Soil Tillage Res. 2011, 111, 197–207. [Google Scholar] [CrossRef]
- Tiessen, K.H.D.; Lobb, D.A.; Mehuys, G.R.; Rees, H.W. Tillage erosion within potato production in Atlantic Canada: II Erosivity of primary and secondary tillage operations. Soil Tillage Res. 2007, 95, 320–331. [Google Scholar] [CrossRef]
- Heckrath, G.; Halekoh, U.; Djurhuus, J.; Govers, G. The effect of tillage direction on soil redistribution by mouldboard ploughing on complex slopes. Soil Tillage Res. 2006, 88, 225–241. [Google Scholar] [CrossRef]
- Novák, P.; Hůla, J. The influence of sloping land on soil particle translocation during secondary tillage. Agron. Res. 2017, 15, 799–805. [Google Scholar]
- Poesen, J.; Van Wesemael, B.; Govers, G.; Martinez-Fernandez, J.; Desmet, P.; Vandaele, K.; Quine, T.; Degraer, G. Patterns of rock fragment cover generated by tillage erosion. Geomorphology 1997, 18, 183–197. [Google Scholar] [CrossRef]
- Hůla, J.; Novák, P. Translocation of soil particles during primary soil tillage. Agron. Res. 2016, 14, 392–399. [Google Scholar]
- Rahman, S.; Lobb, D.A.; Chen, Y. Size and density of point-tracers for use in soil translocation studies. In Proceedings of the 45th Annual Meeting, Winnipeg, MB, Canada, 5–6 February 2002; Manitoba Soil Science Society: Manitoba, MB, Canada, 2002. [Google Scholar]
- MacLeod, C.J.; Lobb, D.A.; Chen, Y. The relationships between tillage translocation, tillage depth and draught for sweeps. In Proceedings of the 43rd Annual Manitoba Soil Science Society Meeting, Winnipeg, MB, Canada, 25–26 January 2000; Manitoba Soil Science Society: Winnipeg, MB, Canada, 2000; pp. 195–199. [Google Scholar]
Figure 1.
Experiment location (a) and field photo (b).

Figure 2.
Design of tracers (location) before pass: (a) Description of measures; (b) One series of tracers.
Figure 2.
Design of tracers (location) before pass: (a) Description of measures; (b) One series of tracers.
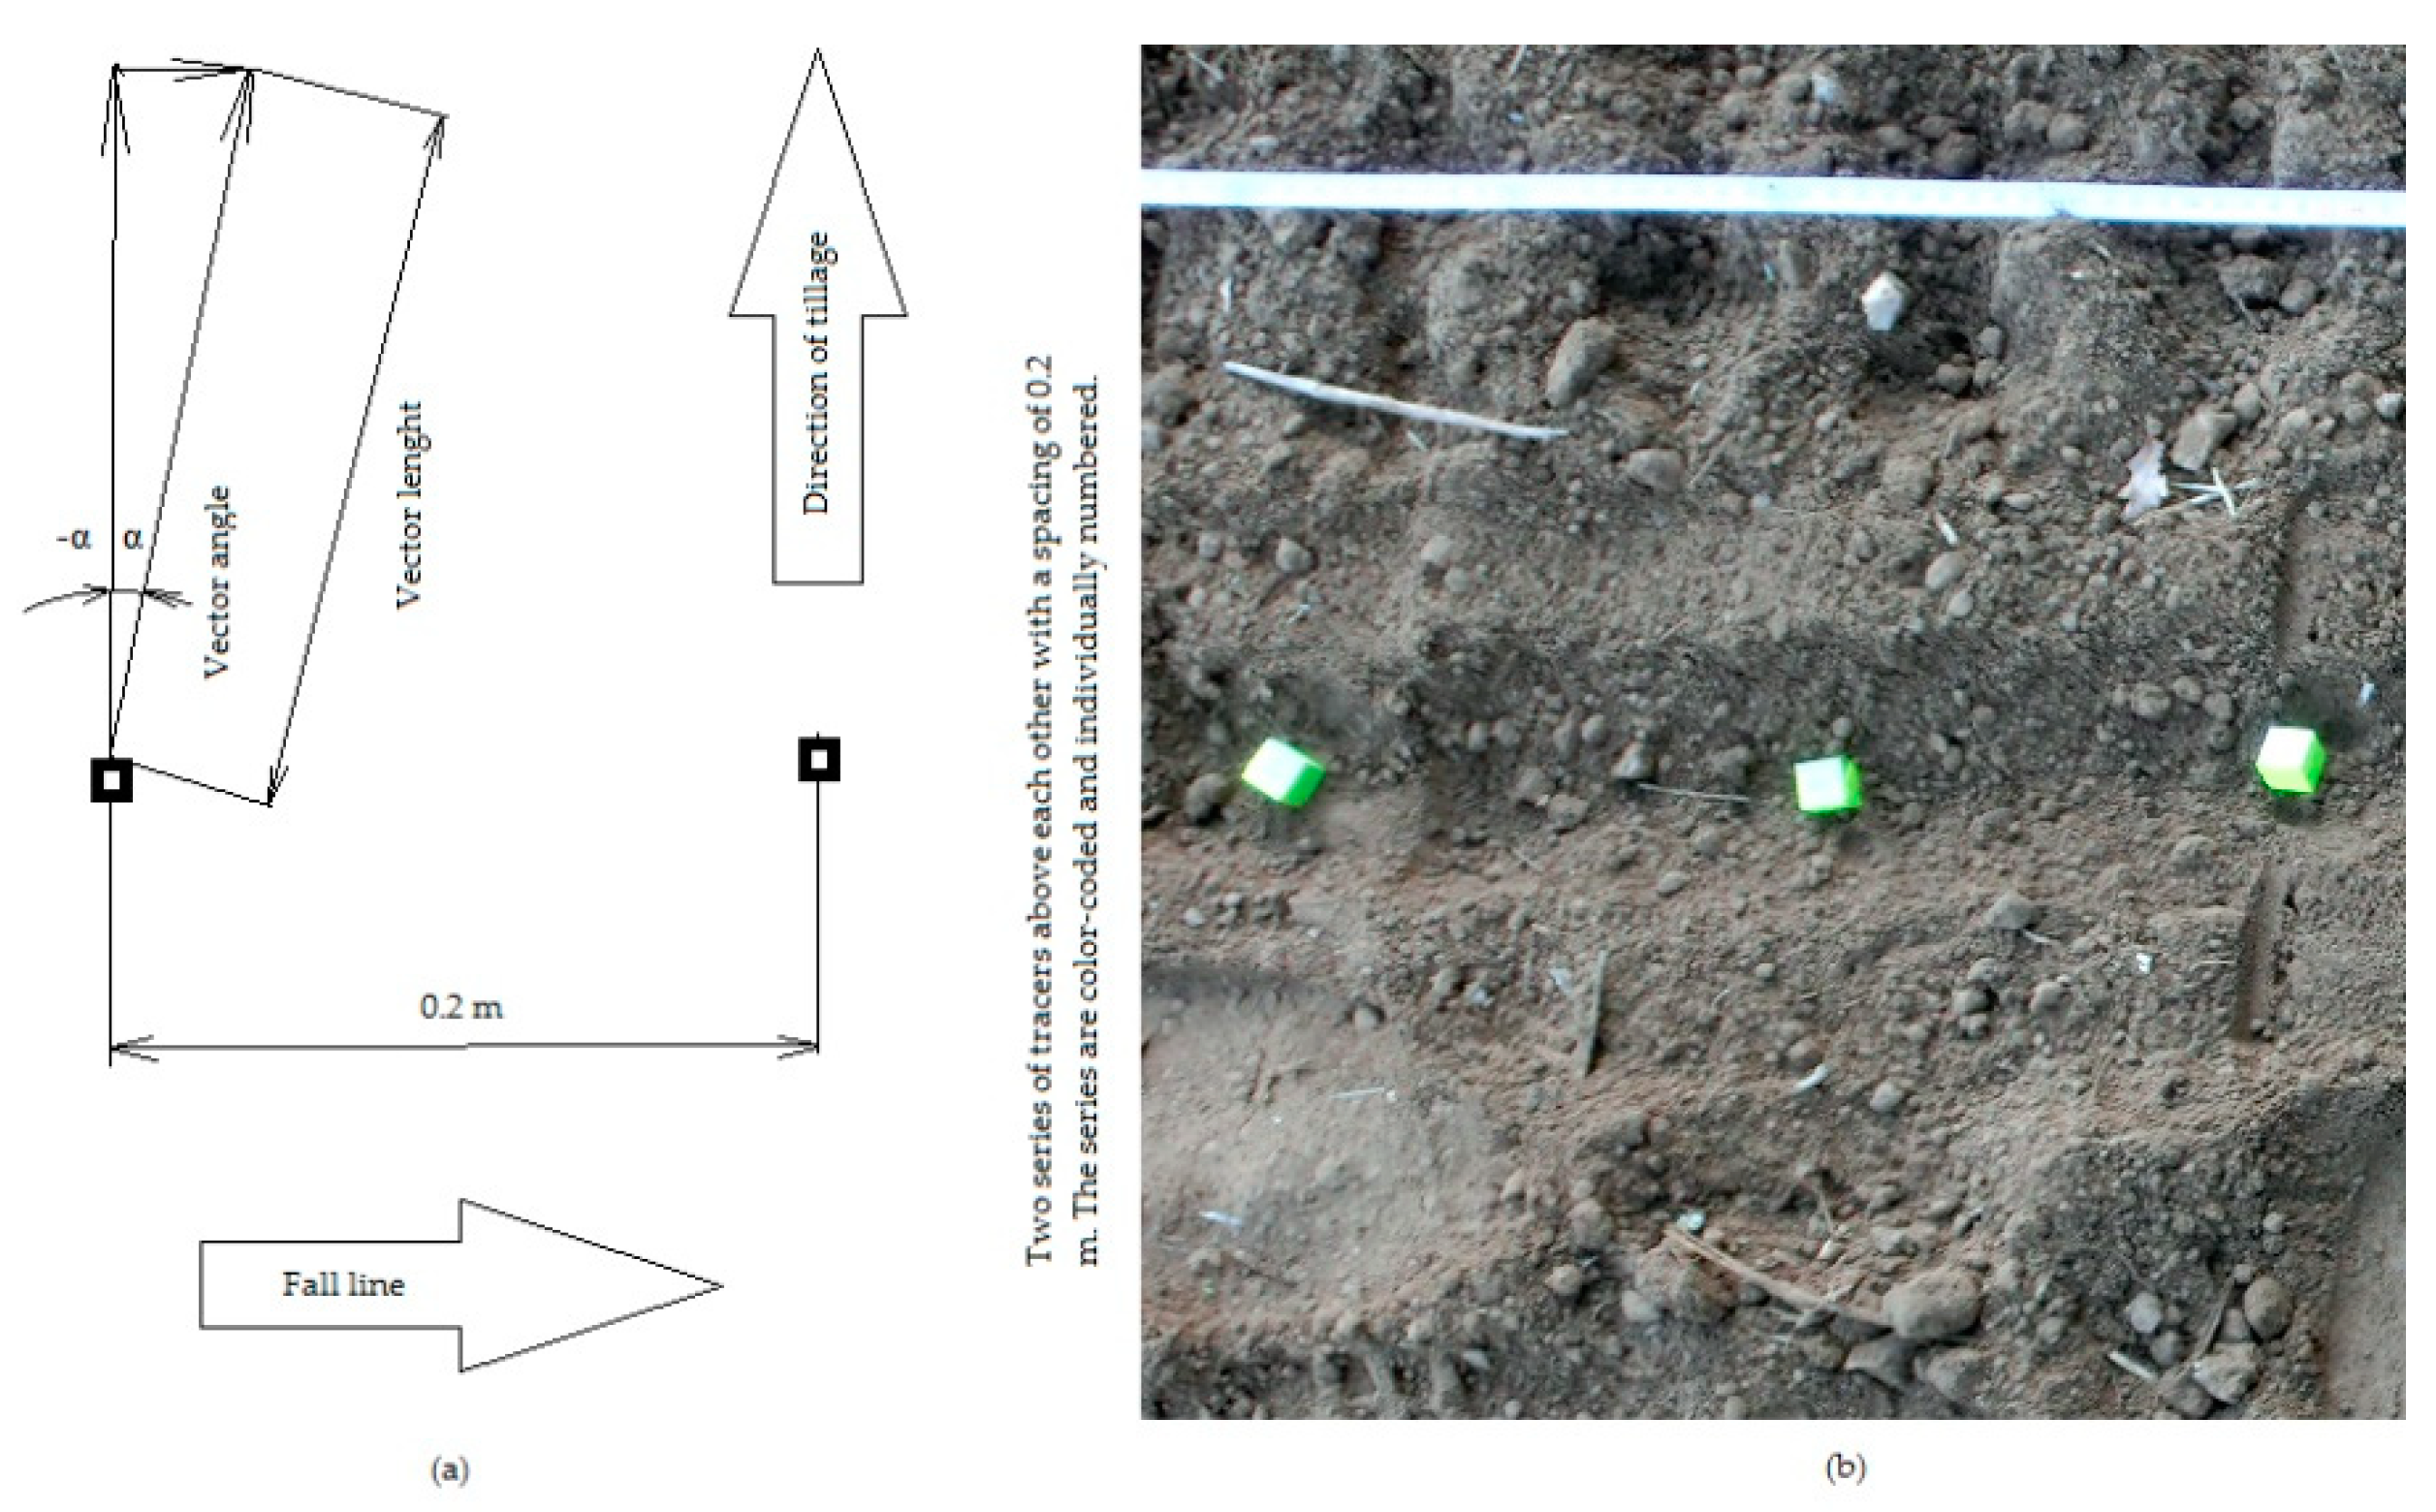
Figure 3.
Vector length after one pass.
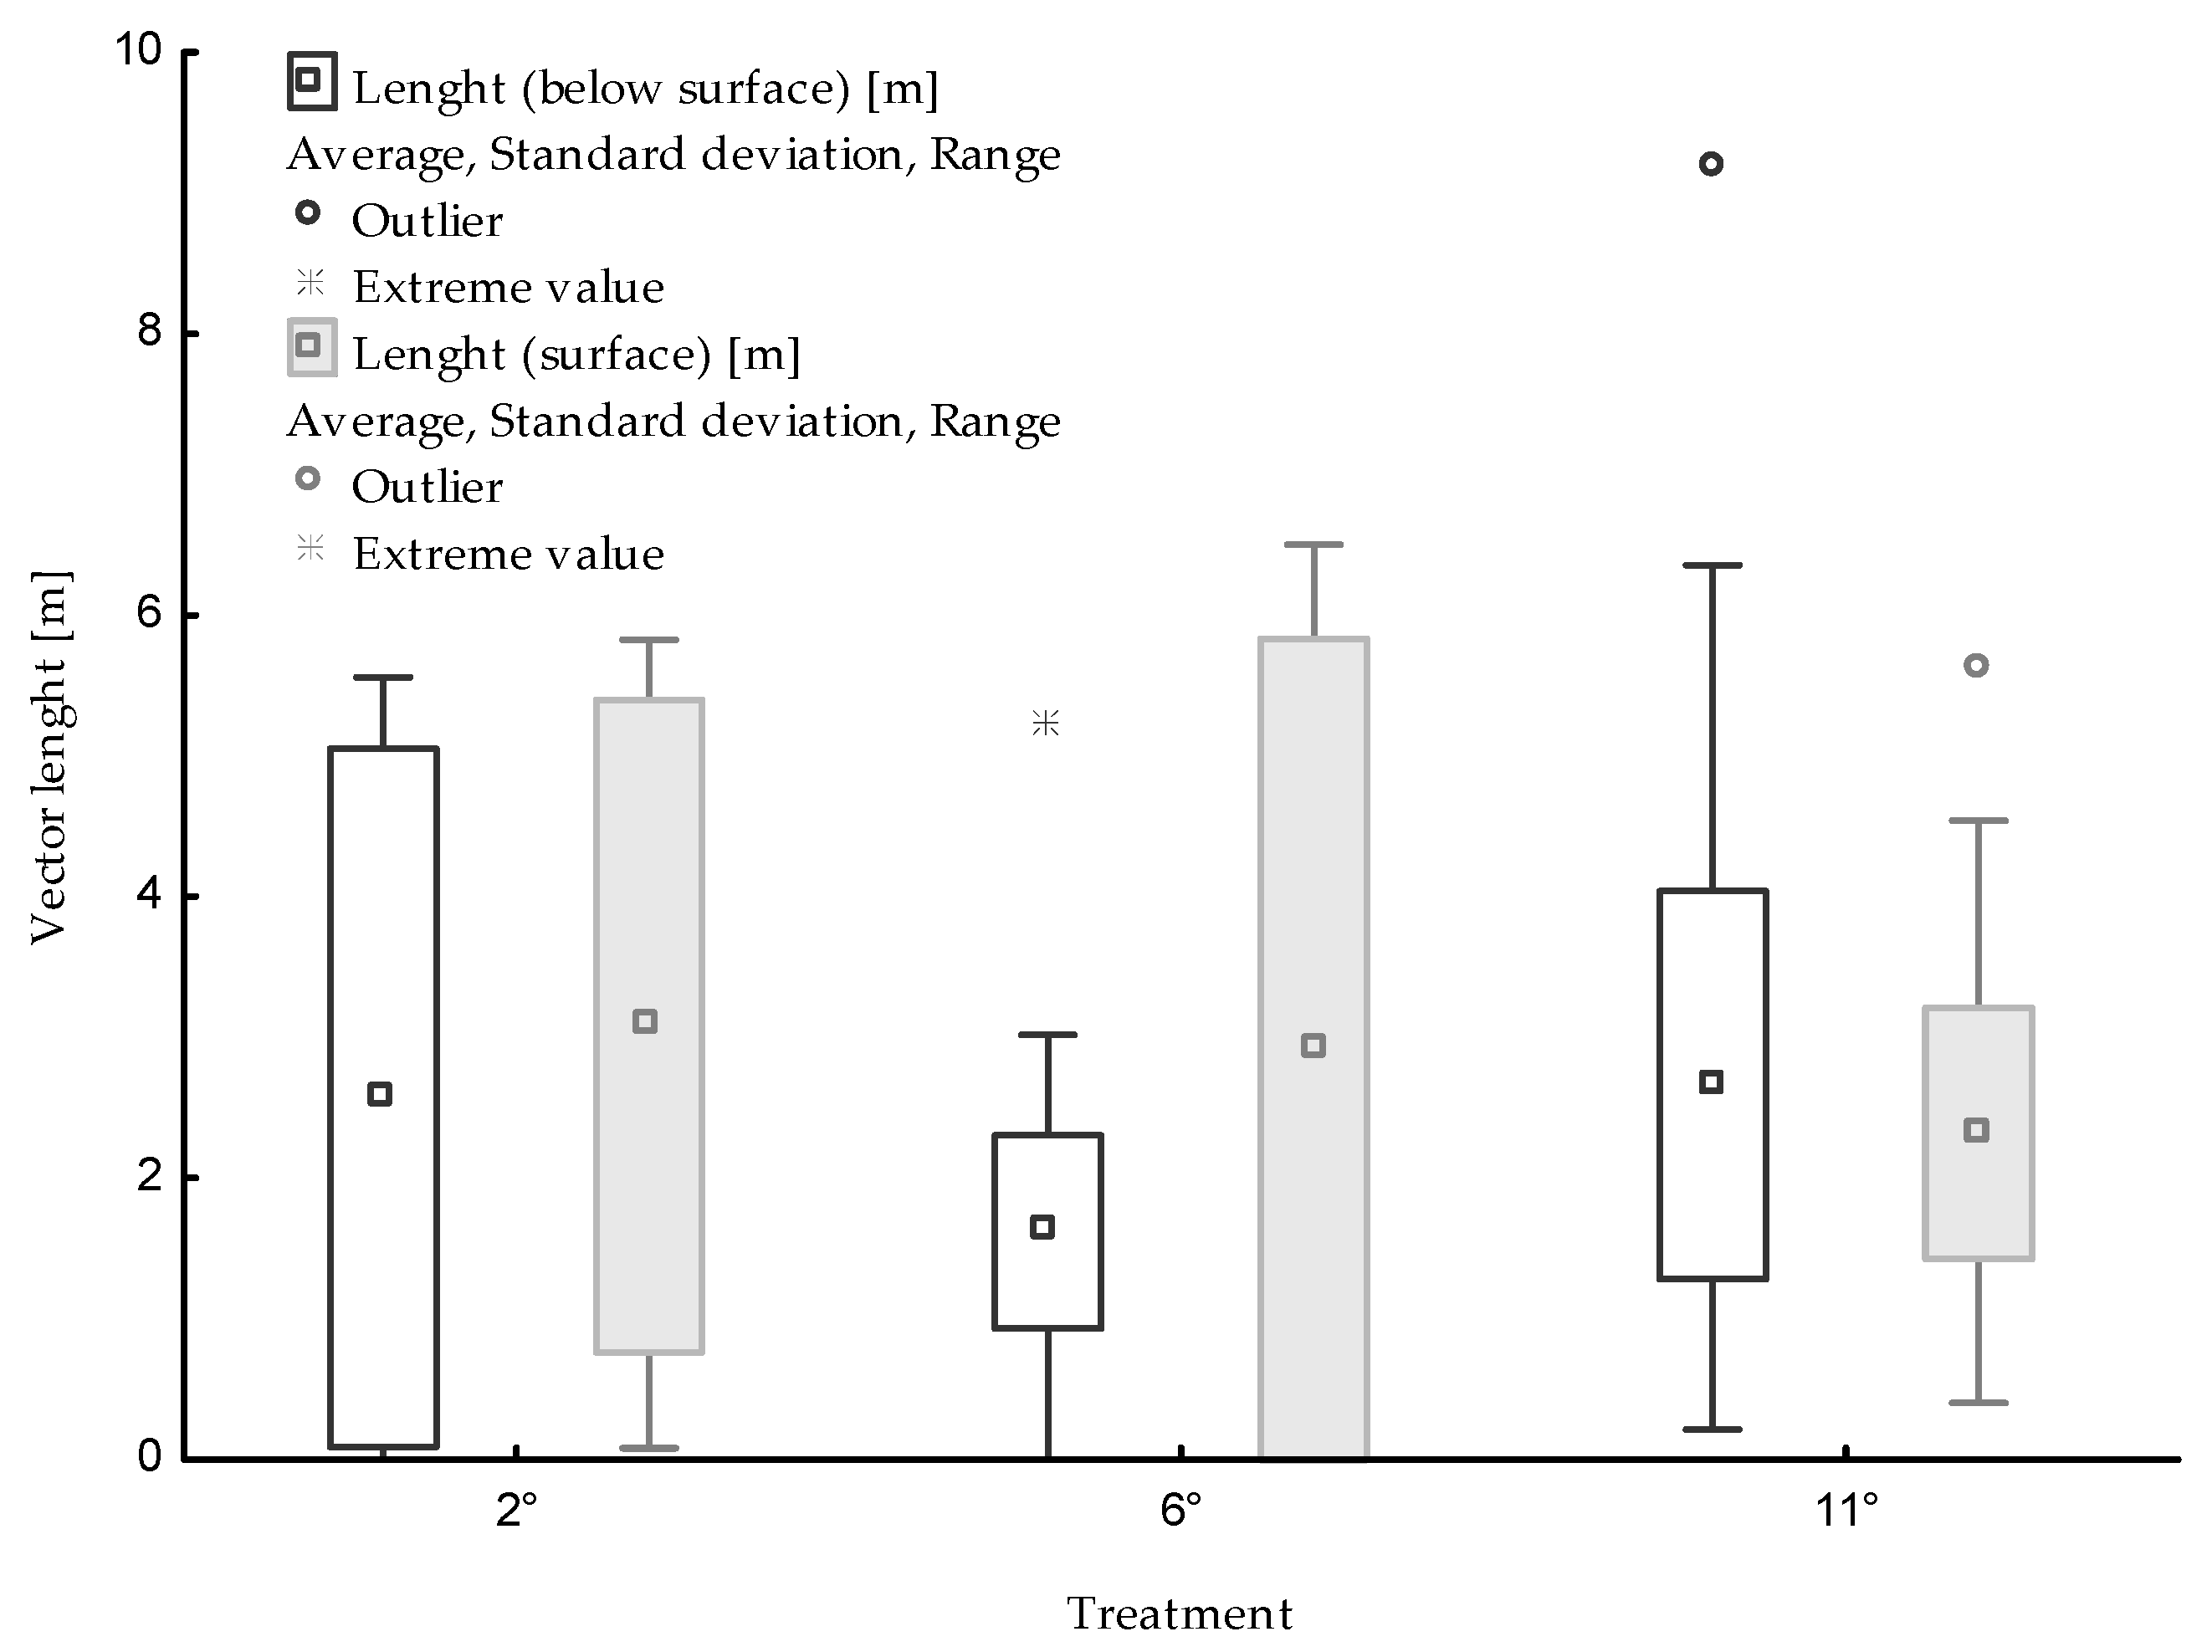
Figure 4.
Vector angle after one pass.
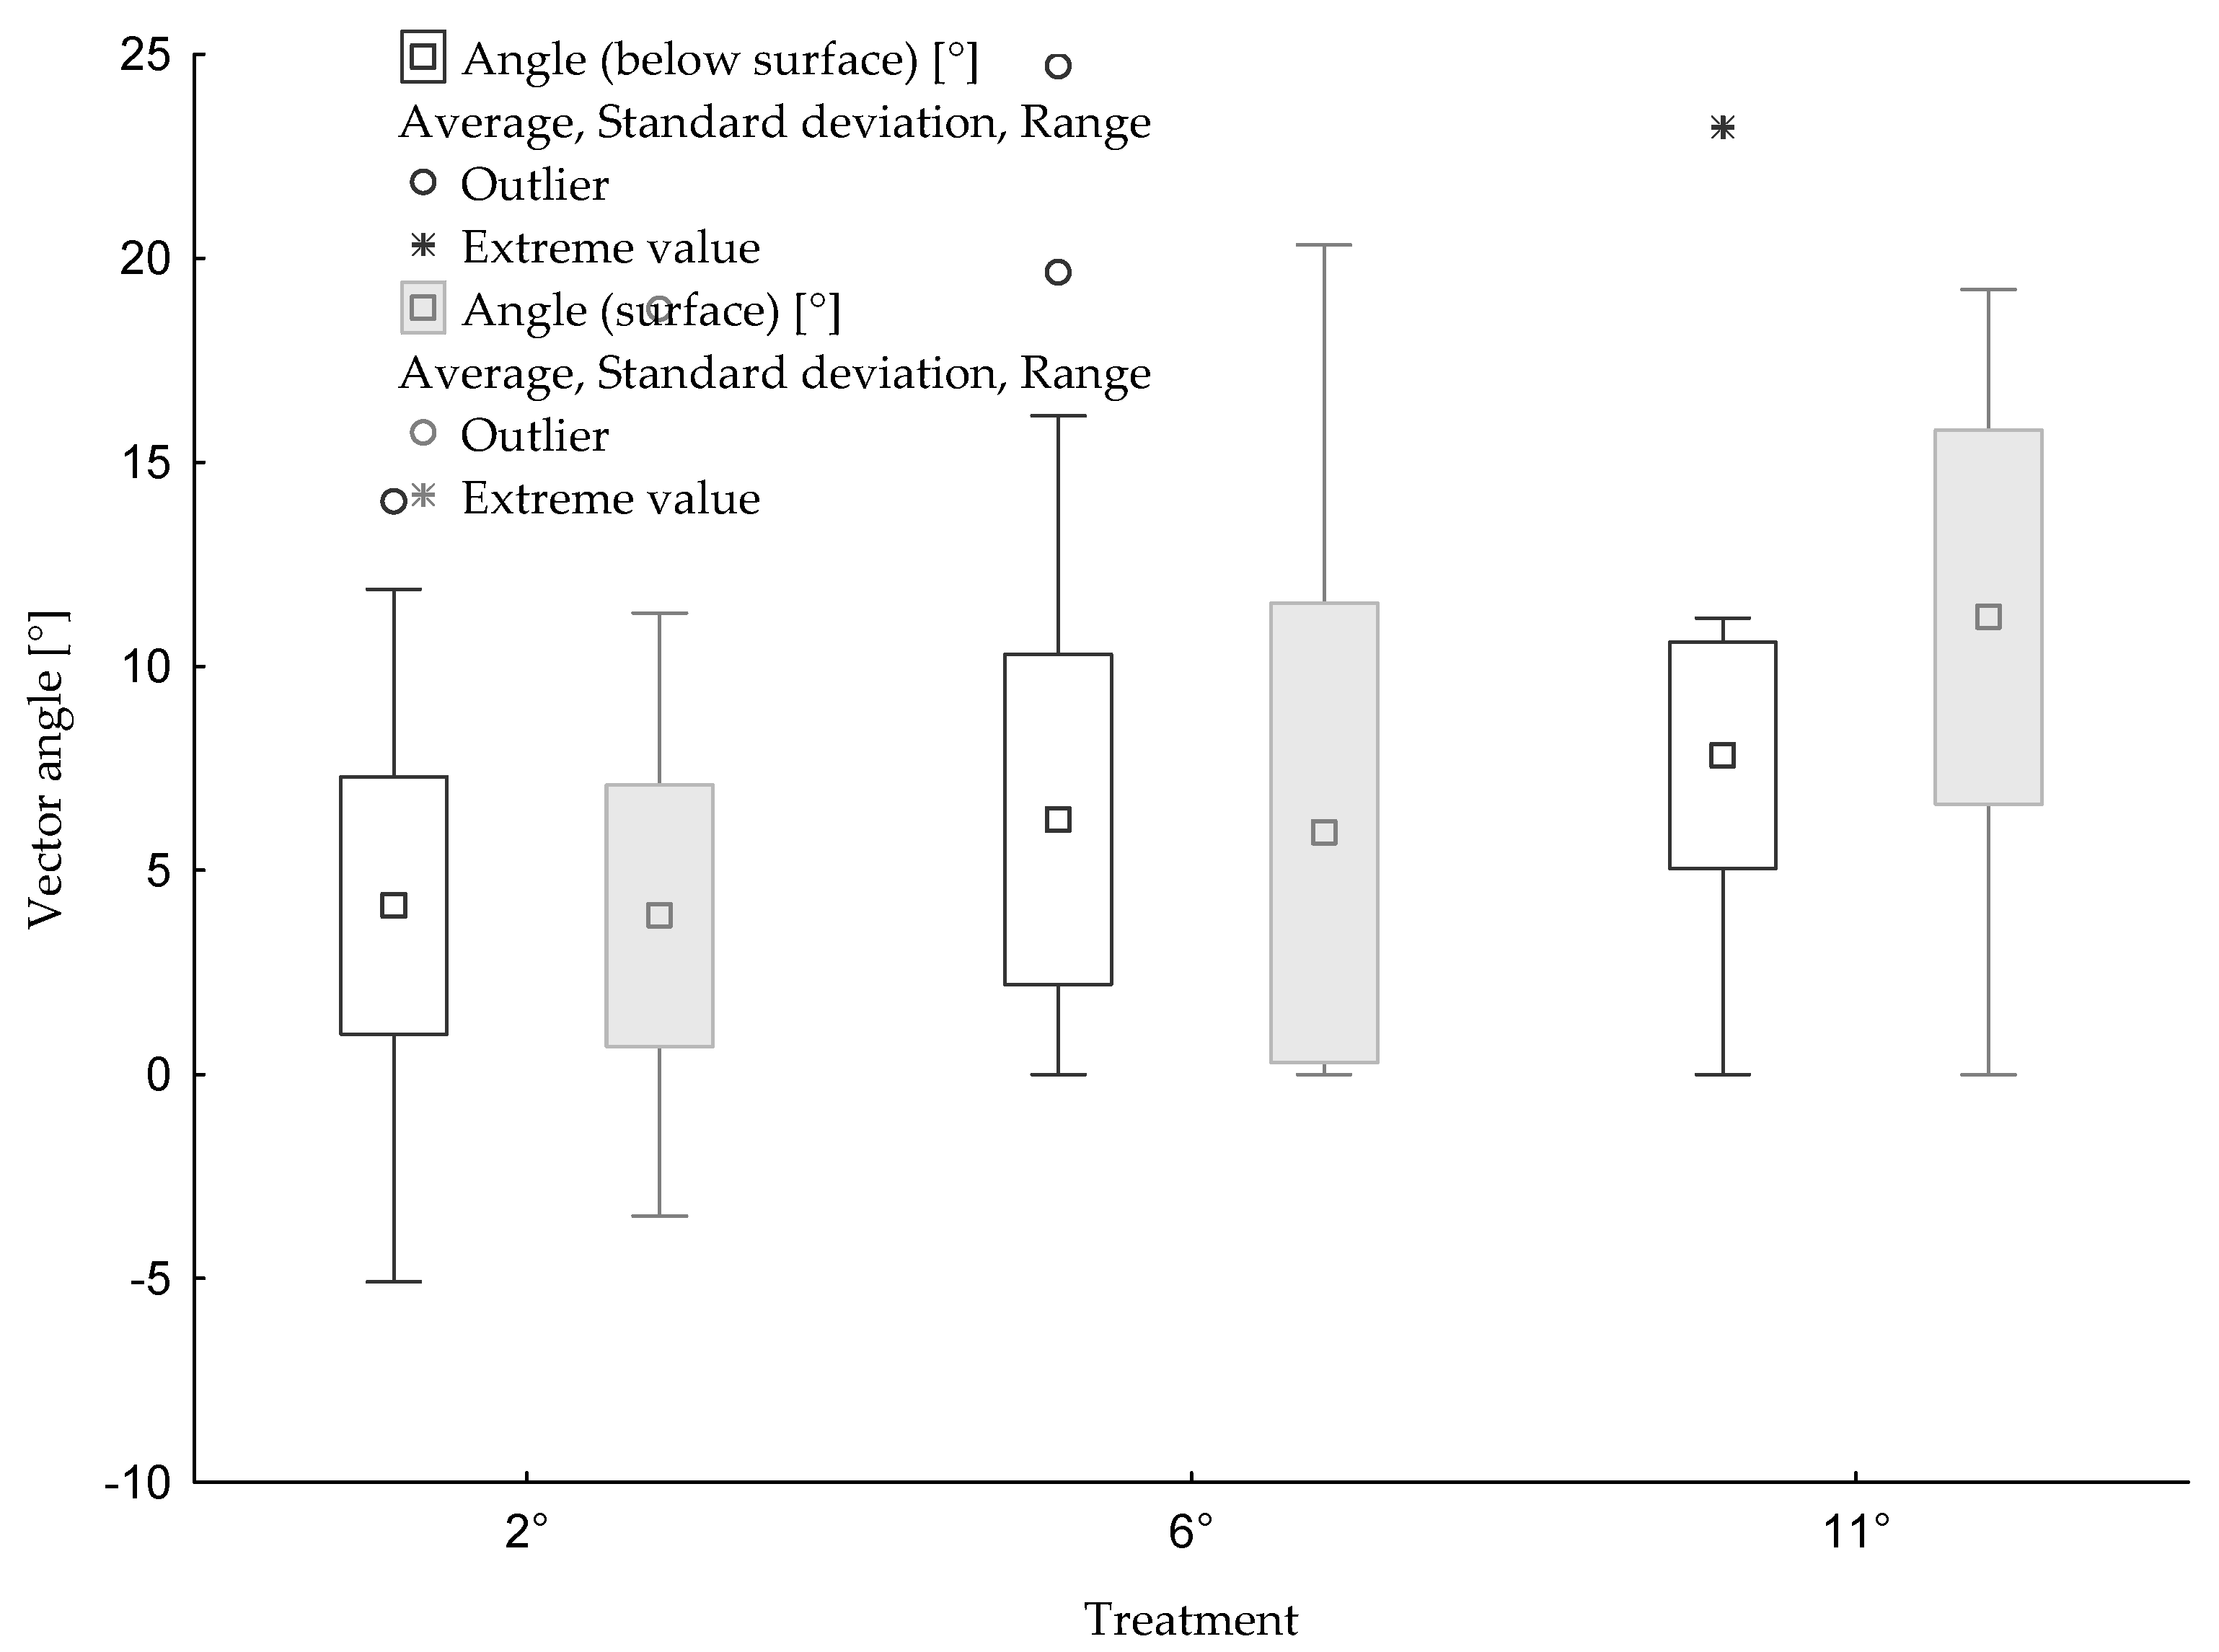
Figure 5.
Vector length after two passes.
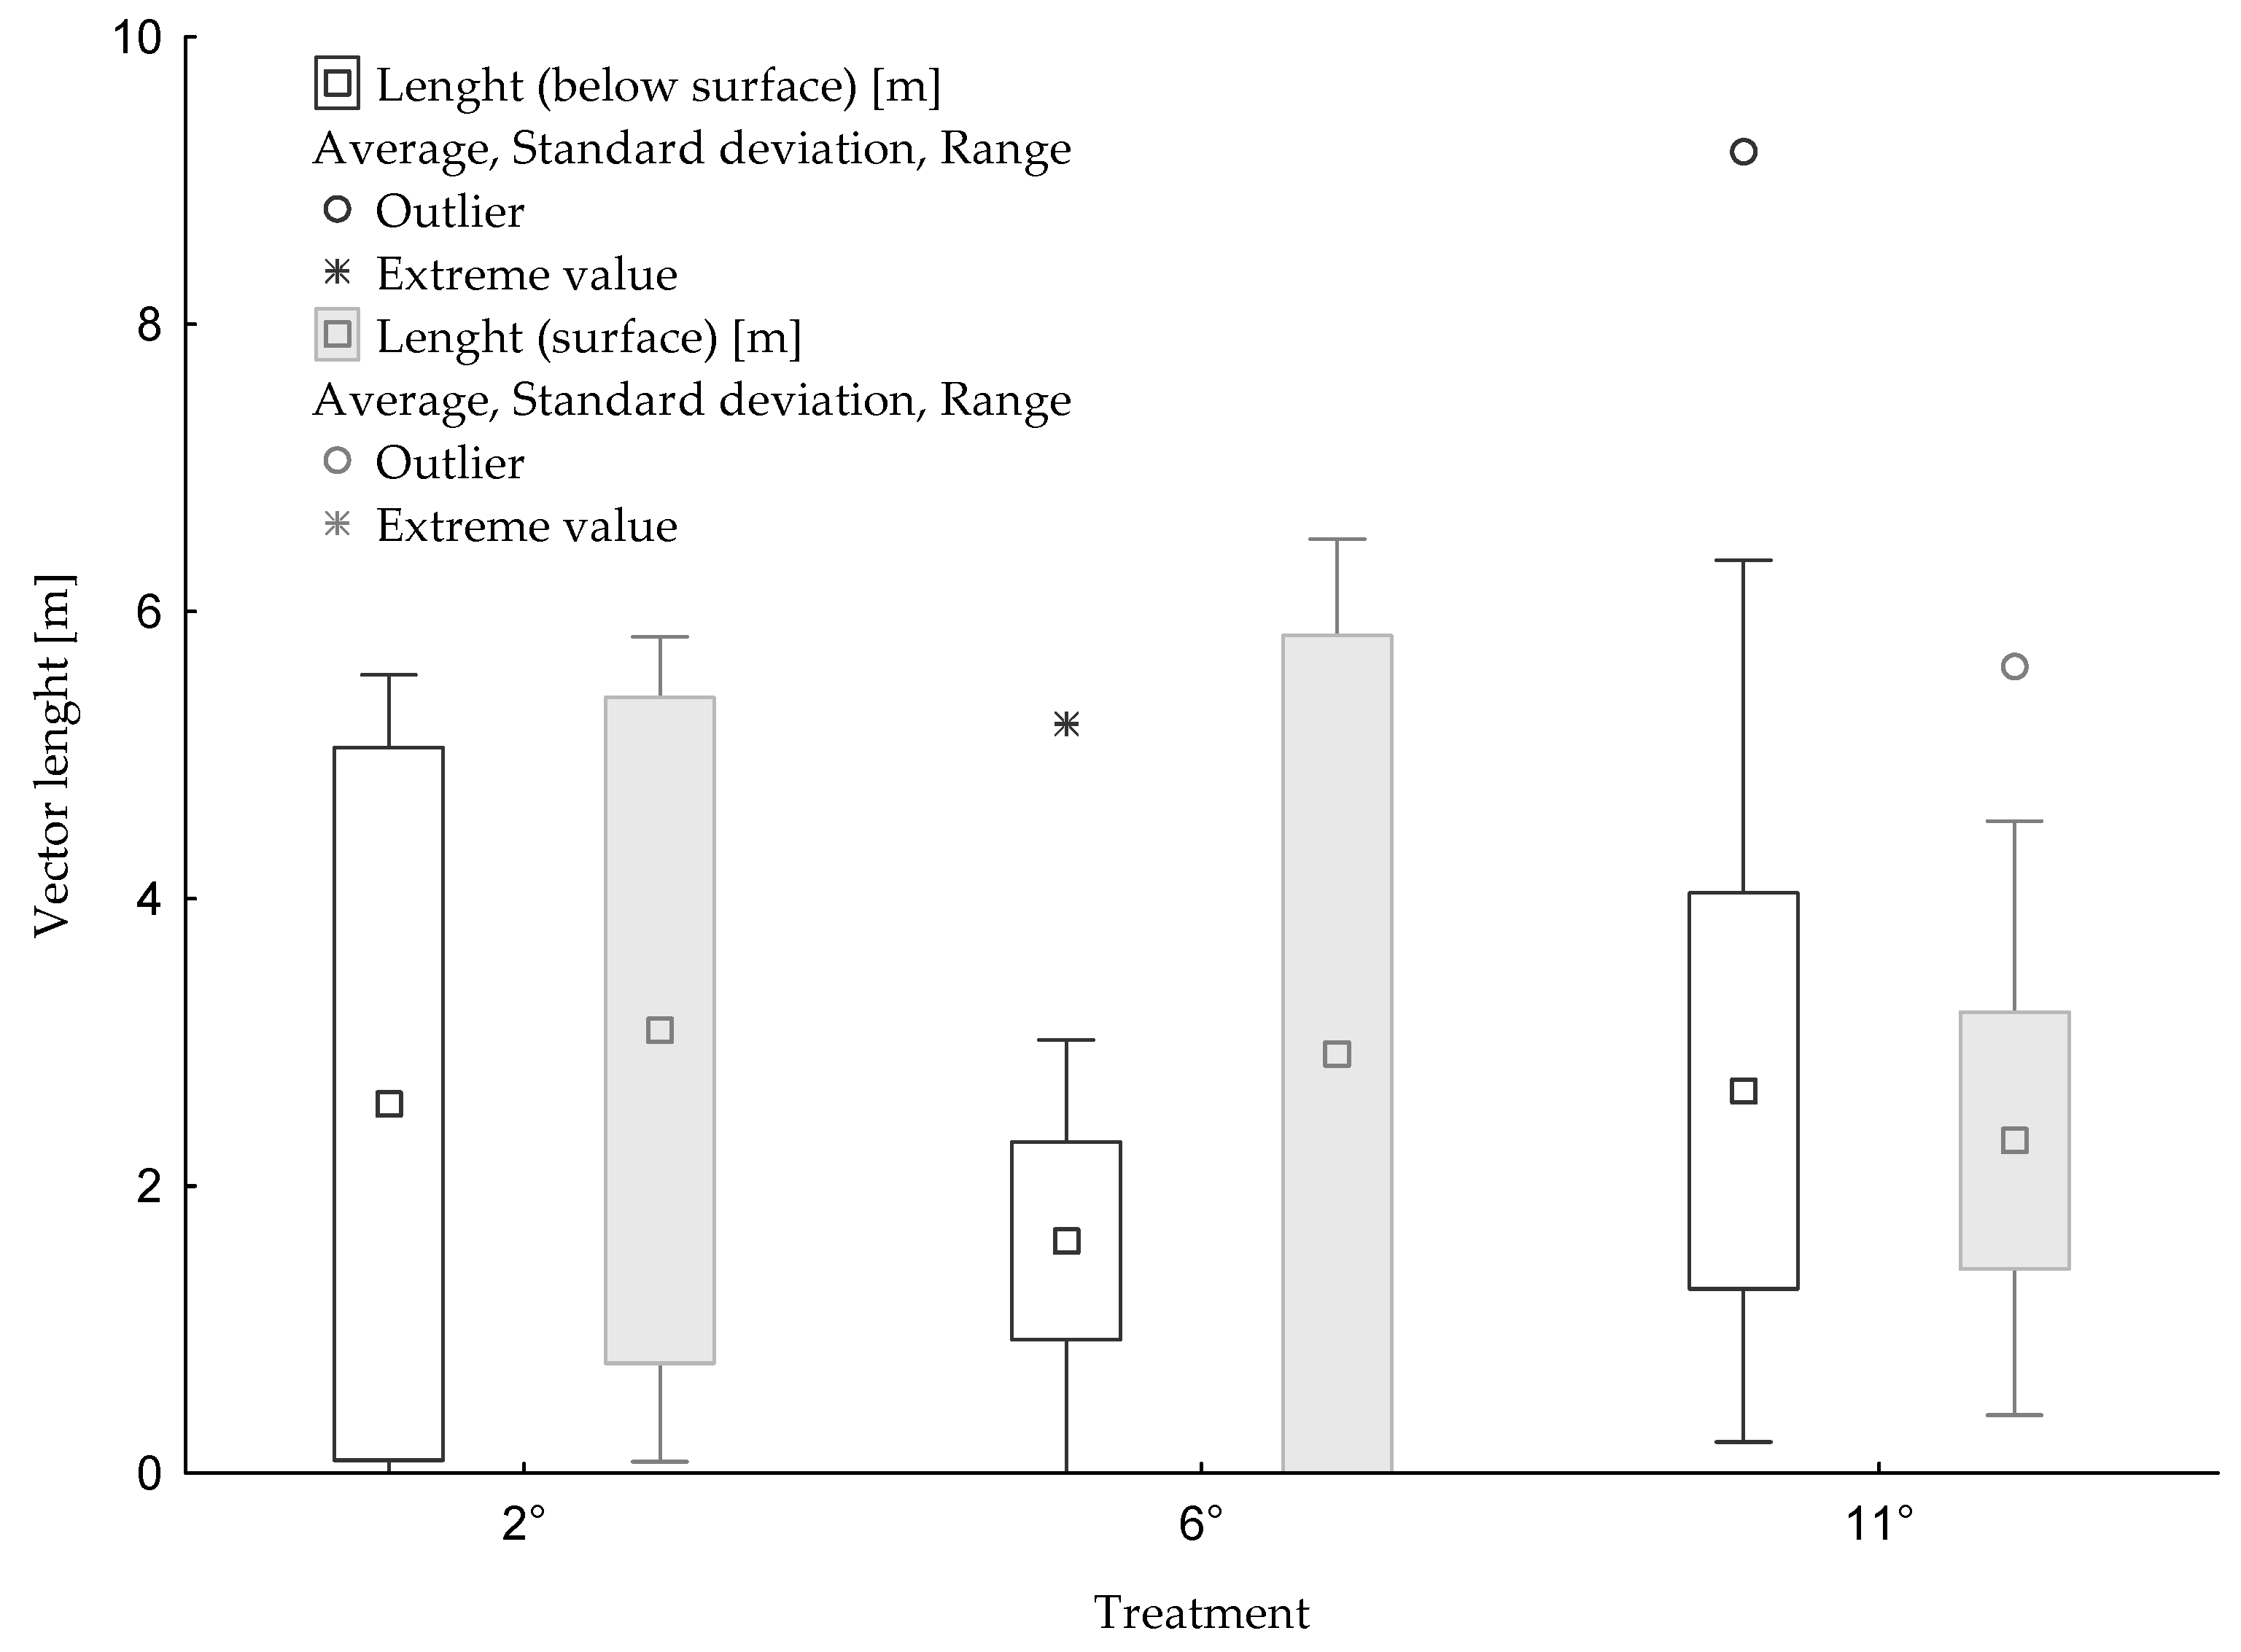
Figure 6.
Vector angle after two passes.
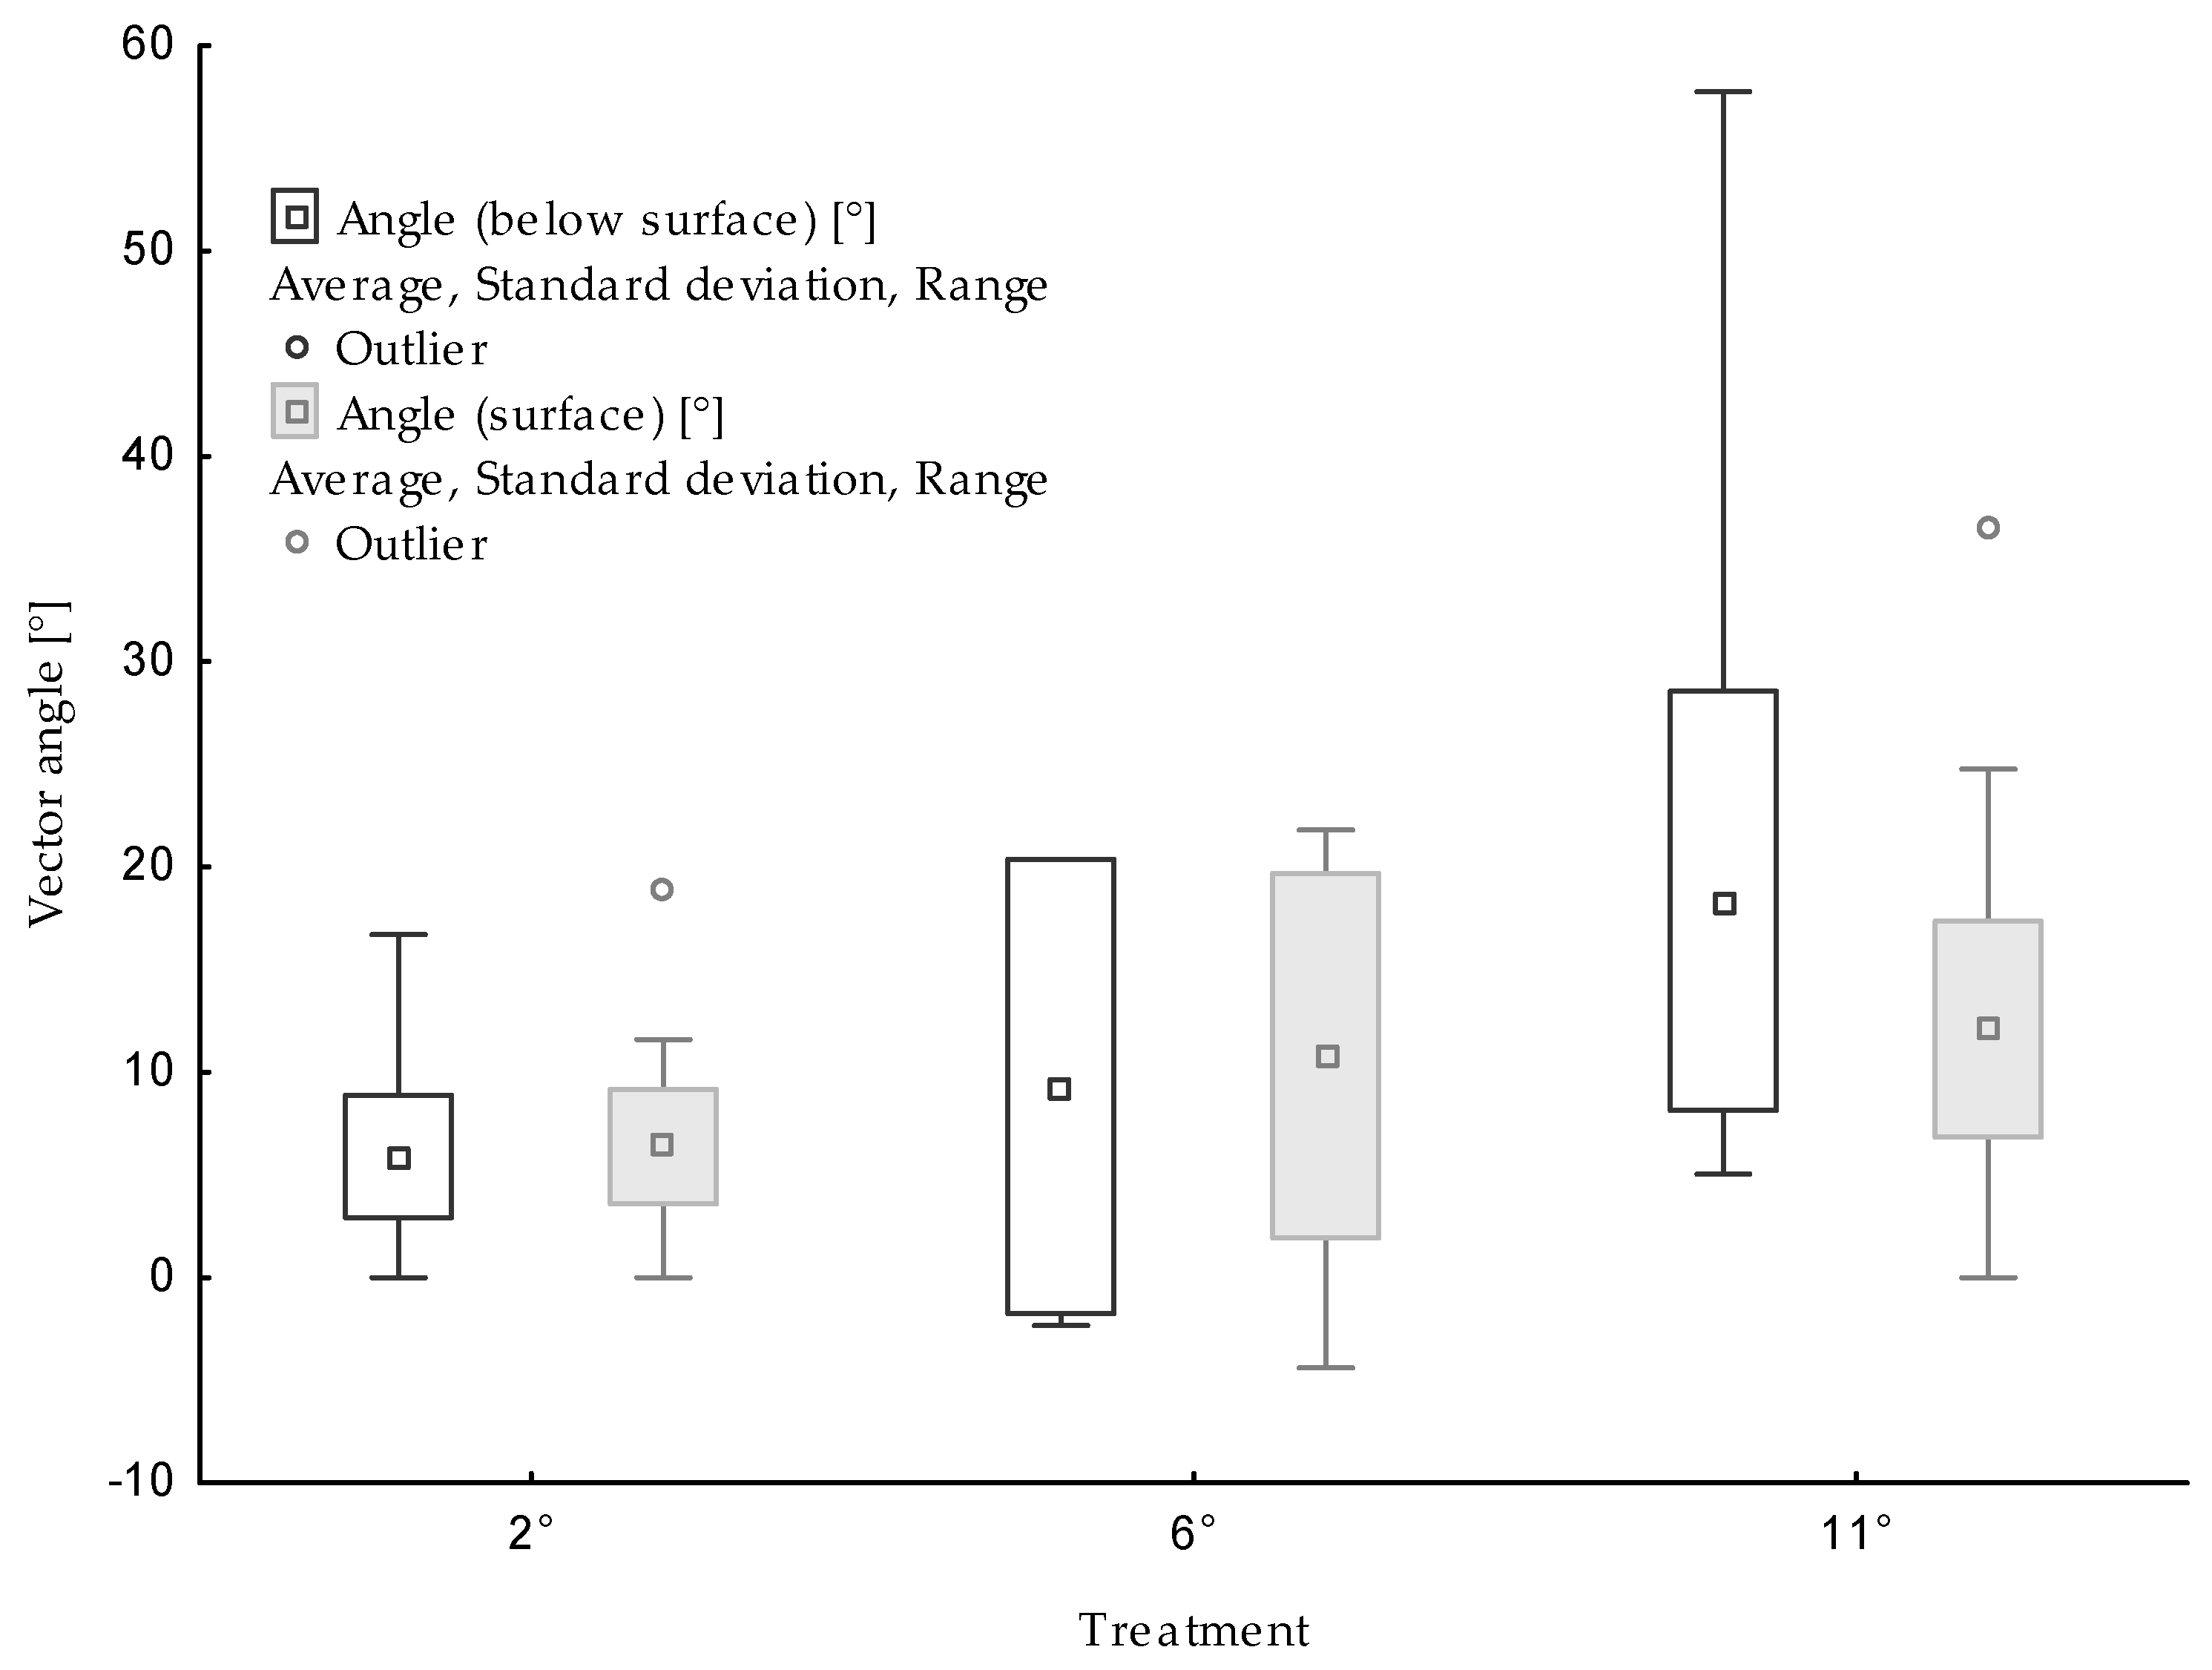
Figure 7.
Vector length after three passes.
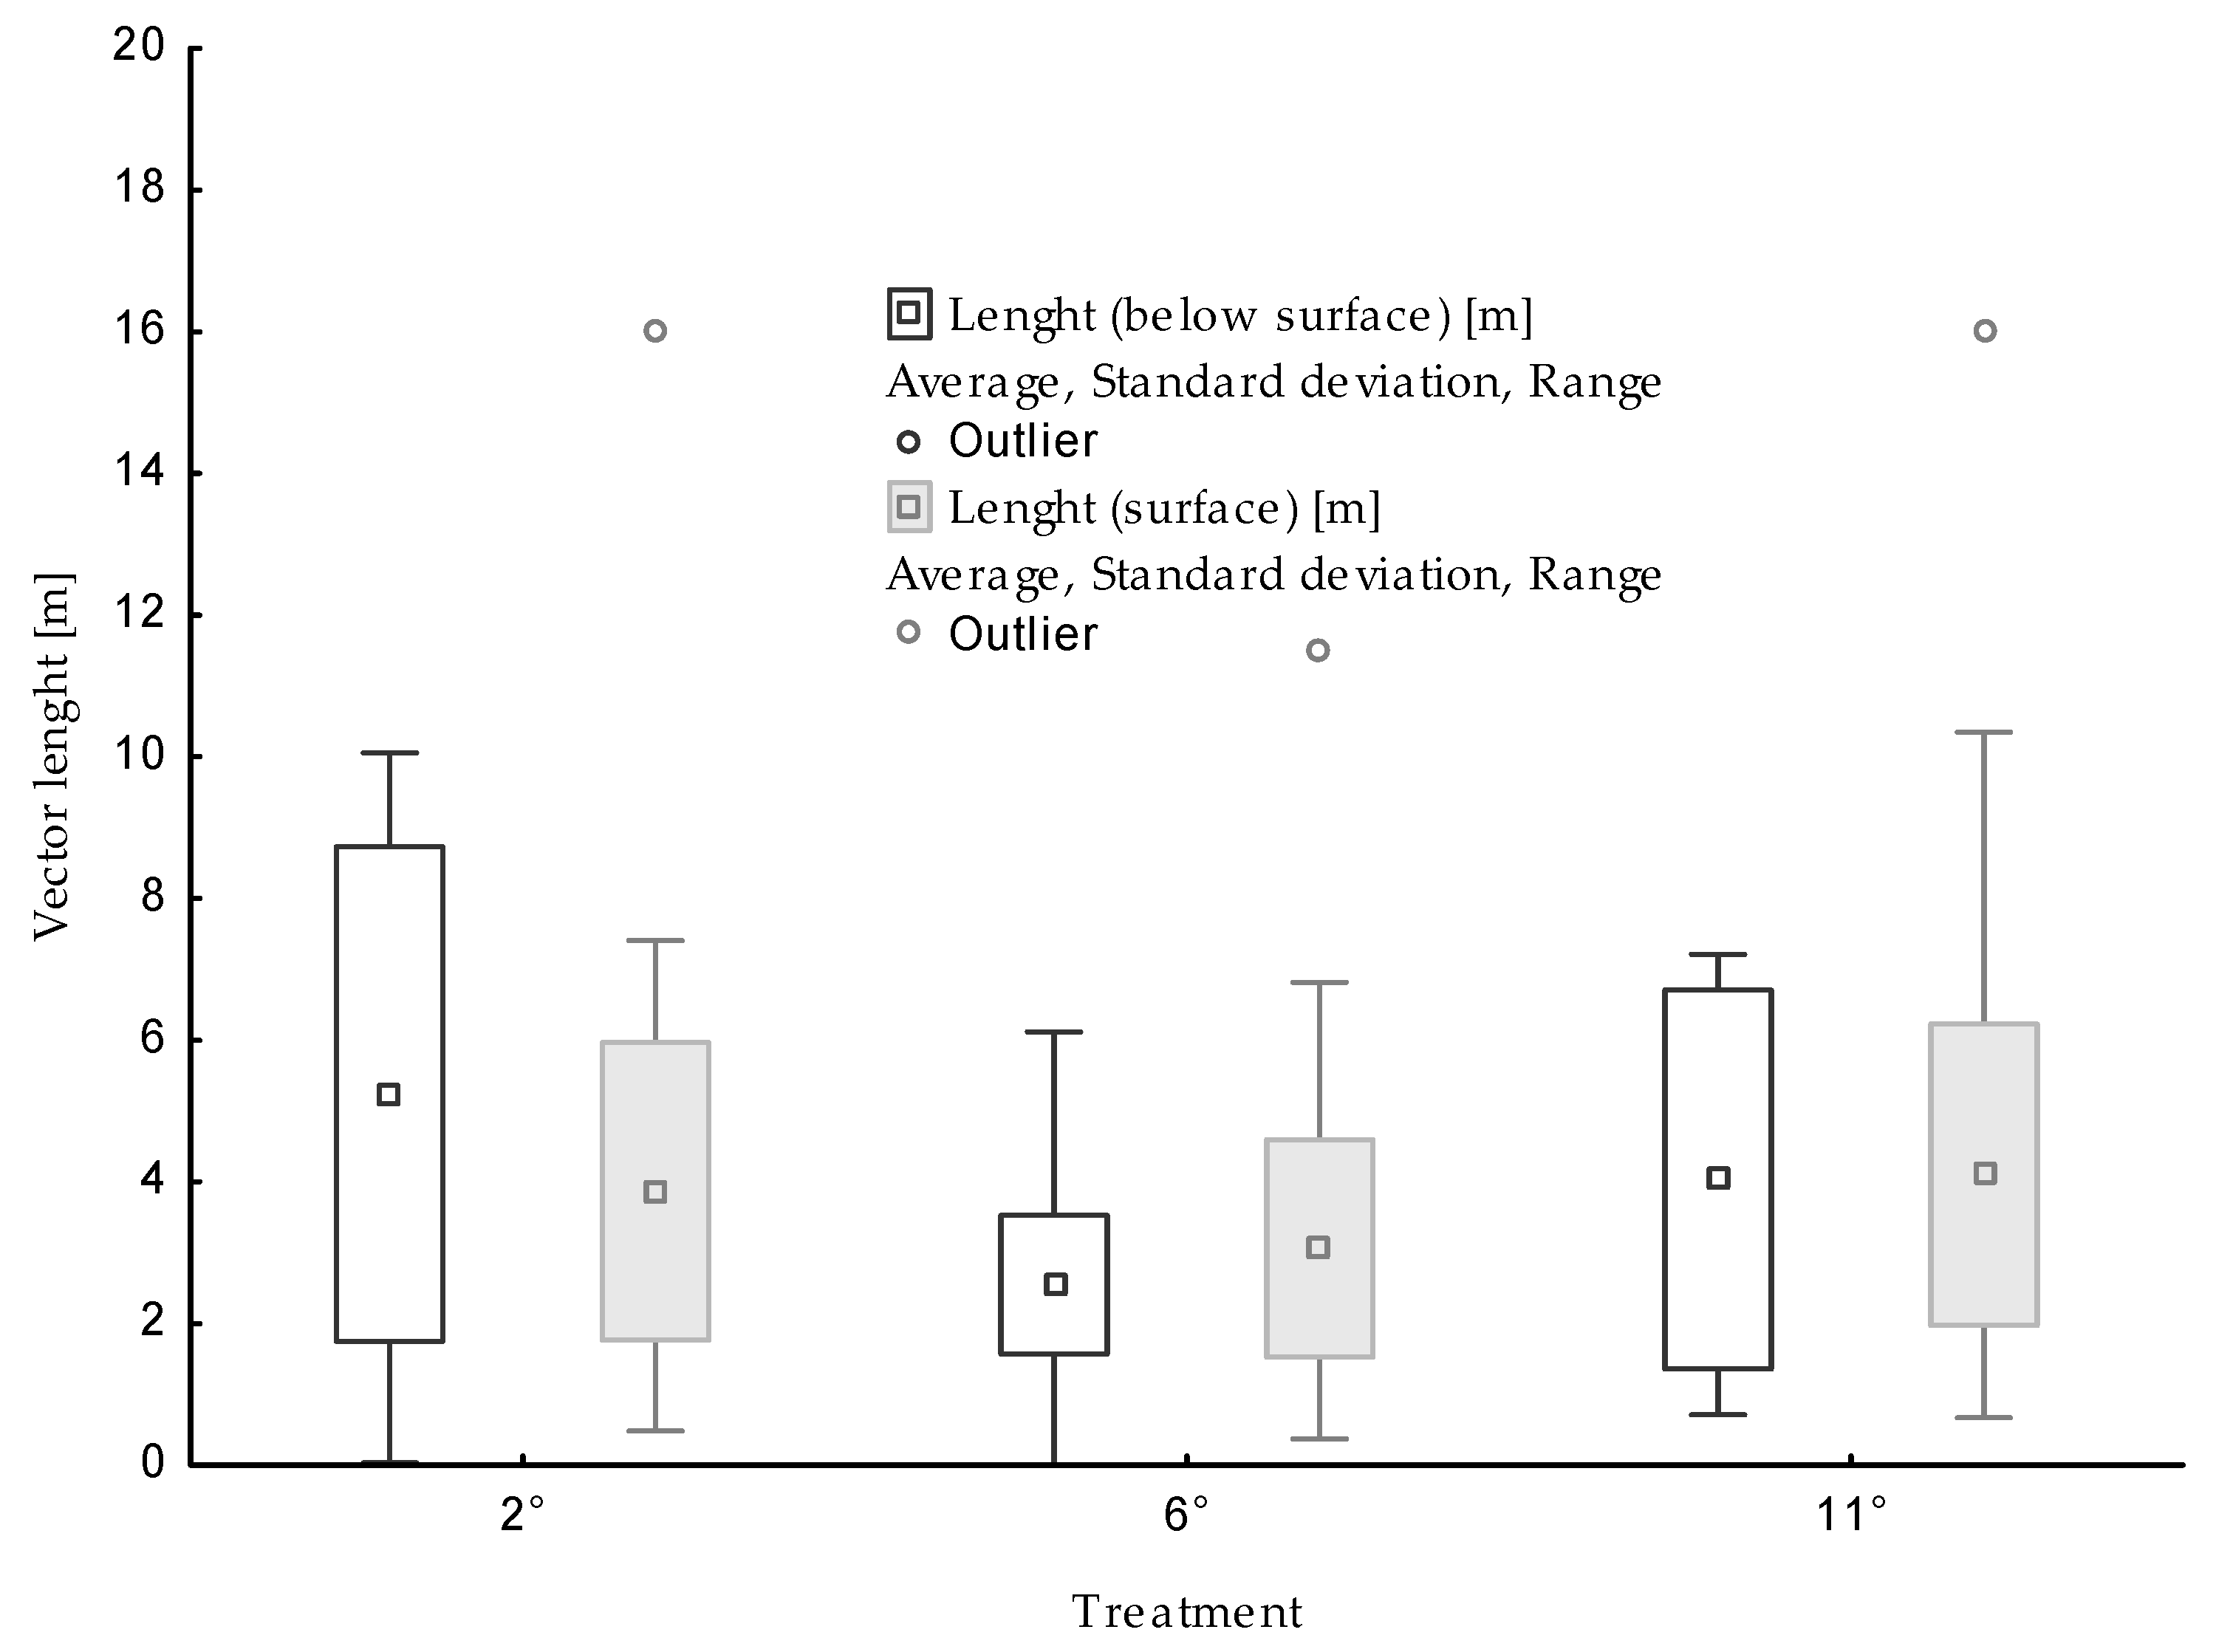
Figure 8.
Vector angle after three passes.


Table 1.
Soil bulk density and porosity before tillage.
| Depth (m) | Bulk Density (g·cm−3) | Porosity (%) |
|---|---|---|
| 0.05–0.10 | 1.49 | 43.8 |
| 0.10–0.15 | 1.52 | 43.3 |
| 0.15–0.20 | 1.51 | 43.2 |
Table 2.
Soil bulk density and porosity after tillage.
| Depth (m) | Bulk Density (g·cm−3) | Porosity (%) |
|---|---|---|
| 0.05–0.10 | 1.37 | 50.2 |
| 0.10–0.15 | 1.39 | 48.2 |
| 0.15–0.20 | 1.39 | 47.2 |
Table 3.
Results obtained after one pass.
| 1 Passes | Below Surface | Surface | ||
|---|---|---|---|---|
| Treatment | Length (m) | Angle (°) | Length (m) | Angle (°) |
| 2° | 1.03 aA | 4.1 bB | 1.23 aA | 3.9 bB |
| 6° | 1.54 aA | 6.24 bB | 2.36 aA | 5.9 bB |
| 11° | 2.23 aA | 7.8 bB | 1.84 aA | 11.2 bB |
Note: Letters denote homogeneous groups (Tukey HSD test). The lowercase letters (a, b) compare the slopes (2°/6°/11°); uppercase letters (A, B) represent the group of tracers (below surface/surface series).
Table 4.
Results obtained after two passes.
| 2 Passes | Below Surface | Surface | ||
|---|---|---|---|---|
| Treatment | Length (m) | Angle (°) | Length (m) | Angle (°) |
| 2° | 2.56 aA | 5.9 bB | 3.08 aA | 6.4 bB |
| 6° | 1.61 aA | 9.3 bB | 2.91 aA | 10.8 bB |
| 11° | 2.66 aA | 18.3 bB | 2.32 aA | 12.1 bB |
Note: Letters denote homogeneous groups (Tukey HSD test). The lowercase letters (a, b) compare the slopes (2°/6°/11°); uppercase letters (A, B) represent the group of tracers (below surface/surface series).
Table 5.
Results obtained after three passes.
| 3 Passes | Below Surface | Surface | ||
|---|---|---|---|---|
| Treatment | Length (m) | Angle (°) | Length (m) | Angle (°) |
| 2° | 5.23 aA | 3.3 bB | 3.86 aA | 1.4 bB |
| 6° | 2.54 aA | 8.0 bB | 3.06 aA | 7.4 bB |
| 11° | 4.02 aA | 8.4 bB | 4.11 aA | 9.3 bB |
Note: Letters denote homogeneous groups (Tukey HSD test). The lowercase letters (a, b) compare the slopes (2°/6°/11°); uppercase letters (A, B) represent the group of tracers (below surface/surface series).
© 2018 by the authors. Licensee MDPI, Basel, Switzerland. This article is an open access article distributed under the terms and conditions of the Creative Commons Attribution (CC BY) license (http://creativecommons.org/licenses/by/4.0/).
Share and Cite
MDPI and ACS Style
Petr, N.; Josef, H. Translocation of Soil Particles during Secondary Soil Tillage along Contour Lines. Water 2018, 10, 568. https://doi.org/10.3390/w10050568
AMA Style
Petr N, Josef H. Translocation of Soil Particles during Secondary Soil Tillage along Contour Lines. Water. 2018; 10(5):568. https://doi.org/10.3390/w10050568
Chicago/Turabian StylePetr, Novák, and Hůla Josef. 2018. "Translocation of Soil Particles during Secondary Soil Tillage along Contour Lines" Water 10, no. 5: 568. https://doi.org/10.3390/w10050568
Note that from the first issue of 2016, this journal uses article numbers instead of page numbers. See further details here.