Groundwater Chemistry Regulated by Hydrochemical Processes and Geological Structures: A Case Study in Tongchuan, China

1
School of Environmental Science and Engineering, Chang’an University, Xi’an 710054, China
2
Key Laboratory of Subsurface Hydrology and Ecological Effect in Arid Region of Ministry of Education, Chang’an University, Xi’an 710054, China
*
Author to whom correspondence should be addressed.
Water 2018, 10(3), 338; https://doi.org/10.3390/w10030338
Submission received: 22 December 2017
/
Revised: 14 March 2018
/
Accepted: 14 March 2018
/
Published: 19 March 2018
Abstract
:Knowledge of hydrochemical processes in groundwater helps to identify the relationship between geochemical processes and groundwater quality as well as to understand the hydrochemical evaluation of groundwater, which is important for the sustainable management of groundwater resources. This study aims to identify the chemical characteristics of groundwater in the area of Tongchuan City, China. A total of 58 groundwater samples were collected. A hierarchical cluster analysis divided samples into three clusters and six sub-clusters (cluster 1a, 1b, 2a, 2b, 3a, 3b) according to hydrochemical facies. Graphical plots of multiple ionic ratios, saturation indices, and ion exchange indices were employed to examine hydrochemical processes that result in different hydrochemical facies of each cluster. Results show the predominance of carbonate and silicate weathering in cluster 1, silicate weathering in cluster 2, and carbonate weathering in cluster 3. Ionic exchange is a ubiquitous process among all clusters. The distribution of clusters is related to the regional geology, which may result in different hydrochemical processes. Two stratigraphic sections identify the differences in hydrochemical processes resulting from complex stratum structures and varied aquifer media. Cluster 2a shows an interesting difference in water chemistry along the groundwater flow path. Further study by oxygen and hydrogen isotope indicated that mixing between Quaternary and the Permian aquifers resulting from faulting is the main reason for the distinctive characteristic of cluster 2a.
1. Introduction
Groundwater is vital to the development of most arid and semiarid regions due to limited precipitation and surface water [1,2]. Rational utilization and sustainable management of groundwater is particularly important in these areas [3]. In natural hydrological cycling, groundwater interacts with the surrounding rocks causing a variety of hydrogeochemical processes that alter groundwater chemical components. Study of the hydrogeochemical processes has been an area of interest in the past few decades, as chemical variation of groundwater can reveal the interaction between groundwater and environment and provide a scientific basis for water resource management. Kumar et al. [4] have identified that simple dissolution, mixing, weathering of carbonate and silicate minerals, ion exchange, and interaction with surface water are the important hydrogeochemical processes that control groundwater quality in Delhi, India. Sonkamble et al. [5] have identified that carbonate, dolomite, calcite, and silicate weathering are the predominant hydrogeochemical processes in the proximity basalt area, but silicate weathering is dominant in proximity granite area, both in the Deccan Volcanic Province in India. Moya et al. [6] used multivariate statistical techniques to identify hydrological processes within the Eromanga and Galilee basins, resulting in the recognition of inter-aquifer mixing. Brkić et al. [7] used hydrochemical and isotope data to learn groundwater flow and residence time, which explains hydrogeochemical variations in a part of the aquifer system of Eastern Slavonia. Kim et al. [8] evaluated the complex hydrogeochemical processes occurring in a salinized aquifer during freshening in the Red River delta aquifer using a multiple end-members mixing model, which successfully found that mixing processes among paleo-seawater, infiltrating rain, and the K-rich groundwater controlled the groundwater chemistry. Thus, knowledge of hydrogeochemical processes can help better understand chemical characteristics of groundwater, which can lead to a reasonable allocation of groundwater resources for many different purposes such as in agriculture, industry, and environmental protection.
Many parts of China, especially arid and semi-arid regions, rely heavily on groundwater resources. Tongchuan is a rapidly growing city in north China and is located on the south edge of the Loess Plateau. With the rapid development in industry and agriculture, groundwater is over-exploited to meet the increasing demand, leading to problems with both groundwater quality and quantity. Due to agricultural activity, the groundwater in the area has been polluted by nitrate [9,10]. Knowledge of hydrochemical processes of groundwater can provide an effective approach to protect, treat, and restore contaminated groundwater [11,12]. Previous studies examined the geological-hazards and groundwater pollution sources [9,10,13,14], however, the hydrogeochemical processes in Tongchuan remain unknown. The geologic structure is complicated, with two faults cross-cutting the study area. Geological structures play a substantial role in many qualitative and quantitative studies of hydrogeological processes [15,16]. Rajabpour et al. [16] investigated the influence of the North Tabriz Fault on the alluvial aquifer northwest of Tabriz, Iran, which showed quite different hydrochemical properties on either side of the fault. Hagedorn and Whittier [17] used the geochemical data to identify solute sources and mixing processes between various water types in a region that experienced multiple lithospheric extension events, and found a remarkable heterogeneity in alluvial spring and groundwater chemistry. However, hydrochemical studies are concerned with the impact of mineral components on groundwater chemistry and evolution of hydrochemical processes along the flow, but ignore the impact of geological conditions on groundwater chemistry. Hence, this study was carried out to identify the hydrochemical processes that control the chemistry of groundwater and to analyze the impact of geologic structures on hydrogeochemistry in the Tongchuan region.
2. Study Area
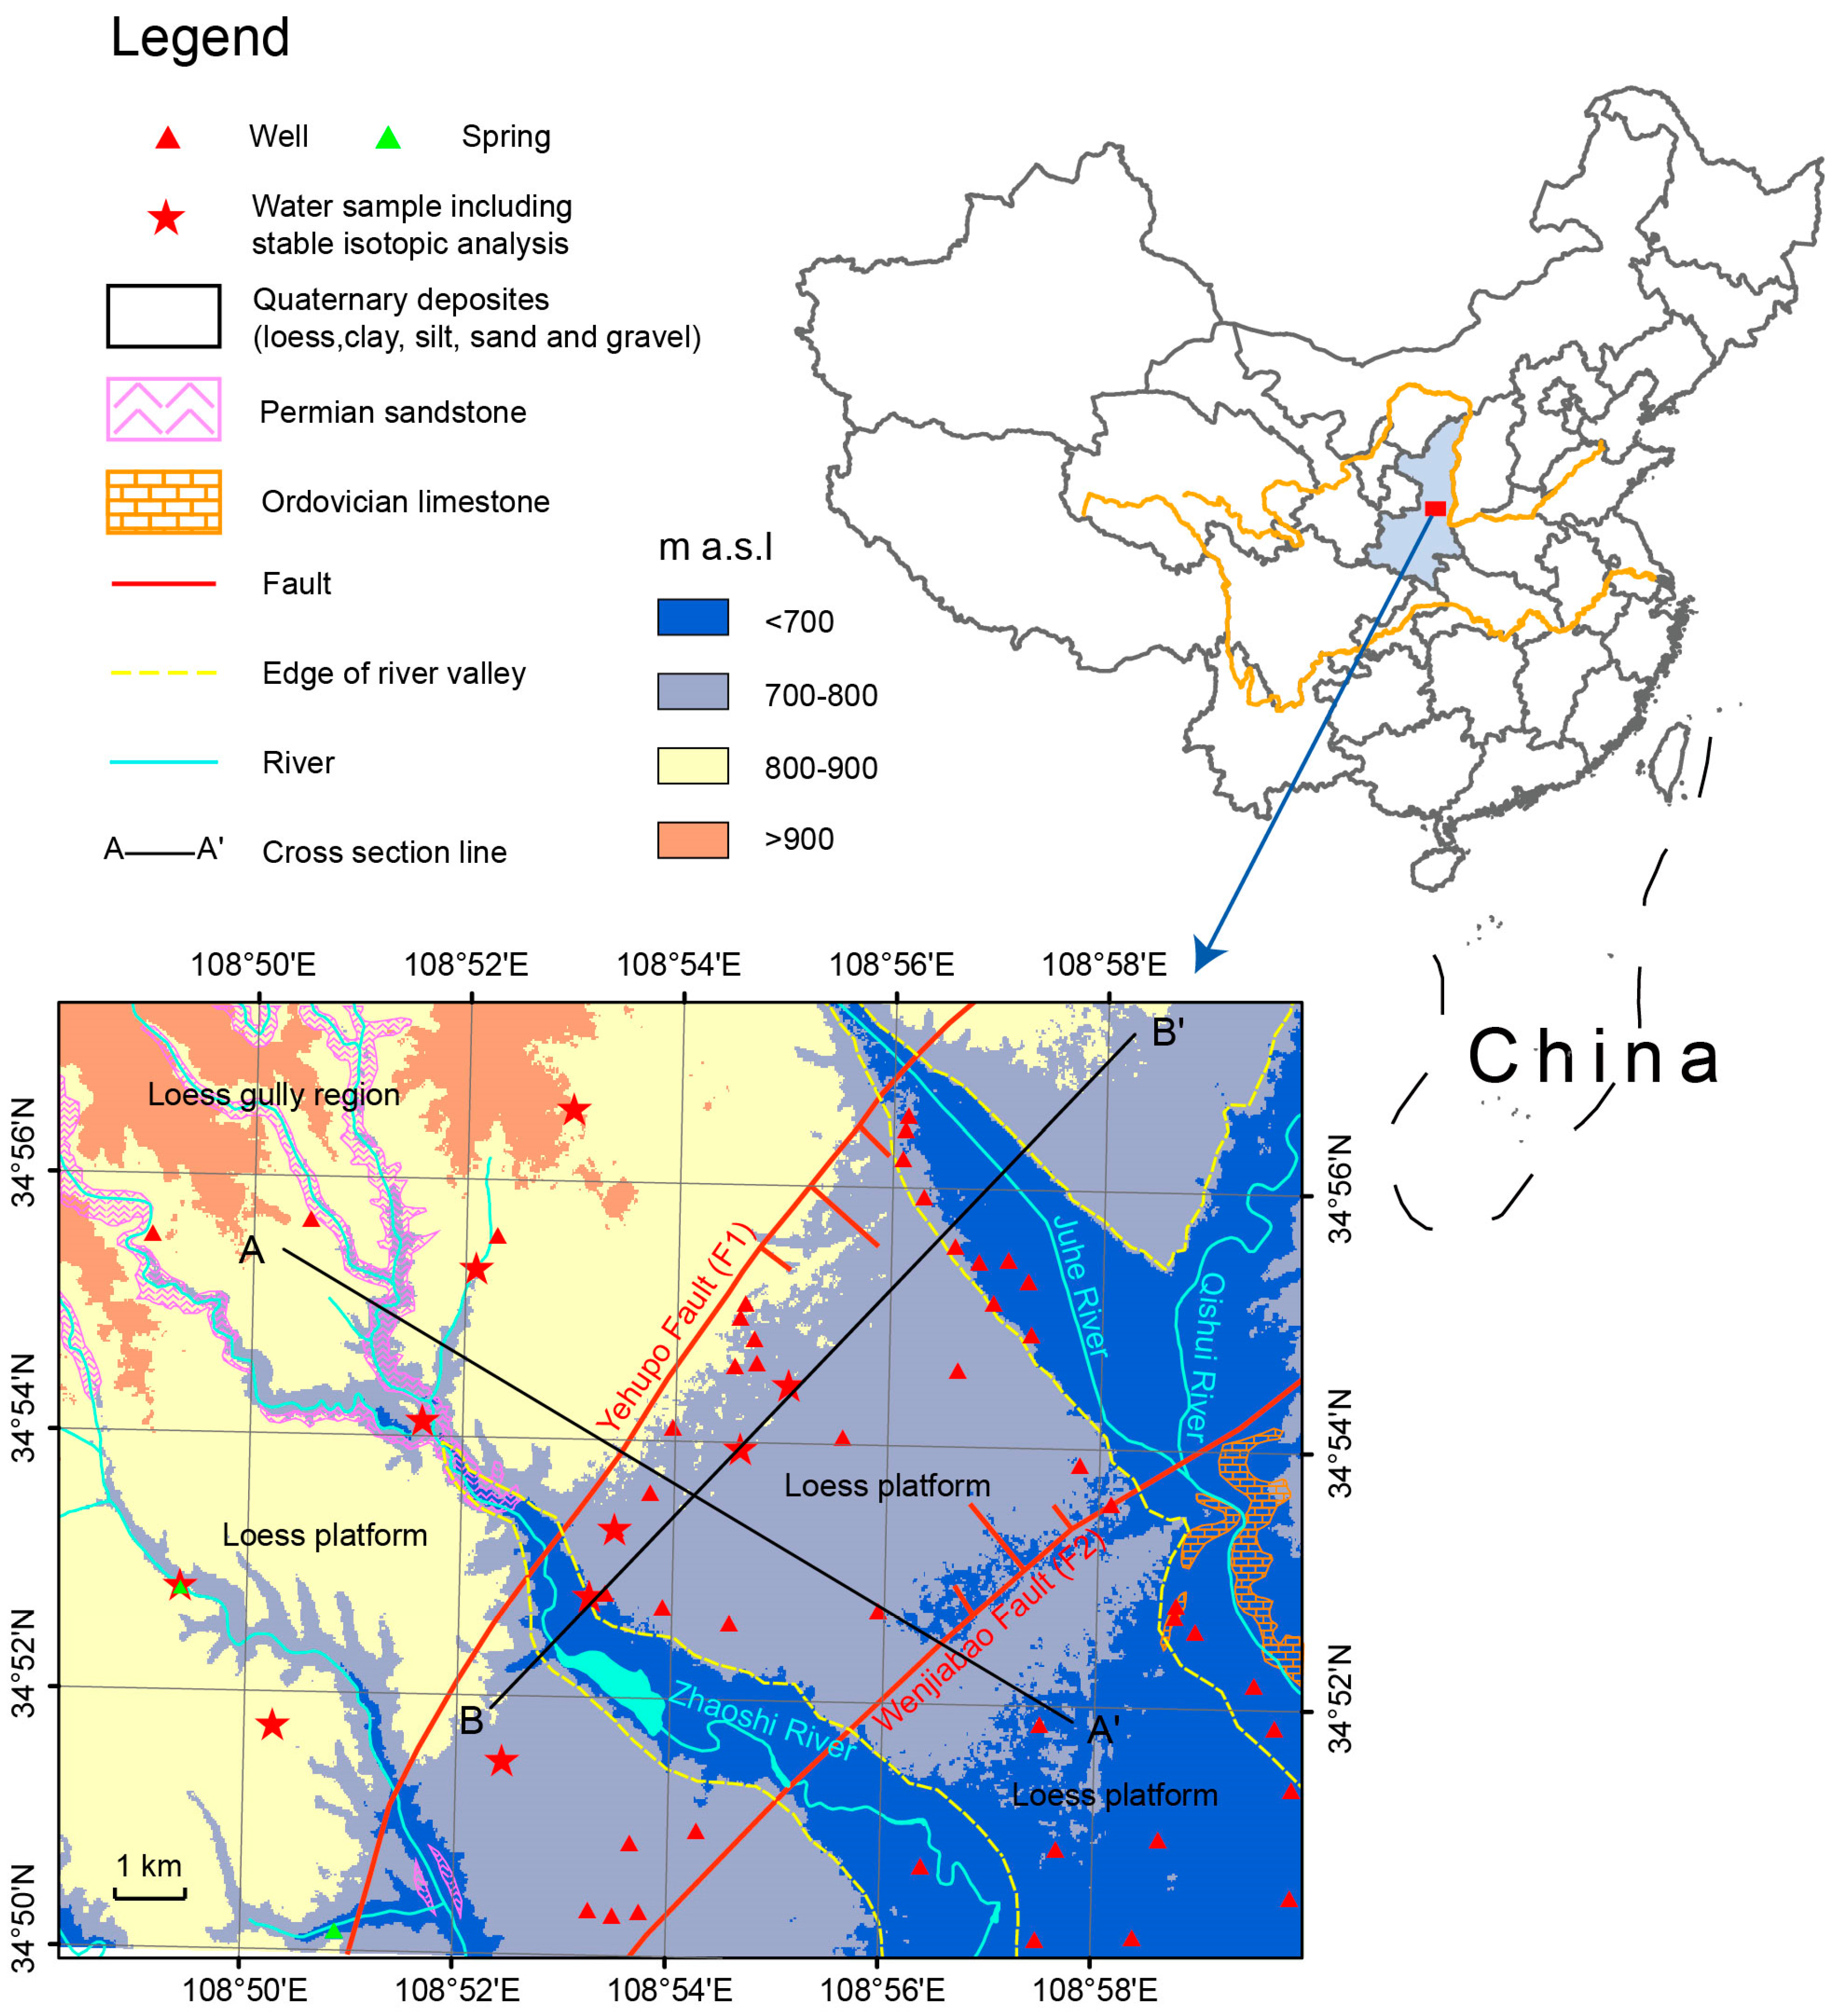
The study area is located in the southeastern part of Tongchuan City in Shaanxi Province, which is situated on the southern edge of the Loess Plateau in China [18]. It lies between longitude 108°50′–109°00′ E and latitude 34°50′–35°00′ N (Figure 1) with altitudes between 900 and 1350 m above mean sea level. The topography slopes from northwest (NW) to southeast (SE). The study area belongs to the warm semi-arid to semi-humid climate and has hot, rainy summers but cold and dry winters [19]. The average annual rainfall is 537.86 mm (more than 50% of which occurs from July–September) [20], and the annual evaporation is 1445.65 mm. The mean minimum and maximum temperatures are 3 and 23 °C, respectively. Tectonically, Tongchuan region belongs to a transition zone between the Ordos platform and Fen-Wei Graben [13,21]. The region contains three major geographical regions, such as the loess gully region, loess platform, and terraced valley region. Four NW-SE running rivers pass through the region draining into the Shichuan River. Little water can be utilized from these rivers because of low river levels. Groundwater is the primary source of water for daily life and agricultural production in the region, especially in the loess-covered areas [9].
3. Geology and Hydrogeology
The oldest rocks are Ordovician limestones, which are distributed evenly across the region. The thick Permian sandstones are distributed in the northwest of Wenjiabao Fault (F2) and underlain conformably by the Ordovician stratigraphy. Quaternary sediments are widespread in the study area and include Holocene sands and gravels and Pleistocene loess deposits. The geological structure is relatively complex in the study area where faults and folds are well developed. The major faults are the Yehupo (F1) and Wenjiabao (F2) faults, and the major folds are Xiaowangzui anticline and Xiaoqiu syncline [22].
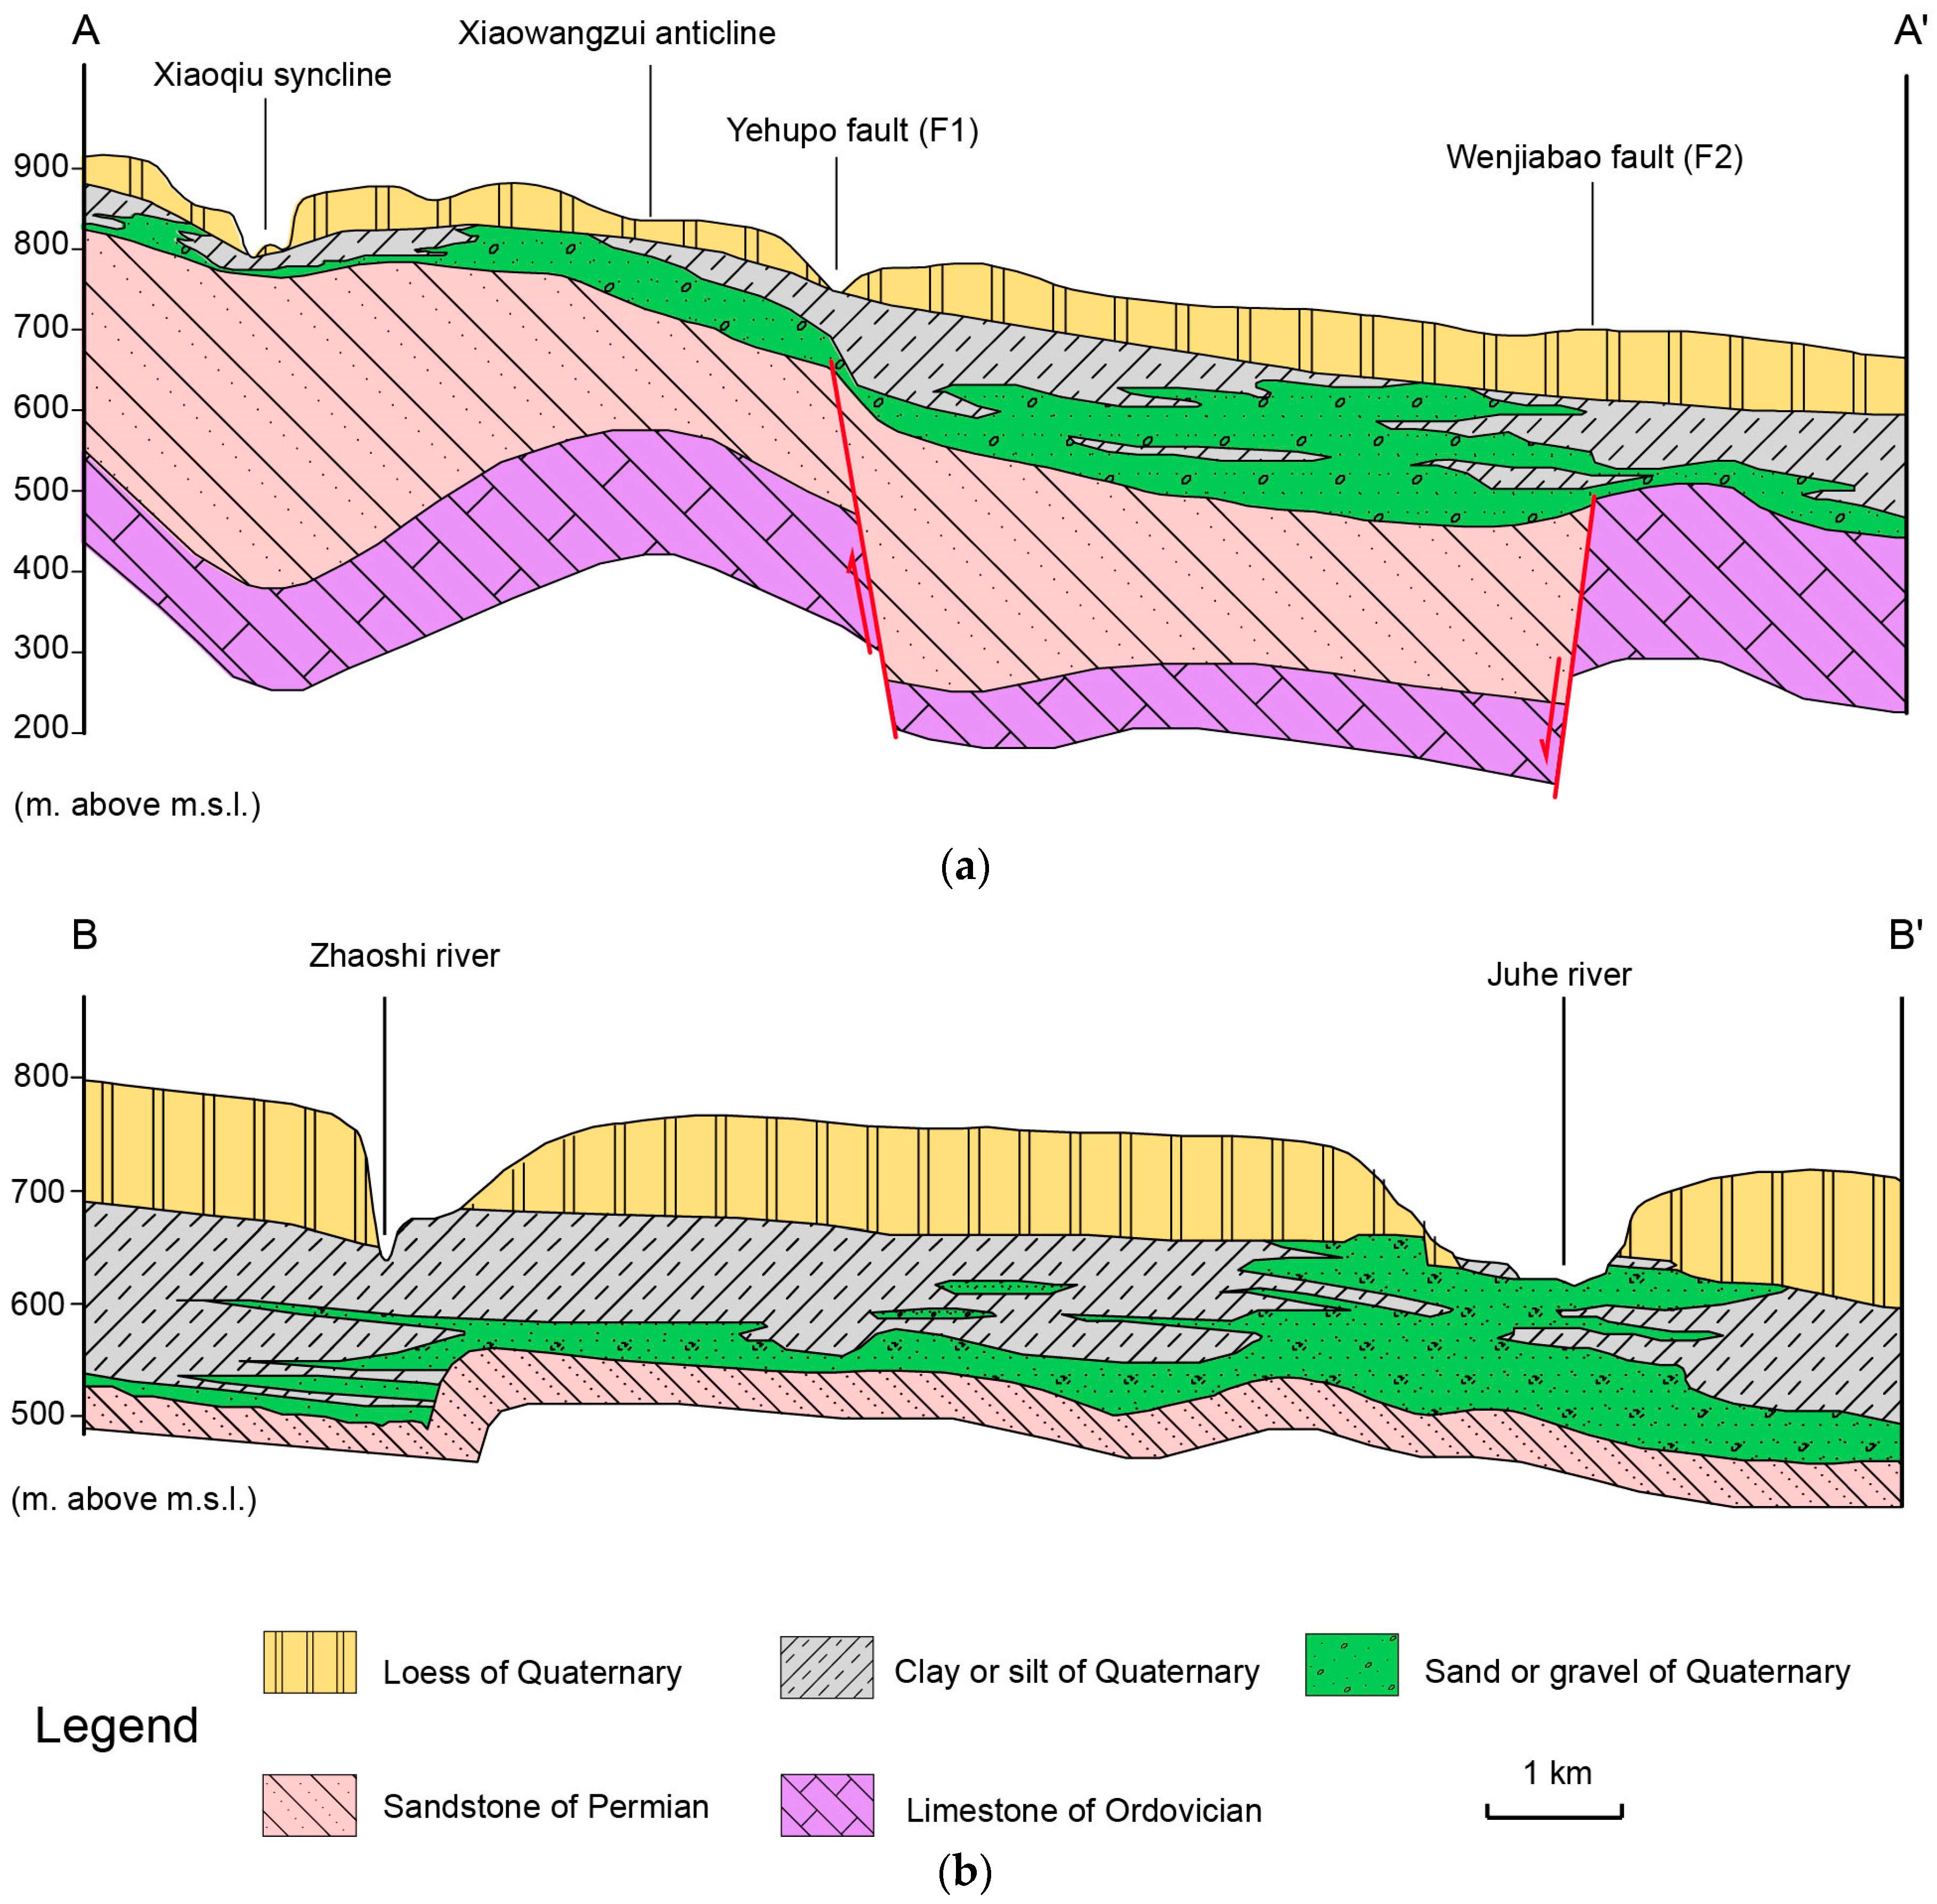
Three aquifers are present in the study area, and the groundwater is classified into three types. The first is Quaternary unconsolidated formation pore water, which is contained in the sand gravel aquifer and loess aquifer. Although loess is wide spread and thick in the area, loess rarely contains water. The loess aquifer only distributes to the north of the F1 fault and has a low water yield capacity. Currently, the sand gravel aquifer is the most exploited aquifer of this area. Cross-section A–A’ (Figure 2) shows that the Permian units have an upward dislocation in the north of the F1 fault and are completely absent to the south of the F2 fault. Offset on the fault makes the middle area subside and accommodate sand and gravel deposition. At the hanging wall of each fault, the sand and gravel unit is relative thin or even absent. Thus, the groundwater distributed between F1 and F2 is abundant with a single well yield ranging from 30–180 m3/d. South of F2, groundwater is somewhat abundant with the single well yield ranging from 10–30 m3/d. Water is relatively scarce north of F1 ranging from 5–10 m3/d. The second aquifer contains water in a clastic rock fissure, which is primarily located north of F2 and has a single well yield between 100–300 m3/d or more than 300 m3/d [22,23]. Fissures and karsts in the Ordovician limestones form the third aquifer. The water yield capacity in this aquifer is generally good but is less exploited because of its high construction cost. In addition, for Quaternary pore water, as the sand gravel aquifer is composed of alternating clay, fine sand, and gravel layers, groundwater exists as confined water. The only unconfined aquifer is in the Juhe River valley (Figure 2).
4. Methodology
4.1. Sampling and Analysis
The present study utilizes data collected from July to September 2014. Groundwater levels were measured in the monitoring wells to obtain the hydraulic head pattern and determine flow directions under natural conditions. Simultaneously, a total of 58 groundwater samples were collected from the Quaternary aquifer via two springs and 56 pump wells (Figure 1). The well depth ranged from 15–380 m, and screen of all wells was located in the Quaternary aquifer. Samples were collected in plastic bottles, which were rinsed three times with the water before sampling. In situ water temperature and pH were measured by alcohol thermometer and portable pH meter (CT-6023), respectively. Major ions (Na+, K+, Ca2+, Mg2+, Cl−, SO42−, and HCO3−), F−, NH4+, NO3−, NO2−, chemical oxygen demand (COD), total dissolved solids (TDS), and total hardness (TH) were analyzed in the laboratory at the Shaanxi Bureau of Geology and Mineral by the standard methods of the Ministry of Health of People’s Republic of China (PRC) and Standardization Administration of PRC [24]. Among these analyzed indices, Na+, K+, Ca2+, and Mg2+ were analyzed using flame atomic absorption spectrometry, HCO3− was measured using hydrochloric acid titrimetric method, NH4–N and NO2–N were determined by spectrophotometry, NO3–N, SO42−, Cl−, and F− were measured by ion chromatography, COD was measured by potassium dichromate, and TDS was dried at 180 °C and then weighed using an analytical balance. Each sample passed an accuracy check via charge balance analysis . The results, less than 1%, confirm the reliability of the analysis results.
To analyze the impacts of the fault on groundwater chemistry, ten groundwater samples were collected for analysis of stable hydrogen and oxygen isotopes (2H and 18O) (Figure 1). The analyses were undertaken in the Shaanxi Entry-exit Inspection and Quarantine Bureau by using CO2 equilibrium method for 18O analysis and zinc reduction method for 2H analysis.
4.2. Hierarchical Cluster Analysis
Cluster analysis refers to a multivariate statistical classification method that groups similar observations [25,26]. Hierarchical cluster analysis (HCA), which successively joins the most similar observations, is widely used in hydrochemical analyses to identify different chemical characteristics [6,27,28,29]. In this study, HCA was applied using Euclidian distance with Ward’s linkage method for computing cluster distance. Observations classified using this method are more correct than single linkage, complete linkage, and average linkage methods [6]. Ward’s method adopts the nearest-neighbor chain algorithm to find the optimal pair of clusters for merge clustering, which generates the most distinct hydrogeochemical signature clusters for water samples. The software Statistical Package for Social Sciences (SPSS) was used to carry out the analysis.
4.3. Hydrochemical Processes
Ionic concentration changes were calculated in order to better understand the hydrochemical processes that take place in the study area. Na+/Cl−, Na+/TZ+, Ca2+/Mg2+, and Ca2+ + Mg2+/(HCO3− + SO42−) molar ratios combined with the mineral saturation indices calculated by PHREEQC (Version 2) [30] were used to determine the sources of anions and cations in the groundwater.
4.4. Stable Isotopic Analysis
Stable isotopes are commonly used in order to study the origin and chemical evolution of groundwater [31,32,33]. The deuterium excess (d – excess = δD – 8 × δ18O) is usually used to describe the evaporation influence on water bodies compared to that of precipitation [31]. Besides, the deviation from a slope of 8 on a plot of δD versus δ18O can also indicate mixing between different water groups or water–rock interactions [34,35].
5. Result and Discussion
5.1. Hydraulic Head Patterns and Flow Directions
To determine the effects of faulting on the flow pattern, groundwater equipotential lines were drawn separately for the three sectors separated by the faults (Figure 3). The water flow is the same on both side of the two faults, and equipotential lines correspond across F1 and F2. As a result, the faults are normal tension faults, have hydraulic connection with each other, and have a great capacity to accommodate groundwater flow. Spatial distribution of groundwater depth is also shown in Figure 3, which has a similar trend with the variation of altitudes. The average depth to groundwater table is 92.5 m whereas minimum and maximum values are 15 m and 165 m, respectively. The shallow groundwater system prevails mainly in regions with low altitudes, especially in valley regions which have depth ranges between 15–50 m and occupy 15.7% of total area. Areas with depth ranges between 100–140 m occupy 41.7% of the total area and are distributed north of the F1 fault and occupy half the area between F1 and F2. Therefore, by considering depth to groundwater, the valley regions are more vulnerable to anthropogenic influence.
5.2. Hydrochemical Characteristics
Table 1 shows major groundwater components in the study area with minimum, maximum, average, and standard World Health Organization (WHO) values. Groundwater is neutral to mildly alkaline with a pH ranging from 6.9 to 7.5 with little variance. TDS ranges from 303.9 to 1033.2 mg/L (mean: 528.1). Only three samples contain TDS above the permissible limit defined by WHO drinking standards. Bicarbonate (HCO3−) concentration varies from 268.5 to 585.8 mg/L (mean: 406.1) and 100% of samples exceed the WHO guideline value. The mean chloride and sulfate concentrations are 24.1 and 68.9 mg/L, respectively, and only four samples contain sulfate above WHO standards. The mean Na+ + K+ concentration is 92.1 mg/L, and only two samples contain Na+ + K+ concentrations above the WHO guideline. Calcium concentration is greater than magnesium concentration and ranges from 14.7 to 194.0 mg/L. High fluoride concentration occurs in local areas, and 8% of the samples exceed the WHO limit; these samples are mainly in the northwestern part of the study area. Nitrate concentration varies between 0.5 and 173.3 mg/L, and 26.3% of samples exceed the nitrate concentration limit. Figure 3 shows that all the shallow groundwater areas were polluted by NO3−, which is dangerous to human health and to the environment. Studies have shown the high NO3− was probably from agricultural input [9,10]. However, variety fertilizers not only provide nitrate into groundwater but also provide calcium, magnesium, chloride, phosphorus, and potassium [36], which may cause a significant change in groundwater geochemistry.
5.3. Hierarchical Cluster Analysis
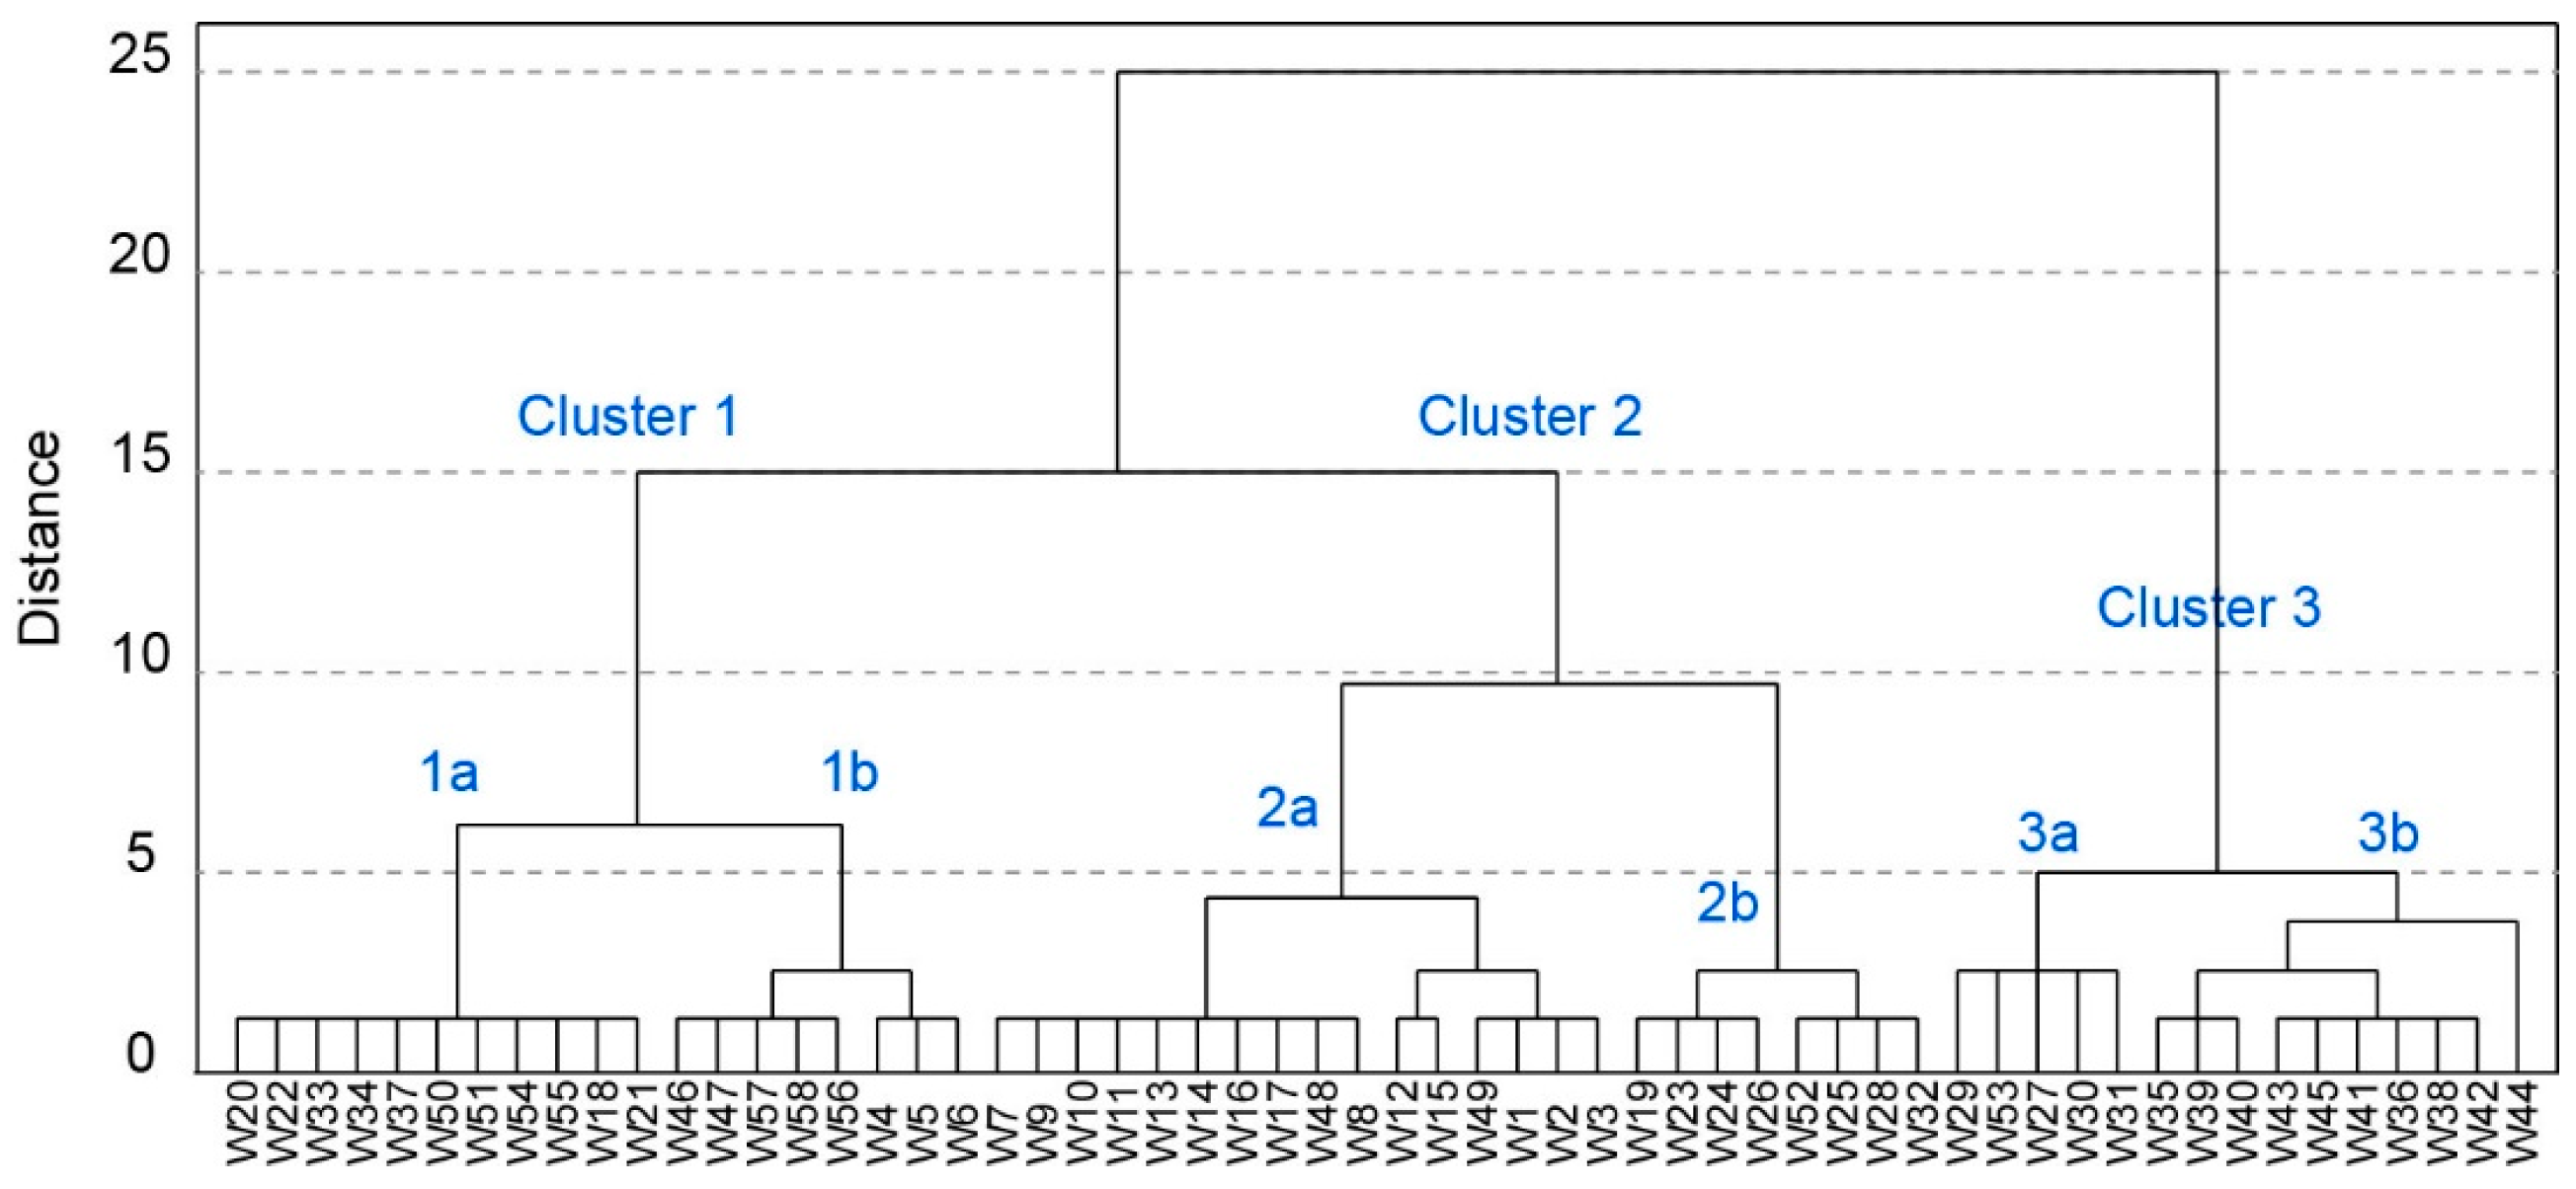
Hierarchical cluster analysis was applied to the set of nine variables, specifically: total hardness (TH), pH, Na+, Ca2+, Mg2+, Cl−, SO42+, HCO3−, NO3−, F−, and PO43−. Three clusters were identified from 58 wells (Figure 4). The spatial distribution of the clusters is presented in Figure 3. Sampling records from the same region are generally assigned to the same cluster during HCA. Cluster 1 is dominated by a mixed-type including 19 groundwater samples, which account for 32.8% of the total samples and have no distinctive characteristics in regard to the evaluated ions. Cluster 1 is further sub-divided in sub-Clusters 1a and 1b that are distributed on either side of the F1 fault. Cluster 2 contains 41.4% of all groundwater and has a Na-HCO3 water type. Cluster 2 is further sub-divided into sub-Clusters 2a and 2b, which are located relatively far away from each other. Groundwater samples in Cluster 3 have a Ca-HCO3 and Ca-SO4 water type, and account for 25.8% of the total samples. Cluster 3 samples are located mainly in the Juhe River valley. Cluster 3 also has two sub-clusters, 3a and 3b, which are located in the midstream and downstream regions, respectively. The Ca-SO4 water type is found in sub-cluster 3b.
Cluster distribution shows some correlation with the physiognomy and geology tectonics, which may cause different hydrochemical processes.
5.4. Hydrochemical Processes
The hydrogeochemical processes and aquifer mechanism are identified with the help of various graphical plots, which are discussed below.
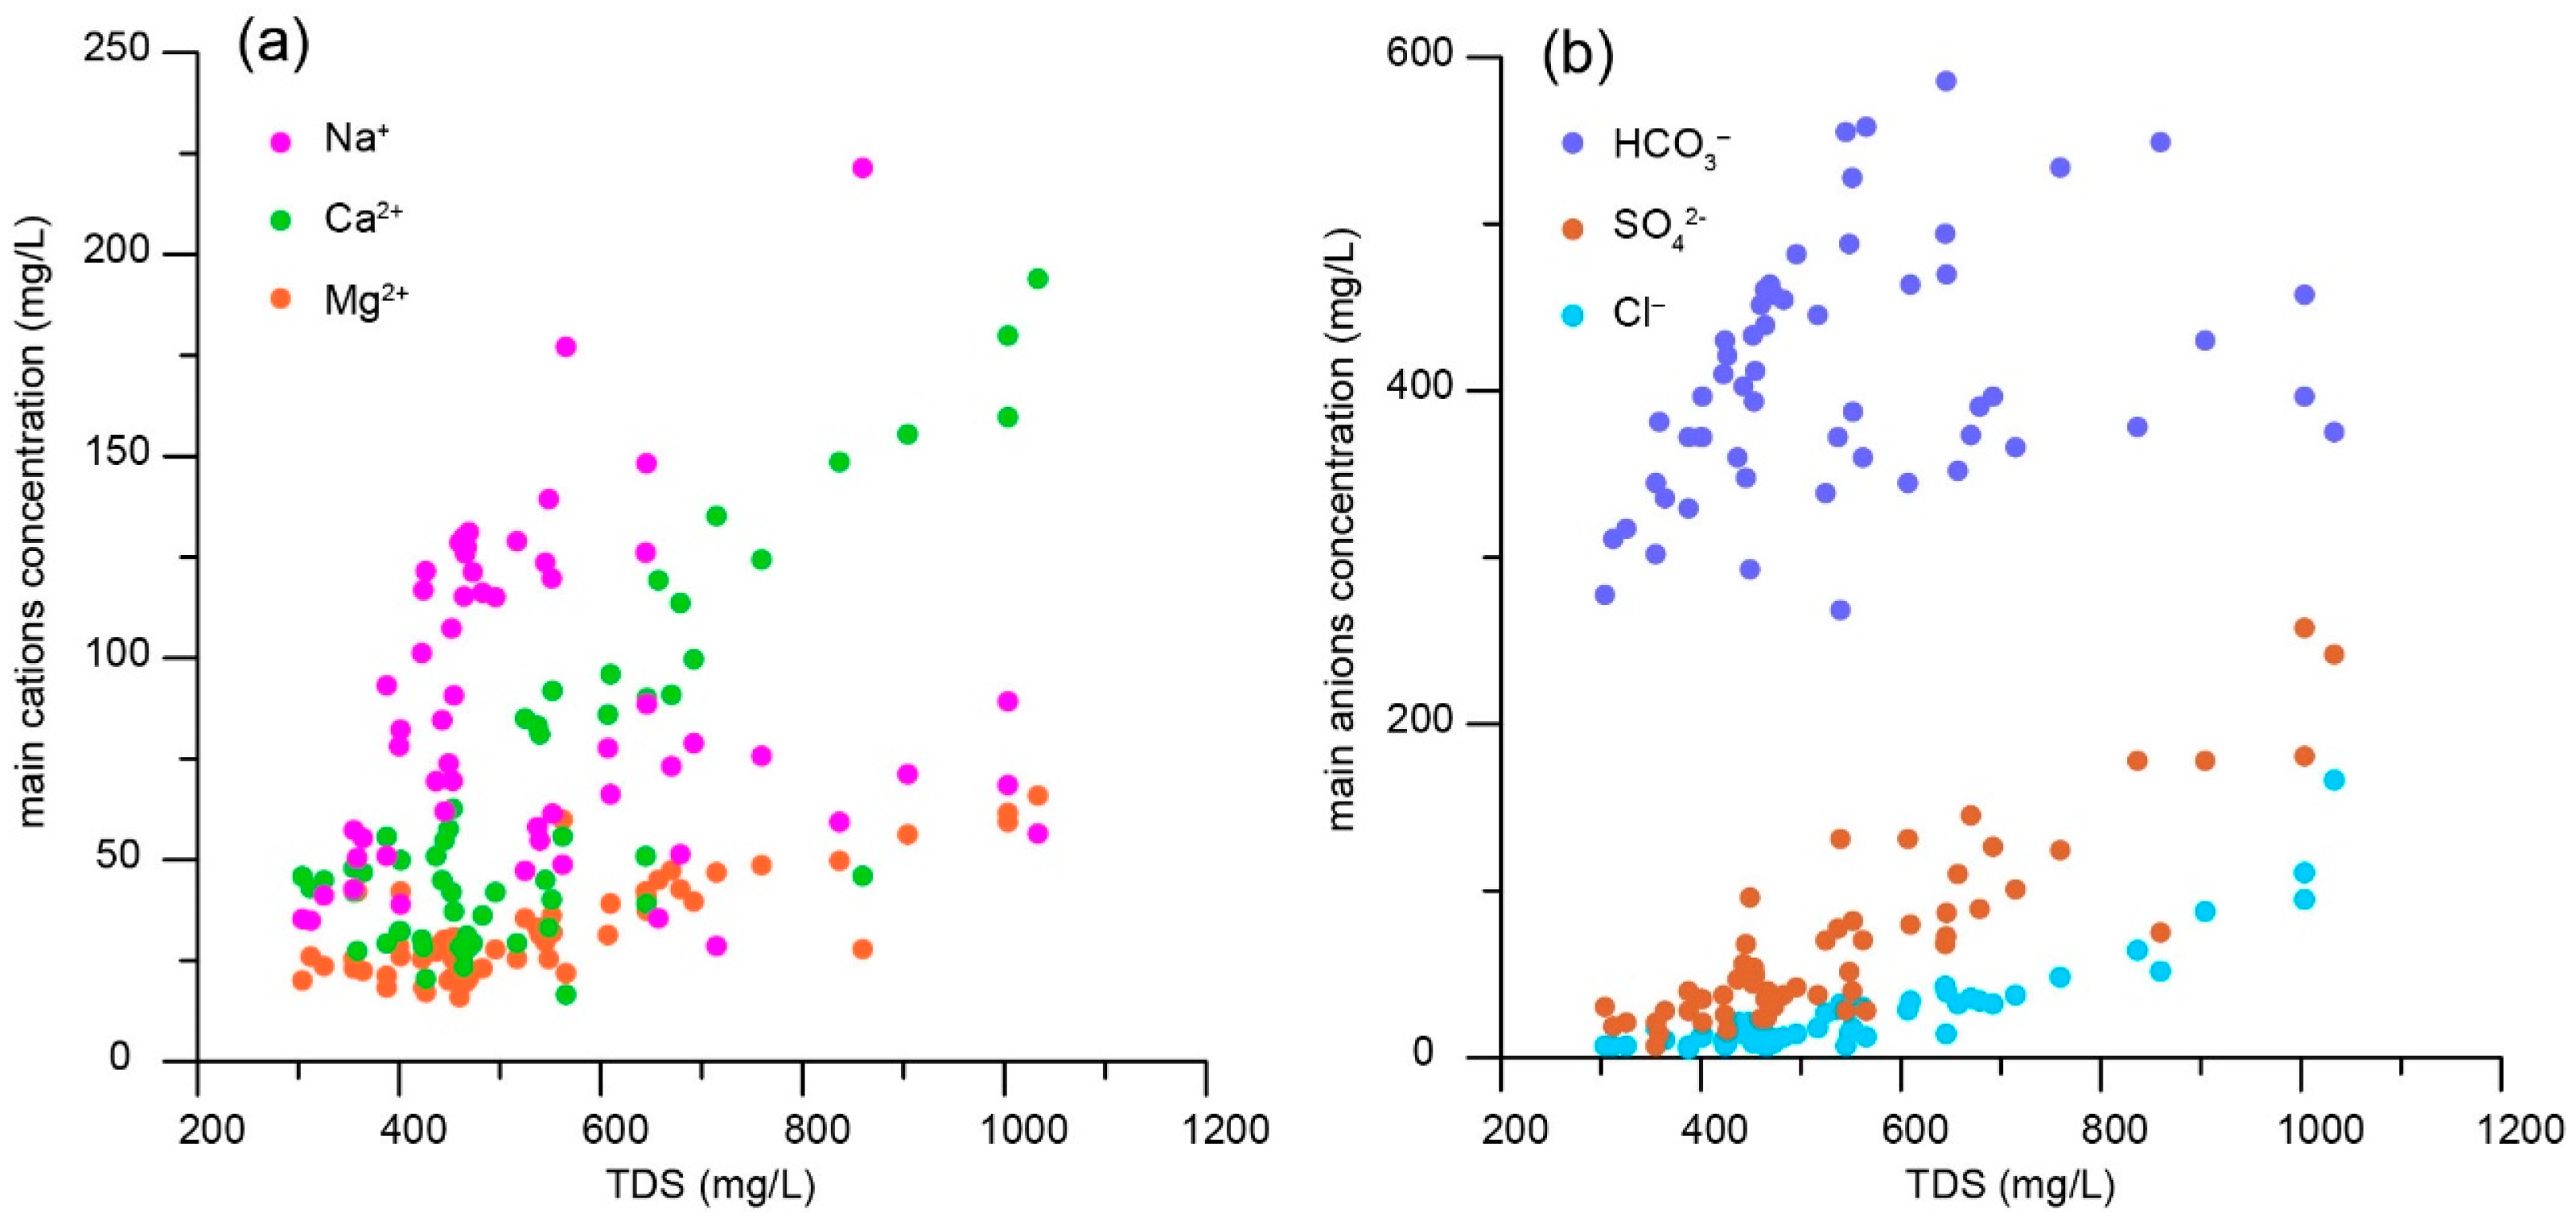
Chemical components and formation of groundwater are controlled by the geological environment, which is a result of the long geological evolution processes. To some extent, major ions constituting the total dissolved solids (TDS) reflect the hydrogeochemical processes that take place in the aquifer system [37]. In Figure 5, as the TDS increase, all ion concentrations increase in varying degrees. Ca2+ and Na+ provide a larger contribution than does Mg2+ to cations, and HCO3− provides a significant contribution to anions. In addition, Ca2+ and Na+ show a counter-balance and HCO3− has a decreasing trend when TDS range from 600 to 1000 mg/L. From the relationship between TDS and the major ions, it is preliminarily concluded that the dissolution of minerals containing Ca2+, Na+, and HCO3− make up the majority of the water-rock interaction. These minerals may be calcite, dolomite, or albite. Secondly, SO42− and Cl− may be from gypsum and halite dissolution. Meanwhile ion exchange processes may exist between Ca2+ and Na+.
5.4.1. Silicate Weathering
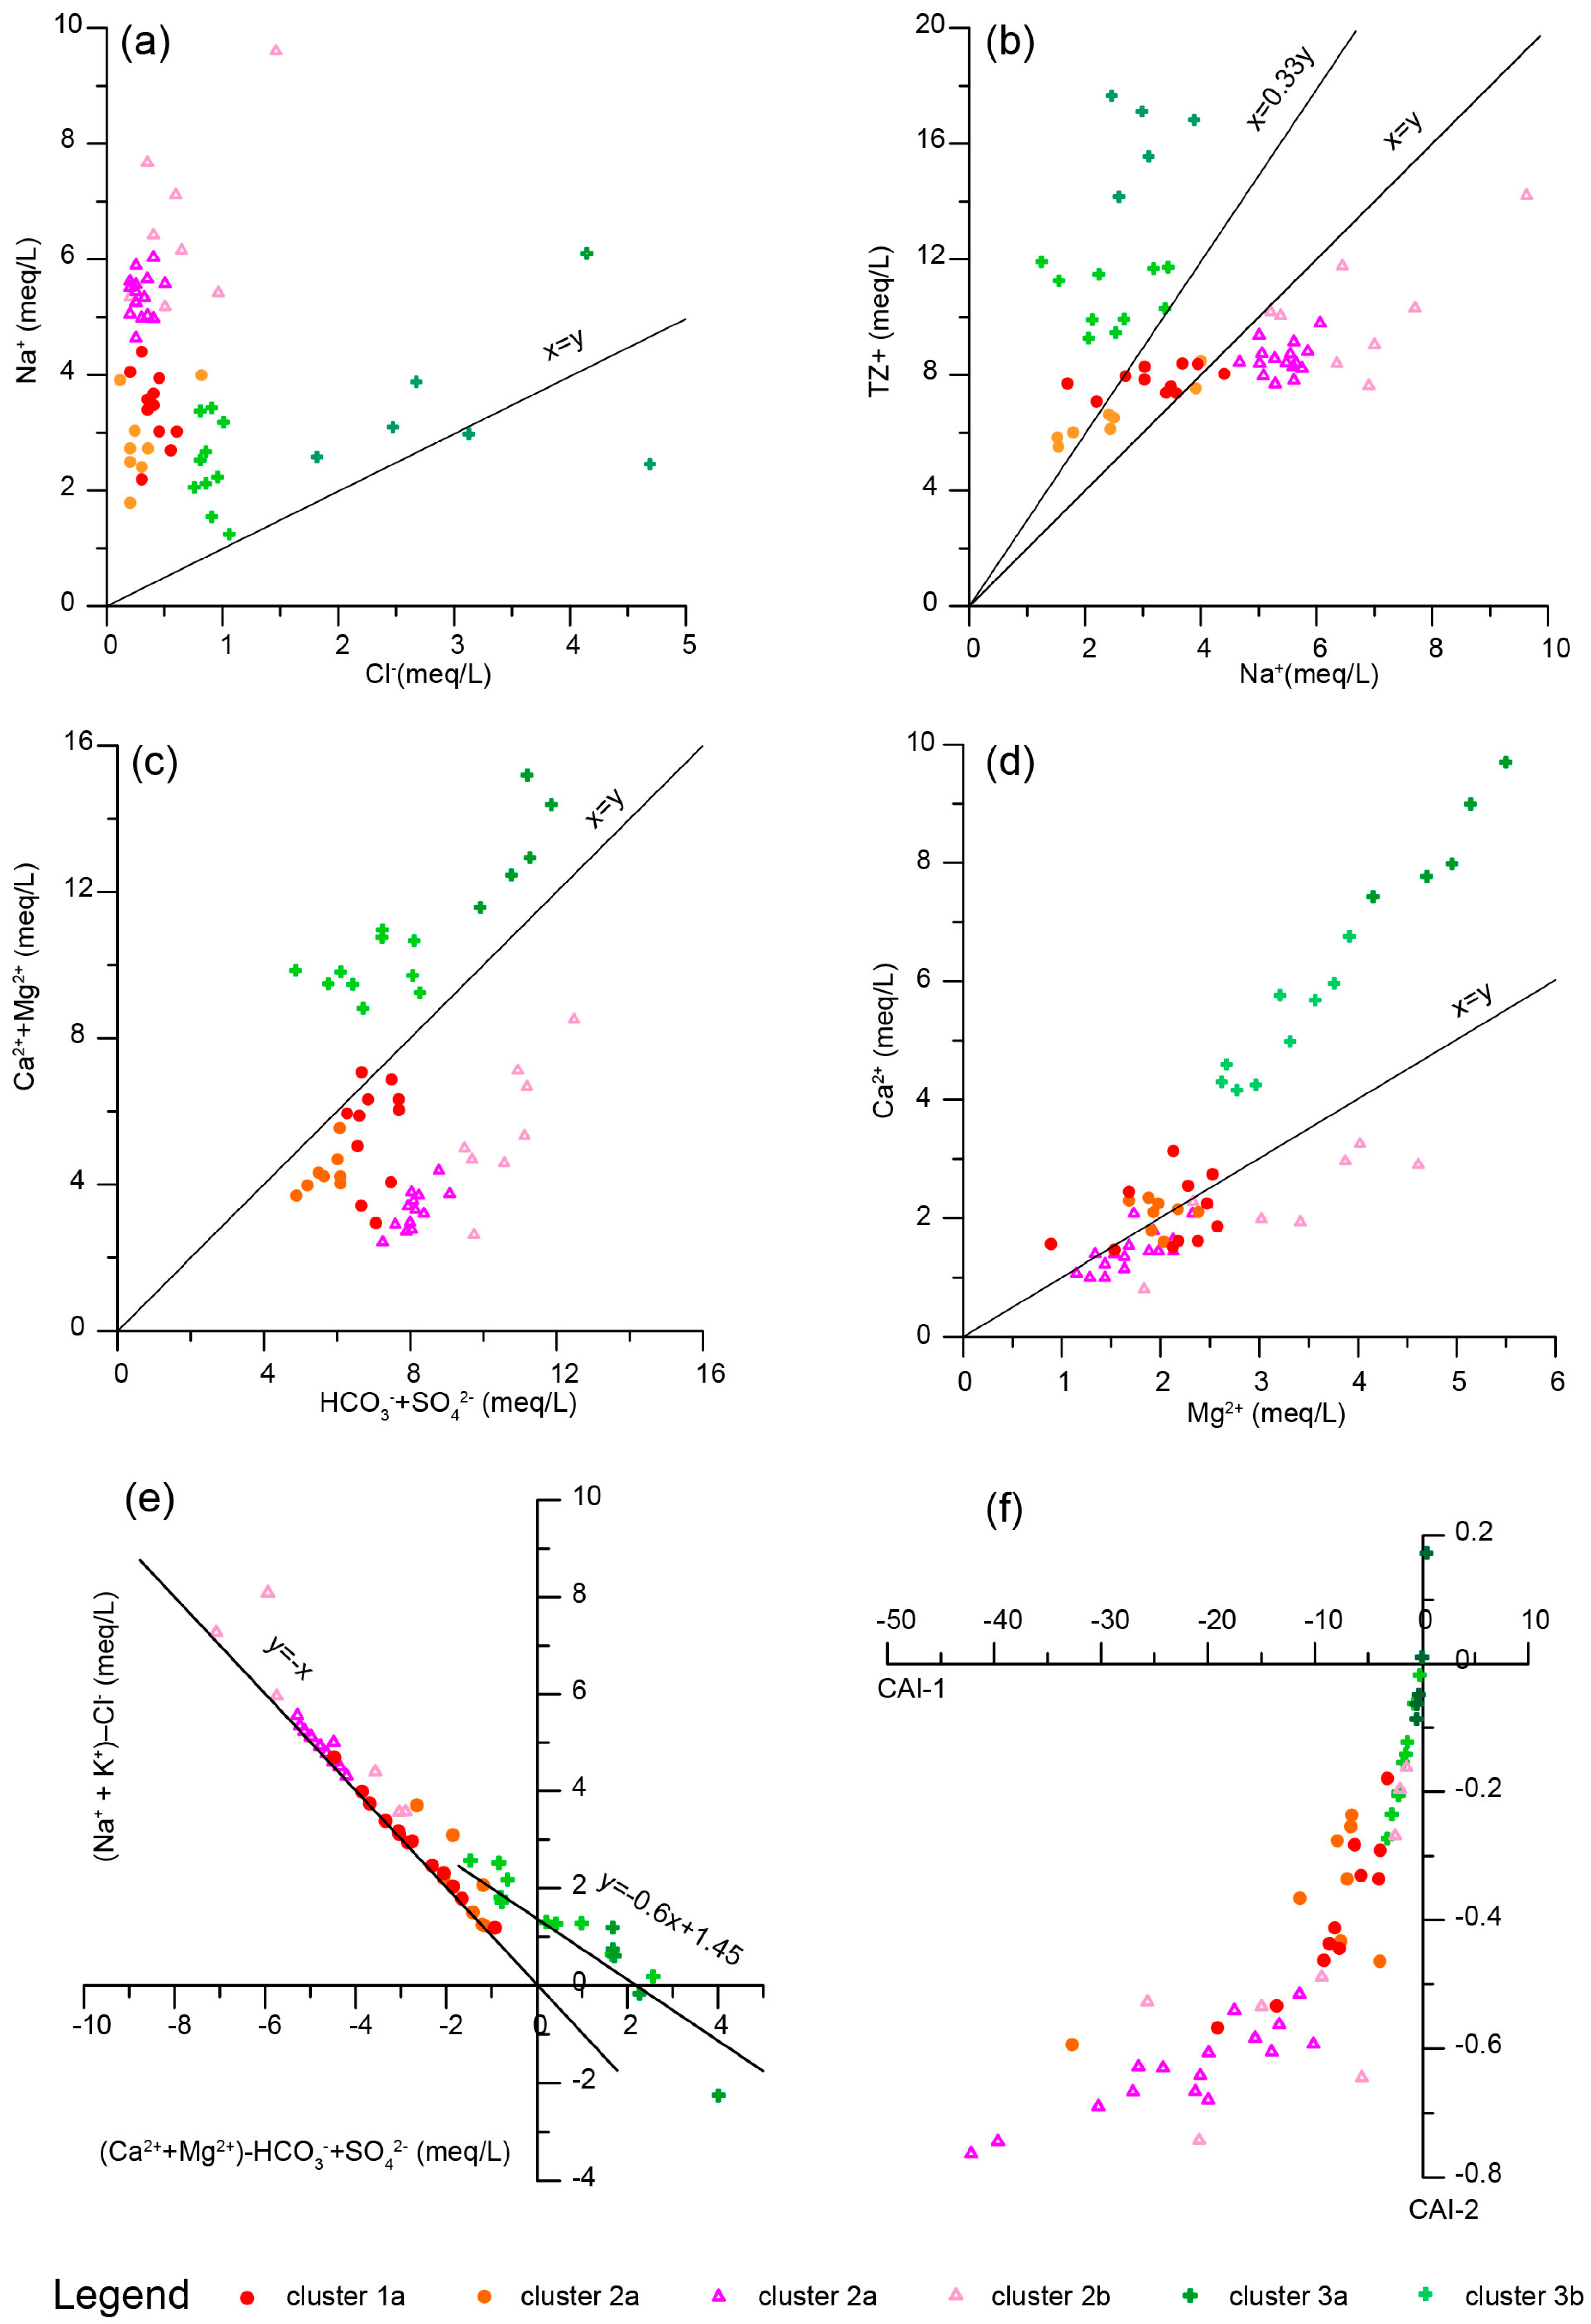
Silicate weathering is one of the key geochemical processes controlling the major ionic chemistry of groundwater, especially in hard rock aquifers [38]. Sodium, the most abundant cation, mainly comes from halite and silicate rocks. If halite dissolution is responsible for sodium concentration, the Na/Cl molar ratio should be approximately equal to one, whereas a ratio greater than one is commonly interpreted as Na released from a reaction during silicate weathering [39,40]. Samples lie above the Na/Cl 1:1 line, suggesting the sodium can be possibly attributed to silicate weathering (Figure 6a). If silicate weathering is the source of the sodium, water samples should have HCO3– as the most abundant anion [41,42]. In the present study, HCO3– is the dominant anion. The silicate weathering process can be examined by estimating the ratio of Na+ to total cations (TZ+) (Figure 6b) [43]. Groundwater samples from the cluster 3 are above 0.33 TZ+, indicating that there is less silicate weathering. Samples from cluster 2 fall below the 1:2 line, indicating an abundance of silicate weathering. Cluster 1 is somewhat scattered, sub-cluster 1a shows relatively little silicate weathering while sub-cluster 1b shows some silicate weathering.
Otherwise, in the Ca2+ + Mg2+ versus SO42− + HCO3− scatter diagram (Figure 6c), sample points fall along the equiline (Ca2+ + Mg2+ = SO42− + HCO3−), suggesting that these ions come from weathering of carbonates and silicates [5,44,45]. About 67% samples of the cluster 3 are on the Ca2+ + Mg2+ side vs. the SO42− + HCO3− side, indicating carbonate weathering is the dominant hydrogeochemical process. Cluster 1 is distributed near the 1:1 line and cluster 2 is relatively far from the 1:1 line, indicating weathering of both carbonates and silicates and dominant silicates weathering, respectively, which is consistent with the aforementioned conclusion. In addition, cluster 2b shows more silicate weathering than cluster 2a.
5.4.2. Carbonate Weathering and Dissolution
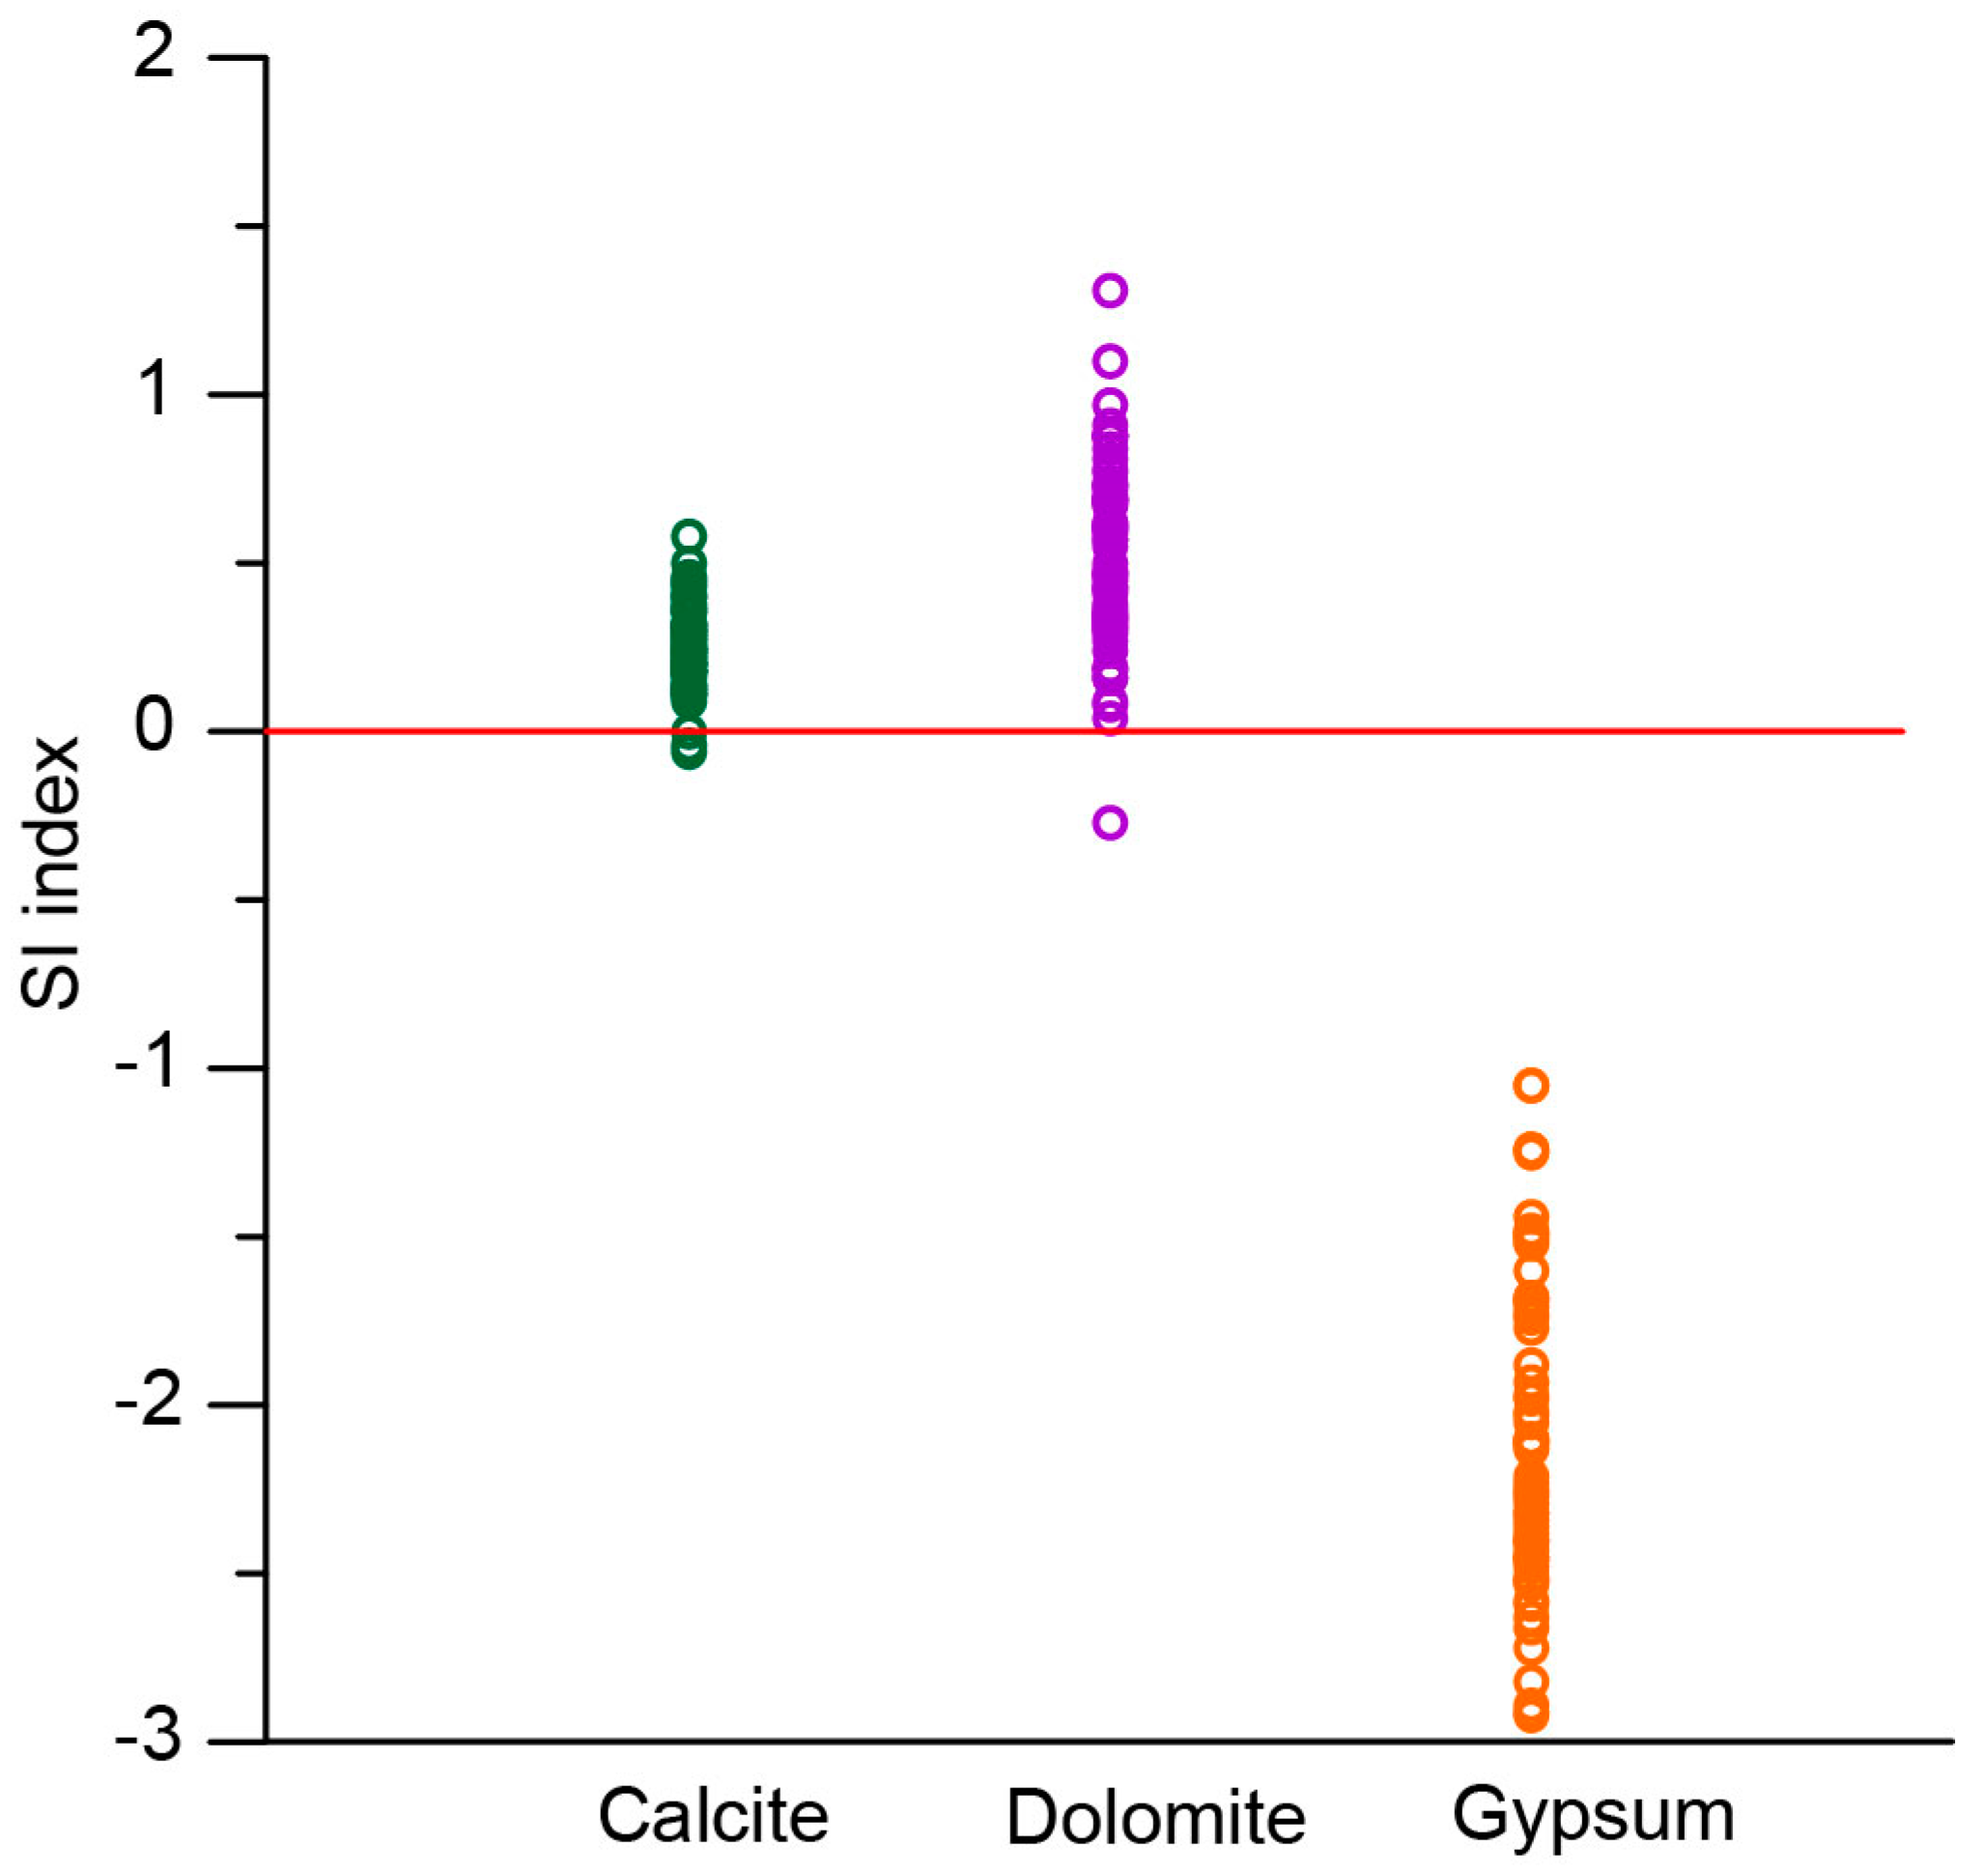
Saturation indices (SI) for gypsum, dolomite, and calcite are calculated using PHREEQC. By using the saturation index approach, it is possible to predict the reactive mineralogy of the subsurface from groundwater data without collecting and analyzing mineral samples [45]. The SI values for calcite and dolomite for all groundwater samples are greater than zero (Figure 7), indicating oversaturation and precipitation of these carbonate minerals. In contrast, gypsum SI values for all groundwater samples are less than zero, indicating the groundwater is unsaturated. Therefore, calcite and dolomite may be the primary carbonate minerals in the study area.
The Ca2+/Mg2+ molar ratios of groundwater samples depict the dissolution of calcite and dolomite that present in the weathered zone (Figure 6d) [5]. If the ratio Ca2+/Mg2+ = 1, dissolution of dolomite should occur, whereas a ratio >1 is indicative of calcite dissolution [29,46]. Samples from clusters 1 and 2 are distributed near the Ca/Mg = 1 line, indicating the dissolution of dolomite. Cluster 3 samples show ratios greater than 1, indicating that calcite dissolution is dominant.
5.4.3. Ion Exchange
Ion exchange reactions with clay material is responsible for the concentration of ions in groundwater [5]. The direct ion exchange and reverse ion exchange can be expressed as Equations (1) and (2), respectively:
where X indicates the soil exchanger [47]. An excess of Ca2+ or Mg2+ in groundwater may be due to the exchange of Na+ in the water by Ca2+ or Mg2+ in clay material, while an excess of Na+ may be due to the exchange of Ca2+ or Mg2+in the water by Na+ in clay material [48].
In order to assess the possible role of ion exchange in the hydrochemistry of groundwater, (Ca2+ + Mg2+) − (HCO3− + SO42−) in meq/L was plotted against (Na+ + K+) − Cl− in meq/L. The (Ca2+ + Mg2+) − (HCO3− + SO42−) equation means that the cations Ca and Mg were corrected by omitting the influences by other processes (e.g., carbonate or silicate weathering), whereas the (Na+ + K+) − Cl− equation means that the cations K and Na were from sources other than their respective chlorides [49]. If ion exchange is the dominant process in the system, the samples should form a line with a slope of −1 [16,20,42,49]. Figure 6e shows that cluster 1 and cluster 2 samples have a slope of −1, indicating cation exchange influences the groundwater chemistry of these samples, and cluster 3 has a slope of −0.6, indicating that cation exchange shows less influence on the water chemistry in cluster 3 than it does in the other clusters.
Chloro alkaline indices (CAI) [37,49], calculated using Equations (3) and (4), were further used to identify the specific ion exchange between the groundwater and its host environment.
All values are expressed in meq/L. When there is an exchange between Na+ or K+ in the water with Mg2+ or Ca2+ in rock, this indicates a direct ion exchange. Na+ or K+ will decrease in water and both the above indices will be positive. In contrast, the reverse ion exchange will produce negative indices [37]. Figure 6f shows that most of the samples indicate negative values for both indices, suggesting reverse ion exchange in the system. Only cluster 3b shows positive values in individual samples.
5.5. Hydrochemical Difference among All Clusters
The varying lithology of the bedrock and associated soil forms different types of groundwater. Moreover, tectonic structures, especially faults, control the spatial distribution of strata and geomorphology, which is related to the different types of groundwater [16].
Owing to the impact of the geological structure, aquifers may not be continuous in the same unit. The similar aquifers on both sides of the F2 fault produce the similar clusters 1a and 1b, which are both dominated by carbonate and silicate weathering. However, silicates weathering has more influence in cluster 1b than in cluster1a. In addition, a loess aquifer exists north of the F1 fault, but south of the F1 fault, the loess is permeable but does not contain water. Thus, north of the F2 fault there could be some mixing between water from the sand gravels aquifer and the loess aquifer, which could explain the difference between 1a and 1b.
Cluster 3 shows a distinctive difference from cluster 1 and 2 in molar ratio graphs. The reasons can be concluded as follows. Firstly, the Ordovician carbonates exposed in the valley region result in carbonate weathering being the main hydrochemical process for cluster 3. Secondly, the only unconfined aquifer with shallow water depth makes the valley region more vulnerable to pollution than the other regions. Nitrate contamination from agricultural infiltration has already threatened the water quality in shallow water depth areas, which also influences water chemistry. In addition, cluster 3b shows a direct ionic exchange process while cluster 3a shows reverse ionic exchange progress. Cluster 3b is centered on a populated area, in addition to agriculture, industrial and domestic activities affect the unconfined aquifer, which can produce the differences between clusters 3a and 3b. Cluster 2 is distributed in two locations. As the faults connect water, cluster 2a within the same aquifer as cluster 1 should have similar chemical characteristics along the flow path. However, cluster 2a located between clusters 1a and 1b is not classified in the same group and shows distinctive water chemical characteristics. Cluster 2b is located in the south of F2 within a different aquifer but is classified in the same group. The rational reason for this is discussed in Section 5.5.
5.6. Discussion of Cluster 2a
The value of d-excess is determined by the variability of δD and δ18O values. Generally, the variations are correlated primarily with isotope composition of precipitation that changes in elevation, latitude, distance from the coast, and temperature [50]. However, for groundwater, the variation in d-excess is hard to interpret because precipitation is not the only recharge source, and the hydrogeological setting is quite complex. The variations of δD and δ18O in groundwater can be caused by a variety of mechanisms [50]: (1) geographic displacement by subsurface, (2) recharge from partially evaporated or polluted surface water bodies, (3) recharge that occurred in past periods of different climate when the isotope composition of precipitation was different from that at present, (4) mixing with different water groups, such as subsurface brines, seawater, or water from other aquifers, (5) interactions with rocks accompanied by an isotope exchange, and (6) evaporation influence on different groundwater depth.
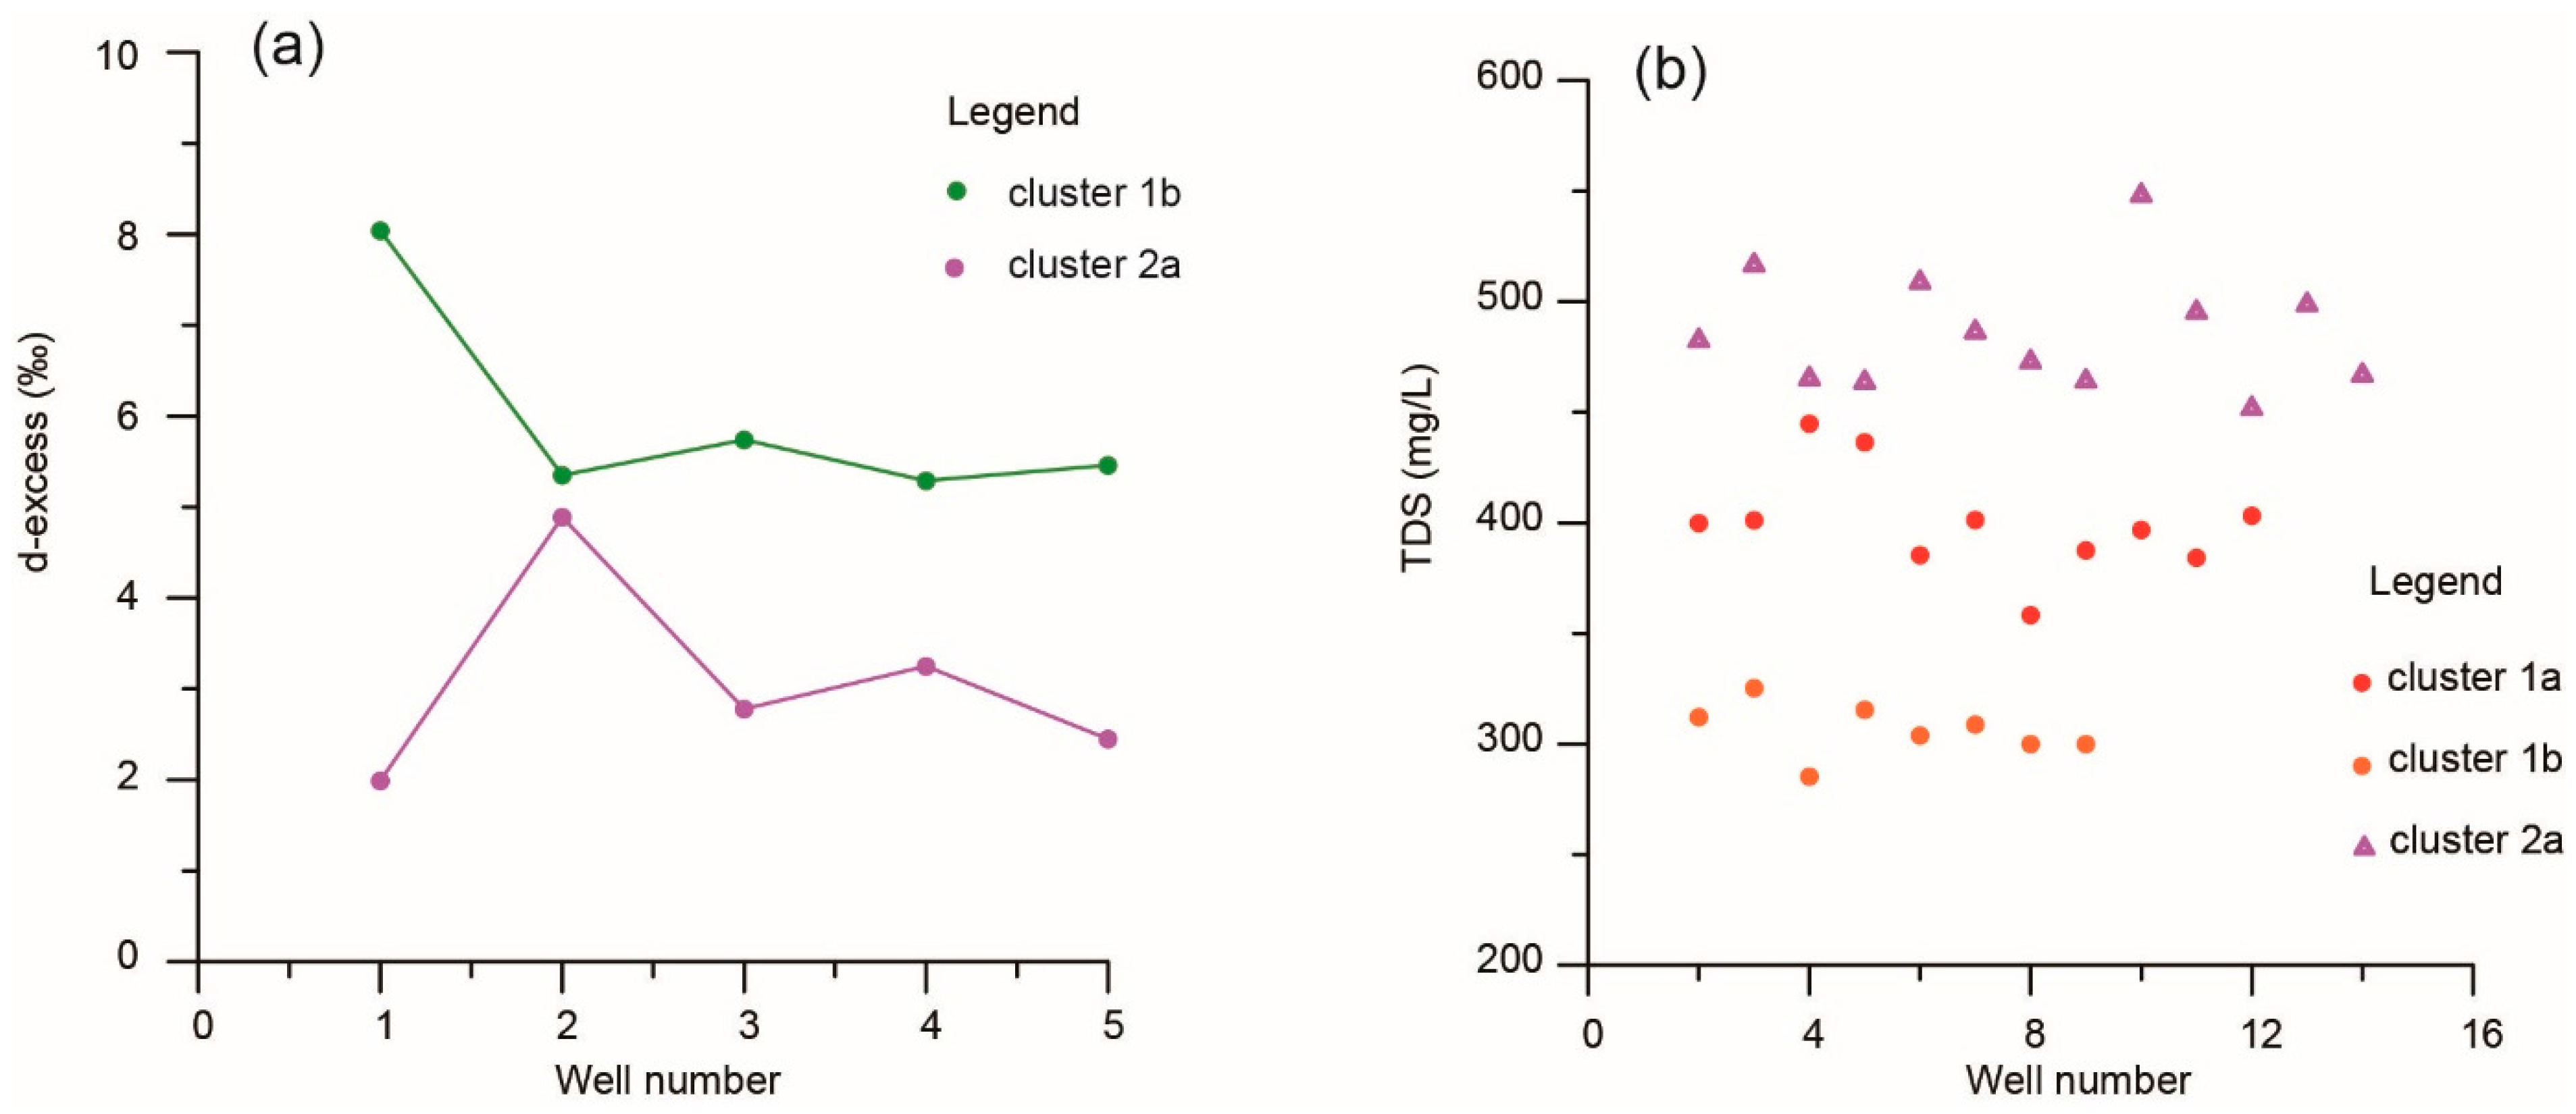
In the sampled area, the possible mechanisms that change δD and δ18O are relatively simple. Firstly, as the sampled groundwater has a deep water depth of >100 m, evaporation has negligible effect on the change in water chemistry. Secondly, as groundwater belongs to the same aquifer system in a small area, there are no differences in both recharge sources, hydrometeorological, and geological conditions. Thus, d-excess is most likely contributed to mechanisms of water-rock interaction and mixing process in the sampled area. Water-rock interaction happens continuously along the groundwater flow path. During the dissolution process of a variety of minerals, rocks release ions and oxygen elements to the groundwater, which result in TDS and δ18O enrichment. Generally, TDS and δ18O content downstream is higher than that upstream because of accumulation of water-rock interaction. TDS are expected to increase from cluster 1b to cluster 2a to cluster 1a. However, results show the TDS content for cluster 2a is higher than cluster 1a (Figure 8), which is contrary to the evolution laws. In addition, if the high TDS result from more water-rock interaction, δ18O should also increase at the same time, which results in low d-excess. However, data analysis shows δ18O values are similar in all clusters. The low d-excess value in cluster 2a is not only caused by water-rock interaction along the flow path but also by another reason, which is probably mixing between different water groups.
Generally, aquifers of fault tectonics occur in the fracture zone. As the rock in each wall is relatively impermeable and the structure of the fault itself may contain void spaces, fracture zones become good reservoir structures when the recharge conditions are appropriate. In addition, the fracture zone, under the most intense strain, is commonly surrounded by fault breccia. Observation in the well log show fault breccia and fractures near the F1 fault [23], and cluster 2a represents a water zone formed by the F1 fault. Almost all wells in cluster 2a have a depth of 150 m and intersect the fracture zone. It is possible to cause mixing between Quaternary pore water and clastic rock fissure water during the pumping of these wells. Combined with the evidence of d-excess, the sampled water from cluster 2a indicates mixing between Quaternary pore water and clastic rock fissure water.
6. Conclusions
Understanding how the hydrochemistry of groundwater evolves within aquifers along groundwater flow paths is crucial for the management of groundwater resources in semi-arid areas. In the present study, statistical analysis, graphical plots, and isotopic techniques were applied to investigate the hydrochemical characteristics and major factors influencing groundwater evolution. The following conclusions can be reached:
- Statistical analysis shows that the relative abundance of major cations in the groundwater is Na+ > Ca2+ > Mg2+, whereas the relative abundance of anions is HCO3− > SO42− > Cl−. The groundwater is polluted with NO3− in shallow water depth areas, which is attributed to anthropogenic factors, especially agriculture.
- Three clusters with different characteristics were identified using HCA in the study area, which is in accordance with the different water types. Clusters 1 and 2 exhibit hydrochemical facies of mixed-HCO3 and Na-HCO3, respectively. Cluster 3 exhibits mixed facies of Ca-HCO3 or Ca-SO4.
- Hydrochemical processes show the predominance of carbonate and silicate weathering in cluster 1, silicate weathering and ionic exchange in cluster 2, carbonate weathering in cluster 3, and ionic exchange in all clusters.
- Geological factors play an important role in groundwater chemistry. The chemistry of samples near the F1 fault is different from that in the other samples in the same aquifer along the flow path, even though F1 is a permeable fault. Oxygen and hydrogen isotopes indicate mixing between Quaternary pore water and clastic rock fissure water causing abnormal groundwater chemistry.
Acknowledgments
The research was supported by the National Natural Science Foundation of China (41572236) and the Fundamental Research Funds for the Central Universities of Chang’an University (310829173306, 310829173701, 310829172202). We also wish to express our gratitude to the reviewers for their constructive comments.
Author Contributions
Hui Qian provided the writing ideas and supervised the study; Xinyan Li conceived the research and wrote the paper; Hui Qian and Yanyan Gao took the water samples and analyzed the data.
Conflicts of Interest
The authors declare no conflict of interest.
References
- Li, P.; Tian, R.; Xue, C.; Wu, J. Progress, opportunities, and key fields for groundwater quality research under the impacts of human activities in China with a special focus on western China. Environ. Sci. Pollut. Res. 2017, 24, 13224–13234. [Google Scholar] [CrossRef] [PubMed]
- Chen, J.; Wu, H.; Qian, H.; Gao, Y. Assessing nitrate and fluoride contaminants in drinking water and their health risk of rural residents living in a semiarid region of Northwest China. Expo. Health 2017, 9, 183–195. [Google Scholar] [CrossRef]
- Chen, J.; Wu, H.; Qian, H.; Li, X. Challenges and prospects of sustainable groundwater management in an arid region along the Silk Road economic belt, Northwest China. Int. J. Water Resour. Dev. 2016. [Google Scholar] [CrossRef]
- Kumar, M.; Ramanathan, A.L.; Rao, M.S.; Kumar, B. Identification and evaluation of hydrogeochemical processes in the groundwater environment of Delhi, India. Environ. Geol. 2006, 50, 1025–1039. [Google Scholar] [CrossRef]
- Sonkamble, S.; Sahya, A.; Mondal, N.C.; Harikumar, P. Appraisal and evolution of hydrochemical processes from proximity basalt and granite areas of Deccan Volcanic Province (DVP) in India. J. Hydrol. 2012, 438–439, 181–193. [Google Scholar] [CrossRef]
- Moya, C.E.; Raiber, M.; Taulis, M.; Cox, M.E. Hydrochemical evolution and groundwater flow processes in the Galilee and Eromanga basins, Great Artesian Basin, Australia: A multivariate statistical approach. Sci. Total Environ. 2015, 508, 411–426. [Google Scholar] [CrossRef] [PubMed]
- Brkić, Ž.; Briški, M.; Marković, T. Use of hydrochemistry and isotopes for improving the knowledge of groundwater flow in a semiconfined aquifer system of the Eastern Slavonia (Croatia). Catena 2016, 142, 153–165. [Google Scholar] [CrossRef]
- Kim, J.-H.; Kim, K.-H.; Thao, N.T.; Batsaikhan, B.; Yun, S.-T. Hydrochemical assessment of freshening saline groundwater using multiple end-members mixing modeling: A study of Red River delta aquifer, Vietnam. J. Hydrol. 2017, 549, 703–714. [Google Scholar] [CrossRef]
- Wei, Y.; Fan, W.; Wang, W.; Deng, L. Identification of nitrate pollution sources of groundwater and analysis of potential pollution paths in loess regions: A case study in Tongchuan region, China. Environ. Earth Sci. 2017, 76, 423. [Google Scholar] [CrossRef]
- Li, X. Research of Groundwater Chemical Characteristics and Nitrate Pollution Source of Yaozhou Map-Area. Master’s Thesis, Chang’an University, Xi’an, China, 2015. (In Chinese). [Google Scholar]
- Chen, J.; Qian, H.; Wu, H. Nitrogen contamination in groundwater in an agricultural region along the New Silk Road, northwest China: Distribution and factors controlling its fate. Environ. Sci. Pollut. Res. 2017, 24, 13154–13167. [Google Scholar] [CrossRef] [PubMed]
- Chen, J.; Qian, H.; Wu, H.; Gao, Y.; Li, X. Assessment of arsenic and fluoride pollution in groundwater in Dawukou area, Northwest China and the associated health risk for inhabitants. Environ. Earth Sci. 2017, 76, 314. [Google Scholar] [CrossRef]
- Cheng, Y.; Zhang, J.; Peng, J. ArcGIS-based evaluation of geo-hazards at Yaozhou County, Shaanxi, China. J. Rock Mech. Geotech. Eng. 2013, 5, 330–334. [Google Scholar] [CrossRef]
- Wei, Y.; Fan, W.; Cao, Y. Experimental study on the vertical deformation of aquifer soils under conditions of withdrawing and recharging of groundwater in Tongchuan region, China. Hydrogeol. J. 2017, 25, 297–309. [Google Scholar] [CrossRef]
- Furi, W.; Razack, M.; Abiye, T.A.; Kebede, S.; Legesse, D. Hydrochemical characterization of complex volcanic aquifers in a continental rifted zone: The Middle Awash basin, Ethiopia. Hydrogeol. J. 2012, 20, 385–400. [Google Scholar] [CrossRef]
- Rajabpour, H.; Vaezihir, A.; Sedghi, M.H. The North Tabriz Fault, a barrier to groundwater flow in an alluvial aquifer northwest of Tabriz, Iran. Environ. Earth Sci. 2016, 75, 849. [Google Scholar] [CrossRef]
- Hagedorn, B.; Whittier, R.B. Solute sources and water mixing in a flashy mountainous stream (Pahsimeroi River, U.S. Rocky Mountains): Implications on chemical weathering rate and groundwater–surface water interaction. Chem. Geol. 2015, 391, 123–137. [Google Scholar] [CrossRef]
- Zhuang, J.; Peng, J.; Wang, G.; Iqbal, J.; Wang, Y.; Li, W.; Xu, Q.; Zhu, X. Prediction of rainfall-induced shallow landslides in the Loess Plateau, Yan’an, China, using the TRIGRS model. Earth Surf. Process. Landf. 2017, 42, 915–927. [Google Scholar] [CrossRef]
- Wu, H.; Li, X.; Qian, H. Detection of anomalies and changes of rainfall in the Yellow River Basin, China, through two graphical methods. Water 2018, 10, 15. [Google Scholar] [CrossRef]
- Wu, H.; Qian, H. Innovative trend analysis of annual and seasonal rainfall and extreme values in Shaanxi, China, since the 1950s. Int. J. Climatol. 2017, 37, 2582–2592. [Google Scholar] [CrossRef]
- Peng, J.; Chen, L.; Huang, Q.; Men, Y.; Fan, W.; Yan, J. Physical simulation of ground fissures triggered by underground fault activity. Eng. Geol. 2013, 155, 19–30. [Google Scholar] [CrossRef]
- Liu, B.K.; Chen, Y.W.; Zhou, C.K. Hydrogeology Survey Report of Valley Region in Yaoxian County, Shaanxi; Department of Geology and Mineral Resources of Shaanxi Province: Xi’an, China, 1985. (In Chinese) [Google Scholar]
- Si, P.Z.; Yu, J.X.; Ge, X.W.; Xue, Y.B. Summary of Geology and Hydrogeology Mapping in Yaoxian County, Shaanxi; Shaanxi Coal Hydrogeology Team: Xi’an, China, 1997. (In Chinese) [Google Scholar]
- Ministry of Health of PRC; Standardization Administration of PRC. Standard Examination Methods for Drinking Water (GB/T5750-2006); Standards Press of China: Beijing, China. (In Chinese)
- Lambrakis, N.; Antonakos, A.; Panagopoulos, G. The use of multicomponent statistical analysis in hydrogeological environmental research. Water Res. 2004, 38, 1862–1872. [Google Scholar] [CrossRef] [PubMed]
- Belkhiri, L.; Boudoukha, A.; Mouni, L.; Baouz, T. Application of multivariate statistical methods and inverse geochemical modeling for characterization of groundwater—A case study: Ain Azel plain (Algeria). Geoderma 2010, 159, 390–398. [Google Scholar] [CrossRef]
- Suk, H.; Lee, K.-K. Characterization of a ground water hydrochemical system through multivariate analysis: Clustering into ground water zones. Groundwater 1999, 37, 358–366. [Google Scholar] [CrossRef]
- Wu, J.; Li, P.; Qian, H.; Duan, Z.; Zhang, X. Using correlation and multivariate statistical analysis to identify hydrogeochemical processes affecting the major ion chemistry of waters: A case study in Laoheba phosphorite mine in Sichuan, China. Arab. J. Geosci. 2014, 7, 3973–3982. [Google Scholar] [CrossRef]
- Askri, B. Hydrochemical processes regulating groundwater quality in the coastal plain of Al Musanaah, Sultanate of Oman. J. Afr. Earth Sci. 2015, 106, 87–98. [Google Scholar] [CrossRef]
- Parkhurst, D.; Appelo, C. User’s Guide to PHREEQC (Version 2); US Geological Survey: Reston, VA, USA, 1999.
- Qian, H.; Wu, J.; Zhou, Y.; Li, P. Stable oxygen and hydrogen isotopes as indicators of lake water recharge and evaporation in the lakes of the Yinchuan Plain. Hydrol. Process. 2014, 28, 3554–3562. [Google Scholar] [CrossRef]
- Qian, H.; Li, P.; Wu, J.; Zhou, Y. Isotopic characteristics of precipitation, surface and ground waters in the Yinchuan plain, Northwest China. Environ. Earth Sci. 2013, 70, 57–70. [Google Scholar] [CrossRef]
- Somaratne, N.; Mustafa, S.; Lawson, J. Use of hydrochemistry, stable isotope, radiocarbon, 222Rn and terrigenic 4He to study the geochemical processes and the mode of vertical leakage to the Gambier Basin tertiary confined sand aquifer, South Australia. Water 2016, 8, 180. [Google Scholar] [CrossRef]
- Yin, G.; Ni, S. Deuterium excess parameter evolution in ground water bulletin of mineralogy. Petrol. Geochem. 2001, 20, 409–411. (In Chinese) [Google Scholar]
- Vengosh, A.; Hening, S.; Ganor, J.; Mayer, B.; Weyhenmeyer, C.E.; Bullen, T.D.; Paytan, A. New isotopic evidence for the origin of groundwater from the Nubian Sandstone Aquifer in the Negev, Israel. Appl. Geochem. 2007, 22, 1052–1073. [Google Scholar] [CrossRef]
- Hagedorn, B.; Cartwright, I. Climatic and lithologic controls on the temporal and spatial variability of CO2 consumption via chemical weathering: An example from the Australian Victorian Alps. Chem. Geol. 2009, 260, 234–253. [Google Scholar] [CrossRef]
- Wu, H.; Chen, J.; Qian, H.; Zhang, X. Chemical characteristics and quality assessment of groundwater of exploited aquifers in Beijiao Water Source of Yinchuan, China: A case study for drinking, irrigation, and industrial purposes. J. Chem. N. Y. 2015, 2015, 726340. [Google Scholar] [CrossRef]
- Mackenzie, F.J.; Garrells, R.H. Silicates: Reactivity with sea water. Sci. J. 1965, 150, 57–58. [Google Scholar] [CrossRef] [PubMed]
- Mayback, M. Global chemical weathering of surficial rocks estimated from river dissolved loads. Am. J. Sci. 1987, 287, 401–428. [Google Scholar] [CrossRef]
- Li, P.; Wu, J.; Qian, H. Hydrogeochemical characterization of groundwater in and around a wastewater irrigated forest in the southeastern edge of the Tengger Desert, Northwest China. Expo. Health 2016, 8, 331–348. [Google Scholar] [CrossRef]
- Rogers, R.J. Geochemical comparison of groundwater in areas of New England, New York, and Pennsylvania. Groundwater 1989, 27, 690–712. [Google Scholar] [CrossRef]
- Rajmohan, N.; Elango, L. Identification and evolution of hydrogeochemical processes in the groundwater environment in an area of the Palar and Cheyyar River Basins, southern India. Environ. Geol. 2004, 46, 47–61. [Google Scholar] [CrossRef]
- Lakshmanan, E.; Kannan, R.; Kumar, M.S. Major ion chemistry and identification of hydrogeochemical processes of ground water in a of Kancheepuram district, Tamil Nadu, India. Environ. Geol. 2003, 10, 157–166. [Google Scholar] [CrossRef]
- Datta, P.S.; Tyagi, S.K. Major ion chemistry of groundwater in Delhi area: Chemical weathering processes and groundwater flow regime. J. Geol. Soc. India 1996, 47, 179–188. [Google Scholar]
- Fisher, R.S.; Mullican, W.F., III. Hydrochemical evolution of sodium-sulfate and sodium-chloride groundwater beneath the northern Chihuahuan Desert, Trans-Pecos, Texas, USA. Hydrogeol. J. 1997, 5, 4–16. [Google Scholar] [CrossRef]
- Maya, A.L.; Loucks, M.D. Solute and isotopic geochemistry and groundwater flow in the Central Wasatch Range, Utah. J. Hydrol. 1995, 172, 31–59. [Google Scholar] [CrossRef]
- Anders, R.; Mendez, G.O.; Futa, K.; Danskin, W.R. A geochemical approach to determine sources and movement of saline groundwater in a coastal aquifer. Groundwater 2014, 52, 756–768. [Google Scholar] [CrossRef] [PubMed]
- Cartwright, I.; Weaver, T.; Petrides, B. Controls on 87Sr/86Sr ratios of groundwater in silicate-dominated aquifers: SE Murray Basin, Australia. Chem. Geol. 2007, 246, 107–123. [Google Scholar] [CrossRef]
- Yidana, S.M.; Yidana, A. Assessing water quality using water quality index and multivariate analysis. Environ. Earth Sci. 2010, 59, 1461–1473. [Google Scholar] [CrossRef]
- Gat, J.R. Comments on the stable isotope method in regional groundwater investigations. Water Resour. Res. 1971, 7, 980–993. [Google Scholar] [CrossRef]
Figure 1.
Map showing the location of the study area.

Figure 2.
Lithological cross sections (a) A–A’ and (b) B–B’.

Figure 3.
Map showing the hydraulic head pattern, groundwater flow direction, groundwater depth, location of monitoring wells, areas where nitrate exceeds the World Health Organization (WHO) guideline value, and distribution of all sub-clusters.
Figure 3.
Map showing the hydraulic head pattern, groundwater flow direction, groundwater depth, location of monitoring wells, areas where nitrate exceeds the World Health Organization (WHO) guideline value, and distribution of all sub-clusters.
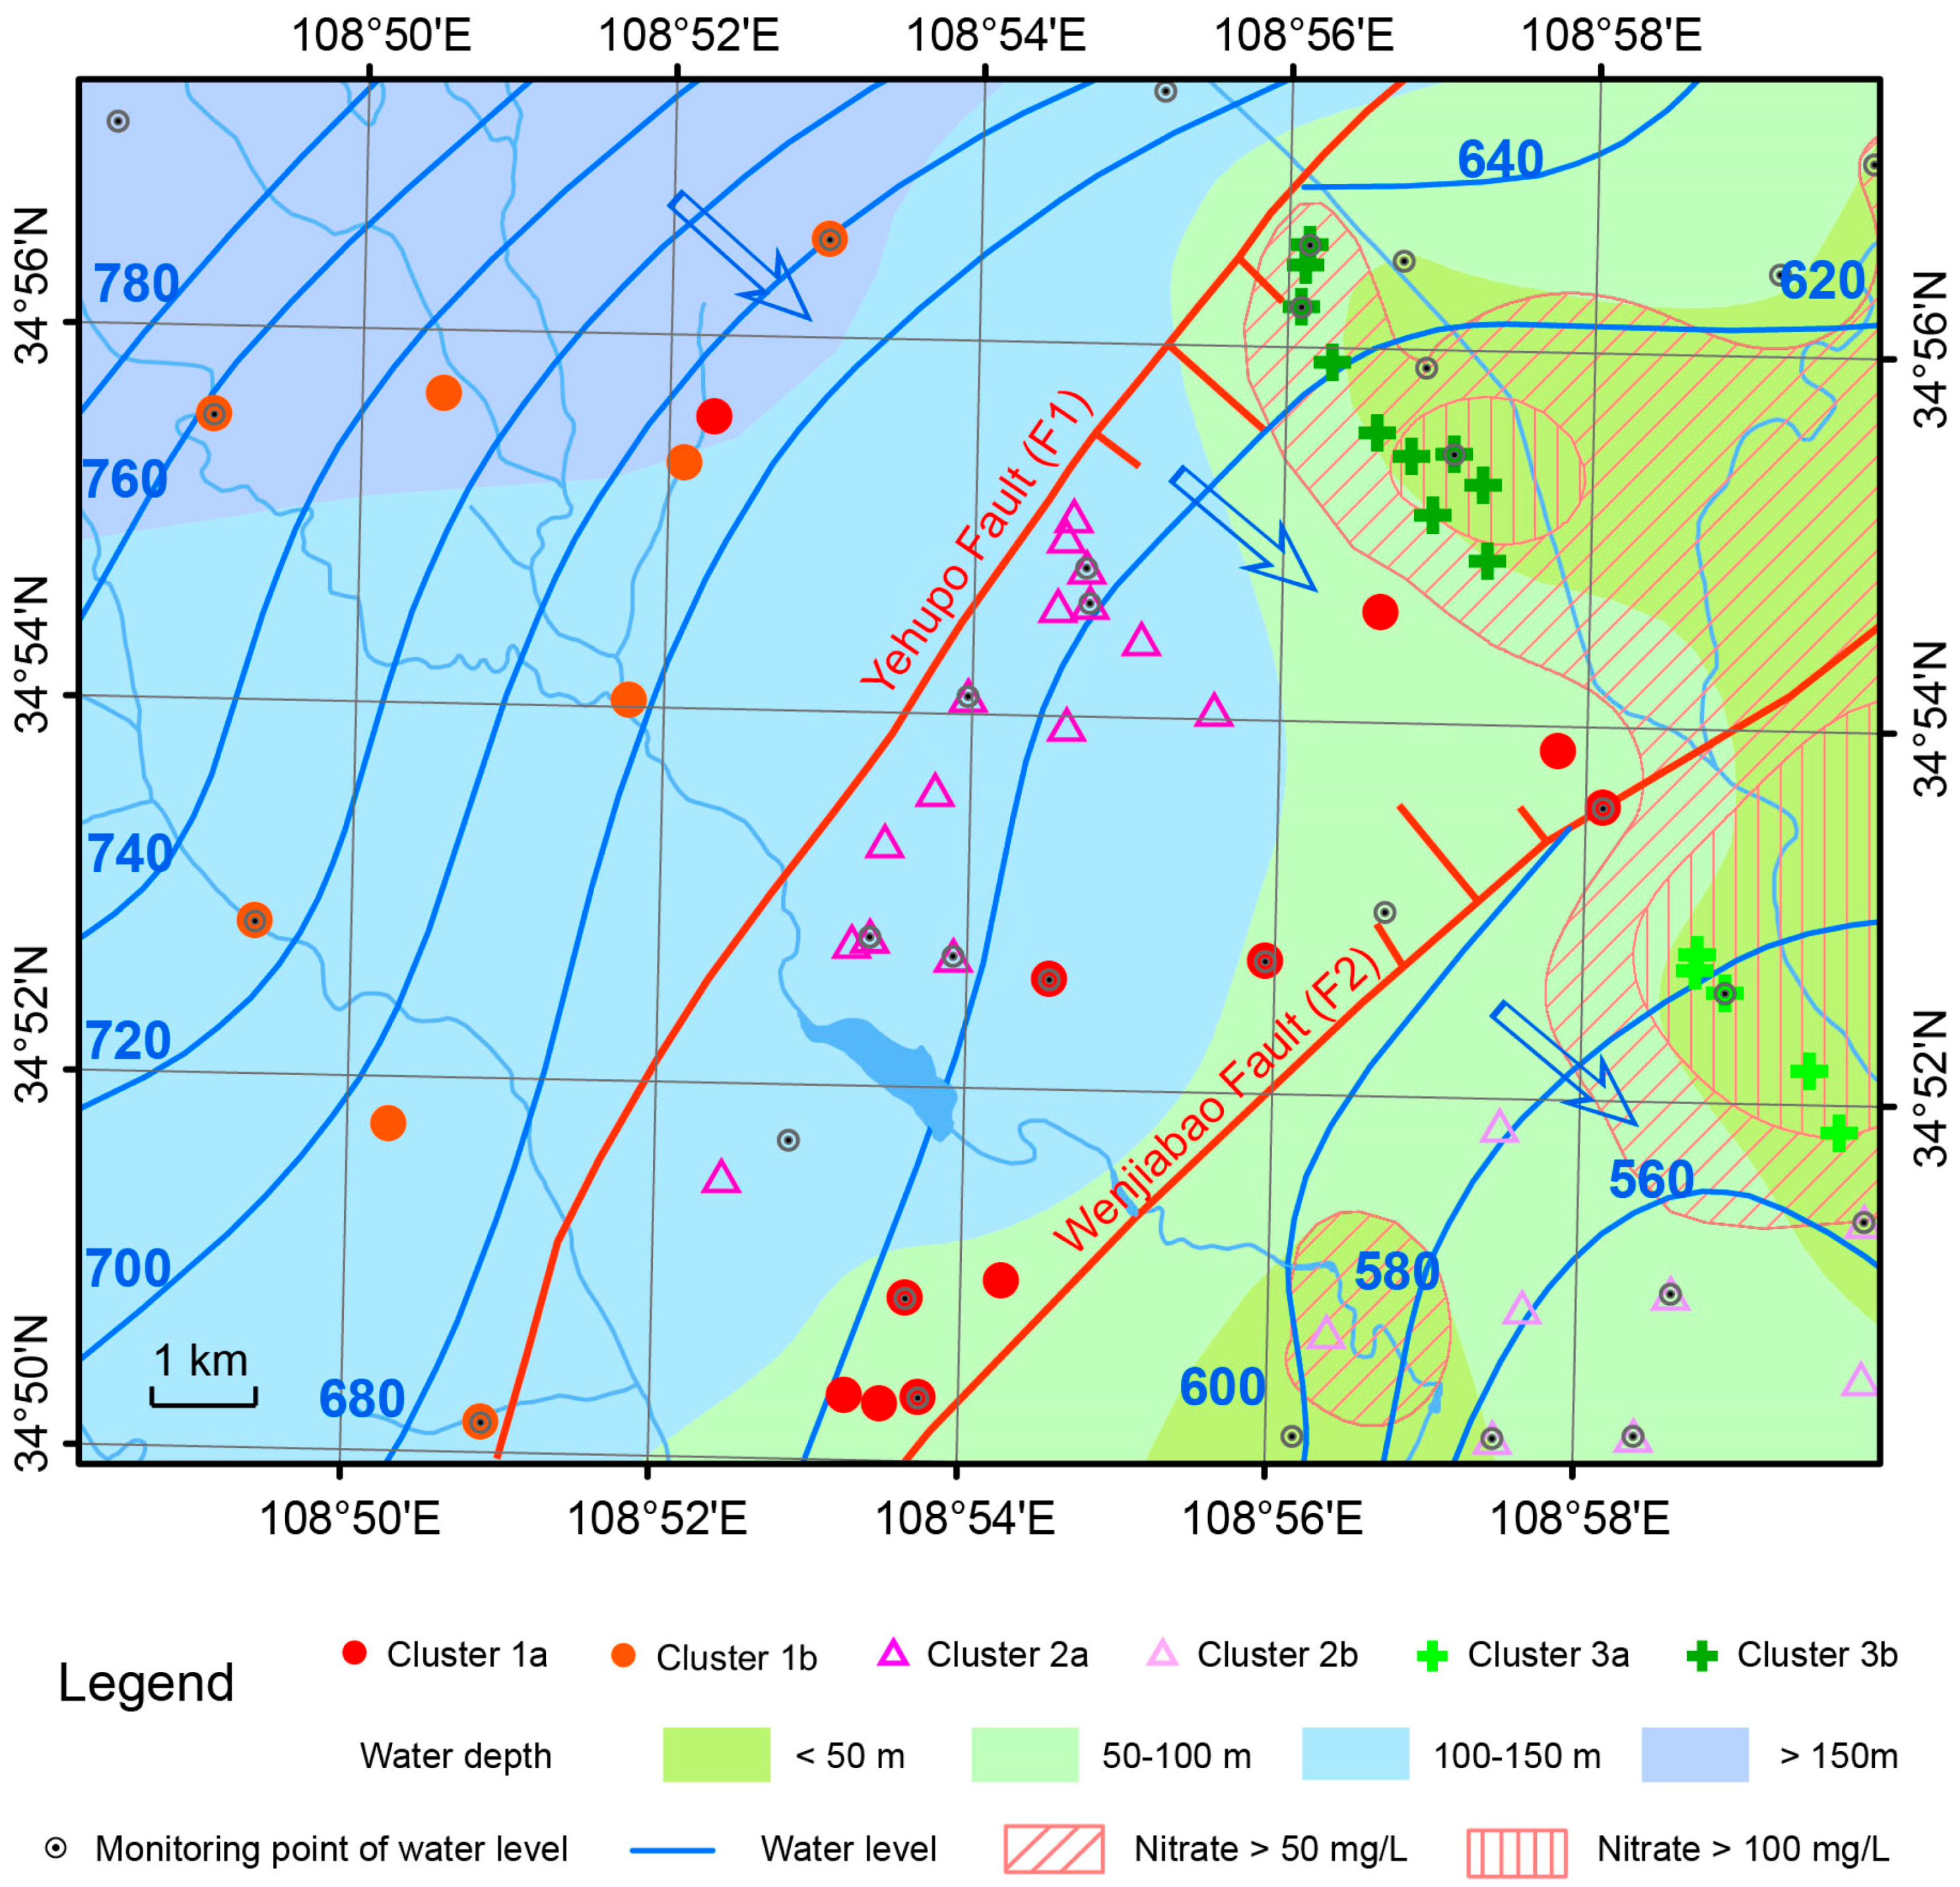
Figure 4.
Dendrogram for the Hierarchical Cluster Analysis showing the three identified clusters and sub-clusters.
Figure 4.
Dendrogram for the Hierarchical Cluster Analysis showing the three identified clusters and sub-clusters.

Figure 5.
Scatter plots for (a) the main cations and (b) the main anions versus TDS.

Figure 6.
Plots showing (a) Na+ versus Cl−, (b) Na+ versus TZ+, (c) (Ca2+ + Mg2+) and (HCO3− + SO42− ), (d) Ca2+ versus Mg2+, (e) (Ca2+ + Mg2+) − (HCO3− + SO42−) and (Na+ + K+) − Cl−, and (f) CAI 1 versus CAI 2.
Figure 6.
Plots showing (a) Na+ versus Cl−, (b) Na+ versus TZ+, (c) (Ca2+ + Mg2+) and (HCO3− + SO42− ), (d) Ca2+ versus Mg2+, (e) (Ca2+ + Mg2+) − (HCO3− + SO42−) and (Na+ + K+) − Cl−, and (f) CAI 1 versus CAI 2.

Figure 7.
Saturation indices for calcite, dolomite, and gypsum.

Figure 8.
Scatter plot for (a) d-excess of cluster 1a and 2a and (b) TDS of cluster 1a, 1b, and 2a.


Table 1.
Statistical summary of hydrochemical components in the study area.
| Index | Mean | Min | Max | Acceptable Limits (WHO 2004) |
|---|---|---|---|---|
| pH | 7.5 | 6.9 | 7.9 | 6.5–9.2 |
| Total Dissolved Solids (mg/L) | 528.1 | 303.9 | 1033.2 | 1000 |
| Na+ + K+ (mg/L) | 92.1 | 28.7 | 227.7 | 200 |
| Ca2+ (mg/L) | 56.8 | 14.7 | 194.0 | 200 |
| Mg2+ (mg/L) | 31.0 | 10.7 | 66.0 | 150 |
| Cl− (mg/L) | 24.1 | 5.4 | 166.5 | 250 |
| SO42− (mg/L) | 68.9 | 7.1 | 293.6 | 250 |
| HCO3− (mg/L) | 406.1 | 268.5 | 585.8 | 240 |
| F− (mg/L) | 0.5 | 0.1 | 1.5 | 1.5 |
| NO3− (mg/L) | 37.1 | 0.5 | 173.3 | 50 |
| PO43− (mg/L) | 0 | 0 | 0.2 | - |
© 2018 by the authors. Licensee MDPI, Basel, Switzerland. This article is an open access article distributed under the terms and conditions of the Creative Commons Attribution (CC BY) license (http://creativecommons.org/licenses/by/4.0/).
Share and Cite
MDPI and ACS Style
Li, X.; Wu, H.; Qian, H.; Gao, Y. Groundwater Chemistry Regulated by Hydrochemical Processes and Geological Structures: A Case Study in Tongchuan, China. Water 2018, 10, 338. https://doi.org/10.3390/w10030338
AMA Style
Li X, Wu H, Qian H, Gao Y. Groundwater Chemistry Regulated by Hydrochemical Processes and Geological Structures: A Case Study in Tongchuan, China. Water. 2018; 10(3):338. https://doi.org/10.3390/w10030338
Chicago/Turabian StyleLi, Xinyan, Hao Wu, Hui Qian, and Yanyan Gao. 2018. "Groundwater Chemistry Regulated by Hydrochemical Processes and Geological Structures: A Case Study in Tongchuan, China" Water 10, no. 3: 338. https://doi.org/10.3390/w10030338
Note that from the first issue of 2016, this journal uses article numbers instead of page numbers. See further details here.