Water Level Measurements from Drones: A Pilot Case Study at a Dam Site


Department of Civil and Environmental Engineering, University of Perugia, 06125 Perugia, Italy
*
Author to whom correspondence should be addressed.
Water 2018, 10(3), 297; https://doi.org/10.3390/w10030297
Submission received: 10 January 2018
/
Revised: 21 February 2018
/
Accepted: 6 March 2018
/
Published: 9 March 2018
(This article belongs to the Special Issue Applications of Remote Sensing and GIS in Hydrology)
Abstract
:Unmanned Aerial Vehicles (UAVs) are now filling in the gaps between spaceborne and ground-based observations and enhancing the spatial resolution and temporal coverage of data acquisition. In the realm of hydrological observations, UAVs play a key role in quantitatively characterizing the surface flow, allowing for remotely accessing the water body of interest. In this paper, we propose a technology that uses a sensing platform encompassing a drone and a camera to determine the water level. The images acquired by means of the sensing platform are then analyzed using the Canny method to detect the edges of water level and of Ground Control Points (GCPs) used as reference points. The water level is then retrieved from images and compared to a benchmark value obtained by a traditional device. The method is tested at four locations in an artificial lake in central Italy. Results are encouraging, as the overall mean error between estimated and true water level values is around 0.05 m. This technology is well suited to improve hydraulic modeling and thus provides reliable support to flood mitigation strategies.
1. Introduction
In recent years, the awareness of the importance of spatial and temporal variation of open water level has increased [1]. The knowledge of water level provides information about the variability of water bodies and thus has a key role in the monitoring and management of water resources. For instance, validation and calibration of hydraulic models [2,3] and of flood forecasting models (e.g., [4]) rely on accurate water level estimates in rivers. Water level measurements are at the basis of flood risk mitigation strategies, as the understanding of the flood inundation extent allows for the construction of a resilient environment [5,6]. Water levels are usually monitored by means of gauging stations. However, water level sensors are characterized by some drawbacks, such as, for instance, their pointwise measurements. Moreover, their accuracy can be affected by several issues, such as severe storm events and systematic errors associated with the sensors themselves [7]. Recently, substantial efforts have been directed towards the development of non-invasive technologies to monitor water level. For instance, Hut et al. [8] proved that the Wiimote device belonging with the Nintendo® Wii™ game system could be used to estimate water level values. Remote sensor-based methods such as the ENVISAT and ERS-2 satellite missions allowed the estimation of the water level of inland lakes with high precision (e.g., [9,10]). Nevertheless, spaceborne sensors are affected by limitations that restrict their ability to measure the temporal and spatial variation of the water level, such as fixed orbit configurations and coarse temporal resolution. An overview of the wide variety of existing sensors can be found in Fraden [11]. Recently, there has been increasing interest in the development of image-based technologies for determining water level values (e.g., [12]). Griesbaum et al. [13] developed a low-cost method for estimating flood elevation and inundation depth based on user-generated flood images. As a drawback, image-based systems can be affected by lighting changes, camera movement and condensation on the lens [14,15]. The spreading use of unmanned aerial vehicles (UAVs) has paved the way for the integration of drone technology and optical sensing aimed at quantitatively estimating hydraulic data such as inundated areas (e.g., [16]), surface flow measurements (e.g., [17]), and water level estimations (e.g., [12]). Drones make possible the non-invasive monitoring of water bodies and are an efficient tool in difficult-to-access environments. For instance, this is the case of mountainous rivers, where flash floods suddenly occur, dragging debris. River debris and high velocities may endanger both operators and instruments, making it impossible to monitor flash floods. In Argentina, the issue has been overcome using videos and photos shared by citizens [18]. In this paper we propose a sensing platform that couples a drone and a camera to estimate the water level of an artificial lake. Water level monitoring has a key role in lakes management, as lakes are used as reservoirs for drinking water and for hydroelectric power generation, among other purposes. A drop in a lake’s level can cause severe damage to the ecosystem and to the local economy. The cause of lake decline can be due to changing climatic forces and to poor management of the water resources [19,20,21,22]. Among the causes of dam break, we can list extreme rainfall events, which sharply increase the water level in the reservoir (e.g., [23,24]); thus, proper management of the water level in dam reservoirs is of the utmost importance.
It is worth noting that, despite the fact that the method presented in this paper has been tested at a dam lake, it could be applied to any water body, including rivers, flood inundation areas, glaciers, coasts and river estuaries. This image-based technology is well-suited to the framework of the Prediction in Ungauged Basins decade [25], as this method can be used to retrieve hydraulic data at ungauged sites [26]. The drone helps to overcome the problems associated with the use of traditional static sensors, which require costly maintenance and personnel, and thus can only be deployed in limited numbers [27]. Water level measurements can then be used to improve hydraulic modeling of rivers to support flood risk mitigation plans. Only few studies have aimed at estimating water depth from flood data acquired during the flood event itself (e.g., [28,29]), while flood-level is often retrieved using remote-sensing data in the aftermath of the event for post-event flood simulations (e.g., [30,31]).
As a complement to traditional documentation systems, the collection of hydraulic information by means of volunteers is now becoming popular [32]. Recent studies have shown the potential of approaches to estimating the flood extent and level from post-event flood images shot by volunteers (e.g., [33,34]). However, crowdsourced data is characterized by gaps in time and space due to the uneven distribution of engaged citizens [35]. Furthermore, there still remains a lack of approaches for accessing information on both the flood level and the flood extent from images shot during the event itself. In this framework, a drone-based approach makes possible to access flood level information during the flood event and provides a unique support to flood mitigation actions and to citizen observatory activities.
This paper proposes a sensing platform allowing for remote sensing the water level. The platform also enables the collection of hydraulic information in hostile situations, such as during the occurrence of a flood event or during adverse atmospheric conditions. This approach is expected to provide substantial support to the monitoring and management of water bodies. The case study where the method has been tested (i.e., a dam site) represents a pilot case study. It was chosen as it is a controlled environment where the actual water level is known with high accuracy. However, the application of the methodology presented in this paper is not limited to dam sites, conversely, the use of the drone makes the approach flexible and thus suitable to diverse environments.
The paper is organized as follows. First, the case study site is introduced and the aerial sensing platform is described. Since the image-based technique presented here requires the acquisition of ground control points (GCPs), the topographic survey is detailed together with the GCPs deployment. Then, the procedure for determining water level values from images is presented and then assessed, comparing the estimated water level values with the benchmark values. The results are discussed, together with the sources of uncertainty.
2. Materials and Methods
In this section, we detail the aerial sensing platform used in the experiments and the case study area where the survey was performed. Then, we provide details on the procedure for the airborne water level measurements.
2.1. Case Study Site and Experimental Set-Up Description
The aerial sensing platform is a HIGHONE 4HSEPRO quadrotor mounting a gimbal system and a SONY Alpha 7R, 36.4 Mpix full-frame camera oriented with its axis along the perpendicular. The gimbal compensates drone vibrations due to flight operations and wind. The lens is a 35 mm f/9; the camera focus, after being tested on a portion of the structure, was set to infinity during the survey. The test case study is the Ridracoli lake, an artificial lake generated by the homonymous dam in the Emilia Romagna Region, central Italy, Figure 1. The Ridracoli dam is characterized by a double-curvature arch-gravity structure with a maximum height of 103.5 m and a crest length of 432 m at 561 m a.s.l. The lake extends for about 5 km in two branches. The catchment area is 88.49 km2 and the maximum water volume in the retention basin equals 33.06 Mm3. The reservoir is the main drinking water supply of Emilia Romagna Region, providing from about 7.5 Mm3/month of discharge in winter up to about 12 Mm3/month in summer to a million residents, tourists and food industries [36]. The reservoir has a crucial role in reducing the pumping from underground sources and in providing water supply to the coast, which is affected by subsidence and saline ingression into aquifers.
2.2. Ground Control Point Acquisition
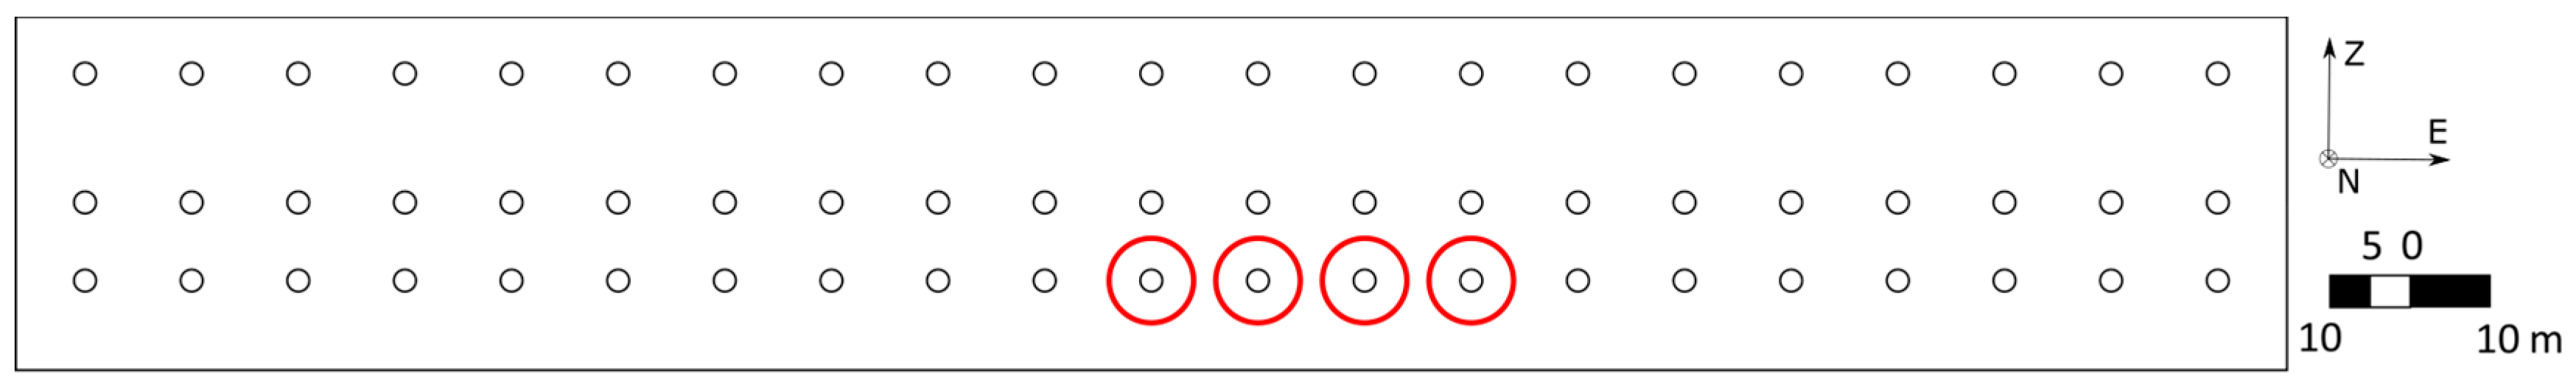
The technique presented in this paper to measure water level values encompasses the need for ground control points (GCPs). GCPs drive the procedures of orthorectification and calibration of the images and are used as reference points to retrieve the water level values. The GCPs have a squared shape with a width of 0.40 m. In two different months (i.e., August and October 2015), sixty regularly spaced GCPs were deployed in three rows on the upstream face of the dam. In this study, we used four GCPs deployed on the lower row during October 2015 using a boat, Figure 2. The hydrostatic level of the time equaled 533.65 m a.s.l.
The identification of GCPs is one of the major sources of uncertainty after seeding density [37]. Therefore, the acquisition of GCP coordinates plays a crucial role in the experimental set-up. The coordinates of the GCPs were acquired through a traditional technique by means of a Leica-Geosystems Total Station TS30. To this end, a pre-existing geodetic network consisting of four vertices materialized by little pillars was used. The coordinates of each GCP were estimated along the three directions. The standard deviation of each point was lower than 1 cm along each of the three directions. The mean value of all standard deviations was equal to 1.0 cm, 1.0 cm and 0.8 cm along each of the three directions, respectively. For a detailed description of the traditional topographic survey, the reader can refer to Buffi et al. [38,39]. The deployment of GCPs could represent one major pitfall of this technique, especially in areas with limited access. However, it is possible to retrieve the water level from pictures with reference either to a staff gauge or to a neighboring object, as discussed by Mazzoleni et al. [40]. Other authors have georeferenced videos and pictures shot by citizens using Ground Control Points acquired in the aftermath of the flood event (e.g., [41,42]). On the other hand, Griesbaum et al. [13] used as reference points ground control points derived from a highly accurate Terrestrial Laser Scanning point cloud. The acquired GCPs were then used as a benchmark to retrieve the water level from pictures shot during a flood event in an urban area. A methodology for addressing the need for ground control points is presented by Tauro et al. [17].
2.3. Image Processing Description
The images were shot at a distance of about 15 m from the dam; the Ground Sample Distance (GSD) equals 2.1 mm. The images were shot every 1.87 s, and the images overlap by more than 70%. Each image size is 7360 × 4912 pixels, with a resolution of 350 dpi. Every image is characterized by a minimum of four GCPs to allow for the orthorectification procedure [43].
After image acquisition, orthorectification was performed to eliminate distortions introduced by the angled camera and to calibrate image dimensions. The orthorectification procedure encompasses the following steps. First, control points such as GCPs are identified in the images. Control points associate an image point with a 3D world position (i.e., longitude, latitude and height acquired by the total station). Then, using bundle adjustment, the position and orientation of each image is estimated. Orthorectification is performed using the estimated positions and orientations. Digital images are processed and orthorectified by means of the Hugin software [44] to obtain a high resolution RGB ortho-mosaic. Hugin is an open, easy-to-use cross-platform panoramic imaging toolchain based on a free suite of programs and libraries (i.e., Panorama Tools; [45,46]). After orthorectification, the images are blended and projected onto a surface to provide the final mosaic [47]. Rectilinear projection is used to reconstruct the position of the camera and the geometry, assuming that the upstream face of the dam is mostly flat, so that all control points lie on a planar surface [48].
2.4. Water Level Experimental Procedure
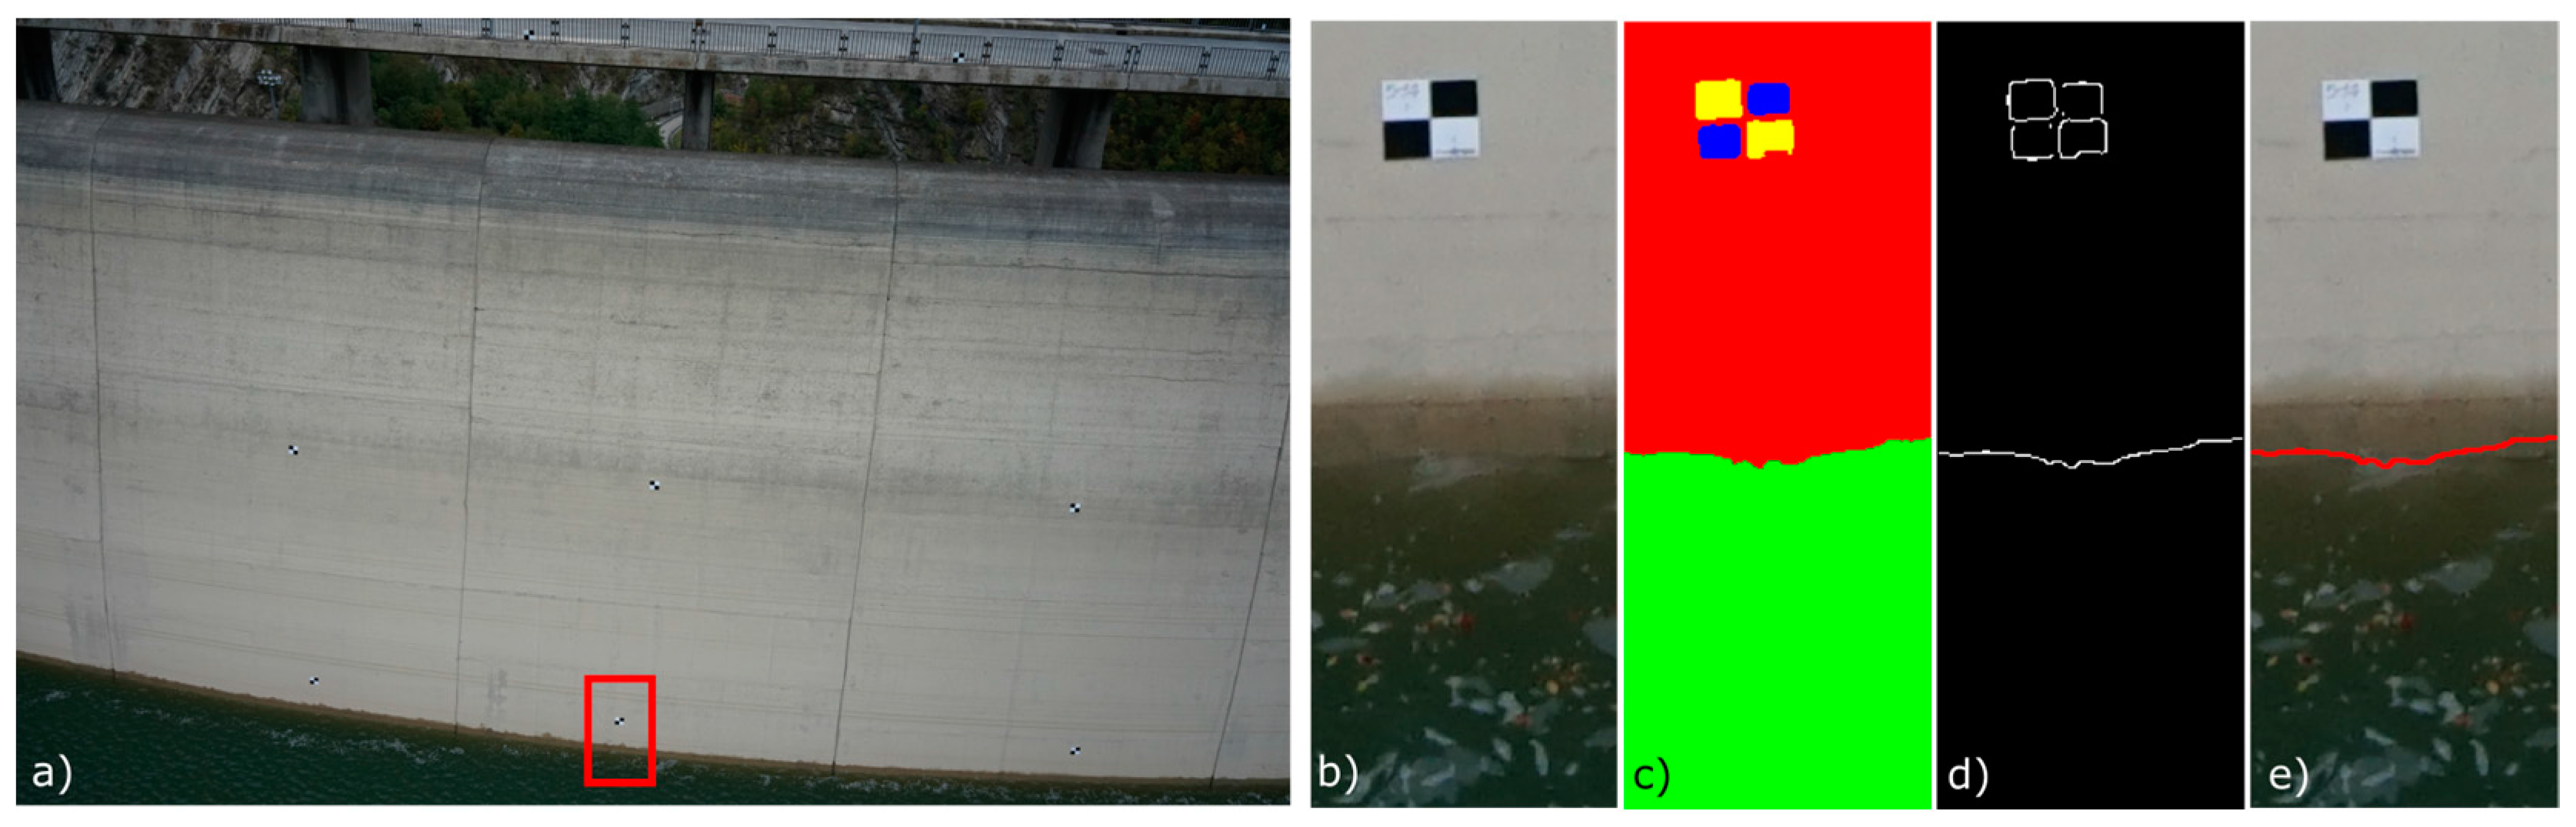
The drone is flown above the water in the reservoir of the dam. The water level was estimated at four different locations to test the goodness of the procedure, see Figure 2. The frames used to estimate the water level values are the images shot at the upstream face, where eight free spillway gates open to allow for the overflow of the dam, Figure 3a. It is interesting to note that there is a light grey shade on the dam surface due to the preexisting water level into the reservoir, Figure 3b. Therefore, it is necessary to pay attention to the identification of the water level to be accurate. The water line can be described as the demarcation line between the water and everything else that is above water. The procedure to determine the water level value encompasses the following steps. First, to define the water demarcation line, the image pixels are categorized in four different classes (i.e., water, concrete face, white and black parts of the marker), Figure 3c. To distinguish pixels, a feature selection approach is used as also described in Marx et al. [49]. The free and open-source project Interactive Learning and Segmentation Tool Kit (Ilastik v.1.1.3; [50]) is used for pixel-wise classification. The image features are computed from the characteristics of the neighborhood of each pixel, including edge indicators as well as color and texture. The feature selection procedure aims at finding and disregarding anomalous edges, such as lines due to change in concrete color, ashlars, etc. Once the pixels have been classified, the edge detection operation is performed by means of the Canny method [51], Figure 3d. The Canny method finds edges by looking for local maxima of the gradient of the gray scale. The edge function calculates the gradient using the derivative of a Gaussian filter. This method uses two thresholds to detect strong and weak edges. By using two thresholds, the Canny method filters out the noise more than the other methods, and it can easily detect true weak edges. The minimum and maximum threshold values are equal to 0.019 and 0.047, respectively. GCP and water level edges are thus identified, Figure 3e. Then, the water level line in pixel coordinates is calibrated to real-world coordinates using, as a benchmark, the center of each one of the four GCPs. The water level retrieved from the images shot by the sensing platform is then compared with the benchmark value. The benchmark is obtained from a spring balance, which measures the weight of the water column and returns the corresponding water level of the lake. The wind speed at the time of the airborne flight generated a mild surface waviness, allowing us to also test the procedure in adverse meteorological conditions.
3. Results and Discussion
The measurement procedure leads to determining the distance between each GCP and the edge of the water level. Several distance measurements are performed to take into account the uncertainty affecting the water level edge detection. Indeed, the water level line cannot be sharply identified because of different sources of uncertainty. The combination of the waves and of both angle and intensity of the incoming light source (e.g., sun, clouds) creates the sharp change in pixel gray scale in an image. Gilmore [52] investigated different sources of uncertainty affecting water level estimates from images. In addition to the uncertainties associated to the local environment as the change in lighting, other sources of uncertainty are associated with the image quality, such as image focus, image resolution, perspective, and lens distortion. The images were processed as explained in Section 2.3 to eliminate distortion or perspective. Despite the high resolution of the images, there are limitations due to pixelization. Notably, the uncertainty in the water level estimates decreases as the resolution of the image increases. We used images with very high resolution; however, the effect of pixelization cannot be cut off completely.
The water level estimated at four GCPs on the upstream face of the dam by means of the aerial platform are compared with the water level reference value. The errors between the estimated water level values and the benchmark one are computed. To provide a quantitative indication of the procedure skill at estimating the water level value, we determined the mean absolute error (MAE) between observed and estimated values, the root mean squared error (RMSE) and the BIAS in percentage. The MAE provides an estimate of the overall agreement between observed and estimated water level values. It is defined as:
where Wobs and West are water level values observed and estimated at a specific GCP, while N is the number of measurements performed using each GCP as fiducial and equals 40.
The RMSE is a non-negative metric without an upper bound. A perfect estimation of the water level value would result in the RMSE equaling zero. It is defined as:
RMSE is estimated in squared differences, and thus it is biased in favor of high magnitude error, while it is insensitive to low magnitude ones. It is thus more sensitive to occasional large errors.
The BIAS represents the mean difference between observed and simulated values; in this paper, it is presented as a percentage:
Estimated water level values were in line with the benchmark value, Table 1.
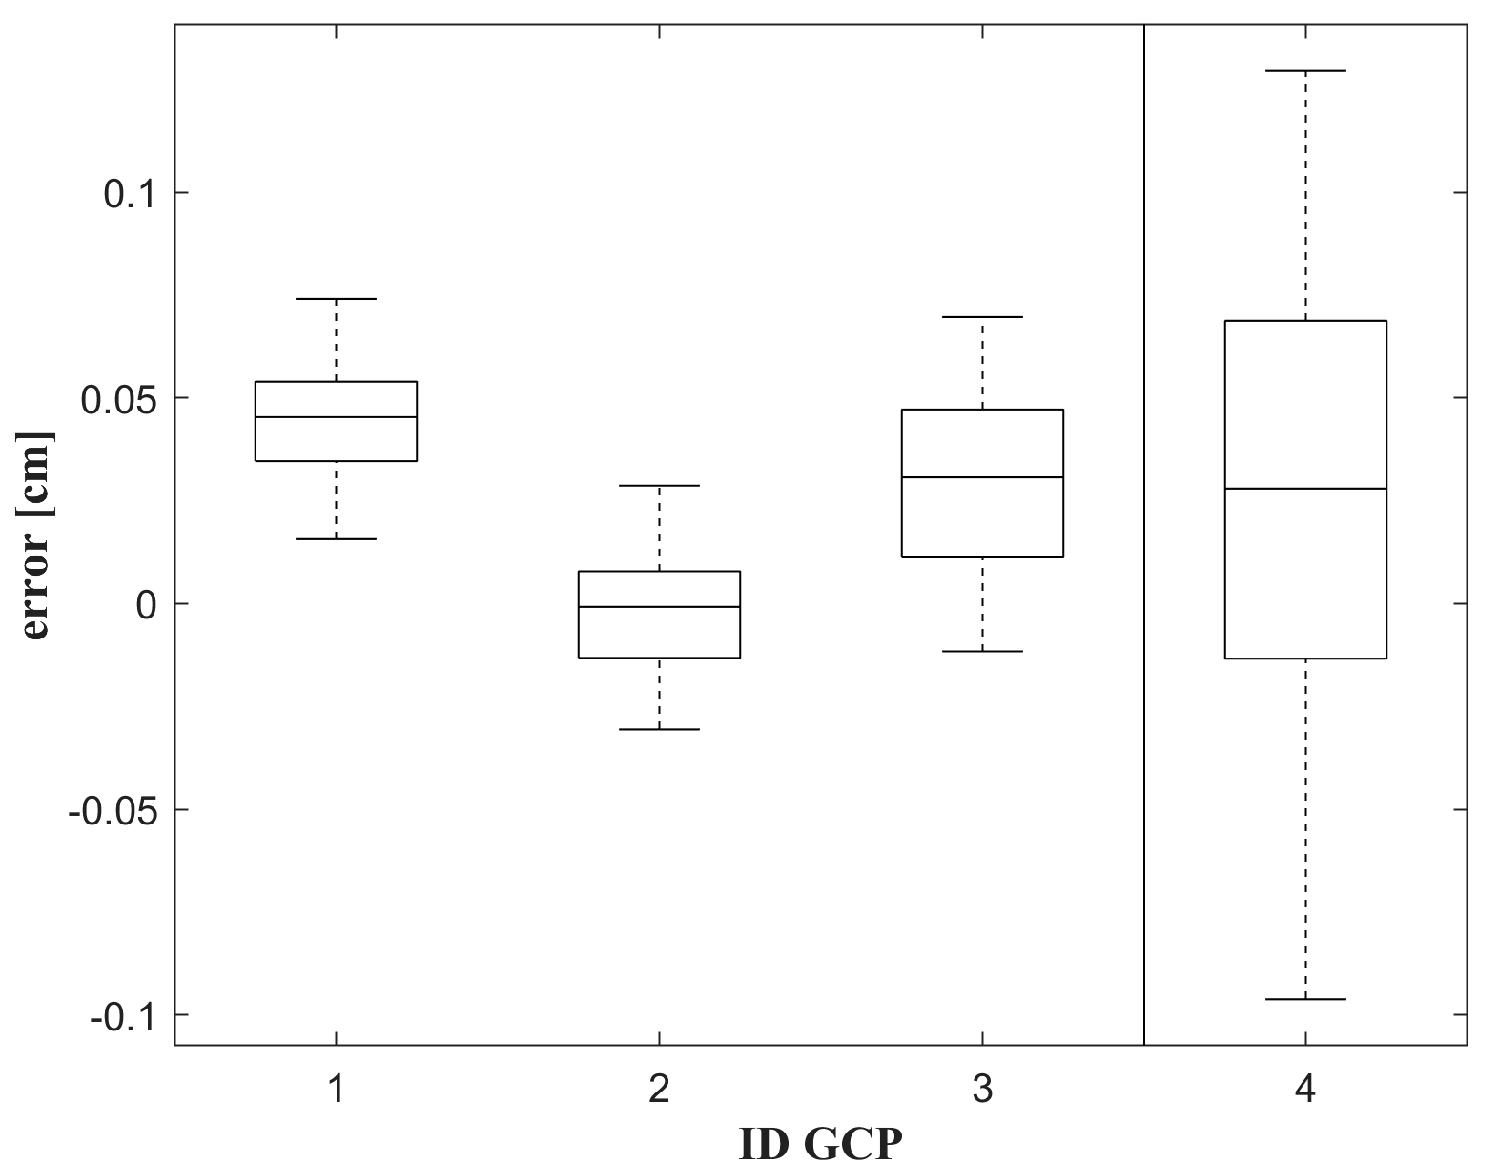
The MAE evaluates all deviations from the observed value in an equal manner, regardless of the sign. As expected, the RMSE is similar to the MAE in magnitude. The amount by which the RMSE is larger than the MAE is an indicator of the magnitude to which outliers exist in the data set [53]. The BIAS provides an indication of the extent of errors in percentage. The three estimation metrics allow us to draw encouraging conclusions on the reliability of the proposed methods. To better visualize the distribution of errors, the boxplot of errors between estimated and observed water level values at each GCP is presented in Figure 4. The central mark indicates the median, and the bottom and top edges of the box indicate the 25th and 75th percentiles, respectively. The whiskers extend to the most extreme data values that are not considered outliers. The median error ranges between −0.01 m (i.e., at GCP 2) and 0.045 m (i.e., at GCP 1), while the mean deviation from the median is of ±0.02 m for the first three GCPs. The fourth GCP is characterized by a higher deviation of around ±0.06 m. The rationale behind this result is the fact that at GCP 4, the perspective affects the measurements. This test was performed to understand the effect of the perspective on the water level measurements from the images.
The overall agreement of the estimated water level values is good, as the maximum error at each GCP is much lower than the sensibility of hydraulic models such as HEC-RAS (i.e., 0.20 m; [2]). This result paves the way for the use of water level estimates for calibration and validation of hydraulic models.
In agreement with the analysis performed by Gilmore et al. [52], the major sources of uncertainty are found to be the perspective and the pixelization, while the scale of the experiment allowed us to get rid of the effect of meniscuses formed by water at the contact with the background. It is worth underlining the fact that the water surface waviness can substantially affect the water level estimates, as waves ripple the water, causing a blurry water level edge. Nevertheless, results are encouraging, since the image-based method compared favorably to the traditional technique. This case study represents a pilot case. It was chosen because it is a controlled environment where we could accurately evaluate the reliability of the method. However, this approach is not limited to artificial lakes generated by the construction of a dam, but can be applied to any other water body. It is worth highlighting that we aim to apply the proposed procedure to flooded areas and to rivers to enhance flood inundation models. Indeed, results confirm that the method presented here also has the potential to be used in other scenarios, providing reliable water level estimates.
4. Conclusions
In this work, we propose a novel water level measurement concept based on the combination of an unmanned aerial vehicle and optical methods. The analysis of the images shot during the experiment demonstrates that the drone is compatible with the hydraulic measurements. A gimbal system compensates drone vibrations, ensuring the stability of the drone, and thus the quality of the images. It is worth noting that despite wind-generated waves, the water level estimates were accurate, confirming the robustness of the procedure. The main sources of uncertainty were found to be the pixelization of the images and the perspective; nevertheless, the results are encouraging and show the potential of image-based measurements. The image analysis procedure is rapid and inexpensive, as it is performed through two pieces of open-source software (i.e., Ilastik and Hugin), allowing for an accurate estimation of the water level.
The sensing platform paves the way for unsupervised rapid observations in large-scale hydrological systems. This apparatus can support flood inundation mapping, as it allows for an efficient event survey. The knowledge of the flood inundation extent and the water level values in a flooded area is crucial to support flood risk mitigation strategies. Moreover, the use of drones can be of great interest in ungauged sites, where water level values and then discharges are retrieved by means of regionalization procedures that allow for information to be transferred from a hydrologically similar river basin. Image-based procedures relying on the use of a camera are now spreading, nevertheless it is not an easy task to retrieve hydraulic information in uneasy-to-access areas. The use of a drone allows this issue to be overcome, providing accurate information. Moreover, unmanned aerial vehicles can improve crowdsourced data collection, supporting citizen observatories, lowering data uncertainty, and filling in the gap due to the irregular distribution of engaged volunteers.
Acknowledgments
The authors would like to express their sincere gratitude to Giulia Buffi who participated in the ground control point deployment, to Marco Barberini who supported the acquisition of the drone images, and Silvia Grassi, who directed the acquisition of the topographic data. Romagna Acque Società delle Fonti S.p.A. and its CEO Andrea Gambi are gratefully acknowledged for the access to the Ridracoli dam. This work was supported by the Italian Ministry of Education, University and Research under PRIN grant No. 20154EHYW9 “Combined numerical and experimental methodology for fluid structure interaction in free surface flows under impulsive loading”.
Author Contributions
Both authors equally contributed to every step, from conceiving this work to analyzing results. Elena Ridolfi wrote the paper.
Conflicts of Interest
The authors declare no conflict of interest.
References
- Alsdorf, D.E.; Rodriguez, E.; Lettenmaier, D.P. Measuring surface water from space. Rev. Geophys. 2007, 45, 1–24. [Google Scholar] [CrossRef]
- Ridolfi, E.; Alfonso, L.; Di Baldassarre, G.; Dottori, F.; Russo, F.; Napolitano, F. An entropy approach for the optimization of cross-section spacing for river modelling. Hydrol. Sci. J. 2013, 59, 126–137. [Google Scholar] [CrossRef]
- Langhammer, J.; Bernsteinová, J.; Miřijovský, J. Building a High-Precision 2D Hydrodynamic Flood Model Using UAV Photogrammetry and Sensor Network Monitoring. Water 2017, 9, 861. [Google Scholar] [CrossRef]
- Montesarchio, V.; Napolitano, F.; Rianna, M.; Ridolfi, E.; Russo, F.; Sebastianelli, S. Comparison of methodologies for flood rainfall thresholds estimation. Nat. Hazards 2014, 75, 909–934. [Google Scholar] [CrossRef]
- Di Baldassarre, G.; Schumann, G.; Bates, P.D.; Freer, J.E.; Beven, K.J. Flood-plain mapping: A critical discussion of deterministic and probabilistic approaches. Hydrol. Sci. J. 2010, 55, 364–376. [Google Scholar] [CrossRef]
- Ridolfi, E.; Yan, K.; Alfonso, L.; Di Baldassarre, G.; Napolitano, F.; Russo, F.; Bates, P.D. An entropy method for floodplain monitoring network design. In AIP Conference Proceedings; AIP Publishing: Melville, NY, USA, 2012; Volume 1479. [Google Scholar]
- Tauro, F.; Porfiri, M.; Grimaldi, S. Surface flow measurements from drones. J. Hydrol. 2016, 540, 240–245. [Google Scholar] [CrossRef]
- Hut, R.W.; Weijs, S.V.; Luxemburg, W.M.J. Using the Wiimote as a sensor in water research. Water Resour. Res. 2010, 46, 1–5. [Google Scholar] [CrossRef]
- Medina, C.E.; Gomez-Enri, J.; Alonso, J.J.; Villares, P. Water level fluctuations derived from ENVISAT Radar Altimeter (RA-2) and in-situ measurements in a subtropical waterbody: Lake Izabal (Guatemala). Remote Sens. Environ. 2008, 112, 3604–3617. [Google Scholar] [CrossRef]
- Munyaneza, O.; Wali, U.G.; Uhlenbrook, S.; Maskey, S.; Mlotha, M.J. Water level monitoring using radar remote sensing data: Application to Lake Kivu, central Africa. Phys. Chem. Earth Parts A/B/C 2009, 34, 722–728. [Google Scholar] [CrossRef]
- Fraden, J. Handbook of Modern Sensors: Physics, Designs, and Applications, 3rd ed.; Springer: New York, NY, USA, 2004. [Google Scholar]
- Bandini, F.; Jakobsen, J.; Olesen, D.; Reyna-Gutierrez, J.A.; Bauer-Gottwein, P. Measuring water level in rivers and lakes from lightweight Unmanned Aerial Vehicles. J. Hydrol. 2017, 548, 237–250. [Google Scholar] [CrossRef]
- Griesbaum, L.; Marx, S.; Höfle, B. Direct local building inundation depth determination in 3-D point clouds generated from user-generated flood images. Nat. Hazards Earth Syst. Sci. 2017, 17, 1191–1201. [Google Scholar] [CrossRef]
- Iwahashi, M.; Udomsiri, S.; Imai, Y.; Muramatsu, S. Water Level Detection for Functionally Layered Video Coding. In Proceedings of the 2007 IEEE International Conference on Image Processing, San Antonio, TX, USA, 16 September–19 October 2007; pp. II-321–II-324. [Google Scholar]
- Yu, J.; Hahn, H. Remote Detection and Monitoring of a Water Level Using Narrow Band Channel. J. Inf. Sci. Eng. 2010, 26, 71–82. [Google Scholar]
- Feng, Q.; Liu, J.; Gong, J. Urban Flood Mapping Based on Unmanned Aerial Vehicle Remote Sensing and Random Forest Classifier—A Case of Yuyao, China. Water 2015, 7, 1437–1455. [Google Scholar] [CrossRef]
- Tauro, F.; Porfiri, M.; Grimaldi, S. Orienting the camera and firing lasers to enhance large scale particle image velocimetry for streamflow monitoring. Water Resour. Res. 2014, 50, 7470–7483. [Google Scholar] [CrossRef]
- Patalano, A.; García, C.M.; Guillén, N.; García, C.; Díaz, E.; Rodriguez, A.; Ravelo, A. Evaluación experimental de la técnica de velocimetría por seguimiento de partículas a gran escala para la determinación de caudales en ríos serranos [Experimental evaluation of large scale particle tracking velocimetry technique for flow discharge measurements in mountains rivers, in Spanish]. Aqua-LAC 2014, 6, 17–24. [Google Scholar]
- Awange, J.L.; Sharifi, M.A.; Ogonda, G.; Wickert, J.; Grafarend, E.W.; Omulo, M.A. The Falling Lake Victoria Water Level: GRACE, TRIMM and CHAMP Satellite Analysis of the Lake Basin. Water Resour. Manag. 2008, 22, 775–796. [Google Scholar] [CrossRef]
- Swenson, S.; Wahr, J. Monitoring the water balance of Lake Victoria, East Africa, from space. J. Hydrol. 2009, 370, 163–176. [Google Scholar] [CrossRef]
- Manciola, P.; Di Francesco, S.; Biscarini, C.; Montesarchio, V. On the role of hydrological processes on the water balance of Lake Bolsena, Italy. Lakes Reserv. Res. Manag. 2016, 21, 45–55. [Google Scholar]
- Pierleoni, A.; Bellezza, M.; Casadei, S.; Manciola, P. Multipurpose water use in a system of reservoirs. In IAHS-AISH Publication; IAHS Press: Wallingford, UK, 2007; pp. 107–116. [Google Scholar]
- Biscarini, C.; Francesco, S.D.; Ridolfi, E.; Manciola, P. On the simulation of floods in a narrow bending valley: The malpasset dam break case study. Water 2016, 8, 545. [Google Scholar] [CrossRef]
- Rico, M.; Benito, G.; Salgueiro, A.R.; Díez-Herrero, A.; Pereira, H.G. Reported tailings dam failures: A review of the European incidents in the worldwide context. J. Hazard. Mater. 2008, 152, 846–852. [Google Scholar] [CrossRef] [PubMed]
- Sivapalan, M.; Takeuchi, K.; Franks, S.W.; Gupta, V.K.; Karambiri, H.; Lakshmi, V.; Liang, X.; Mcdonnell, J.J.; Mendiondo, E.M.; O’connell, P.E.; et al. IAHS Decade on Predictions in Ungauged Basins (PUB), 2003–2012: Shaping an exciting future for the hydrological sciences. Hydrol. Sci. J. 2003, 48, 857–880. [Google Scholar] [CrossRef]
- Ridolfi, E.; Rianna, M.; Trani, G.; Alfonso, L.; Di Baldassarre, G.; Napolitano, F.; Russo, F. A new methodology to define homogeneous regions through an entropy based clustering method. Adv. Water Resour. 2016, 96, 237–250. [Google Scholar] [CrossRef]
- Ridolfi, E.; Servili, F.; Magini, R.; Napolitano, F.; Russo, F.; Alfonso, L. Artificial Neural Networks and Entropy-based Methods to Determine Pressure Distribution in Water Distribution Systems. Procedia Eng. 2014, 89, 648–655. [Google Scholar] [CrossRef]
- Mason, D.C.; Giustarini, L.; Garcia-Pintado, J.; Cloke, H.L. Detection of flooded urban areas in high resolution Synthetic Aperture Radar images using double scattering. Int. J. Appl. Earth Obs. Geoinf. 2014, 28, 150–159. [Google Scholar] [CrossRef]
- Iervolino, P.; Guida, R.; Iodice, A.; Riccio, D. Flooding Water Depth Estimation with High-Resolution SAR. IEEE Trans. Geosci. Remote Sens. 2015, 53, 2295–2307. [Google Scholar] [CrossRef]
- Schumann, G.J.-P.; Neal, J.C.; Mason, D.C.; Bates, P.D. The accuracy of sequential aerial photography and SAR data for observing urban flood dynamics, a case study of the UK summer 2007 floods. Remote Sens. Environ. 2011, 115, 2536–2546. [Google Scholar] [CrossRef]
- Jung, Y.; Kim, D.; Kim, D.; Kim, M.; Lee, S. Simplified Flood Inundation Mapping Based on Flood Elevation-Discharge Rating Curves Using Satellite Images in Gauged Watersheds. Water 2014, 6, 1280–1299. [Google Scholar] [CrossRef]
- Wehn, U.; Rusca, M.; Evers, J.; Lanfranchi, V. Participation in flood risk management and the potential of citizen observatories: A governance analysis. Environ. Sci. Policy 2015, 48, 225–236. [Google Scholar] [CrossRef]
- Triglav-Čekada, M.; Radovan, D. Using volunteered geographical information to map the November 2012 floods in Slovenia. Nat. Hazards Earth Syst. Sci. 2013, 13, 2753–2762. [Google Scholar] [CrossRef]
- Narayanan, R.; Lekshmy, V.M.; Rao, S.; Sasidhar, K. A novel approach to urban flood monitoring using computer vision. In Proceedings of the Fifth International Conference on Computing, Communications and Networking Technologies (ICCCNT), Anhui, China, 11–13 July 2014; pp. 1–7. [Google Scholar]
- Mazzoleni, M.; Alfonso, L.; Chacon-Hurtado, J.; Solomatine, D. Assimilating uncertain, dynamic and intermittent streamflow observations in hydrological models. Adv. Water Resour. 2015, 83, 323–339. [Google Scholar] [CrossRef]
- Romano, E.; Guyennon, N.; Del Bon, A.; Petrangeli, A.B.; Preziosi, E. Robust Method to Quantify the Risk of Shortage for Water Supply Systems. J. Hydrol. Eng. 2017, 22, 04017021. [Google Scholar] [CrossRef]
- Kim, Y. Uncertainty Analysis for Non-Intrusive Measurement of River Discharge Using Image Velocimetry. Ph.D. Thesis, Graduate College of the University of Iowa, The University of Iowa, Iowa City, IA, USA, 2006. [Google Scholar]
- Buffi, G.; Manciola, P.; Grassi, S.; Gambi, A.; Barberini, M. Survey of the Ridracoli Dam: UAV—Based Photogrammetry and Traditional Topographic Techniques in the inspection of Vertical Structures. Geomat. Nat. Hazards Risk 2017, 8, 1562–1579. [Google Scholar] [CrossRef]
- Buffi, G.; Manciola, P.; De Lorenzis, L.; Cavalagli, N.; Comodini, F.; Gambi, A.; Gusella, V.; Mezzi, M.; Niemeier, W.; Tamagnini, C. Calibration of finite element models of concrete arch-gravity dams using dynamical measures: The case of Ridracoli. Procedia Eng. 2017, 199, 110–115. [Google Scholar] [CrossRef]
- Mazzoleni, M.; Arevalo, V.J.C.; Wehn, U.; Alfonso, L.; Norbiato, D.; Monego, M.; Ferri, M.; Solomatine, D.P. Exploring the influence of citizen involvement on the assimilation of crowdsourced observations: A modelling study based on the 2013 flood event in the Bacchiglione catchment (Italy). Hydrol. Earth Syst. Sci. 2018, 22, 391–416. [Google Scholar] [CrossRef]
- Le Coz, J.; Patalano, A.; Collins, D.; Guillén, N.F.; García, C.M.; Smart, G.M.; Bind, J.; Chiaverini, A.; Le Boursicaud, R.; Dramais, G.; et al. Crowdsourced data for flood hydrology: Feedback from recent citizen science projects in Argentina, France and New Zealand. J. Hydrol. 2016, 541, 766–777. [Google Scholar] [CrossRef]
- Le Boursicaud, R.; Pénard, L.; Hauet, A.; Thollet, F.; Le Coz, J. Gauging extreme floods on YouTube: Application of LSPIV to home movies for the post-event determination of stream discharges. Hydrol. Process. 2016, 30, 90–105. [Google Scholar] [CrossRef]
- Hauet, A.; Kruger, A.; Krajewski, W.F.; Bradley, A.; Muste, M.; Creutin, J.-D.; Wilson, M. Experimental System for Real-Time Discharge Estimation Using an Image-Based Method. J. Hydrol. Eng. 2008, 13, 105–110. [Google Scholar] [CrossRef]
- Hugin Manual. 2013. Available online: http://hugin.sourceforge.net/docs/manual/Hugin.html (accessed on 30 December 2017).
- Dersch, H. Panorama Tools: Open Source Software for Immersive Imaging. In Proceedings of the International VR Photography Conference, Berkley, CA, USA, 15–20 June 2007. [Google Scholar]
- Dersch, H. Articles and Software, Hochschule Furtwangen University. 2015. Available online: https://webuser.hs-furtwangen.de/~dersch/ (accessed on 30 December 2017).
- Szeliski, R. Image Alignment and Stitching: A Tuto-Rial; Technical Report, MSR-TR-2004-92; Microsoft Research: Redmond, WA, USA, 2004. [Google Scholar]
- Venturi, S.; Di Francesco, S.; Materazzi, F.; Manciola, P. Unmanned aerial vehicles and Geographical Information System integrated analysis of vegetation in Trasimeno Lake, Italy. Lakes Reserv. Res. Manag. 2016, 21, 5–19. [Google Scholar] [CrossRef]
- Marx, S.; Hämmerle, M.; Klonner, C.; Höfle, B. 3D participatory sensing with low-cost mobile devices for crop height assessment—A comparison with terrestrial laser scanning data. PLoS ONE 2016, 11, e0152839. [Google Scholar] [CrossRef] [PubMed]
- Sommer, C.; Strähle, C.; Köthe, U.; Hamprecht, F.A. Ilastik: Interactive Learning and Segmentation Toolkit. In Proceedings of the Eighth IEEE International Symposium on Biomedical Imaging (ISBI), Chicago, IL, USA, 30 March–2 April 2011; pp. 230–233. [Google Scholar]
- Canny, J. A Computational Approach to Edge Detection. IEEE Trans. Pattern Anal. Mach. Intell. 1987, 184–203. [Google Scholar] [CrossRef]
- Gilmore, T.E.; Birgand, F.; Chapman, K.W. Source and magnitude of error in an inexpensive image-based water level measurement system. J. Hydrol. 2013, 496, 178–186. [Google Scholar] [CrossRef]
- Dawson, C.W.; Abrahart, R.J.; See, L.M. HydroTest: A web-based toolbox of evaluation metrics for the standardised assessment of hydrological forecasts. Environ. Model. Softw. 2007, 22, 1034–1052. [Google Scholar] [CrossRef]
Figure 1.
The test case study area is located in the Emilia Romagna Region, Central Italy. The red circle identifies the location of the area, left panel. The experiment is performed at the Ridracoli lake, artificially created by the construction of the homonymous dam, right panel.
Figure 1.
The test case study area is located in the Emilia Romagna Region, Central Italy. The red circle identifies the location of the area, left panel. The experiment is performed at the Ridracoli lake, artificially created by the construction of the homonymous dam, right panel.
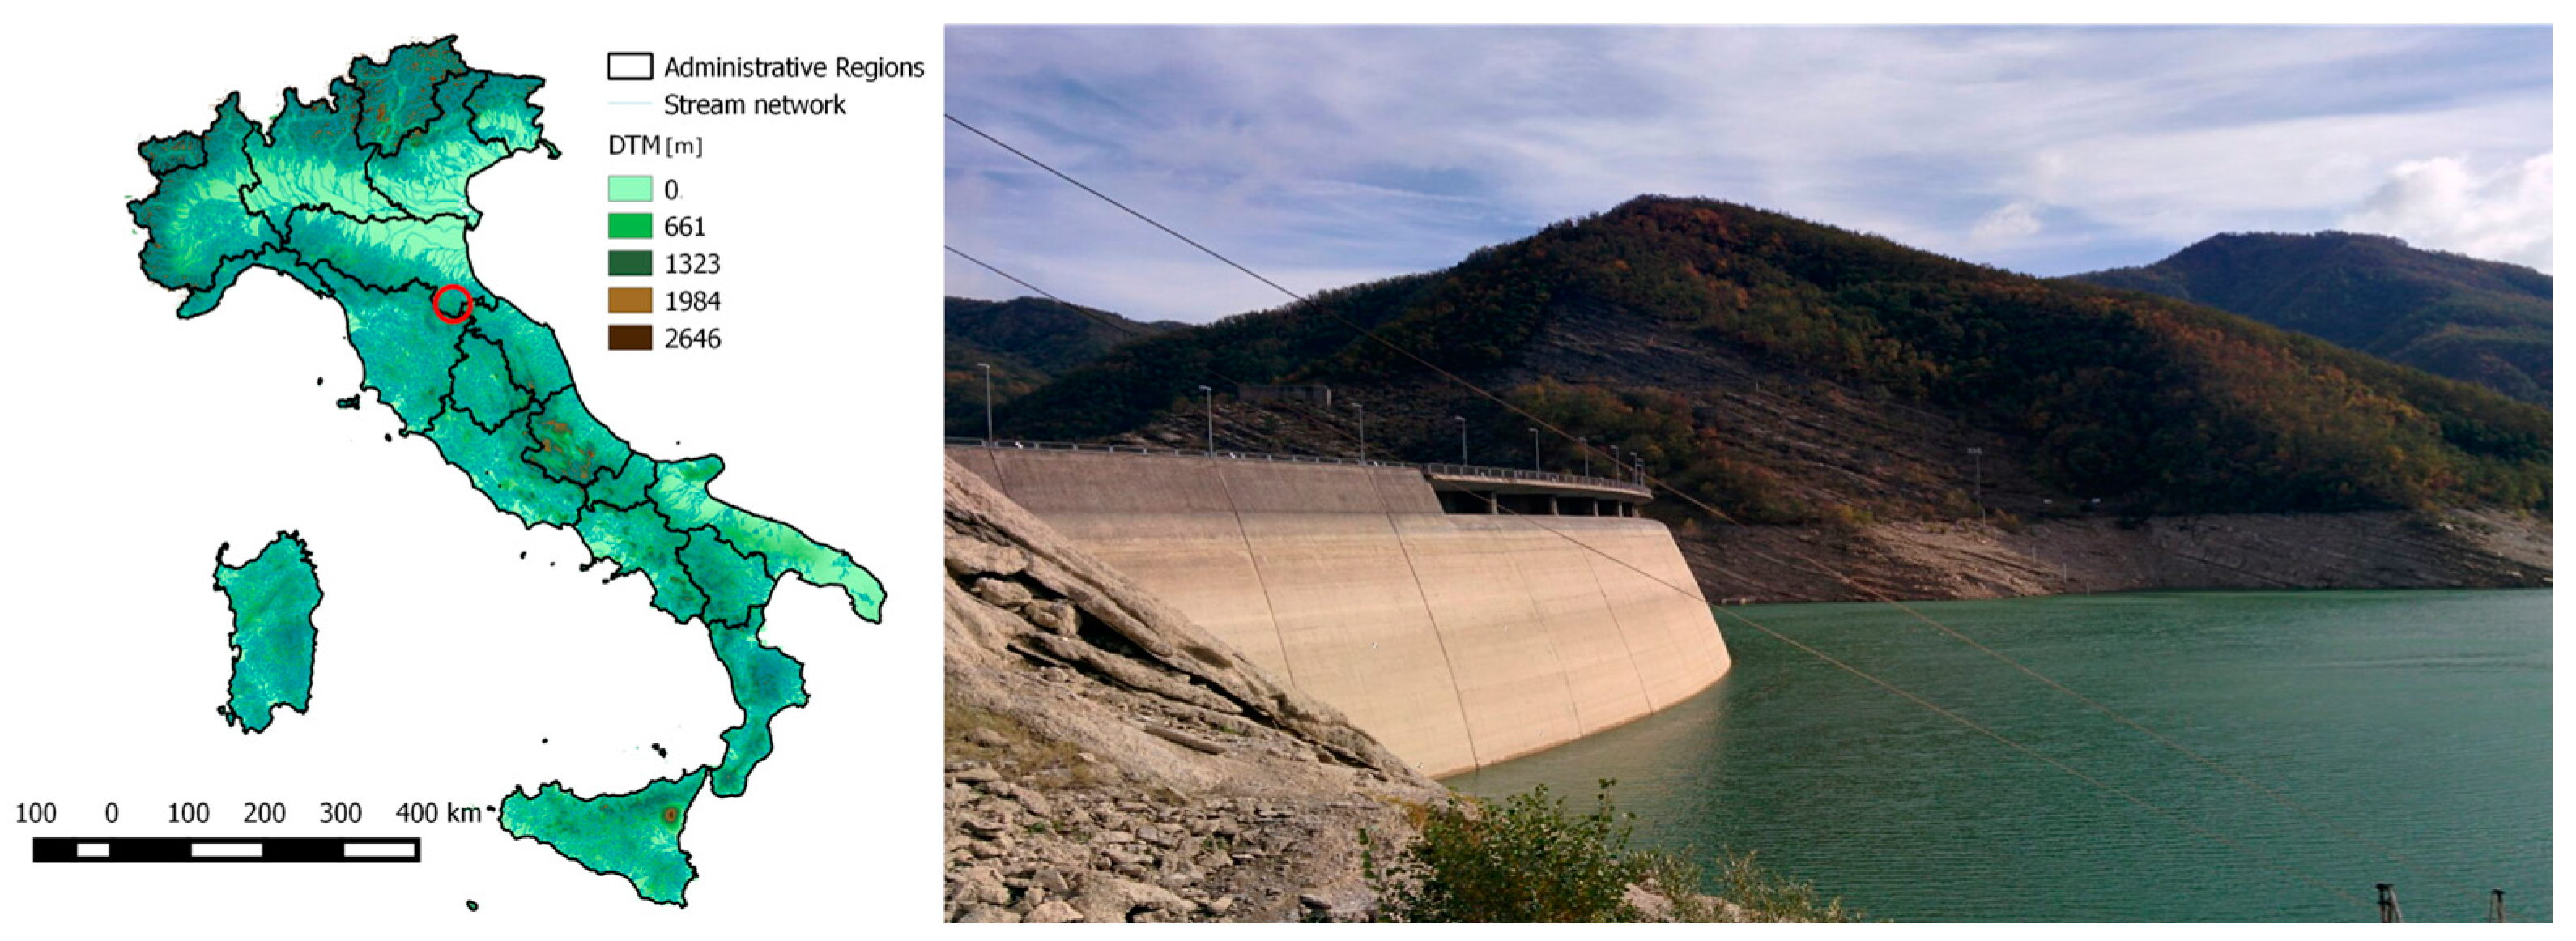
Figure 2.
Scheme of Ground Control Points (GCPs) locations on the upstream face of the dam. The red circles show the position of the four GCPs used to retrieve the water level from the images.
Figure 2.
Scheme of Ground Control Points (GCPs) locations on the upstream face of the dam. The red circles show the position of the four GCPs used to retrieve the water level from the images.

Figure 3.
Panel (a) depicts one of the original images; (b) shows the image used to retrieve the water level value; (c) shows the results of the feature selection approach: elements are divided into four classes (i.e., water, concrete face, white and black parts of the marker); (d) shows the effect of the application of the Canny filter to categorize the image; (e) shows the extracted waterline.

Figure 4.
Boxplot of errors between estimated and observed water level values at the four Ground Control Points (GCPs).
Figure 4.
Boxplot of errors between estimated and observed water level values at the four Ground Control Points (GCPs).

Table 1.
Mean absolute error (MAE) between observed and estimated values, the root mean squared error (RMSE) and the BIAS in percentage are reported for each ground control point (GCP).
Table 1.
Mean absolute error (MAE) between observed and estimated values, the root mean squared error (RMSE) and the BIAS in percentage are reported for each ground control point (GCP).
| ID GCP | MAE | RMSE | BIAS |
|---|---|---|---|
| [m] | [m] | [%] | |
| 1 | 0.045 | 0.047 | 0.008 |
| 2 | 0.012 | 0.015 | 0.000 |
| 3 | 0.031 | 0.038 | 0.005 |
| 4 | 0.051 | 0.062 | 0.005 |
© 2018 by the authors. Licensee MDPI, Basel, Switzerland. This article is an open access article distributed under the terms and conditions of the Creative Commons Attribution (CC BY) license (http://creativecommons.org/licenses/by/4.0/).
Share and Cite
MDPI and ACS Style
Ridolfi, E.; Manciola, P. Water Level Measurements from Drones: A Pilot Case Study at a Dam Site. Water 2018, 10, 297. https://doi.org/10.3390/w10030297
AMA Style
Ridolfi E, Manciola P. Water Level Measurements from Drones: A Pilot Case Study at a Dam Site. Water. 2018; 10(3):297. https://doi.org/10.3390/w10030297
Chicago/Turabian StyleRidolfi, Elena, and Piergiorgio Manciola. 2018. "Water Level Measurements from Drones: A Pilot Case Study at a Dam Site" Water 10, no. 3: 297. https://doi.org/10.3390/w10030297
Note that from the first issue of 2016, this journal uses article numbers instead of page numbers. See further details here.