Article

Nonlinear Response of Streamflow to Climate Change in High-Latitude Regions: A Case Study in Headwaters of Nenjiang River Basin in China’s Far Northeast

1
Key Laboratory of Wetland Ecology and Environment, Northeast Institute of Geography and Agroecology, Chinese Academy of Sciences, Changchun 130102, China
2
University of Chinese Academy of Sciences, Beijing 100049, China
3
School of Renewable Natural Resources, Louisiana State University Agricultural Center, 227 Highland Road, Baton Rouge, LA 70803, USA
*
Author to whom correspondence should be addressed.
Water 2018, 10(3), 294; https://doi.org/10.3390/w10030294
Submission received: 31 December 2017 / Revised: 12 February 2018 / Accepted: 23 February 2018 / Published: 9 March 2018

Abstract

:
Assessment of the response of streamflow to future climate change in headwater areas is of a particular importance for sustainable water resources management in a large river basin. In this study, we investigated multiscale variation in hydroclimatic variables including streamflow, temperature, precipitation, and evapotranspiration in the Headwater Areas of the Nenjiang River Basin (HANR) in China’s far northeast, which are sensitive to climate change. We analyzed 50-year-long (1961–2010) records of the hydroclimatic variables using the ensemble empirical mode decomposition (EEMD) method to identify their inherent changing patterns and trends at the inter-annual and inter-decadal scales. We found that all these hydroclimatic variables showed a clear nonlinear process. At the inter-annual and inter-decadal scales, streamflow had a similar periodic changing pattern and transition years to that of precipitation; however, within a period, streamflow showed a close association with temperature and evapotranspiration. The findings indicate that the response of streamflow in headwater regions to climate change is a nonlinear dynamic process dictated by precipitation at the decadal scale and modified by temperature and evapotranspiration within a decade.

1. Introduction

Global change is expected to alter hydrological processes, redistributing water resources in time and space as the frequency and intensity of climatic extremes increase in response to a warmer world [1,2]. The change in regional water resources, particularly streamflow, will affect local agriculture, environmental conditions, and socio-economics. Headwater streams are the smallest parts of river and stream networks, but they have the longest cumulative length within a river basin [3,4] and therefore govern hydrologic connectivity and supplying and preserving water sources [5]. For instance, the headwaters of the Colorado River Basin produced 75% of the annual streamflow from 25% of the area, while less than 10% of the annual streamflow was contributed by the lower basin [6]. These characteristics of a drainage network make headwater regions more vulnerable to global climate change in a river basin [7,8]. Despite headwaters spatial dominance and importance, they are often not well considered in management policies [9], especially in high-latitude regions. Hence, understanding of streamflow response to future climate change in headwaters is urgently required.
There have been an increasing number of studies on headwater streamflow to climate change [3,4,9,10]. These studies employed methods designed under the hypothesis that the time series of hydroclimatic variables are stationary and therefore can be considered as a linear system (such as moving average or polynomial, linear regression, empirical or spline function fitting) [11]. However, studies also found that hydroclimatic processes are complex and hydroclimatic variables, including runoff, precipitation, temperature and evapotranspiration, often behave nonlinearly and nonstationarily [12,13]. Therefore, traditional (i.e., linear interpretation) methods cannot satisfy for capturing nonlinear, nonstationary response patterns of streamflow to climatic variability. Wu and Huang [14] developed a time-series signal processing method, ensemble empirical mode decomposition (EEMD), that has a stronger self-adaptability and local variation characteristics based on the signal [13,15,16]. The method can gradually separate the oscillations at different scales in hydroclimatic change research (Intrinsic Mode Function—IMF) and the trend components from the original signal. Although the method has some drawbacks (for instance, the residual noise and the mode mixing problem), it has been found to be a robust approach suitable for non-stationary and nonlinear signal detection [17,18,19]. In recent years, there has been a growing application of the EEMD method in the field of hydroclimatic variables change, and some meaningful results have been achieved. In this study, we used the method to investigate nonlinear responses of streamflow in a headwater region of China’s far northeast to climate change in the past half century.
As mentioned above, headwater regions play a crucial role in quantity and variability of streamflow for downstream areas [20] because headwater streams dominate the cumulative drainage length (60–80%) of a typical river basin [3,4]. This is especially true for the headwater region of the Nenjiang River Basin in China’s far northeast that is dominated by snow hydrology. The lower Nenjiang River Basin is part of China’s largest commercial grain production base as well as the country’s largest inland wetland region (including three Wetlands of International Importance and homed many endangered wildlife) [21]. It has been reported that, during the past 50 years, the annual air temperature increased by 0.38 °C per decade across Northeast China, while the annual precipitation showed a decreasing trend, especially in the summer and autumn [22]. Concurrently, streamflow in the Nenjiang River Basin showed a remarkable decline, especially during the spring and summer months [23]. Several studies have looked at the temporal variability of streamflow in the river basin under warming and drying climate conditions [21,24,25,26,27]. These studies have found that climate change was the dominant factor for the reduction in the runoff in the river basin, especially in the upper basin region. However, all these studies use a linear approach to interpret the role of climate conditions on streamflow, giving little consideration to nonlinear and nonstationary characteristics of hydroclimatic variables.
With this mind, we employed a non-linear approach in this study to understand the complexity of streamflow responses to temperature, precipitation and evapotranspiration changes at multiple time scales. The study utilized observational data from seven hydrological stations and 15 meteorological stations across the Nenjiang River Basin to pursue the following objectives: (1) investigate nonlinear nature of streamflow and climate variability in the basin’s headwater region by analyzing inter-annual and inter-decadal trends using the ensemble empirical mode decomposition approach; and (2) determine nonlinear relationships between streamflow and climate. The ultimate goal of this study was to understand the response of headwater streamflow in a high-latitude region to variable changes in temperature, precipitation and the corresponding evapotranspiration.

2. Study Area and Methods
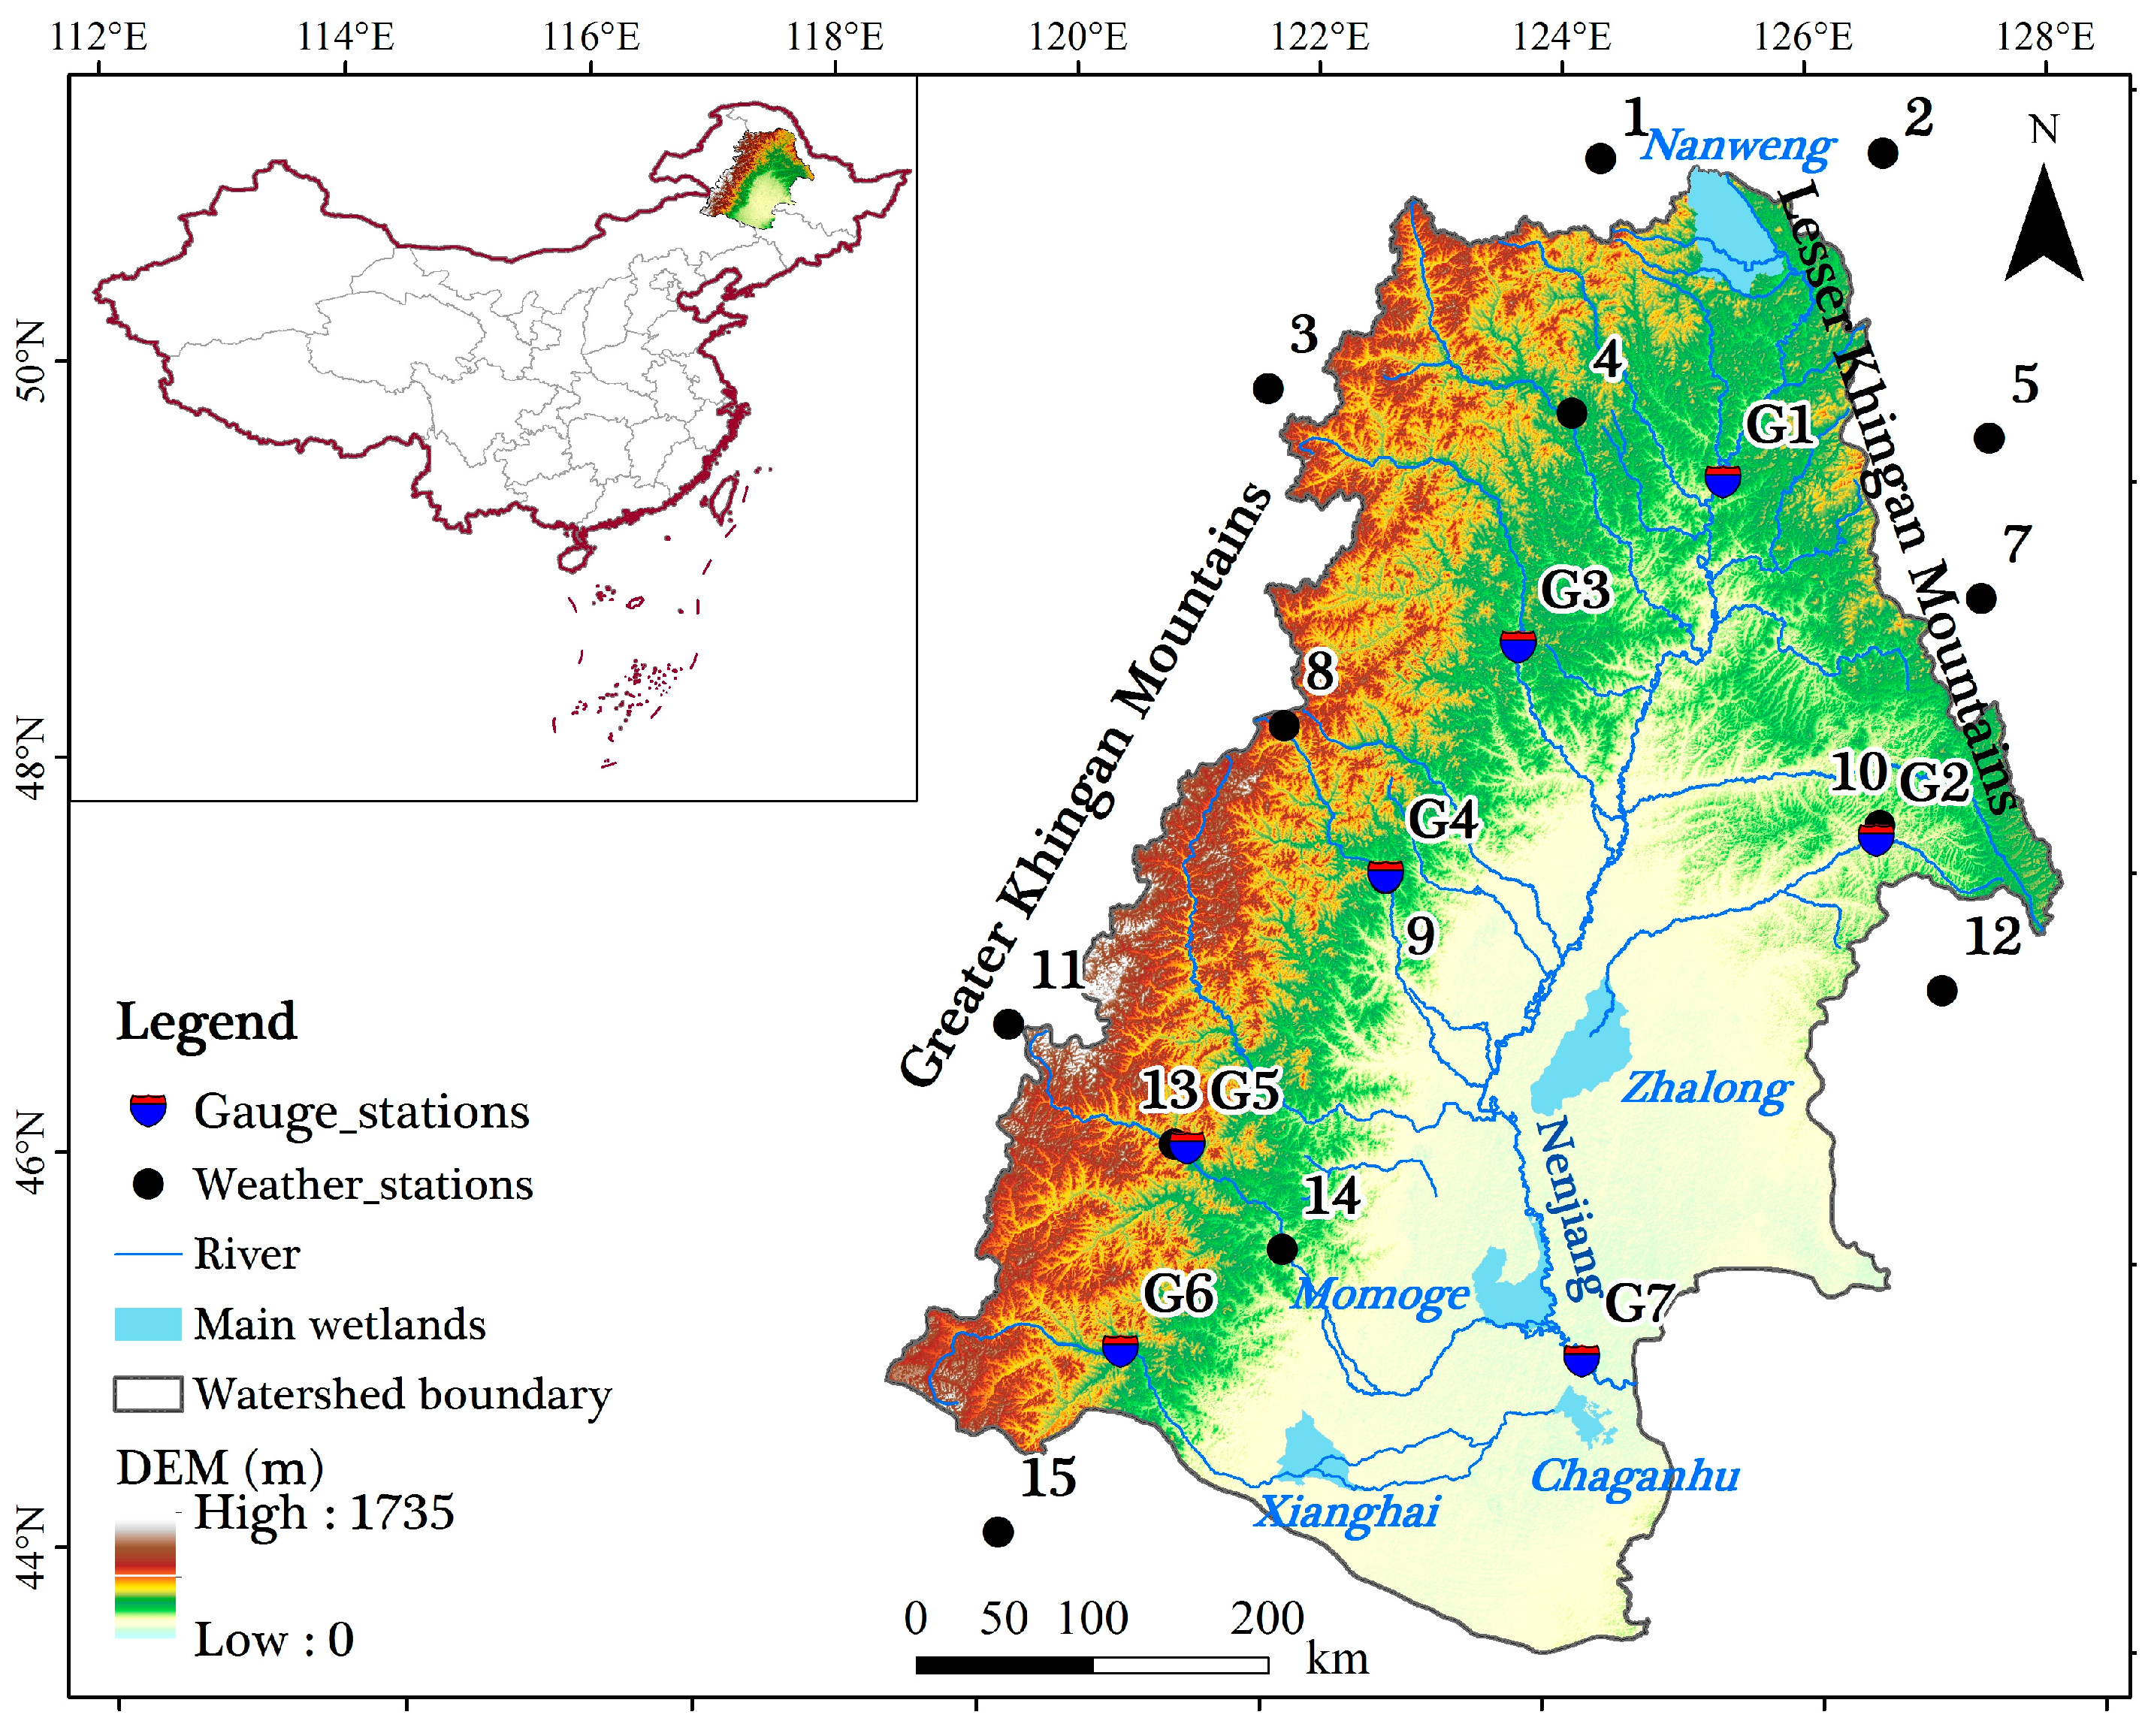
2.1. Study Area

The Nenjiang River is the largest tributary of the Songhua River in Northeast China, and drains a total land area of 297,000 km2, geographically covering the area of latitude 43°36′–51°11′ N and longitude 118°25′–128°81′ E (Figure 1). The river originates from the Greater Khingan Mountains, traveling southward through a semiarid region, the western Songnen Plain, and entering the Songhua River. The river flow has been the most important water source for agricultural irrigation and the large area of wetlands in the region that support diverse ecosystems and many endangered wildlife species [21]. The headwater region of the Nenjiang River, composing of the upper basin of several tributaries, has a drainage area of 55,702 km2, accounting for 26.03% of the entire river basin. The average annual streamflow (or water yield) is 78.26 × 10⁸ m3 (computed from 1951 to 2010) that it contributes to 36.53% of total flow at the last gauge station before the Nenjiang River’s confluence with the Songhua River, the Dalai Station (G7 in Figure 1). In recent years, multipurpose water resource management is gradually being carried out to make the Songhua River Basin become China’s future major grain production base and wetland reserve in the downstream region of Nenjiang River Basin. The streamflow in the basin plays an important role in maintaining ecology security of wetlands and feeding commodity grain production bases in downstream basins.
The headwater region has a cold climate with long and chilly winter as well as widespread snow and seasonal frozen soil and permafrost soil. With rolling hills and deep river valleys, its topography changes greatly and the vertical drop of the headwater is high. Average monthly temperatures range from −21.46 °C in January to 20.38 °C in July with an annual mean of 1.52 °C. Main land covers are grassland and forest. Moreover, human activity is limited ahgnd so it has little impact on local streamflow. The eco-environment of HANR remains in a semi-natural or pristine state, so it is an ideal place to study the response of streamflow to climate change.

2.2. Hydro-Meteorological Data

Monthly streamflow records from 1961 to 2010 were collected from six river gauge stations: Shihuiyao (G1), Beian (G2), Xiaoergou (G3), Zhanlantun (G4), Suollun (G5) and Tuliemaodu (G6). They are located at the ecotone of the Khingan Mountains and Songnen Plain, representing a natural state of streamflow (i.e., with minimal anthropogenic activities) over the HANR (Figure 1 and Table 1). Daily meteorological data (including precipitation, air temperature, relative humid, sunshine duration and wind speed) covering fifteen weather stations and spanning 1961–2010 were obtained from the Climate Data Center, China Meteorological Administration. The data quality for these forcing has been controlled by China Meteorological Administration and has been proven to be unmistakable by means of the extreme value examination and time synchronization detection. Few stations have missing data which were filled using linear regression method. Spatial distribution of the gauge/meteorological stations and their subordination to which sub-basins are shown in Figure 1 and Table 1, respectively.
Temperature and precipitation are the main driving forces to the variant streamflow in Northeast China [23,27], especially facing a warmer trend with less precipitation since 1980s [21,28]. Evapotranspiration (ET0) also plays an important role in controlling the water budget over those water-deficit regions [29]. The variability of climatic factors is a nonlinear and complex process. Therefore, nonlinear response of streamflow to temperature, precipitation and potential evapotranspiration were analyzed. The Penman–Monteith (PM) equation recommend by the United Nations Food and Agriculture Organization [30] was used to calculate daily potential evapotranspiration (ET0).

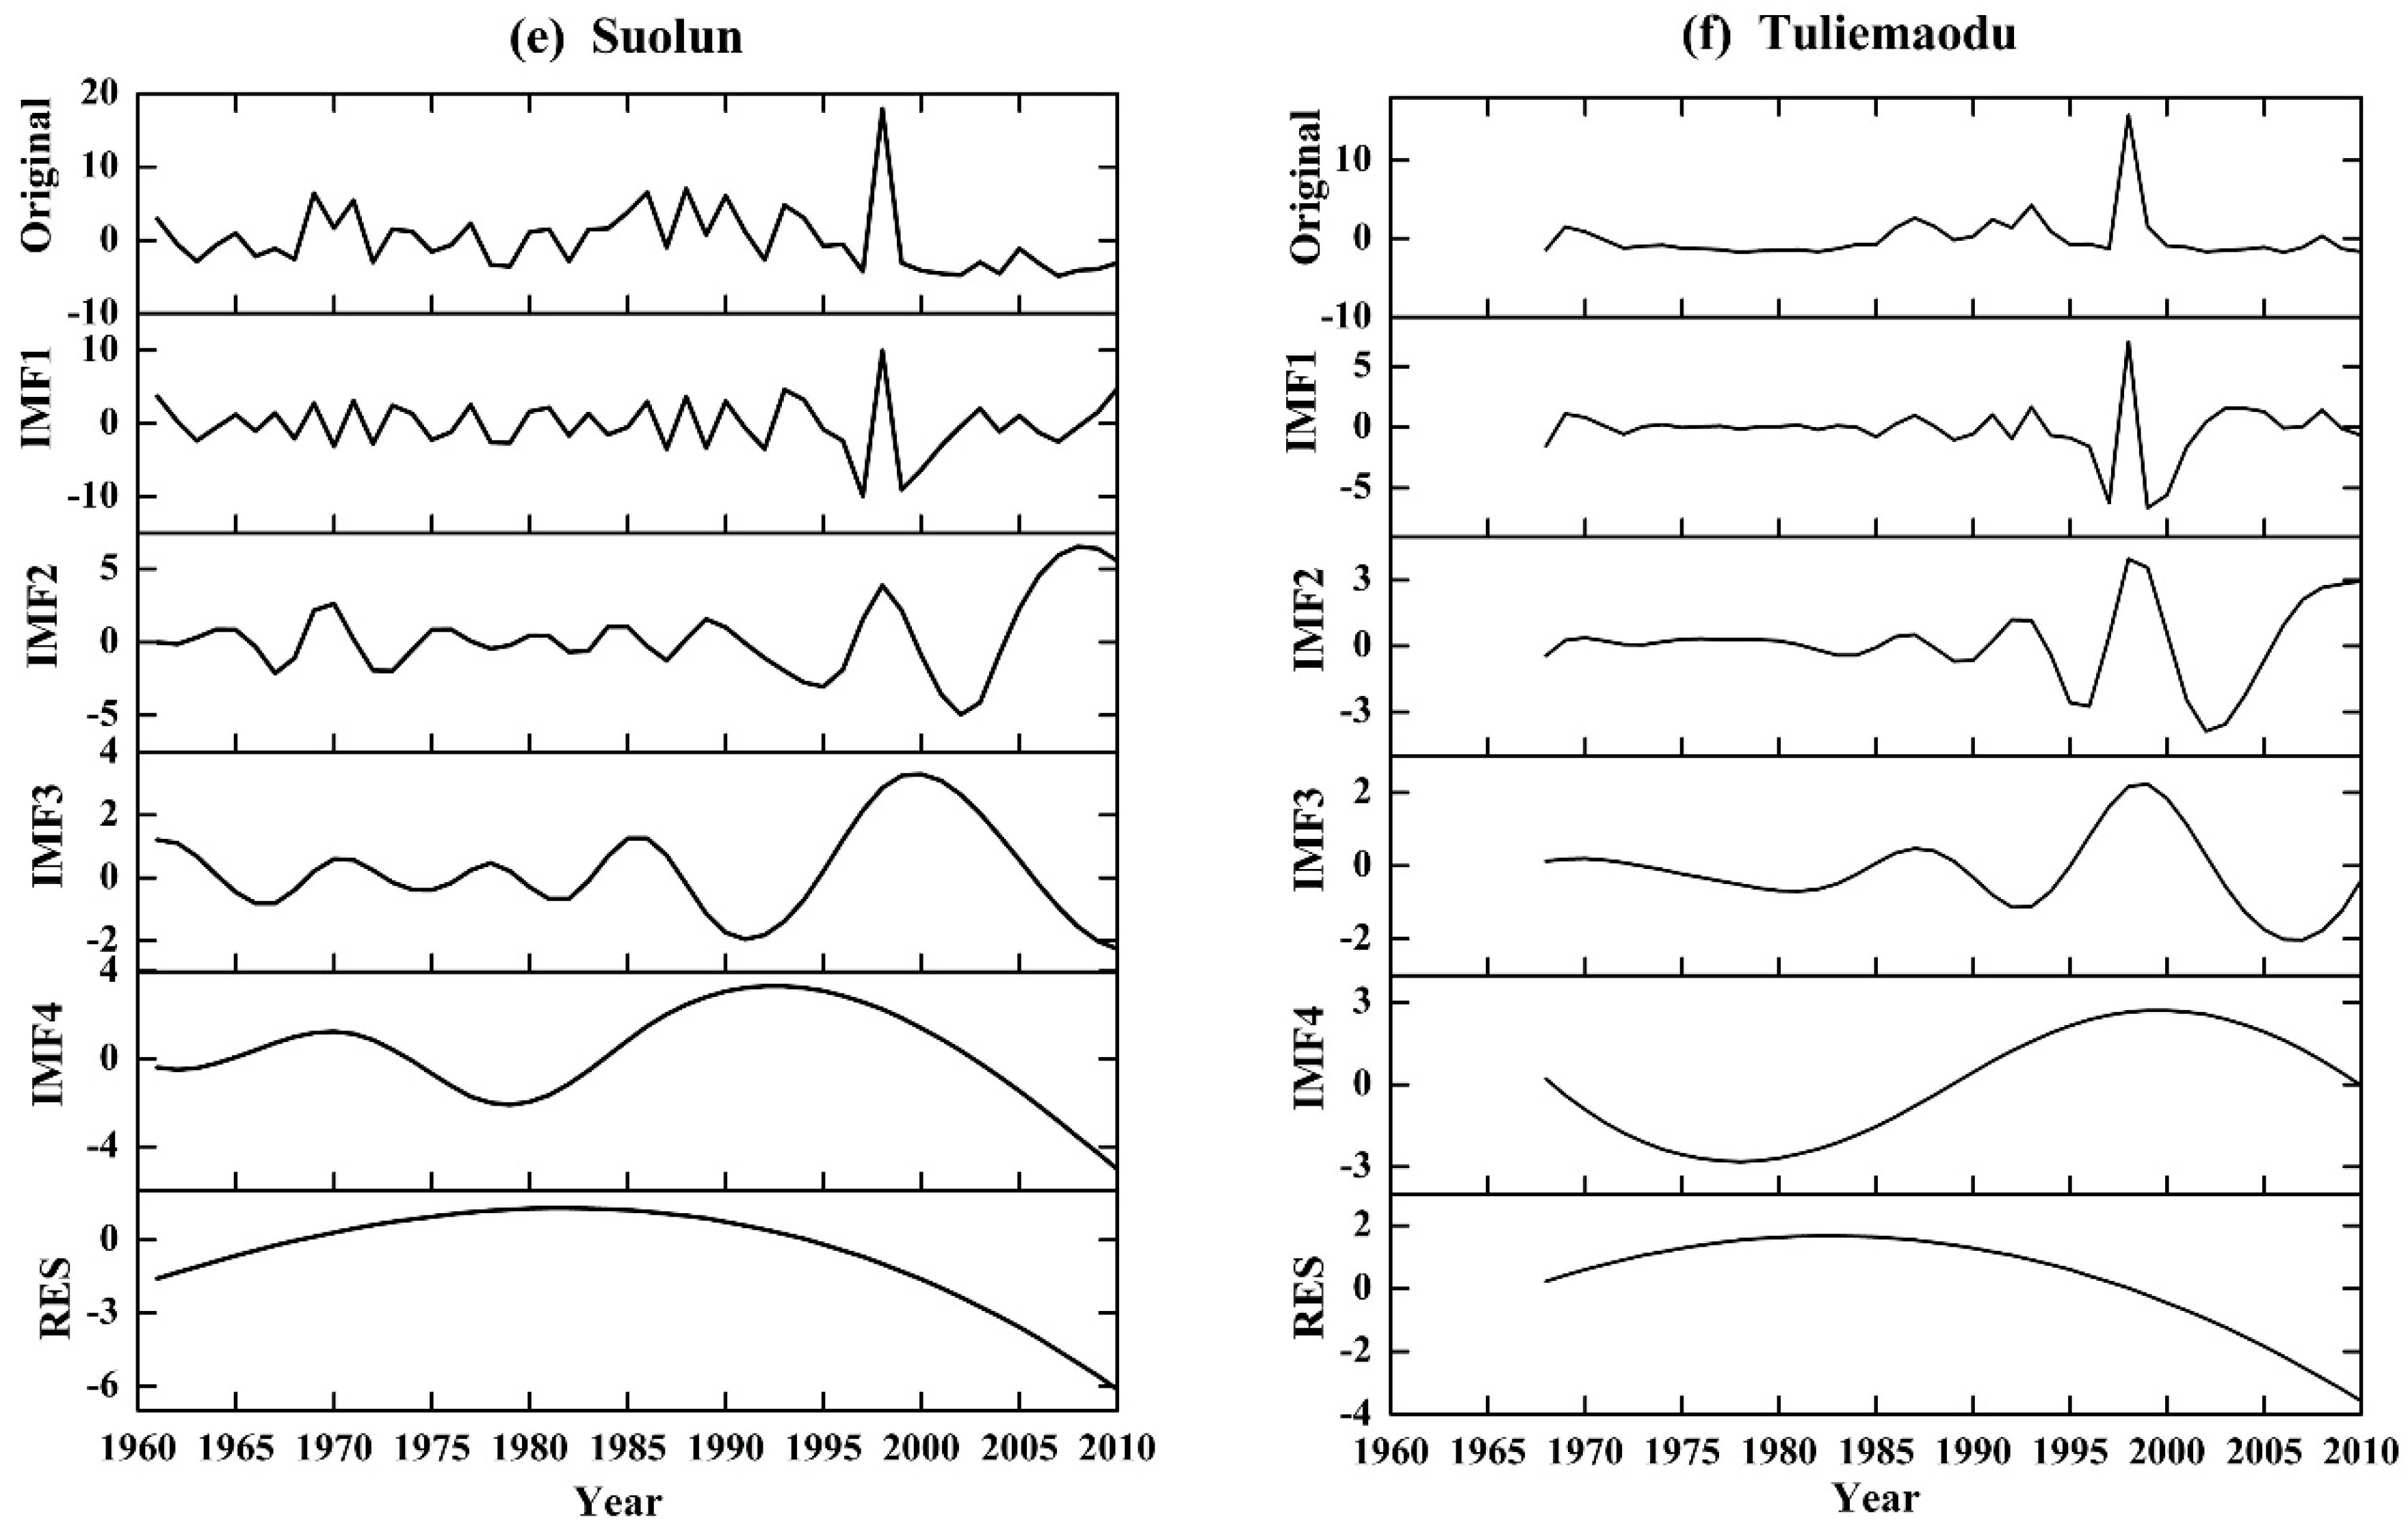
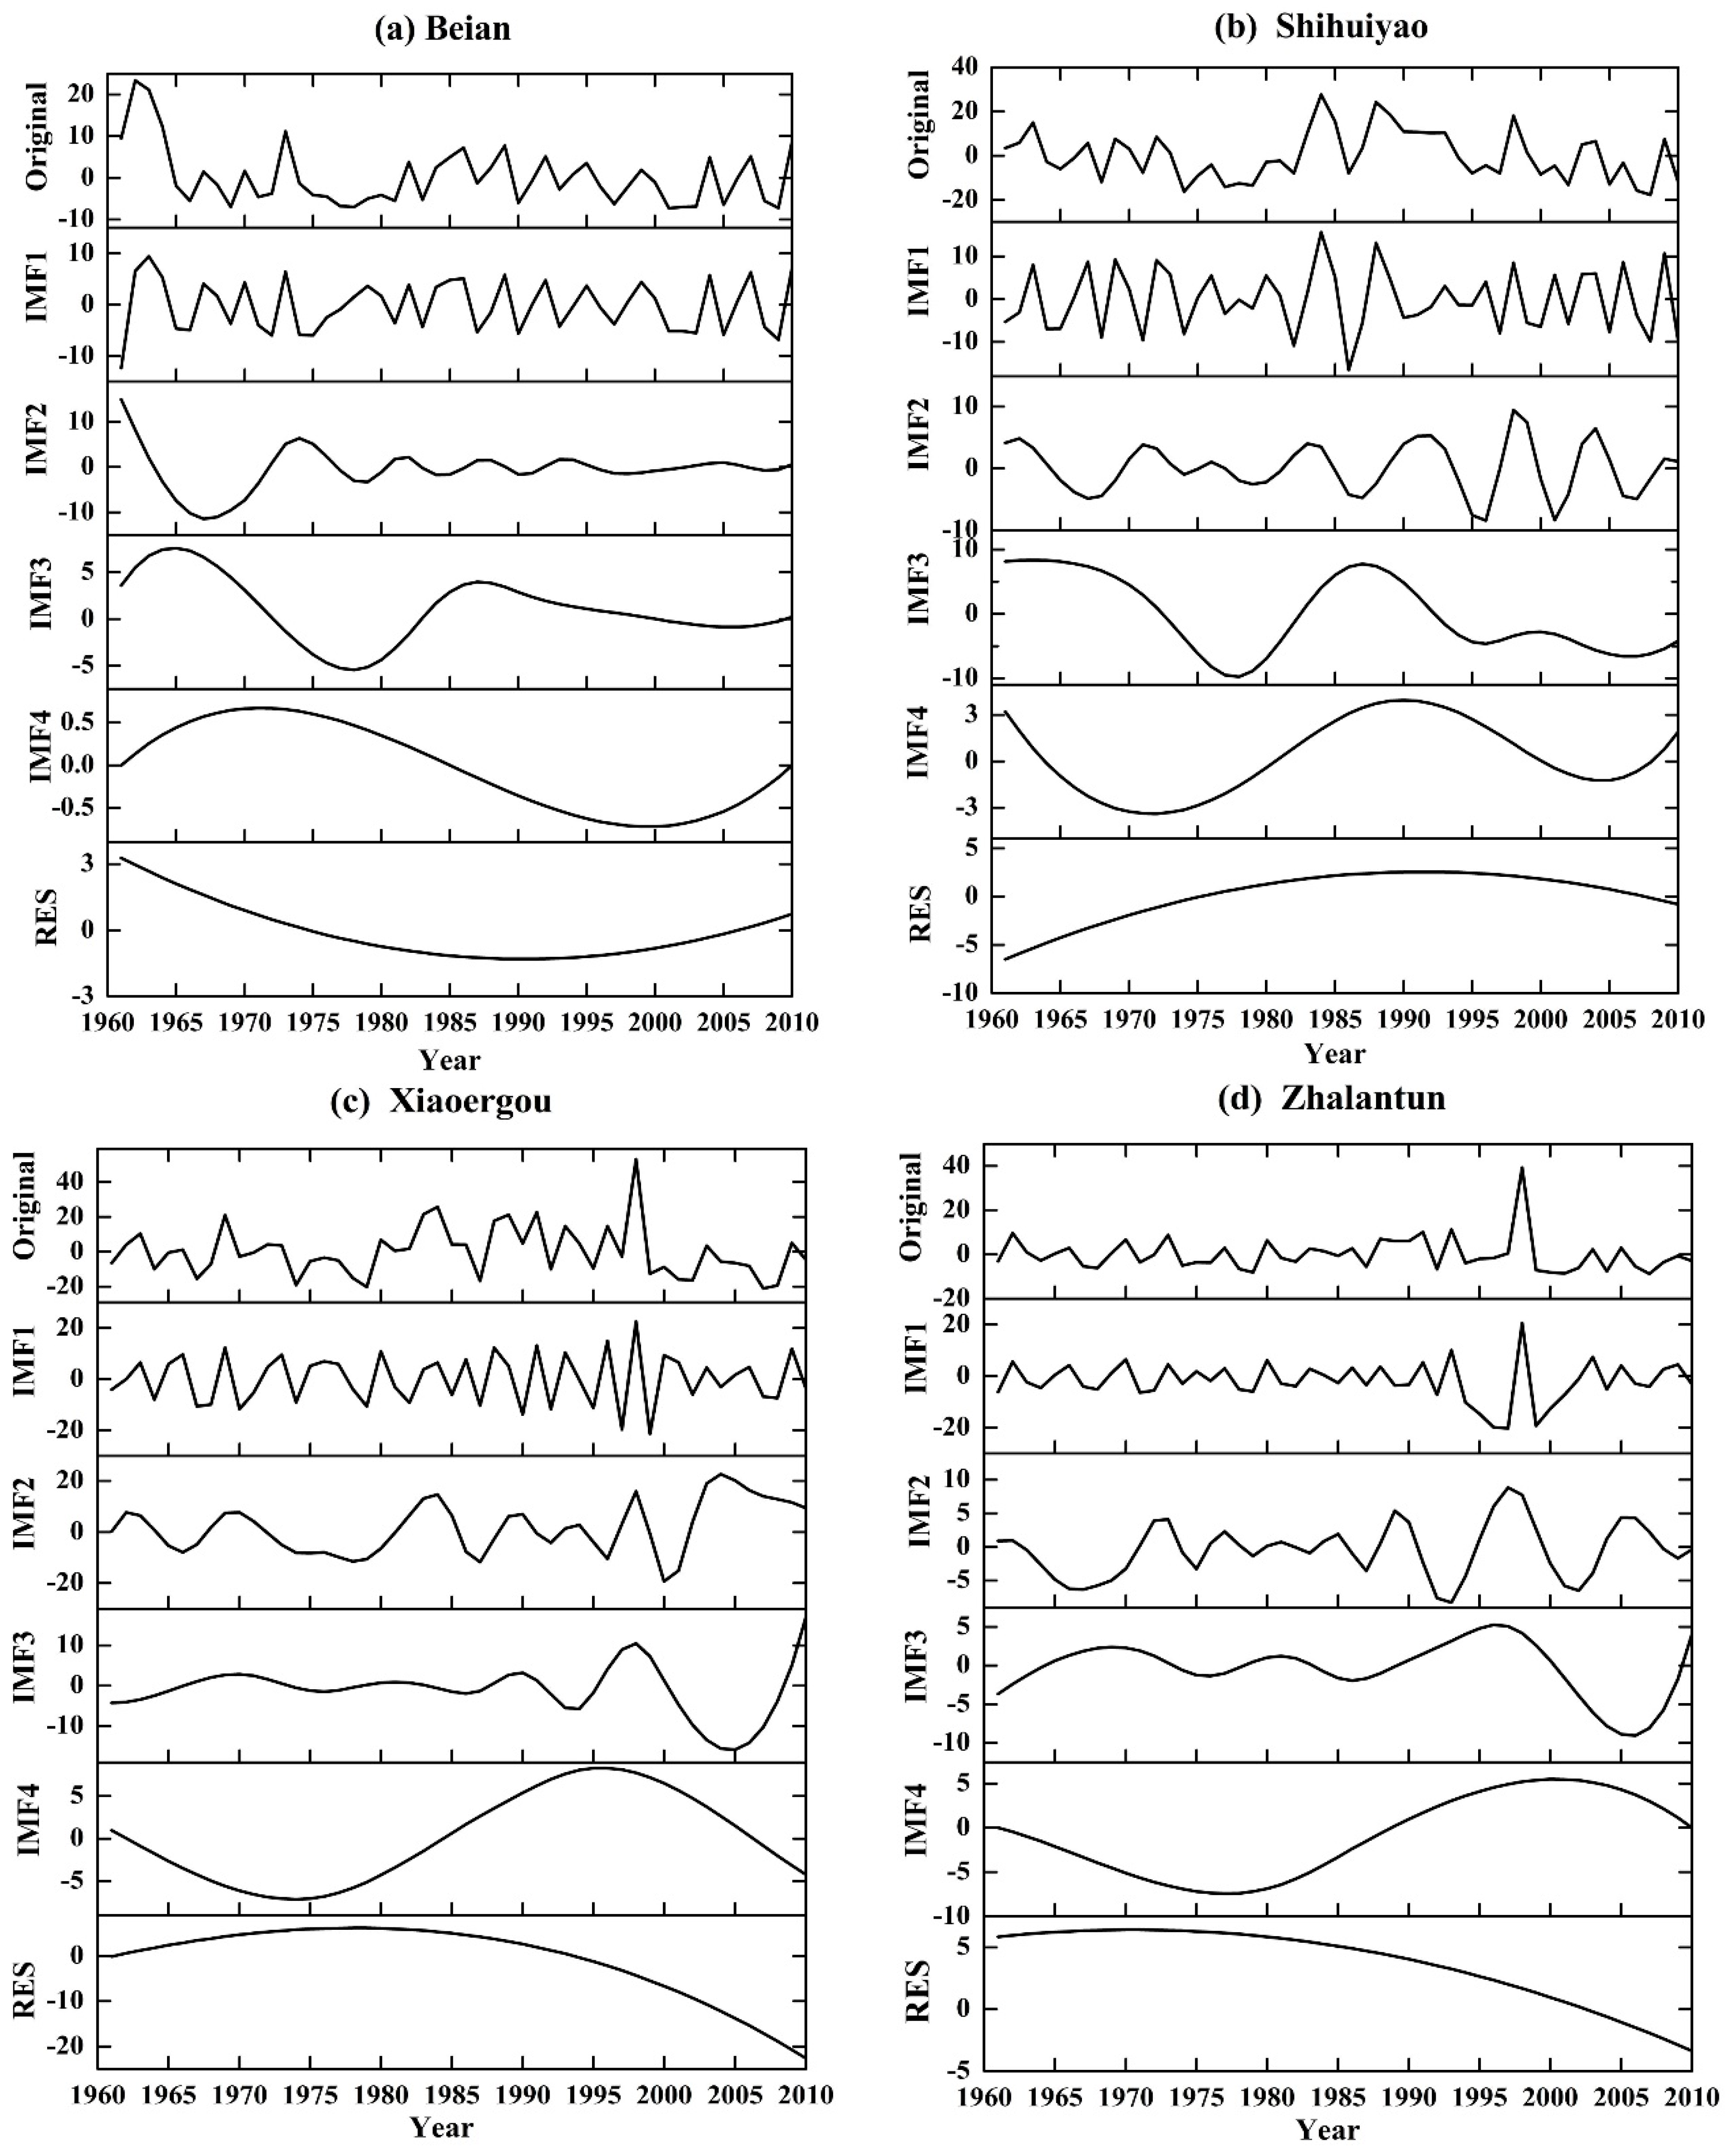
2.3. Ensemble Empirical Mode Decomposition

We applied the ensemble empirical mode decomposition (EEMD) method [14,31] to decompose the streamflow, temperature, precipitation and evapotranspiration during the period of 1961–2010 into different time-scales and its nonlinear trend. The EEMD method was evolved from the EMD method to alleviate or reduces the scale-mixing problem. In the EEMD method, a time series x(t) is decomposed in terms of adaptively obtained, amplitude–frequency modulated oscillatory components Ci (i = 1, 2, ..., n) and a residual Rn, a curve that is either monotonic or contains only one extremum from which no additional oscillatory components can be extracted from:
x ( t ) = i = 1 n C i ( t ) + R n ( t )
where the ith IMF Ci can be written in polar coordinates as Ci(t) = ri(t) × sin[Ci(t)], where r(i) is the ith time-dependent amplitude, Ci is the ith time-dependent frequency, and R is the residual [31]. An IMF is different from Fourier modes for which both ri and Cj are time independent, and is defined by the following two properties: (1) each IMF Cj has exactly one zero crossing between two consecutive local extremes (i.e., a sequence of maxima and minima); and (2) the local mean of each IMF Cj is zero. Rn (RES) follows a priori shape and changes with the time after the intrinsic variability at various time scales is removed. This trend also has low sensitivity to the extension (addition) of new data. The latter property guarantees that the physical interpretation at specified time intervals does not change with the addition of new data, which is to say, to be consistent with a physical constraint that the subsequent evolution of a physical system cannot alter the reality that has already happened [13,14,31]. Here, the ensemble number is set as 100 and the added noise has an amplitude that is 0.2 times the standard deviation of the corresponding data.

2.4. Application of EEMD to Hydro-Meteorological Data

First, we analyzed annual anomaly series to show nonlinear characteristics of streamflow in six gauge stations (Figure 2). Then, we decomposed annual streamflow anomaly of six gauge stations into four Intrinsic Mode Function components (IMF1, IMF2, IMF3 and IMF4) and one trend component (RES), which can adequately reflect multiscale nonlinear variation characteristics of original streamflow series (Figure 3). Each IMF components reflect the fluctuation of streamflow from high frequency (shorter than 10-year period) to low frequency (longer than 10-year period) at different time scales, and whereas the RES component indicates the general change tendency associated with streamflow throughout the whole time period. We obtained the mean period of each IMF by counting the number of peaks of time series curves [14]. Next, we investigated multiscale variations of streamflow by reconstructing inter-annual and inter-decadal series (Figure 4 and Table 2). The inter-annual runoff was obtained by IMF1 and IMF2, which represent the inter-annual runoff variation with trend component, while the inter-decadal runoff was obtained by IMF3 and IMF4, which are representatives of the inter-decadal runoff variation plus trend component. Finally, from the view of fluctuation, in-phase or anti-phase and variety of scales or periodic oscillations, we comparatively analyzed reconstructed inter-annual, inter-decadal series and trend components of streamflow, temperature, precipitation and potential evapotranspiration to identify the multiscale response of streamflow to climate change at different timescales in six headwater areas of HANR (Figure 5, Figure 6 and Figure 7 and Table 3). The Augmented Dickey–Fuller (ADF) unit root test method [32] was used to analyze the stationarity of annual streamflow series for six gauge stations.

3. Results

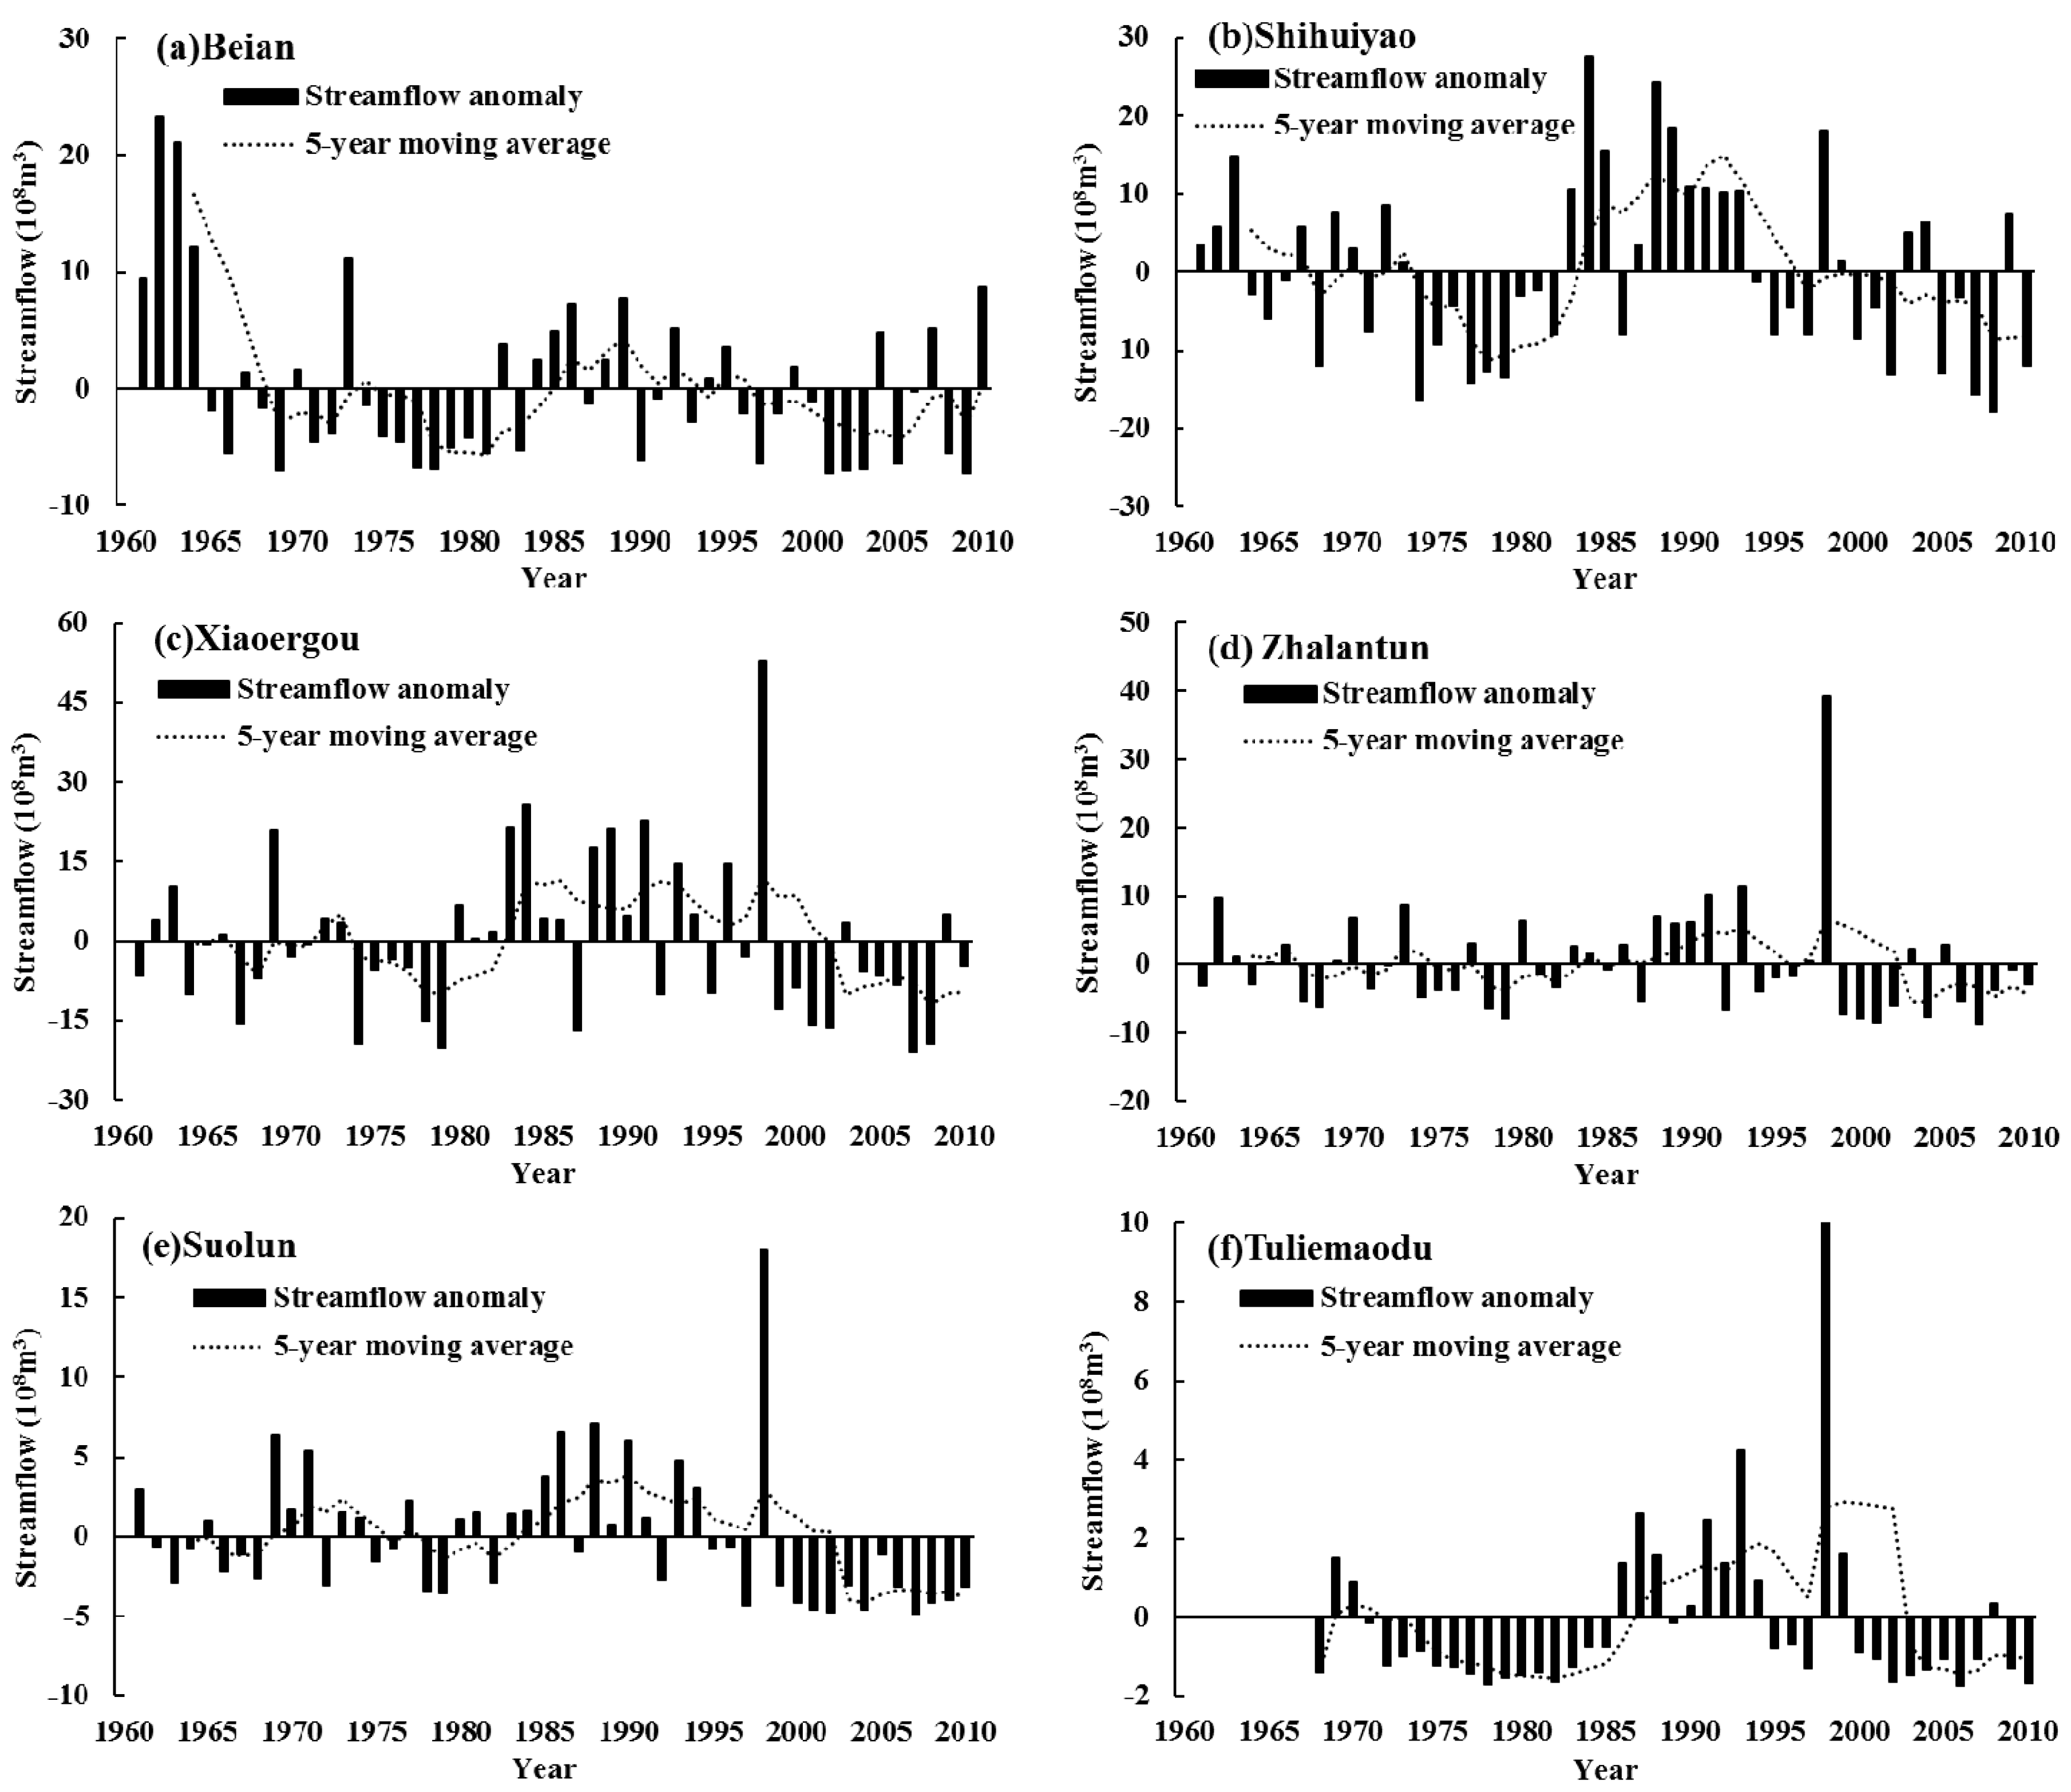
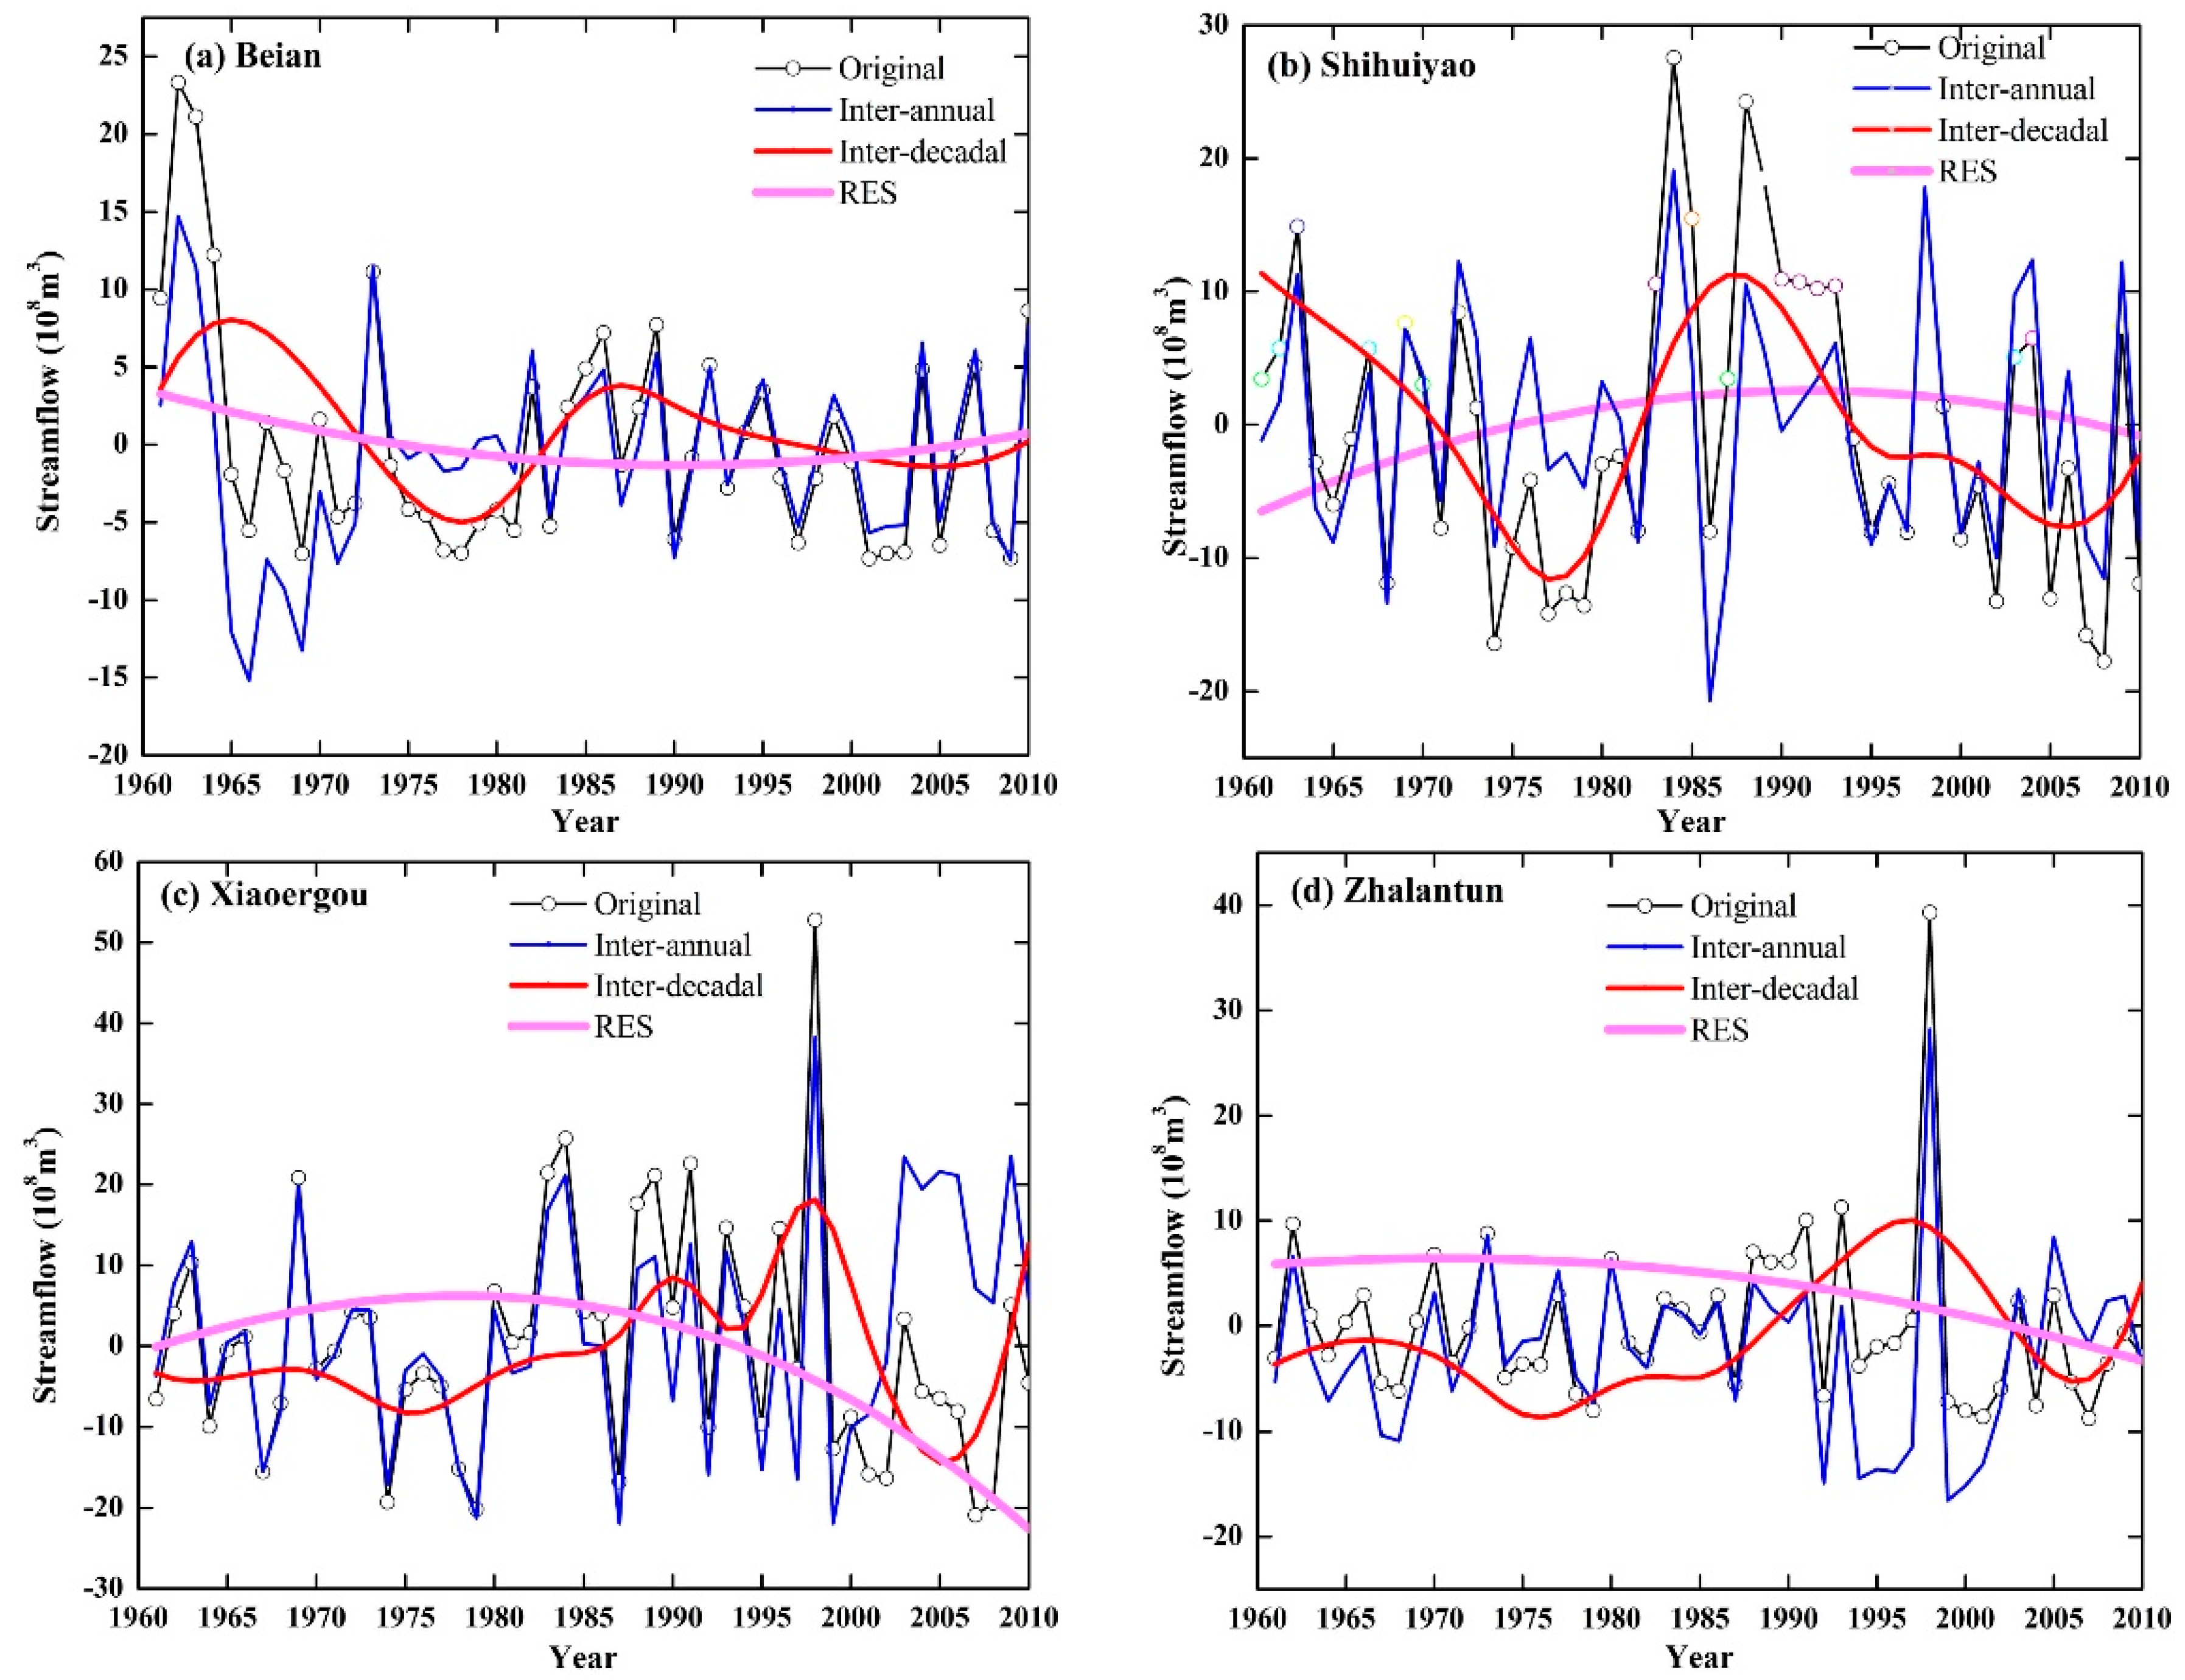
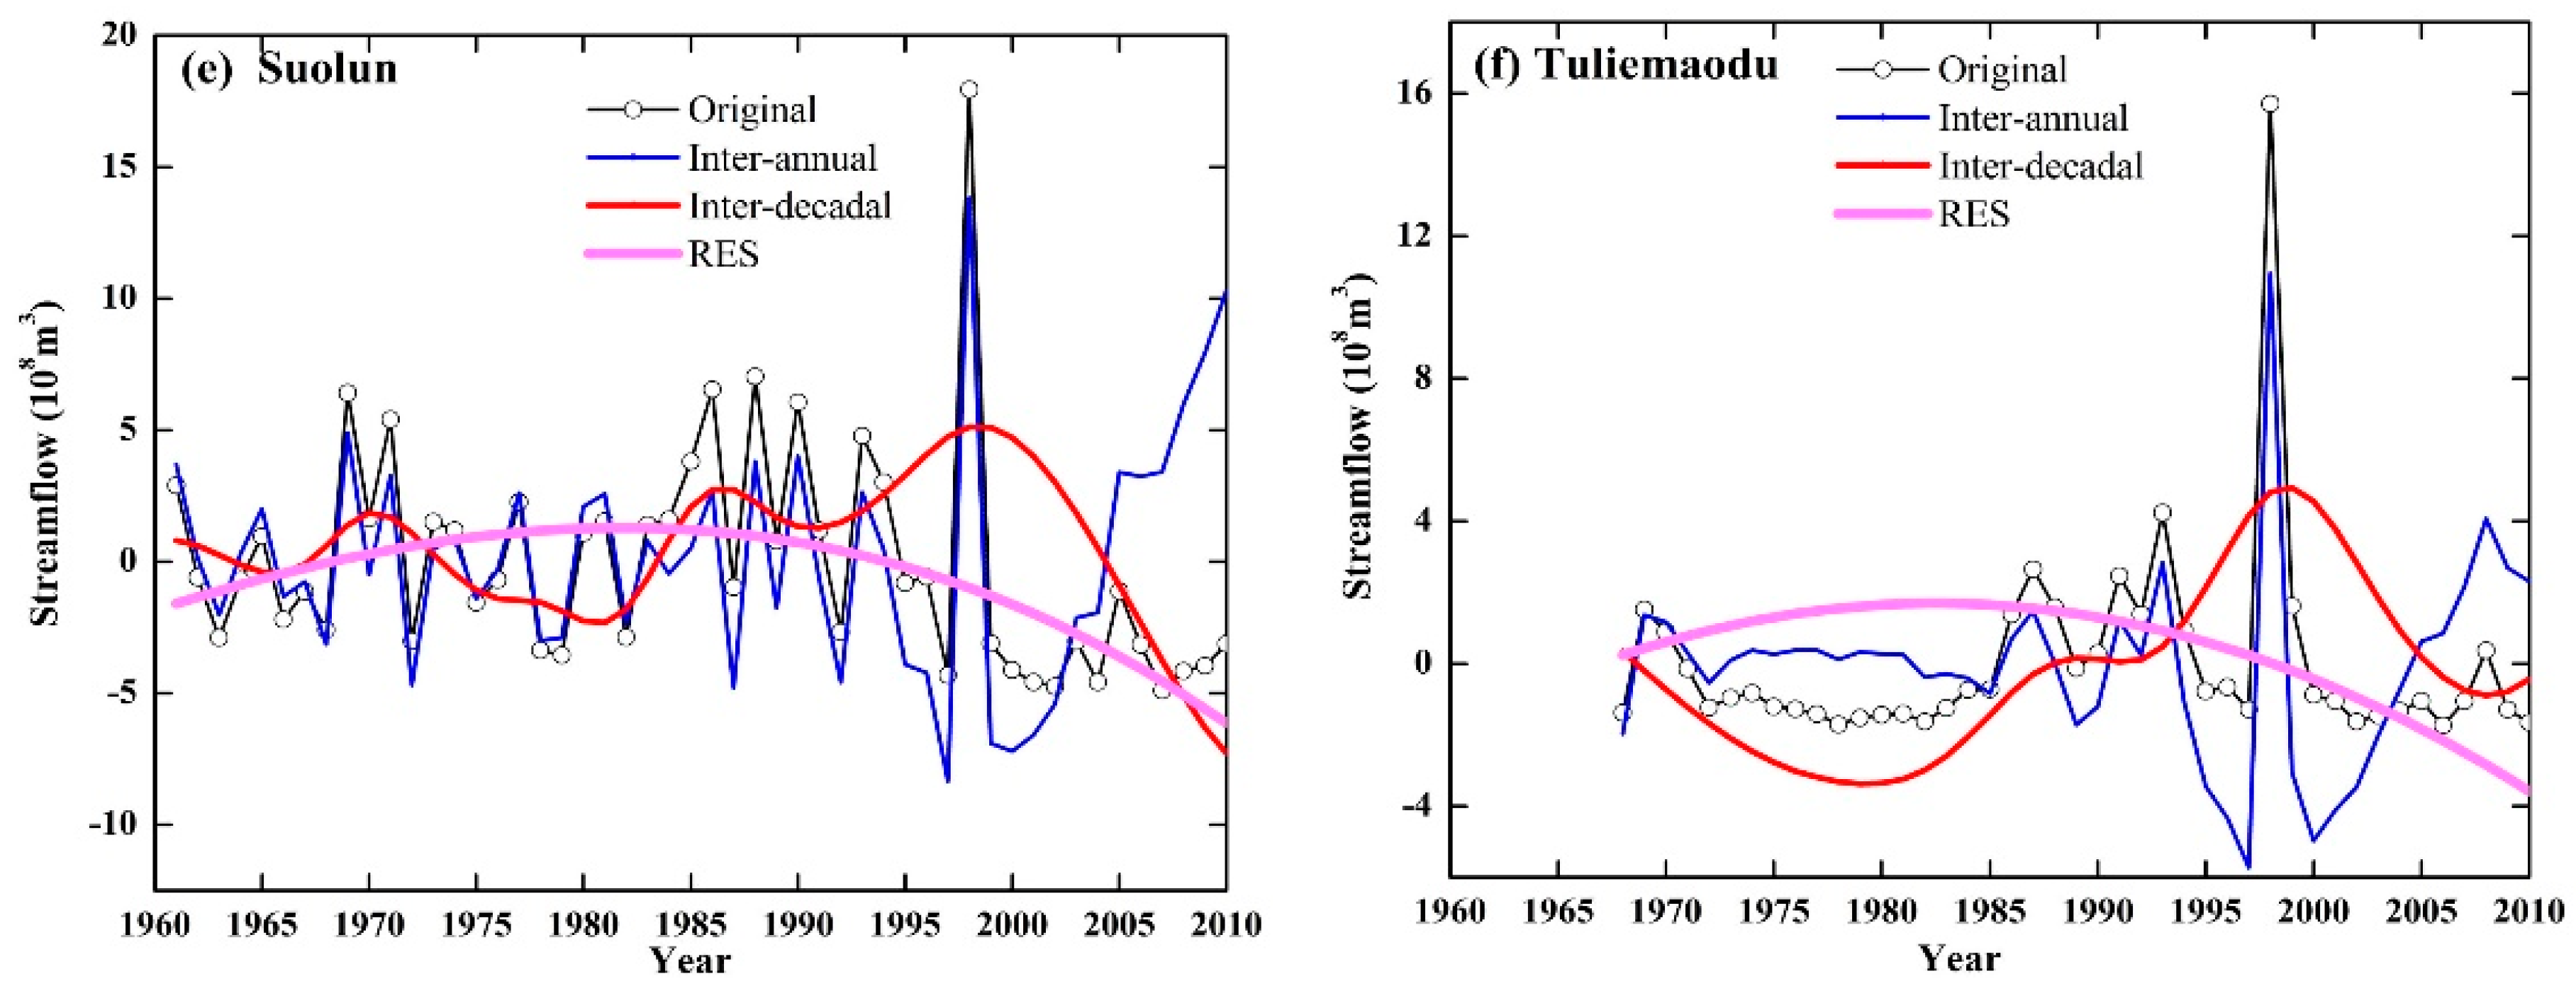
3.1. Nonlinear Variations of the Streamflow in HANR

All six headwater areas showed a decreasing trend in annual streamflow from 1961 to 2010 (Figure 2), with varying magnitude, timing and fluctuation. The Beian (Figure 2a) and Shihuiyao stations (Figure 2b) had relatively low streamflow in two periods (1970–1985 and 1995–2010): Beian, starting from the late 1960s to mid-1980s; and Shihuiyao, from the mid-1990s to 2000s. Relatively high water periods occurred in the early or mid-1960s and mid-1980s until early 1990. However, the streamflow at the Xiaoergou (Figure 2c), Zhalantun (Figure 2d) and Suolun (Figure 2e) stations were relatively high during 1983–1994. The streamflow at Tuliemaodu (Figure 2d) was comparably high during 1969–1970 and 1986–1994, but was low during 1970–1984 and 1995–2010. In addition, 1998 witnessed an unusually high flow, causing flood stage at the Xiaoergou, Zhalantun, Suolun and Tuliemaodu stations. The five-year moving average and transformation between high and low water periods indicate that the streamflow anomaly varied with time nonlinearly and unstably. The Augmented Dickey–Fuller (ADF) unit root tests also suggest that annual streamflow of six headwater areas is non-stationary for all six stations (not shown here).
By applying the EEMD decomposition method, the annual streamflow anomaly at six gauge stations were decomposed into four IMF components and one trend component (denoted by “IMF1–4” and “RES”, respectively) in HANR for 1961–2010 (Figure 3). As is shown in Figure 3, each IMF component reflects frequency and amplitudes on streamflow variability: IMF1 has the highest frequency and largest amplitudes than the IMF components, which allows it to present inter-annual amplitudes (at two- or three-year time intervals) of the streamflow in HANR. When moving from IMF1 to IMF4, the frequency and amplitude degrade whereas the periodic increase obviously. RES plots deliver approximate nonlinear trends among six gauge stations during 1961–2010. RES showed a decreasing trend at the earlier stage while an increasing trend at the later stage at the Beian. However, an opposite trend was found at other stations (Figure 3b–f).
Figure 4 demonstrated the reconstructed IMF1 + IMF2 (inter-annual variations) and IMF3 + IMF4 (inter-decadal variations) sequences plus RES (overall trend) component decomposed by EEMD method from original streamflow anomalies at six gauge stations. The reconstructed inter-annual sequences, basically coinciding with the variation trend of original streamflow anomaly series, can portray the fluctuations of the original runoff anomaly series in the study period, which illustrate that the inter-annual oscillations play an important role in the overall streamflow variation of six sub-basins in HANR. Beian and Shihuiyao, to some extent, shared similar inter-decadal patterns during the high-flow periods (1960–1971 and 1983–1995) as well as during the low-flow periods (1975–1980 and 2000–2010). However, the amplitude of the streamflow at Shihuiyao on decadal scales were much larger than Beian’s. For the four stations, the amplitudes of the reconstructed inter-decadal signals were flatter before of extreme hydrological events happened in later period (Figure 4c–f). The streamflow in HANR’s six sub-basins has a 3–4-year period.
The RES component reflects nonlinear trend at six gauge stations between 1961 and 2010: strong decreasing-slight rising in Beian, strong rising-slight decreasing in Shihuiyao, slight rising-strong decreasing in Xiaoergou and Zhalantun, slight rising-strong decreasing in Suolun and slight rising-strong decreasing in Tuliemaodu (Table 3). Table 2 and RES plot in Figure 3 also reveal a transition year for each sub-basin, i.e., 1990 at Beian, 1991 in Shihuiyao, 1982 at Xiaoergou, 1970 at Zhalantun, 1992 at Suolun and 1984 at Tuliemaodu. A signal transition between an increment and a decrement actually reflects a transition in streamflow between high level and low over a longer time scales. A larger decrement (from 3.29 to −1.31) before 1990 and smaller amplification (from −1.31 to 0.74) after that reveal the overall decreasing trend of streamflow in Beian (Figure 3a). Notably, the streamflow variation of Beian may change in a rising trend stage in future. However, the streamflow of other stations will continuously experience a decreasing trend. Moreover, the inter-decadal variation of streamflow has significant periodic oscillation. As shown in Table 2, the streamflow has the longest period in Beian and Shihuiyao (24.50 years), followed by Tuliemaodu (21.00 years), and by Zhalantun, Suolun and Xiaoergou (16.33 years).

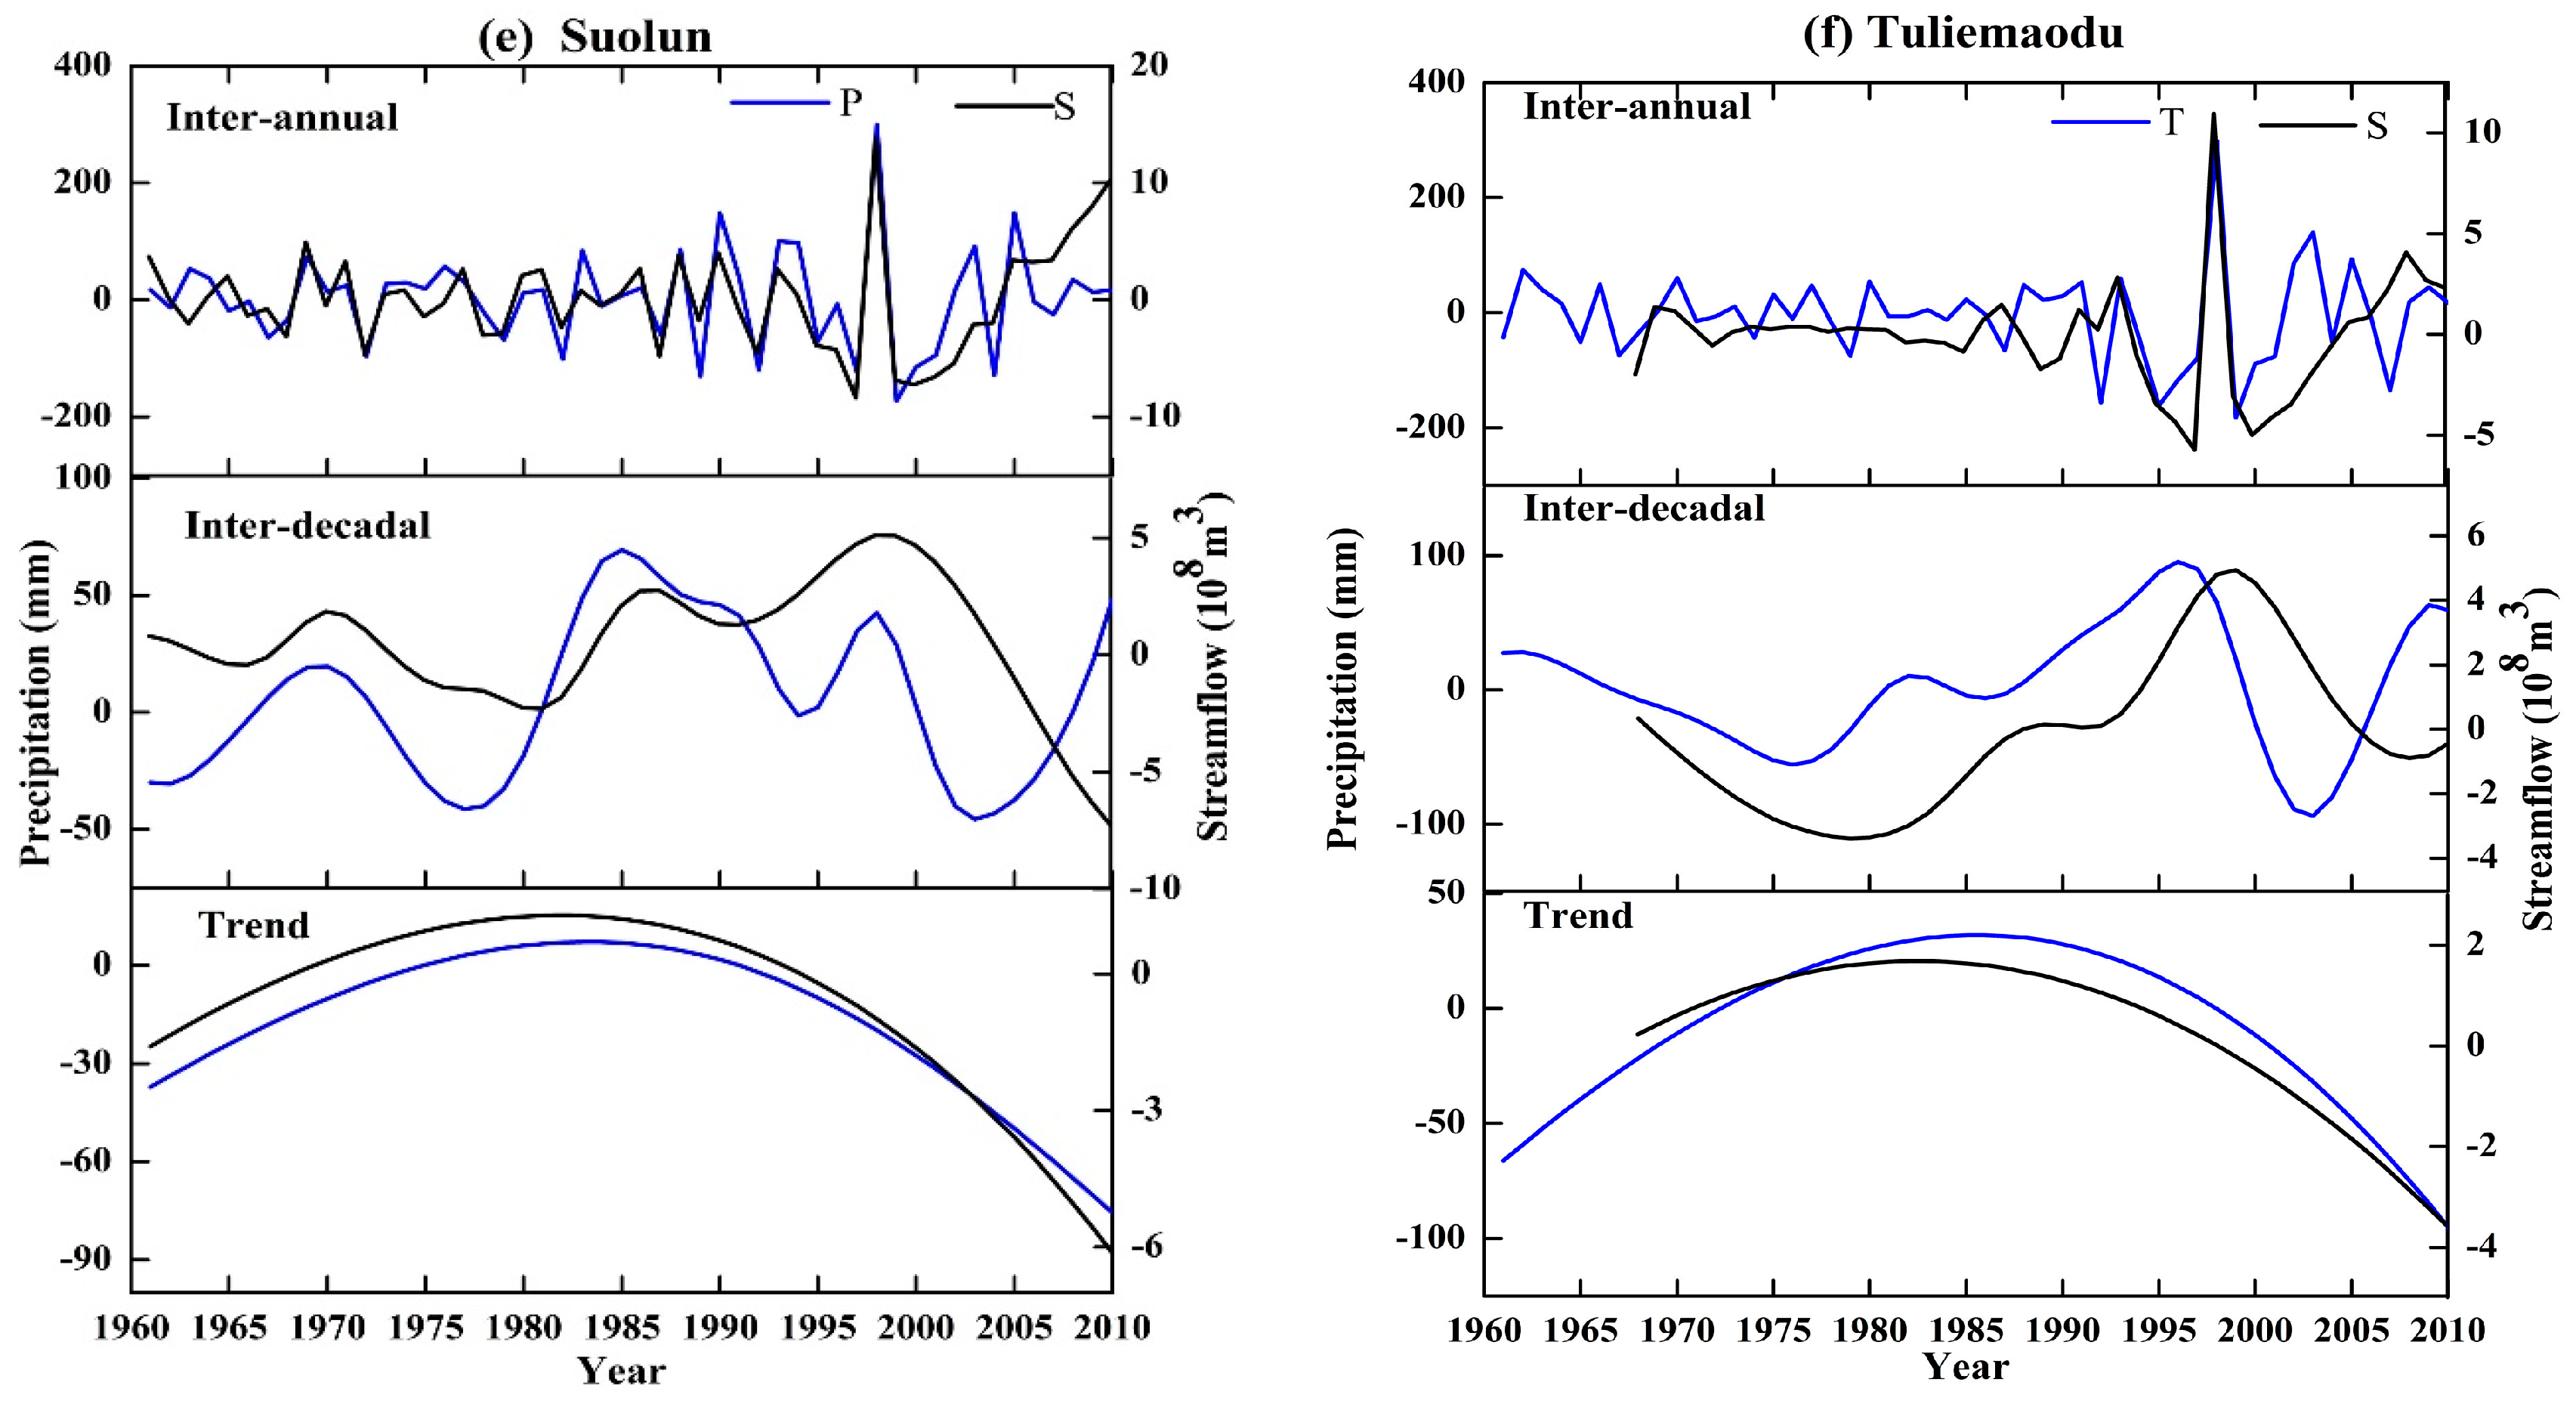
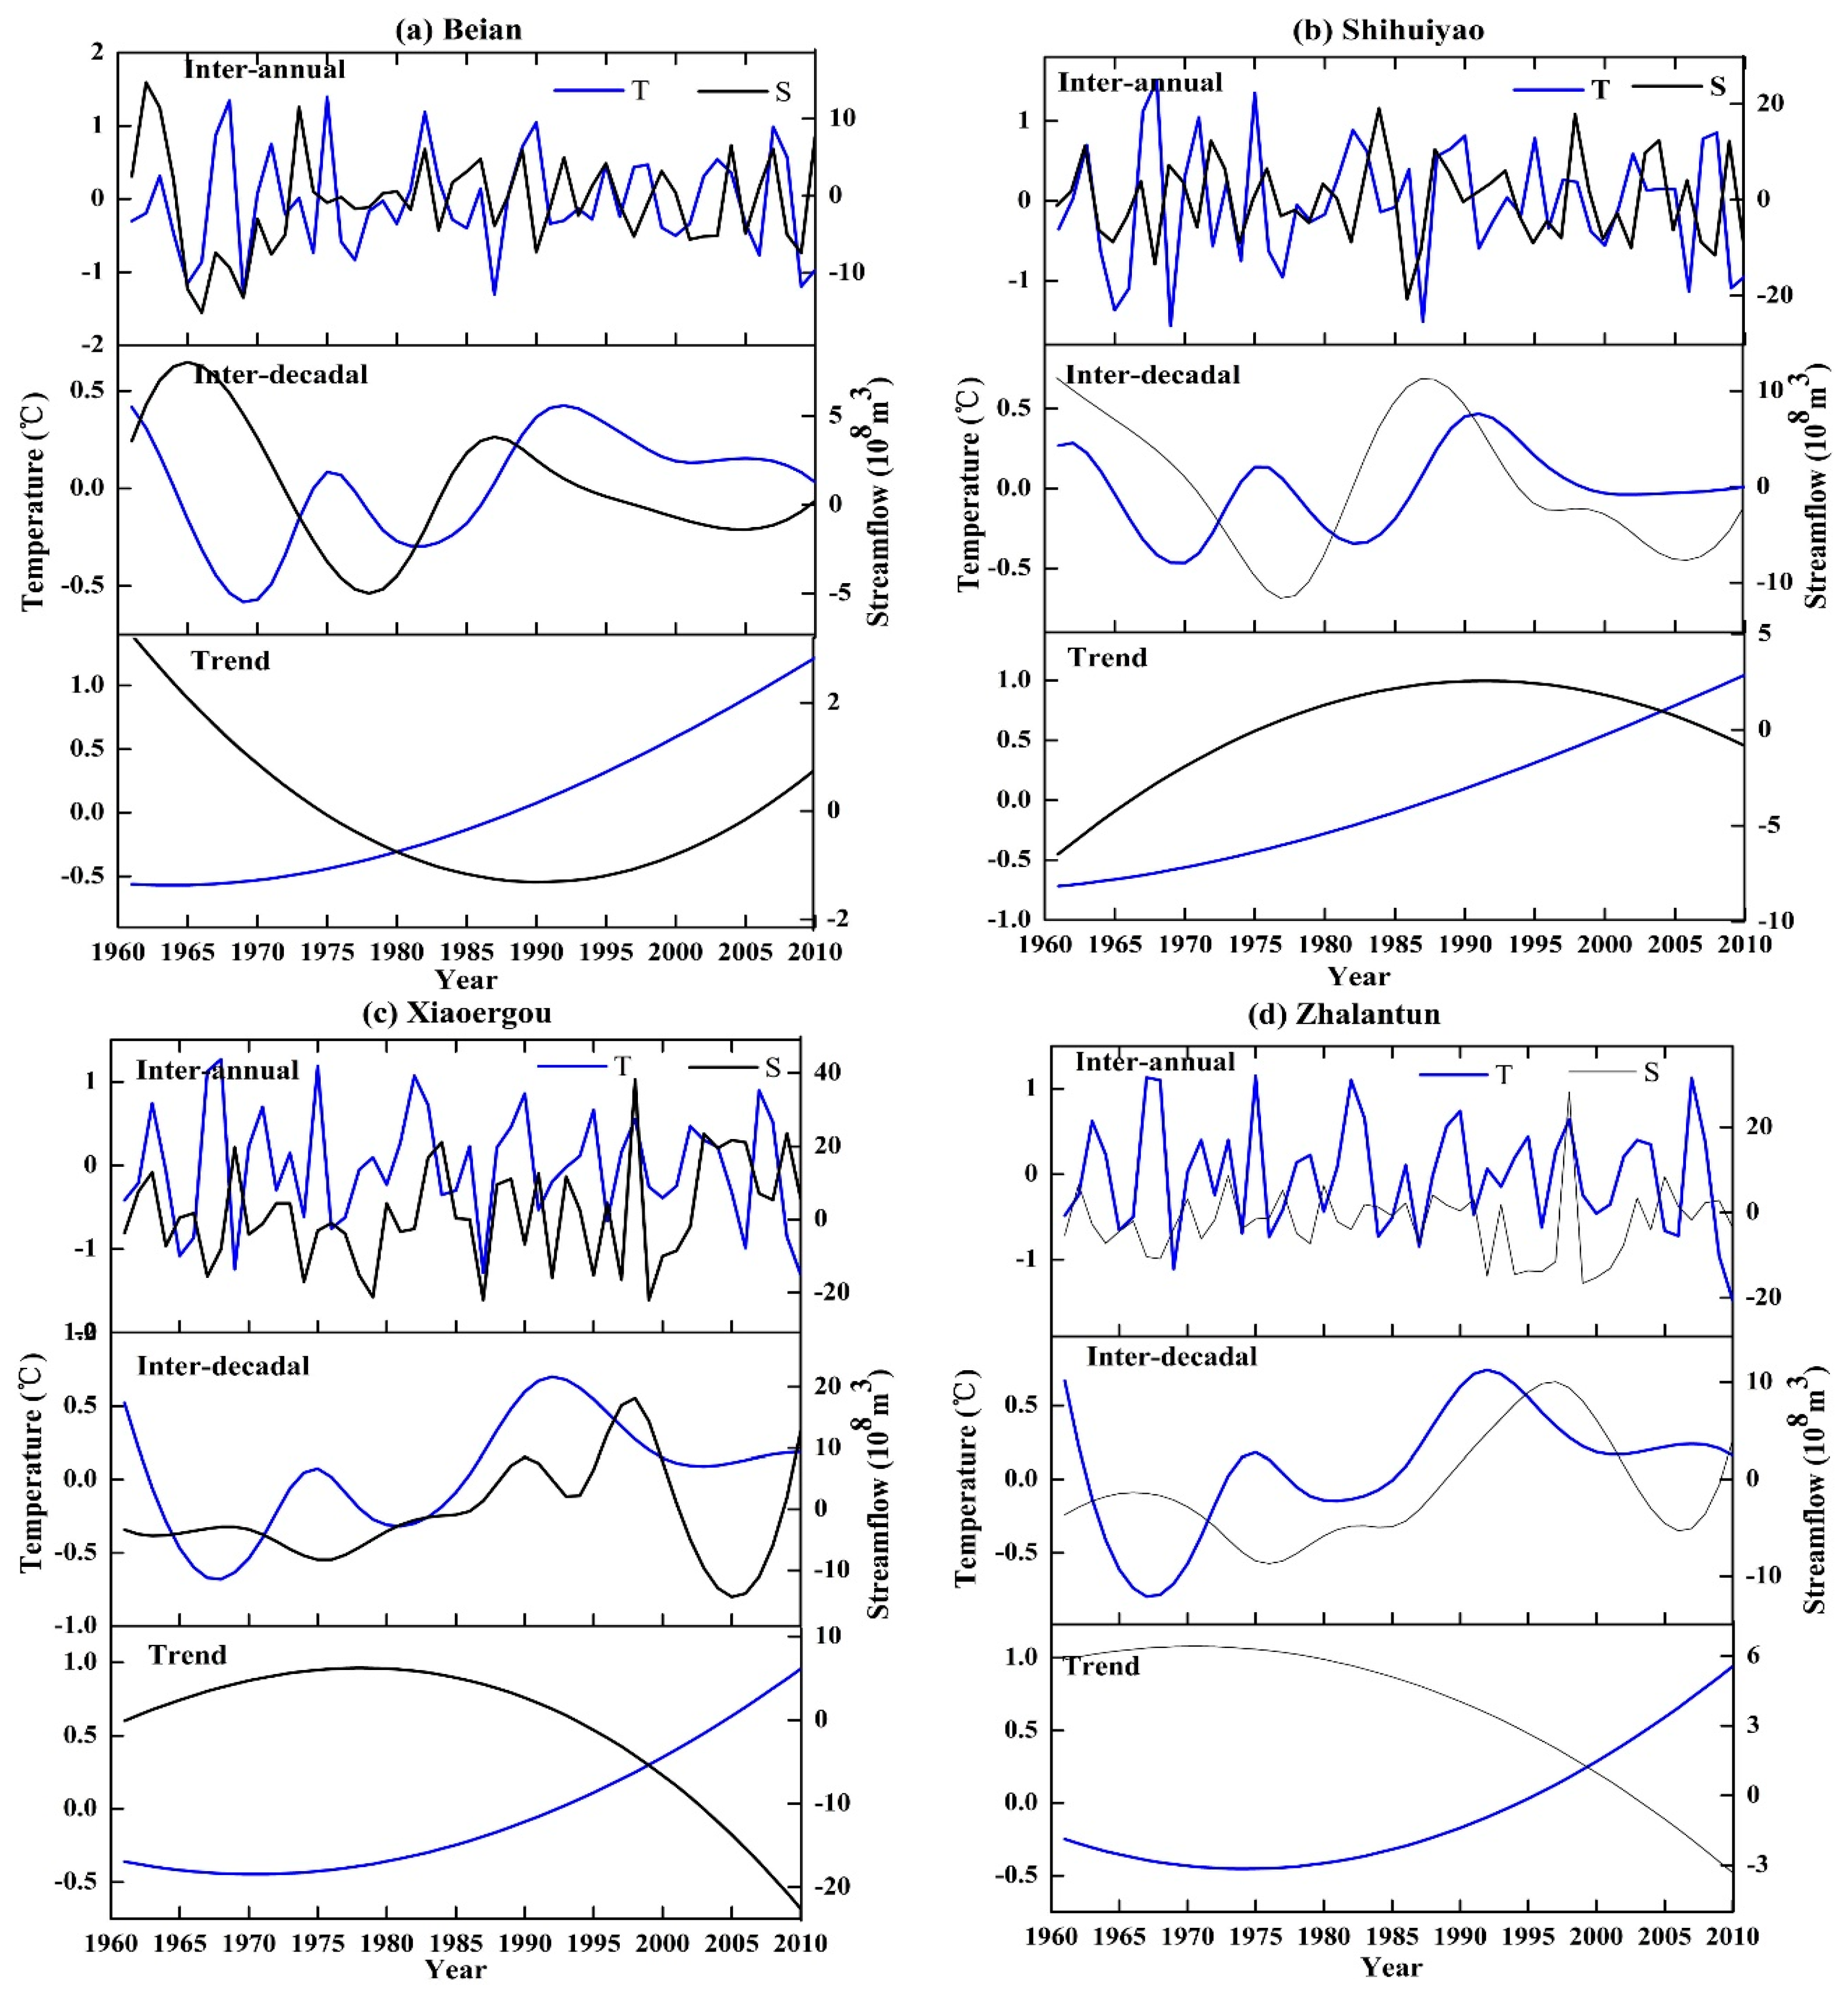
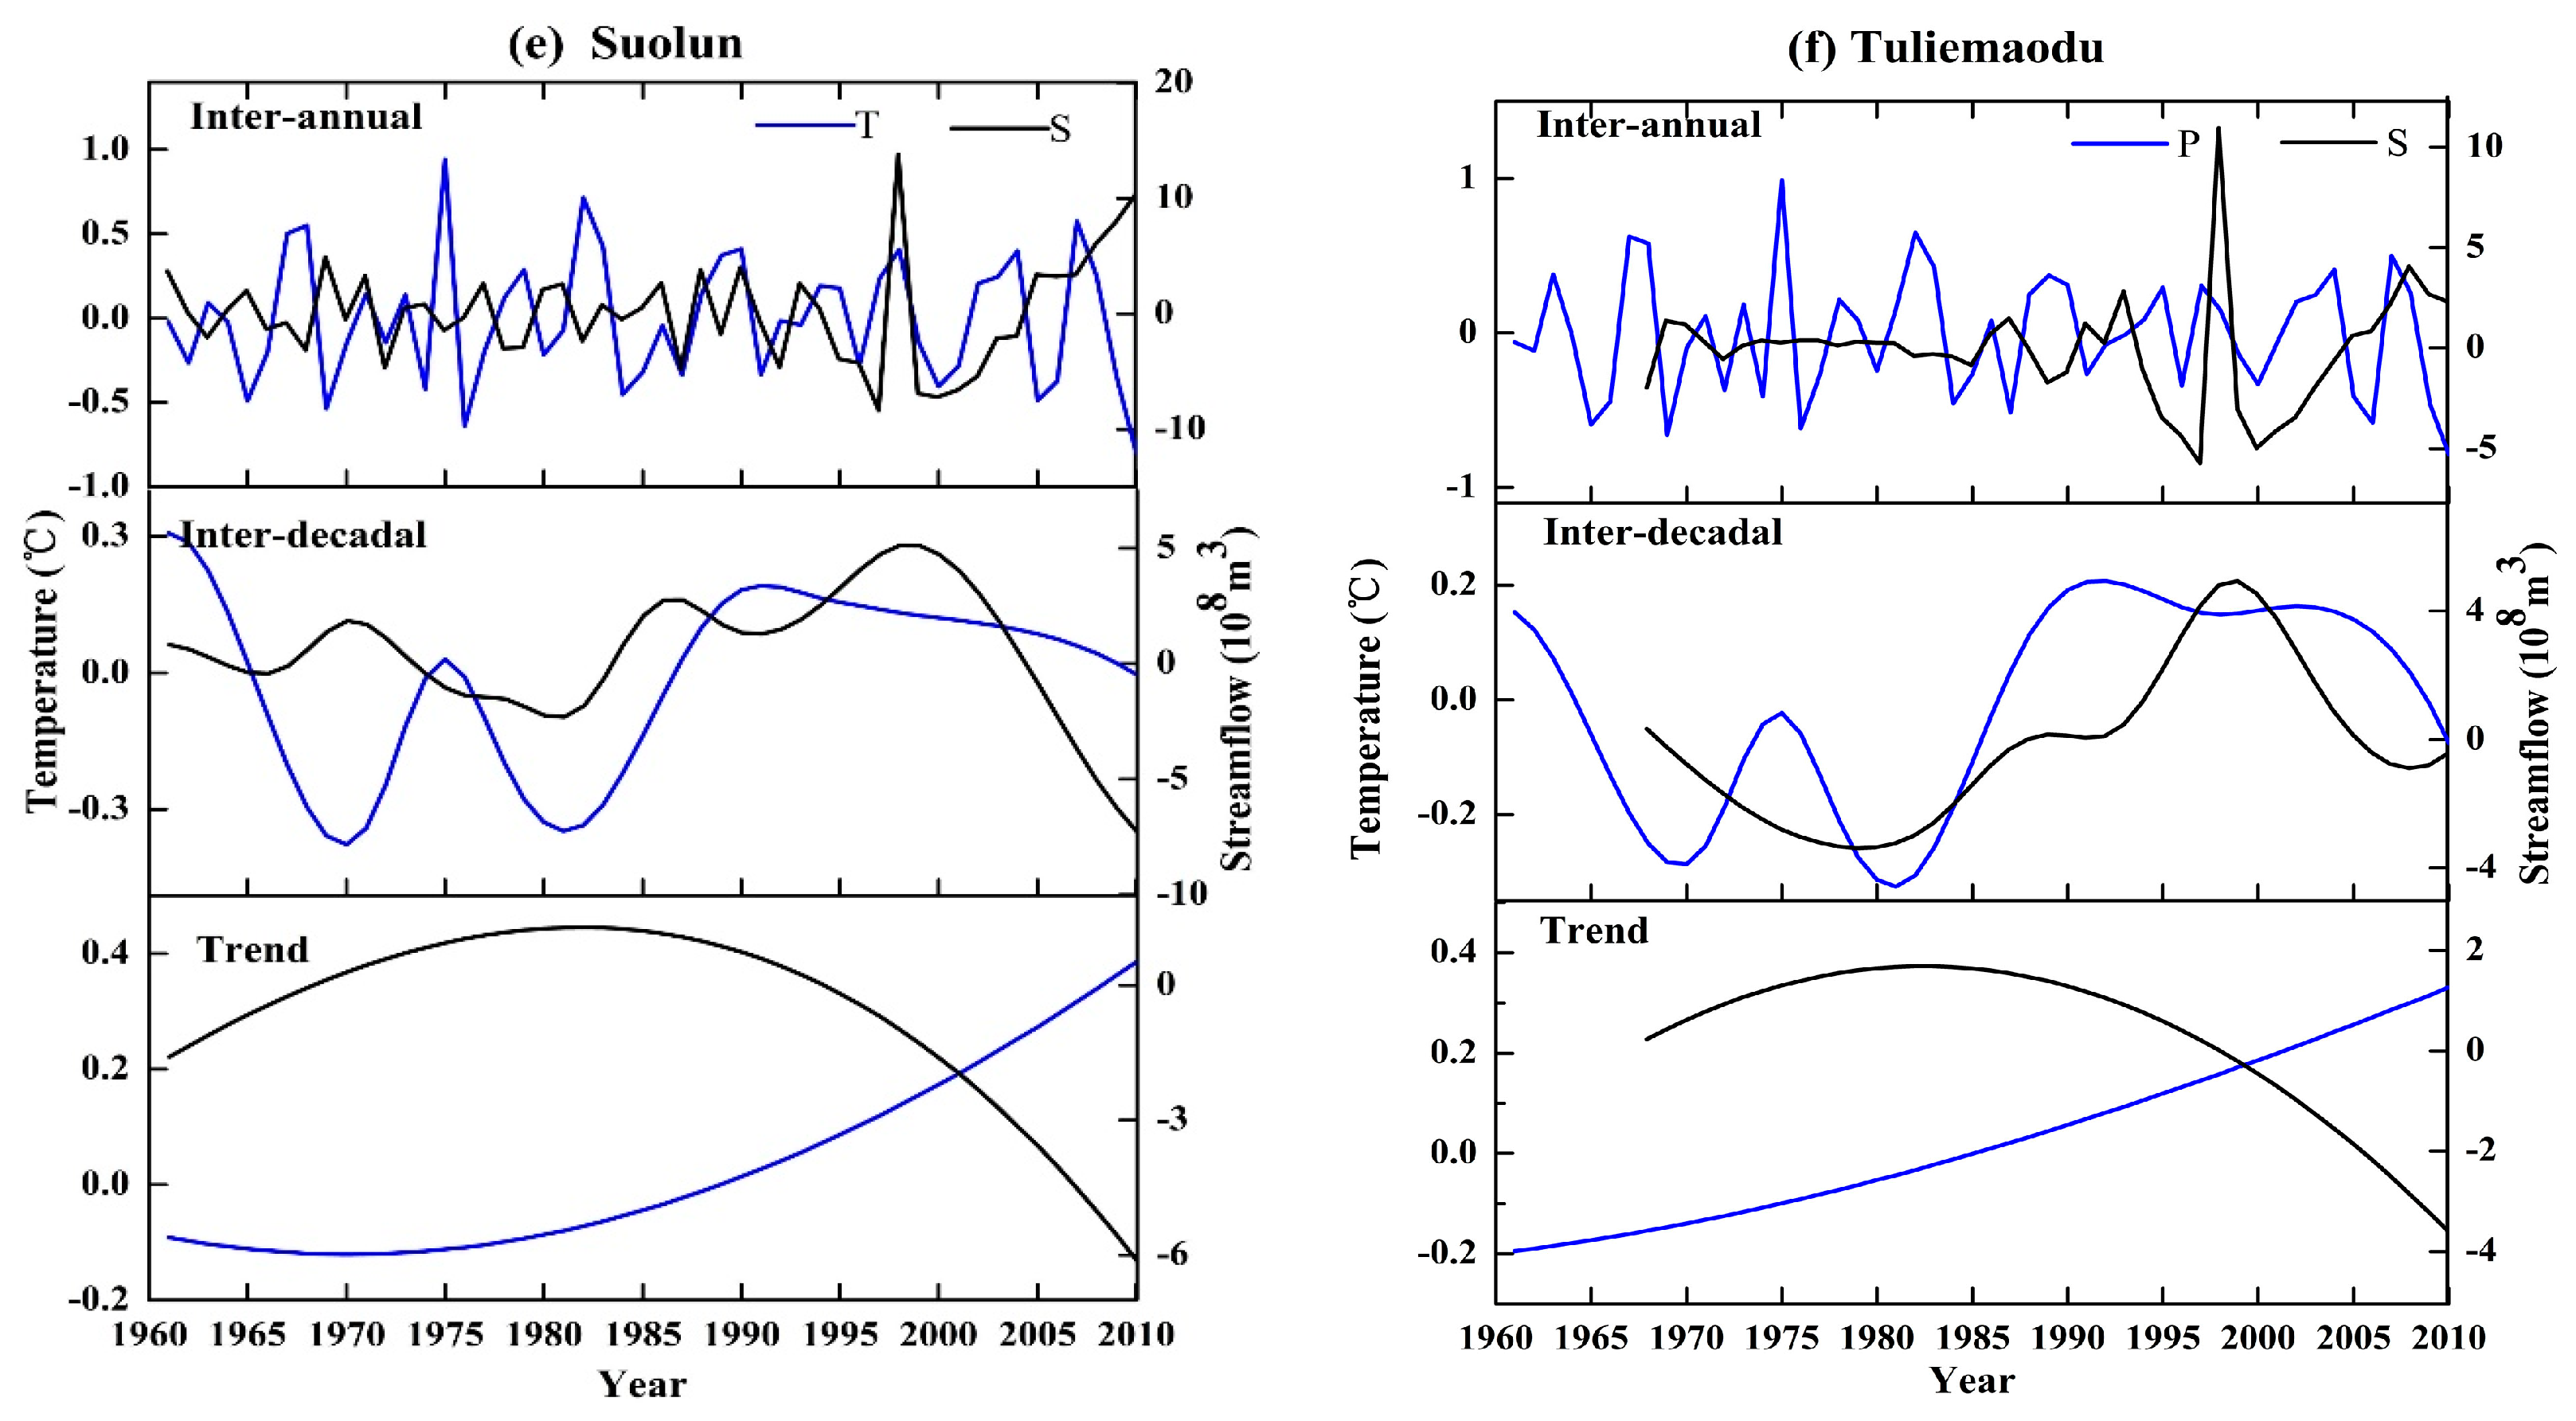
3.2. Multiscale Response of Streamflow to Temperature Variations

As depicted in Figure 5, six gauge stations all showed an overall increase (see “Trend” panel) in temperature and approximate quasi-periodicity (see 1st and 2nd panels). Moreover, the temperature signals share similar patterns with streamflow at inter-annual and inter-decadal scales at six gauge stations. Compared with the variations in temperature at six gauge stations, their streamflow has complicated in-phase and anti-phase alternatively at inter-annual time steps. The streamflow has the periods ranging from 3.06 to 3.82 years, which roughly coincides with the periods temperature’s ranging between 3.27 and 3.76 years (Table 2). For inter-decadal variation, the streamflow shows an obvious in-phase response before 1980 and anti-phase after 1980 to temperature at Beian, Shihuiyao, Xiaoergou and Zhalantun. With respect to the periodic oscillations, the streamflow at Xiaoergou, Zhalantun and Suolun showed a similar value (i.e., 16.3 years) against the temperature’s (16.3 years), but not at Beian and Shihuiyao and Tuliemaodu (Table 2). According to Figure 5 and Table 3, the streamflow and temperature can be divided into three patterns: (1) whole anti-phase at Xiaoergou, Zhalantun and Suolun; (2) anti-phase to in-phase at Beian; and (3) in-phase to anti-phase at Shihuiyao and Tuliemaodu. However, the transition year of trend variation of streamflow and temperature are different.

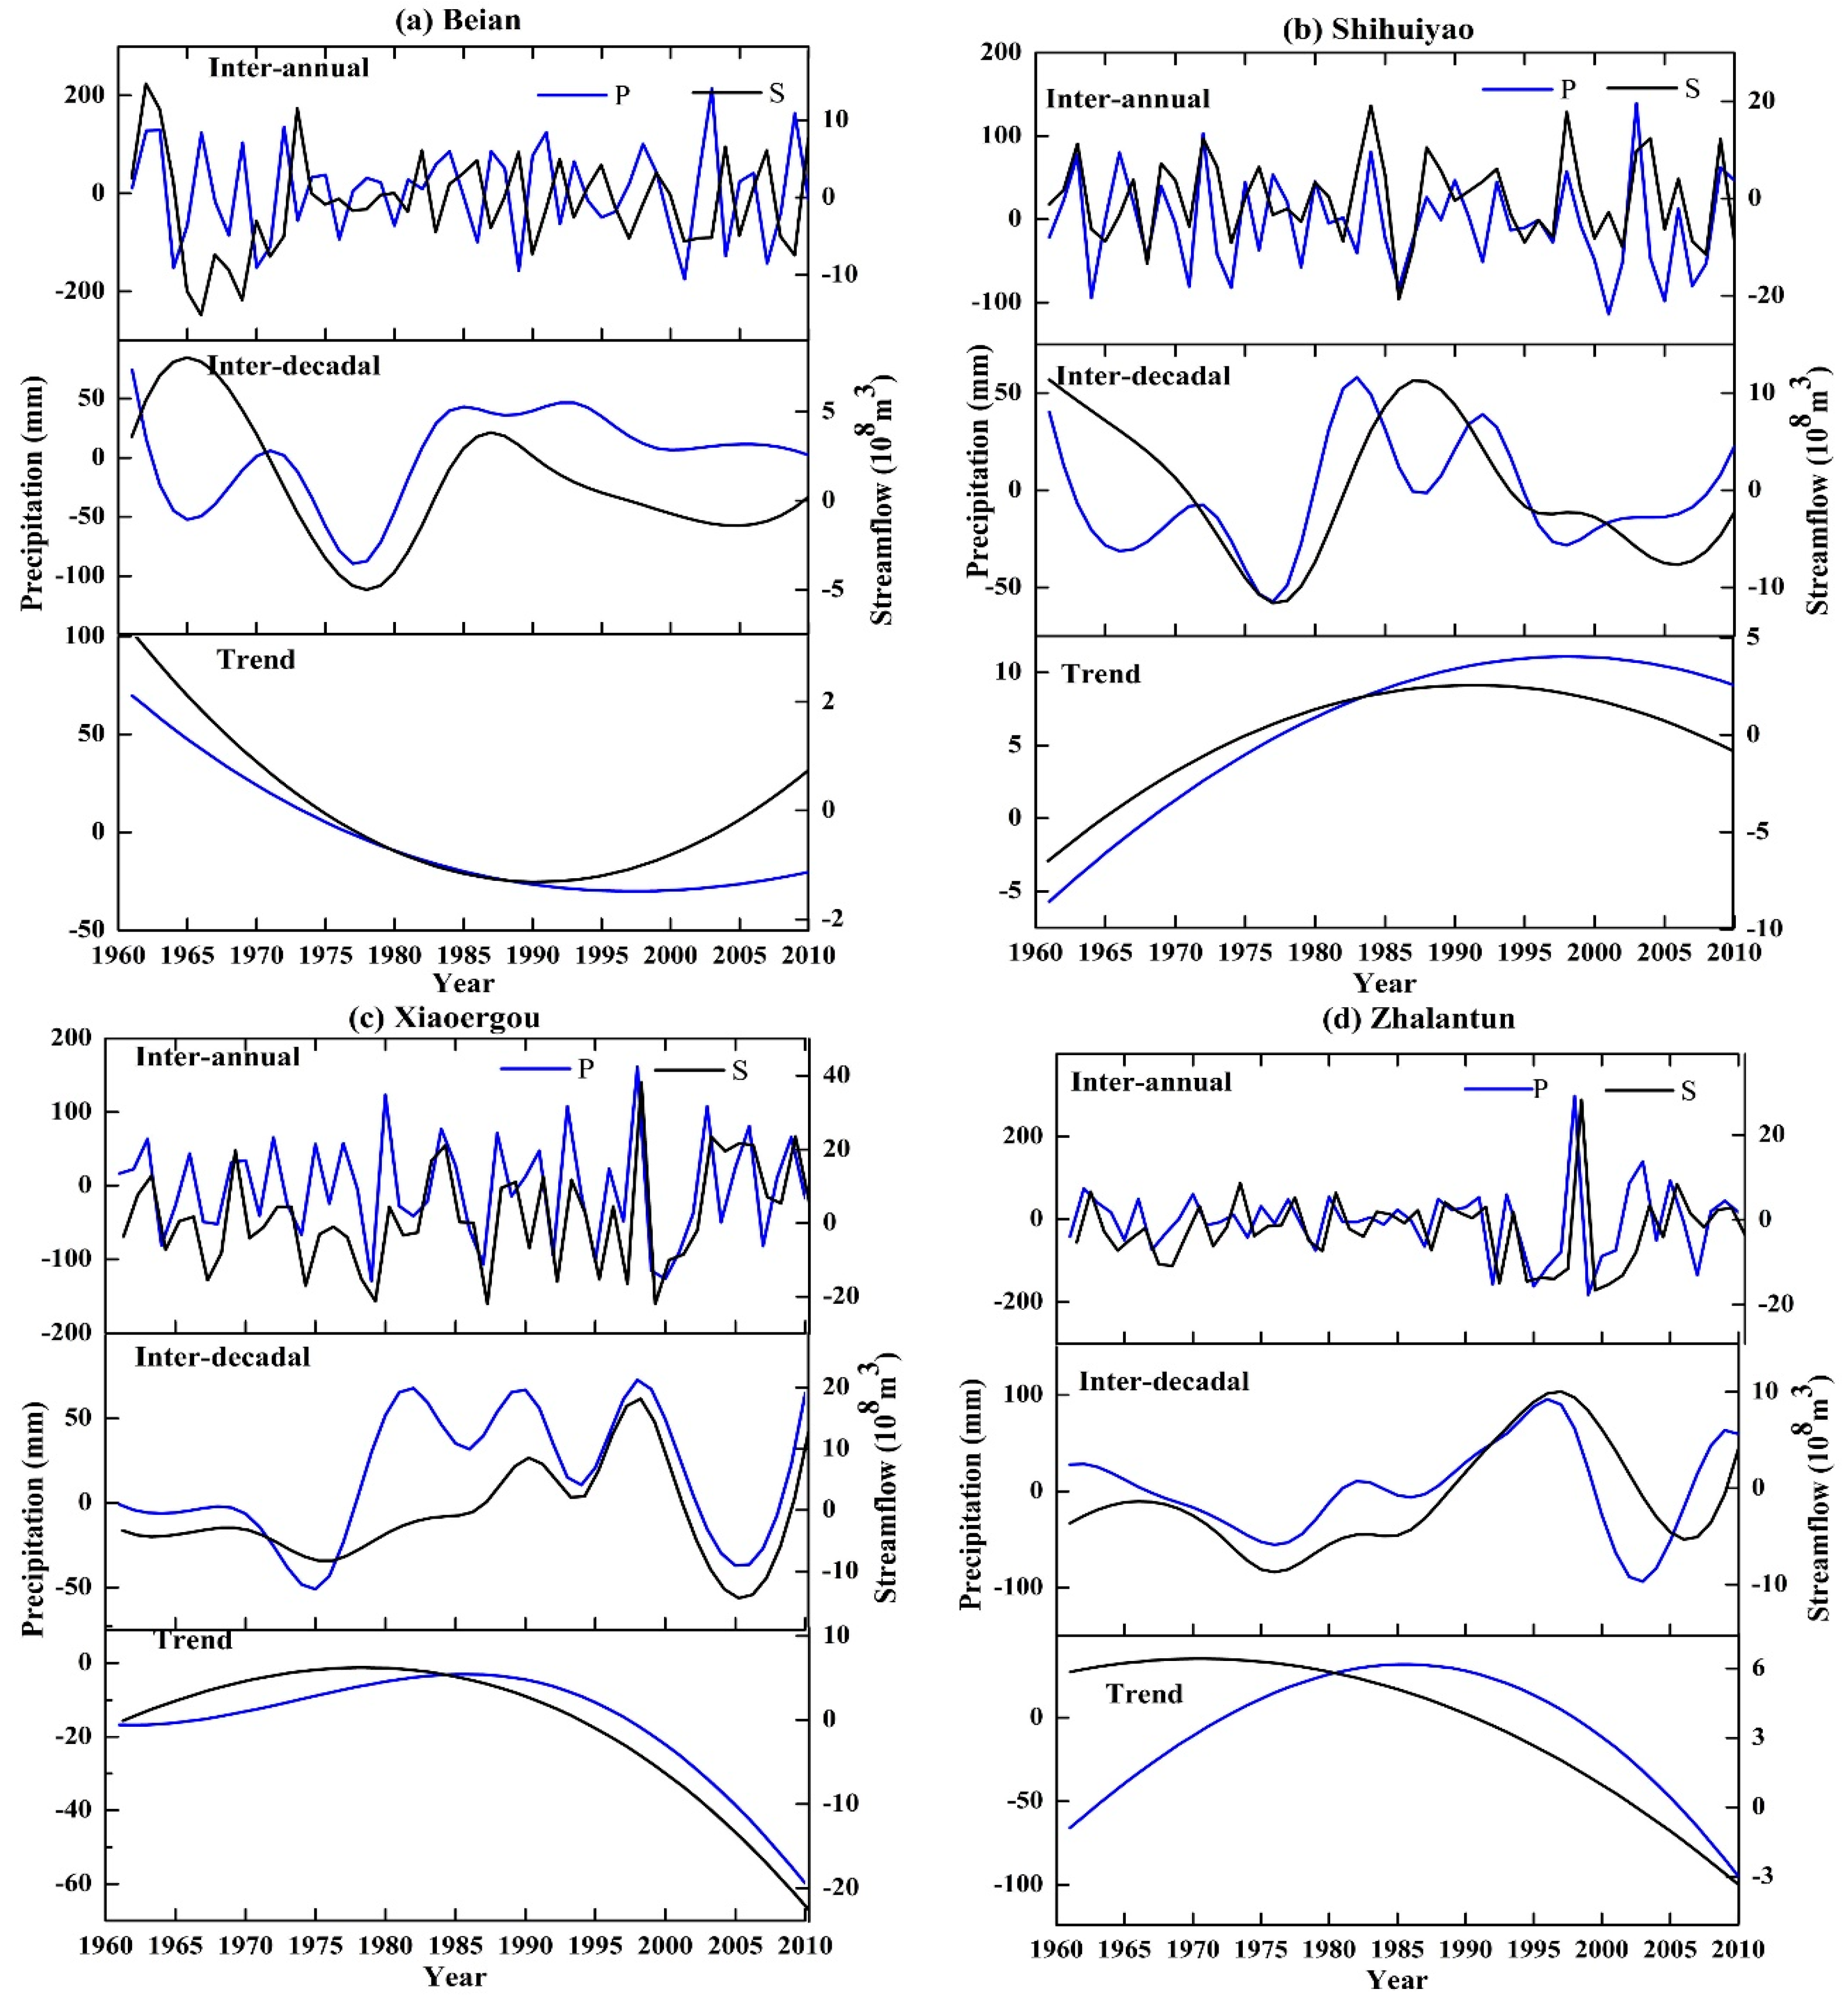
3.3. Multiscale Response of Streamflow to Precipitation

Overall, the precipitation shows an increasing to decreasing trend at all gauge stations during 1961–2010, against an opposite trend at Beian (Table 3 and Figure 6). The precipitation at six gauge stations has an inter-annual periods ranging from 2.88 to 3.27 years, which is similar to the values of 3.06 to 3.82 in streamflow (Table 2). When comparing to inter-decadal periods of precipitation, Suolun has 16.33 years in streamflow and longer periods at remaining gauge stations. Moreover, the streamflow reveals some similar inter-annual patterns (in-phase) with the precipitation at most gauge stations except for Beian (Figure 6a) in 1960s, mid-1980s and 2000s. The trend patterns of precipitation show a consistence with non-liner trend in streamflow at six gauge stations. Note that, although both streamflow and precipitation presented similar nonlinear characteristics in trend, the streamflow have earlier transition years than precipitation’s (except Suolun). From the analysis above, precipitation likely plays a major role in variation of streamflow in HANR.

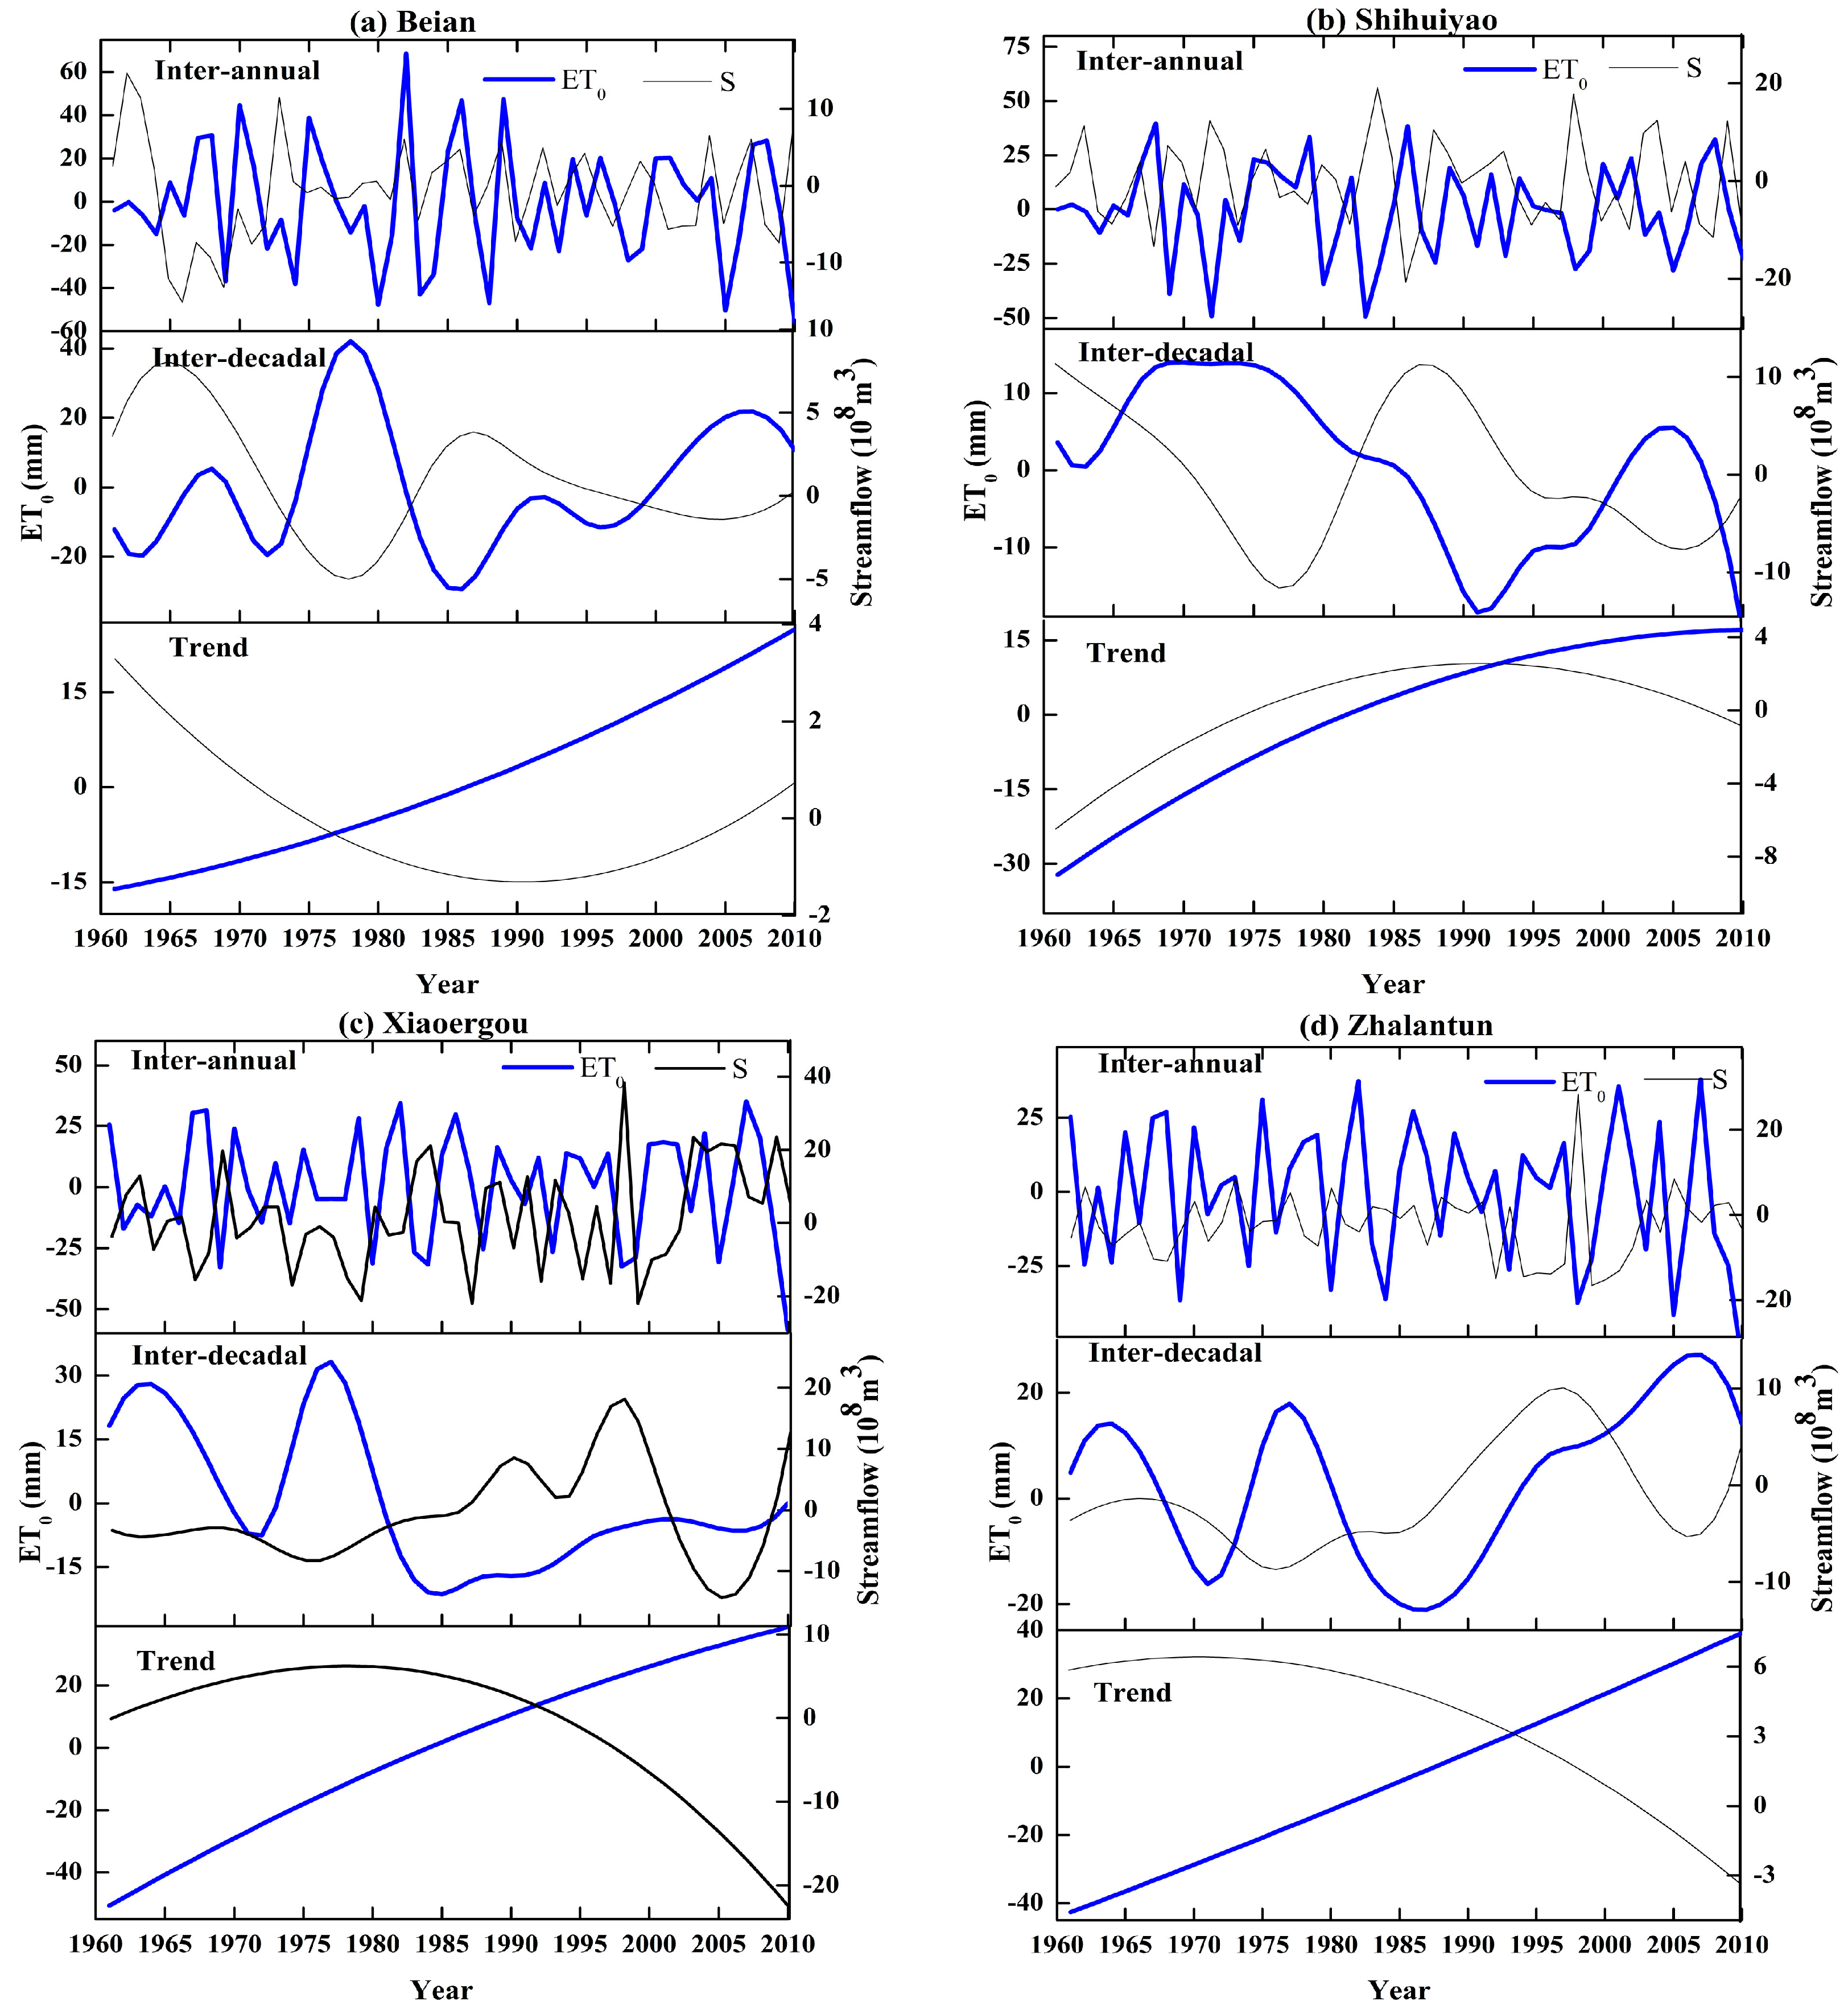
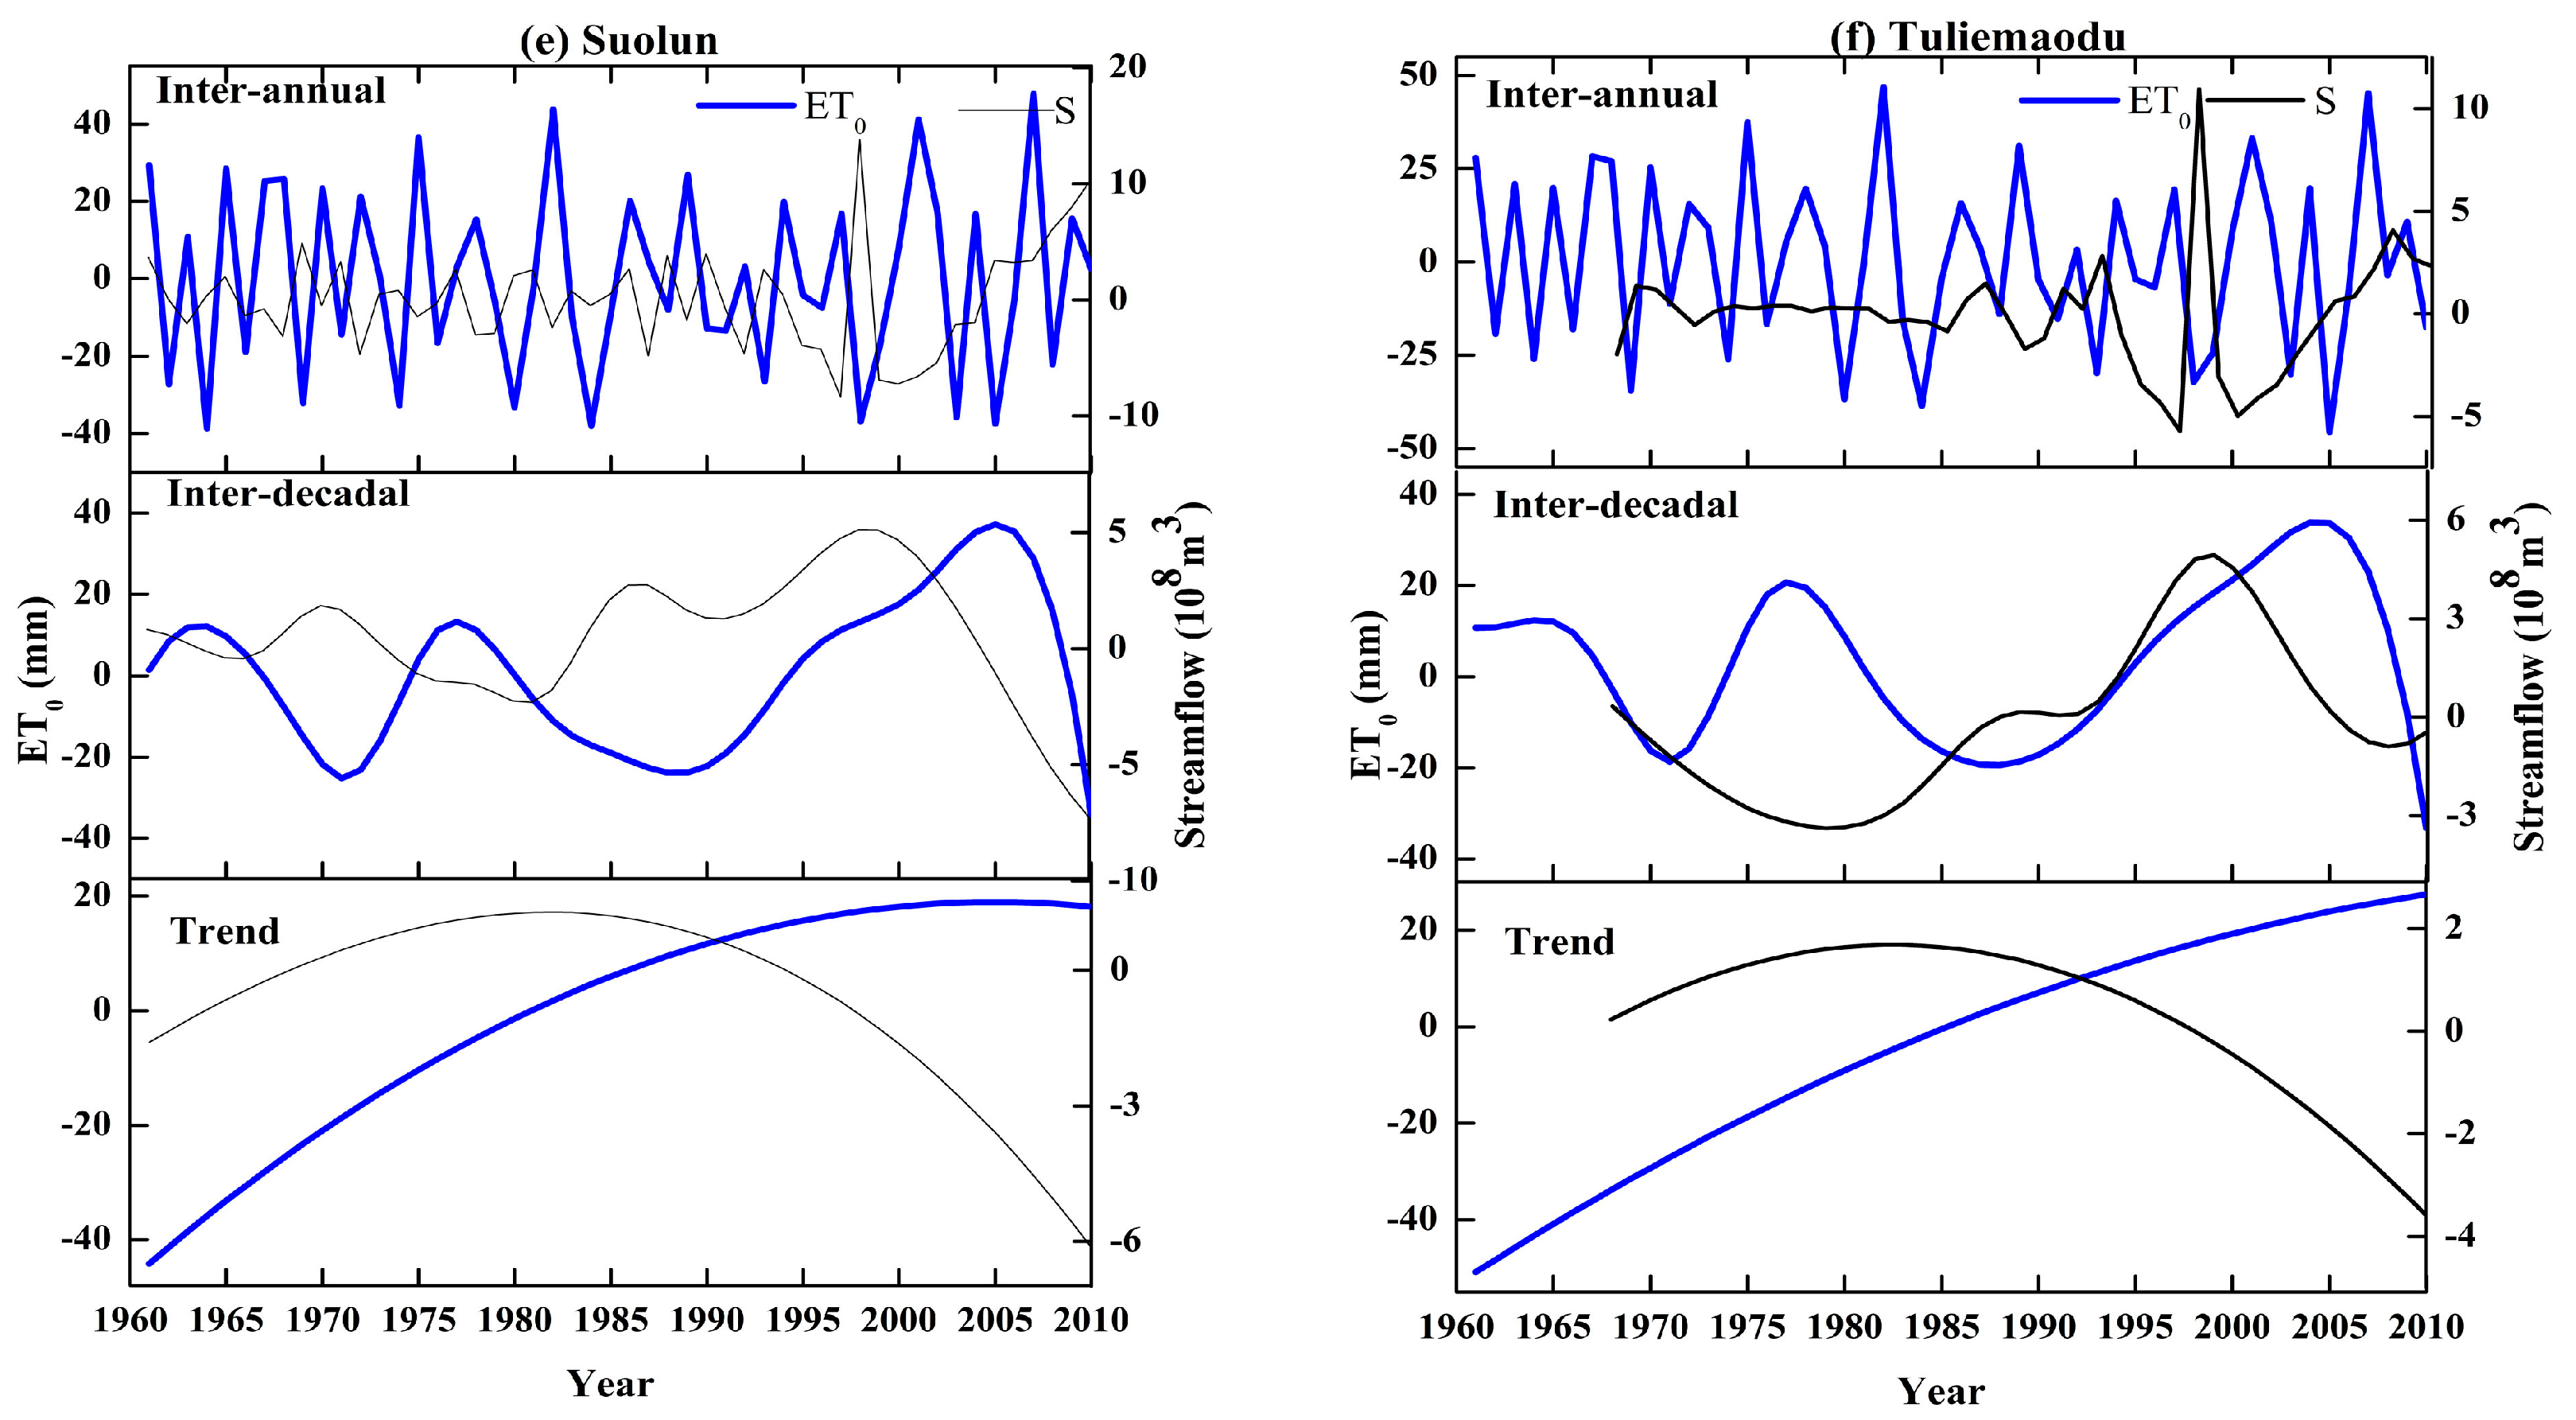
3.4. Multiscale Response of Streamflow to ET0 Variations

Over the past 50 years, ET0 in the six headwater areas of HANR showed an overall increasing trend with inter-annual periods ranging from 2.88 to 3.06 (Figure 7 and Table 2). The streamflow varied with ET0 from in-phase to anti-phase at inter-annual scales. At inter-decadal scales, the streamflow shows an anti-phase with ET0, especially at Shihuiyao, Xiaoergou, Zhalantun and Suolun with a period of 16.33 years. The streamflow has a longer change period than ET0 at Beian and Tuliemaodu, which could be expected because ET0 has less contribution on the change in streamflow. Overall, the trend of ET0 at six gauge stations all experienced a transition from a relative larger to smaller stage in mid-1980s. Moreover, streamflow response to ET0 in following patterns: from anti-phase to in-phase at Beian, in-phase to anti-phase at Shihuiyao, Xiaoergou, Zhalantun, Suolun and Tuliemaodu. However, the transition year of ET0 at Suolun is not obvious, with a strong increase to slight decrease in 2005.

4. Discussion

This paper investigated nonlinear response of streamflow to temperature, precipitation and potential evapotranspiration in the HANR. Instead of performing a traditional method, we focus on nonlinear and nonstationary characteristics of hydro-meteorological variables based on ensemble empirical mode decomposition method. We found that the response of streamflow to climate change is a nonlinear dynamic process as well as a complicated inconsistence multiscale process. The temperature, precipitation, potential evapotranspiration as well as streamflow all exhibited obviously nonlinear characteristics. This is inconsistent with previous studies conducted by Feng et al. [26], Dong et al. [25] and Li et al. [21]. They only found that the streamflow showed a decreasing trend over the past 50 years. In addition, the trend component of streamflow reveals that the change trend of Shihuiyao (Figure 4b) has a transition year in 1991 (strong rising to slight decreasing), which is inconsistent with previous studies conducted by Dong et al. [25] who found two change points (1975 and 1981) based on the non-parametric Pettitt test and Li et al. [21] who detected an abrupt change in 1990 based on Mann–Kendall test. Probably, this is because the trend component focuses on changing process, while the non-parametric Pettitt test and Mann–Kendall test mainly consider rapid change from a statistic characteristic to another. In addition, the test only can assess the statistical significance of trend, but cannot determine its specific shape, no matter the trend is linear or nonlinear [33]. Hence, nonlinear analysis of hydroclimatic variables can capture more information about change characteristics than traditional statistical methods (e.g., non-parametric Pettitt test and Mann–Kendall test).
It should be noted that the temperature and ET0 showed strong nonlinear rising trend, while the streamflow and precipitation experienced nonlinear decreasing trend, which indicated a warm-drying trend in HANR. Yu et al. [34] showed that drought events has become ever more serious both in severity and in extent during the crop-growing season in recent decades over Northeast China. Moreover, wetlands have great sensitivity and vulnerability to the changes in water resources [26,35,36]. The warm-drying trend has contributed to considerable wetland degradation and agricultural hazards in Northeast China [37]. The continue decreasing in streamflow may possess a large pressure on surface and subsurface water resources [38,39,40]. This calls for more authority basin-wide regulations to manage water resources to meet the balance among agricultural sector, ecosystem and domestic water utility.
There are some uncertainties in this study because many other factors can directly or indirectly impact on the response of streamflow to climate change. Here, we only analyzed temperature, precipitation and potential evapotranspiration without consideration of spatial heterogeneity at the watershed and sub-watershed scales [41]. Changes in land use/cover is a crucial factor triggering spatiotemporal variability in hydrologic regulation services of ecosystem [41,42]. Hydrologic regulation is a significant component of watershed services, and exerts a dynamic force on hydrological circulation and processes that form an ecosystem, leading to temporal and spatial changes in precipitation-streamflow relationship and water distribution [43]. For example, the catchment of Shihuiyao Gauge Station (G1 in Figure 1) are primarily covered by forests and wetlands. Wetlands and forests provide important hydrological services including storage and slow release of water, flood mitigation and low flow support, which can alter the response of streamflow regimes to climate change [44,45,46].
Extensive and widespread seasonally frozen and permafrost soils exist in the HANR, which is essential to preserve the water resources and streamflow generation. However, frozen soil experienced a significant degradation trend coupled with a significant climate warming [47,48]. Due to warmer temperature, the increase in active layer thickness of permafrost has two effects on hydrological processes as well as the response of streamflow to climate change: (1) more water for evaporation and hence fewer water yield for streamflow; and (2) more water storage in the soil layers and less surface streamflow generation. Although it is accepted that climate change is one of the major drivers for hydrological changes, the effects of permafrost degradation on runoff processes are poorly understood and remain controversial. Thus, more studies are need to address on the question what extent permafrost degradation might impact streamflow changes in the HANR.

5. Conclusions

This study investigated the nonlinearity of streamflow and its responses to changes in temperature, precipitation, and the corresponding evapotranspiration at the multiple time scales. An Intrinsic Mode Function approach with EEMD was applied to identify the inherent changing patterns and trends at multiple time scales to examine the nonlinear response of streamflow to hydroclimatic variables. We found that, from 1961 to 2010, streamflow, temperature, precipitation and potential evapotranspiration showed apparent multiscale change characteristics, i.e., inter-annual scale (around three-year periodic), inter-decadal scale (around 12-, 16- and 24-year periodic) and nonlinear change trend. The comparatively analysis revealed that streamflow showed corresponding consistent variation characteristics with precipitation, while streamflow experienced a slight consistent different variation change characteristic with temperature and evapotranspiration initially and intensified inconformity variation change characteristic afterwards. The findings suggest that the response of streamflow in headwater regions to climate change is a nonlinear dynamic process dictated by precipitation at the decadal scale and modified by temperature and evapotranspiration within a decade. The results provide insights into how headwater hydrometeorology variables vary at different time scales and how dynamic response processes of streamflow to climate change.

Acknowledgments

This work was supported by National Key Research Project (2017YFC0406003), National Basic Research Program of China (No. 2010CB428404), the Featured Institute Project 4, the Northeast Institute of Geography and Agroecology (IGA-135-05), the National Natural Science Foundation of China (No. 41371108) and the CAS/SAFEA International Partnership Program for Creative Research Teams. We thank all members of our Hydrology and Water Resources Research Group.

Author Contributions

All authors contributed to the design and development of this manuscript. Yanfeng Wu carried out the data analysis and prepared the first draft of the manuscript; Guangxin Zhang is the advisor of Yanfeng Wu and contributed many ideas to the study; and Hong Shen and Y. Jun Xu provided many important advices on the concept of method and structuring of the manuscript, as well as edited the manuscript prior to submission and during revisions. All authors read and approved the final manuscript.

Conflicts of Interest

The authors declare no conflict of interest.

References

  1. Donat, M.G.; Lowry, A.L.; Alexander, L.V.; O’Gorman, P.A.; Maher, N. More extreme precipitation in the world’s dry and wet regions. Nat. Clim. Chang. 2016, 6, 508–514. [Google Scholar] [CrossRef]
  2. Allen, M.R.; Ingram, W.J. Constraints on future changes in climate and the hydrologic cycle. Nature 2002, 419, 224–232. [Google Scholar] [CrossRef] [PubMed]
  3. Benda, L.; Hassan, M.A.; Church, M.; May, C.L. Geomorphology of steepland headwaters: The transition from hillslopes to channels. J. Am. Water Resour. Assoc. 2005, 41, 835–851. [Google Scholar] [CrossRef]
  4. Freeman, M.C.; Pringle, C.M.; Jackson, C.R. Hydrologic connectivity and the contribution of stream headwaters to ecological integrity at regional scales. J. Am. Water Resour. Assoc. 2007, 43, 5–14. [Google Scholar] [CrossRef]
  5. Wohl, E. The significance of small streams. Front. Earth Sci. 2017, 11, 447–456. [Google Scholar] [CrossRef]
  6. Gao, Y.; Vano, J.A.; Zhu, C.; Lettenmaier, D.P. Evaluating climate change over the colorado river basin using regional climate models. J. Geophys. Res.-Atmos. 2011, 116, D13104. [Google Scholar] [CrossRef]
  7. Bales, R.C.; Molotch, N.P.; Painter, T.H.; Dettinger, M.D.; Rice, R.; Dozier, J. Mountain hydrology of the western united states. Water Resour. Res. 2006, 42, W08432. [Google Scholar] [CrossRef]
  8. Zhang, A.; Liu, W.; Yin, Z.; Fu, G.; Zheng, C. How will climate change affect the water availability in the heihe river basin, northwest china? J. Hydrometeorol. 2016, 17, 1517–1542. [Google Scholar] [CrossRef]
  9. Baattrup-Pedersen, A.; Larsen, S.E.; Andersen, D.K.; Jepsen, N.; Nielsen, J.; Rasmussen, J.J. Headwater streams in the EU Water Framework Directive: Evidence-based decision support to select streams for river basin management plans. Sci. Total Environ. 2018, 613, 1048–1054. [Google Scholar] [CrossRef] [PubMed]
  10. Worqlul, A.W.; Taddele, Y.D.; Ayana, E.K.; Jeong, J.; Adem, A.A.; Gerik, T. Impact of climate change on streamflow hydrology in headwater catchments of the Upper Blue Nile Basin, Ethiopia. Water 2018, 10, 120. [Google Scholar] [CrossRef]
  11. Antico, A.; Schlotthauer, G.; Torres, M.E. Analysis of hydroclimatic variability and trends using a novel empirical mode decomposition: application to the Paraná River Basin. J. Geophys. Res. Atmos. 2014, 119, 1218–1233. [Google Scholar] [CrossRef]
  12. Xu, J.H.; Li, W.H.; Ji, M.H.; Lu, F.; Dong, S. A comprehensive approach to characterization of the nonlinearity of runoff in the headwaters of the Tarim River, western China. Hydrol. Process. 2010, 24, 136–146. [Google Scholar] [CrossRef]
  13. Bai, L.; Chen, Z.; Xu, J.; Li, W. Multi-scale response of runoff to climate fluctuation in the headwater region of Kaidu River in Xinjiang of China. Theor. Appl. Climatol. 2015, 125, 703–712. [Google Scholar] [CrossRef]
  14. Wu, Z.H.; Huang, N.E. Ensemble empirical mode decomposition: A noise-assisted data analysis method. Adv. Adapt. Data Anal. 2009, 1, 1–41. [Google Scholar] [CrossRef]
  15. Zhao, X.H.; Chen, X. Auto regressive and ensemble empirical mode decomposition hybrid model for annual runoff forecasting. Water Resour. Manag. 2015, 29, 2913–2926. [Google Scholar] [CrossRef]
  16. Ouyang, Q.; Lu, W.; Xin, X.; Zhang, Y.; Chen, W.G.; Yu, T. Monthly rainfall forecasting using EEMD-SVR based on phase-space reconstruction. Water Resour. Manag. 2016, 30, 2311–2325. [Google Scholar] [CrossRef]
  17. Lin, P.F.; Feng, X.L.; Liu, J.J. Historical trends in surface air temperature estimated by ensemble empirical mode decomposition and least squares linear fitting. Atmos. Ocean Sci. Lett. 2015, 8, 10–16. [Google Scholar]
  18. Franzke, C.L. Warming trends: Nonlinear climate change. Nat. Clim. Chang. 2014, 4, 423–424. [Google Scholar] [CrossRef]
  19. Sun, C.; Ma, Y. Effects of non-linear temperature and precipitation trends on loess plateau droughts. Quatern. Int. 2015, 372, 175–179. [Google Scholar] [CrossRef]
  20. Mao, T.; Wang, G.; Zhang, T. Impacts of climatic change on hydrological regime in the three-river headwaters region, China, 1960–2009. Water Resour. Manag. 2015, 30, 115–131. [Google Scholar] [CrossRef]
  21. Li, F.P.; Zhang, G.X.; Xu, Y.J. Spatiotemporal variability of climate and streamflow in the Songhua River Basin, northeast China. J. Hydrol. 2014, 514, 53–64. [Google Scholar] [CrossRef]
  22. Liu, Z.; Yang, X.; Chen, F.; Wang, E. The effects of past climate change on the northern limits of maize planting in Northeast China. Clim. Chang. 2013, 117, 891–902. [Google Scholar] [CrossRef]
  23. Feng, X.Q.; Zhang, G.X.; Yin, X. Hydrological responses to climate change in Nenjiang River Basin, northeastern China. Water Resour. Manag. 2011, 25, 677–689. [Google Scholar] [CrossRef]
  24. Tang, Y.; Wang, H.; Yan, D.H.; Tang, K.W. Evolutionary regularity of runoff of Nenjiang River Basin in period 1956–2000. Sci. Geogr. Sin. 2009, 29, 864–868. [Google Scholar]
  25. Dong, L.Q.; Zhang, G.X.; Xu, Y.J. Effects of climate change and human activities on runoff in the Nenjiang River Basin, Northeast China. Hydrol. Earth Syst. Sci. Disscuss. 2012, 9, 11521–11549. [Google Scholar] [CrossRef]
  26. Feng, X.Q.; Zhang, G.X.; Xu, Y.J. Simulation of hydrological processes in the Zhalong wetland within a river basin, Northeast China. Hydrol. Earth Syst. Sci. Disscuss. 2013, 17, 2797–2807. [Google Scholar] [CrossRef]
  27. Miao, C.; Yang, L.; Liu, B.; Gao, Y.; Li, S. Streamflow changes and its influencing factors in the mainstream of the Songhua River basin, Northeast China over the past 50 years. Environ. Earth Sci. 2011, 63, 489–499. [Google Scholar] [CrossRef]
  28. Han, T.; Chen, H.; Wang, H. Recent changes in summer precipitation in Northeast China and the background circulation. Int. J. Climatol. 2015, 35, 4210–4219. [Google Scholar] [CrossRef]
  29. Liu, Y.; Ren, L.; Yang, X.; Ma, M.; Yuan, F.; Jiang, S. Effects of precipitation and potential evaporation on actual evapotranspiration over the Laohahe basin, northern China. Proc. Int. Assoc. Hydrol. Sci. 2015, 371, 173–179. [Google Scholar] [CrossRef]
  30. Allen, R.G.; Pereira, L.S.; Raes, D.; Smith, M. Crop Evapotranspiration-Guidelines for Computing Crop Water Requirements-FAO Irrigation and Drainage Paper 56; Food and Agriculture Organization of the United Nations (FAO): Rome, Italy, 1998; Volume 300, p. D05109. [Google Scholar]
  31. Wu, Z.H.; Huang, N.E.; Long, S.R.; Peng, C.K. On the trend, detrending and variability of nonlinear and non-stationary time series. Proc. Nat. Acad. Sci. USA 2007, 104, 14889–14894. [Google Scholar] [CrossRef] [PubMed]
  32. Harvey, D.I.; Leybourne, S.J.; Taylor, A.M.R. On infimum Dickey–Fuller unit root tests allowing for a trend break under the null. Comput. Stat. Data Anal. 2014, 78, 235–242. [Google Scholar] [CrossRef]
  33. Sang, Y.F.; Wang, Z.; Liu, C. Comparison of the MK test and EMD method for trend identification in hydrological time series. J. Hydrol. 2014, 510, 293–298. [Google Scholar] [CrossRef]
  34. Yu, X.Y.; He, X.Y.; Zheng, H.F.; Guo, R.C.; Ren, Z.B.; Zhang, D.; Lin, J.X. Spatial and temporal analysis of drought risk during the crop-growing season over northeast China. Nat. Hazard. 2014, 71, 275–289. [Google Scholar] [CrossRef]
  35. Leauthaud, C.; Duvail, S.; Hamerlynck, O.; Paulc, J.; Cochete, H.; Nyunjaf, J.; Albergela, J.; Grünbergera, O. Floods and livelihoods: The impact of changing water resources on wetland agro-ecological production systems in the Tana River Delta, Kenya. Glob. Environ. Chang. 2013, 23, 252–263. [Google Scholar] [CrossRef]
  36. Yuan, L.H.; Jiang, W.G.; Luo, Z.L.; He, X.H.; Liu, Y.H. Analysis of wetland change in the Songhua River Basin from 1995 to 2008. IOP Conf. Ser. Earth Environ. Sci. 2014, 17, 12125–12131. [Google Scholar] [CrossRef]
  37. Niu, Z.G.; Zhang, H.Y.; Wang, X.W.; Yao, W.B.; Zhou, D.M.; Zhao, K.Y.; Zhao, H.; Li, N.N.; Huang, H.B.; Li, C.C.; et al. Mapping wetland changes in China between 1978 and 2008. Chin. Sci. Bull. 2012, 57, 2813–2823. [Google Scholar] [CrossRef]
  38. Li, F.P.; Zhang, G.X.; Xu, Y.J. Assessing climate change impacts on water resources in the Songhua River Basin. Water 2016, 8, 420. [Google Scholar] [CrossRef]
  39. Piao, S.; Ciais, P.; Huang, Y.; Shen, Z.H.; Peng, S.S.; Li, J.S.; Zhou, L.P.; Liu, H.Y.; Ma, Y.C.; Ding, Y.H.; et al. The impacts of climate change on water resources and agriculture in China. Nature 2010, 467, 43–51. [Google Scholar] [CrossRef] [PubMed]
  40. Song, X.Y.; Li, L.J.; Fu, G.B.; Li, J.Y.; Zhang, A.J.; Liu, W.B.; Zhang, K. Spatial–temporal variations of spring drought based on spring-composite index values for the Songnen Plain, Northeast China. Theor. Appl. Climatol. 2014, 116, 371–384. [Google Scholar] [CrossRef]
  41. Spence, C.; Guan, X.J.; Phillips, R.; Hedstrom, N.; Granger, R.; Reid, B. Storage dynamics and streamflow in a catchment with a variable contributing area. Hydrol. Process 2010, 24, 2209–2221. [Google Scholar] [CrossRef]
  42. López-Moreno, J.I.; Zabalza, J.; Vicente-Serrano, S.M.; Revuelto, J.; Gilaberte, M.; Azorin-Molina, C.; Morán-Tejeda, E.; García-Ruiz, J.M.; Tague, C. Impact of climate and land use change on water availability and reservoir management: Scenarios in the Upper Aragón River, Spanish Pyrenees. Sci. Total Environ. 2014, 493, 1222–1231. [Google Scholar] [CrossRef] [PubMed]
  43. Li, R.; Zheng, H.; Lv, S.; Liao, W.; Lu, F. Development and evaluation of a new index to assess hydrologic regulating service at sub-watershed scale. Ecol. Indic. 2018, 86, 9–17. [Google Scholar] [CrossRef]
  44. Kelly, C.N.; Mcguire, K.J.; Miniat, C.F.; Vose, J.M. Streamflow response to increasing precipitation extremes altered by forest management. Geophys. Res. Lett. 2016, 43, 3727–3736. [Google Scholar] [CrossRef]
  45. Fossey, M.; Rousseau, A.N. Can isolated and riparian wetlands mitigate the impact of climate change on watershed hydrology? A case study approach. J. Environ. Manag. 2016, 184, 327–339. [Google Scholar] [CrossRef] [PubMed]
  46. Whigham, D.F.; Walker, C.M.; Maurer, J.; Kingc, R.S.; Hausera, W.; Bairdb, S.; Keuskampe, J.A.; Nealea, P.J. Watershed influences on the structure and function of riparian wetlands associated with headwater streams–Kenai Peninsula, Alaska. Sci. Total Environ. 2017, 599–600, 124–134. [Google Scholar] [CrossRef] [PubMed]
  47. Liu, J.; Hayakawa, N.; Lu, M.; Dong, S.; Yuan, J. Hydrological and geocryological response of winter streamflow to climate warming in Northeast China. Cold Reg. Sci. Technol. 2003, 37, 15–24. [Google Scholar] [CrossRef]
  48. Liu, J.; Hayakawa, N.; Lu, M.; Dong, S.; Yuan, J. Winter streamflow, ground temperature and active-layer thickness in northeast China. Permafr. Periglac. Process. 2003, 14, 11–18. [Google Scholar] [CrossRef]
Figure 1. Geographical location of the Neijiang River Basin in Northeast China and the spatial distribution of gauge stations (black dots) and weather stations (blue-red symbol) in the basin’s headwater region used in this study.
Water 10 00294 g001
Figure 2. Annual streamflow anomaly against the 1961–2010 average and a five-year moving average trend at six gauge stations ((a) Beian, (b) Shihuiyao, (c) Xiaoergou, (d) Zhalantun, (e) Suolun and (f) Tuliemaodu) in the headwater region of the Nenjiang River Basin, Northeast China.
Water 10 00294 g002
Figure 3. The Intrinsic Mode Function and trend component of streamflow anomaly at six gauge stations ((a) Beian, (b) Shihuiyao, (c) Xiaoergou, (d) Zhalantun, (e) Suolun and (f) Tuliemaodu) during 1961–2010 in the headwater region of the Nejiang River Basin, Northeast China.
Water 10 00294 g003aWater 10 00294 g003b
Figure 4. Inter-annual, inter-decadal and RES signals computed by EEMD method from annual streamflow anomalies at six gauge stations ((a) Beian, (b) Shihuiyao, (c) Xiaoergou, (d) Zhalantun, (e) Suolun and (f) Tuliemaodu) during 1961–2010 in the headwater region of the Nenjiang River Basin, Northeast China.
Water 10 00294 g004aWater 10 00294 g004b
Figure 5. Nonlinear response of streamflow (S) at six gauge stations ((a) Beian, (b) Shihuiyao, (c) Xiaoergou, (d) Zhalantun, (e) Suolun and (f) Tuliemaodu) to air temperature (T) during 1961–2010 in the headwater region of the Nenjiang River Basin, Northeast China.
Water 10 00294 g005aWater 10 00294 g005b
Figure 6. Nonlinear response of streamflow (S) at six gauge stations ((a) Beian, (b) Shihuiyao, (c) Xiaoergou, (d) Zhalantun, (e) Suolun and (f) Tuliemaodu) to precipitation (P) during 1961–2010 in the headwater region of the Nenjiang River Basin, Northeast China.
Water 10 00294 g006aWater 10 00294 g006b
Figure 7. Nonlinearity of streamflow (S) at six gauge stations ((a) Beian, (b) Shihuiyao, (c) Xiaoergou, (d) Zhalantun, (e) Suolun and (f) Tuliemaodu) to potential evapotranspiration (ET0) during 1961–2010 in the headwater region of the Nenjiang River Basin, Northeast China.
Water 10 00294 g007aWater 10 00294 g007b
Table 1. Summary of river gauge stations, tributaries, representing drainage area (DA), annual streamflow (AS), and the identification numbers of meteorological stations (MS No.) in the headwater regions of the Nenjiang River Basin, Northeast China.
No.Gauge StationsBasinTime SpanDA (km2)AS (108 m3)MS No.
G1ShihuiyaoMainstream1961–201017,20527.161, 2, 4, 5
G2BeianWuyuer River1961–201029522.757, 10, 12
G3XiaoergouNuomin River1961–201016,76130.553, 4, 6, 8
G4ZhalantunYalu River1961–201068919.618, 9
G5SuolunTaoer River1961–201058935.6311, 13
G6TuliemaoduHuolin River1961–201080002.5611, 13, 14, 15
G7DalaiMainstream1968–2010221,715214.25/
Table 2. Streamflow (S), temperature (T), precipitation (P) and potential evapotranspiration (ET0) at six gauge stations on different time scales during 1961–2010 in the headwater region of the Nenjiang River Basin, Northeast China.
Gauge StationsT (°C)P (mm)ET0 (mm)S (108 m3)
Inter-AnnualInter-DecadalInter-AnnualInter-DecadalInter-AnnualInter-DecadalInter-AnnualInter-Decadal
Beian3.5016.333.2712.253.0612.253.5024.50
Shihuiyao3.2716.333.0616.333.0624.503.0624.50
Xiaoergou3.7616.333.0612.253.0616.333.2616.33
Zhalantun3.5016.333.0612.253.0616.333.2716.33
Suolun3.5016.332.8816.332.8816.333.2616.33
Tuliemaodu3.7616.333.2716.332.8816.333.8221.00
Table 3. Trends (Tre) and transition years (TraY) for temperature (T), precipitation (P), evapotranspiration (ET0), and streamflow (S) variations during 1961–2010 for six gauge stations in the headwater region of the Nenjiang River Basin, Northeast China.
Gauge StationsT (°C)P (mm)ET0 (mm)S (108 m3)
TreTraYTrendTraYTrendTraYTrendTraY
BeianStrong Rising/Strong decreasing-slight rising1997Strong Rising/Strong decreasing-slight rising1990
ShihuiyaoStrong Rising/Strong rising-slight decreasing1998Strong Rising/Strong rising-slight decreasing1991
XiaoergouSlight decreasing-strong rising1970Slight rising-strong decreasing1986Strong Rising/Slight rising-strong decreasing1982
ZhalantunSlight decreasing-strong rising1974Strong rising-strong decreasing1986Strong Rising/Slight rising-strong decreasing1970
SuolunSlight decreasing-strong rising1970Slight rising-strong decreasing1983Strong Rising-slight decreasing2005Slight rising-strong decreasing1992
TuliemaoduStrong Rising-Strong rising-strong decreasing1988Strong Rising/Slight rising-strong decreasing1984

