Changes in Annual, Seasonal and Monthly Climate and Its Impacts on Runoff in the Hutuo River Basin, China

1
State Key Laboratory of Simulation and Regulation of Water Cycle in River Basin, Water Resources Department, China Institute of Water Resources and Hydropower Research, Beijing 100038, China
2
College of Water Resources and Civil Engineering, China Agricultural University, Beijing 100083, China
*
Author to whom correspondence should be addressed.
Water 2018, 10(3), 278; https://doi.org/10.3390/w10030278
Submission received: 25 January 2018
/
Revised: 2 March 2018
/
Accepted: 4 March 2018
/
Published: 6 March 2018
Abstract
:Much attention has focused on the effects of precipitation (P) and temperature (T) changes on runoff (R); however, the impacts of other climatic factors need to be studied further. Moreover, the monthly and seasonal scale also need to be investigated. In this paper, we investigated the characteristics of changes in annual, seasonal, and monthly hydroclimatic variables, including R, P, T, sunshine duration (SD), relative humidity (RH), and wind speed (WS), between 1956 and 2015 in the Hutuo River basin (HTRB) using the nonparametric Mann-Kendall test, the cumulative anomaly test and the Precipitation-Runoff double cumulative curve method. Additionally, we assessed the contributions of climatic factors to changes in R in the HTRB between 1956 and 2015 using the climate elasticity method. The results indicated that significant downward trends were found for both annual and seasonal R, SD, RH, and WS. In contrast, there was a nonsignificant decrease in annual P; specifically, P significantly increased in spring and winter, but P insignificantly decreased in summer and autumn. Annual and seasonal T increased significantly. The annual R showed an abrupt change in 1979; thus, the entire study period from 1956 to 2015 was divided into two periods: the baseline period (i.e., 1956–1978) and the change period (i.e., 1979–2015). The elasticities in the climatic factors were calculated using the climate elasticity method, and the elasticity values of P, T, SD, RH, and WS were 1.84, −1.07, −2.79, 1.73, and −0.45, respectively. Increasing T was the main cause of the decline in R, and decreasing SD had a large negative contribution to the decline in R in the HTRB. This study will help researchers understand the interactions between climate change and hydrological processes at the basin scale and promote water resource management and watershed planning.
1. Introduction
In recent decades, climate change has attracted increasing global attention because the changing climate could affect water supplies [1,2]. The Intergovernmental Panel on Climate Change (IPCC, 2013) Fifth Assessment Report on Climate Change noted that the global average temperature increased by 0.85 °C from 1880 to 2013 [3]. Spatial and temporal changes in precipitation (P) have been observed in many parts of the world [4,5,6]. Runoff (R) is one of the most important components of the water cycle and is affected by climate change. River R and water resources have changed in many parts of the world due to climate change [7,8,9,10]. Climate change affects water resources and threatens agricultural production in China [11]. Understanding how much of the observed change in R can be attributed to climate change is important to water resource management.
A tremendous importance has been attached to the study of climatological variables, such as air temperature (T), amount of P, sea level, and atmospheric pressure [12]. The study of annual precipitation and mean annual temperature in the state of Kentucky indicates that, over the period 1950–2010, the precipitation generally did not exhibit any statistically significant trends with respect to time [4]. Generally, the average total annual P in China has not changed remarkably; however, regional and seasonal distinctions in P are evident [13,14]. A wet tendency has been identified in South China, and a dry tendency has been identified in North China, with the wet tendency in winter and the dry tendency in summer [6]. There was a consistent warming trend throughout the country during the period of 1963–2012, with a warming rate of 0.26 °C/decade [15]. Tian et al. used the extreme T indices to detect significant and stable trends in the southern Anhui and Jiangsu provinces [16]. The mean annual T increased significantly, with a rate of 0.0247 °C per year; additionally, the mean winter T increased by 0.0353 °C per year, and the increasing trend in winter was more significant than those in other seasons between 1961 and 2012 in the southeast Tibetan Plateau [17]. The annual mean temperature in the Loess Plateau has significantly increased over the last 50 years (1.91 °C/50 years.); however, the region-averaged annual P showed a nonsignificant negative trend (−29.11 mm/50 years.) [18]. Many studies have focused on the spatial distribution and temporal trends in P and T among years and seasons, and the trends in climate variability as well as their magnitudes were spatially and temporally variable. However, most studies have concentrated on the spatial and temporal distribution of P and T; few studies have provided insight into the seasonal and monthly changes in P and T. In addition, the variation analyses of other climatic elements, such as sunshine duration (SD), relative humidity (RH), and wind speed (WS), are rarely reported.
Recently, several studies have assessed the impacts of climate change on R reduction, and the use of hydrological models to quantify the impacts of climate change and human activity on declines in R has increased. Jia et al. used a distributed hydrological model of water and energy transfer processes in large river basins to assess the impacts of climate change and human activity on the evolution of the quantity of water resources in the highly water-stressed Haihe River basin; their results indicated that natural climate variability and local human activity may be two factors responsible for the observed changes in the quantity of water resources measured between 1961 and 2000 in the basin [19]. Hu et al. used the HydroInformatic Modelling System (HIMS) to assess the impacts of climate variability and human activities on streamflow in the water source area of Baiyangdian Lake; as a result, the authors found that the effect of human activities played a dominant role in the decline of streamflow in the water source area of Baiyangdian Lake [20]. However, hydrological models are always limited since they require large amounts of data (e.g., topography, land-use, soil, and hydrometeorological data); additionally, hydrological models are time-consuming in terms of the model calibration and validation processes, and there is uncertainty in terms of model structure and parameter estimation. Accordingly, some new methods have been developed to assess the impacts of climate change and human activities; these new methods include the hydrological sensitivity analysis method, the climate elasticity method, and the slope change ratio of accumulative quantity method.
On a watershed scale, the climate elasticity of R has been considered as an important indicator for quantifying the sensitivity of R to climate change [21,22,23,24,25], and this method is advantageous because it requires only the means and trends in climatic and basin variables and does not require extensive historical measurements [26]; thus, the climate elasticity method has been widely used in quantifying the effects of climatic factors on R, e.g., in the Yellow River basin [24,25], the Songhua River basin [27], the Chao–Bai River basin [28], the Hai River basin [25,29], the entire United States [22], the 219 catchments across Australia [30], and 725 catchments in Europe [31].The concept of climate elasticity was defined by Schaake (1990) to evaluate the effect of P on R [21].
where is the P elasticity.
P and T are two of the most important climatic elements and represent a crucial part of the global hydrological cycle [32]. To further consider the impact of T on R, Ma et al. added T into Equation (1) to calculate the impacts of P and T on R [28].
where is the T elasticity.
Additionally, several studies have used the long-term water balance equation (R = P − E) and the Budyko hypothesis to calculate the P elasticity and to assess the effect of climate change on R [20,27]. To date, in most studies, P and T are the two key factors considered in assessing the causes of R change, partly because increasing air T is the most significant characteristic of climate change, and P is the major source of R [33]. Nonetheless, other climatic factors, such as SD, RH, and WS, may play non-negligible roles in R variation; specifically, these additional climatic factors may be important if they change significantly or if R is sensitive to them. Consequently, assessing the impact of climate change on R should consider additional climatic factors. Moreover, much attention has been focused on investigating the variation of annual hydroclimatic series, but few have provided insight into the seasonal and monthly changes in hydroclimatic series and their impacts on runoff change.
In this study, the Hutuo River basin (HTRB) was chosen to assess the change in R as a result of the changing climate. The HTRB is a primary tributary in the west region of the Haihe River basin. The Haihe River basin is an important political and economic center with a large grain production base, and the basin plays an important role in the sustainable development of the economy and the ecology of China. However, frequent droughts and serious water shortages in this basin have hindered economic development and have resulted in severe environmental problems, which are attributable to the region’s environmental and ecological vulnerability to water shortages [34,35,36].
The objective of this study is to use the long-term hydroclimatic time series data (i.e., from 1956 to 2015) to assess the impact of climate variability on R in the HTRB. First, the hydroclimatic changes in the annual, seasonal, and monthly variation of the R and climatic elements (e.g., P, T, SD, RH, and WS) in the HTRB are investigated. Second, we develop a derivation of the climate elasticity of R to climatic elements (e.g., P, T, SD, RH, and WS) based on the climate elasticity method, and then we calculate the contribution of each climatic element to the change in R in the HTRB. This study will help researchers understand the interactions between climate change and hydrological processes at the basin scale and promote water resource management and watershed planning.
2. Materials and Methods
2.1. Study Area and Data
The HTRB is the largest tributary in the middle segment of the Haihe River basin, which is approximately 587 km long and has a drainage area of 24,769 km2; additionally, the basin supports 4.29 million people [37]. In this study, the region upstream of the Xiaojue hydrological station (113°43′’ E, 38°23′ N) was selected as the study area, which covers a drainage area of 14,000 km2, has a length of 337 km, and accounts for 57% of the entire HTRB (Figure 1). The study area coordinates are 112.14–113.87° E and 38.02–39.47° N, with an elevation of 267–3058 m above mean sea level (Figure 1).
The area can be characterized by a typical semi-humid zone with continental monsoon climate, with hot and rainy summers and cold and dry winters. The mean annual P is 543 mm, with 70–80% falling during the rainy summer months, i.e., between July and September. The mean annual T is approximately 6 °C. The main land use types in the study area are forest, grassland, and agricultural land. The main soil types in the HTRB are loess and brown earth.
Daily P and mean air T data were collected from seven stations (Figure 1) between 1956 and 2015. Daily meteorological data were obtained from two stations (Yuanping and Wutaishan, Xinzhou, China) between 1956 and 2015, and these data included the SD, RH, and WS. Monthly river discharge data were obtained for the same time period as the meteorological data from the Xiaojue hydrological station located at the HTRB outlet, and discharge data were transformed to depth in millimeters (i.e., R) to compare with P. To calculate the average climatic variables in the watershed, a data set consisting of a 10-km grid covered the study region and was interpolated from the data collected at the meteorological stations by using an inverse-distance weighted technique.
2.2. Trend Test
A trend test was performed to identify statistically significant changes in the hydroclimatic variables in the study area. A linear regression model and a nonparametric Mann-Kendall (MK) test were adopted to assess possible trends and to compute the significance of monotonic trends at a significance level of α = 0.05 [34,38]. The MK test is one of the most popular methods for trend analysis and has been commonly used to perform trend testing for hydroclimatic series, for it has an advantage of not assuming any distributional form for the data and has the same power as its parametric competitors. Student’s t-test was applied to evaluate the statistical significance of the linear trends in this study. The magnitudes of the trends were estimated by the slope, which was extended by Hirsch et al. [39] from that proposed by Sen [40]. A positive (negative) value of the slope indicates an upward (downward) trend. In this study, we analyzed the trends in annual, seasonal, and monthly R and climatic elements. In addition, March–May, June–August, September–November, and December–February represented spring, summer, autumn, and winter, respectively.
2.3. Change-Point Detection
The cumulative anomaly method was used to identify the changing tendency of discrete data, such as the P, evapotranspiration, and R data [41,42]. In this study, we use this method to detect the R change point. For a discrete R series Ri, the cumulative anomaly (Rt) for the R data point Rt can be expressed as
where Rm is the mean value of the R series Ri, and n is the number of discrete points. Specifically, a positive or negative cumulative anomaly indicates that the R data point is higher or lower than the average, respectively. If the curve consists of these two parts, we can determine the inflection point of the trend.
In addition, the Precipitation-Runoff (P-R) double cumulative curve (DCC) was generated to identify change points of the R series. The P-R DCC can visually show the consistency of the P and R data [43]; specifically, the P-R DCC should be a straight line if two variables are proportional, and the slope of this line represents the ratio between the two variables. A change in the gradient of the curve may indicate that the original relationship between the P and R was broken. In this study, the DCC method was used as an auxiliary confirmation of the change points of the R.
2.4. Climate Elasticity Method
The climate elasticity method has been widely employed to assess the impacts of climate change [28]. The concept of climate elasticity was introduced by Schaake [21] and has been continuously improved since [22,23]. The climate elasticity of R can be defined as the proportional change in R divided by the proportional change in a climatic variable, such as P. Thus, the P elasticity of R was expressed as Equation (1). To further consider the impact of T on R, Ma et al. added T into Equation (1) to calculate the impacts of both P and T on R [28]; thus, the P and T elasticity of R was expressed as Equation (2). Nonetheless, other climatic factors, such as SD, RH, and WS, may play non-negligible roles in R variation, e.g., if the climatic factor changes significantly or if R is more sensitive to it. Consequently, more climatic factors should be considered when assessing the impact of climate change on R. Therefore, the impacts of the climatic elements (e.g., P, T, SD, RH, and WS) were considered in the climate elasticity model, and the equation was as follows
where R, P, T, SD, RH, and WS are R, P, T, SD, RH, and WS, respectively. , , , , and are the P, T, SD, RH, and WS elasticities, respectively.
According to Equation (4), the formula for the influence of climatic factors on R change can be expressed as
where i is a specific influence factor of R change, such as P, T, SD, RH, and WS; is the elastic coefficient of each factor to R change; ΔRi is the influence of climatic factors on R changes; and Δi is the change in the influence of climatic factors.
Changes in annual R after the change point could be estimated from the climatic factor data during the post-change period using Equation (4). The influence of climatic factors on R change could be calculated by Equation (5), and the impact of climate variability on R change was the sum of the influence of each climatic element (including P, T, SD, RH, and WS) on R change. Therefore, the contribution of climate change to R change can be calculated as
where Rc is the contribution of climate change to R change, and ΔR is the total change in R. Therefore, we can calculate the contribution of climate change on R change by using Equation (6), and the remaining changes are assumed to be caused by human activities.
3. Results
3.1. Trends Analysis for Hydroclimatic Series
Observed annual R and climatic elements in the HTRB for the period of 1956–2015 are shown in Figure 2, and Table 1 further shows the statistical results of annual trends in R and climatic factors based on the Mann-Kendall test. Between 1956 and 2015, the observed average annual R was 45.5 mm, and R decreased significantly at a rate of −11.97 mm/10a (Figure 2a and Table 1). The P generally exhibited a slight downward trend during the study period without significant changes (Figure 2b and Table 1). The T in the HTRB increased significantly between 1956 and 2015 with a slope of 0.58 °C/10a (Figure 2c and Table 1). The SD and RH decreased significantly for the entire period with a slope of −0.26 h/day decade−1 and −1.46%/10a, respectively (Figure 2d,e and Table 1). The WS showed an upward trend during the period of 1956–1979, but it displayed a downward trend during 1980–2015; as a whole, the WS exhibited a clear downward trend between 1956 and 2015 with a rate of −0.45 m/s decade−1 (Figure 2f and Table 1).
The HTRB is the main source of water resources for the North China Plain, which is a major grain-producing area. The key issue is that seasonal and monthly changes in R and climatic elements are more important for agriculture than annual changes. For example, if P occurs during winter, it is asynchronous with the cropping season; thus, it will not be beneficial to agriculture. Therefore, we also analyzed the seasonal and monthly change trends in R and climatic elements in the HTRB during 1956–2015, and these results are shown in Table 2 and Table 3. In terms of seasonal changes, the R in all four seasons decreased by −1.40, −5.69, −3.22 and −1.61 mm decade−1, respectively, and the four seasons were all statistically significant at the 0.05 level (Table 2). The P in summer and autumn was much higher than the P in spring and winter. Significant increases in the P trend was found in spring and winter at the rates of 8.44 and 2.30 mm/10a, respectively. In contrast, P decreased insignificantly in summer and autumn at the rates of −13.59 and −3.95 mm/10a, respectively (Table 2). The T increased by 0.67, 0.47, 0.51 and 0.62 °C/10a in spring, summer, autumn, and winter, respectively, which indicated a significant warming trend, and the overall increasing trend was significant at the 0.05 level (Table 2). The most warming occurred in spring, followed by winter, autumn, and summer. The SD decreased significantly in all four seasons at the rates of −0.16, −0.28, −0.29 and −0.34 h/day decade−1, respectively (Table 2). A significant decreasing trend was found for RH at the rates of −2.24, −1.15, −0.79 and −1.69%/10a for spring, summer, autumn, and winter, respectively (Table 2). The WS also decreased significantly in spring, summer, autumn, and winter, and the rates were −0.38, −0.21, −0.46 and −0.79 m/s decade−1, respectively (Table 2).
In terms of monthly results, the R decreased significantly in all months except for May (which decreased, but the decrease was nonsignificant), with trend line slopes ranging from −0.12 to −3.83 mm/10a (Table 3). Compared with the other monthly time series, the R in August had the largest trend magnitudes. The monthly P increased from January to June, with significant increases in February, March, and May; in contrast, the P decreased from July to December, with a significant decrease in August (Table 3). The monthly T exhibited significant increasing trends in all months, with trend line slopes ranging from 0.43 to 0.81 °C/10a (Table 3). The SD decreased notably in all months except April and August (in which SD decreased, but the decreases were nonsignificant) (Table 3). The monthly RH values all exhibited significant downward trends, except in June, September, and October (in which the RH decreased, but the decreases were nonsignificant) (Table 3). All monthly WS values decreased significantly, with trend line slopes ranging from −0.16 to −0.81 m/s decade−1 (Table 3).
3.2. Change-Point Detection for Annual R Series
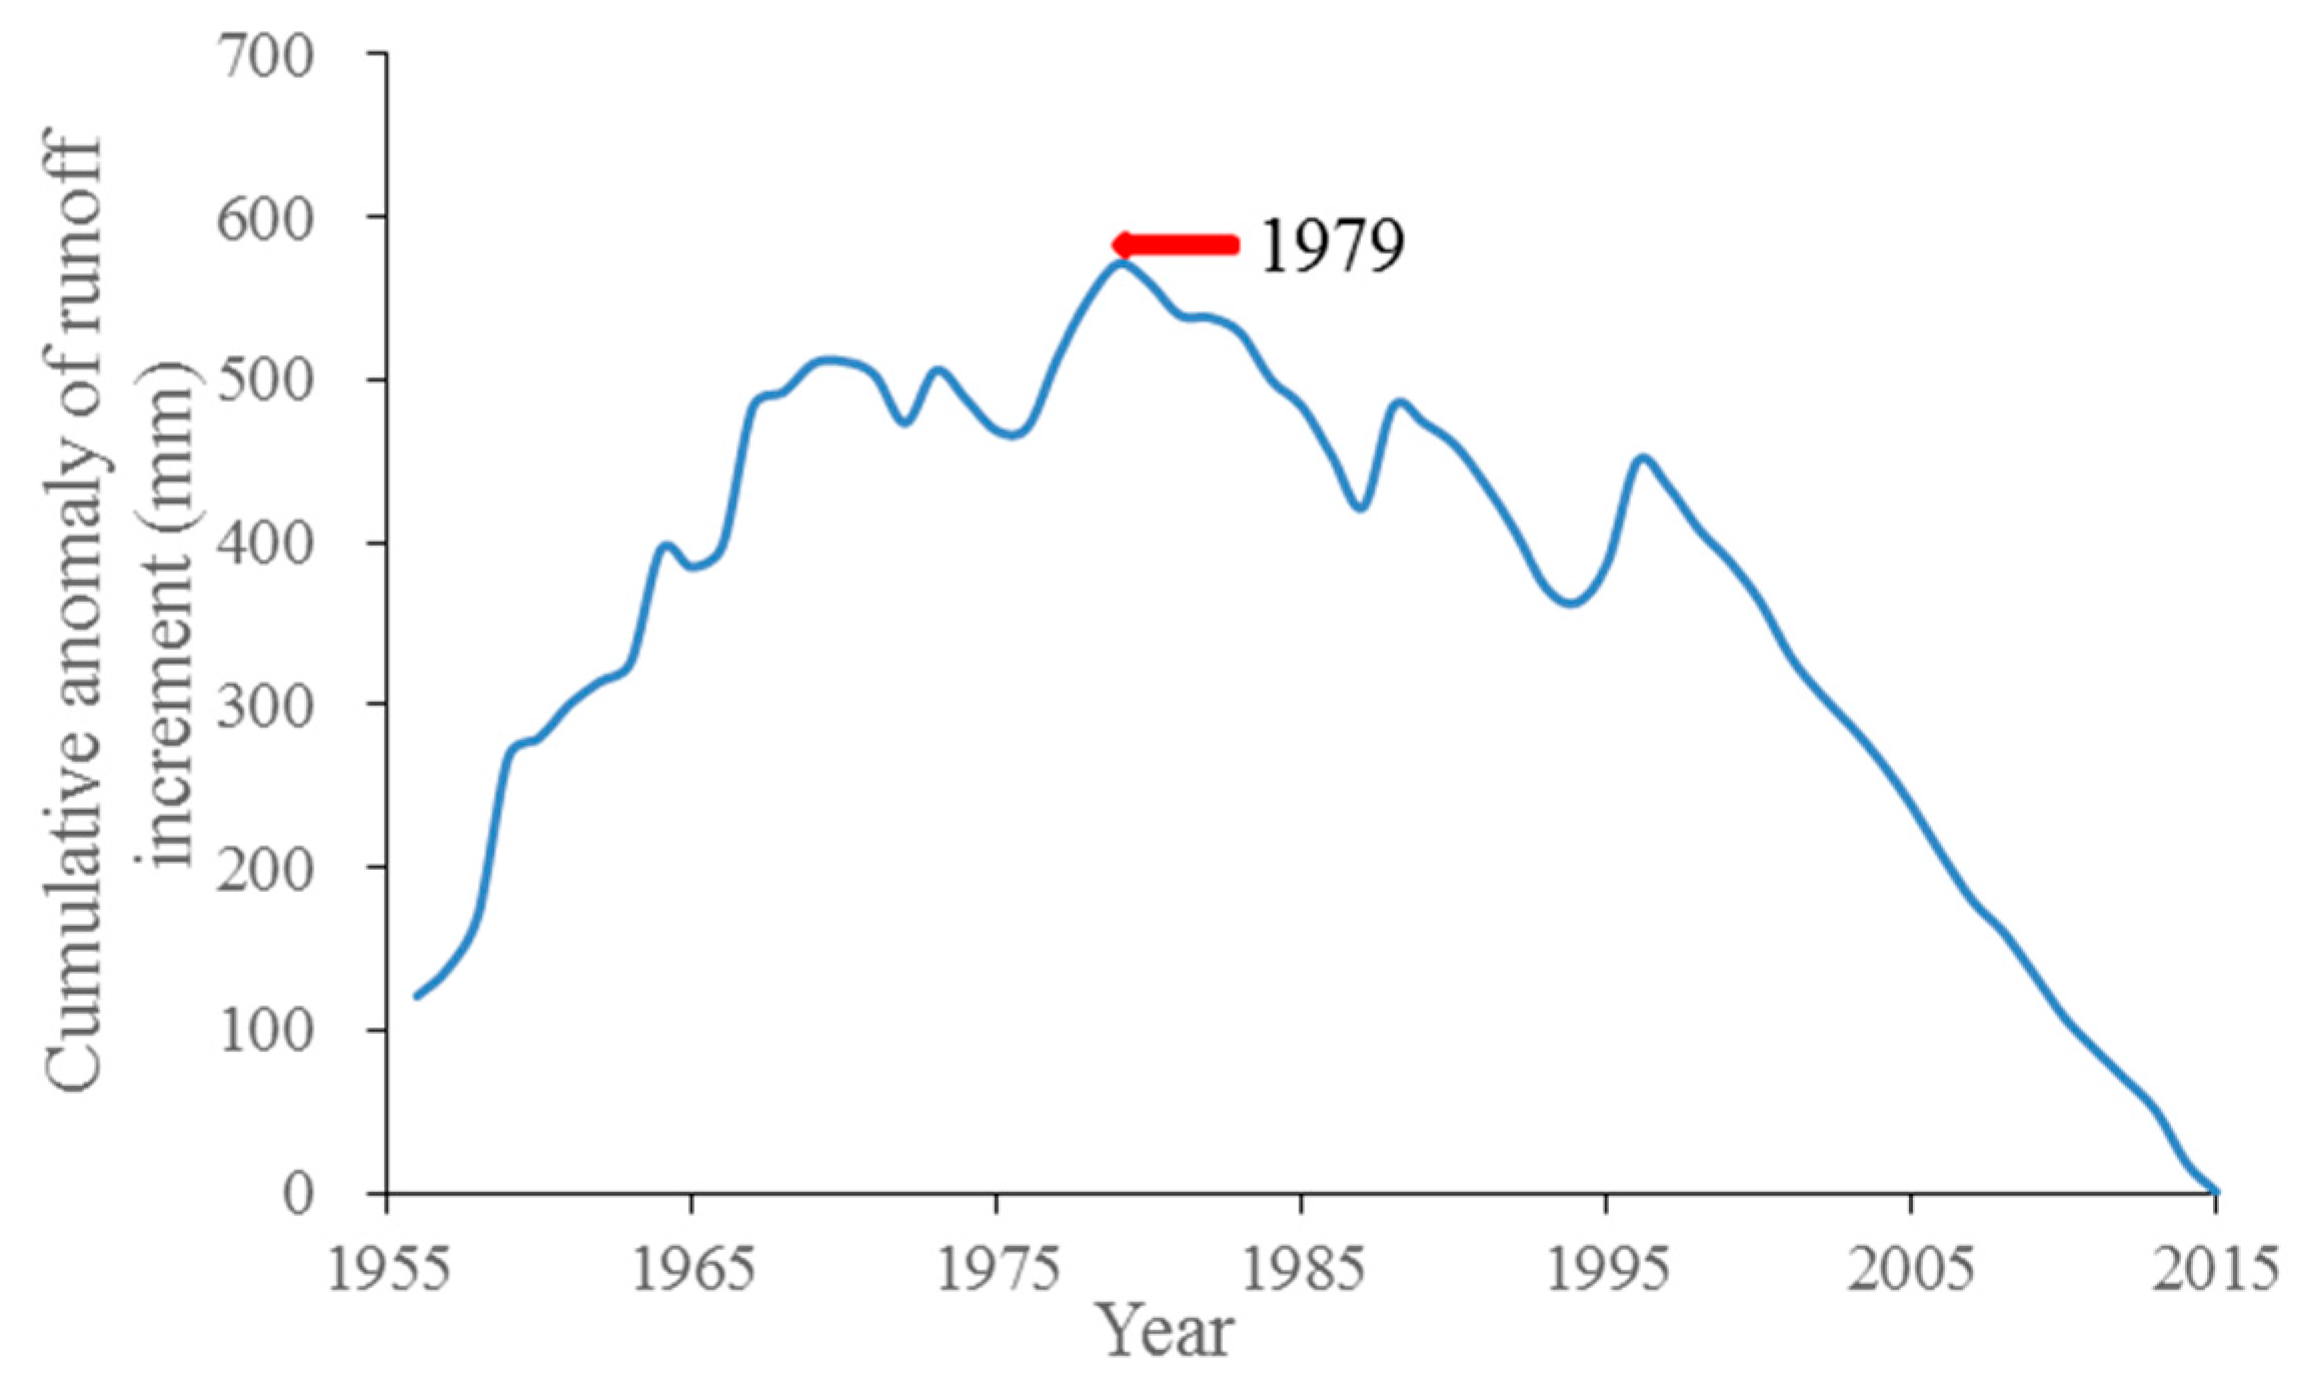
The observed annual R decreased significantly in the HTRB from 1956 to 2015; in contrast, the P exhibited a slight downward trend during the study period but had no significant changes. This may indicate that the linear relationships between P and R have changed during the past decades. Therefore, we used the cumulative anomaly method and the DCC method to detect the change point of the annual R series. The results of the cumulative anomaly method indicate that the significant change point for the HTRB occurred in 1979 (Figure 3). The cumulative annual P and R shown in Figure 4 demonstrate that before 1979, the DCC was nearly a straight line, but the line has different slopes before and after 1979, which may indicate that the characteristics of either P or R changed. Therefore, by combining the results of the cumulative anomaly test and the DCC analysis, 1979 could identify the change point that reflects the effect of human activities on R. Consequently, 1956–1978 was used as the baseline period in which the effect of human activities on R was less recognized, and the period of 1979–2015 was considered as the human-induced period.
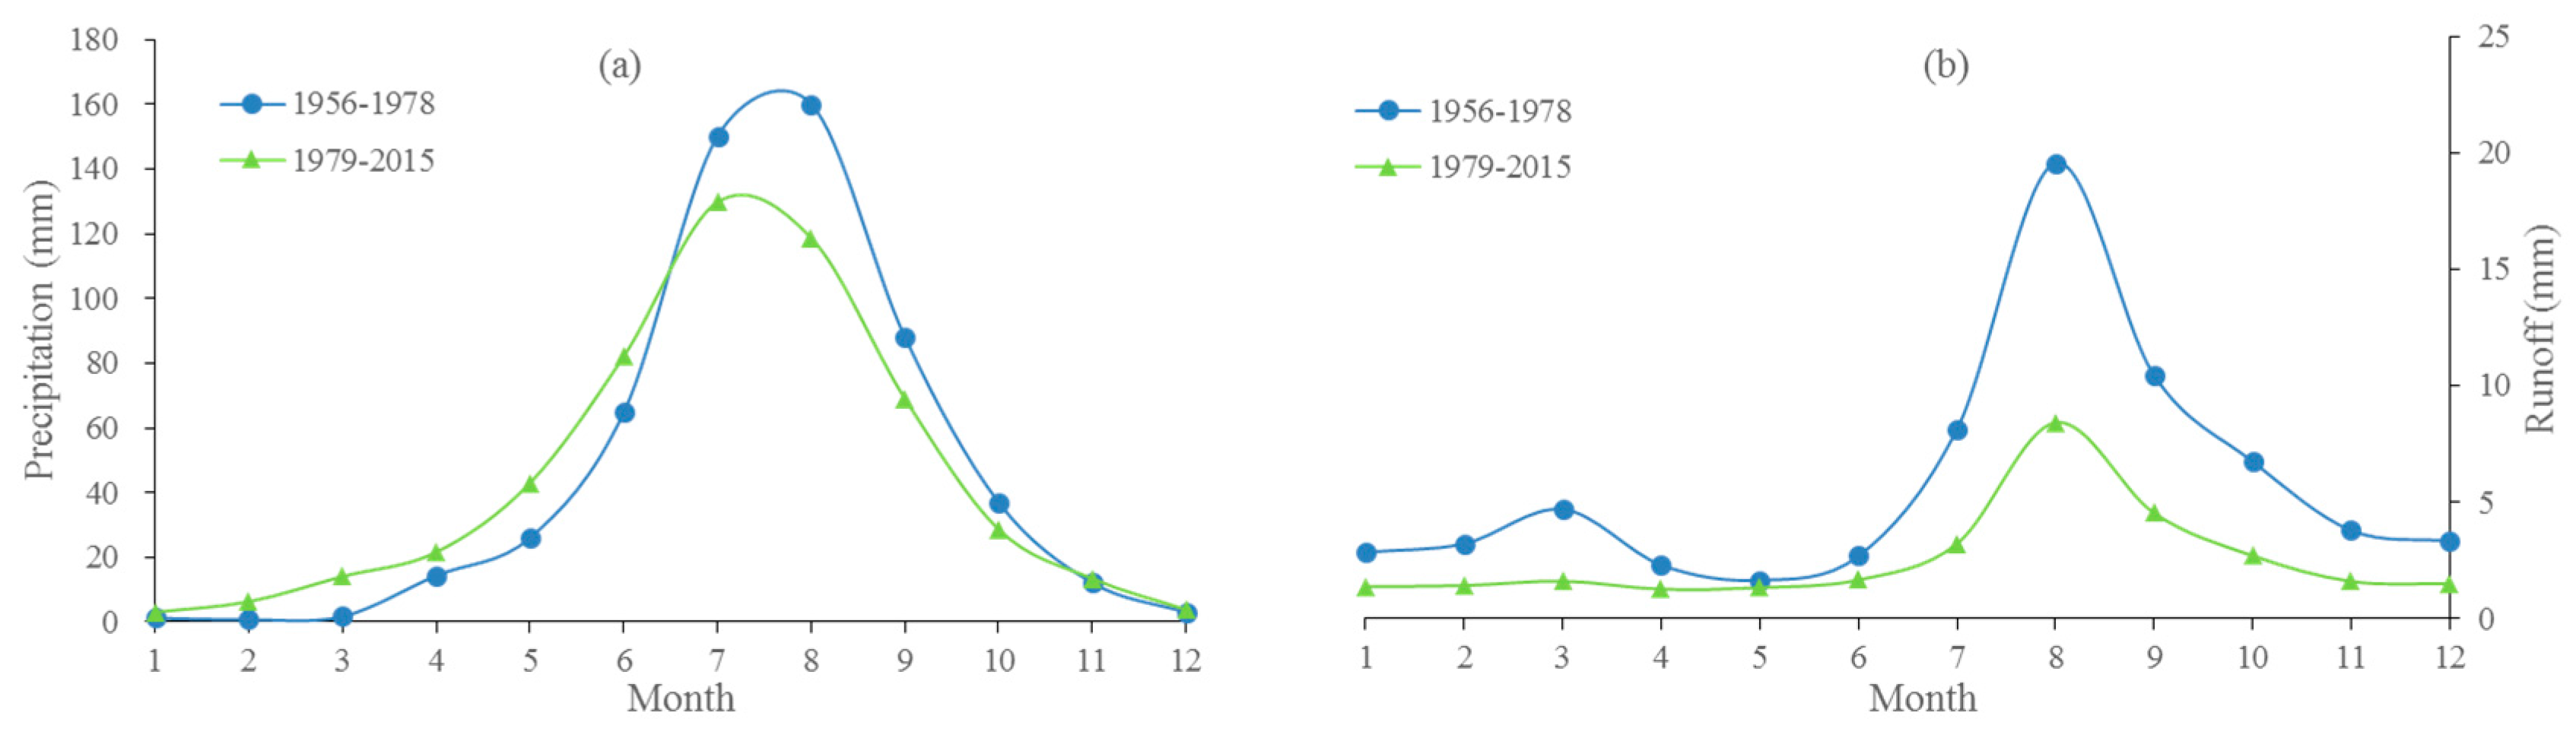
The intra-annual variability in R was related to the monthly cycles of P, T, and water-related human activities in the catchment. To further understand the intra-annual variability in P and R, the average monthly P and R between the baseline period (1956–1978) and the human-induced period (1979–2015) was investigated (Figure 5). Both the average monthly P and R changed in the two periods, though a larger change can be seen in the R series. The declines in R were most dramatic during the flood and irrigation seasons (i.e., July to September) compared to the P decreased during the same time. P increased, while R consistency declined from January to June between the two periods. Therefore, the decrease in R from 1979–2015 may be due to catchment-level water-related human activities, such as agricultural irrigation and industrial development.
3.3. Contributions of Climatic Elements to R Changes
As mentioned above, the change point for the HTRB occurred in 1979; thus, we divided the study period into two periods, namely, the baseline period (i.e., 1956–1978) and the change period (i.e., 1979–2015). According to Table 4, the observed average annual R was 69.4 mm between 1956 and 1978 and 30.7 mm between 1979 and 2015; this means the average annual R decreased by −38.7 mm compared to the baseline period, which represents approximately 56% of the baseline period R. The P, SD, RH, and WS decreased with change rates of −4.6%, −8.7%, −5.7%, and −20.5%, respectively; however, T increased with a change rate of 32.9% (Table 4). The rates of change of the R, T, and WS were much higher compared with those of the P, SD, and RH.
To assess the impact of each climatic factor on R, the climate elasticity model was used in this study. The climate elasticity coefficient and the influence amount of each climatic factor on R change were calculated using Equations (4) and (5). As shown in Table 5, the values of , , , , and were 1.84, −1.07, −2.79, 1.73, and −0.45, respectively. The results indicated that a 1% increase in P and RH would result in a 1.84% and 1.73% increase in R, respectively; additionally, a 1% increase in T, SD, and WS would lead to a 1.07%, 2.79%, and 0.45% decrease in R, respectively. The value of was 1.5–6.2 times larger than the other climatic variable elasticities in this basin, indicating that streamflow was more sensitive to SD than to other climatic variables.
According to Equation (5), the influence amount of each climatic factor on R change can be calculated using the calculated climate elasticity coefficients of each climatic element. It can be estimated that the 25.6 mm decrease in P observed between 1979 and 2015 may reduce the R by 4.0 mm (Table 5). Meanwhile, the influence amounts of T, SD, RH, and WS on R change were −13.3, 11.7, −4.7, and 4.8 mm, respectively; therefore, the contribution of each climatic factor on R change was 10.3%, 34.4%, −30.2%, 12.1%, −12.4%, respectively (Table 5). These results indicated that the P, T, and RH showed positive contribution to changes in R; additionally, the SD and WS negatively contributed to decreases in R in the HTRB, and furthermore, the contributions of T and SD were much larger than those of P, RH, and WS. As a whole, the impact of climate change was a 5.5 mm decrease in annual R in the HTRB, which contributed to 14% of the total decrease in R; thus, human activities were responsible for 86% of the decrease in R. In other words, the effect of human activities played a dominant role in the decline of R in the HTRB.
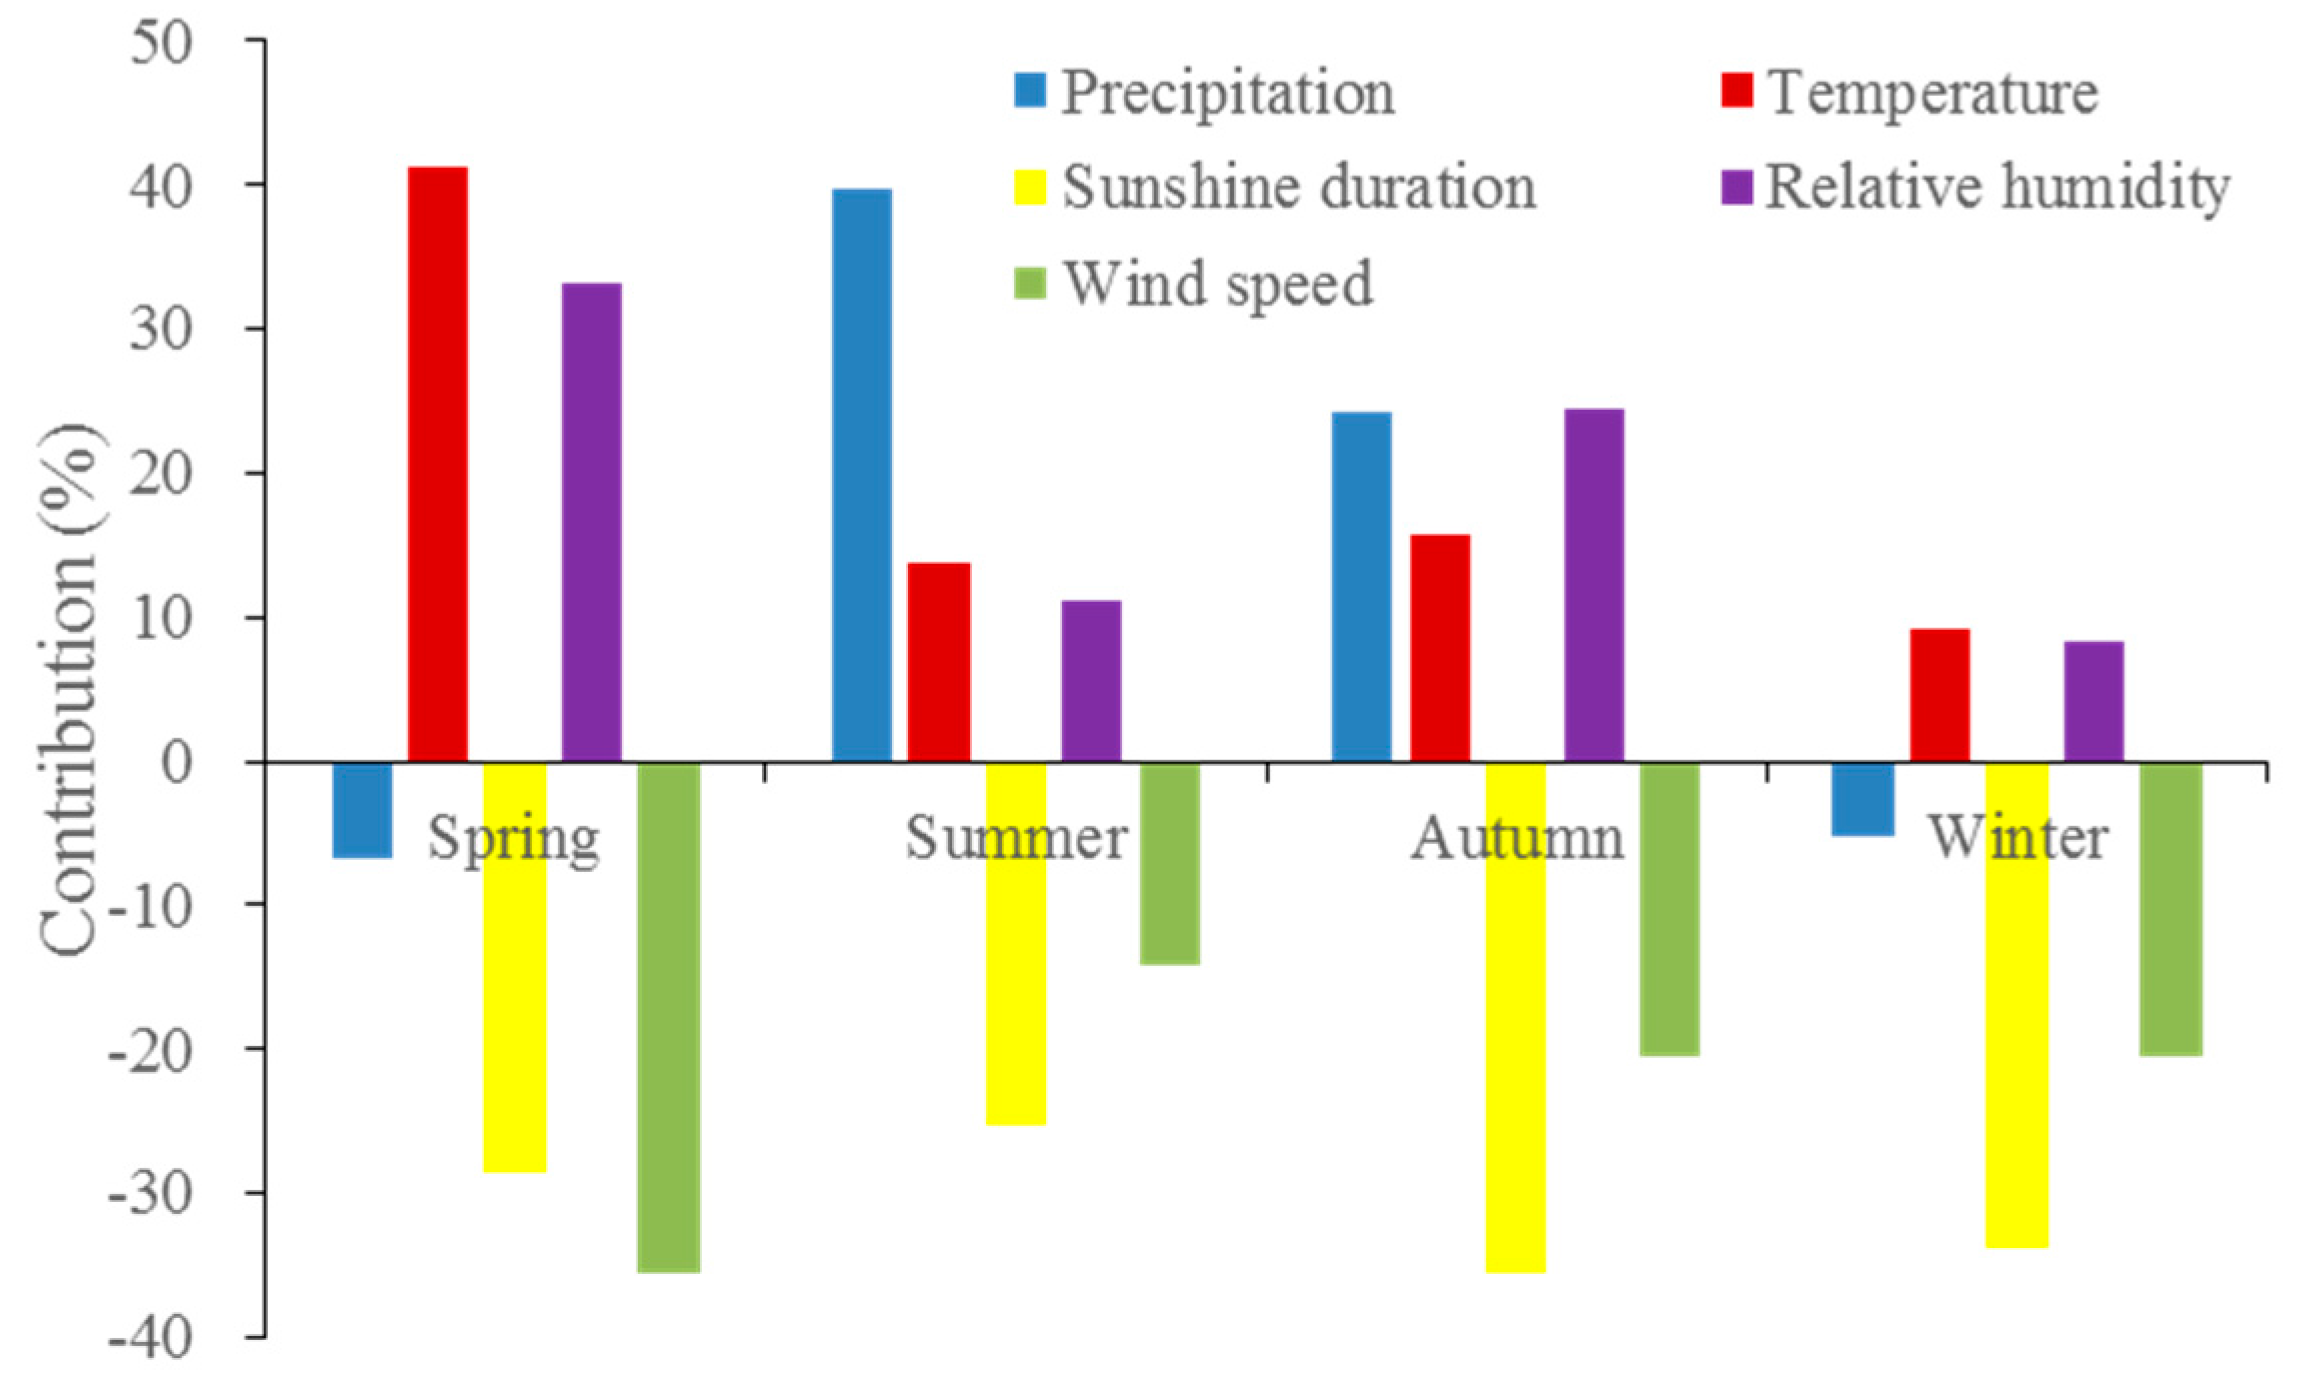
Seasonal changes in R and climatic elements are more important for agriculture than are annual changes. As mentioned above, seasonal R decreased significantly in the HTRB during the study period. Moreover, compared with the baseline period, the decreased rate of R observed during all four seasons throughout the change period exceeded 50% (Table 6). In this study, we also calculated the contributions of each climatic factor to seasonal R changes by using the climate elasticity method in the HTRB, as shown in Figure 6. As with the annual scale, the P, T, and RH showed positive contributions to the seasonal R change; in contrast, SD and WS negatively contributed to seasonal R decreases in the HTRB, with the exceptions of spring P and winter P (which showed a negative contribution to R change, Figure 6). However, there were differences in the sensitivity of climatic factors to R in each season. In spring, the decrease in R was attributed to the increase in T and the decrease in RH; additionally, both T and RH contributed to more than 30% of the spring R decrease, while WS, SD, and P exhibited negative contributions to the spring R decrease. In summer, P contributed more than 40% to the reduction of R, followed by T and RH, while SD and WS negatively contributed to the decrease in R. In autumn, RH and P showed nearly identical contributions to R change, while SD contributed more than −30% to the decrease in R. In winter, R reduction was less sensitive to climatic factors except for SD and WS (Figure 6). In other words, R change was dominated by T and RH in spring, P in summer, RH and P in autumn, and SD and WS in winter. As a whole, the contributions of the climatic factors to each seasonal R decline were 17%, 25%, 8% and −42%, respectively. In other words, climate change decreased the seasonal R, except for winter R (i.e., climate change increased the winter R).
4. Discussion
4.1. Climate Elasticity
The climate elasticity method was used to assess the impact of climate change on R in some catchments in China. In terms of climate elasticity, most previous studies mainly concentrated on the impacts of P and potential evapotranspiration on R (e.g., [20,24,27,29]). Several studies expressed the R change as a function of the change in P and evaporation-related climatic variables (i.e., T, SD, RH and WS) and evaluated their contributions to changes in R (e.g., [25,33]). In practice, the impacts of SD, RH, and WS on changes in R should not be ignored. Therefore, we calculated the climatic variable (e.g., P, T, SD, RH, and WS) elasticities by the climate elasticity method and quantitatively assessed the impact of each climatic variable on R changes in the HTRB. In this study, the , , , , and values were 1.84, −1.07, −2.79, 1.73, and −0.45, respectively. Table 7 compares our results with estimates of climate elasticities from references, illustrating good agreement between our results and the references.
Notably, most previous studies mainly concentrated on the impact of net radiation (RN) on R, and several studies researched the impact of SD variability on R change. SD is one of the variables used to calculate RN, and the latter is one of the most impact factors for catchment evapotranspiration; thus, SD indirectly impacts changes in R [47], and some researchers believe that SD plays a non-negligible role in R variation [33,48]. Data on SD are more accessible than are data on RN. Therefore, in this study, we used SD data to assess the impact of SD on changes in R. As can be seen in Table 7, both the RN and SD of the reference results and the results from the present study showed negative contributions to decreases in R. These results showed good agreement between our results for the five climatic variable elasticities and the values provided in the references.
4.2. Effect of Climate Change on R
The contributions of climatic elements to changes in R can be evaluated by climate elasticity and changes in climatic elements.
P positively contributed to the annual decline in R in the HTRB between 1956 and 2015. This was because the decrease in annual P was nonsignificant with a rate of −7.31 mm/10a. The HTRB is a typical monsoonal climate that is controlled by the East Asia monsoon (EAM) in the summer and autumn and the westerlies in the spring and winter. In the HTRB, 70–80% of P falls between July and September; in other words, annual P mainly occurs in summer and autumn. So, P in the HTRB is strongly influenced by the EAM, and water vapor is transported from the Pacific into Asia by the EAM as the source of summer and autumn P; therefore, variability in the EAM greatly affects the temporal and spatial distribution of P variables. However, the decreases in summer and autumn P were insignificant, at rates of −13.59 and −3.95 mm/10a, respectively. These decreases may be caused by the weakening of the EAM [6,48]. Due to increases in the westerlies, the spring and winter P increased significantly [49]. Therefore, spring and winter P negatively contributed to the decreases in spring and winter R, and summer and autumn P positively contributed to the same seasonal R decline. Additionally, the decreases in summer and autumn P were nonsignificant, and the spring and winter P increased significantly; furthermore, the annual P mainly occurred in summer and autumn, so the decrease in annual P was nonsignificant. Therefore, annual P positively contributed to annual R decline.
Between 1956 and 2015, there was a significant increasing trend for all annual and seasonal T in the HTRB due to human activities, which included industrialization and agricultural production [50], leading to a positive contribution to declines in R. Rising T lead to more evaporative demand and further induce more evaporation; thus, this reduces R. In fact, rising air temperature also have indirect impacts on runoff [26]. For example, Chiew et al. reported that a degree global warming will result in −10–3% changes in precipitation in Australia, leading to runoff change [30].
Between 1956 and 2015, SD negatively contributed to R in the HTRB. As a result of atmospheric dimming and increased atmospheric turbidity, there was an obvious decrease in SD in China, especially in the Hai River basin [51,52]. The combined direct and indirect effects of aerosols can reduce SD, especially through the effects of haze in autumn and winter [53,54]. Due to the haze events in autumn and winter, the number of sunshine hours decreased, which decreases the RN to the Earth’s surface and causes a decrease in evaporation, and then R increases.
RH negatively contributed to the decrease in R that occurred in the HTRB between 1956 and 2015; specifically, this was caused by the trend of RH change. Seasonal RH also negatively contributed to seasonal changes in R. The annual and seasonal RH exhibited declining trends in the HTRB. The decline in RH was mainly caused by the increasing rates of specific humidity that were smaller than those of surface saturation specific humidity caused by increases in T [55].
The weakening wind might be due to atmospheric circulation and urbanization [56], and the non-uniformity of warming may have also played an important role because non-uniform warming would result in a smaller T difference between the south and the north, causing a WS, i.e., weakened winds [48]. Consequently, WS weakened, which led to a decrease in evaporation and an increase in R. Therefore, the significantly weakening WS resulted in WS having a large negative contribution to declines in R.
4.3. Comparison with Other Research
In this study, annual R in the change period (i.e., 1979–2015) decreased by 56% compared to the baseline period (i.e., 1956–1978), and the contributions of P, T, SD, RH, and WS on changes in R were 10.3%, 34.4%, −30.2%, 12.1%, and −12.4%, respectively. The results indicated that the change of P, T, and RH positively contributed to declines in R, while the variation of SD and WS negatively contributed to decreases in R in the HTRB; furthermore, rising T was the dominant factor contributing to declining R in the HTRB.
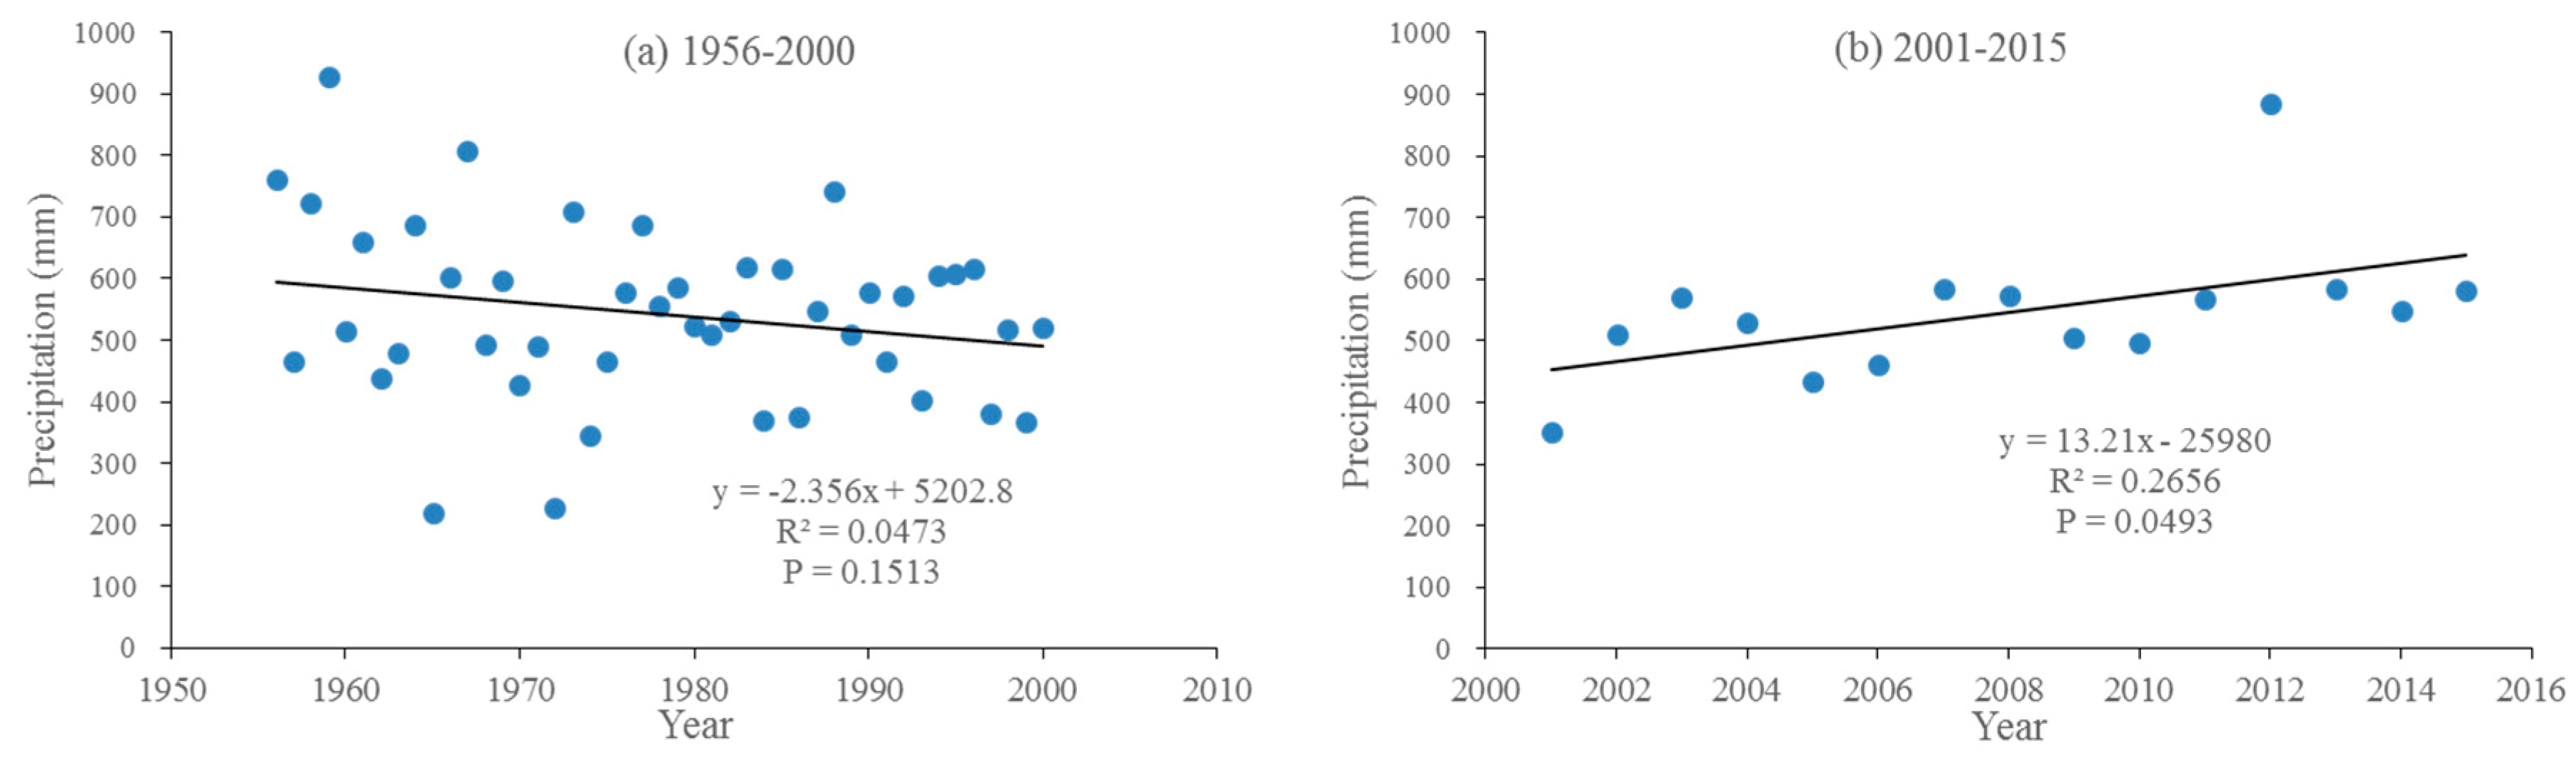
Previous studies reported that decreasing P was primarily responsible for the declines in R in the HTRB [25,36]. These conclusions were mainly due to the different time periods of the datasets. Yang et al. noted that P decreased to −27 mm/10a between 1961 and 2000 and accounted for approximately 12% of the decrease in R in the HTRB [25]. Wang et al. determined that P decreased significantly at a rate of −51.7 mm/10a between 1957 and 2000, and a 69% reduction in R contributed to the significant decreasing trends in P in the HTRB, however, their paper concerned only the P elasticity [36]. In this study, P decreased by −23.6 mm/10a during 1956–2000 and increased by 132.1 mm/10a during 2001–2015 (Figure 7), leading to a nonsignificant decreasing trend in P between 1956 and 2015 with a rate of −7.3 mm/10a. The decrease in P was nonsignificant and accounted for 10% of the decrease in R.
In this study, the decreasing in R was mainly determined by rising T, which accounted for approximately 34% of the R decline. The rising in T accounted for approximately 20% of the decline in R in the HTRB during 1961–2000 [25], which was lower than our result; this was mainly due to the lower warming trend and T elasticity. In their paper, the warming trend was 0.25 °C/10a, and T elasticity was −0.048; in contrast, in this paper, the T increased significantly over 1956–2015, with a slope of 0.58 °C/10a, and T elasticity was −1.07. Previous studies also showed that T increased by 0.53 °C/10a in the HTRB during 1956–2000 [44], T elasticity ranged between −0.79 and −1.13 in the Haihe River basin [57], and T increases were primarily responsible for the changes in R in the Haihe River basin, contributing to approximately 40% of the observed change [58]. All these results agree with our results.
SD showed a negative contribution (−30%) to declines in R in this study; this was because SD decreased significantly (−0.26 h/day decade−1), and there was a large SD elasticity (−2.79). Wang et al. reported that the number of sunshine hours decreased by approximately 7% in the HTRB during 1956–2000 [44]. The reason for this difference was caused by the differences in SD elasticity between the two studies. The SD elasticity in this study was much larger than that in Want et al.
Both the RH and WS changes contributed approximately 12% to the decrease in R in this study; specifically, the RH showed a positive contribution, and the WS showed a negative contribution. The decreasing RH led to the increase in actual evapotranspiration, and thus, the decrease in R. The reduced WS resulted in the reduction of actual evapotranspiration and the complementary increase of streamflow [59]. The decrease in RH was responsible for 7.1% of the decrease in R, and the decrease in WS contributed to a 10.7% increase in R in the Yellow River basin during 1960–2011 [46]. Their results were similar to our findings.
As a whole, the impact of climate change contributed to a 14% decrease in the R in the HTRB; thus, human activities were responsible for 86% of the decreased R. In other words, the effect of human activities played a dominant role in the decline in R in the HTRB. Previous studies also reported that human activities were the dominant factor affecting R decline in the HTRB [60] and in the Haihe basin [29,34]. For example, the impacts of climate variation and human activities were responsible for average R decreases of 26.9% and 73.1%, respectively [29]. Overall, the results of this study are reasonable when compared with other studies.
5. Conclusions
In this paper, we used the climate elasticity method to assess the contributions of climatic factors on annual and seasonal R change for the period of 1956–2015 in the HTRB. We first investigated the characteristics of changes in annual, seasonal, and monthly hydroclimatic variables, including R, P, T, SD, RH, and WS, during the period of 1956–2015 in the HTRB. Based on the change point of annual R in the HTRB, the whole study period, i.e., from 1956 to 2015, was divided into two periods, the baseline and change periods. The differences in R, P, T, SD, RH, and WS between the two periods were then calculated. The impacts of each climatic factor on R change were discussed based on the climate elasticity method. The main conclusions are summarized below:
Significant downward trends were found for annual R, SD, RH, and WS; additionally, P also decreased but did not pass the 0.05 level of significance test. In contrast, T increased significantly, with a rate of 0.58 °C/10a. On the seasonal scale, the R, SD, RH, and WS in four seasons all significantly decreased. T showed a significant warming trend in all four seasons. P significantly increased in spring and winter, and P decreased in summer and autumn, though this decrease was insignificant.
The cumulative anomaly test and the P-R double cumulative curve demonstrated that annual R showed an abrupt change in 1979. Thus, the whole study period, i.e., from 1956 to 2015, was divided into two periods, the baseline period (1956–1978) and the change period (1979–2015).
Based on the climate elasticity method, the climate elasticities of climatic factors were calculated, and the values of , , , , and were 1.84, −1.07, −2.79, 1.73, and −0.45, respectively; additionally, the contribution of each climatic factor to the decline in R was 10.3%, 34.4%, −30.2%, 12.1%, and −12.4%, respectively. In the HTRB, the increase in T was the main cause of the decline in R, while SD largely negatively contributed to the R decline. In terms of seasonal, R change was dominated by T and RH in spring, P in summer, RH and P in autumn, and SD and WS in winter.
This study points out the necessity of researching hydrological and climate change in the HTRB and investigates the impact of five climate factors on runoff change by the climate elasticity method and highlights the necessity of investigating runoff responses to climatic elements other than the precipitation and temperature. However, the meteorological data in the high elevation are scarce, more comprehensive and in-depth analyses may be needed for future studies by using the remote sensing data.
Acknowledgments
The authors would like to express their gratitude for the financial support of the National Basic Research Program of China (973 Program) (2015CB452701) and the key study team of the State Key Laboratory of Simulation and Regulation of Water Cycle in River Basin, China Institute of Water Resources and Hydropower Research (2016ZY03).
Author Contributions
Fei Xu carried out the study, analyzed the data, and wrote the first manuscript draft. Yangwen Jia developed the study concept, provided oversight throughout the study, and revised the manuscript. Cunwen Niu provided valuable comments in revising the manuscript. Jiajia Liu and Chunfeng Hao assisted in dealing with the data analysis.
Conflicts of Interest
The authors declare no conflict of interest.
References
- Xu, C.; Singh, V.P. Review on regional water resources assessment models under stationary and changing climate. Water Resour. Manag. 2004, 18, 591–612. [Google Scholar] [CrossRef]
- Xu, C.; Gong, L.; Jiang, T.; Chen, D.; Singh, V.P. Analysis of spatial distribution and temporal trend of reference evapotranspiration and pan evaporation in Changjiang (Yangtze River) catchment. J. Hydrol. 2006, 327, 81–93. [Google Scholar] [CrossRef]
- The Intergovernmental Panel on Climate Change (IPCC). Climate change 2013: The physical science basis. In Contribution of Working Group I to the 5th Assessment Report of the Intergovernmental Panel on Climate Change; Cambridge University Press: Cambridge, UK; New York, NY, USA, 2013. [Google Scholar]
- Chattopadhyay, S.; Edwards, D.R. Long-term trend analysis of precipitation and air temperature for Kentucky, United States. Climate 2016, 4, 10. [Google Scholar] [CrossRef]
- Chattopadhyay, S.; Edwards, D.R.; Yu, Y. Contemporary and future characteristics of precipitation indices in the Kentucky River Basin. Water 2017, 2, 109. [Google Scholar] [CrossRef]
- Zhang, Q.; Xu, C.; Chen, X.; Zhang, Z. Statistical behaviours of precipitation regimes in China and their links with atmospheric circulation 1960–2005. Int. J. Climatol. 2011, 31, 1665–1678. [Google Scholar] [CrossRef]
- Wang, G.; Xia, J.; Chen, J. Quantification of effects of climate variations and human activities on runoff by a monthly water balance model: A case study of the Chaobai River basin in northern China. Water Resour. Res. 2009, 45. [Google Scholar] [CrossRef] [Green Version]
- Wang, D.; Hejazi, M. Quantifying the relative contribution of the climate and direct human impacts on mean annual streamflow in the contiguous United States. Water Resour. Res. 2011, 47. [Google Scholar] [CrossRef]
- Zhan, C.; Jiang, S.; Sun, F.; Jia, Y.; Niu, C.; Wang, F. Quantitative contribution of climate change and human activities to runoff changes in the Wei River basin, China. Hydrol. Earth Syst. Sci. 2014, 11, 2149–2175. [Google Scholar] [CrossRef]
- Zhou, Y.; Xu, Y.; Xiao, W.; Wang, J.; Huang, Y.; Yang, H. Climate change impacts on flow and suspended sediment yield in headwaters of high-latitude regions—A case study in China’s far northeast. Water 2017, 9, 966. [Google Scholar] [CrossRef]
- Piao, S.; Ciais, P.; Huang, Y.; Shen, Z.; Peng, S.; Li, J.; Zhou, L.; Liu, H.; Ma, Y.; Ding, Y.; et al. The impacts of climate change on water resources and agriculture in China. Nature 2010, 467, 43–51. [Google Scholar] [CrossRef] [PubMed]
- Piervitali, E.; Colacino, M.; Conte, M. Signals of climatic change in the Central-Western Mediterranean Basin. Theor. Appl. Climatol. 1997, 58, 211–219. [Google Scholar] [CrossRef]
- Liu, B.; Xu, M.; Henderson, M.; Qi, Y. Observed trends of precipitation amount, frequency, and intensity in China, 1960–2000. J. Geophys. Res. Atmos. 2005, 110. [Google Scholar] [CrossRef]
- Zhai, P.; Zhang, X.; Wan, H.; Pan, X. Trends in total precipitation and frequency of daily precipitation extremes over China. J. Clim. 2005, 18, 1096–1108. [Google Scholar] [CrossRef]
- Dong, D.; Huang, G.; Qu, X.; Tao, W.; Fan, G. Temperature trend–altitude relationship in China during 1963–2012. Theor. Appl. Climatol. 2014, 122, 285–294. [Google Scholar] [CrossRef]
- Tian, J.; Liu, J.; Wang, J.; Li, C.; Nie, H.; Yu, F. Trend analysis of temperature and precipitation extremes in major grain producing area of China. Int. J. Climatol. 2017, 37, 2. [Google Scholar] [CrossRef]
- Wang, S. Spatiotemporal variability of temperature trends on the southeast Tibetan Plateau, China. Int. J. Climatol. 2017, 5. [Google Scholar] [CrossRef]
- Wang, Q.; Wang, M.; Fan, X.; Qin, Z.; Wang, M. Trends of temperature and precipitation extremes in the Loess Plateau Region of China, 1961–2010. Glob. Planet Chang. 2012, 92–93, 138–147. [Google Scholar] [CrossRef]
- Jia, Y.; Ding, X.; Wang, H.; Zhou, Z.; Qiu, Y.; Niu, C. Attribution of water resources evolution in the highly water-stressed Haihe River Basin of China. Water Resour. Res. 2012, 48. [Google Scholar] [CrossRef]
- Hu, S.; Liu, C.; Zheng, H.; Wang, Z.; Yu, J. Assessing the impacts of climate variability and human activities on streamflow in the water source area of Baiyangdian Lake. J. Geogr. Sci. 2012, 22, 895–905. [Google Scholar] [CrossRef]
- Schaake, J.C. From Climate to Flow, in Climate Change and U.S. Water Resources; Waggoner, J., Ed.; Wiley: New York, NY, USA, 1990; pp. 177–206. [Google Scholar]
- Sankarasubramanian, A.; Vogel, R.M.; Limbrunner, J.F. Climate elasticity of streamflow in the United States. Water Resour. Res. 2001, 37, 1771–1781. [Google Scholar] [CrossRef]
- Fu, G.; Charles, S.P.; Chiew, F.H.S. A two-parameter climate elasticity of streamflow index to assess climate change effects on annual streamflow. Water Resour. Res. 2007, 43. [Google Scholar] [CrossRef]
- Zheng, H.; Zhang, L.; Zhu, R.; Liu, C.; Sato, Y.; Fukushima, Y. Responses of streamflow to climate and land surface change in the headwaters of the Yellow River Basin. Water Resour. Res. 2009, 45. [Google Scholar] [CrossRef]
- Yang, H.; Yang, D. Derivation of climate elasticity of runoff to assess the effects of climate change on annual runoff. Water Resour. Res. 2011, 47. [Google Scholar] [CrossRef]
- Huang, Z.; Yang, H.; Yang, D. Dominant climatic factors driving annual runoff changes at the catchment scale across China. Hydrol. Earth Syst. Sci. 2016, 20, 2573–2587. [Google Scholar] [CrossRef]
- Li, F.; Zhang, G.; Xu, Y. Separating the impacts of climate variation and human activities on runoff in the Songhua river basin, northeast China. Water 2014, 6, 3320–3338. [Google Scholar] [CrossRef]
- Ma, H.; Yang, D.; Tan, S.K.; Gao, B.; Hu, Q. Impact of climate variability and human activity on streamflow decrease in the Miyun Reservoir catchment. J. Hydrol. 2010, 389, 317–324. [Google Scholar] [CrossRef]
- Xu, X.; Yang, D.; Yang, H.; Lei, H. Attribution analysis based on the Budyko hypothesis for detecting the dominant cause of runoff decline in Haihe basin. J. Hydrol. 2014, 510, 530–540. [Google Scholar] [CrossRef]
- Chiew, F.S. Estimation of rainfall elasticity of streamflow in Australia. Hydrol. Sci. J. 2006, 51, 613–625. [Google Scholar] [CrossRef]
- Berghuijs, W.; Hartmann, A.; Woods, R. Streamflow sensitivity to water storage changes across Europe. Geophys. Res. Lett. 2016, 43, 1980–1987. [Google Scholar] [CrossRef]
- Thériault, J.M.; Milbrandt, J.A.; Doyle, J.; Minder, J.R.; Thompson, G.; Sarkadi, N.; Geresdi, I. Impact of melting snow on the valley flow feld and precipitation phase transition. Atmos. Res. 2015, 156, 111–124. [Google Scholar] [CrossRef]
- Meng, D.; Mo, X. Assessing the effect of climate change on mean annual runoff in the Songhua River basin, China. Hydrol. Process. 2012, 26, 1050–1061. [Google Scholar] [CrossRef]
- Yang, Y.; Tian, F. Abrupt change of runoff and its major driving factors in Haihe River Catchment, China. J. Hydrol. 2009, 374, 373–383. [Google Scholar] [CrossRef]
- Wang, W.; Peng, S.; Yang, T.; Shao, Q.; Xu, J.; Xing, W. Spatial and temporal characteristics of reference evapotranspiration trends in the Haihe River basin, China. J. Hydrol. Eng. 2011, 16, 239–252. [Google Scholar] [CrossRef]
- Wang, W.; Shao, Q.; Yang, T.; Peng, S.; Xing, W.; Sun, F.; Luo, Y. Quantitative assessment of the impact of climate variability and human activities on runoff changes: A case study in four catchments of the Haihe River basin, China. Hydrol. Process. 2013, 27, 1158–1174. [Google Scholar] [CrossRef]
- Peng, S.; Liu, W.; Wang, W.; Shao, Q.; Jiao, X.; Yu, Z.; Xing, W.; Xu, J.; Zhang, Z.; Luo, Y. Estimating the effects of climatic variability and human activities on streamflow in the Hutuo River Basin, China. J. Hydrol. Eng. 2013, 18, 422–430. [Google Scholar] [CrossRef]
- Yue, S.; Pilon, P.; Cavadias, G. Power of the Mann-Kendall and Spearman’s rho tests for detecting monotonic trends in hydrological series. J. Hydrol. 2002, 259, 254–271. [Google Scholar] [CrossRef]
- Hirsch, R.M.; Slack, J.R.; Smith, R.A. Techniques of trend analysis for monthly water quality data. Water Resour. Res. 1982, 18, 107–121. [Google Scholar] [CrossRef]
- Sen, P.K. Estimates of the regression coefficient based on Kendall’s tau. J. Am. Stat. Assoc. 1968, 63, 1379–1389. [Google Scholar] [CrossRef]
- Ran, L.; Wang, S.; Fan, X. Channel change at Toudaoguai Station and its responses to the operation of upstream reservoirs in the upper Yellow River. J. Geogr. Sci. 2010, 20, 231–247. [Google Scholar] [CrossRef]
- Wang, S.; Yan, M.; Yan, Y.; Shi, C.; He, L. Contributions of climate change and human activities to the changes in runoff increment in different sections of the Yellow River. Quat. Int. 2012, 282, 66–77. [Google Scholar] [CrossRef]
- Huo, Z.; Feng, S.; Kang, S.; Li, W.; Chen, S. Effect of climate changes and water-related human activities on annual stream flows of the Shiyang river basin in arid north-west China. Hydrol. Process. 2008, 22, 3155–3167. [Google Scholar] [CrossRef]
- Wang, W.; Zou, S.; Shao, Q.; Xing, W.; Chen, X.; Jiao, X.; Luo, Y.; Yong, B.; Yu, Z. The analytical derivation of multiple elasticities of runoff to climate change and catchment characteristics alteration. J. Hydrol. 2016, 541, 1042–1056. [Google Scholar] [CrossRef]
- Zhang, Q.; Liu, J.; Singh, V.P.; Shi, P.; Sun, P. Hydrological responses to climatic changes in the Yellow River basin, China: Climatic elasticity and streamflow prediction. J. Hydrol. 2017, 554, 635–645. [Google Scholar] [CrossRef]
- Tang, Y.; Tang, Q.; Tian, F.; Zhang, Z.; Liu, G. Responses of natural runoff to recent climatic changes in the Yellow River basin, China. Hydrol. Earth Syst. Sci. 2013, 17, 4471–4480. [Google Scholar] [CrossRef]
- Zhang, L.; Dawes, W.R.; Walker, G.R. Response of mean annual evapotranspiration to vegetation changes at catchment scale. Water Resour. Res. 2001, 37, 701–708. [Google Scholar] [CrossRef]
- Cong, Z.; Zhao, J.; Yang, D.; Ni, G. Understanding the hydrological trends of river basins in China. J. Hydrol. 2010, 388, 350–356. [Google Scholar] [CrossRef]
- Li, Z.; He, Y.; Theakstone, W.H.; Wang, X.; Zhang, W.; Cao, W.; Du, J.; Xin, H.; Chang, L. Altitude dependency of trends of daily climate extremes in southwestern China, 1961–2008. J. Geogr. Sci. 2012, 22, 416–430. [Google Scholar] [CrossRef]
- Ren, G.; Ding, Y.; Zhao, Z.; Zheng, J.; Wu, T.; Tang, G.; Xu, Y. Recent progress in studies of climate change in China. Adv. Atmos. Sci. 2012, 29, 958–977. [Google Scholar] [CrossRef]
- Tang, W.; Yang, K.; Qin, J.; Cheng, C.C.K.; He, J. Solar radiation trend across China in recent decades: A revisit with quality-controlled data. Atmos. Chem. Phys. 2011, 11, 393–406. [Google Scholar] [CrossRef]
- Zhao, C.; Tie, X.; Lin, Y. A possible positive feedback of reduction of precipitation and increase in aerosols over eastern central China. Geophys. Res. Lett. 2006, 33, 229–239. [Google Scholar] [CrossRef]
- Wang, H.; Xie, X.; Liu, X. On the robustness of the weakening effect of anthropogenic aerosols on the East Asian summer monsoon with multimodel results. Adv. Meteorol. 2015, 2015, 1–8. [Google Scholar] [CrossRef]
- Zhao, X.; Zhao, P.; Xu, J.; Meng, W.; Pu, W.; Dong, E.; He, D.; Shi, Q. Analysis of a winter regional haze event and its formation mechanism in the North China Plain. Atmos. Chem. Phys. 2013, 13, 5685–5696. [Google Scholar] [CrossRef]
- Song, Y.; Liu, Y.; Ding, Y. A study of surface humidity changes in china during the recent 50 years. Acta. Meteorol. Sin. 2012, 26, 541–553. [Google Scholar] [CrossRef]
- Ren, G.; Zhou, Y.; Chu, Z.; Zhou, J.; Zhang, A.; Guo, J.; Liu, X. Urbanization effects on observed surface air temperature trends in North China. J. Clim. 2008, 21, 1333–1348. [Google Scholar] [CrossRef]
- Liu, J.; Zhang, Q.; Chen, X.; Gu, X. Quantitative evaluations of human- and climate-induced impacts on hydrological processes of China. Acta. Geogr. Sin. 2016, 11, 1875–1885. (In Chinese) [Google Scholar]
- Wang, Y.; Yang, D.; Lei, H.; Yang, H. Impact of cryosphere hydrological processes on the river runoff in the upper reaches of Heihe River. J. Hydraul. Eng. 2015, 9, 1064–1071. (In Chinese) [Google Scholar]
- Liu, X.; Zhang, X.; Tang, Q.; Zhang, X. Effects of surface wind speed decline on modeled hydrological conditions in China. Hydrol. Earth Syst. Sci. 2014, 18, 2803–2813. [Google Scholar] [CrossRef]
- Tian, F.; Yang, Y.; Han, S. Using runoff slope-break to determine dominate factors of runoff decline in Hutuo River Basin, North China. Water. Sci. Technol. 2009, 8, 2135–2144. [Google Scholar] [CrossRef] [PubMed]
Figure 1.
Location of the HTRB and the hydrological and meteorological stations.
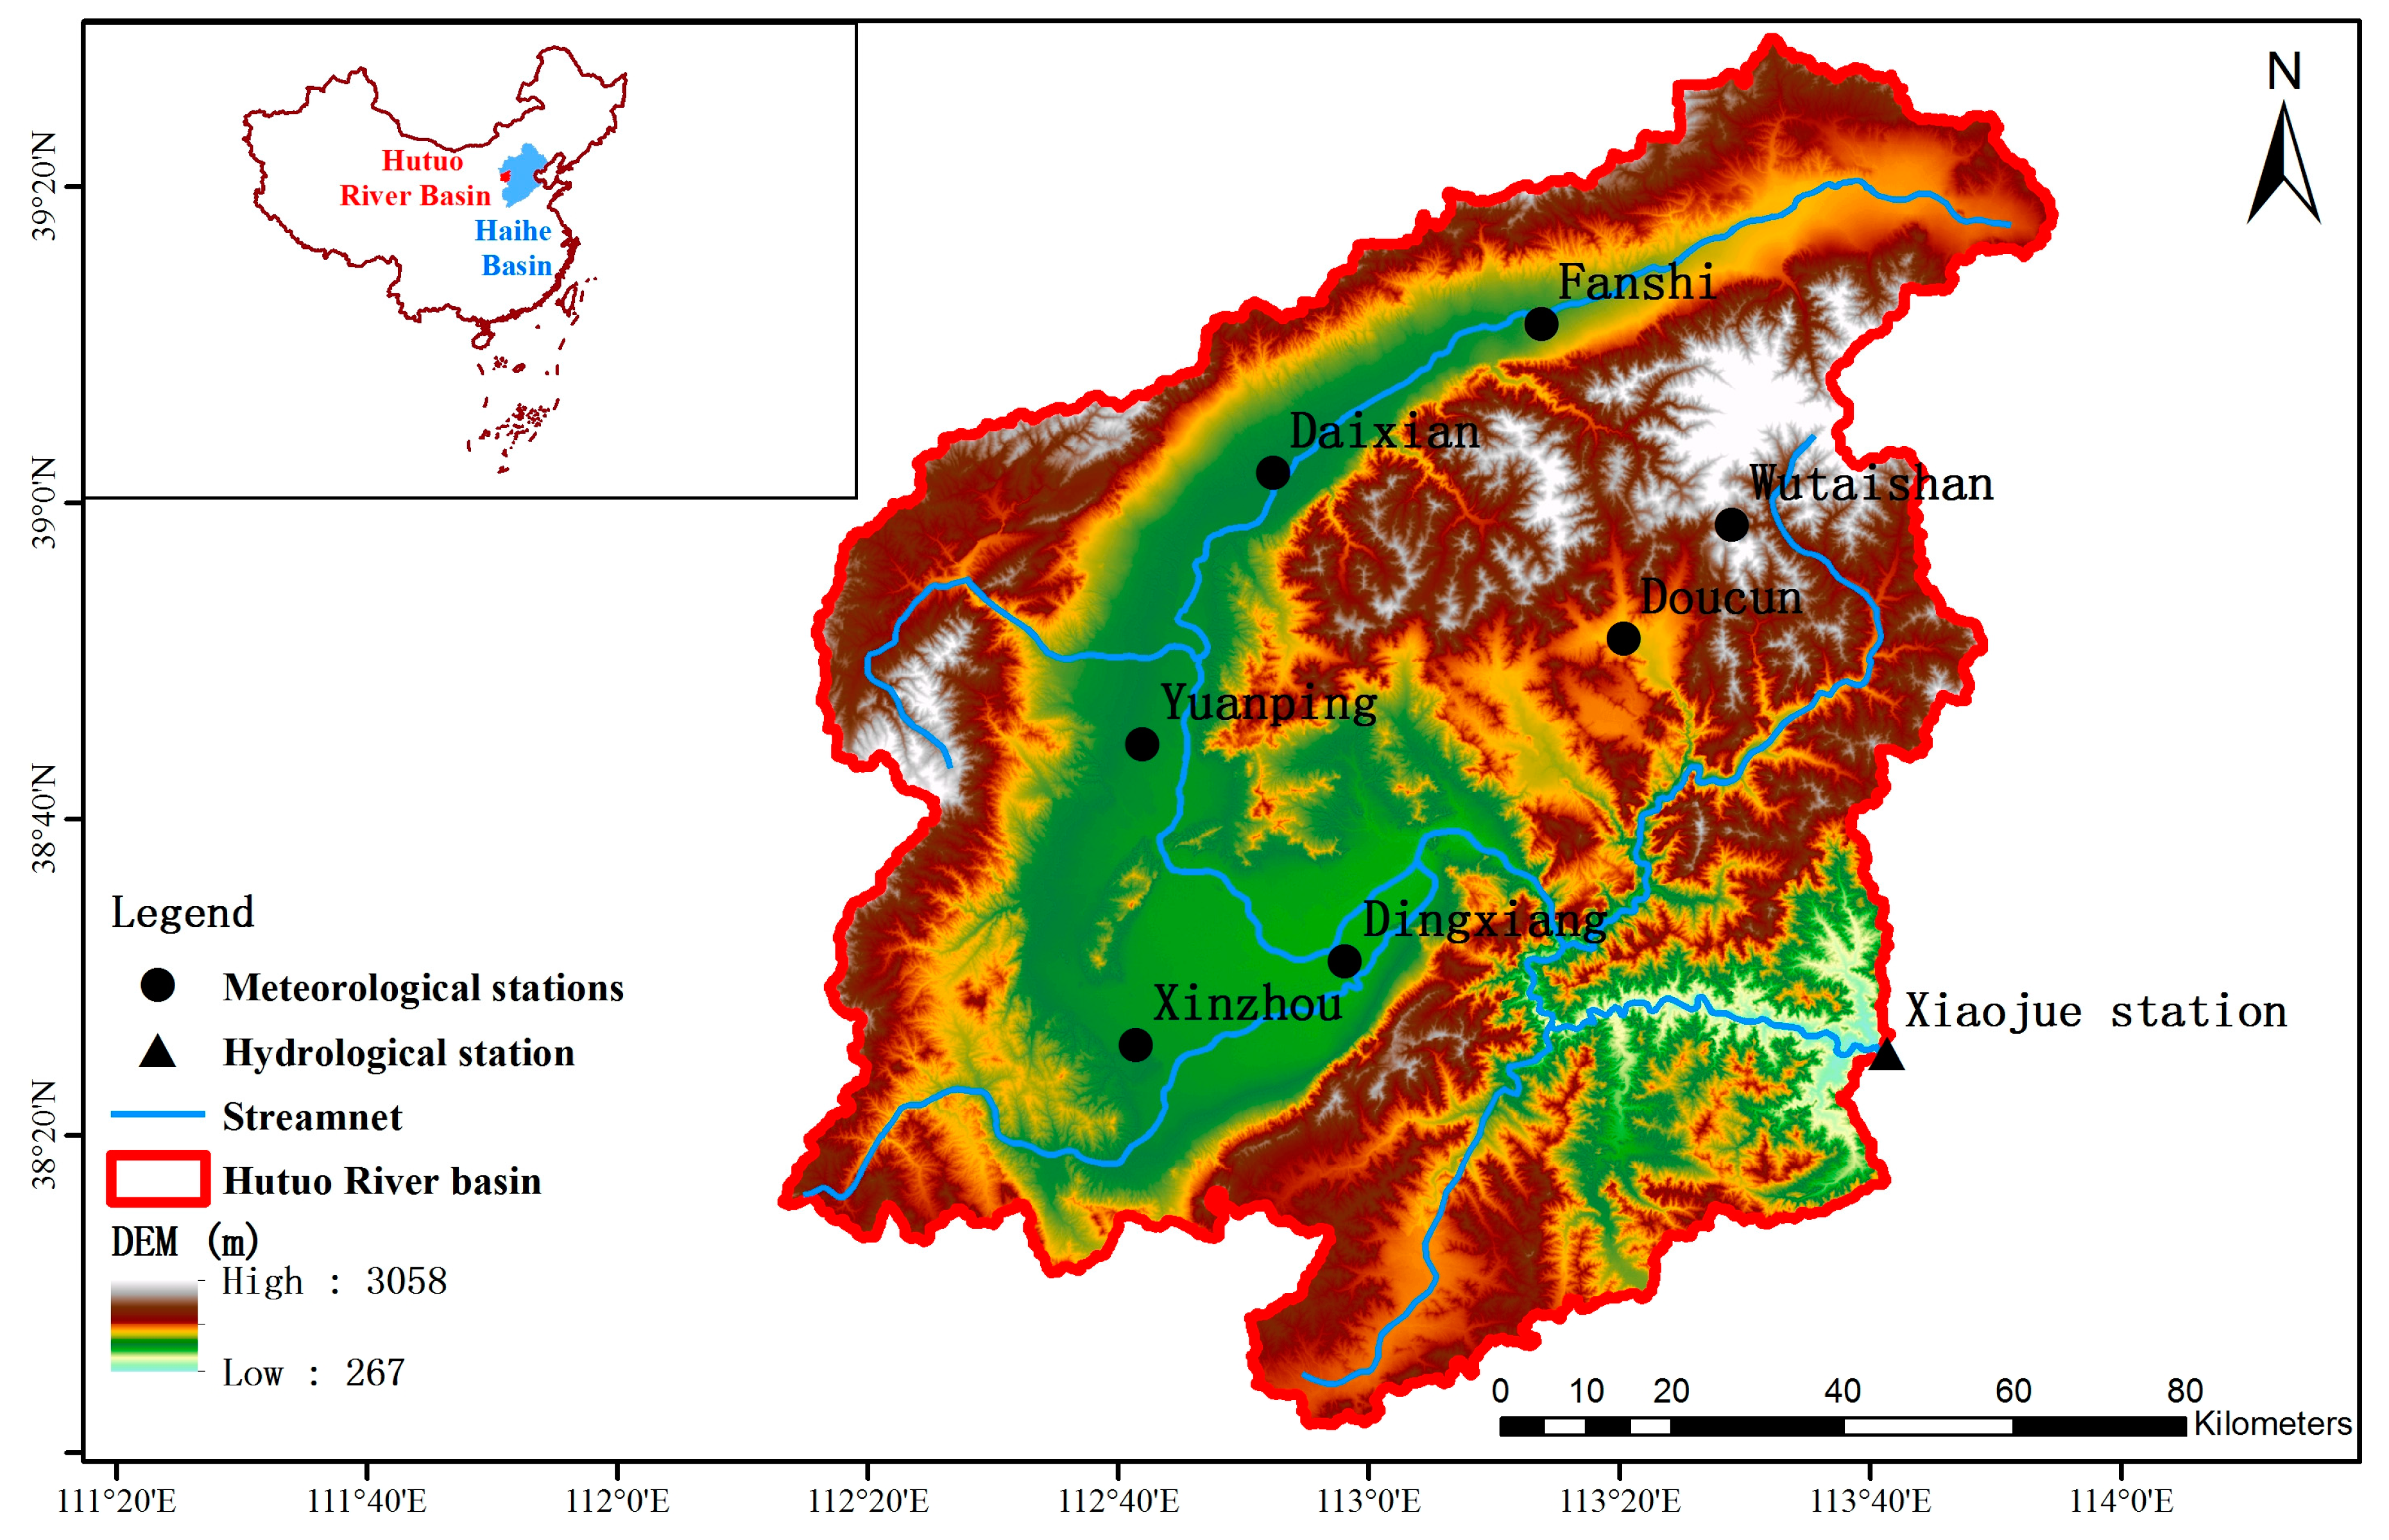
Figure 2.
Long-term variations in R (a), P (b), T (c), SD (d), RH (e), and WS (f) series in the HTRB between 1956 and 2015 (R2 denotes the correlation coefficients for the relationships, and P denotes the statistical significance).
Figure 2.
Long-term variations in R (a), P (b), T (c), SD (d), RH (e), and WS (f) series in the HTRB between 1956 and 2015 (R2 denotes the correlation coefficients for the relationships, and P denotes the statistical significance).
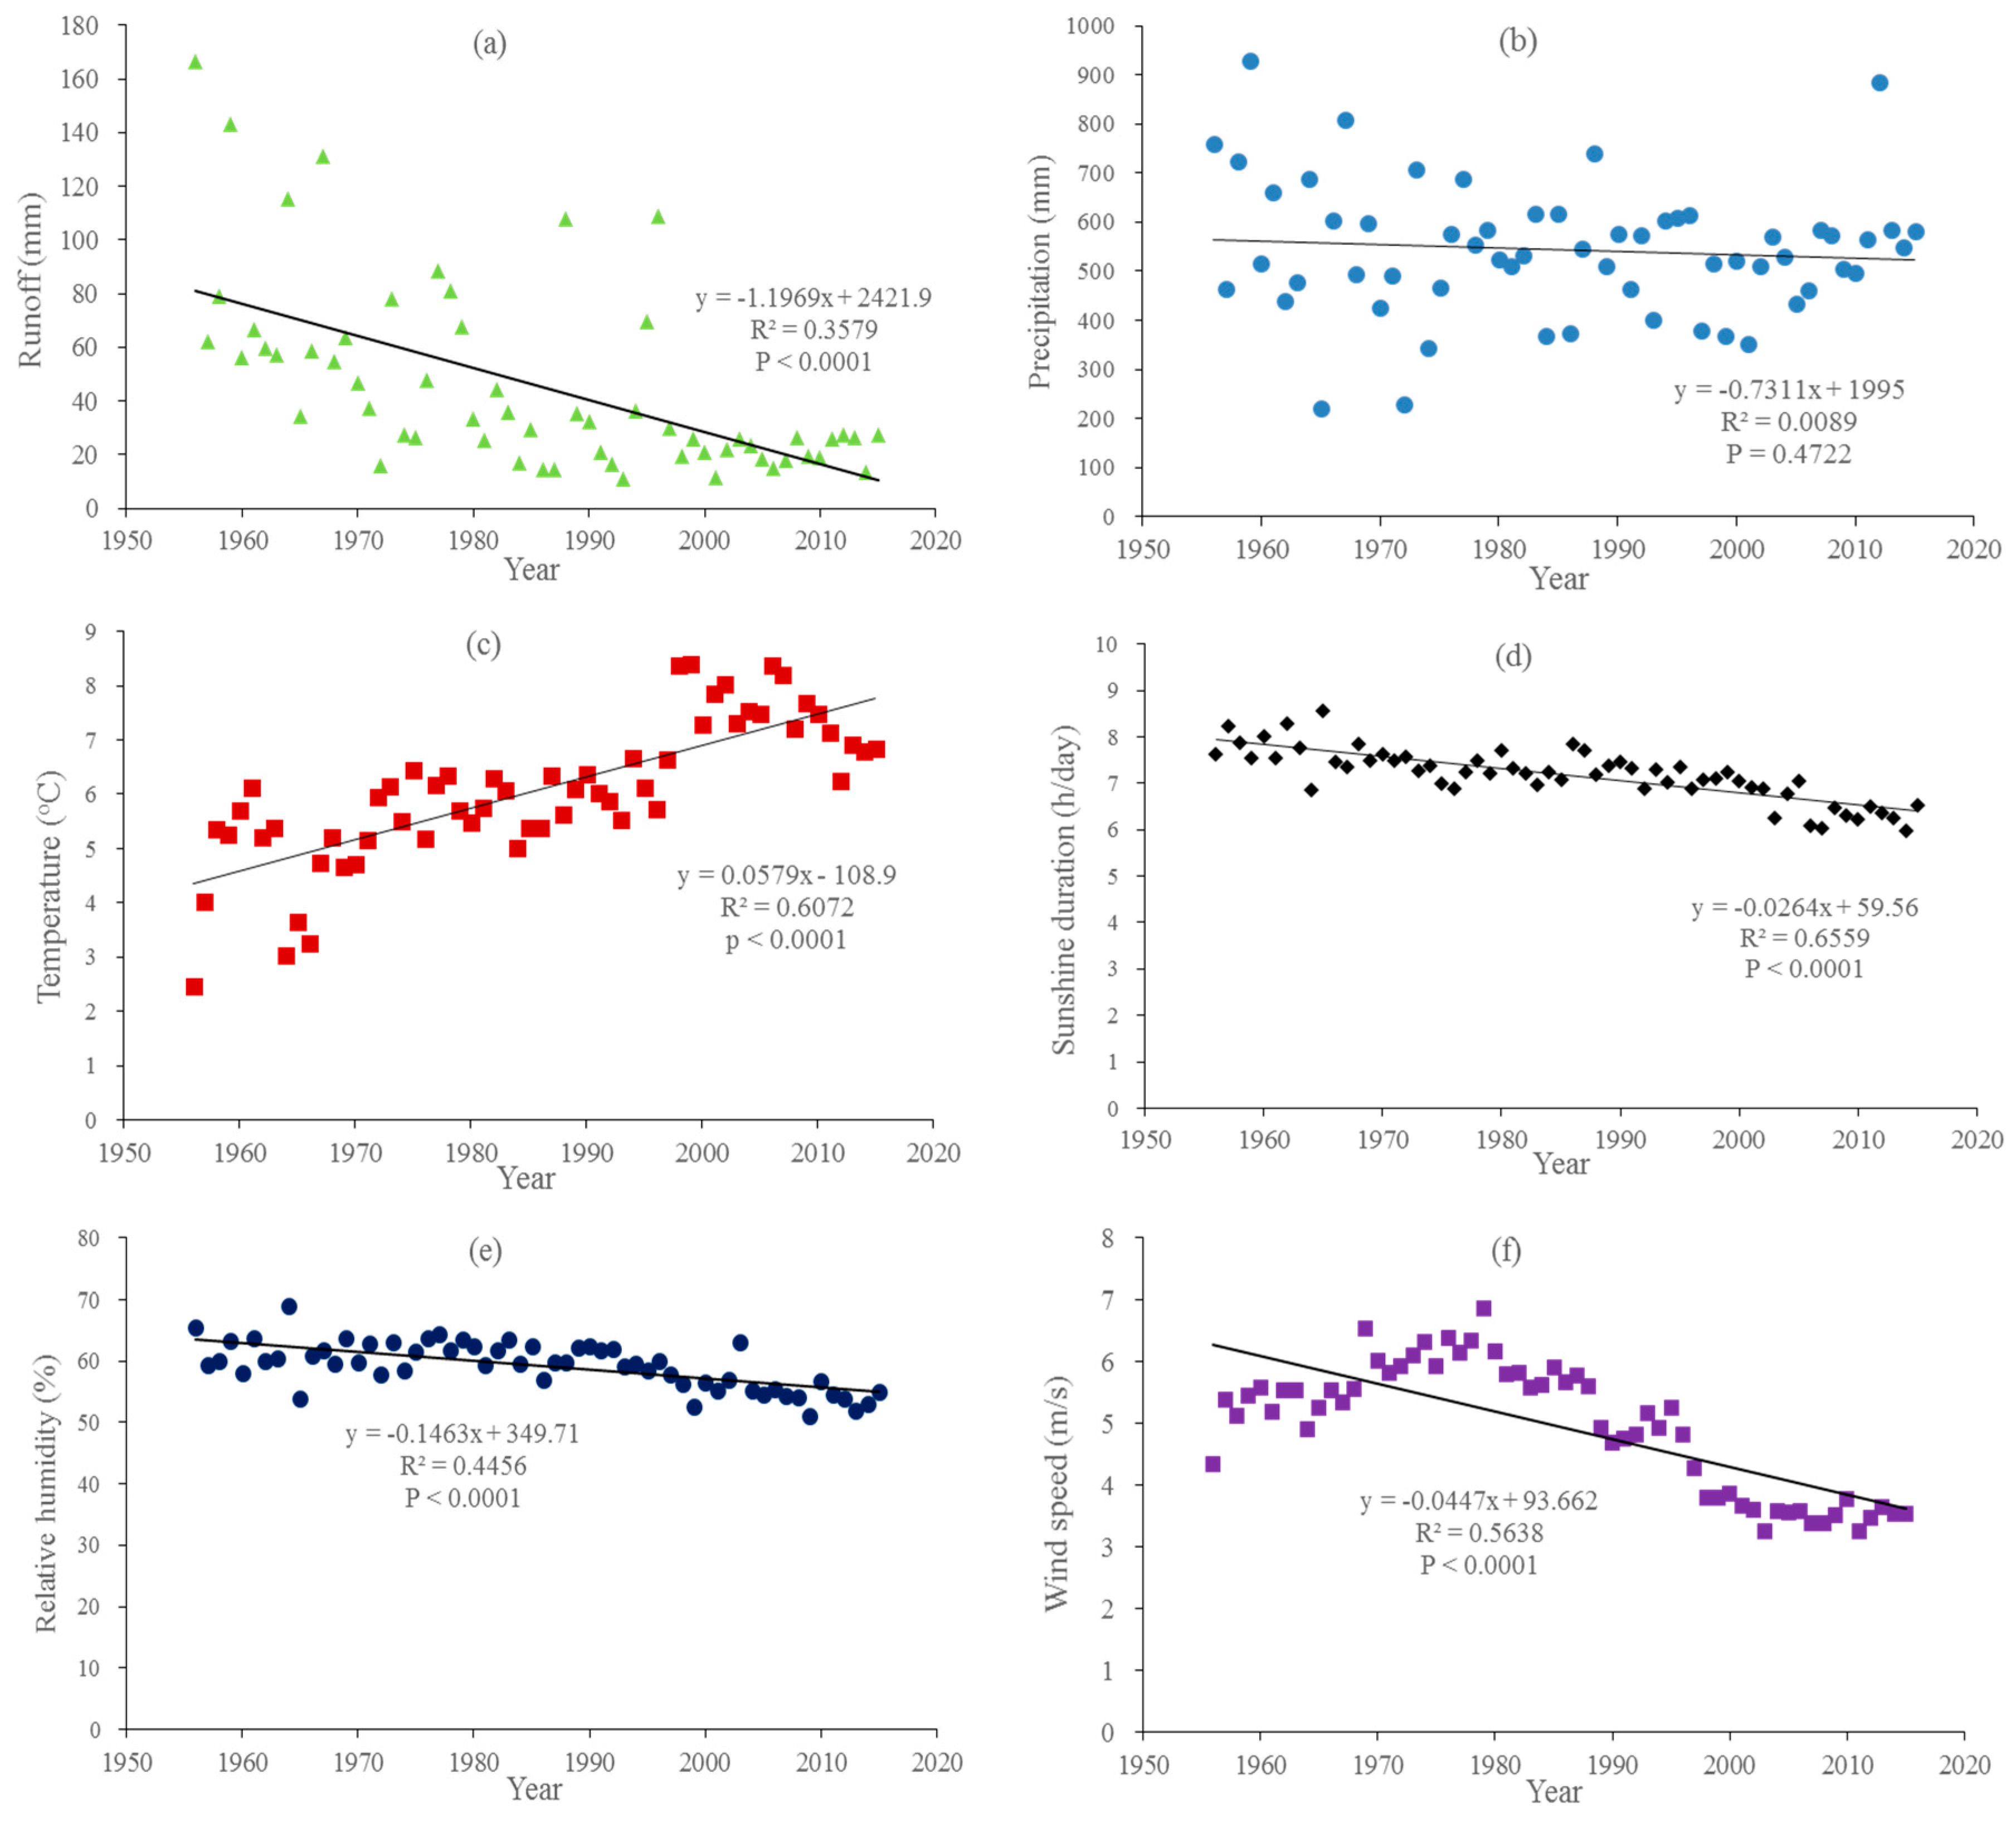
Figure 3.
The years before and after the R increment changes in the HTRB during 1956–2015.

Figure 4.
Double cumulative curve of annual P and R (R2 denotes the correlation coefficients for the relationships).
Figure 4.
Double cumulative curve of annual P and R (R2 denotes the correlation coefficients for the relationships).
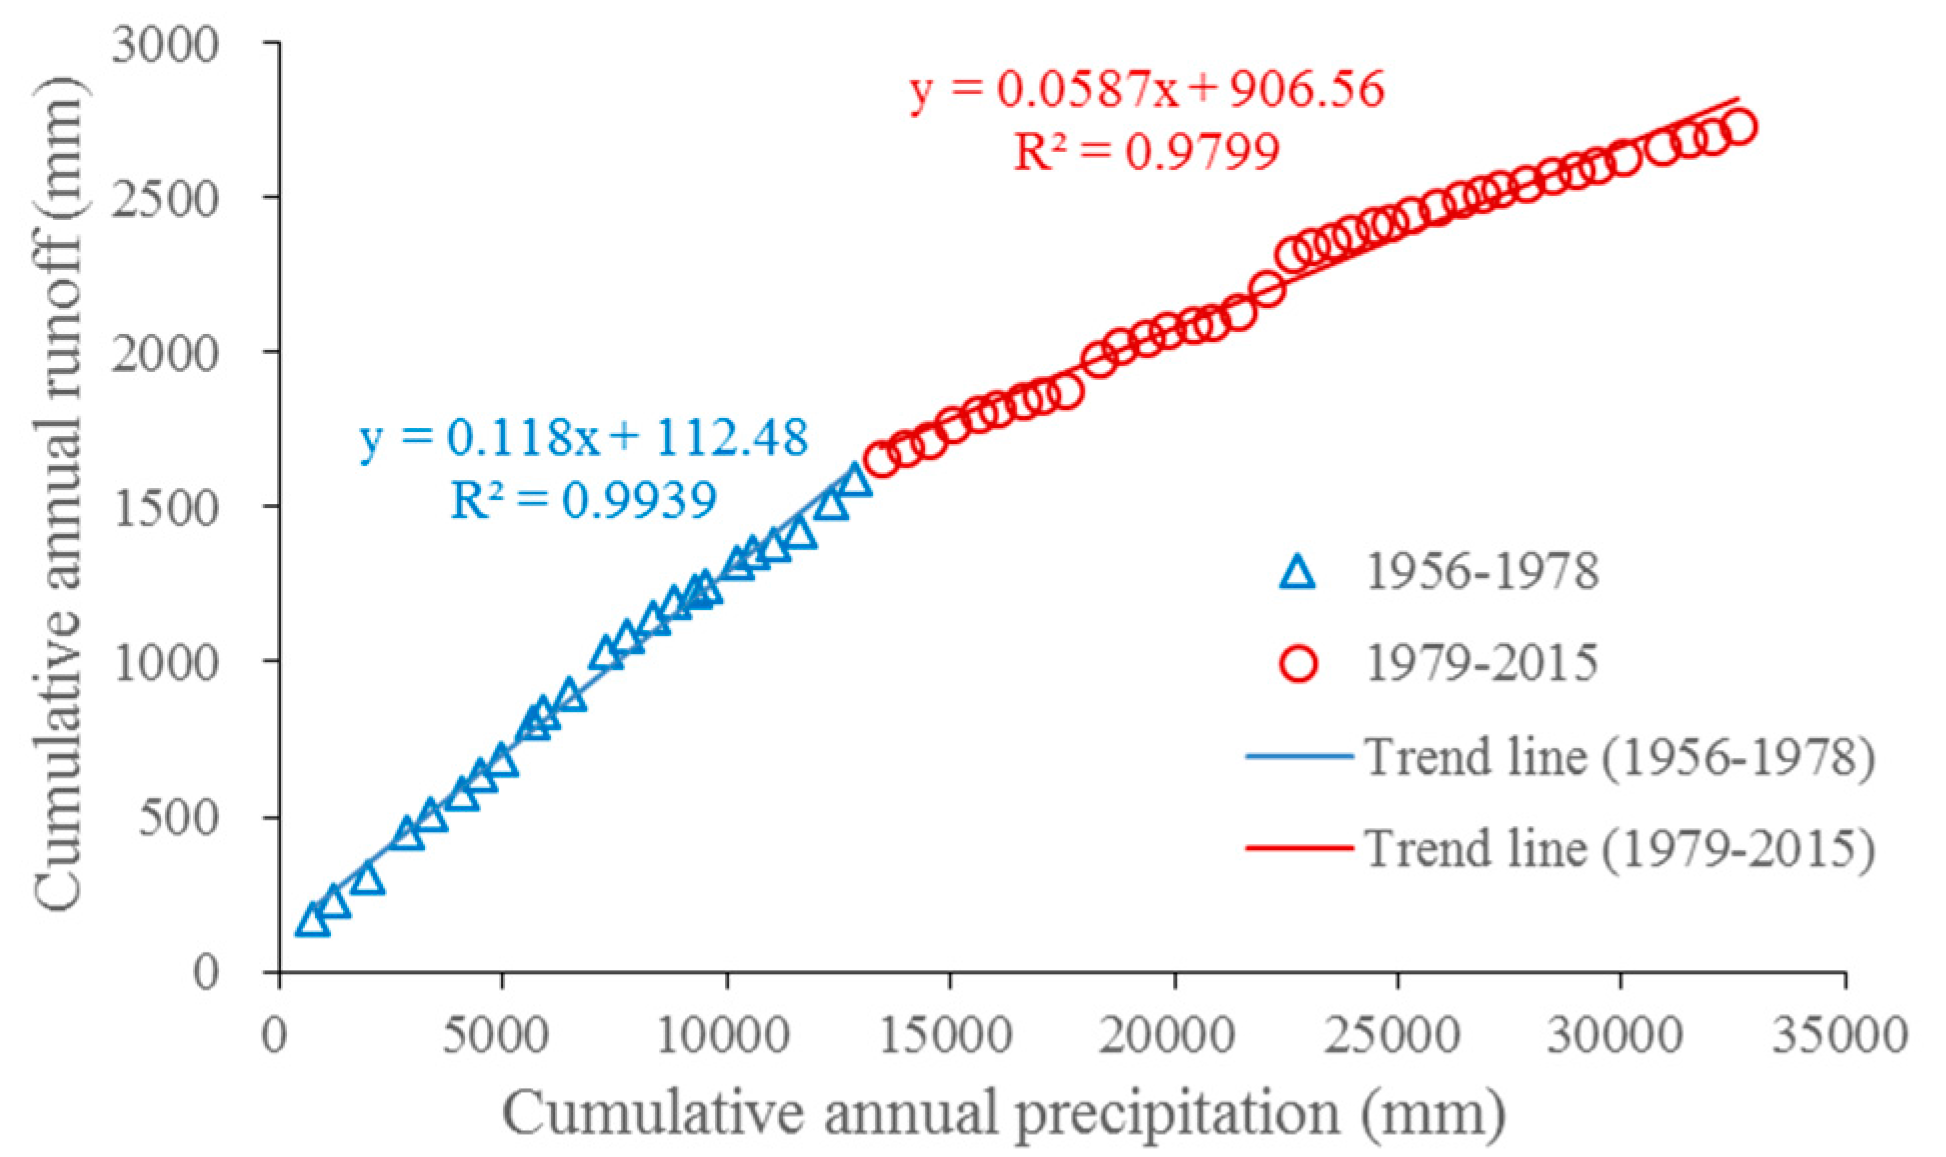
Figure 5.
Average monthly P (a) and R (b) for the baseline (1956–1978) and change (1979–2015) periods.
Figure 5.
Average monthly P (a) and R (b) for the baseline (1956–1978) and change (1979–2015) periods.

Figure 6.
Contribution of each climatic factor to the seasonal R changes in the HTRB.

Figure 7.
P trend magnitudes for (a) 1956–2000 and (b) 2001–2015 in the HTRB (R2 denotes the correlation coefficients for the relationships, and P denotes the statistical significance).
Figure 7.
P trend magnitudes for (a) 1956–2000 and (b) 2001–2015 in the HTRB (R2 denotes the correlation coefficients for the relationships, and P denotes the statistical significance).


Table 1.
The mean value and Mann-Kendall test results of the annual R and climatic elements in the HTRB during 1956–2015.
Table 1.
The mean value and Mann-Kendall test results of the annual R and climatic elements in the HTRB during 1956–2015.
| R | P | T | SD | RH | WS | ||||||
|---|---|---|---|---|---|---|---|---|---|---|---|
| Mean (mm) | Slope (mm/10a) | Mean (mm) | Slope (mm/10a) | Mean (°C) | Slope (°C/10a) | Mean (h/day) | Slope (h/day/10a) | Mean (%) | Slope (%/10a) | Mean (m/s) | Slope (m/s/10a) |
| 45.5 | −11.97 * | 543.4 | −7.31 | 6.0 | 0.58 * | 7.2 | −0.26 * | 59.3 | −1.46 * | 4.9 | −0.45 * |
Note: * Significance at α = 0.05 level.
Table 2.
The mean value and Mann-Kendall test results of the seasonal R and climatic elements in the HTRB during 1956–2015.
Table 2.
The mean value and Mann-Kendall test results of the seasonal R and climatic elements in the HTRB during 1956–2015.
| Element | Test | Spring | Summer | Autumn | Winter |
|---|---|---|---|---|---|
| R | Mean (mm) | 5.9 | 19.9 | 13.5 | 6.2 |
| Slope (mm/10a) | −1.40 * | −5.69 * | −3.22 * | −1.61 * | |
| P | Mean (mm) | 64.7 | 347.6 | 121.1 | 10.8 |
| Slope (mm/10a) | 8.44 * | −13.59 | −3.95 | 2.30 * | |
| T | Mean (°C) | 7.5 | 18.9 | 6.0 | −8.3 |
| Slope (°C/10a) | 0.67 * | 0.47 * | 0.51 * | 0.62 * | |
| SD | Mean (h) | 8.0 | 7.3 | 6.8 | 6.5 |
| Slope (h/day/10a) | −0.16 * | −0.28 * | −0.29 * | −0.34 * | |
| RH | Mean (%) | 50.0 | 70.6 | 63.3 | 52.9 |
| Slope (%/10a) | −2.24 * | −1.15 * | −0.79 * | −1.69 * | |
| WS | Mean (m/s) | 5.3 | 3.6 | 4.8 | 6.1 |
| Slope (m/s/10a) | −0.38 * | −0.21 * | −0.46 * | −0.79 * |
Note: * Significance at α = 0.05 level.
Table 3.
The mean value and Mann-Kendall test results of the monthly R and climatic elements in the HTRB during 1956–2015.
Table 3.
The mean value and Mann-Kendall test results of the monthly R and climatic elements in the HTRB during 1956–2015.
| Element | Test | Jan. | Feb. | Mar. | Apr. | May. | Jun. | Jul. | Aug. | Sep. | Oct. | Nov. | Dec. |
|---|---|---|---|---|---|---|---|---|---|---|---|---|---|
| R | Mean (mm) | 1.9 | 2.1 | 2.8 | 1.7 | 1.5 | 2.1 | 5.1 | 12.7 | 6.8 | 4.3 | 2.4 | 2.2 |
| Slope (mm/10a) | −0.49 * | −0.59 * | −0.93 * | −0.35 * | −0.12 | −0.42 * | −1.44 * | −3.83 * | −1.47 * | −1.12 * | −0.63 * | −0.58 * | |
| P | Mean (mm) | 2.4 | 4.2 | 9.4 | 18.8 | 36.5 | 75.5 | 137.5 | 134.6 | 76.3 | 31.8 | 12.9 | 3.5 |
| Slope (mm/10a) | 0.37 | 1.46 * | 2.39 * | 1.80 | 4.26 * | 3.95 | −5.27 | −12.27 * | −2.46 | −2.02 | −0.53 | −0.05 | |
| T | Mean (°C) | −10.2 | −6.6 | 0.1 | 8.0 | 14.4 | 18.3 | 20.0 | 18.3 | 12.9 | 6.6 | −1.6 | −8.3 |
| Slope (°C/10a) | 0.64 * | 0.81 * | 0.69 * | 0.69 * | 0.62 * | 0.53 * | 0.47 * | 0.43 * | 0.51 * | 0.54 * | 0.48 * | 0.50 * | |
| SD | Mean (h) | 6.5 | 6.9 | 7.3 | 8.0 | 8.7 | 8.1 | 7.1 | 6.7 | 7.0 | 7.1 | 6.5 | 6.2 |
| Slope (h/day/10a) | −0.31 * | −0.37 * | −0.18 * | −0.09 | −0.19 * | −0.45 * | −0.21 * | −0.18 | −0.36 * | −0.24 * | −0.26 * | −0.36 * | |
| RH | Mean (%) | 52.2 | 53.1 | 51.9 | 48.5 | 49.5 | 60.8 | 74.2 | 76.7 | 70.3 | 61.4 | 58.1 | 54.1 |
| Slope (%/10a) | −1.70 * | −1.96 * | −3.07 * | −2.24 * | −1.39 * | −0.55 | −1.38 * | −1.52 * | −0.03 | −1.02 | −1.32 * | −1.36 * | |
| WS | Mean (m/s) | 6.2 | 5.9 | 5.6 | 5.4 | 4.9 | 4.1 | 3.4 | 3.3 | 3.8 | 4.6 | 5.9 | 6.4 |
| Slope (m/s/10a) | −0.81 * | −0.68 * | −0.47 * | −0.37 * | −0.30 * | −0.27 * | −0.20 * | −0.16 * | −0.32 * | −0.37 * | −0.67 * | −0.76 * |
Note: * Significance at α = 0.05 level.
Table 4.
Variations in annual R and climatic elements between the two periods.
| Type of Value | R (mm) | P (mm) | T (°C) | SD (h/day) | RH (%) | WS (m/s) |
|---|---|---|---|---|---|---|
| 1956–1978 | 69.4 | 559.2 | 5.0 | 7.6 | 61.4 | 5.7 |
| 1979–2015 | 30.7 | 533.6 | 6.7 | 6.9 | 57.9 | 4.5 |
| Change between two periods | −38.7 | −25.6 | 1.7 | −0.7 | −3.5 | −1.2 |
| Change rate (%) | −55.6 | −4.6 | 32.9 | −8.7 | −5.7 | −20.5 |
Table 5.
Climate elasticity coefficient and contributions of climatic factors.
| Type of Value | P | T | SD | RH | WS |
|---|---|---|---|---|---|
| Sensitivity coefficient (ε) | 1.84 | −1.07 | −2.79 | 1.73 | −0.45 |
| Influence amount (mm) | −4.0 | −13.3 | 11.7 | −4.7 | 4.8 |
| Contribution (%) | 10.3 | 34.4 | −30.2 | 12.1 | −12.4 |
Table 6.
Variations in seasonal R between the two periods.
| Type of Value | Spring | Summer | Autumn | Winter |
|---|---|---|---|---|
| 1956–1978 | 8.7 | 30.4 | 21.0 | 9.4 |
| 1979–2015 | 4.2 | 13.3 | 8.8 | 4.2 |
| Change between two periods | −4.5 | −17.1 | −12.2 | −5.2 |
| Change rate (%) | −52 | −56 | −58 | −55 |
Table 7.
Comparison between the climate elasticity to climatic elements between the reference results and the results from the present study.
Table 7.
Comparison between the climate elasticity to climatic elements between the reference results and the results from the present study.
| Climate Elasticity | Reference Results | Study Area | Period | Reference |
|---|---|---|---|---|
| * | 2.4 | Chaobai River basin | 1956–2005 | [28] |
| 2.4 | Hutuo River basin | 1961–2000 | [25] | |
| 1.68 | Hutuo River basin | 1957–2000 | [36] | |
| 1.84 | Hutuo River basin | 1956–2015 | ||
| * | −0.79 | Chaobai River basin | 1956–2005 | [28] |
| −0.98 | Haihe River basin | 1956–2000 | [44] | |
| −5–−1 | Yellow River basin | 1960–2014 | [45] | |
| −1.07 | Hutuo River basin | 1956–2015 | ||
| * | −0.79 | Hutuo River basin | 1961–2000 | [25] |
| −2.1–−0.8 | Haihe River basin | 1961–2010 | [26] | |
| −0.76 | Yellow River basin | 1960–2011 | [46] | |
| −2.79 | Hutuo River basin | 1956–2015 | ||
| * | 0.83 | Hutuo River basin | 1961–2000 | [25] |
| 0.2–2.1 | Haihe River basin | 1961–2010 | [26] | |
| 0.78 | Yellow River basin | 1960–2011 | [46] | |
| 1.73 | Hutuo River basin | 1956–2015 | ||
| * | −0.33 | Hutuo River basin | 1961–2000 | [25] |
| −0.85–−0.1 | Haihe River basin | 1961–2010 | [26] | |
| −0.59 | Yellow River basin | 1960–2011 | [46] | |
| −0.45 | Hutuo River basin | 1956–2015 |
Notes: *, *, *, *, and * are the reference results on the climate elasticity to P, T, RN, RH, and WS, respectively; , , , , and are the results from the present study on the climate elasticity to P, T, SD, RH, WS, respectively.
© 2018 by the authors. Licensee MDPI, Basel, Switzerland. This article is an open access article distributed under the terms and conditions of the Creative Commons Attribution (CC BY) license (http://creativecommons.org/licenses/by/4.0/).
Share and Cite
MDPI and ACS Style
Xu, F.; Jia, Y.; Niu, C.; Liu, J.; Hao, C. Changes in Annual, Seasonal and Monthly Climate and Its Impacts on Runoff in the Hutuo River Basin, China. Water 2018, 10, 278. https://doi.org/10.3390/w10030278
AMA Style
Xu F, Jia Y, Niu C, Liu J, Hao C. Changes in Annual, Seasonal and Monthly Climate and Its Impacts on Runoff in the Hutuo River Basin, China. Water. 2018; 10(3):278. https://doi.org/10.3390/w10030278
Chicago/Turabian StyleXu, Fei, Yangwen Jia, Cunwen Niu, Jiajia Liu, and Chunfeng Hao. 2018. "Changes in Annual, Seasonal and Monthly Climate and Its Impacts on Runoff in the Hutuo River Basin, China" Water 10, no. 3: 278. https://doi.org/10.3390/w10030278
Note that from the first issue of 2016, this journal uses article numbers instead of page numbers. See further details here.