High-Strength Domestic Wastewater Treatment and Reuse with Onsite Passive Methods

1
Departamento de Tecnología Ambiental, Centro de Investigación y Asistencia en Tecnología y Diseño del Estado de Jalisco, A. C. Av. Normalistas 800, Colinas de la Normal, Guadalajara CP 44270, Jalisco, Mexico
2
Centro Universitario de Ciencias Biológicas y Agropecuarias, Universidad de Guadalajara, Camino Ramón Padilla Sánchez, Nextipac 2100, Zapopan, Jalisco, Mexico
*
Author to whom correspondence should be addressed.
†
Died on 13 March 2017 in a car accident.
Water 2018, 10(2), 99; https://doi.org/10.3390/w10020099
Submission received: 10 October 2017
/
Revised: 18 December 2017
/
Accepted: 19 December 2017
/
Published: 25 January 2018
(This article belongs to the Special Issue Recent Advances in Water Management: Saving, Treatment and Reuse)
Abstract
:This paper describes the preliminary monitoring results of an onsite pilot wastewater treatment plant consisting of a septic tank, an anaerobic up-flow filter, and a horizontal subsurface flow wetland system planted with Agapanthus africanus. The system was designed to treat heavily polluted domestic wastewater produced in a research and development (R&D) center, reaching additional goals of zero energy consumption and eliminating the use of chemical additives. First water quality data shows that organic load in the treated sewage were removed achieving more than 95% efficiency. Nutrients were removed by almost 50%, and fecal and total coliform counts decreased by 99.96%. The results were compared to official Mexican regulations for wastewater discharged into lakes and reservoirs complied with all of them except for nutrients. In this pilot project, the resulting treated wastewater was directly reused for watering the green areas of the R&D center. The result was that the excess of nutrients improved the quality of the grass, avoiding the use of synthetic fertilizers, and created a wetland habitat for small wildlife species living in the area.
1. Introduction
Wastewater treatment approaches vary from conventional centralized systems to entirely decentralized and clustered systems. The centralized systems, which are usually publicly owned, collect and treat large volumes of wastewater for entire large communities, thus requiring large pipes, major excavations, and manholes for access. While decentralized systems collect, treat, and reuse/dispose of treated wastewater on site or near the generation point, centralized systems often reuse/dispose of treated wastewater far from the generation point [1].
Maintenance and operation (M&O) costs associated with wastewater treatment include labor, energy, purchase of chemicals, and equipment replacement. Conventional centralized technologies normally require high amounts of energy due to the complexity of the processes which combine mechanical, chemical, and biological stages to remove contaminants in the sewage. Additionally, these systems also require further energy to treat and transport the produced biological sludge [2].
In developing countries, the treatment of domestic, commercial, or industrial wastewaters has become an important issue in recent years because of the increase of M&O costs involved in conventional wastewater treatment plants (WWTP) [3,4]. Thus, several WWTP facilities in developing countries have started to reduce their operation capacity, suspend operation, or end up being abandoned [4,5,6]. Therefore, decentralized wastewater treatment technologies based on anaerobic processes and constructed wetlands is attracting interest as a potential solution to reduce M&O costs [7,8,9].
This paper describes the performance of a functional pilot treatment process based on a combined anaerobic process and a horizontal subsurface flow wetland planted with the ornamental plant Agapanthus africanus, which uses zero energy consumption and no chemical additives. The treated wastewater comes from a food research and development (R&D) center and has high contents of organic pollutants and is rich in nitrogen because the sewages are mixed with nontoxic wastes produced in laboratories and pilot plants. As a result, the produced wastewater could be classified as high-strength domestic wastewater compared with common domestic wastewater according to the literature [10].
2. Background
The strategy of treating sewage by common and known aerobic processes has been shifted back to anaerobic processes in recent years with the advent of high rate anaerobic systems such as up-flow anaerobic sludge blanket reactors (UASB), anaerobic contact processes, anaerobic filters (AF), or fixed film reactors and fluidized bed reactors [11]. The high rate anaerobic processes have several advantages such as: low capital investment, lower M&O costs, energy recovery in the form of biogas, operational simplicity, and low production of digested sludge [11].
It is reported in warm tropical countries that, for domestic sewage, the UASB system is the best option for biological oxygen demand (BOD) removal due to the high attainable efficiencies and that a low BOD load, but the efficiencies of low BOD load removal could increase if the combination of a septic tank (ST) followed by an up-flow anaerobic filter (UAF) is used, as shown in Table 1 [12]. Therefore, most of the treatment systems based on anaerobic processes and constructed wetlands reported in the literature for warm tropical countries use the UASB as a preliminary treatment step prior to a constructed wetland [13,14,15]. Nevertheless, the use of up-flow anaerobic filters (UAF) is also widely used to treat municipal wastewater [16,17,18,19]. It was found few research works reporting use of a coupled ST with an UAF previous to the constructed wetland to improve the performance of the system [20,21]. Anaerobic ponds followed by constructed wetlands are also a convenient solution, especially for developing countries, due to their cost-effectiveness and high potential of removing different pollutants. However, these systems have to be installed far from residential areas due to the odor release, they need a larger surface area to construct them due to the higher residence time required, and algae could bloom in the ponds causing secondary pollution of the following stream [22,23,24].
Constructed wetlands with surface flow (SF CWs), horizontal sub-surface flow (HF CWs), vertical sub-surface flow (VF CWs), or hybrid systems have been used together with previous anaerobic and/or aerobic systems for wastewater treatment for at least 30 years [25,26]. By far the most frequently used plant around the globe to plant constructed wetlands with horizontal subsurface flow is Phragmites australis (Common reed). Species of the genera Typha (latifolia, angustifolia, domingensis, orientalis, and glauca) and Scirpus (e.g., lacustris, validus, californicus, and acutus) spp. are other commonly used species [27]. On the other hand, in many countries, and especially in the tropics and subtropics, local plants including ornamental species are used for HF CWs such as Zantedeschia aethiopica (giant white arum lily), Strelitzia reginae (crane flower, bird of paradise), Anthurium andraenum (flamingo flower), and Agapanthus africanus (agapanthus) [27]. Based on a search of the literature and in previous experience, it was concluded that it is possible to use ornamental plants in constructed wetlands without reducing the efficiency of the treatment system [28,29,30,31].
In the case of pilot experiments where a UASB with HF CW systems was used, the reviewed reports focus basically on estimating the performance of the HF CW system but water quality data of previous steps of the process are not included [32,33]. Thus, removal efficiencies in the reviewed HF CW systems planted with conventional or ornamental species achieves values up to 80% for COD, BOD5, and total suspended solids (TSS) in most of the reviewed works [32,33]. The major removal mechanism for nitrogen in HF CWs is denitrification. Removal of ammonia is limited due to lack of oxygen in the filtration bed because of permanent waterlogged conditions [34]. The ammonia-N removal efficiency reported in the literature achieves values up to 65% and 45% for nitrate NO3-N removal [34,35]. Phosphorus is removed primarily by ligand exchange reactions, where phosphate displaces water or hydroxyls from the surface of iron and aluminum hydrous oxides. Unless special materials are used, removal of P is usually lower to 50% in HF CWs [32,33,34,35].
Regarding the operation and maintenance (O&M) costs of tertiary treatment CWs with reuse purposes, they are lower than those of secondary treatment ones, not only because of the lower intensity of processes (lower loading rates) but also because of certain investment returns such as plant harvesting, aquaculture, production of ornamental plants, etc. [36].
3. Materials and Methods
The system was designed to treat wastewater from a food research and development (R&D) public institution located in the municipality of Zapopan, in the state of Jalisco, Mexico. The design of the present treatment system is based on experience gained in a demonstrative pilot plant installed previously in Chapala, Jalisco, Mexico [29]. In the sewage pipes, black and gray water are mixed together with discharges of non-hazardous liquid wastes generated in laboratories and food processing pilot plants. Because it is a functional pilot treatment plant discharging intermittently different type of wastes related to food industry, the content of solids, organic matter, and nutrients was not controlled at the entrance. The designed system consists basically of a septic tank (ST), an up-flow anaerobic filter (UAF), and a subsurface horizontal flow constructed wetland (HF CW) (see Figure 1).
It is convenient to mention that, due to failures in the connection of pluvial piping network during the construction of the pilot treatment plant, some rain water eventually entered into the piping system that conducts the sewage to the treatment plant. This situation created some efficiency problems for the system as will be discussed later.
At the time when this work was carried out, about 150 people worked at this R&D center including researchers, administrative, and maintenance personnel, and students. All the sewage is directed to a sump pump (SP). Solar panels were installed to power the pump located in the pumping sump and in the receiving tank at the end of the system to irrigate the green areas of the R&D center. The average flow at the entrance was estimated to be 7.5 m3/day (Qi) based on the use and discharge of about 50 L per person per day. This amount was calculated from the monthly average consumption of water used directly in the buildings, laboratories, and pilot plants of the R&D center. Figure 1 displays the sequence of the treatment process.
The sump pump (SP) has a stainless-steel basket to trap coarse solids in the wastewater. The wastewater is pumped from the sump pump (SP) to a two-chamber septic tank (ST) as shown in Figure 2. The wastewater flows by gravity to an up-flow anaerobic filter (UAF) and then also by gravity to a horizontal subsurface flow constructed wetland (HF CW) as shown in Figure 3. The level tank (LT) at the end of the process controls the height of the water table in the constructed wetland. Immediately after the level tank, a disinfection system was installed which works with chlorination tablets. Finally, the treated water is stored in a plastic tank with a volume capacity of 10 m3 from which the treated water is pumped to irrigate the green areas of the R&D center. The pump installed for irrigation is also sun powered, making it a zero-energy consumption system.
The septic tank (ST) is divided into two chambers: the first one is 11.3 m3 (V1), the second chamber is 7.1 m3 (V2). They are connected by two 3″ diameter pipes installed equidistant in the middle of both chambers and 1.22 m in height from the bottom. At the bottom of each chamber there is a sump that accumulates the biological sludge generated by the anaerobic bacteria. The amount of accumulated sludge in each chamber was partially removed every six months by using a vacuum pump to avoid the excess of solids in both chambers of the septic tank. Care was taken to leave part of the sludge at the bottom of each chamber to maintain a minimum of active methanogenic bacteria within the system. The removed sludge could be disposed of in a filtering bed. After a few days of sun exposure, the dried sludge could be used as fertilizer.
The up-flow anaerobic filter (UAF) is divided into two chambers, the function of the first one is to receive and distribute the wastewater from the bottom into a wider second chamber filled with a volcanic porous rock, known as lava rock, which is commonly called “tezontle” in Mexico [29]. The second chamber is the anaerobic up-flow chamber where the wastewater flows from the bottom to the top of the chamber through the porous media created with the use of tezontle. The fixed bed has a volume of 69.5 m3 (V3). The resulting porosity of the fixed bed is about 0.69. There are three homogeneous layers of volcanic rock settled in the filtering bed ranging from 3″ average diameter at the bottom, 2″ average diameter in the middle, and 1″ diameter at the top. At the bottom of the anaerobic filter, a sump was constructed that collects the biological sludge. The sludge must be removed every six months by using a vacuum pump. The removed sludge can be disposed of in the same filtering bed used to treat the sludge of the septic tank (ST).
Tezontle was selected as filling material in the UAF since it is an inert volcanic material relatively abundant in the central portion of the country, it is neutral in pH, has a high porosity, is physically stable, does not contain nutrients, and is rich in minerals like calcium, iron, and zinc [33]. Two months after starting the operation, it was observed that a biofilm was created around the particles of tezontle and there was a constant bubbling due to the anaerobic digestion of organic matter.
The constructed wetland has a surface area of about 336 m2 (A), and it is filled with 0.7 m of tezontle with an average diameter of 3/8″. In the operation of the wetland, the hydraulic depth (δ) was 0.6 m. The total volume of the constructed wetland was 201.6 m3 (V4) and the resulting porosity of the filtering bed was about 0.68. The control level tank (LT) has a cubic shape and measures 0.40 m per side. The tube in the level tank (LT) was adjusted to control the water level in the constructed wetland 10 cm below the surface of the filling material. Tezontle was used as filling material in the HF CW because it is commonly used as substrate in the hydroponic production of ornamental commercial flowers and tomatoes in Mexico due to the richness of mineral content which is absorbed selectively by the plants [37,38].
The system was put into operation and after three months the constructed wetland was planted with African agapanthus (Agapanthus africanus) with a density of about three plants per square meter in a quincunx arrangement giving an approximated number of 1000 plants. It took about three months for plants to adapt to the system. After the level tank (LT), a disinfection system based on chlorination was installed to control the pathogens that could be present at the end of the treatment process.
After one year of a clear adaptation of the vegetation was observed, the process of monitoring water quality was initiated. Twelve water quality parameters where monitored every three months at the entrance and outlet of the system over a year period. All water quality parameters were determined by using accredited official Mexican norms that are in accordance with the standard methods for the examination of water and wastewater [39].
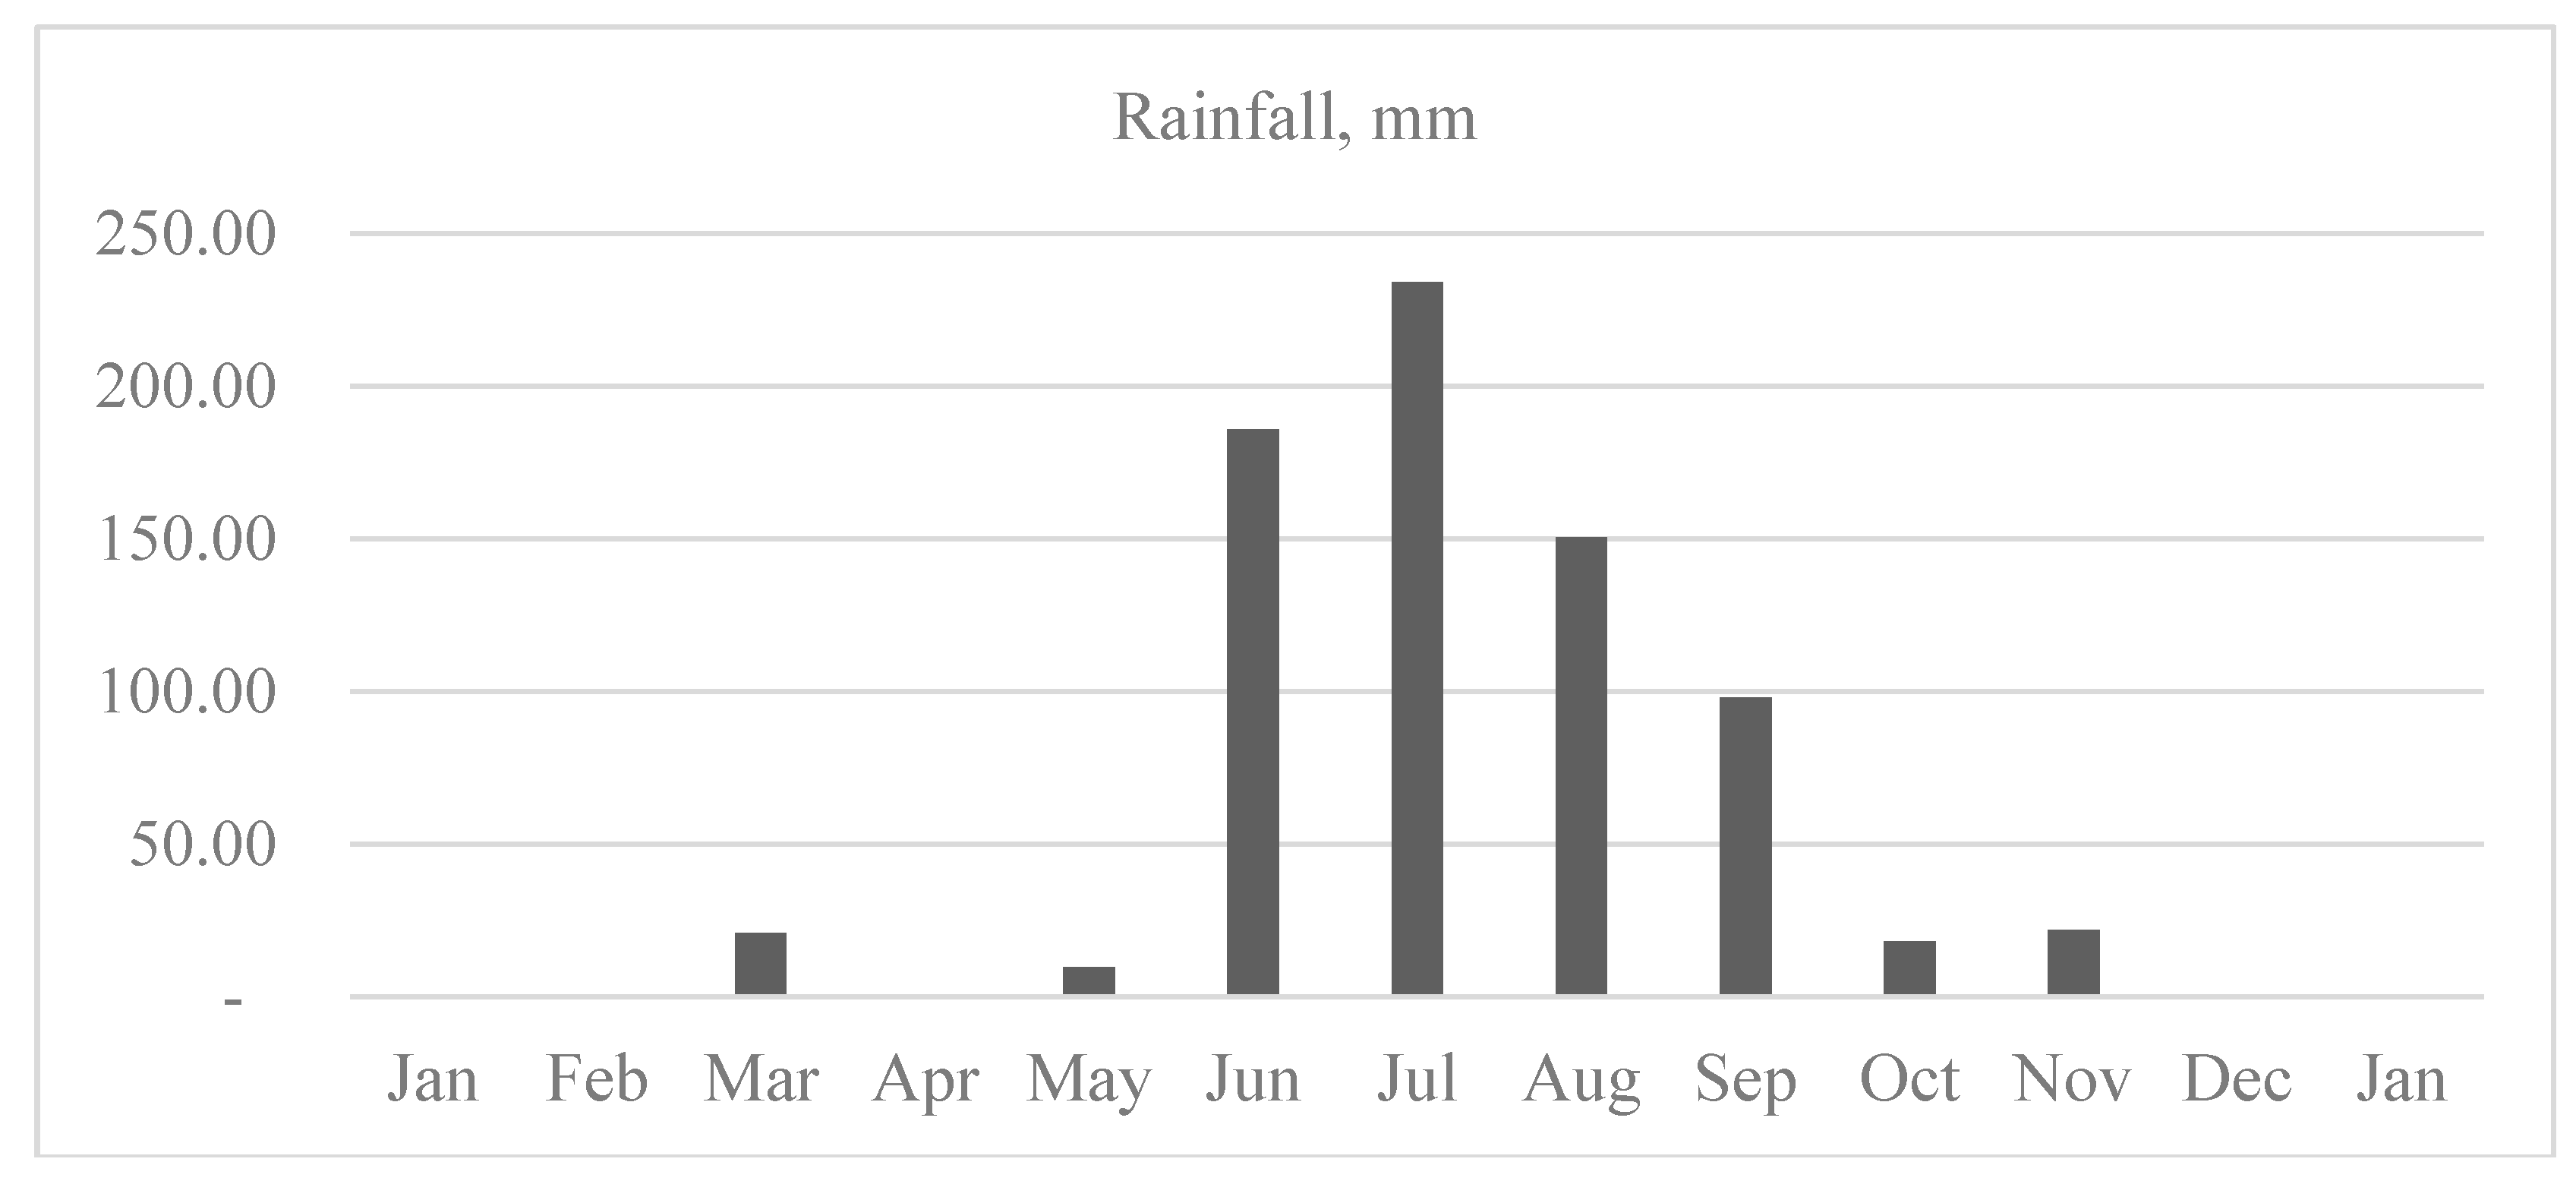
Water quality parameters were monitored at the entrance of the system, at the outlet of every treatment unit, and at the end of the treatment process after disinfection. Heavy metals were not monitored since potable water is used for the diverse services of the R&D center, and it was not contaminated with hazardous materials. The monitoring protocol was applied one year after its construction and operation of the treatment plant during the months of January, April, July, and October of the year 2016 and on January of 2017. The samples were taken only once in each reported month. A duplicate sample was taken at the beginning and at the end of every treatment unit. Samples were transported and analyzed in the laboratory following accredited standard methods for water examination [39]. The hydraulic residence time (HRT) was considered as constant along the system for purposes of analysis and discussion. The average use of water per month was calculated according with water consumption data of the R&D center finding slight variations in monthly water consumption. Pluvial water enters occasionally at the inlet of the system throughout the year. It was unavoidable that the precipitation fell over the surface of the wetland since it was constructed in an open area. The municipality of Zapopan is part of the metropolitan area of Guadalajara, it is located at 1548 m above sea level and its climate is sub-humid, with winters and dry and temperate springs. The average temperature is 23.5 °C, with a maximum of 35 °C and a minimum of 5.4 °C. The average annual rainfall is 906.1 mm, and it rains mainly between the months of June to October. During the rainfall period, the intensity of rainfall in Zapopan occurs mainly around midnight and in the early hours of the day. According with the nearest meteorological station located in the city of Guadalajara, the average monthly rainfall from January 2016 to January 2017 is shown in Figure 4.
4. Results
Measured water quality parameters are shown in Table 2, Table 3, Table 4, Table 5 and Table 6. According to Table 2 the mean fats, oil, and grease (FOG) during the monitoring period was 37.04 ± 8.97 mg L−1, settleable solids (SS) was 2.18 ± 2.37 mg L−1, total suspended solids (TSS) was 204.50 ± 89.19 mg L−1, biological oxygen demand (BOD) was 505.1 ± 202.0 mg L−1, chemical oxygen demand (COD) was 987.9 ± 295.4 mg L−1, and the total phosphorus (TP) was 11.98 ± 2.08 mg L−1. A high concentration of total nitrogen (TN) was also found of 196.56 ± 91.13 mg L−1. Presence of pathogens increased markedly during the month of July due to non-desirable input of rain water to the inlet of the system which mixed with wastewater in the sump pump. The temperature was not reported since the samples were taken according to the environmental conditions at midday which was an average of 23.5 °C with a maximum of 35 °C. In general, the range of measured values in the water quality parameters overpass by far the values reported in the literature corresponding to domestic wastewater and it is closer to the so named ‘high-strength domestic wastewater’ [10]. The reason of high standard deviation in BOD, COD, and TSS as well as in TN is because some of the activities of the R&D center generates sewages of different content in solid and organic matter depending on the type of raw material processed in the laboratories and pilot plants. The R&D areas of the center are food technology, industrial biotechnology and plant biotechnology. The activities of the plant biotechnology department in particular use nitrogen rich compounds in the laboratory essays.
It is noteworthy that pathogens indicators increase abnormally in July at the entrance of the system (see Table 2). This phenomenon was probably due to the entrance of pluvial water to the system which dragged out part of the settled solids in the sump pump. Therefore, during this month, also at the outlet of the septic tank (ST) and in the up-flow anaerobic filter (UAF) an abnormal increase in the number of the pathogens indictors was measured (Table 3 and Table 4). This increase in the count of pathogen indicators was already observed at the outlet of the constructed wetland (HF CW) (Table 5).
4.1. Septic Tank
By applying Equation (1) we have an estimation of the residence time (τ) in the septic tank of about 2.45 days. In Equation (1), V1 is the volume of the first chamber of the septic tank, V2 is the volume of the second chamber, and Qi is the inlet flow. The residence time could diminish eventually during the rainy season due to the increase of flow at the inlet of the system.
Comparing the data of the water quality parameters from Table 2 and Table 3, the septic tank could remove 67.5% of FOG, 75.2% of the SS, 55.5% of TSS, 61.1% of the BOD5, 49.6% of the COD, and 12.4% of TP. On the other hand, TN increased 16.9%. In a conventional septic tank, organic nitrogen in household wastes is transformed into ammonia products under the anaerobic conditions of the septic tank (ammonification). Some of the organic nitrogen, however, is not degraded and becomes part of the sludge at the bottom of the septic tank [40]. However, the abnormal increase of measured total nitrogen concentration could be due to an introduction of excess of nitrogen-rich compounds during some tests carried out in the R&D facilities. On the other hand, reduction of pathogens was very effective in the first stage of the treatment process achieving an average of 90.6% removal of all measured pathogens.
4.2. Anaerobic Filter
To estimate the residence time of the up-flow anaerobic filter (UAF) we used Equation (2) where V3 is the total volume of the packed bed in the filter (69.5 m3) and ε is the average porosity of the filling material (0.69). By applying Equation (2) we calculated a residence time in UAF of about 6.4 days. The UAF considered a high hydraulic residence time to ensure the maximum removal of the organic matter before it arrives to the wetland.
Comparing water quality conditions among the measured outflow of septic tank (Table 3) and UAF (Table 4) it was concluded that this treatment unit reduced 85.3% of the FOG, 100% of the SS, 77.7% of the TSS, 85.7% of the BOD, 71.1% of COD, 21.6% of TN, and 25.1% of TP. In this second treatment step, the pathogens indicators were reduced an average of 95.6%. Due to the abnormal increase of pathogens indicators explained before, to calculate the efficiency of the UAF regarding bacteria removal, the measured pathogens indicators during July were not included, otherwise the efficiency of bacteria removal in this unit falls to negative values (Table 4).
4.3. Constructed Wetland
To estimate the residence time of the horizontal flow constructed wetland (HF CW), we used Equation (3) where V4 is the total volume of the constructed wetland (201.6 m3), εw is the average porosity of the filling material in the wetland (0.68), and E is the estimated loss of water due to evaporation and evapotranspiration through the plants in the wetland according to the average local climatic conditions. Based on the findings of Headley et al. [41], measuring the rate of evapotranspiration from subsurface horizontal flow wetlands planted with Phragmites australis in sub-tropical environment, an average loss of 10% of water by evapotranspiration from soil and plants was considered. By applying Equation (3) we got a residence time in the HF CW of 11.75 days.
Comparing water quality conditions in the measured outflow of the UAF (Table 4) and in the HF CW (Table 5) it was observed that this unit could reduce 38.0% of the FOG, 55.2% of the TSS, 68.4% of the BOD, 81.0% of COD, 44.2% of TN, and 21.6% of TP. In the third treatment step, the pathogen indicators were reduced by an average of 88.5%. As it was explained before, the increase of pathogens indicators in July happened because of the rainfall that entered the inlet of the system which removed part of the pathogens settled in the septic tank. If we leave out the values measured in July, the pathogen removal efficiency of the system increases to 90.0%, fulfilling the requirements of the official Mexican regulations (NOM-001-SEMARNAT-1996) without using chlorination [42].
4.4. Outlet of the Desinfection Stage
The final process of the treatment system is the disinfection which works with chlorination tablets and is installed immediately after the level tank (LT) (see Figure 3). The disinfection practically reduces the pathogen indicators to zero, fulfilling the Mexican official regulations [42]. In the case of discharges to surface waterbodies, the upper limit for FC is 1000 CFU/100 mL, and for the reuse of treated wastewater the upper limit is 240 CFU/100 mL in the case of direct contact with persons and 1000 for indirect or occasional contact with persons. Basically, we observe the same removal efficiencies obtained at the outflow of the constructed wetland for FOG, TSS, BOD, and COD. Nutrients remain practically the same but there is a reduction to zero of each of the pathogen indicators.
5. Discussion
The passive treatment system was designed and constructed during the period of 2014–2015 to support the treatment needs of an R&D center producing high-strength domestic wastewater. An amount of close to 120,000 USD was invested in the construction of this system. After almost three years of operating the system, the M&O costs of the system were estimated to be around 700 USD per year. The actual savings in water for irrigation were estimated to be close to 2000 USD per year. Additionally, during the period of study the system discharges consistently complied almost with all parameters observed by the official Mexican standards NOM-001-SEMARNAT-1997 and NOM-003-SEMARNAT-1997 [42]. These norms establish the limits of wastewater parameters in treated wastewater discharged into surface water bodies and those reused for public services respectively [42]. Table 6 shows the average water quality parameters reached at the end of the process after the chlorination stage and the estimated overall efficiency of the system.
As explained throughout this paper, the system was designed to treat highly polluted domestic wastewater. Therefore, the actual hydraulic retention times (HRT) in each stage of the treatment process are relatively high compared to those recommended in the literature for septic tanks of one to three days [40,43], 2 to 96 h for UAF units treating domestic or rural sewages [16,17,18,19], 10 to 20 days for high rate anaerobic digesters treating high-strength wastewater [44], and the range of two to seven days in horizontal subsurface constructed wetlands [45]. In the pilot treatment plant, it was established a HRT for the septic tank of 2.45 days which is in accordance with the literature. For the UAF, a HRT of 6.4 days was established which is 1.6 times higher than the best HRT suggested for UAF systems but in the middle of those suggested to treat high-strength wastewater. Finally, the HF CW was designed with a HRT of 11.75 days which is double too high to that suggested by the literature to treat domestic wastewater. The content of total nitrogen in domestic wastewater is in the range of 20 mg L−1 to 50 mg L−1 and the content of total phosphorus is in the range of 5 mg L−1 to 15 mg L−1 [10]. As shown in Table 2, total nitrogen at the inlet of the system is three to six times higher and total phosphorus is in the upper limit. It was expected that the longer the residence time designed for the HF CW system could capture most of the nitrogen and phosphorus entering to the system.
According with the results shown in Table 7, the system efficiently removes most of the contaminants entering to the system except for nutrients. Phosphorus concentration was reduced almost to the limits permitted by the Mexican regulations for treated wastewater discharged to surface waterbodies [42]. Nitrogen was reduced only to almost 50% but the end concentration is far from the permitted concentration discharged to surface waterbodies [42].
On the other hand, overabundance or deficiency of available nitrogen are both problematic for grass plants. Excessive levels of nitrogen: (1) stimulate rapid shoot growth while slowing down root growth and increasing the need for more frequent mowing; (2) deplete the plant’s carbohydrate reserves more rapidly, which in turn can result in less stress tolerance and slower recovery from any injury to the plant; (3) result in thinner, more succulent leaf tissue, which increases moisture loss and therefore creates a greater need for water; (4) can predispose the plant to greater insect and disease problems; (5) contribute to more rapid and excessive thatch development; (6) leach through the soil beyond the root system, potentially polluting groundwater resources when not used by the grass plant [46]. To date, the grass of the R&D Center shows healthy development in both rainy and dry season. However, it will be necessary to monitor the subsurface land to measure if the excess of nitrogen is leaching and polluting the underground.
Later monitoring data shows that the system still works satisfactorily removing chemical organic matter, even with COD loads of 2560 mg L−1 with an efficiency removal of 93.9%. In counterpart, the efficiency in nutrients removal barely achieved 50% for both nitrogen and phosphorus. Since the treated wastewater is directly reused for irrigation, the excess of nutrients results in benefits to the green areas of the R&D center, because the use of synthetic fertilizers is not required. The quantification of the number of plants produced per square meter per month in the HF CW is still pending but preliminary counts establish that about 50% of the planted wetland (about 500 plants) produce at least one lateral bud per month.
6. Conclusions
The elevated organic content of high-strength domestic wastewater makes aerobic treatment systems uneconomical. High-strength domestic wastewater was preferably treated anaerobically, thus providing a potential for energy generation while producing low surplus sludge [44]. Additionally, in the tested pilot plant project it was possible to produce successfully Agapanthus africanus as an ornamental plant.
As explained by previous authors, the efficiency in the removal of pollutants from high-strength domestic wastewater by using anaerobic processes are mainly controlled by the hydraulic residence time selected in the design of the anaerobic units and in the HF CW [44,45]. The studied wastewater treatment process efficiently reduced the FOG, TSS, BOD, and COD loads from the R&D center sewage, meeting the water quality standards requested by Mexican regulations [42]. The present results are in accordance with the experience of similar treatment systems reported for tropical climates [12]. Through this work, it is possible to extend the principles of BOD and COD removal reported for domestic wastewater to high-strength domestic wastewater [44].
Discharged Total-N concentration was close to seven times higher compared with the requested official standard which controls the treated wastewater discharged to surface water bodies [42]. Most of the total-N concentration was removed in the HF CW and the results show that, despite the longer hydraulic residence time, it was not sufficient to remove it to values below 50%. In counterpart, total-P was very close to fulfil the limits of the official regulations [42]. Since treated wastewaters were used for irrigation, chlorination was necessary at the end of the treatment process to meet environmental regulations regarding fecal coliforms [42]. Total-N removal was safely solved by the reuse of treated wastewater in grass irrigation, but in case of discharges to surface waterbodies it will be necessary to use combined aerobic and anaerobic processes to improve the denitrification process [47].
Nowadays, the pilot treatment system still works close to the facilities where R&D activities are regularly carried out without releasing offensive odors. The community at the R&D center enjoys an environmentally friendly area because they preserve green areas all year long, a nice view was created specially during the flowering time of the African agapanthus, and a habitat was created within the constructed wetland, where several species of birds, lizards, butterflies, and bees are frequent visitors to this artificial ecosystem.
Acknowledgments
The authors acknowledge the “Centro de Investigación y Asistencia en Tecnología y Diseño del Estado de Jalisco, A. C.” (CIATEJ) for financing the monitoring work during the period of study. We particularly acknowledge the work done by the team of the Department of Analytical Chemistry at CIATEJ. We are also very thankful for Dana Erickson’s help in reviewing the grammar of this work.
Author Contributions
José de Anda and Alberto López-López are the authors of the technology described in this work. Edgardo Villegas-García implemented the sampling protocols and followed up with the analytical procedures during the period of study.
Conflicts of Interest
The authors declare no conflict of interest. The technology involved in this paper was already protected by “Centro de Investigación y Asistencia en Tecnología y Diseño del Estado de Jalisco, A. C.” under the law of the Mexican Institute of Industrial Protection, number MX/a/2010/014332.
References
- Massoud, M.A.; Tarhini, A.; Nasr, J.A. Decentralized approaches to wastewater treatment and management: Applicability in developing countries. J. Environ. Manag. 2009, 90, 652–659. [Google Scholar] [CrossRef] [PubMed]
- Muga, H.E.; Mihelcic, J.R. Sustainability of wastewater treatment technologies. J. Environ. Manag. 2008, 88, 437–447. [Google Scholar] [CrossRef] [PubMed]
- Libralato, G.; Ghirardini, A.V.; Avezzù, F. To centralise or to decentralise: An overview of the most recent trends in wastewater treatment management. J. Environ. Manag. 2012, 94, 61–68. [Google Scholar] [CrossRef] [PubMed]
- Noyola, A.; Morgan-Sagastume, J.M.; Güereca, L.P. Selección de Tecnologías Para el Tratamiento de Aguas Residuales Municipales. Guía de Apoyo Para Ciudades Pequeñas y Medianas; Universidad Nacional Autónoma de México, Instituto de Ingeniería: Mexico City, México, 2013; p. 140. ISBN 978-607-02-4822-1. (In Spanish) [Google Scholar]
- Abdel-Halim, W.; Weichgrebe, D.; Rosenwinkel, K.-H.; Verink, J. Sustainable sewage treatment and re-use in developing countries. In Proceedings of the Twelfth International Water Technology Conference, IWTC12 2008, Alexandria, Egypt, 1 January 2008; pp. 1397–1409. Available online: http://www.iwtc.info/2008_pdf/15-2.PDF (accessed on 20 August 2017).
- De Anda, J.; Shear, H. Searching a sustainable model to manage and treat wastewater in Jalisco, Mexico. Int. J. Dev. Sustain. 2017, 5, 278–294. [Google Scholar]
- Sing, N.K.; Kazami, A.A.; Starkl, M. A review on full-scale decentralized wastewater treatment systems: Techno-economical approach. Water Sci. Technol. 2015, 71, 468–474. [Google Scholar] [CrossRef] [PubMed]
- Wua, H.; Zhang, J.; Ngo, H.H.; Guo, W.; Hub, Z.; Liang, S.; Fan, J.; Liu, H. A review on the sustainability of constructed wetlands for wastewater treatment: Design and operation. Bioresour. Technol. 2015, 175, 594–601. [Google Scholar] [CrossRef] [PubMed]
- ElZein, Z.; Abdou, A.; Abd ElGawad, I. Constructed Wetlands as a Sustainable Wastewater Treatment Method in Communities. Procedia Environ. Sci. 2016, 34, 605–617. [Google Scholar] [CrossRef]
- Tchobanoglous, G.; Stensel, H.D.; Tsuchihashi, R.; Burton, F.L.; Abu-Orf, M.; Bowden, G.; Pfang, W. Wastewater Engineering: Treatment and Reuse, 5th ed.; McGraw-Hill: New York, NY, USA, 2014; p. 2018. [Google Scholar]
- Khan, A.A.; Gaur, R.Z.; Kazmi, A.A.; Lew, B. Sustainable Post Treatment Options of Anaerobic Effluent, Biodegradation—Engineering and Technology; Chamy, R., Ed.; InTech: Rijeka, Croatia, 2013. [Google Scholar] [CrossRef]
- Chernicharo, C.A.L. Post-treatment options for the anaerobic treatment of domestic wastewater. Rev. Environ. Sci. Bio/Technol. 2006, 5, 73–92. [Google Scholar] [CrossRef]
- Kaseva, M.E. Performance of a sub-surface flow constructed wetland in polishing pre-treated wastewater—A tropical case study. Water Res. 2004, 38, 681–687. [Google Scholar] [CrossRef] [PubMed]
- Mbuligwe, S.E. Comparative effectiveness of engineered wetland systems in the treatment of anaerobically pre-treated domestic wastewater. Ecol. Eng. 2004, 23, 269–284. [Google Scholar] [CrossRef]
- Hamouri, B.E.; Nazih, J.; Lahjouj, J. Subsurface-horizontal flow constructed wetland for sewage treatment under Moroccan climate conditions. Desalination 2007, 215, 153–158. [Google Scholar] [CrossRef]
- Przywara, L.; Mrowiec, B.; Suschka, J. The Application of Anaerobic Filter for Municipal Wastewater Treatment. Chem. Pap. 2000, 54, 159–164. [Google Scholar]
- Bodík, I.; Herdová, B.; Drtil, M. The use of up-flow anaerobic filter and AnSBR for wastewater treatment at ambient temperature. Water Res. 2002, 36, 1084–1088. [Google Scholar] [CrossRef]
- Manariotis, I.D.; Grigoropoulos, S.G. Municipal-Wastewater Treatment Using Up-flow-Anaerobic Filters. Water Environ. Res. 2006, 78, 233–242. [Google Scholar] [CrossRef] [PubMed]
- Ladu, J.L.C.; LÜ, X.-W. Effects of hydraulic retention time, sewage temperature and effluent recycling on efficiency of up-flow anaerobic filter reactor in treating rural domestic sewage. Int. J. Waste Resour. 2016, 6 (Suppl. S3). [Google Scholar] [CrossRef]
- Villegas-Gómez, J.D.; Jhonniers-Guerrero, E.; Castaño-Rojas, J.M.; Paredes-Cuervo, D. Septic Tank (ST)-Up Flow Anaerobic Filter (UAF)-Subsurface Flow Constructed Wetland (SSF-CW) systems aimed at wastewater treatment in small localities in Colombia. Rev. Téc. Fac. Ing. Univ. Zulia 2006, 29, 269–281. [Google Scholar]
- Nguyen, A.V.; Pham, N.T.; Nguyen, T.H.; Morel, A.; Tonderski, K. Improved septic tank with constructed wetland, a promising decentralized wastewater treatment alternative in Vietnam. In Proceedings of the Paper XI-RCS-07-30 NOWRA 16th Annual Technical Education Conference & Exposition, Baltimore, Maryland, 10–14 March 2007. [Google Scholar]
- Kadlec, R.H. Pond and wetland treatment. Water Sci. Technol. 2003, 48, 1–8. [Google Scholar] [PubMed]
- Senzia, M.A.; Mashauri, D.A.; Mayo, A.W. Suitability of constructed wetlands and waste stabilisation ponds in wastewater treatment: Nitrogen transformation and removal. Phys. Chem. Earth 2003, 28, 1117–1124. [Google Scholar] [CrossRef]
- Peng, J.-F.; Wang, B.-Z.; Wang, L. Multi-stage ponds-wetlands ecosystem for effective wastewater treatment. J. Zhejiang Univ. Sci. B 2005, 6, 346–352. [Google Scholar] [CrossRef] [PubMed]
- Brix, H. Use of constructed wetlands in water pollution control: Historical development, present status, and future perspectives. Water Sci. Technol. 1994, 30, 209–223. [Google Scholar]
- Vymazal, J.; Brix, H.; Cooper, P.F.; Perfler, R.; Laber, J. Removal mechanisms and types of constructed wetlands. In Constructed Wetlands for Wastewater Treatment in Europe; Vymazal, J., Brix, H., Cooper, P.F., Green, M.B., Eds.; Backhuys Publishers: Leiden, The Netherlands, 1998; pp. 17–66, ISBN-10 9073348722. [Google Scholar]
- Vymazal, J. Plants used in constructed wetlands with horizontal subsurface flow: A review. Hydrobiologia 2011, 674, 133–156. [Google Scholar] [CrossRef]
- Belmont, M.A.; Metcalfe, C.D. Feasibility of using ornamental plants (Zantedeschia aethiopica) in subsurface flow treatment wetlands to remove nitrogen, chemical oxygen demand and nonylphenol ethoxylate surfactants—A laboratory-scale study. Ecol. Eng. 2003, 21, 233–247. [Google Scholar] [CrossRef]
- Merino-Solís, M.L.; Villegas, E.; de Anda, J.; López-López, A. The effect of the hydraulic retention time on the performance of an ecological wastewater treatment system: An anaerobic filter with a constructed wetland. Water 2015, 7, 1149–1163. [Google Scholar] [CrossRef]
- Zurita, F.; De Anda, J.; Belmont, M.A. Treatment of domestic wastewater and production of commercial flowers in vertical and horizontal subsurface-flow constructed wetlands. Ecol. Eng. 2009, 35, 861–869. [Google Scholar] [CrossRef]
- Konnerup, D.; Koottatep, T.; Brix, H. Treatment of domestic wastewater in tropical, subsurface flow constructed wetlands planted with Canna and Heliconia. Ecol. Eng. 2009, 35, 248–257. [Google Scholar] [CrossRef]
- Vymazal, J.; Kröpfelová, L. Types of Wastewater Treated in HF Constructed Wetlands. In Wastewater Treatment in Constructed Wetlands with Horizontal Sub-Surface Flow, Environmental Pollution; Vymazal, J., Kröpfelová, L., Eds.; Springer: Dordrecht, The Netherlands, 2008; Volume 14, pp. 323–354. [Google Scholar] [CrossRef]
- Vymazal, J. The use constructed wetlands with horizontal sub-surface flow for various types of wastewater. Ecol. Eng. 2009, 35, 1–17. [Google Scholar] [CrossRef]
- Vymazal, J. Removal of nutrients in various types of constructed wetlands. Sci. Total Environ. 2007, 380, 48–65. [Google Scholar] [CrossRef] [PubMed]
- Mekonnen, A.; Leta, S.; Njau, K.N. Wastewater treatment performance efficiency of constructed wetlands in African countries: A review. Water Sci. Technol. 2015, 71, 1. [Google Scholar] [CrossRef] [PubMed]
- Rousseau, D.P.L.; Lesage, E.; Story, A.; Vanrolleghem, P.A.; De Pauw, N. Constructed wetlands for water reclamation. Desalination 2008, 218, 181–189. [Google Scholar] [CrossRef]
- Trejo-Téllez, L.I.; Ramírez-Martínez, M.; Gómez-Merino, F.C.; García-Albarado, J.C.; Baca-Castillo, G.A.; Tejeda-Sartorius, O. Physical and chemical evaluation of volcanic rocks and its use for tulip production. Rev. Mex. Cienc. Agrícolas 2013, 5, 863–876. [Google Scholar]
- Gayosso-Rodríguez, S.; Borges-Gómez, L.; Villanueva-Couoh, E.; Estrada-Botello, M.A.; Garruña-Hernández, R. Substrates for Growing Flowers. Agrociencia 2016, 50, 617–631. [Google Scholar]
- Rice, E.W.; Baird, R.B.; Eaton, A.D. (Eds.) Standard Methods for the Examination of Water and Wastewater, 23rd ed.; American Public Health Works Association: Washington, DC, USA; American Water Works Association: Denver, CO, USA; Water Environment Federation: Alexandria, VA, USA, 2017; ISBN(s) 9781625762405. [Google Scholar]
- Bedinger, M.S.; Fleming, J.S.; Johnson, A.I. (Eds.) Site Characterization and Design of On-Site Septic Systems; STP1324; ASTM International: West Conshohocken, PA, USA, 1997. [Google Scholar]
- Headley, T.R.; Davison, L.; Huett, D.O.; Müller, R. Evapotranspiration from subsurface horizontal flow wetlands planted with Phragmites australis in sub-tropical Australia. Water Res. 2012, 46, 345–354. [Google Scholar] [CrossRef] [PubMed]
- Secretaría de Medio Ambiente y Recursos Naturales (SEMARNAT). Normas Oficiales Mexicanas NOM-001-SEMARNAT-1996, NOM-002-SEMARNAT-1996 NOM-003-SEMARNAT-1997. Secretaría de Medio Ambiente y Recursos Naturales (SEMARNAT) 2007, Comisión Nacional del Agua (CONAGUA), México, 1997. p. 65. Available online: http://www.conagua.gob.mx/CONAGUA07/Publicaciones/Publicaciones/SGAA-15-13.pdf (accessed on 13 September 2017). (In Spanish).
- Nasr, F.A.; Mikhaeil, B. Treatment of domestic wastewater using modified septic tank. Desalination Water Treat. 2014, 56, 2073–2081. [Google Scholar] [CrossRef]
- Hamza, R.A.; Iorhemen, O.T.; Joo Hwa Tay, J.H. Advances in biological systems for the treatment of high-strength wastewater. J. Water Process Eng. 2016, 10, 128–142. [Google Scholar] [CrossRef]
- Rousseau, D.P.L.; Vanrolleghem, P.A.; De Pauw, N. Model-based design of horizontal subsurface flow constructed treatment wetlands: A review. Water Res. 2004, 38, 1484–1493. [Google Scholar] [CrossRef] [PubMed]
- Mugaas, B. The Good, Bad and Interesting Roles of Nitrogen (N) and Nitrogen Fertilizers in Home Lawn Care—Part 2 of a 3 Part Series on Understanding and Using Home Lawn Fertilizers. University of Minnesota Extension. Available online: http://blog-yard-garden-news.extension.umn.edu/2011/03/the-good-bad-and-interesting-roles-of.html (accessed on 31 March 2011).
- Washington State Department of Health (WSDH). Nitrogen Reducing Technologies for Onsite Wastewater Treatment Systems. Wastewater Management Program; Division of Environmental Health, Washington State Department of Health: Olympia, WA, USA, 2005; p. 14. Available online: http://www.doh.wa.gov/portals/1/Documents/Pubs/337-093.pdf (accessed on 12 September 2017).
Figure 1.
Block diagram describing the treatment process.
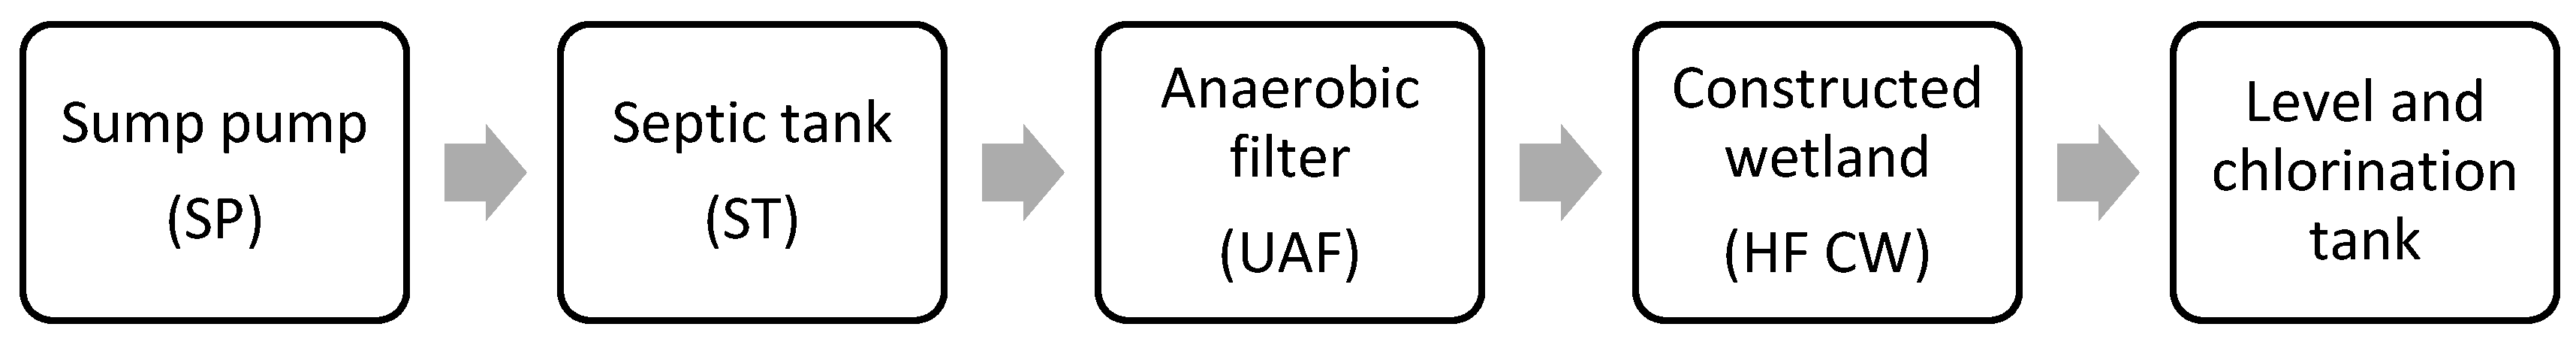
Figure 2.
Wastewaters entering to the sump pump (SP). The waste waters are pumped to a septic tank (ST) which has a vent pipe (VP) to permit biogas generated during the anaerobic decomposition to exit.
Figure 2.
Wastewaters entering to the sump pump (SP). The waste waters are pumped to a septic tank (ST) which has a vent pipe (VP) to permit biogas generated during the anaerobic decomposition to exit.
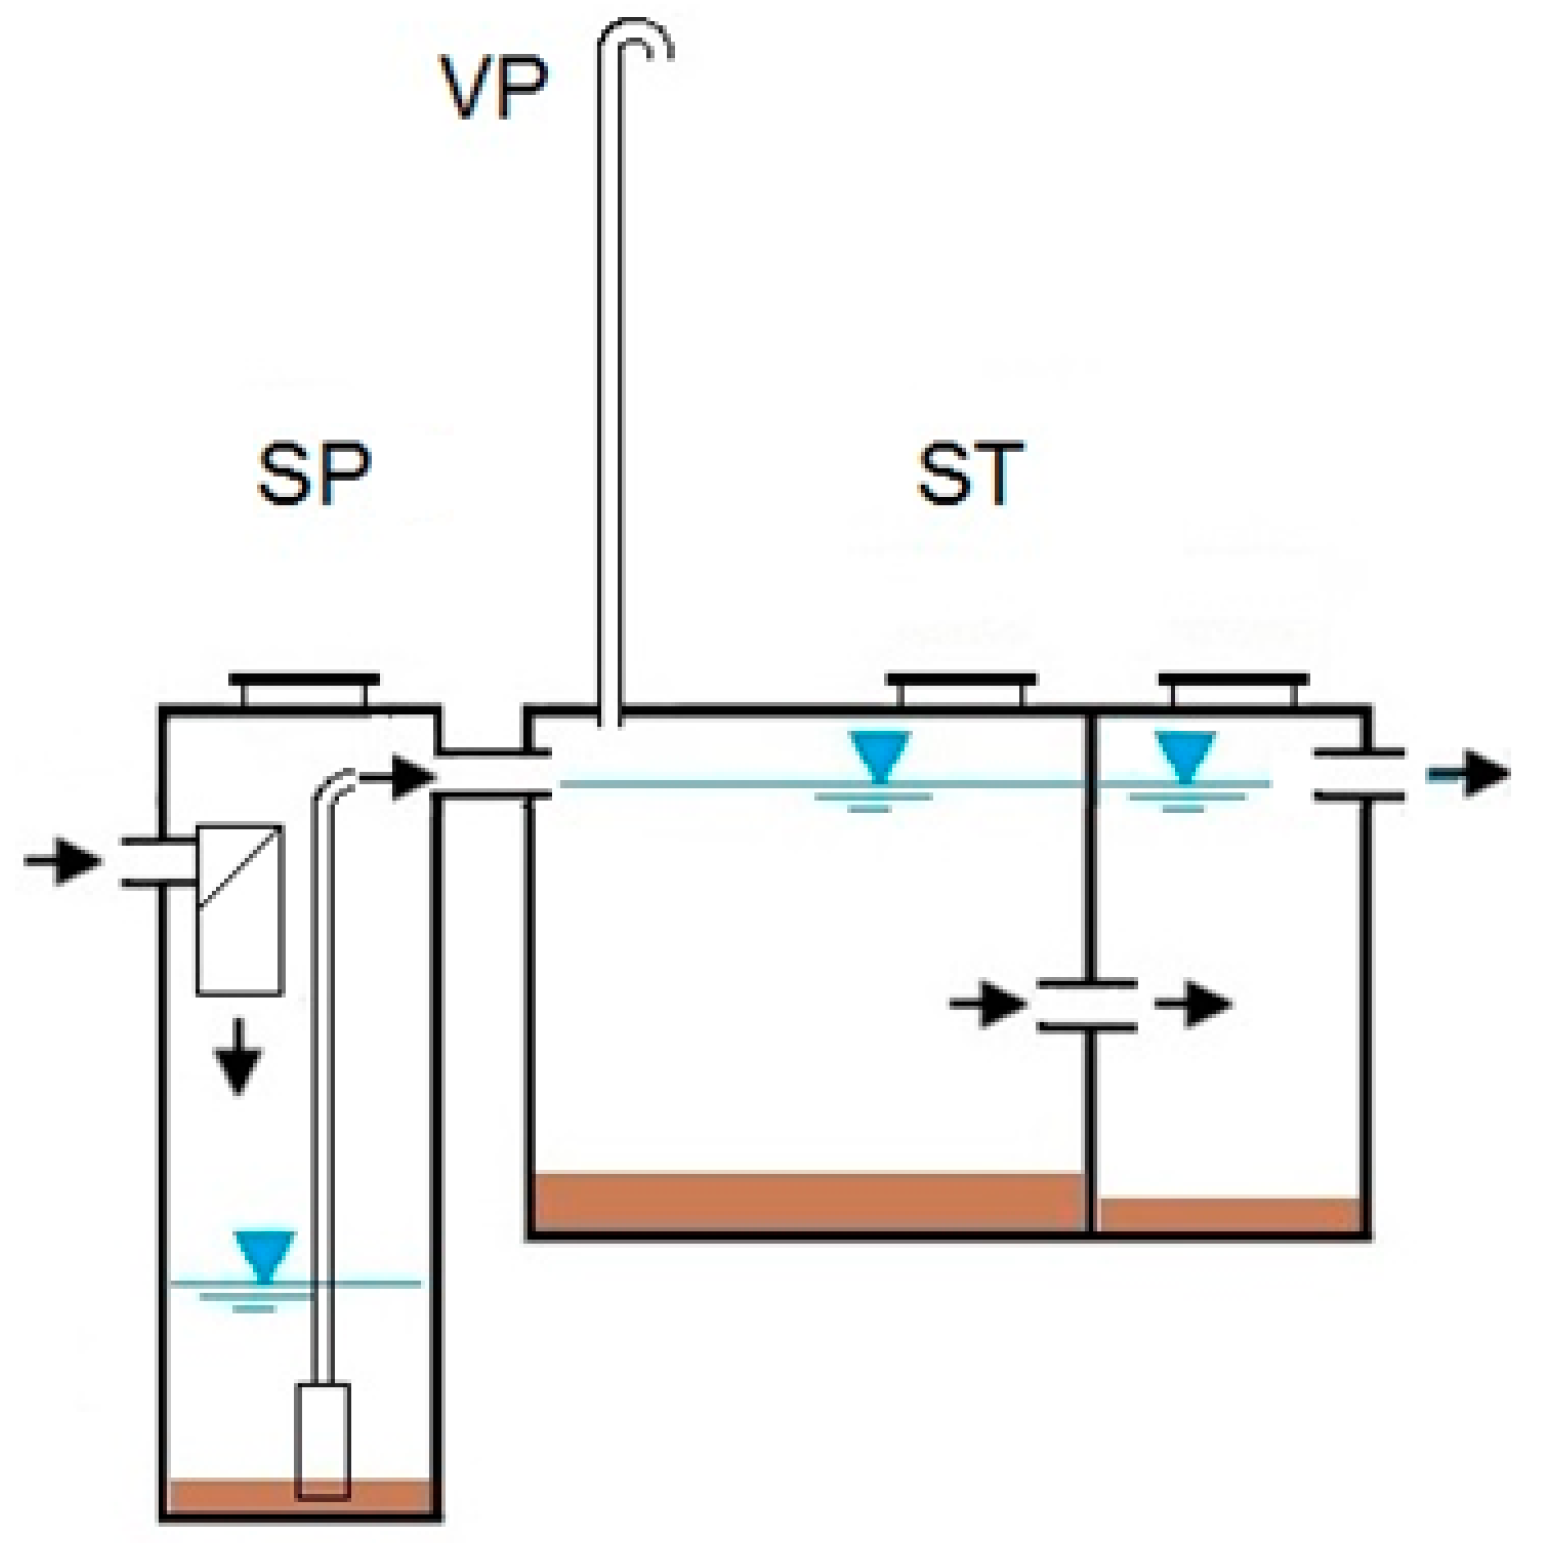
Figure 3.
Wastewaters flowing to an up-flow anaerobic filter (UAF) and then to a horizontal subsurface constructed wetland (HF CW).
Figure 3.
Wastewaters flowing to an up-flow anaerobic filter (UAF) and then to a horizontal subsurface constructed wetland (HF CW).
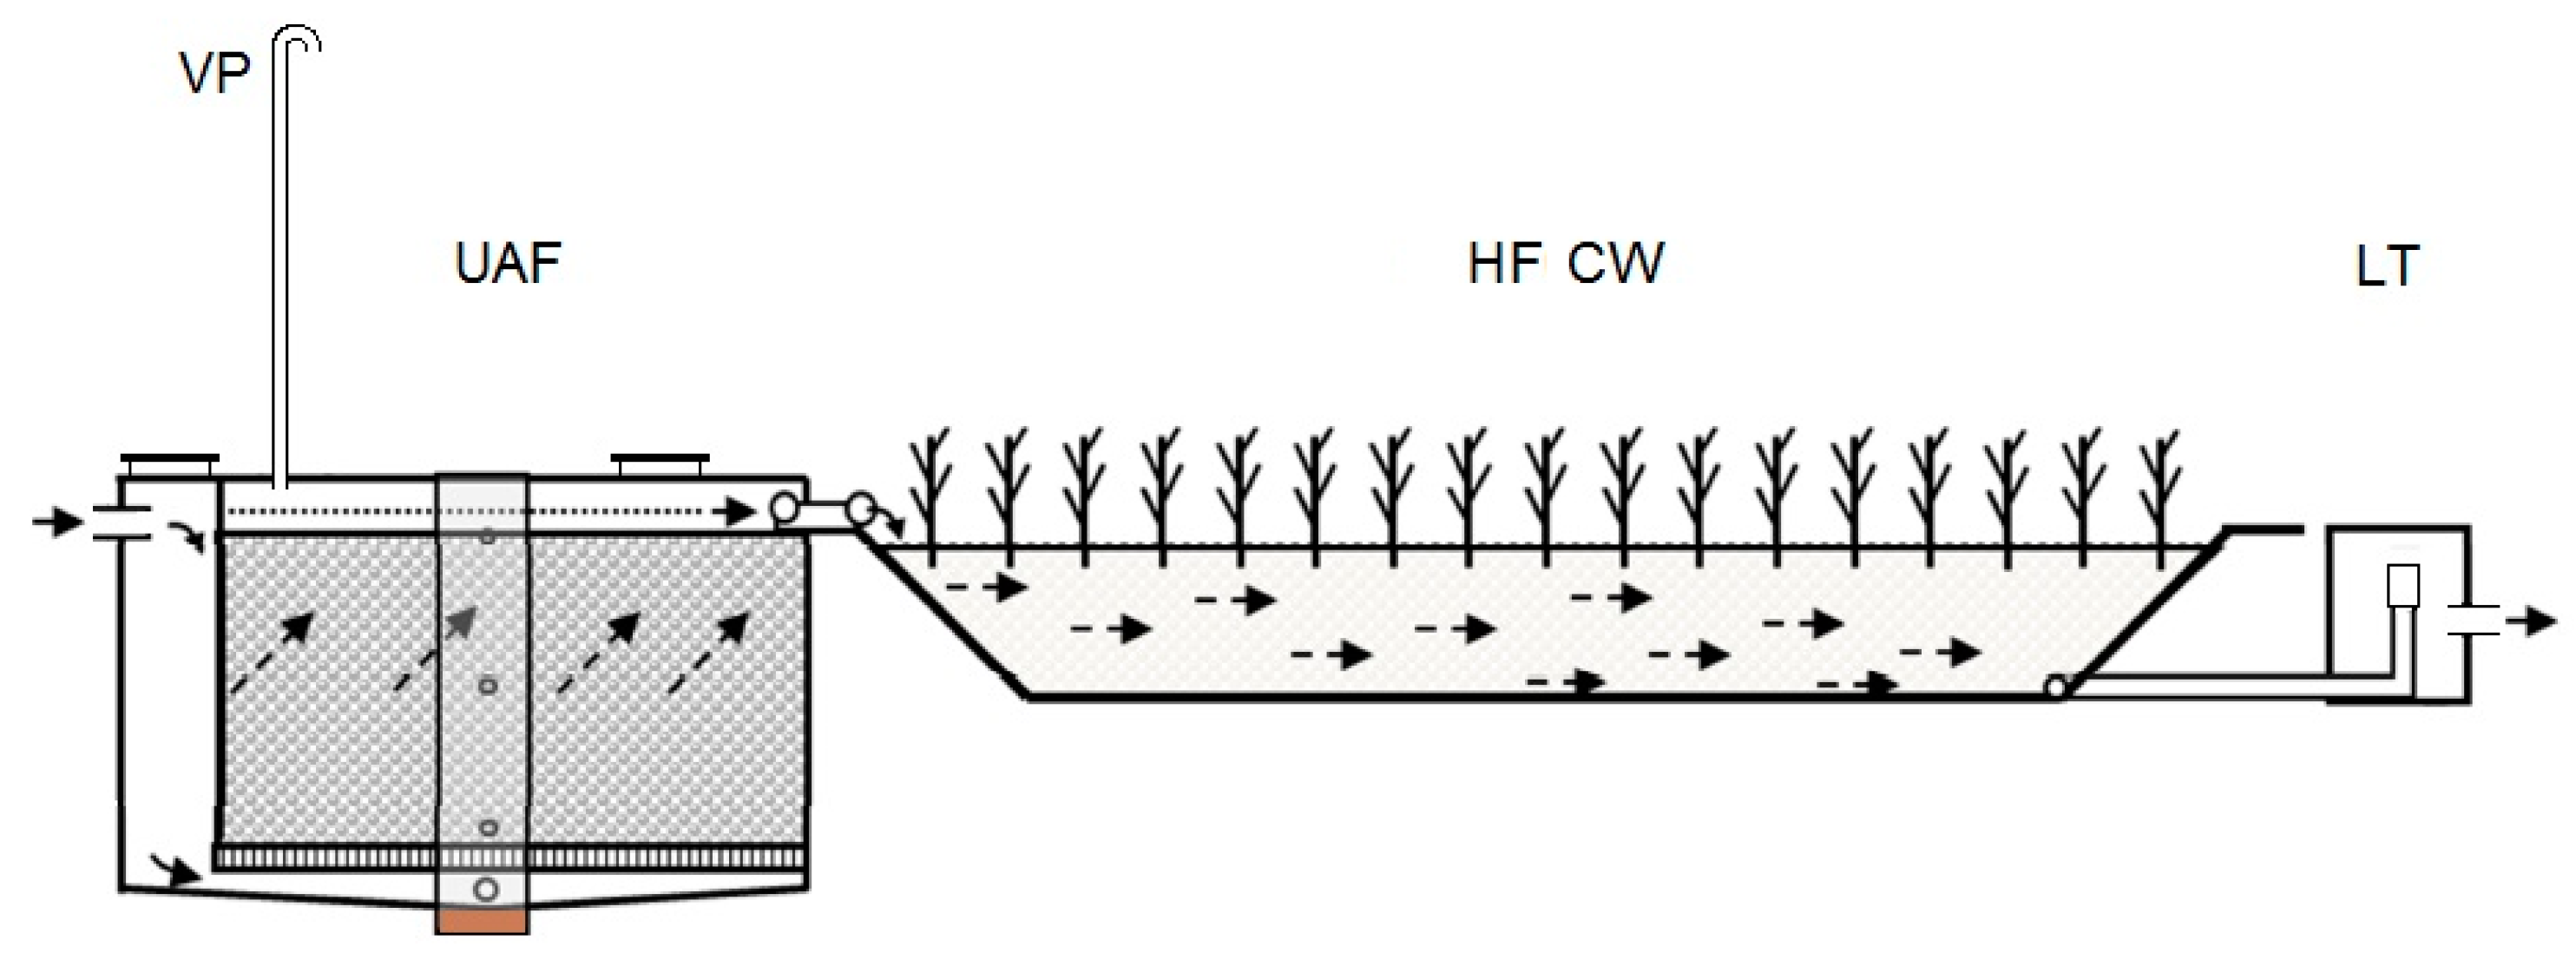
Figure 4.
Amount of rainfall during the period of January 2016 to January 2017 in the meteorological station located in Guadalajara.
Figure 4.
Amount of rainfall during the period of January 2016 to January 2017 in the meteorological station located in Guadalajara.


Table 1.
Removal efficiencies in anaerobic systems treating domestic sewage [12].
Table 1.
Removal efficiencies in anaerobic systems treating domestic sewage [12].
| Anaerobic System | Effluent BOD a (mg/L) | BOD Removal Efficiency a (%) |
|---|---|---|
| Anaerobic pond | 70–160 | 40–70 |
| UASB reactor | 60–120 | 55–75 |
| Septic tank | 80–150 | 35–60 |
| Imhoff tank | 80–150 | 35–60 |
| Septic tank followed by anaerobic filter | 40–60 | 75–85 |
a Ranges of effluent concentration and typical removal efficiencies based on Brazilian experience. Lower efficiency limits are usually associated with poorly operated systems.
Table 2.
Water quality parameters at the entrance of the septic tank (ST) (SD = standard deviation).
Table 2.
Water quality parameters at the entrance of the septic tank (ST) (SD = standard deviation).
| Water Quality Parameter | Unit | 2016 | 2017 | Average and SD | |||
|---|---|---|---|---|---|---|---|
| Jan | Apr | Jul | Oct | Jan | |||
| pH | - | 8.5 | 7.5 | 6.3 | 7.0 | 8.4 | 7.54 ± 0.93 |
| Floating material | - | Presence | Presence | Presence | Presence | Presence | Presence |
| Turbidity | NTU | 158.0 | 87.3 | 88.5 | 196.0 | 223.0 | 150.56 ± 61.69 |
| Fats, oil, and grease | mg L−1 | 40.9 | 44.9 | 38.8 | 21.6 | 39.0 | 37.04 ± 8.97 |
| Settleable solids | mg L−1 | 3.0 | 0.8 | 0.5 | 0.6 | 6.0 | 2.18 ± 2.37 |
| Total Suspended Solids | mg L−1 | 112.5 | 157.5 | 152.5 | 290.0 | 310.0 | 204.50 ± 89.19 |
| Biological Oxygen Demand | mg L−1 | 854.0 | 426.0 | 329.5 | 458.0 | 458.0 | 505.10 ± 202.03 |
| Chemical Oxygen Demand | mg L−1 | 1453.0 | 863.5 | 666.5 | 1061 | 895.5 | 987.90 ± 295.37 |
| Total Nitrogen | mg L−1 | 121.0 | 295.1 | 296.2 | 122.0 | 148.5 | 196.56 ± 91.13 |
| Total Phosphorus | mg L−1 | 14.2 | 13.9 | 12.0 | 10.0 | 9.8 | 11.98 ± 2.08 |
| Total Coliforms (×105) | CFU/100 mL | 920 | 210 | 1600 | 920 | 920 | 914.00 ± 491.51 |
| Fecal Coliforms (×105) | CFU/100 mL | 540 | 820 | 1600 | 540 | 540 | 808.00 ± 459.04 |
| E. coli (×105) | CFU/100 mL | 240 | 820 | 1600 | 540 | 540 | 748.00 ± 518.57 |
| Residual chlorine | mg L−1 | <0.1 | <0.1 | <0.1 | <0.1 | <0.1 | CELL |
| Color | Pt-Co. | 312 | 739 | 376 | 959 | 1574 | 792.00 ± 511.29 |
Table 3.
Water quality parameters at the outlet of the septic tank (SD = standard deviation).
| Water Quality Parameter | Unit | 2016 | 2017 | Average and SD | |||
|---|---|---|---|---|---|---|---|
| Jan | Apr | Jul | Oct | Jan | |||
| pH | - | 7.1 | 6.9 | 6.7 | 7.1 | 7.1 | 6.98 ± 0.18 |
| Floating material | - | Absence | Absence | Absence | Absence | Absence | CELL |
| Turbidity | NTU | 53.0 | 53.0 | 75.8 | 116.0 | 147.0 | 88.96 ± 41.41 |
| Fats, oil, and grease | mg L−1 | 1.9 | 5.8 | 27.6 | 5.56 | 19.4 | 12.05 ± 10.95 |
| Settleable solids | mg L−1 | 0.3 | 0.4 | 0.3 | 0.2 | 1.5 | 0.54 ± 0.54 |
| Total Suspended Solids | mg L−1 | 45.0 | 90.0 | 45.0 | 165.5 | 110.0 | 91.10 ± 50.36 |
| Biological Oxygen Demand | mg L−1 | 157.0 | 136.5 | 235.5 | 276.0 | 177.5 | 196.50 ± 57.80 |
| Chemical Oxygen Demand | mg L−1 | 458.0 | 554.0 | 476.5 | 534.0 | 465.5 | 497.60 ± 43.44 |
| Total Nitrogen | mg L−1 | 111.5 | 505.7 | 270.8 | 120.7 | 140.0 | 229.74 ± 167.16 |
| Total Phosphorus | mg L−1 | 12.4 | 12.5 | 11.4 | 9.4 | 6.8 | 10.50 ± 2.41 |
| Total Coliforms (×105) | CFU/100 mL | 35 | 49 | 220 | 79 | 170 | 110.60 ± 80.63 |
| Fecal Coliforms (×105) | CFU/100 mL | 3.1 | 49 | 47 | 33 | 170 | 60.42 ± 63.94 |
| E. coli (×105) | CFU/100 mL | 3.1 | 49 | 47 | 33 | 170 | 60.42 ± 63.94 |
| Residual chlorine | mg L−1 | <0.1 | <0.1 | <0.1 | <0.1 | <0.1 | CELL |
| Color | Pt-Co. | 302 | 499 | 354 | 631 | 1075 | 572.20 ± 309.13 |
Table 4.
Water quality parameters at the outlet of the up-flow anaerobic filter (UAF) (SD = standard deviation).
Table 4.
Water quality parameters at the outlet of the up-flow anaerobic filter (UAF) (SD = standard deviation).
| Water Quality Parameter | Unit | 2016 | 2017 | Average and SD | |||
|---|---|---|---|---|---|---|---|
| Jan | Apr | Jul | Oct | Jan | |||
| pH | - | 7.1 | 7.1 | 6.8 | 7.1 | 7.4 | 7.10 ± 0.21 |
| Floating material | - | Absence | Absence | Absence | Absence | Absence | - |
| Turbidity | NTU | 32.8 | 32.8 | 14.5 | 3.7 | 13.5 | 19.46 ± 12.89 |
| Fats, oil, and grease | mg L−1 | 0.9 | 1.87 | 4.2 | 1.1 | 0.8 | 1.77 ± 1.42 |
| Settleable solids | mg L−1 | 0 | 0 | 0 | 0 | 0 | - |
| Total Suspended Solids | mg L−1 | 22.5 | 17.5 | 12.5 | 27.5 | 21.5 | 20.30 ± 5.63 |
| Biological Oxygen Demand | mg L−1 | 35.0 | 29.4 | 31.5 | 19.0 | 25.5 | 28.08 ± 6.13 |
| Chemical Oxygen Demand | mg L−1 | 239 | 245.5 | 52.5 | 56.5 | 126.5 | 144.00 ± 94.42 |
| Total Nitrogen | mg L−1 | 120.5 | 261 | 230.1 | 145.3 | 144.0 | 180.18 ± 61.46 |
| Total Phosphorus | mg L−1 | 12.0 | 7.0 | 9.1 | 6.9 | 4.3 | 7.86 ± 2.87 |
| Total Coliforms (×105) | CFU/100 mL | 7.9 | 2.6 | 540 | 1.3 | 6.4 | 4.55 ± 3.11 |
| Fecal Coliforms (×105) | CFU/100 mL | 4.3 | 2.6 | 350 | 0.2 | 4.3 | 2.85 ± 1.94 |
| E. coli (×105) | CFU/100 mL | 4.3 | 2.6 | 350 | 0.2 | 4.3 | 2.85 ± 1.94 |
| Residual chlorine | mg L−1 | <0.1 | <0.1 | <0.1 | <0.1 | <0.1 | - |
| Color | Pt-Co. | 207 | 126 | 97 | 82 | 193 | 152.00 ± 58.54 |
Table 5.
Water quality parameters at the outlet of constructed wetland (SD = standard deviation).
| Water Quality Parameter | Unit | 2016 | 2017 | Average and SD | |||
|---|---|---|---|---|---|---|---|
| Jan | Apr | Jul | Oct | Jan | |||
| pH | - | 7.0 | 7.0 | 6.9 | 7.1 | 7.4 | 7.08 ± 0.19 |
| Floating material | - | Absence | Absence | Absence | Absence | Absence | - |
| Turbidity | NTU | 1.7 | 1.7 | 4.2 | 3.6 | 2.5 | 2.74 ± 1.13 |
| Fats, oil, and grease | mg L−1 | 0.1 | 0.1 | 3.6 | 1.1 | 0.6 | 1.10 ± 1.46 |
| Settleable solids | mg L−1 | 0 | 0 | 0 | 0 | 0 | - |
| Total Suspended Solids | mg L−1 | 12.5 | 5.5 | 4.5 | 13.0 | 10.0 | 9.10 ± 3.93 |
| Biological Oxygen Demand | mg L−1 | 15 | 10.3 | 8 | 8.0 | 3.0 | 8.86 ± 4.35 |
| Chemical Oxygen Demand | mg L−1 | 36.7 | 20.7 | 32.7 | 21.2 | 25.8 | 27.42 ± 7.08 |
| Total Nitrogen | mg L−1 | 98.8 | 123.1 | 100.3 | 105.0 | 75.5 | 100.54 ± 17.02 |
| Total Phosphorus | mg L−1 | 11 | 6.1 | 4.4 | 6.0 | 3.3 | 6.16 ± 2.95 |
| Total Coliforms (×105) | CFU/100 mL | 0.017 | 0.068 | 0.79 | 0.078 | 1.3 | 0.37 ± 0.62 |
| Fecal Coliforms (×105) | CFU/100 mL | 0.0078 | 0.018 | 0.49 | 0.002 | 1.3 | 0.33 ± 0.65 |
| E. coli (×105) | CFU/100 mL | 0 | 0.018 | 0.49 | 0.002 | 1.3 | 0.33 ± 0.65 |
| Residual chlorine | mg L−1 | <0.1 | <0.1 | <0.1 | <0.1 | <0.1 | - |
| Color | Pt-Co. | 36 | 45 | 19 | 44 | 40 | 41.25 ± 4.11 |
Table 6.
Overall efficiency of the system in the pollutants removal and compliance with the regulations.
Table 6.
Overall efficiency of the system in the pollutants removal and compliance with the regulations.
| Water Quality Parameter | Unit | Inlet to the Septic Tank | Outlet of the HF CW | Removal Efficiency | After Chlorination | NOM-001/003 a | Compliance with the Regulation |
|---|---|---|---|---|---|---|---|
| Temperature | °C | - | - | - | - | 40 | √ c |
| pH | - | 7.54 | 7.08 | - | 7.02 | 5–10 | √ |
| Floating material | - | Presence | Absence | - | Absence | Absence | √ |
| Turbidity | NTU | 150.56 | 2.74 | 98.2% | 1.78 | NS b | |
| Fats, oil, and grease | mg L−1 | 37.04 | 1.10 | 97.0% | 0.98 | 15 | √ |
| Settleable solids | mg L−1 | 2.18 | - | 100.0% | - | 1 | √ |
| Total Suspended Solids | mg L−1 | 204.50 | 9.10 | 95.6% | 5.90 | 30 | √ |
| Biological Oxygen Demand | mg L−1 | 505.10 | 8.86 | 98.2% | 8.70 | 30 | √ |
| Chemical Oxygen Demand | mg L−1 | 987.90 | 27.42 | 97.2% | 23.88 | NS | - |
| Total Nitrogen | mg L−1 | 196.56 | 100.54 | 48.9% | 103.06 | 15 | NA d |
| Total Phosphorus | mg L−1 | 11.98 | 6.16 | 48.6% | 5.32 | 5 | NA |
| Total Coliforms (×105) | CFU/100 mL | 914.00 | 0.37 | 99.96% | - | NS | |
| Fecal Coliforms (×105) | CFU/100 mL | 808.00 | 0.33 | 99.96% | - | 0.01 | PA e |
| E. coli (×105) | CFU/100 mL | 748.00 | 0.33 | 100.0% | - | NS | |
| Residual chlorine | mg L−1 | <0.1 | <0.1 | 0.34 | NS | ||
| Color | Pt-Co. | 792.00 | 41.25 | 94.8% | 28.20 | NS |
a Maximum permitted water quality values for treated water discharge to natural lakes or reservoirs which later are used for urban public uses, measured as monthly average. b NS = Not specified by the Mexican regulation. c “√” Means in accordance with the regulation. d “NA” Means not in accordance with the regulation. e “PA” Means partially in accordance with the regulations since fecal coliforms were controlled after the HF CW by chlorination.
Table 7.
Water quality parameters at the outlet of the disinfection system (SD = standard deviation).
Table 7.
Water quality parameters at the outlet of the disinfection system (SD = standard deviation).
| Water Quality Parameter | Unit | 2016 | 2017 | Average and SD | |||
|---|---|---|---|---|---|---|---|
| Jan | Apr | Jul | Oct | Jan | |||
| pH | - | 7.3 | 7.0 | 6.5 | 7.2 | 7.2 | 7.02 ± 0.31 |
| Floating material | - | Absence | Absence | Absence | Absence | Absence | - |
| Turbidity | NTU | 1.70 | 1.70 | 4.2 | 3.6 | 2.5 | 1.78 ± 0.22 |
| Fats, oil, and grease | mg L−1 | 0.1 | 1.02 | 2.9 | 0.8 | 0.1 | 0.98 ± 1.15 |
| Settleable solids | mg L−1 | 0 | 0 | 0 | 0 | 0 | - |
| Total Suspended Solids | mg L−1 | 9.0 | 4.5 | 2.5 | 12.0 | 1.5 | 5.90 ± 4.46 |
| Biological Oxygen Demand | mg L−1 | 15 | 10.3 | 8 | 7.2 | 3.0 | 8.70 ± 4.40 |
| Chemical Oxygen Demand | mg L−1 | 36.1 | 18.62 | 23.6 | 16.3 | 24.8 | 23.88 ± 7.67 |
| Total Nitrogen | mg L−1 | 83.5 | 140.9 | 116.8 | 99.6 | 74.5 | 103.06 ± 26.60 |
| Total Phosphorus | mg L−1 | 11.0 | 5.6 | 4 | 4 | 2 | 5.32 ± 3.42 |
| Total Coliforms (×105) | CFU/100 mL | 0 | 0 | 0 | 0 | 0 | - |
| Fecal Coliforms (×105) | CFU/100 mL | 0 | 0 | 0 | 0 | 0 | - |
| E. coli (×105) | CFU/100 mL | 0 | 0 | 0 | 0 | 0 | - |
| Residual chlorine | mg L−1 | 0.3 | 0.3 | 0.4 | 0.2 | 0.5 | 0.34 ± 0.11 |
| Color | Pt-Co. | 20 | 41 | 16 | 38 | 26 | 28.20 ± 10.96 |
© 2018 by the authors. Licensee MDPI, Basel, Switzerland. This article is an open access article distributed under the terms and conditions of the Creative Commons Attribution (CC BY) license (http://creativecommons.org/licenses/by/4.0/).
Share and Cite
MDPI and ACS Style
De Anda, J.; López-López, A.; Villegas-García, E.; Valdivia-Aviña, K. High-Strength Domestic Wastewater Treatment and Reuse with Onsite Passive Methods. Water 2018, 10, 99. https://doi.org/10.3390/w10020099
AMA Style
De Anda J, López-López A, Villegas-García E, Valdivia-Aviña K. High-Strength Domestic Wastewater Treatment and Reuse with Onsite Passive Methods. Water. 2018; 10(2):99. https://doi.org/10.3390/w10020099
Chicago/Turabian StyleDe Anda, José, Alberto López-López, Edgardo Villegas-García, and Karla Valdivia-Aviña. 2018. "High-Strength Domestic Wastewater Treatment and Reuse with Onsite Passive Methods" Water 10, no. 2: 99. https://doi.org/10.3390/w10020099
Note that from the first issue of 2016, this journal uses article numbers instead of page numbers. See further details here.