Article

A Comparison of SWAT and ANN Models for Daily Runoff Simulation in Different Climatic Zones of Peninsular Spain

by
Patricia Jimeno-Sáez
1,*,
Javier Senent-Aparicio
1,
Julio Pérez-Sánchez
1 and
David Pulido-Velazquez
1,2
1
Department of Civil Engineering, Catholic University of San Antonio, Campus de los Jerónimos s/n, Guadalupe, 30107 Murcia, Spain
2
Geological Survey of Spain (IGME), Granada Unit, Urb. Alcázar del Genil, 4. Edificio Zulema, 18006 Granada, Spain
*
Author to whom correspondence should be addressed.
Water 2018, 10(2), 192; https://doi.org/10.3390/w10020192
Submission received: 18 December 2017 / Revised: 8 February 2018 / Accepted: 9 February 2018 / Published: 11 February 2018

Abstract

:
Streamflow data are of prime importance to water-resources planning and management, and the accuracy of their estimation is very important for decision making. The Soil and Water Assessment Tool (SWAT) and Artificial Neural Network (ANN) models have been evaluated and compared to find a method to improve streamflow estimation. For a more complete evaluation, the accuracy and ability of these streamflow estimation models was also established separately based on their performance during different periods of flows using regional flow duration curves (FDCs). Specifically, the FDCs were divided into five sectors: very low, low, medium, high and very high flow. This segmentation of flow allows analysis of the model performance for every important discharge event precisely. In this study, the models were applied in two catchments in Peninsular Spain with contrasting climatic conditions: Atlantic and Mediterranean climates. The results indicate that SWAT and ANNs were generally good tools in daily streamflow modelling. However, SWAT was found to be more successful in relation to better simulation of lower flows, while ANNs were superior at estimating higher flows in all cases.

1. Introduction

Streamflow is one of the most important variables of the hydrological cycle. In a watershed, streamflow data are necessary for many water resources issues such as management, planning and hydraulic engineering design [1]. Hydrological models are used in science and practice to predict extreme events in terms of flood and low-flow events for river management [2]. Therefore, a challenge of hydrological models is to adequately represent all phases with the same model parameter set [3] to avoid underestimating the very high flow and therefore the risk of flooding and to avoid overestimating the very low flow and water supply problems. There are many hydrological models. Conceptual hydrologic models that simulate streamflow in a watershed take into consideration various processes of the hydrological cycle through mathematical formulation [4]. Numerous hydrologic models have been developed to simulate the hydrologic processes and are important tools for estimating streamflow values, capable of establishing rainfall-runoff relationships [5]. A sophisticated mathematical model is the Soil and Water Assessment Tool (SWAT) [6]. SWAT is a conceptual semi-distributed model and currently is one of the most popular hydrologic models for watershed scale [7]. It has been widely used to estimate the streamflow time series and requires a large amount of spatial and temporal data and input parameters. In addition, the broad range of value parameters and their complex interactions complicate the model parameterization and calibration process [4]. To facilitate this process, SWAT-CUP (Calibration and Uncertainty Procedures) has been developed. It is a stand-alone program developed for calibration of SWAT which contains five calibration procedures and includes functionalities for validation and sensitivity analysis [8].
On the other hand, over the last decades with advances in computing, the estimation of hydrological variables by machine learning has gained much attention among researchers. Recent studies about real-life cases using soft computing techniques in hydrologic engineering consist of the following: Olyaie et al., (2015) [9] compared three artificial intelligence approaches, namely, artificial neural networks (ANNs), adaptive neuro-fuzzy inference system (ANFIS) and coupled wavelet and neural network (WANN), for estimating suspended sediment load (SSL) of river systems; Gholami et al., (2015) [10] modelled of groundwater level fluctuations using dendrochronology (tree-rings) and an ANN; Chen and Chau (2016) [11] developed a hybrid double feedforward neural network model for daily SSL estimation; Jimeno-Sáez et al., (2017) [12] used different machine learning models, such as ANN and ANFIS for instantaneous peak flow estimation based on maximum mean daily flow.
Specifically, ANNs, which have been introduced and widely applied to water resources system problems, were found to be powerful tools for the estimation of streamflow time series [13,14]. The particular advantage of the ANN is that the network can be trained to learn these relationships without requiring a priori knowledge of the physical characteristics of the process [15]. This feature makes ANNs an effective tool for modelling complex hydrological processes [16]. ANNs are empirical models which can be used as an alternative to simulate hydrological processes by connecting inputs and outputs through mathematical functions without the need to know the relationship with the catchment characteristics [17]. ANNs have been used in a considerable number of recent studies for estimating the values of streamflow [4,12,18,19,20]. Therefore, SWAT and ANN have been widely used for streamflow estimation. However, few studies have compared both models for daily streamflow estimation [5,21,22,23].
Against this background, one of the goals of this work is to use SWAT and ANNs to build a hydrologic model in basins with contrasting climatic conditions to simulate streamflow. These models are assessed at basin scale and in daily time intervals. A comparison of performance of ANN models with different input variables (e.g., daily precipitation, daily precipitation of previous days, total precipitation of previous days, mean daily temperature) has been made to find the best and most efficient network structure. Secondly, the selection of the most appropriate model for each of the studied cases is analysed by comparing the performance of SWAT and ANN models. In addition, their efficiency for the estimation of different ranges of flow (from very high to very low flow) is determined based on the flow duration curve (FDC). Thus, the efficiency of these models has been assessed in two watersheds: the Ladra River Basin (LRB) with an Atlantic climate and the headwaters of the Segura River Basin (HSRB) with a Mediterranean climate. These basins were selected based on the wide diversity of climate conditions that they represent, including some of the rainiest areas in Europe in the northeast of Spain (LRB) and the driest areas in the southeast of Spain (HSRB). To ensure the validity of the results, both basins are in natural regime. Selecting the appropriate model to simulate the streamflow in a watershed is a key challenge, and analysing the performance of these models in different climate basins could help researchers to apply the suitable model in each case.

2. Materials and Methods

2.1. Study Areas and Data Inputs

To compare the accuracy of SWAT and ANN models, two contrasting watersheds in Spain were selected as case studies in this work. Figure 1 shows the location map and the digital elevation models (DEMs) of the watersheds. Table 1 summarizes the characteristics of both watersheds. LRB is located in the north of the Miño-Sil Basin (NW Spain) and covers an area of 843 km2 with an elevation range from 392 to 872 m asl. The climate is typical Atlantic, with higher differences between extreme temperatures in summer and winter. Annual precipitation ranges from 660 to 1632 mm. The streamflow data are abundant and are produced by persistent Atlantic frontal systems from the west that generally occur from autumn to spring; summer is the driest season [24]. The mean monthly flow varied from 48 m3/s in winter to 4 m3/s in summer; this flow gradually decreases until summer and increases again during autumn. The predominant soil type is Humic Cambisol (82% of the total area). This area has a low permeability, and the importance of aquifers is much lower than superficial water resources [25]. The major land cover in the Ladra River watershed is forest land (35%) followed by land with scrub and/or herbaceous vegetation (24%), heterogeneous agricultural areas (23%) and mixed mosaic (18%).
The other studied area is the headwaters of the Segura River Basin (SE Spain), which has an area of 235 km2 and is characterized by steep terrain with an elevation range from 898 to 1912 m asl. The climate is Mediterranean with very dry summers and a rainy season extending from October to May, during which over 80% of annual precipitation occurs. The mean annual precipitation ranged from 412 to 1234 mm. The main soil type is Rendzic Leptosol (88% of the total area) with good drainage [26]. The catchment is characterized by conditions which allow the infiltration of a large amount of water and which smooth the hydrological response, and groundwater is crucial in surface hydrology [27]. During the summer months the rainfall is practically non-existent, and so the streamflow in this period is mainly from groundwater sources [28]. The mean monthly flow varies between 0.96 m3/s in September and 2.97 m3/s in January. The HSRB is a mostly forest-dominated area which covers about 61% of the basin, and 19% is covered by Mediterranean scrubland vegetation.
The SWAT and ANN models were constructed using freely available information. The daily discharge data of LRB were collected from the Centre for Hydrographic Studies of CEDEX website [29] and are available from 1971. The daily flow data for HSRB are available on the Hydrographic Confederation of the Segura River website [30] from 1987. This work used the climatic database SPAIN02 (see details in Herrera et al., (2012) [31]), which includes daily precipitation and temperature data for 1950 to 2007 in a grid (20 × 20 km) for Spanish territory. This grid was developed by considering a very dense network of quality-controlled stations. The grid was produced applying the kriging method in a two-step process. First, the occurrence was interpolated using a binary kriging and, in a second step, the amounts were interpolated by applying ordinary kriging to the occurrence outcomes [31]. Distributed hydrological models require spatially long-term, distributed, continuous data to simulate the hydrological response of a basin. However, conventional weather stations cannot fully represent the climate conditions across a basin because they are often sparsely distributed, particularly if large hydro climatic gradients exist [32]. In addition, weather station records often do not cover the proposed simulation period or contain gaps. That is why we have used grid-based data. DEMs were obtained from the National Geographic Institute of Spain [33], with a resolution of 25 m. The soil data were obtained from the Harmonized World Soil Database (HWSD), assembled by the Food and Agriculture Organization of the United Nations (FAO) [34]. Land cover maps were extracted from reclassified Corine Land Cover (CLC) [35].

2.2. SWAT Model

SWAT is a semi-distributed and semi-physically based model. SWAT considers the heterogeneity of a watershed by dividing it into sub-watersheds based on the river network and topography; subsequently, sub-watersheds are divided into hydrologic response units (HRUs) which lump land areas with unique soil, land cover and slope combinations. SWAT simulates the hydrologic cycle based on water balance, which is controlled by climate inputs such as daily precipitation and maximum and minimum air temperature. The water balance equation employed is [6]:
SW t   = S W i n i t +   i = 1 t ( R d a y ( i ) Q s u r f ( i ) E a ( i ) W s e e p ( i ) Q g w ( i ) )
where SWt is the final soil water content (mm), SWinit is the initial soil water content (mm), t is the time in days, Rday(i) is the precipitation on day i (mm), Qsurf(i) is the surface runoff (mm), Ea(i) is the evapotranspiration (mm), Wseep(i) is the percolation (mm) and Ggw(i) is the amount of baseflow (mm).

2.2.1. Model Setup and Data Sets

The SWAT model requires physically based inputs, like hydro-meteorological data, topography, soil properties, and land-use/land-cover in the catchment. Daily precipitation data (mm) and maximum and minimum temperature (°C) data from 1971 to 2007 in LRB and from 1987 to 2007 in Segura Basin were used for the SWAT model simulation. Relative humidity, solar radiation and wind speed were not available in the study areas. In this study, we simulated the potential evapotranspiration using the Hargreaves method [36] because it only requires maximum and minimum daily temperatures. Besides, according to Schneider et al., (2007) [37], the potential evapotranspiration method adopted has a minor effect on the simulated discharge response. The DEMs, with a 25 m mesh size, were used to determine the watershed and sub-watershed boundaries. Soil maps were used to characterize each soil type from information on soil texture, hydraulic conductivity and available water content, among others. Land cover is one of the most important factors that controls events such as runoff, evapotranspiration, sediment deposition and soil erosion [38]. In SWAT, the combination of these three data sets (DEM, soil maps and land cover maps) divided the watersheds into HRUs; three categories of slope were defined (0–8%, 8–30% and >30%) to characterize the variety of the surface, and a threshold level of 10% was established to simplify model processing and remove minor slopes, soils and land used for each sub-watershed. Finally, LRB has been divided into 11 sub-basins and 124 HRUs and HSRB into 3 sub-basins and 21 HRUs.

2.2.2. Sensitivity Analysis, Calibration and Validation

Sensitivity analysis and calibration of parameters of the SWAT model were carried out automatically in SWAT-CUP using the SUFI-2 algorithm [39]. Sensitivity analysis allowed us to calculate the rate of change in model output with respect to changes in model parameters [40] and thus we were able to identify the most influential parameters in governing streamflow [41]. The parameters were calibrated using the observed daily discharge; the process consists in adjusting them so that the daily simulations are as close as possible to the observations. Firstly, we performed 500 model runs to obtain the sensitivities, and the most sensitive parameters were identified for each basin. Afterwards, two iterations of 1500 simulations were run as recommended by Yang et al., (2008) [42], readjusting the parameters after the second iteration. The input data series were divided into three phases: warm-up, calibration and validation. In the LRB, the period from 1971 to 1989 was chosen for model calibration, preceded by a five-year warming period (1966–1970). After calibration, the model was validated using daily streamflow from 1990 to 2007. For HSRB, the periods of 1987–1997 and 1998–2007 were used for model calibration and validations, respectively, also preceded by a five-year warm-up.

2.3. Artificial Neural Network

An ANN is a computing method with a mathematical structure which mimics the human brain and nervous system. This network learns, memorizes and discloses the various relations found in the data. It is capable of modelling complex nonlinear input/output time-series relationships of a watershed without prior and explicit knowledge of the physical characteristics of that process [17,18]. ANNs are composed of neurons or processing units which are organized in layers and connected through several links. There are many different architectures of ANNs: single-layer and multilayer networks according to the number of layers and feed-forward, recurrent and self-organizing networks according to the direction of information flow and processing. In this work, we have used the multilayer feed-forward networks, which are the most widely applied to simulate hydrological processes (e.g., [1,9,10,18]) and consist of a number of neurons organized in an input layer, one or more hidden layers and an output layer [20]. The input layer includes neurons where input data are fed into the network. In the hidden layers, the neurons receive signals only from neurons in the previous layer and process data. Finally, the outputs are produced for the given inputs in the output layer. The nodes are connected to nodes in the neighbouring layers by weighted synaptic connections; each link has an associated weight that represents its connection strength. These weights store the knowledge of the network, that is, they parameterize the mathematical relationships between the variable inputs of the network; positive weight values reflect excitatory connections, negative values mean inhibition connections, whereas the zero weights make the connection considered non-existent. The scheme of operation of these networks is as follows: (i) The information is processed in the neurons, each neuron receives an array of inputs or signals; (ii) these signals pass between neurons through connection links; (iii) each neuron forms a linear combination of the signals’ inputs according to its weights and then passes through an activation function to produce an output signal [43]. The mathematical operation of a neuron is given as Equation (2):
y j   =   f   ( i = 1 n x i · w i     b j )
where y is the output of a neuron j, f is an activation function, xi is an input of the vector of inputs (i = 1, 2, …, n), wi is the weight associated with the connection link through which the input xi arrives to current neuron j from a neuron in the preceding layer and bj is a bias associated with neuron j. The activation function is usually a continuous and bounded nonlinear transfer function and controls the amplitude of the output neuron. The logistic sigmoid and hyperbolic tangent functions are the most commonly used in the hidden layers with a range of output from 0 to 1 and from −1 to 1, respectively [5], while a linear activation function may be used in the output layer so that a limited output interval has not been generated. The training process involves giving known input data and targets to the network and adjusting internal parameters (weight and biases) based on the performance measure and other parameters.

The ANN Modelling Approach

According to Govindaraju (2000) [43], there is no fixed method for determining the number of input-output data that will be required. An optimal data set should be representative of the probable occurrence of an input vector and should facilitate the mapping of the underlying nonlinear process. Inclusion of unnecessary patterns could slow network learning. In contrast, an insufficient data set could lead to poor learning. A typical ANN training requires three data sets: training, validation and testing [21]. In this work, the calibration data sets (1971 to 1989 in LRB, and 1987 to 1997 in HSRB) were divided into training sets (70% of data), validation data sets (15% of data) and testing data sets (15% of data). We have used a backpropagation algorithm to train, in which the result of the network (output of ANN model) is compared to the actual target (observed data), and then the network error is calculated. The output errors are repeatedly propagated backwards through the network to adjust its parameters until optimal values are obtained [1]. The training was finished when the error on the validation data sets was near minimum. There are several backpropagation algorithms to network training. The superiority of the Levenberg-Marquardt (LM) algorithm [44,45] over other algorithms for better performance (lower estimated error) and higher convergence speed (when determining epoch size) was clearly established in several studies (e.g., [46,47]). LM is often the fastest backpropagation algorithm. Studies about streamflow forecasting [47,48] have shown that the LM algorithm has an appropriate operation in training this type of network. Therefore, LM algorithm has been used to reduce the mean squared error (MSE) (Equation (3)) iteratively in this study:
MSE   =   i = 1 n ( O i E i ) 2 n
where Oi is the ANN target (observation), Ei is the ANN output (simulated value) and n is the total number of observations. For use in finding optimal neural weights by backpropagation algorithms based on a least-squared approach such as MSE, it is required that the transfer function be easily differentiable, thus permitting the evaluation of increments of weights via the chain rule for partial derivatives [49]. According to Dawson and Wilby (2001) [50], the logistic sigmoid is continuous and relatively easy to compute (as is its derivative). Thus, we used a feed-forward neural network with LM back-propagation learning and sigmoid transfer function, which is one of the best selections for modeling hydrologic parameters [10].
Different types and numbers of inputs were employed in the ANNs to estimate daily flow. Understanding the temporal relationships between climatic variables and streamflow is fundamental for ANN development. Many studies use time-series correlation analysis to determine the dependency between the observed streamflow and the antecedent climate variables [1,18,20]. In an attempt to check any overfitting, a cross-validation was performed. We divided the data sets into five subsets: four subsets were used to train, and the remaining subset was used to validate.

2.4. Evaluation Criteria for Model Comparison

In the cross-validation of the ANNs, we obtained the average performance for the five cross-validation steps. The selected networks for each basin were the best performances in terms of Nash-Sutcliffe efficiency coefficient (NSE), percent bias (PBIAS) and root mean squared error (RMSE). The results were evaluated statistically using the statistics defined in Table 2. We have evaluated and compared SWAT and ANN results based on four statistics including NSE, PBIAS, RMSE and coefficient of determination (R2), which are the most widely used in hydrology studies. These statistics are defined in Table 2.
NSE indicates how well the plot of observed versus simulated data fits the 1:1 line and is recommended because it is very commonly used, which provides extensive information on reported values [51]. R2 describe the degree of collinearity between simulated and measured data. PBIAS measures the average tendency of the simulated data to be larger or smaller than their observed counterparts and has the ability to clearly indicate poor model performance [52]. RMSE quantifies the prediction error in terms of the units of the variable calculated by the model. The best performance for NSE and R2 is 1, and for PBIAS and RMSE the best performance is 0. In addition, to evaluate models we have used the criteria proposed by Kalin et al., (2010) [53], who adapted the monthly criteria of Moriasi et al., (2007) [51] to a daily scale (Table 3). In this case, the study is an exploratory analysis of the power of SWAT and ANN models for daily simulation of runoff, and this is an additional reason to relax the performance ratings according to the American Society of Agricultural and Biological Engineers (ASABE, 2017) [54].
The results were also evaluated graphically using scatter plots. In addition to these goodness-of-fit measures, we analysed the results based on the flow duration curves to help visualize graphically the differences between observed and estimated streamflow. Pfannerstill et al., (2014) [2] presented an approach to improve the models’ evaluation by subdividing the flow duration curve into different segments. Their results showed that the segmentation of very low/high and low/high flow allows analysis of the model performance for every important discharge event precisely. In addition, they concluded that the additional segmentation of the flow duration curve into low and very low flows is essential for taking into account long low flow periods events. In this study, to assess different phases of the hydrograph, FDCs were divided into five segments as shown in Table 4 according to Pfannerstill et al., (2014) [2], where Qp represents the flow with a probability of exceedance equal to p%. The RMSE, defined in Table 2, was used to compare the performance of models for each hydrograph phase.

3. Results and Discussion

3.1. Sensitive Analysis, Calibration and Validation of the SWAT Model

A global sensitivity analysis was conducted to identify the most important influence parameters for streamflow simulation, which were adjusted during calibration. A ranking of parameter sensitivities was obtained after 500 model runs. The effect of the parameters on the simulated streamflow was evaluated with p-value which determines the significance of the sensitivity and t-stat which provide a measure of sensitivity. The ranking of most sensitive parameters observed in this study (Table 5) was also supported by the findings of Raposo et al., (2013) [55] in the LRB and Senent-Aparicio et al., (2017) [26] in the HSRB. Some of the most sensitive parameters are common for both basins with a similar order of sensitivity, as for example ALPHA_BF, CH_N1, CH_N2, SOL_K, CN2 and GWQMN.
After performing a global sensitivity analysis, the most sensitive parameters were selected for each studied basin, which are shown and defined in Table 6. All the selected parameters were also selected as the most relevant in other research [23,26,41,55].
The fitted values of these parameters reflect the contrasting climatic characteristics of the two basins. In HSRB, groundwater parameters (GWQMN, GW_DELAY, RCHRG_DP, ALPHA_BF and GW_REVAP) were significant, as expected in Mediterranean basins where the aquifers are relevant [41,56]. A high deep aquifer percolation fraction (RCHRG_DP) and very low delay time (GW_DELAY) for aquifer recharge reflect the highly permeable geology of HSRB. In contrast, no relevant aquifer is present in LRB, where RCHRG_DP was very low. In both basins, the low values of ALPHA_BF indicate a slow response [57]. The low value of CH_K1 in LRB indicated a moderate loss rate for soil with high silt-clay content, while a high value in HSRB reflected a very high loss rate for very clean gravel and large sand [57]. Another big difference between the two basins is the soil evaporation compensation factor (ESCO). The ESCO was higher in the LRB, with an Atlantic climate, than in the HSRB, with a Mediterranean climate where evapotranspiration has a higher relevance [26]. When the ESCO value decreases, the ability of the model to extract the evaporative demand from lower soil layers increases [58]. Lateral flow travel time (LAT_TTIME) in the LRB was very similar to that used by Raposo et al., (2013) [55] in nearby basins where a significant portion of groundwater flows laterally as interflow [59]. The value of GWQMN was calibrated as 82.5 in LRB similar to that obtained in a nearby study [55]. Besides, an automated digital filter programme (Base Flow Filter Program) [60] was applied to determine the groundwater ratio. The results obtained are similar to those simulated by our model.

3.2. Input Selection, Training and Validation of ANN Models

Determining the input variables has a significant influence on the simulated flow. The basin rainfall and temperature data used by the ANNs were calculated using the Thiessen method, in which the climate values were based on a weighted average of the contribution of the cell in the area. After reviewing other research [22,23,48], we have selected the following variables as inputs to the ANN models to estimate daily streamflow: daily precipitation (Pt), daily temperature (Tt), precipitation of the previous n days (Ptn), total rainfall of the preceding n days (Rn) and mean temperature over the previous n days (Tm
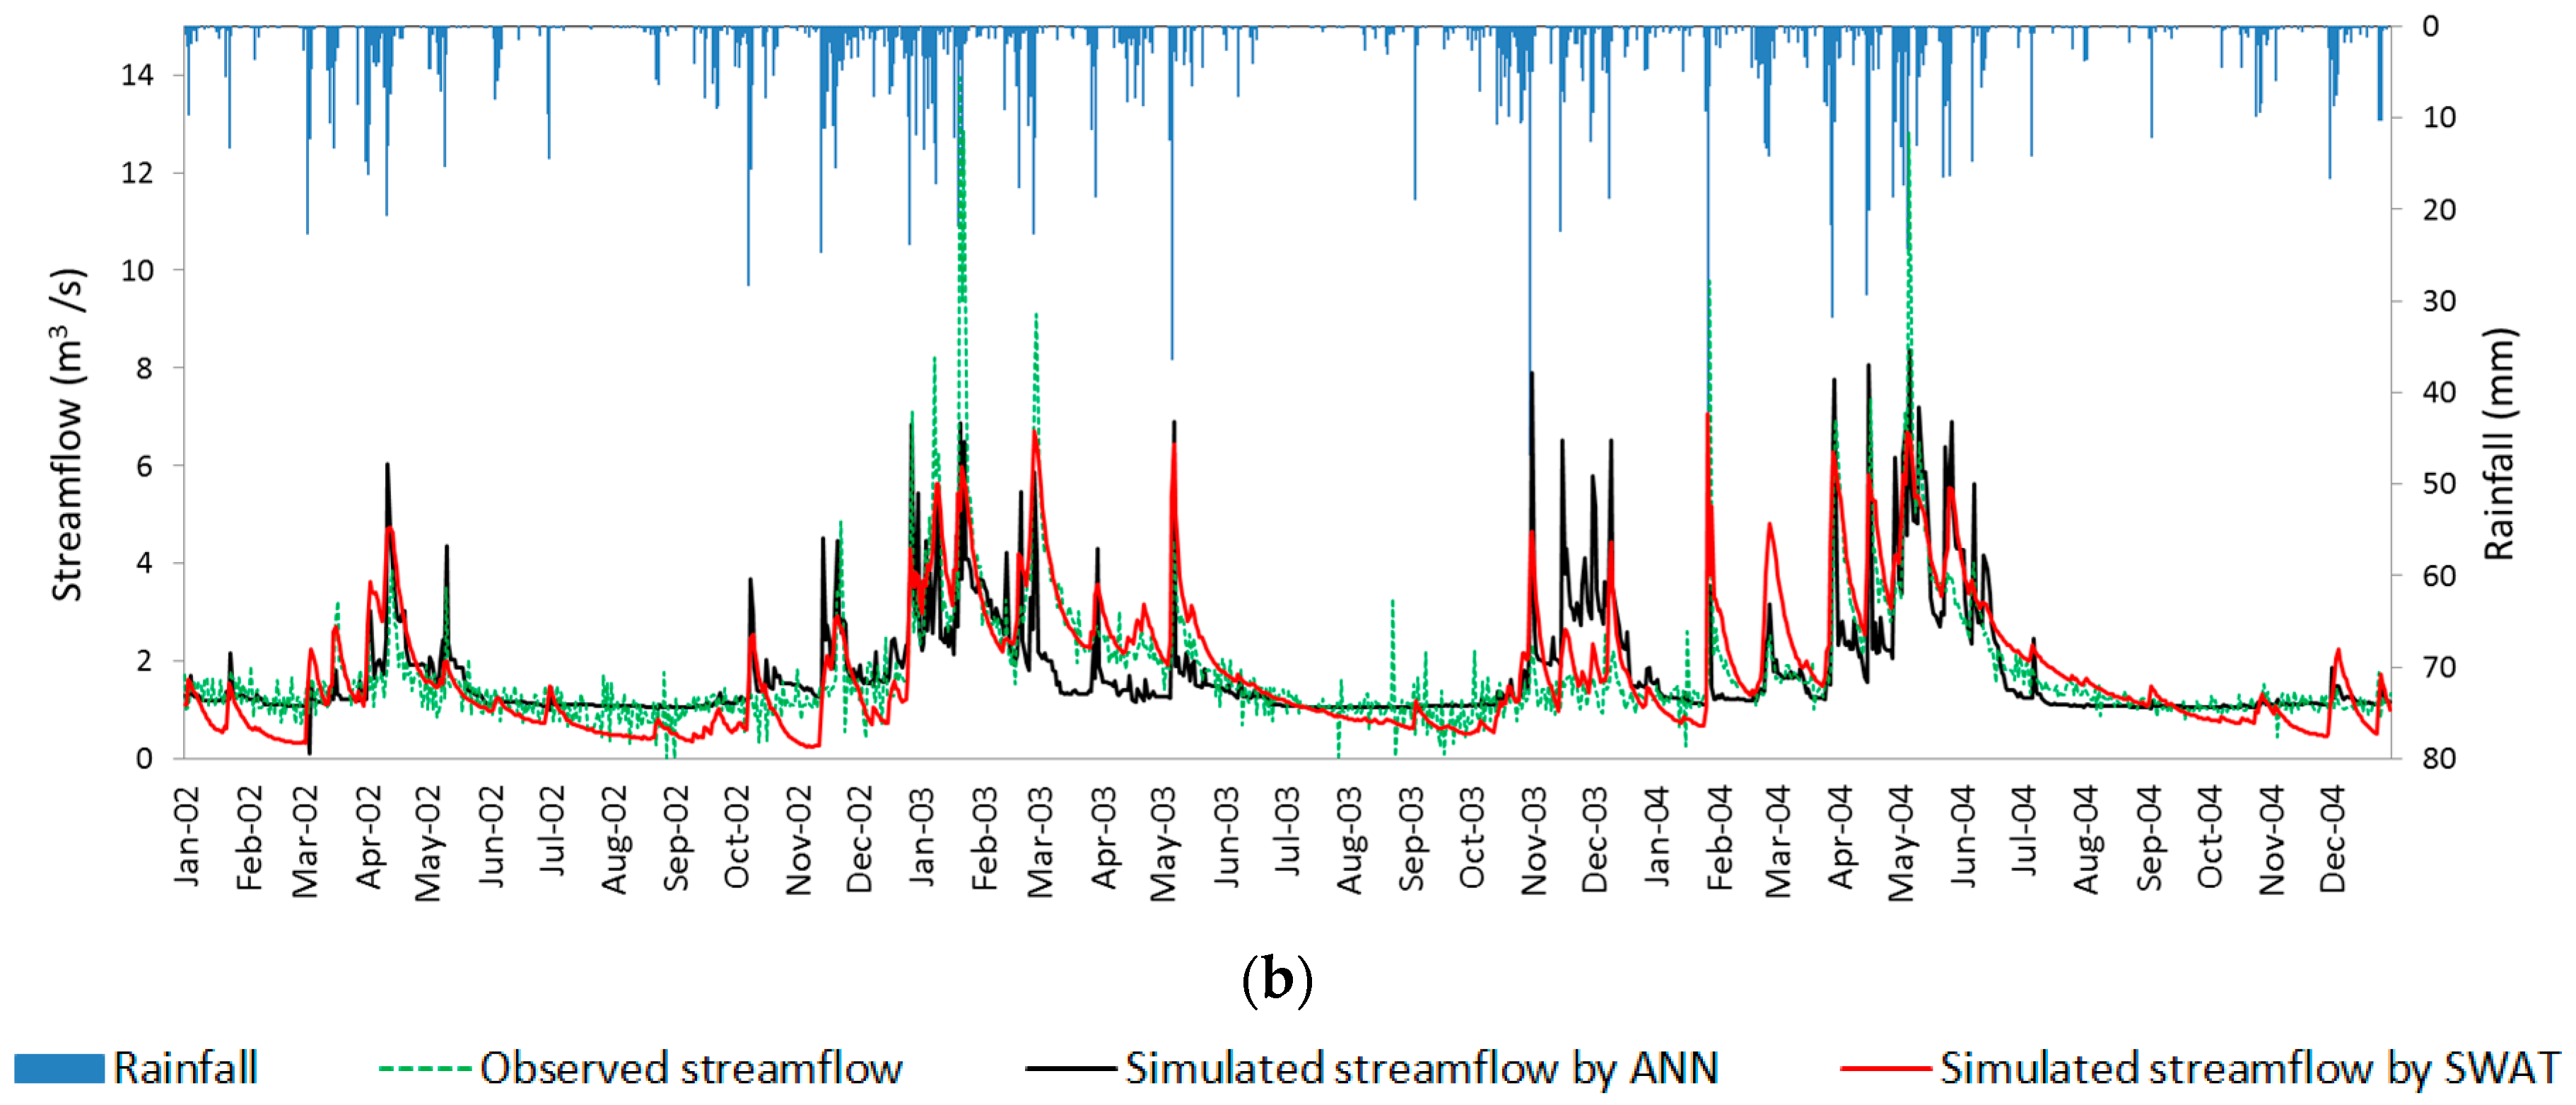
n). In this study, the most suitable delays of climate variables were determined using cross-correlation analyses, so we determined the temporal relationships between these input variables and streamflow. As shown in Figure 2a, the streamflow is highly positively correlated with daily precipitation of the current day t (Pt) and with daily precipitation of the previous days, until t-4 for LRB and until t-2 in HSRB.
Streamflow is strongly correlated with accumulated daily rainfall; there is a greater correlation for 4 days in LRB and for 48 days in HSRB, reflecting the little and the great importance of groundwater, respectively, in these basins. With respect to the daily temperature, there are moderate negative correlations with the daily streamflow in both basins. Finally, a total of four input combinations have been proposed for each basin in this study (Table 7).
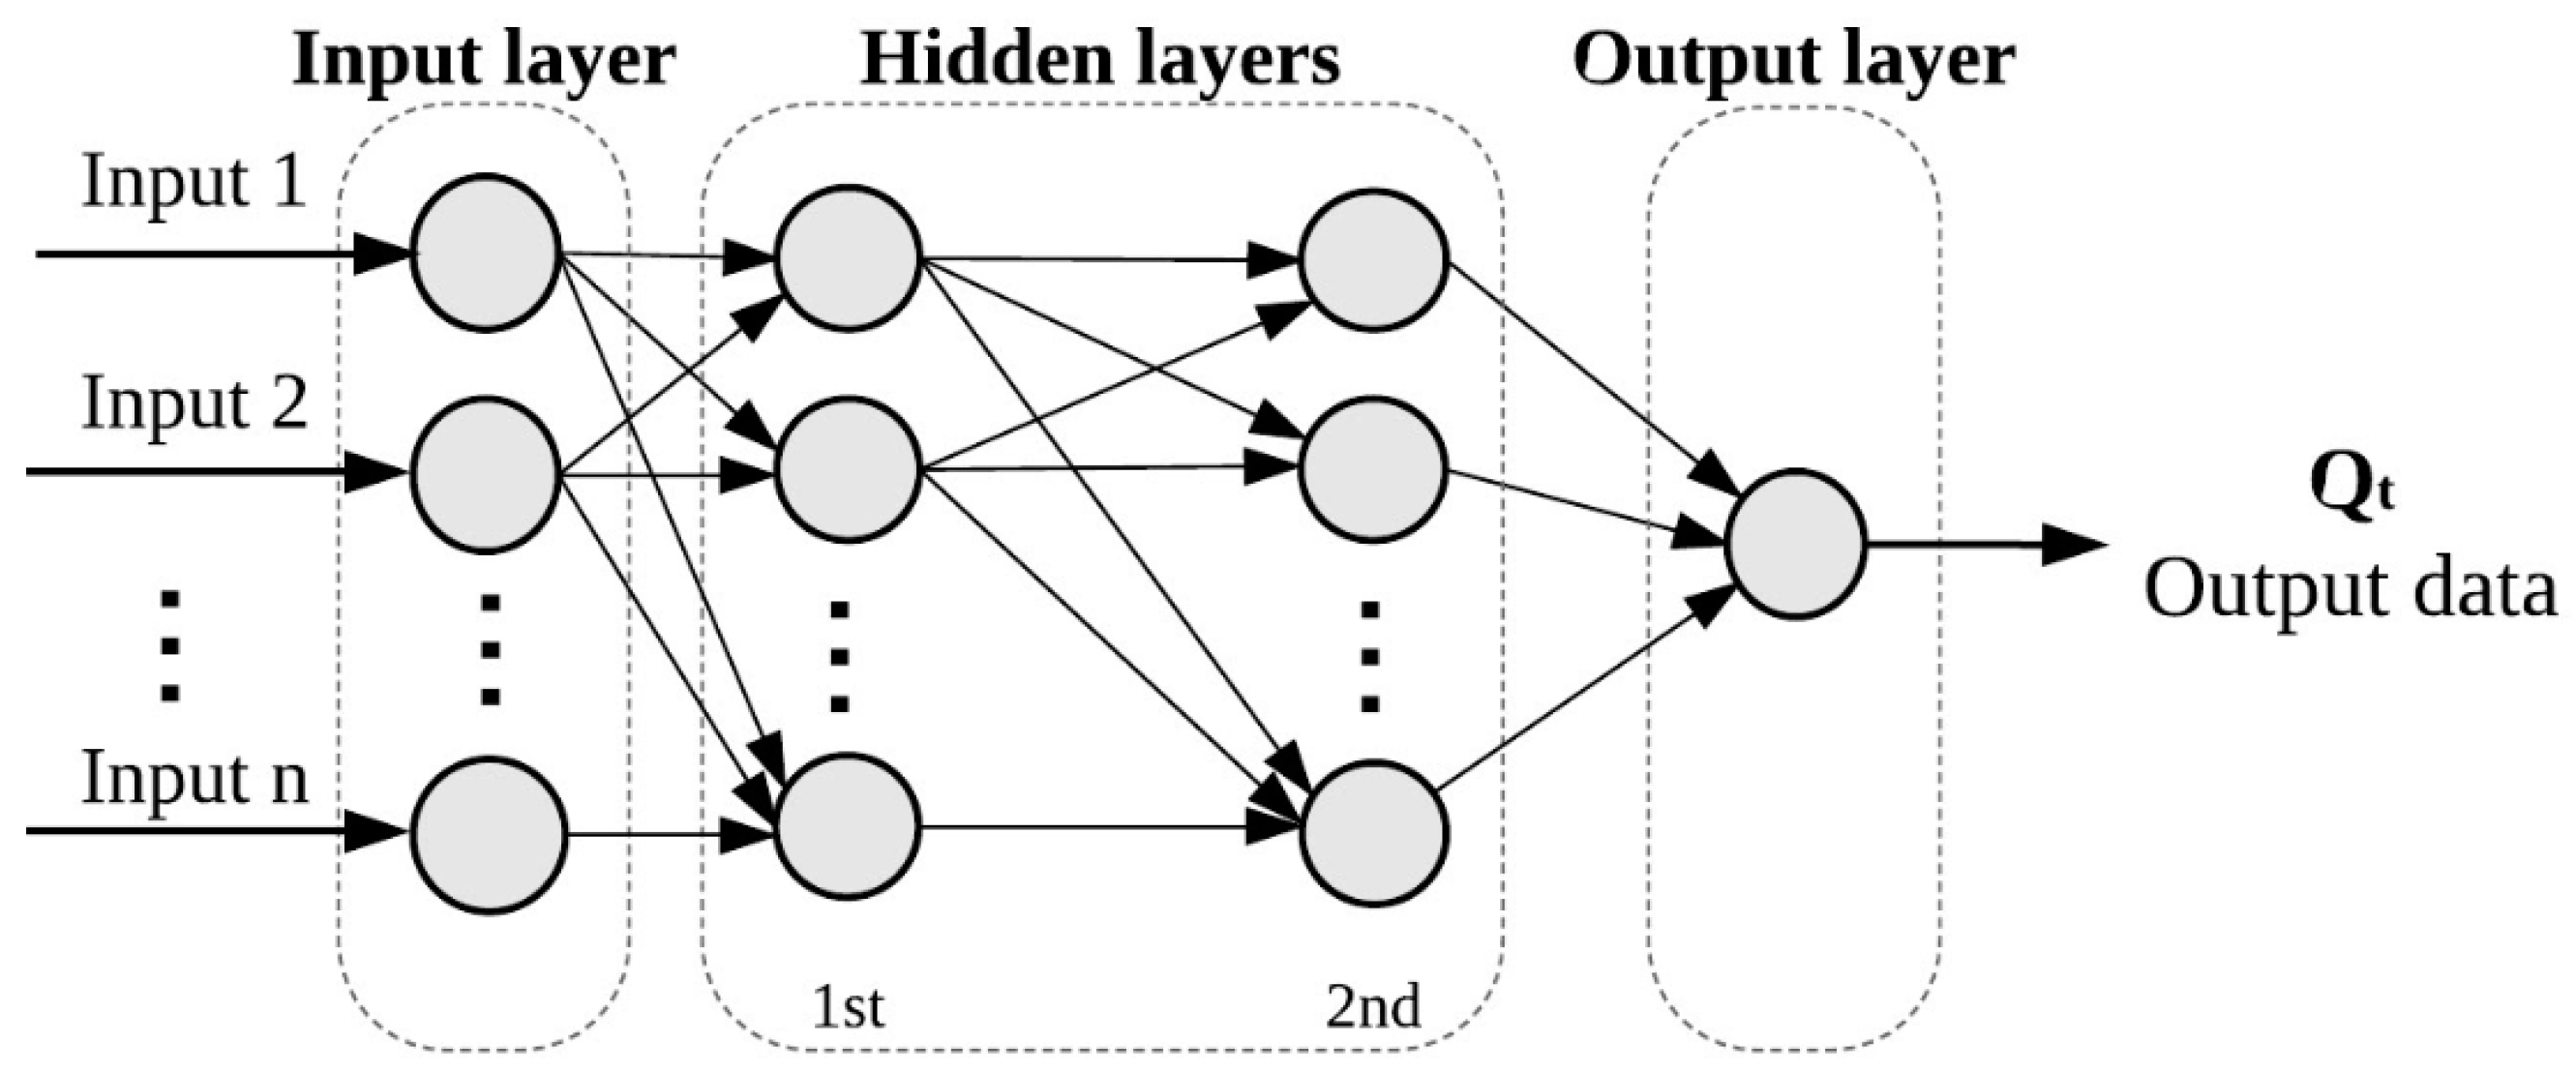
For the network structure identification, we implemented and built the ANNs using MATLAB® software (version 8.2.0.701 (R2013b), The Mathworks, Natick, MA, USA). A multilayer feed-forward network was used. The number of hidden layers and hidden neurons was established by trial-and-error procedure; one or two hidden layers with a number of neurons between two and ten are considered. The number of neurons in the input layer depends on the number of input variables in each scenario, which varies from 3 to 7. Figure 3 shows the ANN structure used in this work.
The different scenarios defined in Table 7 were tested for determining the type and number of inputs to ANN models. Table 8 shows the best architecture of ANN and their performances for each scenario trained and validated for the studied basins. These performance measures values are averages obtained over the five rounds of cross-validation.
The results shown in Table 8 indicate four effective ANN structures with good performances for LRB. Scenario 1 for LRB with a combination of six cells in the input layer (the precipitation of days t, t-1, t-2, t-3 and t-4, and the temperature of day t), one hidden layer with two neurons and one neuron in the output layer (the streamflow of day t) had the highest NSE and the lowest RMSE in the training and validation phase. Based on the criteria of Table 3, NSE and PBIAS of scenario 1 were good and very good, respectively. Therefore, scenario 1 was the selected architecture for LRB. However, the performance levels of ANN models for HSRB were lower in general because modelling the hydrological response of arid and semi-arid regions, where evapotranspiration rates are high and precipitation is irregular and/or limited, is especially complex [61]. The selected model for HSRB was scenario 3 where NSE and RMSE were better than those obtained in other proposed scenarios. In this scenario, NSE was classified as satisfactory and PBIAS as very good. The rest of the scenarios were classified as unsatisfactory based on NSE. Therefore, the ANN configuration selected for HSRB was three cells in the input layer (the precipitation of days t and t-1, and total rainfall of the preceding 48 days), one hidden layer with four neurons and one neuron in the output layer (the streamflow of day t). In conclusion, the structure selected for both basins was formed by three layers, similar to other studies (e.g., [1,23]).

3.3. Comparison of Model Performance

Calibration of SWAT models and training of the selected ANNs (scenario 1 for LRB and scenario 3 for HSRB) were done using the training data sets (1971–1989 for LRB and 1987–1997 for HSRB). Then, we tested the models with the validation sets (1990–2007 for LRB and 1998–2007 for HSRB). A comparison of flow estimation performance of the SWAT and ANN for LRB and HSRB is provided in Table 9, which shows separately the performances for the calibration/training and validation periods.
The values of NSE for both models were classified as good according to the criteria listed in Table 3 for the calibration/training phase in LRB and HSRB. For the validation phase, the NSE values ranged between 0.5 and 0.7, and therefore, they were classified as good for both models of the LRB. The NSE values were classified as satisfactory for both models of the HSRB. The PBIAS values were less than 25%, so they were classified as very good in all cases. The values of RMSE for both models were similar. The NSE and R2 values obtained by the ANN model were higher than those obtained in SWAT in both basins, and those during training were higher than those during validation phases. After analysing these results, it was concluded that both SWAT and ANN were suitable. The more arid the catchment, the lower the performances obtained in the hydrological models, which is similar to the experience reported by Pérez-Sánchez et al., (2017) [61].
For a better understanding of the difference between the models, Figure 4 shows the results of SWAT and ANN models plotted against the observed values of streamflow for the calibration/training and validation periods with their correlation coefficients.
SWAT models had a poor performance in estimating the large values of streamflow, whereas ANN models were worse in estimating the small values. In every figure of Figure 4, the points which are related to streamflow with large values are positioned at a greater distance to the 1:1 line when the values have been estimated by SWAT. In contrast, the points related to the estimated streamflow by ANN models are farther from the 1:1 line when it comes to the estimation of small values.
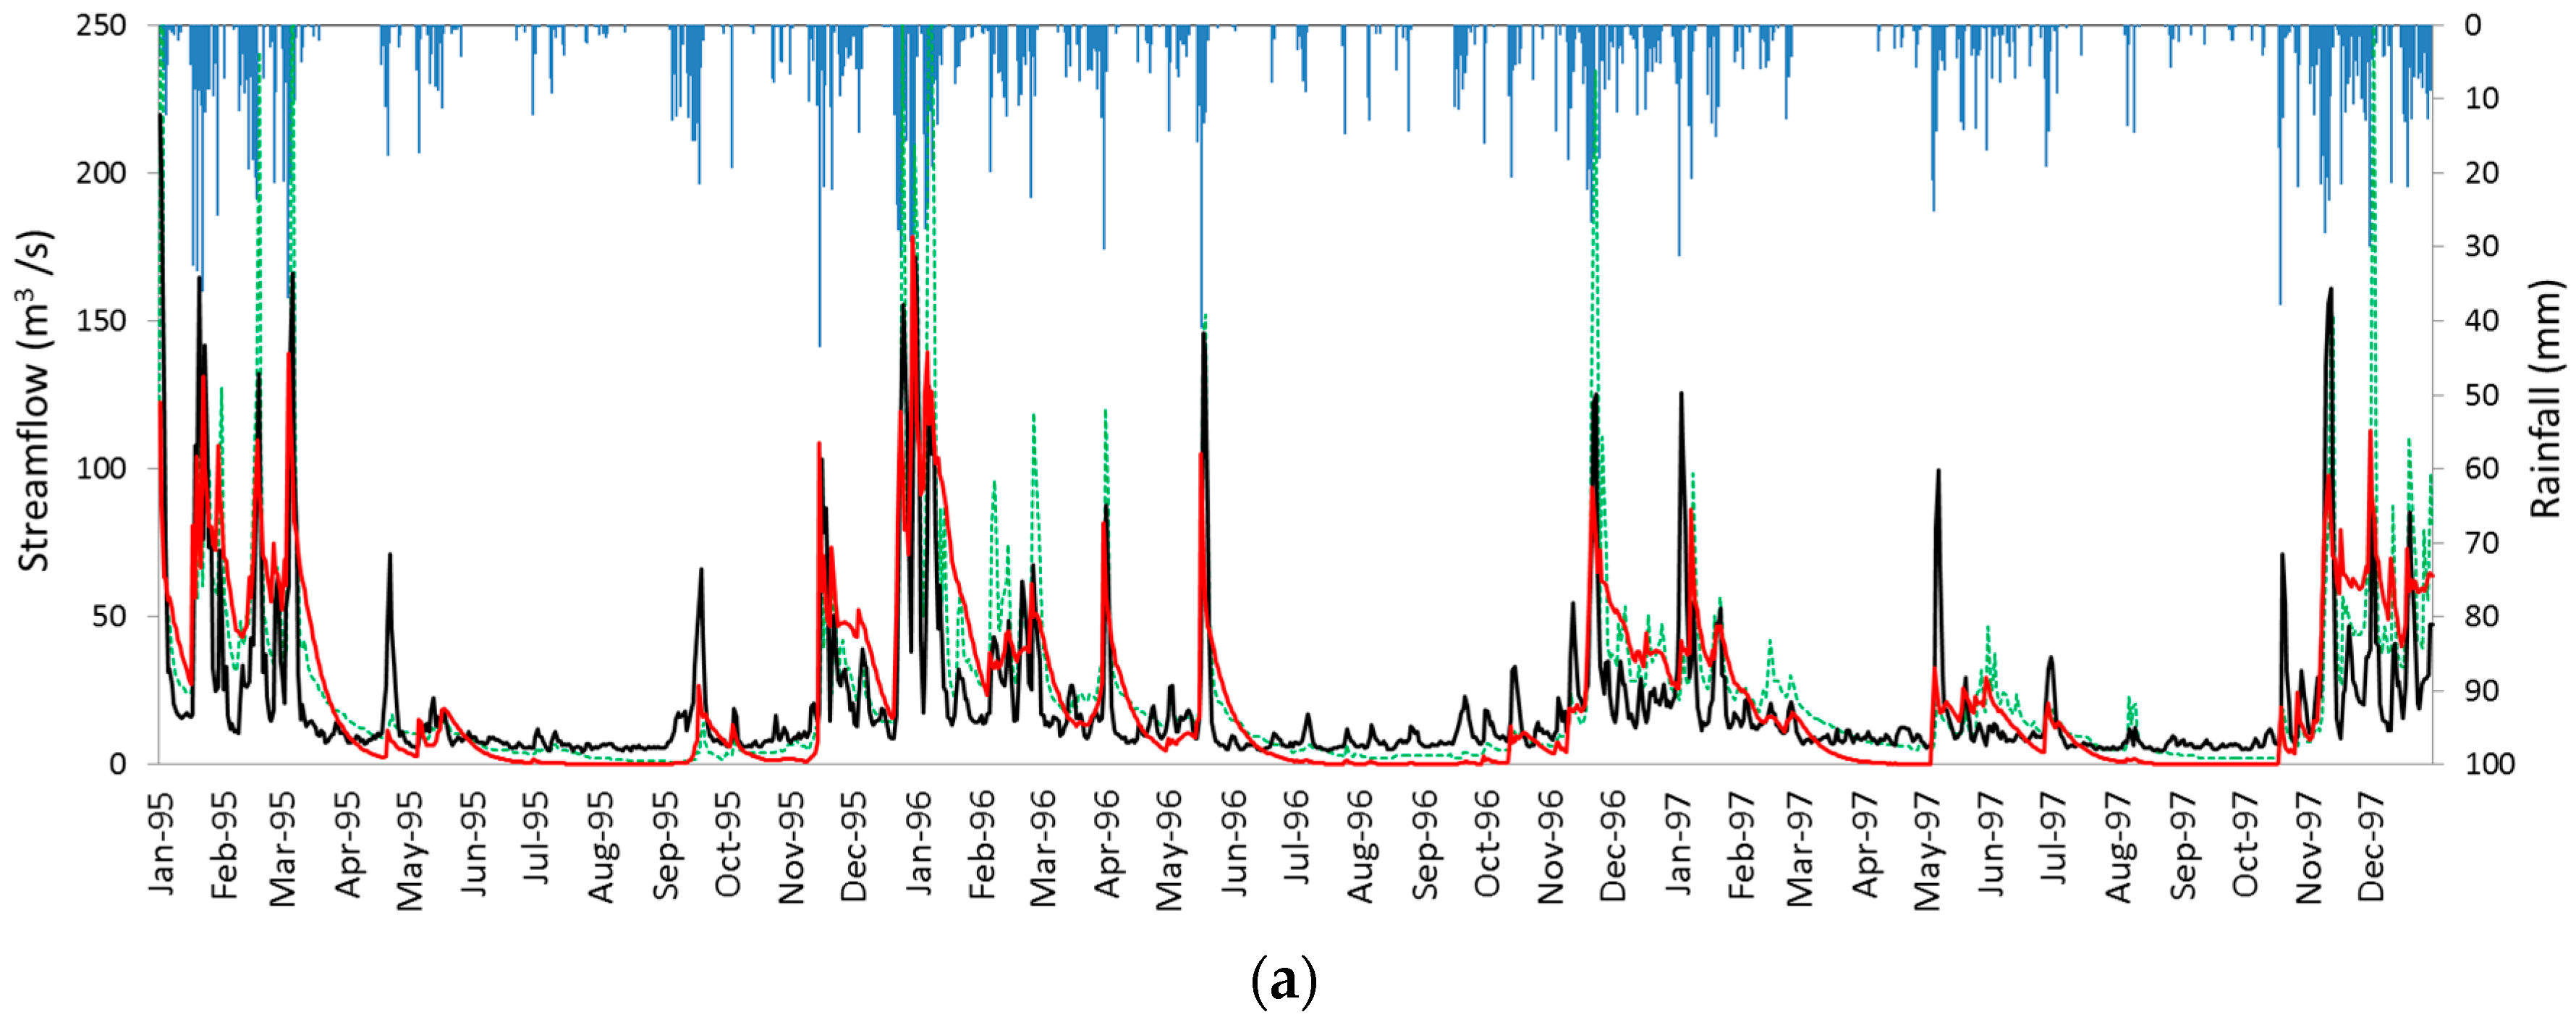
The hydrographs (Figure 5) show the fit obtained for simulated versus measured streamflow in the studied basins during the validation period (from 1995 to 1997 for the LRB and from 2002 to 2004 for the HSRB). The models generally reproduce the streamflow fairly well. Although both models tended to underestimate the peak-flow events during the validation phase, ANN models were more sensitive to precipitation events than SWAT models, and their estimations always remain above those obtained by SWAT.
According to Chen and Chau (2016) [
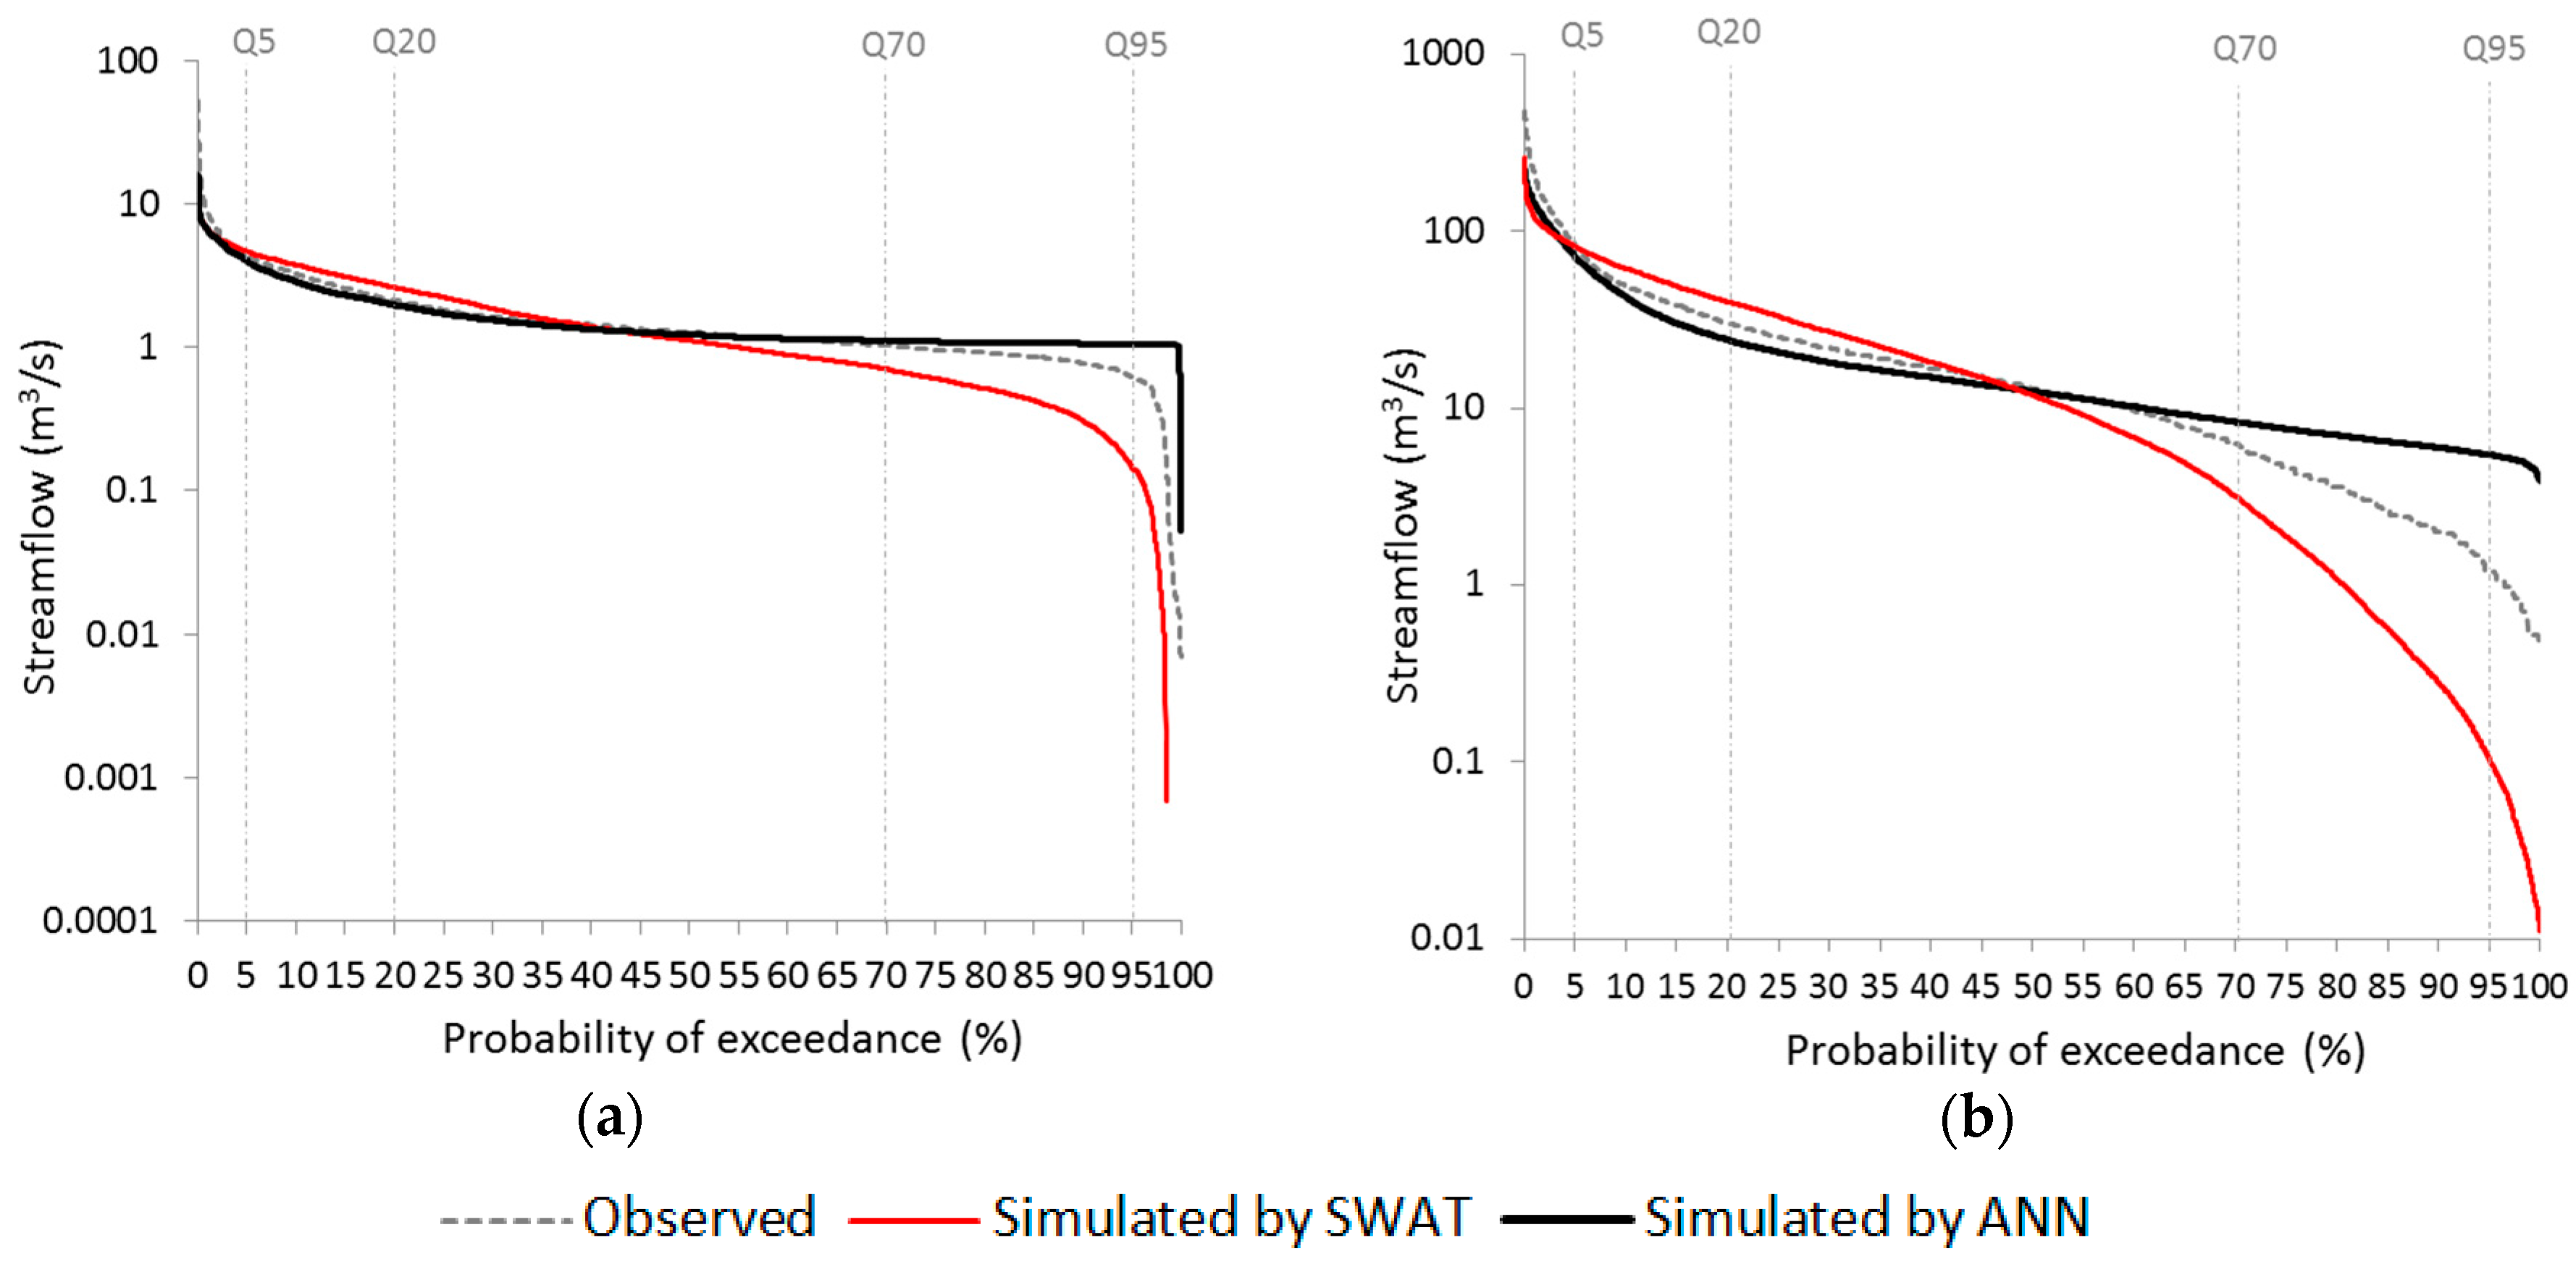
11], NSE and RMSE scale the mean squared error of estimation models, therefore they particularly reflect the performance on high values. Thus, the above discussions on evaluation criteria and plots of estimated data could not provide explicit performances on different intervals of values. To address this problem, different ranges of flow (from very high to very low flow) were determined. The reproduction of the streamflow was analysed by the FDC of LRB and HSRB for the validation periods (Figure 6). The FDC for LRB shows that the ANN performed generally better in the very high flow segment and SWAT was better in the very low flow segment. The values obtained by SWAT and by ANN were graphically similar for the rest of the flow segments in LRB. For HSRB, SWAT was better only in the very low flows.
An analysis of performance based on RMSE in each hydrograph phase was also done, as reflected in Table 10. The best results for each basin are highlighted in bold. As it was expected, high peaks are better simulated at the expense of low flows due to the fact that RMSE is biased towards high values. The RMSE values suggest that the SWAT model was better in the estimation of very low flows and ANN in the estimation of very high flows in all cases.
Similar results regarding peak-flow inefficiency of SWAT have been obtained in other studies (e.g., [5,22,23]), which suggested that peak-flow inefficiency could be caused by the formulation. The results obtained show that use of ANN models can help reduce the error in the estimation of high streamflow values, although these were also underestimated. One of the reasons is that the data of high values are scarce in the training data sets, the medium and low values being more numerous as illustrated in the cloud of points in the scatterplots in Figure 4. This problem in the application of neural network has also been reported in the works of Minns and Hall (1996) [15] and Talebizadeh et al., (2010) [62]. On the other hand, SWAT models simulated the estimation of the low flow values better than ANNs. In general, ANN models tended to overestimate the low values of streamflow. This inability can be attributed to complex non-linear relationships governing the process of low flow, often related to the base flow from groundwater. The performance of the ANN could be deteriorated with the increase in non-linearity [15]. It is generally accepted that the processes of streamflow generation are likely to be quite different during low, medium, and high flow periods. The base flow mainly contributes to low flow events whereas intense storm rainfall gives rise to high flow events [63]. Therefore, a single global ANN model could not predict the high and low runoff events satisfactorily [15]. SWAT models may obtain satisfactory results for the estimation of low flows but could not simulate very high streamflow with the same accuracy. In contrast to SWAT, a single ANN can obtain better results for very high values but not for the lowest values; these results are similar to those obtained by Kim et al., (2015) [23]. Therefore, the use of these models is suitable for simulating the streamflow in a basin. In the case of studies of extreme hydrologic events (e.g., floods), it is recommended to use an ANN model to simulate high-flow events. Otherwise, in studies of hydrological management in which low-flow events are more interesting, applying the SWAT model would be more desirable. In addition, it is important to take into account the disadvantages of each model. In Spain, it is relatively easier to obtain the input data, such as the streamflow and precipitation data, for the ANN model through the governmental online resources compared to data regarding the physical characteristics of river basins, such as soil moisture, infiltration, soil classes, groundwater level and evaporation, for the SWAT model. In addition, the time consumed in the setup and calibration of SWAT is higher than that consumed in the implementation of an ANN model. However, an ANN is a black box, and the water balance and its components are not obtained. The use of precipitation and temperature as the only inputs of the models is, on the other hand, a limitation of the ANN models used because the rainfall-runoff relation is impacted by different physical parameters too. The non-consideration of land use or land management in the ANN model makes the SWAT model more advantageous if a number of scenarios are to be made to investigate the response of the basin [1].
The results of this study suggest, however, that the ANN approach is very efficient to simulate a hydrological process because it requires very few input variables and minimal resources to implement and therefore, it is sufficiently promising to the development of other approaches such as the simulation of water quality process, as it is reflected in some studies (e.g., [64,65,66]).

4. Conclusions

We proposed the use of SWAT, a semi-physically based model, and ANN, a machine learning technique, to simulate the daily streamflow values and compare the results of both models in order to analyse their capabilities. They were applied in two basins with contrasting climates to check the validity of these models in basins with different climatic conditions. For determining the type and number of inputs for ANN models, four scenarios were considered in each studied basin, and they showed that the inclusion of daily precipitation, precipitation of previous days and total rainfall in the previous days was important to estimate the daily streamflow. After calibrating SWAT models for daily observed streamflow through the SUFI-2 algorithm, results indicated that SWAT has a better performance in estimating very low values of streamflow, whereas ANN estimated very high values with greater precision in all cases studied. Moreover, the results suggest that SWAT and ANN models were better when the climate was more humid. When the basin has more arid weather and, therefore, it is more complicated to model, ANN obtained better performance in more hydrograph phases. One of the advantages of the ANN model is that it does not require any physical characteristics of the watershed and, therefore, its implementation is easier. Nevertheless, in reverse, the totally implicit and physically meaningless features are also the major criticisms. It is still necessary to develop estimation models with conceptual ideas to reflect the characteristics of streamflow. ANN is a black box, and to gain knowledge about the water balance and its components, the SWAT model is more useful. Despite the advantages and disadvantages of each model, the results suggest that to simulate values of streamflow time-series, the choice between the SWAT or ANN has an impact on the accuracy of estimated flow. This idea for modelling streamflow can be extended to other machine learning techniques, which we could explore in future works. In addition, the ANN model only considers the inputs of precipitation and temperature. The influences of other inputs related to the streamflow can be explored additionally to improve the current study.

Acknowledgments

The first author was supported by the Catholic University of Murcia (UCAM) research scholarship program. This work has been partially supported by GESINHIMPADAPT project (CGL2013-48424-C2-2-R). We acknowledge Papercheck Proofreading & Editing Services.

Author Contributions

All authors contributed significantly to the development of the methodology applied in this study. Patricia Jimeno-Sáez designed the experiments and wrote the manuscript. Julio Pérez-Sánchez and Javier Senent-Aparicio helped to perform the experiments and reviewed and helped to prepare this paper for publication. David Pulido-Velázquez as the supervisor of Patricia Jimeno-Sáez provided many important advices on the concept of methodology and structure of the manuscript.

Conflicts of Interest

The authors declare no conflict of interest.

References

  1. Amirhossien, F.; Alireza, F.; Kazem, J.; Mohammadbagher, S. A comparison of ANN and HSPF models for runoff simulation in Balkhichai river watershed, Iran. Am. J. Clim. Chang. 2015, 4, 203–216. [Google Scholar] [CrossRef]
  2. Pfannerstill, M.; Björn, G.; Fohrer, N. Smart Low Flow Signature Metrics for an Improved Overall Performance Evaluation of Hydrological Models. J. Hydrol. 2014, 510, 447–458. [Google Scholar] [CrossRef]
  3. Madsen, H. Automatic calibration of a conceptual rainfall–runoff model using multiple objectives. J. Hydrol. 2000, 235, 276–288. [Google Scholar] [CrossRef]
  4. Noori, N.; Kalin, L. Coupling SWAT and ANN models for enhanced daily stream flow Prediction. J. Hydrol. 2016, 533, 141–151. [Google Scholar] [CrossRef]
  5. Makwana, J.J.; Tiwari, M.K. Hydrological stream flow modelling using soil and water assessment tool (SWAT) and neural networks (NNs) for the Limkheda watershed, Gujarat, India. Model. Earth Syst. Environ. 2017, 3, 635–645. [Google Scholar] [CrossRef]
  6. Arnold, J.G.; Srinivasan, R.; Muttiah, R.S.; Williams, J.R. Large area hydrologic modeling and assessment part I: Model development. J. Am. Water Resour. Assoc. 1998, 34, 73–89. [Google Scholar] [CrossRef]
  7. Grusson, Y.; Anctil, F.; Sauvage, S.; Sánchez Pérez, J.M. Testing the SWAT Model with Gridded Weather Data of Different Spatial Resolutions. Water 2017, 9, 54. [Google Scholar] [CrossRef]
  8. Abbaspour, K.C.; Rouholahnejad, E.; Vaghefi, S.; Srinivasan, R.; Yang, H.; Klove, B. A continental-scale hydrology and water quality model for Europe: Calibration and uncertainty of a high-resolution large-scale SWAT model. J. Hydrol. 2015, 524, 733–752. [Google Scholar] [CrossRef]
  9. Olyaie, E.; Banejad, H.; Chau, K.W.; Melesse, A.M. A comparison of various artificial intelligence approaches performance for estimating suspended sediment load of river systems: A case study in United States. Environ. Monit. Assess. 2015, 187, 189. [Google Scholar] [CrossRef] [PubMed]
  10. Gholami, V.; Chau, K.W.; Fadaee, F.; Torkaman, J.; Ghaffari, A. Modeling of groundwater level fluctuations using dendrochronology in alluvial aquifers. J. Hydrol. 2015, 529, 1060–1069. [Google Scholar] [CrossRef]
  11. Chen, X.Y.; Chau, K.W. A hybrid double feedforward neural network for suspended sediment load estimation. Water Resour. Manag. 2016, 30, 2179–2194. [Google Scholar] [CrossRef]
  12. Jimeno-Sáez, P.; Senent-Aparicio, J.; Pérez-Sánchez, J.; Pulido-Velazquez, D.; Cecilia, J.M. Estimation of Instantaneous Peak Flow Using Machine-Learning Models and Empirical Formula in Peninsular Spain. Water 2017, 9, 347. [Google Scholar] [CrossRef]
  13. Panu, U.S.; Khalil, M.; Elshorbagy, A. Streamflow data infilling techniques based on concepts of groups and neural networks. In Artificial Neural Networks in Hydrology; Govindaraju, R.S., Rao, A.R., Eds.; Water Science and Technology Library; Springer: Dordrecht, The Netherlands, 2000; Volume 36, pp. 235–258. ISBN 978-94-015-9341-0. [Google Scholar] [CrossRef]
  14. Elsholberg, A.; Simonovic, S.P.; Panu, U.S. Estimation of missing streamflow data using principles of chaos theory. J. Hydrol. 2002, 255, 123–133. [Google Scholar] [CrossRef]
  15. Minns, W.; Hall, M.J. Artificial neural networks as rainfall-runoff models. Hydrol. Sci. J. 1996, 41, 399–417. [Google Scholar] [CrossRef]
  16. Talebizadeh, M.; Moridnejad, A. Uncertainty analysis for the forecast of lake level fluctuations using ensembles of ANN and ANFIS models. Exp. Syst. Appl. 2011, 38, 4126–4135. [Google Scholar] [CrossRef]
  17. Singh, A.; Imtiyaz, M.; Isaac, R.K.; Denis, D.M. Comparison of soil and water assessment tool (SWAT) and multilayer perceptron (MLP) artificial neural network for predicting sediment yield in the Nagwa agricultural watershed in Jharkhand, India. Agric. Water Manag. 2012, 104, 113–120. [Google Scholar] [CrossRef]
  18. Shiau, J.T.; Hsu, H.T. Suitability of ANN-based daily streamflow extension models: a case study of Gaoping River basin, Taiwan. Water Resour. Manag. 2016, 30, 1499–1513. [Google Scholar] [CrossRef]
  19. Ng, W.W.; Panu, U.S.; Lennox, W.C. Comparative studies in problems of missing extreme daily streamflow records. J. Hydrol. Eng. 2009, 14, 91–100. [Google Scholar] [CrossRef]
  20. Wang, Y.; Guo, S.; Xiong, L.; Liu, P.; Liu, D. Daily Runoff Forecasting Model Based on ANN and Data Preprocessing Techniques. Water 2015, 7, 4144–4160. [Google Scholar] [CrossRef]
  21. Srivastava, P.; McNair, J.N.; Johnson, T.E. Comparison of process-based and artificial neural network approaches for streamflow modeling in an agricultural watershed. J. Am. Water Resour. Assoc. 2006, 42, 545–563. [Google Scholar] [CrossRef]
  22. Demirel, M.C.; Venancio, A.; Kahya, E. Flow forecast by SWAT model and ANN in Pracana basin, Portugal. Adv. Eng. Softw. 2009, 40, 467–473. [Google Scholar] [CrossRef]
  23. Kim, M.; Baek, S.; Ligaray, M.; Pyo, J.; Park, M.; Cho, K.H. Comparative studies of different imputation methods for recovering streamflow observation. Water 2015, 7, 6847–6860. [Google Scholar] [CrossRef]
  24. Coch, A.; Mediero, L. Trends in low flows in Spain in the period 1949–2009. Hydrol. Sci. J. 2016, 61, 568–584. [Google Scholar] [CrossRef]
  25. Instituto Geológico y Minero de España (IGME). Identificación y Caracterización de la Interrelación Que Se Presenta Entre Aguas Subterráneas, Cursos Fluviales, Descargas Por Manantiales, Zonas Húmedas y Otros Ecosistemas Naturales de Especial Interés Hídrico: 011 Miño-Sil. Memoria Técnica (In Spanish). Available online: http://info.igme.es/SidPDF/146000/839/146839_0000001.pdf (accessed on 7 September 2017).
  26. Senent-Aparicio, J.; Pérez-Sánchez, J.; Carrillo-García, J.; Soto, J. Using SWAT and Fuzzy TOPSIS to Assess the Impact of Climate Change in the Headwaters of the Segura River Basin (SE Spain). Water 2017, 9, 149. [Google Scholar] [CrossRef]
  27. Moral, F.; Cruz-Sanjulian, J.J.; Olias, M. Geochemical evolution of groundwater in the carbonate aquifers of Sierra de Segura (Betic Cordillera, southern Spain). J. Hydrol. 2008, 360, 281–296. [Google Scholar] [CrossRef]
  28. Belmar, O.; Velasco, J.; Martinez-Capel, F. Hydrological classification of natural flow regimes to support environmental flow assessments in intensively regulated Mediterranean rivers, Segura River Basin (Spain). Environ. Manag. 2011, 47, 992. [Google Scholar] [CrossRef] [PubMed]
  29. Centre for Public Works Studies and Experimentation (CEDEX). Anuario de Aforos (In Spanish). Available online: http://ceh-flumen64.cedex.es/anuarioaforos/default.asp (accessed on 20 August 2017).
  30. Confederation of the Segura River. Visor GIS Para Consulta y Descarga de Datos de Embalses. Available online: https://www.chsegura.es/chs/cuenca/redesdecontrol/estadisticashidrologicas/visorembalses/visorjs.html (accessed on 20 August 2017).
  31. Herrera, S.; Gutiérrez, J.M.; Ancell, R.; Pons, M.R.; Frías, M.D.; Fernández, J. Development and analysis of a 50-year high-resolution daily gridded precipitation dataset over Spain (Spain02). Int. J. Climatol. 2012, 32, 74–85. [Google Scholar] [CrossRef] [Green Version]
  32. Ciach, G.J. Local random errors in tipping-bucket rain gauge measurements. J. Atmos. Ocean. Technol. 2010, 20, 752–759. [Google Scholar] [CrossRef]
  33. National Geographic Institute of Spain. Available online: http://www.ign.es/web/ign/portal (accessed on 17 August 2017).
  34. Nachtergaele, F.; van Velthuizen, H.; Verelst, L.; Batjes, N.; Dijkshoorn, K.; van Engelen, V.; Fischer, G.; Jones, A.; Montanarella, L.; Petri, M. Harmonized World Soil Database; Food and Agriculture Organization of the United Nations: Rome, Italy, 2008. [Google Scholar]
  35. Corine Land Cover 2006. Seamless Vector Data—European Environment Agency. Available online: https://www.eea.europa.eu/data-and-maps/data/clc-2006-vector-4 (accessed on 20 June 2017).
  36. Hargreaves, G.H. Defining and using reference evapotranspiration. J. Irrig. Drain. Eng. 1994, 120, 1132–1139. [Google Scholar] [CrossRef]
  37. Schneider, K.; Ketzer, B.; Breuer, L.; Vaché, K.B.; Bernhofer, C.; Frede, H.G. Evaluation of evapotranspiration methods for model validation in a semi-arid watershed in northern China. Adv. Geosci. 2007, 11, 37–42. [Google Scholar] [CrossRef]
  38. Singh, V.; Bankar, N.; Salunkhe, S.S.; Bera, A.K.; Sharma, J.R. Hydrological stream flow modelling on Tungabhadra catchment: parameterization and uncertainty analysis using SWAT CUP. Curr. Sci. India 2013, 104, 1187–1199. [Google Scholar]
  39. Abbaspour, K.C.; Vejdani, M.; Haghighat, S. SWAT-CUP calibration and uncertainty programs for SWAT. In Proceedings of the Modsim 2007: International Congress on Modelling and Simulation, Christchurch, New Zealand, 3–8 December 2007; pp. 1603–1609. [Google Scholar]
  40. Arnold, J.G.; Moriasi, D.N.; Gassman, P.W.; Abbaspour, K.C.; White, M.J.; Srinvasan, R.; Santhi, C.; Harmel, R.D.; van Griensven, A.; van Liew, M.W.; et al. SWAT: Model use, calibration, and validation. Trans. ASABE 2012, 55, 1491–1508. [Google Scholar] [CrossRef]
  41. Molina-Navarro, E.; Martínez-Pérez, S.; Sastre-Merlín, A.; Bienes-Allas, R. Hydrologic modeling in a small mediterranean basin as a tool to assess the feasibility of a limno-reservoir. J. Environ. Qual. 2014, 43, 121–131. [Google Scholar] [CrossRef] [PubMed]
  42. Yang, J.; Reichert, P.; Abbaspour, K.C.; Xia, J.; Yang, H. Comparing uncertainty analysis techniques for a SWAT application to the Chaohe Basin in China. J. Hydrol. 2008, 358, 1–23. [Google Scholar] [CrossRef]
  43. Govindaraju, R.S. Artificial neural networks in hydrology. I: Preliminary concepts. J. Hydrol. Eng. 2000, 5, 115–123. [Google Scholar] [CrossRef]
  44. Levenberg, K. A Method for the Solution of Certain Problems in Least Squares. Appl. Math. 1944, 2, 164–168. [Google Scholar]
  45. Marquardt, D. An Algorithm for Least-Squares Estimation of Nonlinear Parameters. Appl. Math. 1963, 431–441. [Google Scholar] [CrossRef]
  46. Nayebi, M.; Khalili, D.; Amin, S.; Zand-Parsa, S. Daily stream flow prediction capability of artificial neural networks as influenced by minimum air temperature data. Biosyst. Eng. 2006, 95, 557–567. [Google Scholar] [CrossRef]
  47. Kişi, Ö. Streamflow forecasting using different artificial neural network algorithms. J. Hydrol. Eng. 2007, 12, 532–539. [Google Scholar] [CrossRef]
  48. Yaseen, Z.M.; El-shafie, A.; Jaafar, O.; Afan, H.A.; Sayl, K.N. Artificial intelligence based models for stream-flow forecasting: 2000–2015. J. Hydrol. 2015, 530, 829–844. [Google Scholar] [CrossRef]
  49. Elliott, D.L. A Better Activation Function for Artificial Neural Networks; Institute for Systems Research, University of Maryland: College Park, MD, USA, 1993. [Google Scholar]
  50. Dawson, C.W.; Wilby, R.L. Hydrological modelling using artificial neural networks. Prog. Phys. Geogr. 2001, 25, 80–108. [Google Scholar] [CrossRef]
  51. Moriasi, D.N.; Arnold, J.G.; Van Liew, M.W.; Bingner, R.L.; Harmel, R.D.; Veith, T.L. Model evaluation guidelines for systematic quantification of accuracy in watershed simulations. Trans. Am. Soc. Agric. Eng. 2007, 50, 885–900. [Google Scholar] [CrossRef]
  52. Gupta, H.V.; Sorooshian, S.; Yapo, P.O. Status of automatic calibration for hydrologic models: Comparison with multilevel expert calibration. J. Hydrol. Eng. 1999, 4, 135–143. [Google Scholar] [CrossRef]
  53. Kalin, L.; Isik, S.; Schoonover, J.E.; Lockaby, B.G. Predicting water quality in unmonitored watersheds using Artificial Neural Networks. J. Environ. Qual. 2010, 39, 1429–1440. [Google Scholar] [CrossRef] [PubMed]
  54. American Society of Agricultural and Biological Engineers (ASABE). Guidelines for Calibrating, Validating, and Evaluating Hydrologic and Water Quality (H/WQ) Models; ASABE 621 JUN2017; ASABE: St. Joseph, MI, USA, 2017. [Google Scholar]
  55. Raposo, J.R.; Dafonte, J.; Molinero, J. Assessing the impact of future climate change on groundwater recharge in Galicia-Costa, Spain. Hydrogeol. J. 2013, 21, 459–479. [Google Scholar] [CrossRef]
  56. Conan, C.; de Marsily, G.; Bouraoui, F.; Bidoglio, G. A long-term hydrological modeling of the upper Guadiana river basin (Spain). Phys. Chem. Earth 2003, 28, 193–200. [Google Scholar] [CrossRef]
  57. Arnold, J.G.; Kiniry, J.R.; Srinivasan, R.; Williams, J.R.; Haney, E.B.; Neitsch, S.L. Soil and Water Assessment Tool Input/Output Documentation: Version 2012; Texas Water Resources Institute Technical Report: College Station, TX, USA, 2012; Volume TR-439, Available online: http://swat.tamu.edu/media/69296/SWAT-IO-Documentation-2012.pdf (accessed on 20 June 2017).
  58. Neitsch, S.L.; Arnols, J.G.; Kiniry, J.R.; Williams, J.R. Soil and Water Assessment Tool Theoretical Documentation, version 2009; Texas A&M University: College Station, TX, USA, 2011; Available online: http://swat.tamu.edu/media/99192/swat2009-theory.pdf (accessed on 2 July 2017).
  59. Soriano, G.; Samper, J. Monitoring and modelling water quantity and quality in a pilot catchment in north-western Spain. In Monitoring and Modelling Catchment Water Quantity and Quality; Verhoest, N., Hudson, J., Hoeben, R., De Troch, F., Eds.; IHP-VI, Technical Documents in Hydrology, No. 66; UNESCO: Paris, France, 2003. [Google Scholar]
  60. Arnold, J.G.; Allen, P.M. Automated methods for estimating baseflow and ground water recharge from streamflow records. JAWRA 1999, 35, 411–424. [Google Scholar] [CrossRef]
  61. Pérez-Sánchez, J.; Senent-Aparicio, J.; Segura-Méndez, F.; Pulido-Velazquez, D. Assessment of lumped hydrological balance models in peninsular Spain. Hydrol. Earth Syst. Sci. 2017. [Google Scholar] [CrossRef]
  62. Talebizadeh, M.; Morid, S.; Ayyoubzadeh, S.A.; Ghasemzadeh, M. Uncertainty analysis in sediment load modeling using ANN and SWAT model. Water Resour. Manag. 2010, 24, 1747–1761. [Google Scholar] [CrossRef]
  63. Wu, C.L.; Chau, K.W.; Li, Y.S. Predicting monthly streamflow using data-driven models coupled with data-preprocessing techniques. Water Resour. Res. 2009, 45. [Google Scholar] [CrossRef]
  64. Babbar, R.; Babbar, S. Predicting river water quality index using data mining techniques. Environ. Earth Sci. 2017, 76, 504. [Google Scholar] [CrossRef]
  65. Huo, S.; He, Z.; Su, J.; Xi, B.; Zhu, C. Using artificial neural network models for eutrophication prediction. Procedia Environ. Sci. 2013, 18, 310–316. [Google Scholar] [CrossRef]
  66. Kuo, J.T.; Hsieh, M.H.; Lung, W.S.; She, N. Using artificial neural network for reservoir eutrophication prediction. Ecol. Model. 2007, 200, 171–177. [Google Scholar] [CrossRef]
Figure 1. (a) Location of the Miño-Sil and Segura River Basins in Peninsular Spain; (b) Location of the LRB in the Miño-Sil River Basin; (c) Location of the HSRB in the Segura River Basin; (d) DEM of the LRB; (e) DEM of the HSRB.
Water 10 00192 g001
Figure 2. Cross-correlation analyses for LRB and HSRB between daily streamflow and (a) daily precipitation; (b) total rainfall of the preceding n days; (c) daily temperature; (d) mean temperature over the previous n days.
Water 10 00192 g002
Figure 3. Structure of multilayer feed-forward network used in this research.
Water 10 00192 g003
Figure 4. Scatterplots for daily streamflow obtained with SWAT and ANN in (a) calibration/training period of LRB; (b) validation period of LRB; (c) calibration/training period of HSRB; (d) validation period of HSRB.
Water 10 00192 g004
Figure 5. Comparison of observed and simulated daily streamflow by SWAT and ANN in validation phase, while the bar graph at the top is the daily precipitation for (a) LRB; (b) HSRB.
Water 10 00192 g005aWater 10 00192 g005b
Figure 6. FDC of validation period of (a) LRB; (b) HSRB.
Water 10 00192 g006
Table 1. Characteristics of the watersheds.
CharacteristicLRB 1HSRB 2
Mean annual temperature (°C)11.213.2
Mean annual precipitation (mm)1218748
Mean annual flow (m3/s)23.661.85
1 According to data from 1971 to 2007. 2 According to data from 1987 to 2007.
Table 2. Performance metrics.
EquationRange
NSE =   1 [ i = 1 n ( O i E i ) 2 i = 1 n ( O i O ¯ ) 2 ] [−∞, 1]
R 2 =   [ i = 1 n ( O i O ¯ ) · ( E i E ¯ ) ] 2 [ [ i = 1 n ( O i O ¯ ) 2 ] 0.5 · [ i = 1 n ( E i E ¯ ) 2 ] 0.5 ] 2 [0, 1]
PBIAS =   i = 1 n ( O i E i ) · 100 i = 1 n ( O i ) [−∞, ∞]
RMSE = i = 1 n ( O i E i ) 2 n [0, ∞]
Oi is the ith observed data, O ¯ is the mean of the observed data, Ei is the ith estimated data, E ¯ is the mean of the estimated data and n is the total number of observations.
Table 3. Evaluation model criteria for daily time scale.
Performance RatingNSEPBIAS (%)
Very goodNSE ≥ 0.7|PBIAS| ≤ 25
Good0.5 ≤ NSE < 0.725 < |PBIAS| ≤ 50
Satisfactory0.3 ≤ NSE < 0.550 < |PBIAS| ≤ 70
UnsatisfactoryNSE < 0.3|PBIAS| > 70
Table 4. Definition of five segments of different phases of the hydrograph.
Hydrograph PhaseDefinition
Very high flowFlows greater than Q5
High flowFlows between Q5 and Q20
Medium flowFlows between Q20 and Q70
Low flowFlows between Q70 and Q95
Very low flowFlows smaller than Q95
Table 5. Sensitivity analysis of SWAT model parameters for LRB and HSRB.
ParameterDefinitionLRBHSRB
t-Statp-ValueRankt-Statp-ValueRank
ALPHA_BFBaseflow alpha factor (days−1)21.870.0010.950.3414
CH_N1Manning’s “n” value for the tributary channels12.730.0029.230.001
OV_NManning’s “n” value for overland flow5.980.0031.230.2212
GW_DELAYGroundwater delay time (days)−5.450.004−0.910.3615
CH_N2Manning’s “n” value for main channel2.590.0152.080.047
SOL_KSaturated hydraulic conductivity (mm/h)2.480.0162.090.046
CN2SCS runoff curve number2.420.027−8.090.002
GWQMNThreshold depth of water in the shallow aquifer for return flow to occur (mm)1.970.0582.010.049
CH_K1Effective hydraulic conductivity in tributary channel alluvium (mm/h)−1.780.0893.900.004
RCHRG_DPDeep aquifer percolation fraction−1.770.0810−2.050.048
LAT_TTIMELateral flow travel time (days)−1.490.1411−2.160.035
SOL_AWCAvailable water capacity of the soil layer (mm H2O/mm soil)1.340.18125.390.003
BIOMIXBiological mixing efficiency1.230.22130.800.4216
SLSUBBSNAverage slope length (m)1.210.23140.250.8020
GW_REVAPGroundwater “revap” coefficient1.110.27151.410.1610
SURLAGSurface runoff lag coefficient1.010.31160.370.7119
REVAPMNThreshold depth of water in the shallow aquifer for “revap” or percolation to the deep aquifer to occur (mm)0.930.36171.200.2313
CANMXMaximum canopy storage (mm)0.470.64181.260.2111
ESCOSoil evaporation compensation factor−0.200.8419−0.420.6718
EPCOPlant uptake compensation factor0.010.99200.690.4917
Table 6. Parameters used in the SWAT model calibration in LRB and in HSRB.
ParameterRangeFitted Value
LRBHSRB
GWQMN0–500082.50642.17
GW_DELAY0–5002.521.38
RCHRG_DP0–10.010.70
ALPHA_BF0–10.090.20
GW_REVAP0.02–0.2-0.14
REVAPMN0–1000-65.59
CH_K10–3006.98230.73
CH_N20.01–0.30.130.30
CH_N10.01–0.30.190.12
CN2±20%−1.35%−3.75%
SOL_K±20%+12.01%−12.04%
SOL_AWC0–1−1.29%−5.51%
ESCO0.1–10.770.39
SLSUBBSN±20%−0.57%-
OV_N0.01–0.80.69-
LAT_TTIME0–1803.956.79
BIOMIX0–10.94-
CANMX0–100-4.71
Table 7. Estimation scenarios for each basin.
BasinPrediction ScenarioInput CombinationsOutput
LRB1Pt, Pt−1, Pt−2, Pt−3, Pt−4, TtQt
2Pt, R4, Tt, Tm30Qt
3Pt, Pt−1, Pt−2, Pt−3, Pt−4, R4, TtQt
4Pt−1, Pt−2, Pt−3, Pt−4, R4Qt
HSRB1Pt, Pt−1, Pt−2, TtQt
2Pt, Pt−1, R48, TtQt
3Pt, Pt−1, R48Qt
4Pt−1, R48, Tm30Qt
Table 8. Best network architectures and their average performance measures obtained in cross-validation for each prediction scenario.
BasinPrediction ScenarioANN Architecture (I–H–O) 1TrainingValidation
NSEPBIAS (%)RMSENSEPBIAS (%)RMSE
LRB16–2–10.631.1722.510.5912.5223.02
24–2–10.520.6224.750.521.6724.85
37–2–10.622.9122.640.5812.0723.52
45–2–10.560.7124.450.537.2624.65
HSRB14–2–10.285.521.96−0.1529.851.90
24–4–10.552.161.540.2613.531.66
33–4–10.566.851.510.3212.021.57
43–3–3–10.471.291.690.1021.151.81
1 I is the number of neurons in input layer; H is the number of neurons in hidden layer (one or two hidden layers); O is the number of neurons in output layer.
Table 9. Performances of SWAT and ANN models.
BasinModelCalibration/TrainingValidation
NSEPBIAS (%)RMSER2NSEPBIAS (%)RMSER2
LRBSWAT0.592.5522.110.590.577.1825.780.58
ANN0.642.0320.810.630.5912.9425.390.61
HSRBSWAT0.524.371.760.530.488.741.450.49
ANN0.549.031.730.570.495.281.510.52
Table 10. RMSE values (m3/s) of SWAT and ANN models in each hydrograph phase.
Hydrograph PhaseBasin
LRBHSRB
Range of Flow (m3/s)CalibrationValidationRange of Flow (m3/s)CalibrationValidation
SWATANNSWATANNSWATANNSWATANN
Very high flow[82.88, 478.29]73.4064.26100.4292.72[4.52, 51.70]6.645.805.985.81
High flow[30.37, 82.87]26.7126.0621.8526.43[2.14, 4.51]1.532.290.911.30
Medium flow[6.29, 30.32]13.9313.7412.3612.74[1.03, 2.13]0.990.840.730.64
Low flow[1.21, 6.28]5.178.976.7910.10[0.61, 1.02]0.540.580.530.48
Very low flow[0.48, 1.20]1.507.801.007.41[0, 0.60]0.290.900.601.22

