Experimental and Numerical Study of Hydrodynamic Characteristics of Gullies for Buildings

1
Department of Maritime Information and Technology, National Kaohsiung Marine University, Kaohsiung 811, Taiwan
2
Department of System and Naval Mechatronic Engineering, National Cheng Kung University, No. 1, University Road, Tainan City 701, Taiwan
3
Cu Golden Power Products, Inc., No. 26, Ln. 243, Rongzong Road, Zuoying District, Kaohsiung City 813, Taiwan
*
Author to whom correspondence should be addressed.
Water 2018, 10(2), 165; https://doi.org/10.3390/w10020165
Submission received: 13 November 2017
/
Revised: 19 January 2018
/
Accepted: 5 February 2018
/
Published: 7 February 2018
Abstract
:The miniaturization of a gully for building drainage system is attempted by installing a streamlined bump in the discharge pipe to maintain the minimum water trap height of 50 mm. The hydrodynamic performances of the air–water flows with or without glass balls through the two types of four-entry gullies with beveled or vertical nozzle flows are experimentally and numerically studied. The images of air–water–solid flow, maximum flow rates, self-purification properties and sustainable water traps subject to static and dynamic loadings are experimentally detected. The predictions of Computational Fluid Dynamics (CFD) unravel the characteristic flow structures to assist the interpretation of experimental results. In this respect, the observed entrained air bubbles and clustered glass balls in each gully correspond favorably to the regions with negative static pressures and weak flow momentums as disclosed by the CFD predictions. The measured ratios between discharged and supplied glass balls are consistently higher for the gully with beveled nozzle flows. The less efficient transportation of glass balls out of the drum for the gully with downward nozzle flow is attributed to the larger pressure gradients with considerable air entrainments. The relaxations of the form and friction drags over the nozzle-tip region and the reductions of air entrainments are essential for upgrading the maximum flow rate and the self-purification performance of a miniaturized gully.
1. Introduction
A building drainage system utilizes gravity to transport waste water into underground sewers. The airflow is entrained by the water discharge with the air pressure affected by separation, shearing actions among the air–water flow and on the fluid–solid interfaces, the appliances installed and the geometries of a drainage network. The accelerated discharge flow and the various pipe line losses in a vertical stack cause sub-atmospheric airflow pressures over a portion of the drainage system. Downstream of the discharging branch along the vertical stack, the sub-atmospheric airflow pressure gradually recovers back towards atmospheric near the base of the stack, mainly due to the hydrodynamic complexities induced through the bottom bend [1]. In practice, a discharge through a drainage system is an intermittent and random process. The pressure profile in a drainage system is temporal with pressure transients transmitted along the drainage network. The pressure surges triggered by these transients can be approximated by Joukowsky equation as the products of the velocity changes, fluid density and the speed of sound. A negative air pressure transient draws water out of a trap seal, while a positive transient can force the water from an appliance into the habitable space. Neither negative nor positive pressure transitions are favorable for a drainage system; however, these air pressure transients are inevitable. The hydrodynamic characteristics of the multiphase flows in a drainage network and in the associated appliances play crucial roles for engineering designs to cope with the consequences caused by these air pressure transients. The just-in-time recompenses of airflow at locations close to the sources of the triggering events for alleviating the pressure transients to ensure the equilibrium state in a drainage system can safeguard the drainage operations [2].
The optimal design of a building drainage system is a difficult task due to the complex pipe-line bifurcations, the appliances installed and the virtually intermittent/unsteady multi-phase flows. In a branch or the vertical stack of a building drainage system, the interfacial structures of the air–water flows generally take the forms of intermittent stratified, wavy and annular flows [3]. The positive or negative pressure transients that propagate within the drainage system at sonic speeds are mainly affected by the momentum changes of air–water flows due to flow bifurcations, expansions, contractions, diversions and chocking [4]. The propagation of these transients in a drainage system depended on the interfacial structures of air–water flows and the reflection and/or transmission of the air pressure waves on the air–water and fluid–solid interfaces. Considerable pressure oscillations at the bend of the vertical stack as a result of the air pressure propagation in a drainage and vent system were reported [4]. As the propagation of pressure transient is also affected by the operating condition, a wide range of pressure surge applications in a drainage system were analyzed and modelled by solving the St Venant equations via the method of characteristics [5]. Particularly, the aggravated surge pressures due to the trapped or entrained air were considered in terms of a transient analysis [5]. With horizontal drainage systems, the numerical model adopting the characteristic-based finite-difference method with a time-line interpolation scheme was proposed and validated [6] to predict the transient free surface flows in actual drainage systems. Nevertheless, as the aforementioned hunter-based models for sizing the pipes to cope with the instantaneous demands of discharges were not permissive to predict the incidences and durations of the discharges in a drainage system, the alternative time series model was proposed [7]. The estimations for the duration and incidence of drainage demands from several appliances that discharged randomly and intermittently with variable flow rates were verified [7]. Alternatively, the air pressure fluctuations in a high-rise building drainage system were predicted using the probability density functions and statistical analysis for the measured data from the vertical stack of the eighteen-floor building [8]. The air pressure fluctuations were closely correlative with the number of floor. The flatness factor for the pressure fluctuation profile increased with the floor number; but the skewness factor exhibited the reversed tendency. The probability density functions of the air pressure fluctuations were far from normal distributions [8]. While previous research [1,2,3,4,5,6,7,8] has investigated the causes and effects of air pressure transients on the air pressure regime in building drainage and vent systems, the falling solids also modified/generated the pressure transients in a vertical stack [9].
The pressure waves emitted from the vertical stack and the appliances are interdependent, leading to the interactive hydrodynamic responses in a drainage system [2,3,4,5,10]. As water seals prevent odor and fouling air transmissions into habitat spaces through the interconnected network of a drainage system, the survival of each water seal during the attacks of the air pressure transients is crucial. As a general guide, the various architecture regulations mandate a trap seal of minimum 50 mm water height in a building drainage system. In response to the Severe Acute Respiratory Syndrome outbreak beginning in 2002, the lack of monitoring the status of water trap seal status in a building motivated the development of the sonar-like technology aimed at identifying the defective water traps for a building drainage network in the repeatable and non-destructive manners [11]. In addition, several research works probed into the transient hydrodynamic performances of the various types of water seals with drainage applications. Jean and Gormley [12] attempted to improve the accuracy of drainage simulation models by estimating the dynamic responses of trapped water to air pressure transients using Computational Fluid Dynamics (CFD) and the traditional 1D finite difference method of characteristics models. These results affirmed the considerable effects of the frequency of air pressure transients on water trap seals and related such frequency impacts to the various device geometries, particularly the ratio between inner and outer wall length [12].
For occasions with many drainage discharges in a same habitable space, a gully trap is applicable to receive multiple discharge pipes using a common water trap seal. Combining with air admittance valves, the drainage pipe lines are considerably simplified. Several international standards have specified the functional requirements for a gully trap. In this respect, the maximum flow rate, the self-purification performances by transporting solid–liquid–air flows and the survival of water trap under steady and dynamic air pressure loadings are essential. In addition, the impacts caused by installing gully on the performances of a drainage system were investigated. The experimental measurements [13] and numerical simulations [14] for the air–water flows and their dynamic responses in the multi-outlet siphonic roof drainage systems were reported. The air–water flows through gullies were numerically studied [15]. Using lumped bubbly flow assumption, the geometries of entry and discharge ports as well as the plenum chamber were the predominant factors for the hydrodynamic performances of gullies [15]. By fitting a streamlined bump in the discharge port of the gully, the siphonic effects at the throat of the partitioned discharge port substantially stabilized the upstream air–water flows [16]. However, the discharge capacity was limited due to the choking effect at the discharge port. For raising the maximum discharge capacity of the gully, a ring of swirl generation vanes was installed in the annular flow pathway to stabilize the agitating air–water bubbly flows [17].
With present research results to assist the development of gullies in drainage systems of buildings, the air and solid transportations within water flows through pipes are encountered. The recent scientific status of water–gas–liquid flows were reviewed by Yang et al. [18]. The flow characteristics of liquid, bubbles and solid particles in gas–liquid–solid fluidization systems were discussed by reviewing the mechanisms of bubble formation, instability and rising dynamics driven by their relatable forces. With gas–liquid–solid flows, the bubble dynamics dominated the overall transport phenomena. The hydrodynamic characteristics of gas–liquid–solid flows were governed by the bubble wakes because the laminar or turbulent wake flows characterized the behaviors of rising bubbles [18]. The major factor causing the complexities of liquid–solid flows in the vicinity of rising bubbles was the flow instabilities induced by the laminar or turbulent wakes downstream these bubbles [18]. The unsteady and interactive wake flow often emerged as a cyclic vortex formation and shedding process due to the oscillating bubble motion. In the work of Qin and Suckale [19], the dynamic interactions between bubbles, solid particles and liquid flow had led to the intense nonlinearities in the aggregate behavior of such multiphase flow. With solid particles and bubbly air flows in water, the combined effect of void fraction and solid volume fraction on drag coefficients of the gas–liquid–solid flows was discovered [20]. In general, the drag coefficients for both air-bubbles and solid-particles were reduced as the bubble diameter increased. As the increase of particle inertia could cause air-bubble deformations and even to break-up, the impact of particle size on the drags of air-bubbles and solid particles were hard to be predicted [20]. Nevertheless, the complex transport of solid particles in air–water flows through a gully is expected to be affected by the air–water flow pattern, the fluid properties and interfacial structures, as well as the geometries of flow passages.
The miniaturization of gully height to fit into the building floor is preferable. The present study thus adopted the experimental and numerical methods for devising the triple-entry gully with reduced height suitable for fitting into the building floor. For maintaining the minimum water trap height of 50 mm in a gully, a streamwise bump fitted in the discharge port [16] was followed. Initially, the hydrodynamic performances of solid–water–air flows through the gullies with various interior designs, including the side-discharged nozzle, were numerically examined. The experimental rigs collect the data from two selective types of gullies for CFD validations. In this respect, the maximum flow rate, the temporal responses of water trap to the periodical pressure fluctuations, the maximum sustainable positive/negative air pressures and the self-purification performances for two selective gully models are compared with the associated hydrodynamic characteristics examined. The research results are applicable to gullies in drainage systems inside buildings within the scope of EN 1253-1:2015, Class K3, Gullies for buildings.
2. Research Methods
Figure 1 depicts the two types of four-entry test gully with beveled discharge (Figure 1a) and vertical discharge (Figure 1b) for present numerical and experimental studies. Present attempt for reducing the gully height is achieved by installing a streamlined bump on the bottom surface of the discharge pipe to extend the volume and height of the water trap in each gully. As indicated in Figure 1, the origin of present x-y-z coordinate system is allocated on the centerline of the nozzle above the base of gully drum.
For each test gully depicted in Figure 1, the vertical nozzle directs the entry mixed air–water flows from the four entry ports toward the base of gully drum. The nozzle with downward or beveled discharge respectively formulates the downstream radial spreading stream or side bulk stream that surges toward the discharge port. On the inner surface of the gully drum, a C-shaped open ring is installed to partially compress the fluids in the drum when the flow is up-surging, leading to the elevation of the pressure potential to assist the solid transportation toward the discharge pipe. To ensure the 50 mm water trap height, the vertical length between the peak of the streamlined bump in the discharge pipe and the highest open edge of each nozzle is 50.5 mm. A filter leaf is installed on the top entry port of each test gully, which lifts open to permit the entry of falling glass balls when the purification tests are performed.
Present numerical study adopts Flow 3-D commercial code to analyze the unsteady flow structures and the pressure fields in each type of gully shown in Figure 1. The transportation of solid glass balls in the water stream through the test gully is particularly examined for assessing the self-purification performance. The experimental tests are formulated to reveal the stabilities and the dynamic responses of the water traps in the test gullies. Along with the CFD simulation results, the flow snapshots with or without glass balls are taken to disclose the hydrodynamic characteristics of present test gullies. The maximum flow rates for the test gullies are also determined experimentally. Table 1 summarizes the test conditions for present numerical and experimental studies.
2.1. Experimental Method
Figure 2 depicts the experimental facilities for testing: (a) sustainable positive and negative pressures at steady and unsteady conditions; (b) maximum flow rate; and (c) self-purification performance of a gully. As shown in Figure 2a, the blower (1) feeds/draws airflow into/from the test gully (2) via the instrumented pipe lines. For measuring the responses of test gully to the negative pressures at unsteady conditions, the airflow drawn by the blower (1) flows through two vent valves (3), the electrically controlled butterfly valve (4) which closes and opens periodically at the fixed frequency and two pressure transducers (5) and (6) connecting with the digital micro-manometers. With the airflow drawn by the blower from test gully to atmosphere, the negative pressure measured by pressure transducer (6) is initially controlled at −400 Pa ± 5 Pa by regulating vent valve (3). The electrically controlled butterfly valve (4) is subsequently activated to periodically open and close for five times in 50 s. The ultra sound liquid level detector (7) connected with the data logger and computer records the temporal variation of the water level in the trap of the test gully (2) which is affected by the periodical pressure variation at the entrance. With positive/negative pressure tests at steady conditions, the butterfly valve remains closed and the blower (1) feeds/draws airflow into/from the test gully (1). By adjusting the vent valves (2), the maximum positive/negative pressures sustainable by the water trap in the gully are detected using the pressure transducers (5) and (6). The pressure transducers (5) and (6) utilize the piezoelectricity that converts the pressure into the electrical potential. Each pressure tap installed on the pipe line with the probing depth to the pipe core is connected with a port of the digital-type micro-manometer. As another port of the micro manometer is vented to atmosphere, the static airflow pressures above/less than the atmospheric level are measured. Having completed the pressure tests at the steady and unsteady conditions, the drain valve (8) is opened to discharge the water from the test gully (2).
The test facilities shown in Figure 2b measure the maximum flow rate of a test gully. As shown in Figure 2b, each water stream from a gravity tank flows through the regulating valve (1) with the volume flow rate measured by the digital type flow meter (2). The volume flow rates for the two water streams from the gravity tanks are designated as and in Figure 2b. The flow stream at the flow rate of is channeled into the tank (3) fitted with the water level gauge (4) via the pathway formulated by the tank sidewall and the anti-swirl plate (5). The two water streams are directed into the test gully (6) from its top and side entries. For measuring the water height above the top entry of the test gully (h), the ultra-sound water level detector (7) is installed on the top plate of the tank (3). Having predefined a tested , the is adjusted by the needle valve (1) until the h value remains unchanged at 20 mm for at least 20 min. Thus, the maximum flow rate attainable for the test gully is determined as the summation of and .
Figure 2c depicts the test facilities measuring the flow structure and the self-purification performance of the test gully. The water stream from a gravity tank flows steadily through the regulating valve (1), volume flow mater (2), electrical solenoidal valve (3) and vent valve (4) to mix with the falling glass balls in the entry tray (5). The diameter of each glass spherical ball is 5 mm with the density of 2500 kg/m3. With the flow structure fully developed in the gully (6) at the tested flow rate of 0.8 L/s, the 3000 glass balls are falling into the entry tray (5) in 30 s. The discharged water stream carrying air bubbles and glass balls flows through the interceptor (7) into the tank (8). The glass balls out of the gully in the discharged stream are retained in the interceptor (7). Each test gully is made of transparent arctic block. A light sheet is emitted toward the transparent test gully at each set of test conditions. The air–water flow images with or without glass balls in the gully are taken by the charge-coupled device (CCD) at the rate of 60 fps. The images are recorded and stored via the computerized data acquisition system. The performance index of self-purification for the tested gully is calculated as the mass ratio between the intercepted and supplied glass balls.
The maximum experimental uncertainties of the reported measurements originated from the precision errors of the instrumentations are estimated following the editorial policy of ASME Journal of Heat Transfer [21]. With 95% confidence interval, the maximum experimental uncertainties for the measurements of ultra sound liquid level detector, micro-manometer, electronic balance scale and volume flow meter are +0.02%, +1.612%, +0.02% and +6.9%, respectively. The maximum experimental uncertainty for ratio of discharged and supplied glass balls propagated from the mass measurements is +0.36%.
2.2. Numerical Method
The governing flow continuity and momentum equation, namely the Navier–Stokes equation, for an orthogonal coordinate system are, respectively, expressed in Equations (1) and (2).
In Equations (1) and (2), denotes the velocity vector and is the source term of external force in x, y or z direction. The symbols P and μ in Equation (2), respectively, stand for the pressure and viscosity of fluids. To solve Navier–Stokes equations, a direct numerical simulation (DNS) scheme is adopted. Within the calculation domain, the DNS solutions are obtained using the fine grid cell of length 4 mm. The flow entry conditions for both types of gully with beveled nozzle discharge (Case 1) or downward nozzle flow (Case 2) are identical with = 0.4, 0.5, 0.6, 0.7 and 0.8 L/s from the top entry port. Present numerical simulation analyzes the temporal variations of the fluid velocity and pressure, including the interactions between fluids and solid particles (glass balls), with the attempt to disclose the complex multi-phase flow phenomena during the self-purification tests for each test gully. The intensity of non-linearity and convective effects are sensitive to the magnitude of volume flow rate from each inlet. Thus, the Sommerfeld radiation boundary conditions are selected as the outlet flow boundary conditions to permit the study of wave interactions with the solid surfaces.
As a numerical treatment for solids (glass balls) in the fluids, the multiple mass particle species are included in the CFD simulation by incorporating the solid transportation Equation (3) that governs the dynamics of the solid particles.
In Equation (3), , where and are the particle mean velocity and density, respectively. The drag coefficients divided by the particle mass are denoted as α and β in Equation (3), while the particle diffusion velocity, , is calcuated using the Monte Carlo technique and added to the mean velocity for accountancy. Thus, the particle motion is affected by the fluid flow via the drag force terms in Equation (3). With the significant interactions between the continuous fluids and dispersed particles, the fully coupled particle-fluid interaction model is selected in Flow 3-D code. Drags encountered by the dispersed particles arise as the solid balls drift through the continuous fluid flow. The physical properties for the solid particles are identical with the glass balls selected for the experimental tests, as summarized in Table 2.
One of the difficulties for present numerical simulation of the unsteady flow is the free water surface in the drum. In addition, the surface wave also interacts with the drifting solid particles. Thus, the Volume Of Fluid (VOF) method [22] is selected to track the fluid interface through fixed grids for predicting the solid–water and air–water interfaces, or the “two-fluid interface”. In addition, there are several restrictions on time-step selection for avoiding numerical instabilities. With present study, the time step will float up or down 5% changes per each iteration cycle unless a stability condition is violated for which the calculation parameters undergo the diametric changes. In the CFD code, the automatic time-step option is selected for achieving the optimum results. The automatic time-step interval needs to satisfy the following criteria. First, a fluid must be permitted to flow across more than one computational cell in one time step. Such advection transport not only depends on the fluid velocity but also on the fractional area/volume open to flow. The basic stability condition is formulated by Equation (4) as:
in which u, v, and w denote velocity magnitudes, VF is the fractional volume open to flow to feature a mass source and Ax, Ay, and Az are the fractional area open to flow in the x, y and z directions. The factor of CON = 0.45 is typically used to account for the worst case situations.
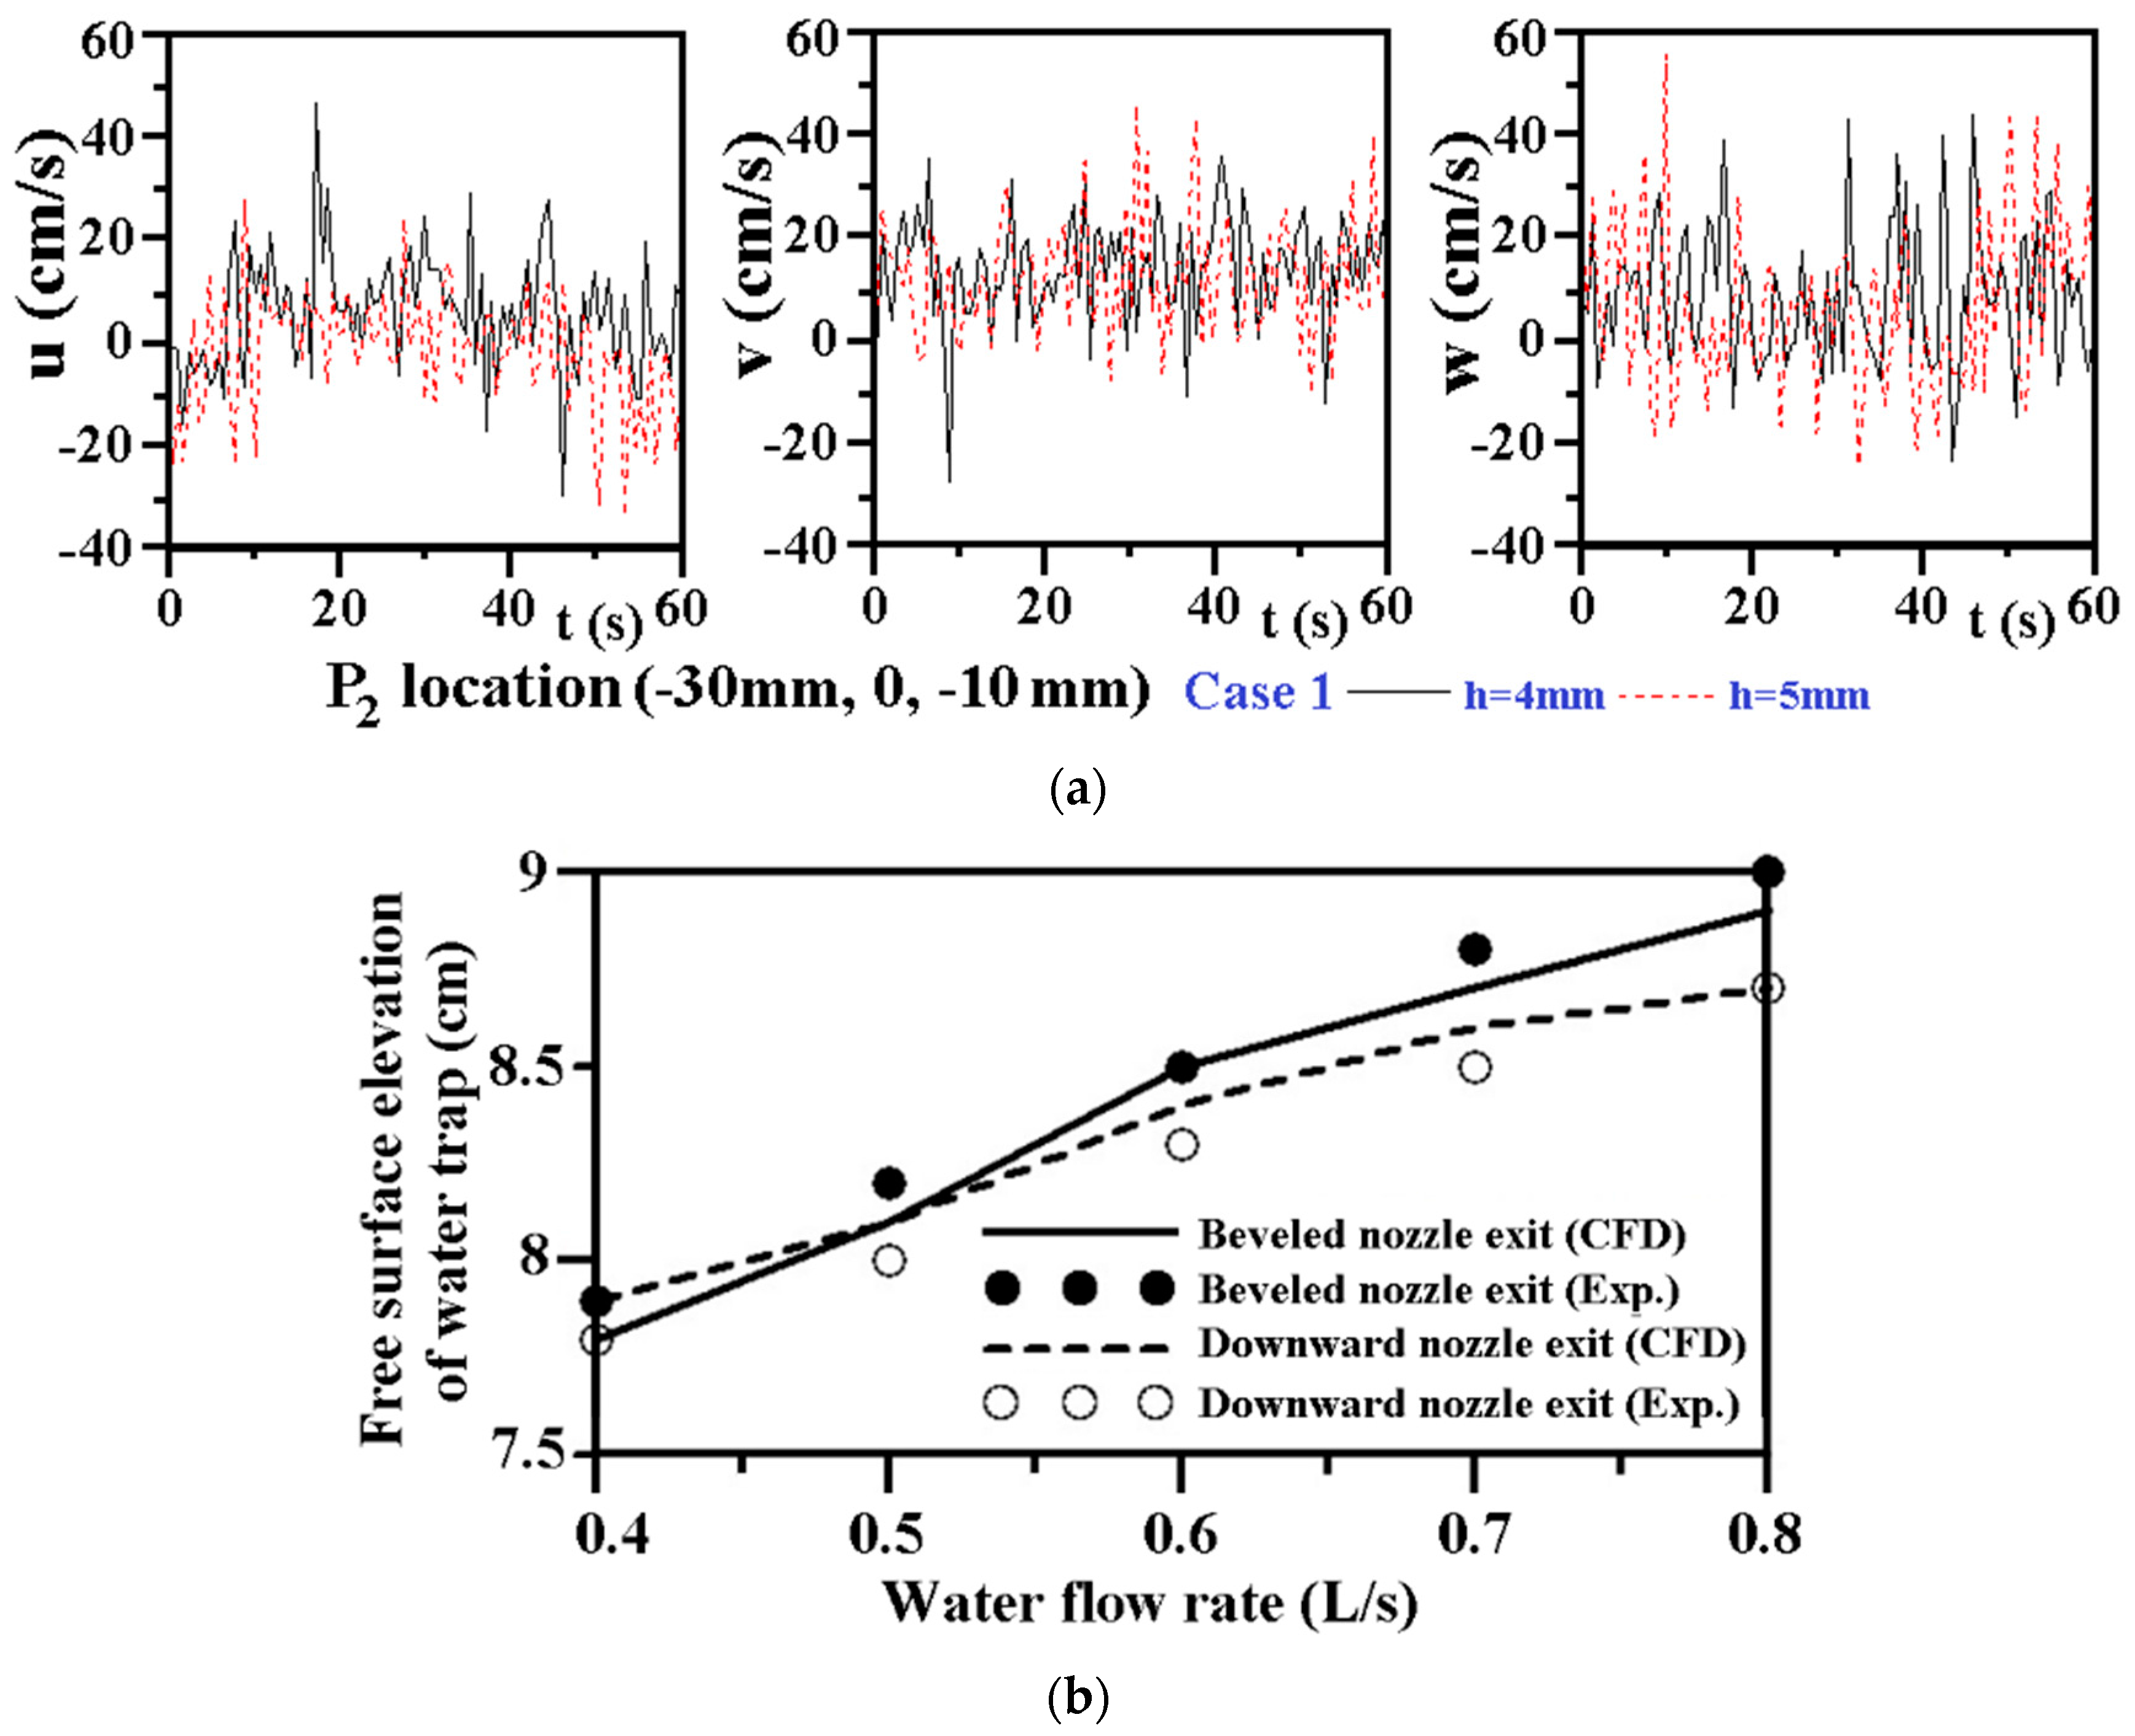
The grid independency test is performed using several grids with various mesh intervals (h). Figure 3a compares the temporal variations of u, v, w velocities at location P2(−30, 0, −10) mm, as indicated in Figure 1, for Case 1 gully at the flow rate of 0.6 L/s using the grids with interval, h, at 4 and 5 mm. These uneven orthogonal grids with h = 4 and 5 mm construct the respective 75,000 and 56,000 elements over the entire computational domain. The oscillatory amplitudes and spectrum characteristics for u, v and w velocities at P2 location approach similar when h < 5 mm. With the simulation range of water flow rates between 0.4 and 0.8 L/s, present numerical study adopts the grid with 75,000 elements at h = 4 mm.
The verification of present CFD simulations is performed by comparing the elevation of water free surface from the drum bottom in the two test gullies with beveled and downward nozzle exits at the water flow rates of 0.4, 0.5, 0.6, 0.7 and 0.8 L/s when the gullies reach their stable operation modes. In Figure 3b, the elevations of water free surface from the drum bottom keep increasing as the entry flow rate increases from 0.4 to 0.8 L/s. The higher elevations of water free surface consistently emerge in the gully with the beveled nozzle exit, as shown in Figure 3b. As the maximum discrepancy between the CFD and experimental results shown in Figure 3b is less than +10%, the present numerical simulation model is adopted to analyze the hydrodynamic performances of the two shallow gullies with beveled and downward nozzles.
3. Results and Discussion
3.1. Simulation Results
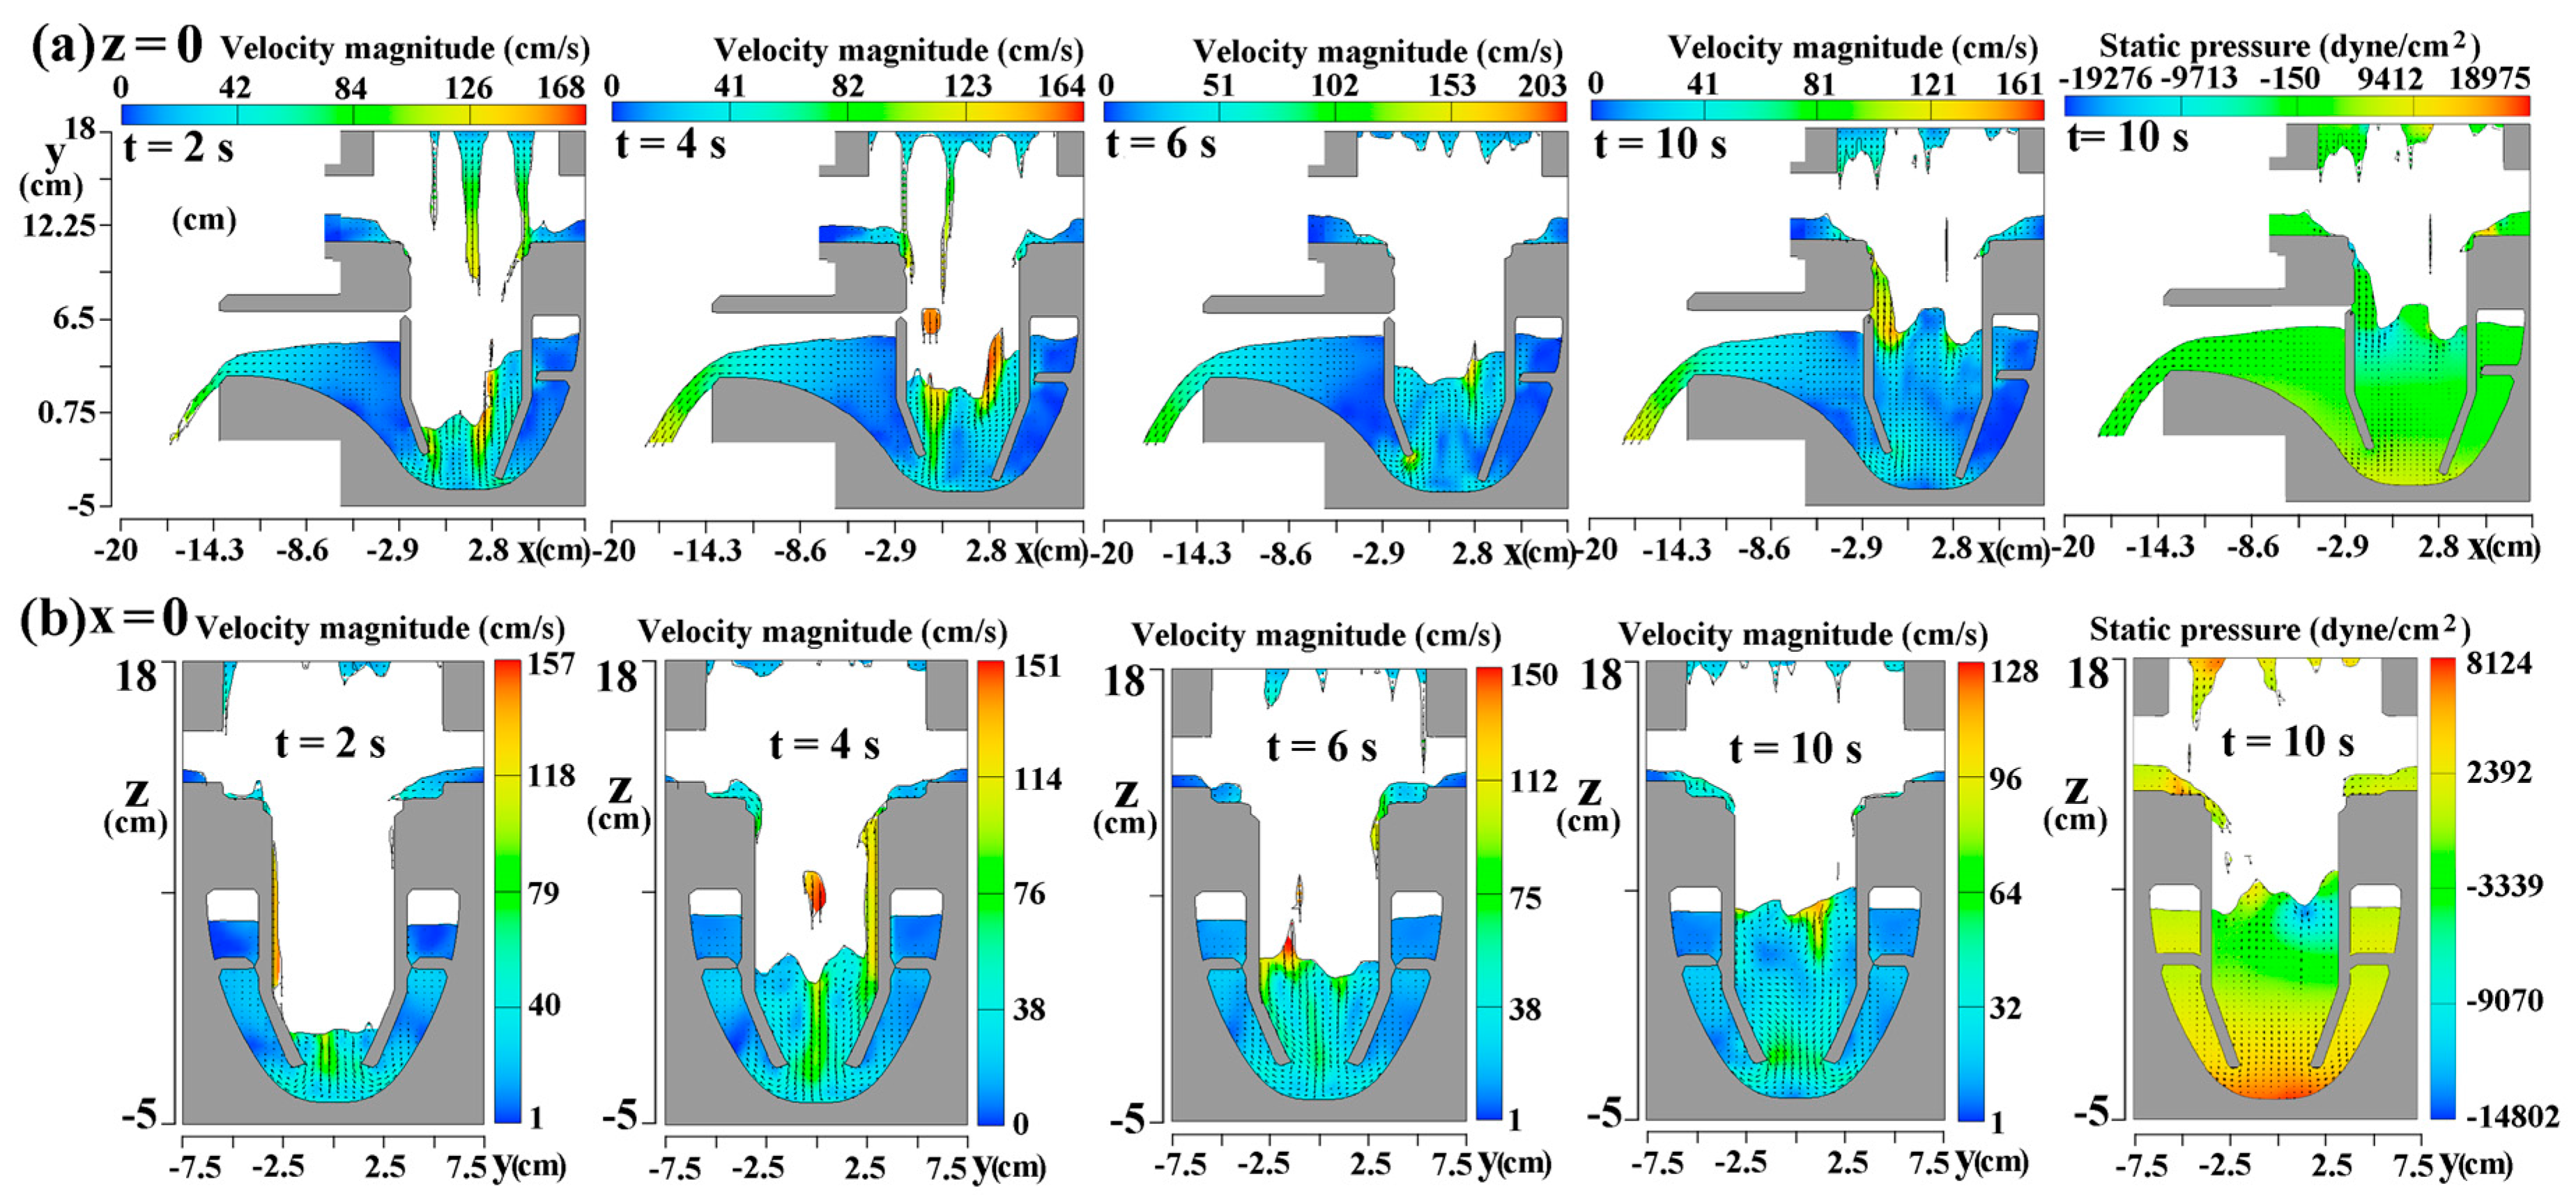
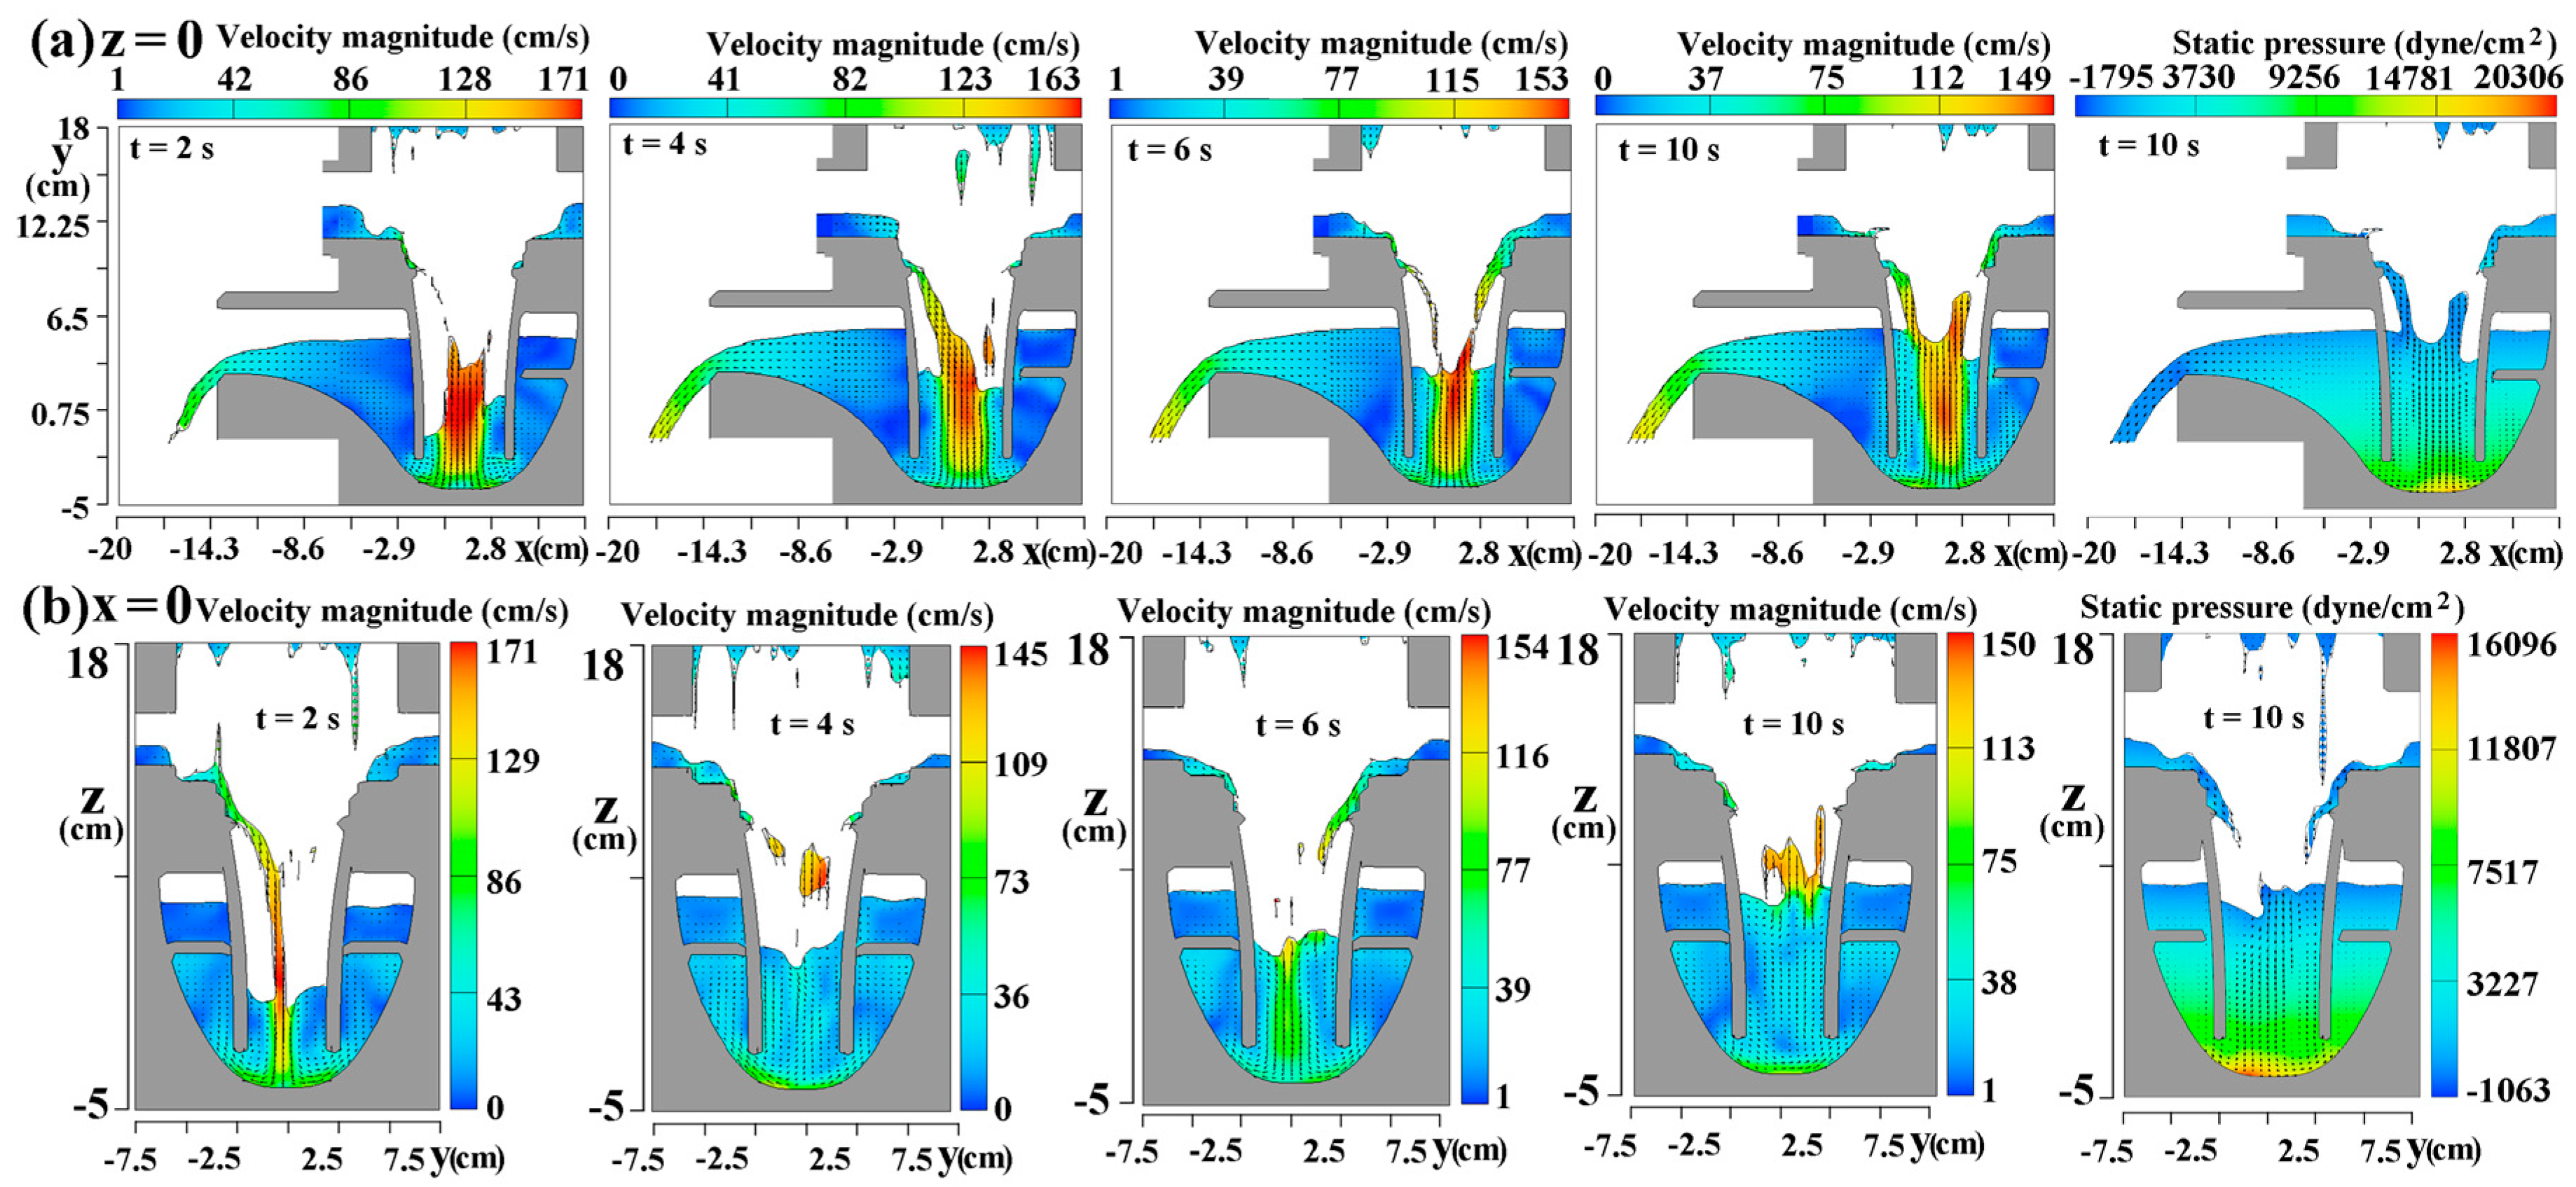
The distributions of velocity and static-pressure at the selective instants on z = 0 and x = 0 planes for the gullies with beveled and vertical nozzle discharges at = 0.6 L/s are, respectively, depicted in Figure 4 and Figure 5 to typify the flow structures in these two types of gullies.
With the beveled nozzle discharge, the low momentum streams keep surrounding the outer wall of central nozzle during the surging period from t = 0 to 10 s as shown by the velocity plots collected in Figure 4. With the water stream entering from the top of the gully, water soon fills the space enveloping the central nozzle due to the presence of the streamlined bump on the bottom surface of the discharge pipe, generating the higher water levels surrounding the central nozzle. However, the differential water levels between inner and outer walls of the central nozzle gradually diminish as the flow structures evolve toward the quasi-steady conditions. As shown in Figure 4b, the impinging water stream spread smoothly over the concave bottom wall of the drum toward the gully exit. The high pressure regions emerge over the bottom drum center rather than the regions with relative weak flow momentums. In particular, the bouncing water stream in the nozzle incur negative pressures scattering within the nozzle to entrain air–bubbles which will be later demonstrated by the detected flow snapshots. Compared with the static-pressure distributions shown in Figure 5 for the gully with the downward nozzle flow, the overall pressure levels in the gully with beveled nozzle flow are noticeably less than those developed in the gully with downward nozzle flow at the same flow rate. Thus, the required pressure potential between the drum and atmosphere for facilitating the flow through the bumped discharge pipe is lesser for the gully with the beveled nozzle discharge.
With the downward nozzle flow, the high momentum water streams concentrate within the nozzle, as shown in Figure 5.
Referring to the results collected in Figure 4, the momentums of water stream are more diffused in the gully with the beveled nozzle flow. In addition, the differential water levels between the inner and outer walls of the nozzle during the unsteady filling period shown in Figure 5 are moderated from the counterparts shown in Figure 4. The flow regions with negative pressures, where are prone to air entrainments, emerge on the free-surface regions, as shown in Figure 5. The spatial pressure gradients developed with the drum of the gully with the downward nozzle flow are generally higher than those found for the gully with the beveled nozzle flow, as shown in Figure 4. The stronger air entrainments and the higher spatial pressure gradients in the gully with the downward nozzle flow act together to weaken the transportation of glass balls from the gully drum to the exit pipe.
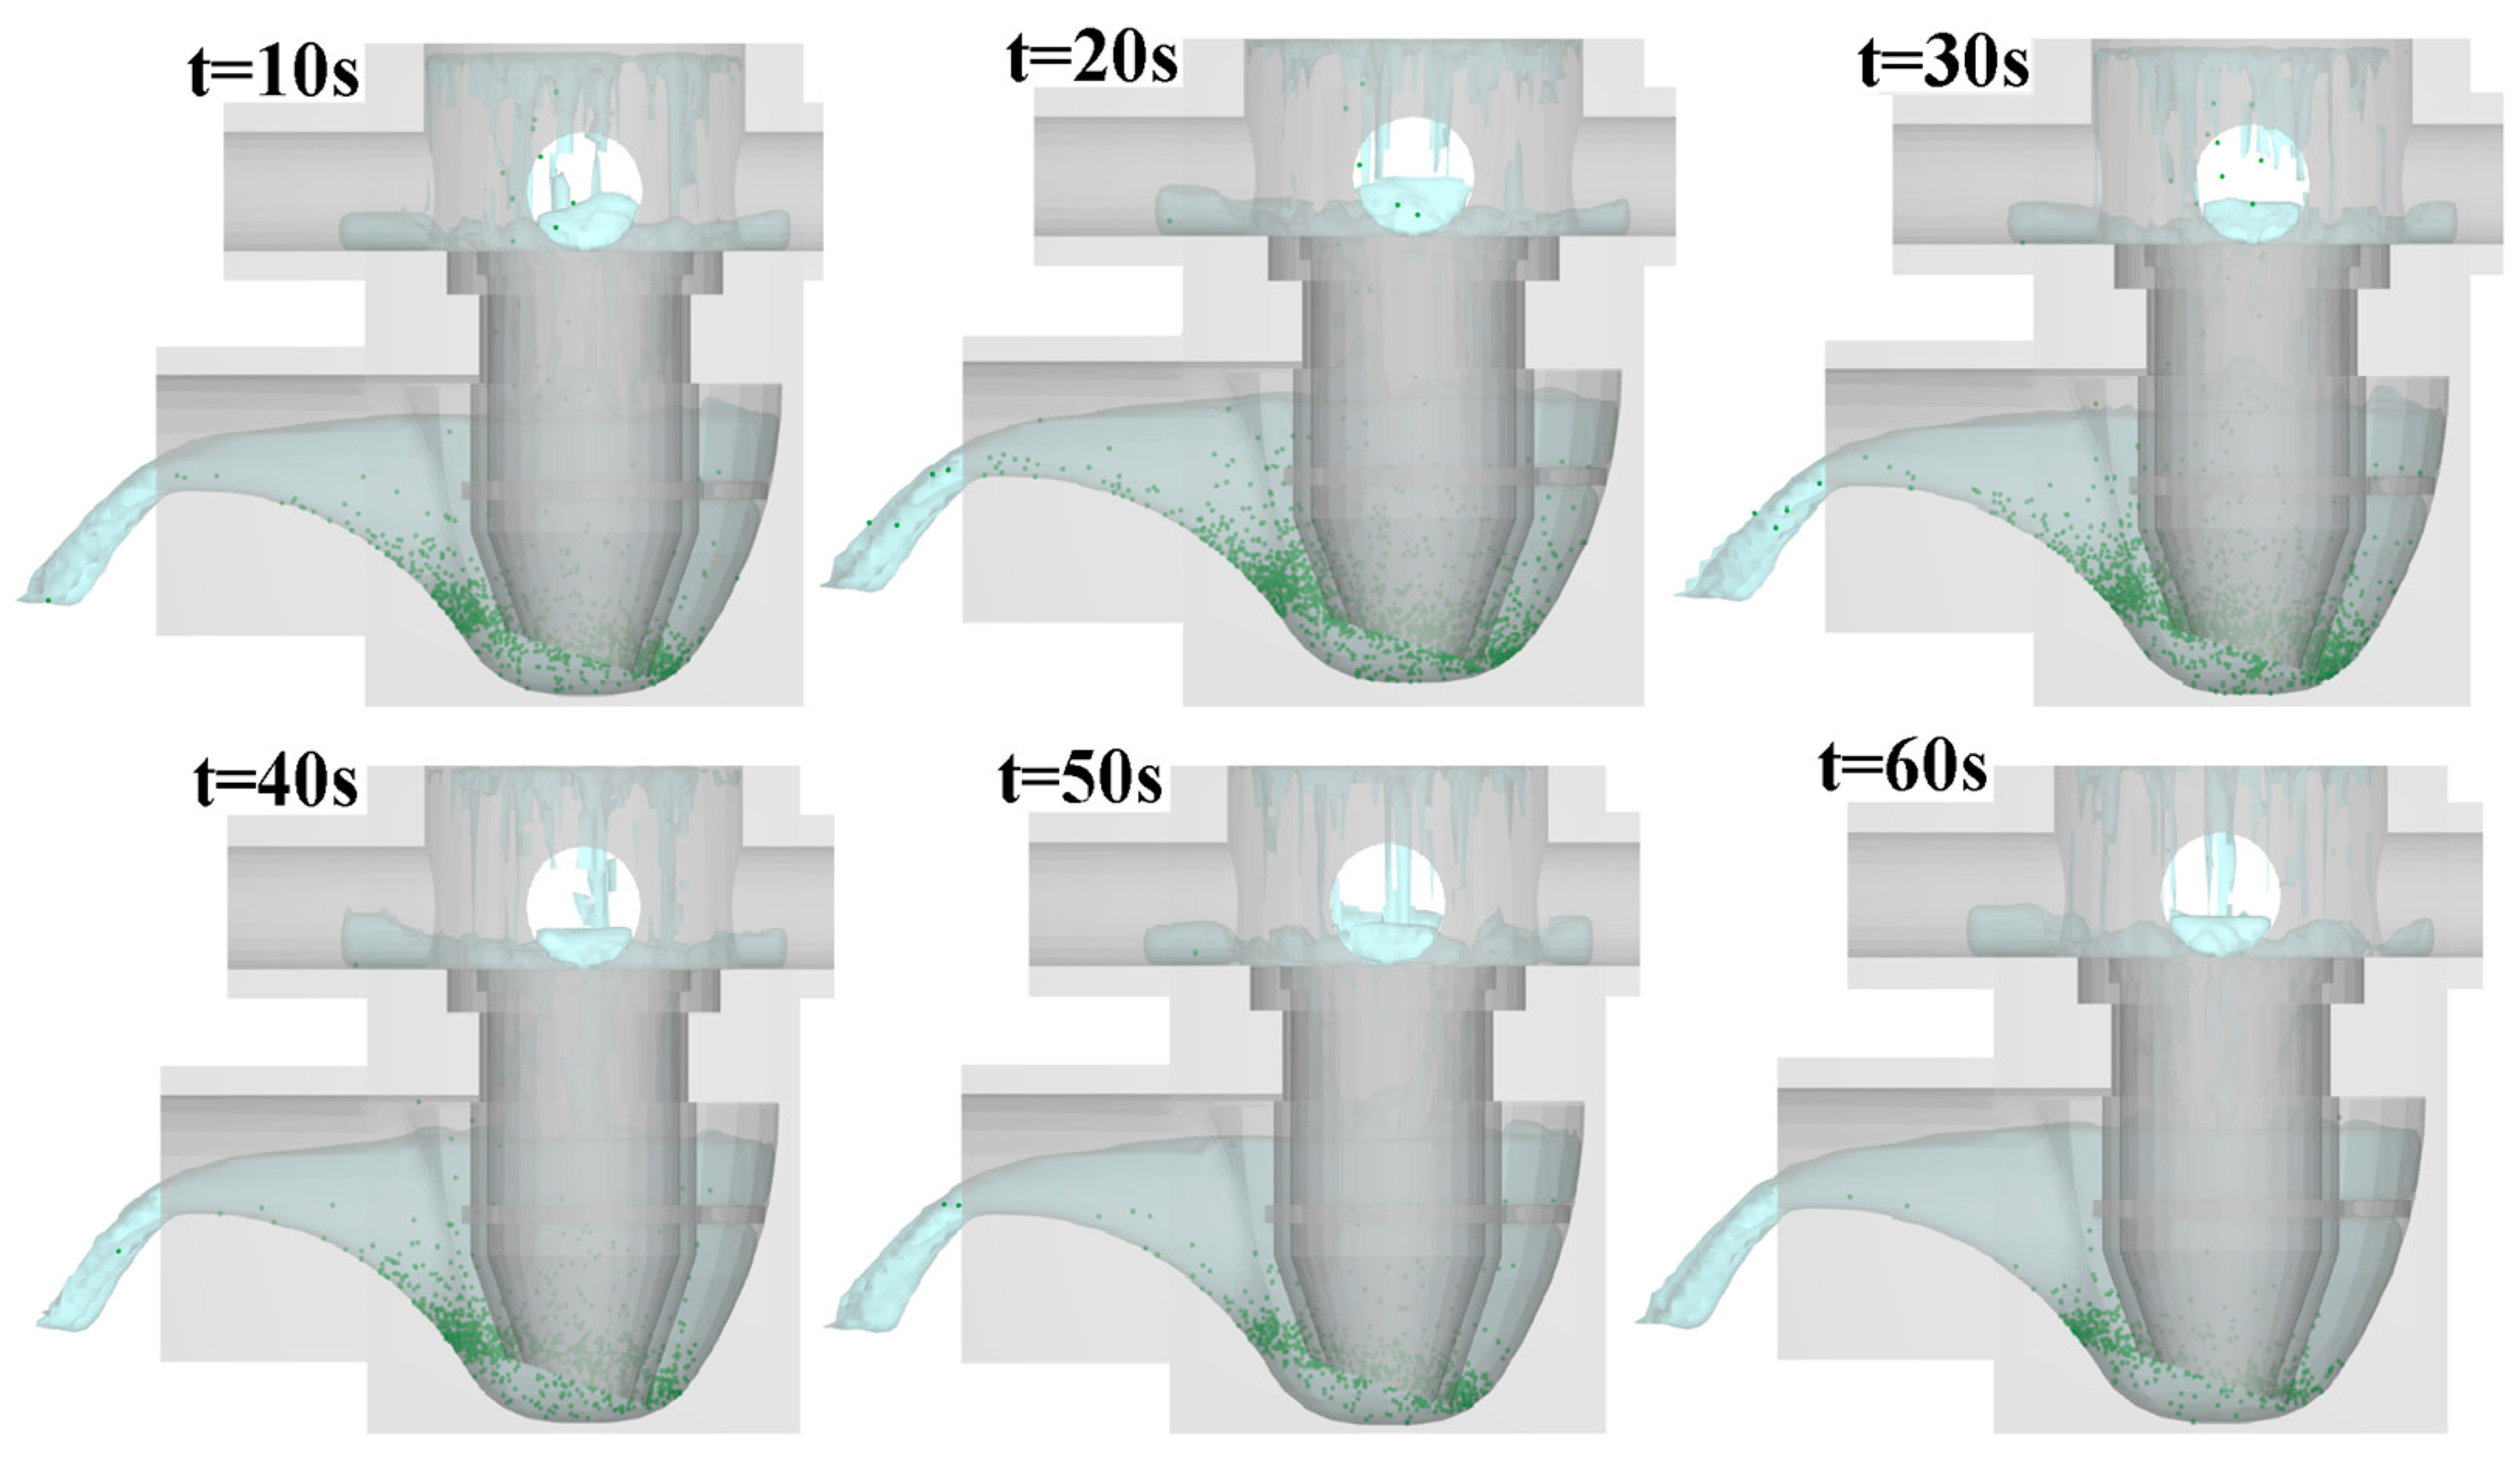
The transportations of 3000 glass balls that randomly fall into the gully from the top entry within the entry water flow at 0.6 L/s are displayed by viewing the sequential flow snapshots predicted at t = 10, 20, 30, 40, 50 and 60 s for the gullies with the beveled and downward nozzle flows in Figure 6 and Figure 7, respectively.
Cross-referencing with the flow structures depicted in Figure 4 and Figure 5 reveals that the regions with high glass-ball concentrations shown in Figure 6 and Figure 7 correlate well with the flow regions with low flow momentum. During the period of falling glass balls, t = 0–30 s, the patterns of glass ball distributions in the gully with the beveled nozzle flow basically remain similar with the regional high concentration density on two sides of the beveled nozzle tip, as shown in Figure 6. Implicated by such similar distribution pattern of the glass ball in the drum is the steady transport of the glass balls through the bumped exit pipe. However, in the drum of the gully with the downward nozzle flow, the concentration density of the glass ball around the flat edge of the nozzle increases systematically as t increases from 0 to 30 s, as shown in Figure 8. The less efficient transportation of glass balls out of the drum is found for the gully with the downward nozzle flow. Within the period of self-purification without falling glass ball, t = 30–60 s, the glass balls keep stirring within the drum flow and are randomly surged to traverse the streamlined bump in the exit pipe for each type of gully.
3.2. Experimental Results
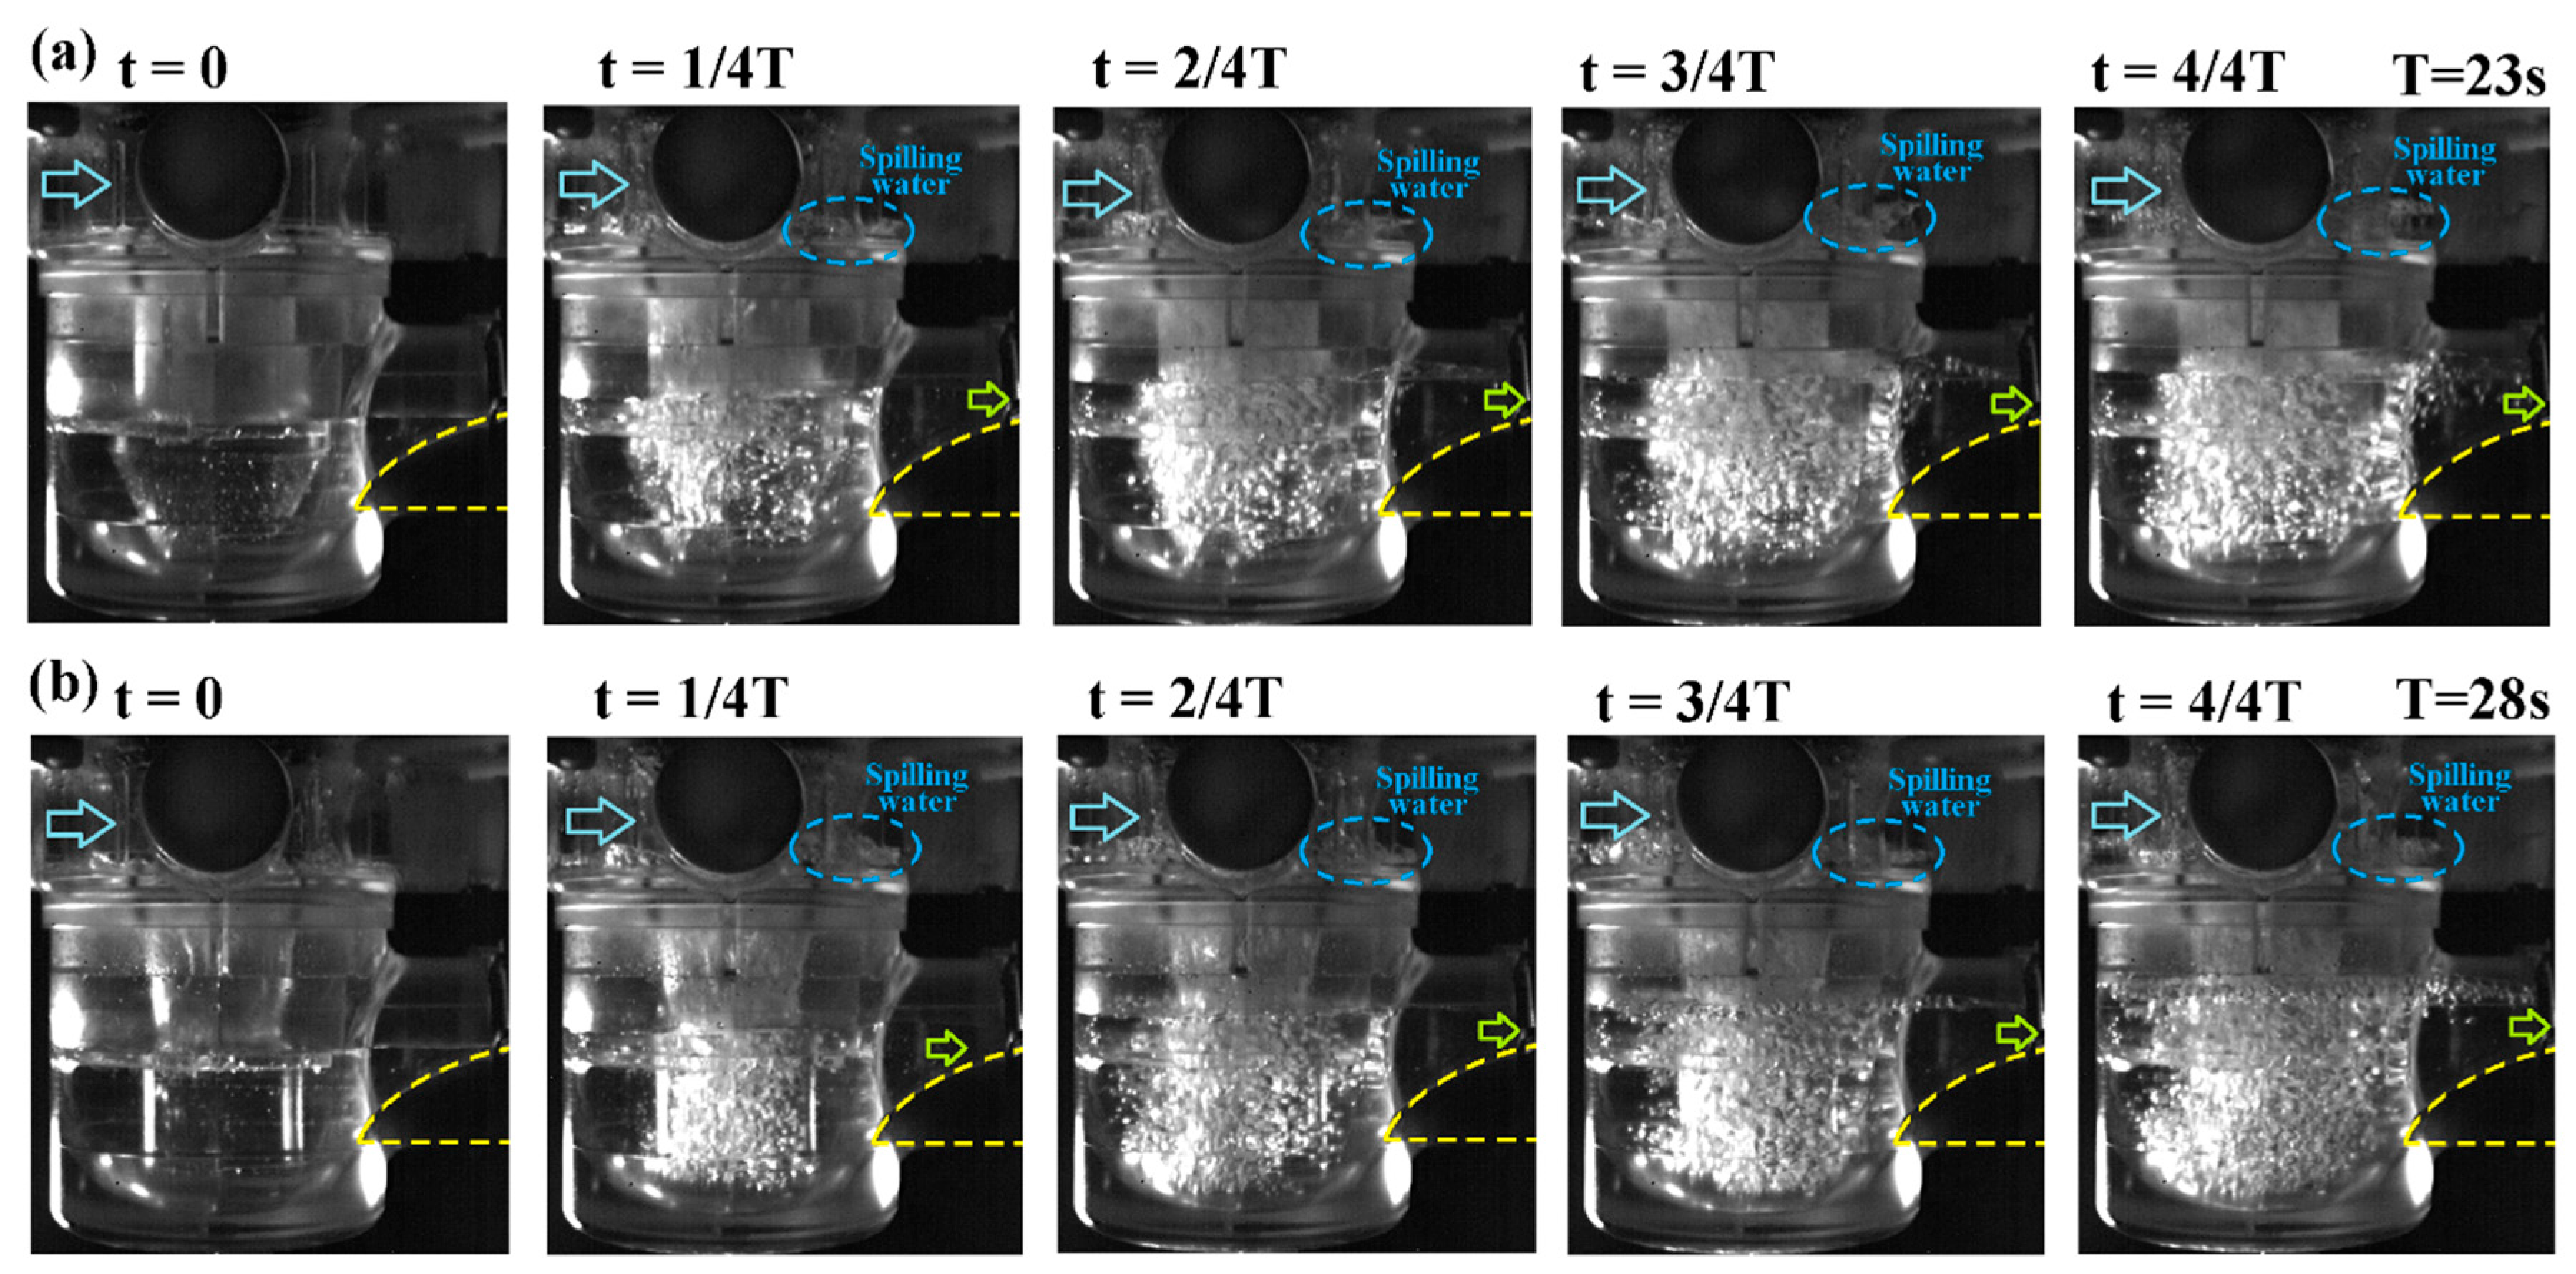
Initially, the air–water flow structures through the test gullies with beveled and downward nozzle flows at 0.6 L/s are examined by depicting the flow snapshots over the filling period, T, as shown in Figure 8. After feeding the water stream with dissolved air into each gully, the air bubbles are soon released among the negative pressure regions depicted in Figure 4 and Figure 5. The released air bubbles drift upward and are subsequently trapped within the gully drum from t = 0 to t = 3/4 T, as shown in Figure 8. As the stream-lined bump is fitted in the discharge pipe to maintain the water trap level above 50 mm, the low-momentum flow region with high static pressures is developed in front of the bump. While the water stream keeps surmounting the bump to flow out of each gully, the penetration of air-bubble into the low momentum region in front of the bump is prohibited, as shown in Figure 8. Thus, many air bubbles accumulate in the gully drum at the flow rate of 0.6 L/s. Further increase of the flow rate from 0.6 to 0.8 L/s to enrich the flow momentum can considerably moderate such air-bubble accumulation, which is demonstrated below. At time t, at 4/4 T, the air–water mixed flow fully fills the entire gully drum. Air bubbles then spread and drift on the free surface of the discharging water stream over the streamlined bump to flow out with the water flow. Clearly, the installation of the streamlined bump in the discharge pipe for reducing the gully height promotes the accumulation of air bubbles in the gully drum to add the form and frictional drags of the gully.
The purification performances of present test gullies with beveled and downward nozzle flows are examined by simultaneously feeding the water flow with 3000 glass balls in 30 s from the top entry of each gully. Figure 9 depicts the sequential flow snapshots detected from the gullies with beveled and downward nozzle flows at the water flow rate of 0.8 L/s.
As shown in Figure 9, the 3000 glass balls start falling into each test gully from t = 0 to t = 30 s, after which the water stream at the flow rate of 0.8 L/s keeps purging the accumulated glass balls in the drum until t = 35 s. As shown in Figure 9, the transportation of the glass ball out of the gully at t < 10 s with the flow rate of 0.8 L/s is not observed for both test gullies. Within this period, the glass balls accumulate at the drum bottom and the air-bubble densities seen in Figure 9 are increased from those depicted in Figure 8 with no falling glass ball. For the gully with beveled nozzle flow at t = 20 s shown in Figure 9a, the transport of glass balls across the surface of the streamlined bump emerge; however, there is no trace of glass-ball discharge for the gully with downward nozzle flow at this instant. It is interesting to note that the water–solid flow above the central nozzle of the gully with beveled nozzle discharge shown in Figure 9a at t = 20 s and 30 s are fully filled, while the space above the nozzle in the gully with downward nozzle discharge shown in Figure 9b at t = 20 s or 30 s is only partially filled by the water–solid flow. After stopping the feed of glass ball into each test gully at t > 30 s, the water stream keeps purging the glass balls out of the gully drum. At t = 35 s, most of the glass balls accumulated in the bottom drum of the gully with beveled nozzle discharge are purged out of the gully through the bump in the discharge pipe, as shown in Figure 9a. However, a considerable amount of glass balls remains in the drum of the gully with the downward nozzle discharge, as shown in Figure 9b. By comparing the flow snapshots at t = 35 s in Figure 9 with those detected at the flow rate of 0.6 L/s in Figure 8, the air-bubble densities in the drum of each test gully are considerably moderated by increasing the entry water flow rate to 0.8 L/s.
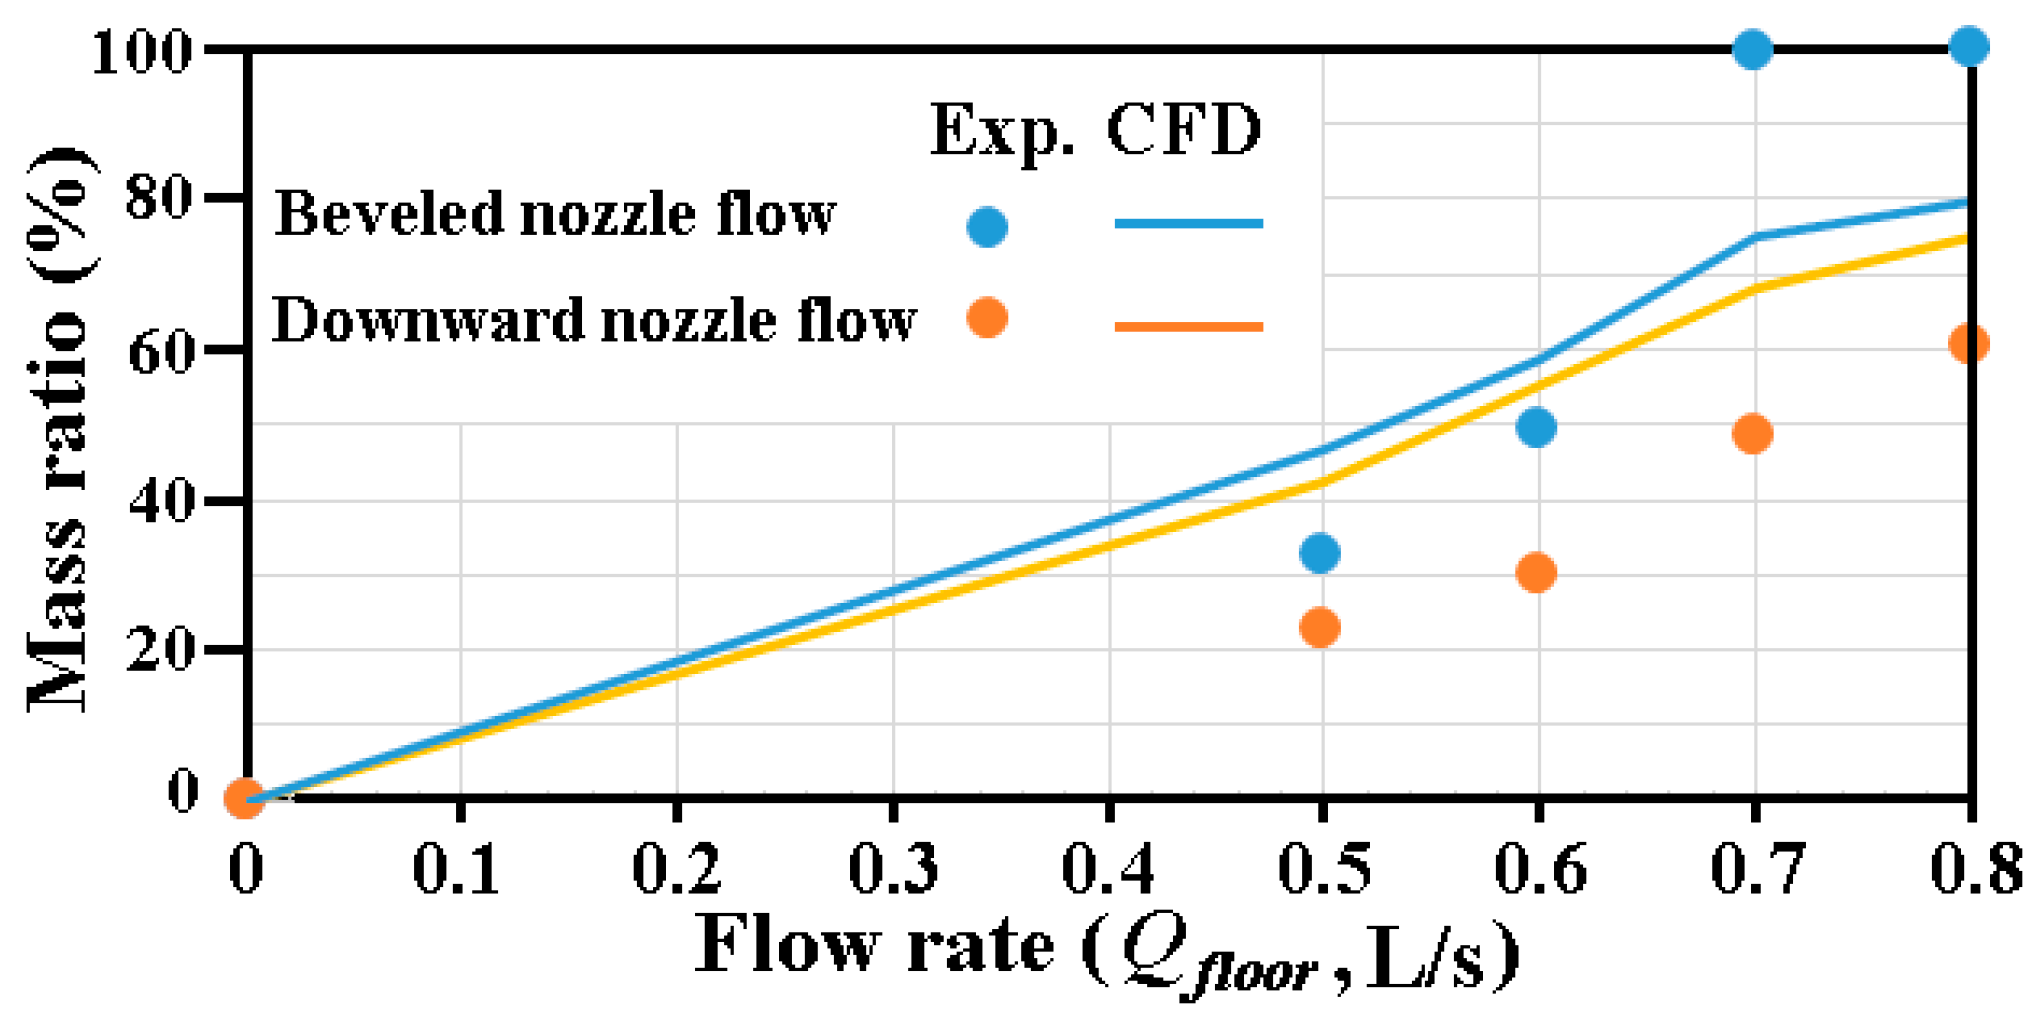
As reported in previous section, the index of the overall purification performance for each test gully is specified by the mass ratio between intercepted and supplied glass balls. Figure 10 depicts the variations of mass ratio between intercepted and supplied glass balls at = 0.5, 0.6, 0.7 and 0.8 L/s. The CFD predictions are also included in Figure 10.
As shown in Figure 10, the mass ratios between the intercepted and supplied glass balls measured from the gully with beveled nozzle flow are consistently higher than those for the gully with downward nozzle flow. For the gully with downward nozzle flow, the mass ratio steadily increases with the increase of flow rate. With beveled nozzle flow, the mass ratio jumps toward 100% at > 0.7 L/s, as shown in Figure 10. In this respect, present CFD predictions also capture such drastic increase of mass ratio at > 0.7 L/s for the gully with beveled nozzle flow in Figure 10. However, with the complex geometrical features and air–water–solid flows, the maximum discrepancies in the measured and predicted mass ratios for the gullies with beveled and downward nozzle flows are 21% and 35%, respectively.
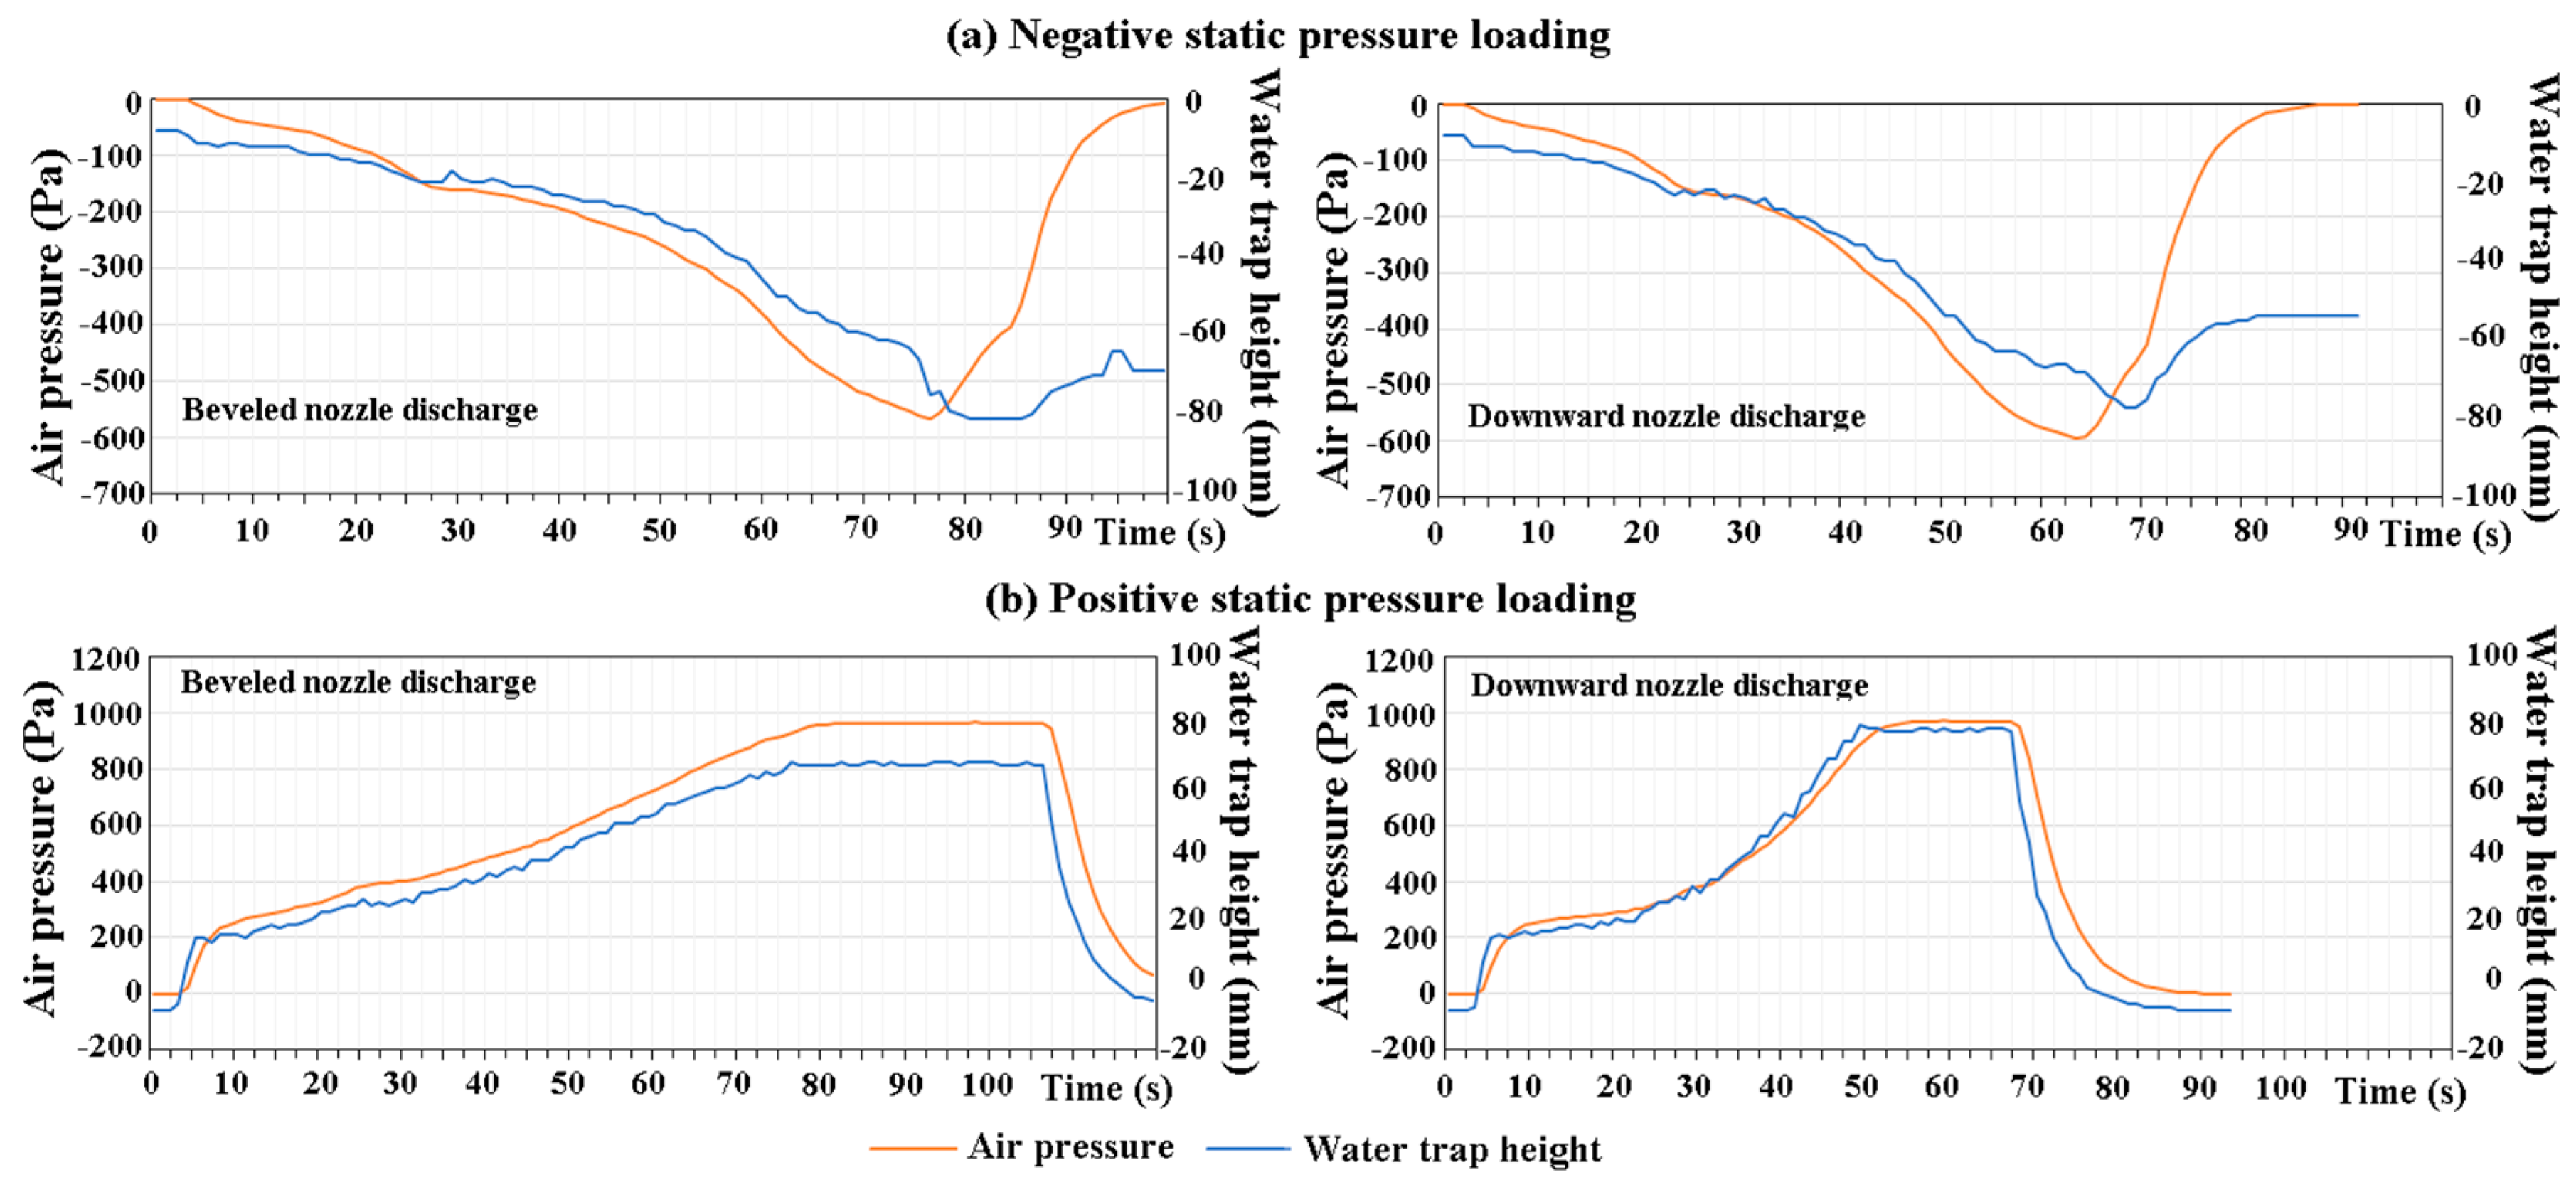
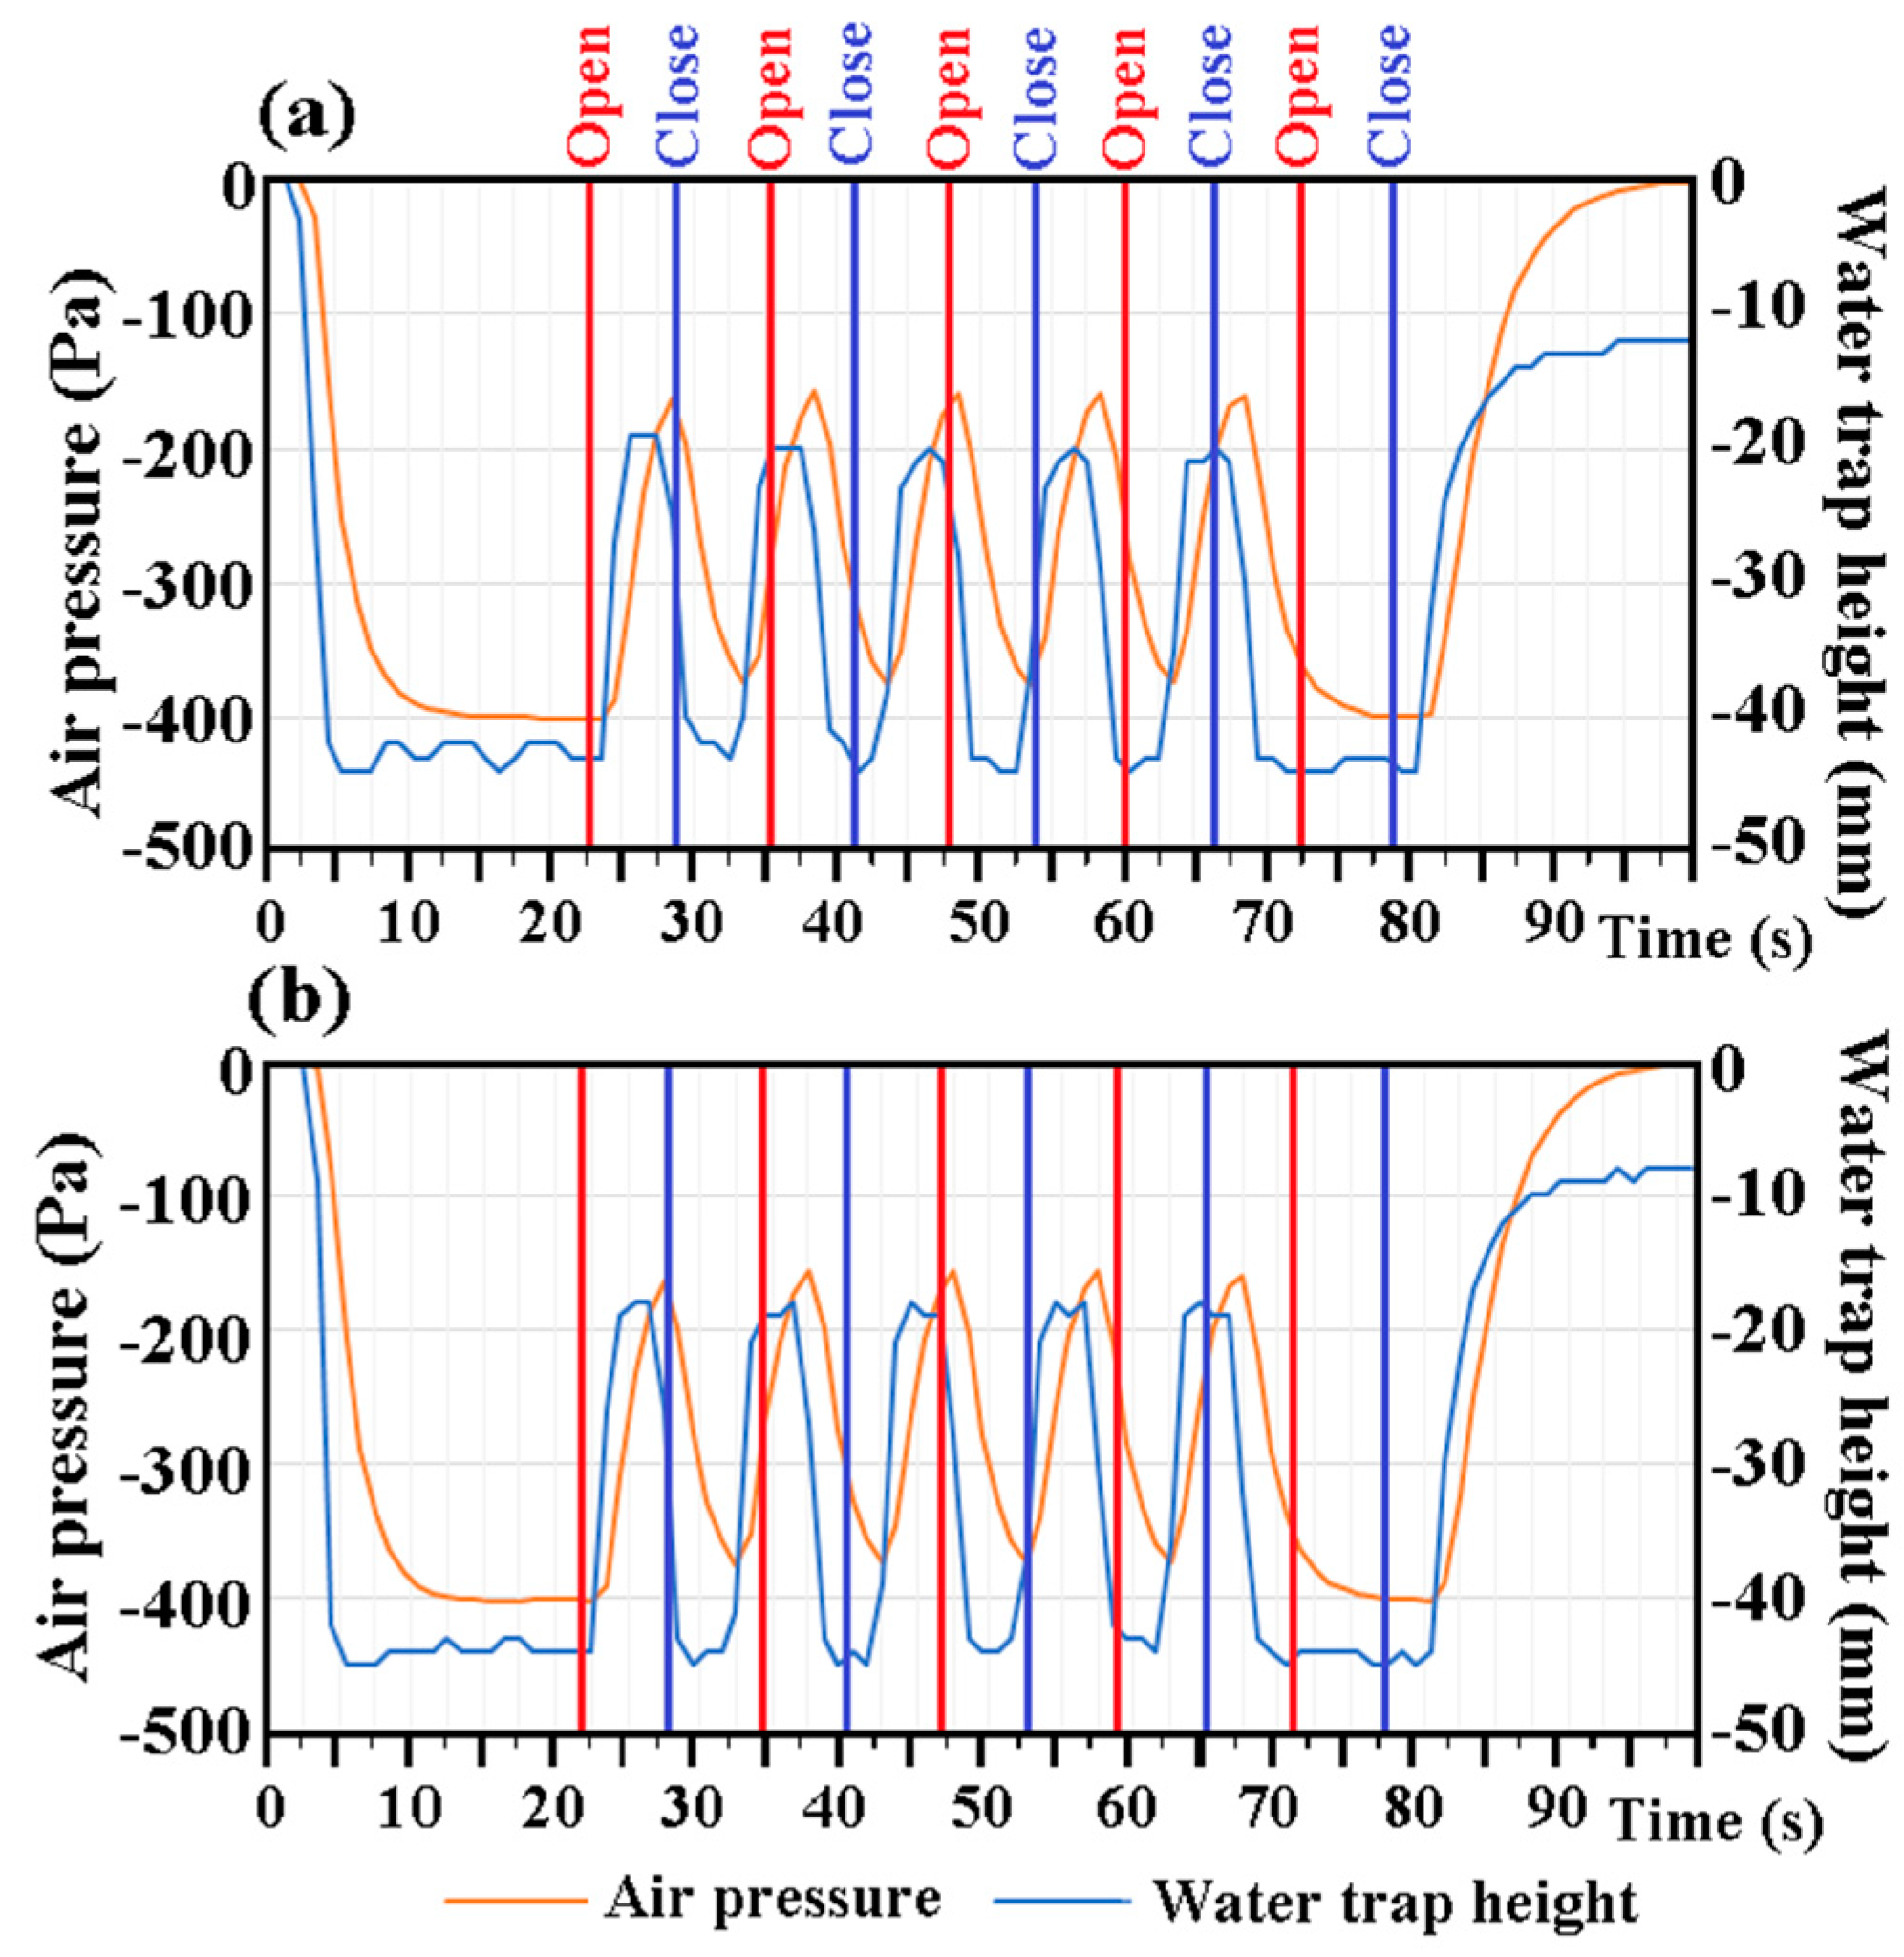
The measured dynamic responses of water trap level and air pressure in the gully drums with beveled and downward nozzle flows are compared in Figure 11. As indicated by the temporal variations of the air pressure and the corresponding water trap height shown in Figure 11, the lagging responses to opening and closing the vent valve are moderated for the water trap height in comparison with the air pressure. With the beveled and downward nozzle exits, the results shown in Figure 11a,b are quite similar, indicating the negligible impact of nozzle exit orientation on the sustainable dynamic pressure variations. Similarly, the sustainable water traps subject to the static positive and negative pressure loadings applied to the exit of the test gullies with beveled and downward nozzle exits exhibit similar results in Figure 12.
The range of sustainable static pressures with secured water trap in each of present test gully is between −550 Pa and 900 Pa. Upon the instant of water-trap break-down due to the extreme negative pressures at the exit port of the test gullies, the detected air pressures shown in Figure 12a soon arise, an event that is followed by the lagging increase of water-trap height. However, when the water-trap break-down is caused by the extreme positive pressure at the gully exit, the diminished water trap height and air pressure tend to take place at similar instances, as shown in Figure 12b.
Finally, the maximum flow rates measured by providing the constant water head of 20 mm above each test gully with different flow entry conditions using the test facilities shown in Figure 2b are summarized in Table 3.
With this type of flow rate measurements, the test gully is submerged in the water tank with 20 mm water head above the top entry of the test gully. Thus, the air-entrainment by the partially-filled water stream through the entry pipe(s) is minimized. The maximum flow rate mainly responds to the flow resistances caused by the water flows. For the present gully with the beveled nozzle exit of the smaller discharge area, the change of flow momentum at the nozzle exit due to variations of both fluid velocity magnitude and flow direction incur a higher degree of pressure drops from the driven water head of 20 mm. Thus, the maximum flow rates measured at the different flow entry conditions for the gully with the beveled nozzle flow are generally less than those detected from the gully with the downward nozzle flow as compared in Table 2. In particular, with the twin-entry flow conditions, the permissible water flow rates for and with the gully of beveled nozzle exit are noticeably less than those found for the gully with downward nozzle exit. As the beveled nozzle discharge provides the better purification performances, the further increase of maximum flow rates for this type of shallow gully is recommended to moderate the change of fluid velocities at the beveled nozzle exit.
4. Conclusions
As an attempt to devise the shallow gullies for a drainage system, a stream-lined bump is installed in the discharge pipe to maintain the minimum water trap height of 50 mm. The research results are applicable to the trapped floor gullies which mainly convey domestic wastewater inside buildings. Along with the beveled nozzle exit, the discharges of water–air–solid flow at the predefined driven pressure heads are assured. The hydrodynamic characteristics of the air–water–solid flows in the shallow gullies with the beveled and downward nozzle exits are experimentally and numerically examined with the following salient points emerging:
- The weak momentum flow region in front of the streamlined bump in the discharge pipe of each type of test gullies formulates an obstacle for air-bubble transportations out of the gullies. A considerable amount of trapped air-bubbles in the gully drum undermines the transportation of glass balls out of the gully.
- The mass ratios between the intercepted and supplied glass balls for both test gullies keep increasing by increasing the water flow rate to enhance the flow momentum. With the higher flow momentum for the beveled nozzle flow toward the exit pipe, the mass ratios between the intercepted and supplied glass balls for the gully with the beveled nozzle exit are consistently higher than those found for the gully with the downward nozzle exit. With the enhanced air-bubble discharges at the flow rate above 0.7 L/s, the mass ratio between the intercepted and supplied glass balls increases drastically for the gully with the beveled nozzle.
- The impacts of nozzle configuration on the sustainable static and dynamic pressure loadings for present type of shallow gullies with the streamlined bump in the exit pipe are not noticeable.
- With diminished air-bubble effects and constant water head of 20 mm, the gully with downward nozzle exit exhibits the higher flow rates. Justified by the superior purification performance for the shallow gully with the beveled nozzle exit, the moderation of velocity gradients at the nozzle exit is recommended for boosting the maximum flow rate.
Acknowledgments
This research project was supported by the grant from Cu golden power products, Inc., Taiwan.
Author Contributions
Shyy Woei Chang was the principal investigator, and conceived and designed this study. Der-Chang Lo performed the analysis of computational fluids dynamics. Hsin-Feng Liu and Chao-Yan Chen conducted the experiments. Shyy Woei Chang, Der-Chang Lo and Chao-Yan Chen analyzed the results. Hsin-Feng Liu contributed the test facilities. Shyy Woei Chang wrote the paper.
Conflicts of Interest
The authors declare no conflict of interest.
Nomenclature
| English Symbols | |
| A | fractional area open to flow (m2) |
| f | volumetric source of external force vector (N m−3) |
| g | gravitational acceleration (m s−2) |
| h | grid interval (m) |
| P | pressure (N m−2) |
| total volume flow rate through gully (m3 s−1) | |
| u | fluid velocity vector (m s−1) |
| particle diffusion velocity vector (m s−1) | |
| VF | fractional volume open to flow (m3) |
| u, v, w | fluid velocity component in x, y, z directions (m s−1) |
| x, y, z | orthogonal coordinates (m) |
| Greek symbols | |
| α | drag coefficient per particle mass (s−1) |
| β | drag coefficient per particle mass (s−1) |
| μ | Fluid viscosity (kg m−1 s−1) |
| ρ | Fluid density (kg m−3) |
| Subscripts | |
| p | particle |
References
- Chang, S.W.; Hsieh, C.-M.; Lin, C.Y.; Liou, H.-F. Air-water drainage flow through finned bend. J. Asian Archit. Build. Eng. 2012, 11, 177–184. [Google Scholar] [CrossRef]
- Swaffield, J.A.; Jack, L.B.; Campbell, D.P. Control and suppression of air pressure transients in building drainage and vent systems. Build. Environ. 2004, 39, 783–794. [Google Scholar] [CrossRef]
- Swaffield, J.A.; Campbell, D.P. Air pressure transient propagation in building drainage vent systems, an application of unsteady flow analysis. Build. Environ. 1992, 27, 357–365. [Google Scholar] [CrossRef]
- Swaffield, J.A.; Campbell, D.P. The simulation of air pressure propagation in building drainage and vent system. Build. Environ. 1995, 30, 115–127. [Google Scholar] [CrossRef]
- Swaffield, J.A.; Ballanco, J.; McDougall, J.A. Pressure surge in building utility services exacerbated by the presence of trapped or entrained air. Build. Serv. Eng. Res. Technol. 2002, 23, 179–196. [Google Scholar] [CrossRef]
- Mao, Z.; Xiao, H.; Liu, Y.; Hu, Y. Numerical simulation of transient flow in horizontal drainage systems. Water Sci. Eng. 2009, 2, 74–85. [Google Scholar]
- Mui, K.W.; Wong, L.T. Modelling occurrence and duration of building drainage discharge loads from random and intermittent appliance flushes. Build. Serv. Eng. Res. Technol. 2012, 34, 381–392. [Google Scholar] [CrossRef]
- Wong, E.S.W.; Chan, D.W.T.; Zhu, Z. Fluctuation behaviors of air pressure in a high-rise building drainage system. ASCE J. Archit. Eng. 2011, 17, 82–84. [Google Scholar] [CrossRef]
- Gormley, M. Air pressure transient generation as a result of falling solids in building drainage stacks: Definition, mechanisms and modelling. Build. Serv. Eng. Res. Technol. 2007, 28, 55–70. [Google Scholar] [CrossRef]
- Campbell, D.P. Experimental application of particle imaging to fluid velocity analysis in building drainage systems. Build. Serv. Eng. Res. Technol. 2011, 32, 263–275. [Google Scholar] [CrossRef]
- Gormley, M.; Swaffield, J.A.; Sleigh, P.A.; Noakes, C.J. An assessment of, and response to, potential cross-contamination routes due to defective appliance water trap seals in building drainage systems. Build. Serv. Eng. Res. Technol. 2011, 33, 203–222. [Google Scholar] [CrossRef]
- Jean, N.J.; Gormley, M. Modelling water trap seal boundary conditions in building drainage systems: Computational fluid dynamics analysis of unsteady friction to improve accuracy. Build. Serv. Eng. Res. Technol. 2017, 38, 580–601. [Google Scholar] [CrossRef]
- Wright, G.B.; Swaffield, J.A.; Arthur, S. The performance characteristics of multi-outlet siphonic rainwater systems. Build. Serv. Eng. Res. Technol. 2002, 23, 127–141. [Google Scholar] [CrossRef]
- Wright, G.B.; Arthur, S.; Swaffield, J.A. Numerical simulation of the dynamic operation of multi-outlet siphonic roof drainage systems. Build. Environ. 2006, 41, 1279–1290. [Google Scholar] [CrossRef]
- Chang, S.W.; Lo, D.C. Chapter 6 Air-Water Two-Phase Flows with Applications to Drainage System. In Advances in Multiphase Flow and Heat Transfer, 2nd ed.; Bentham Science Publishers Ltd.: Sharjah, the United Arab Emirates, 2009; pp. 176–215. [Google Scholar]
- Chang, S.W.; Lo, D.-C.; Liou, H.-F.; Liou, J.S. Hydrodynamic performances of gully with air-water flows in drainage system. J. Water Resour. Supply Drain. Build. 2014, 1, 1–19. [Google Scholar]
- Lo, D.-C.; Liou, J.-S.; Chang, S.W. Hydrodynamic performances of air-water flows in gullies with and without swirl generation vanes for drainage systems of buildings. Water 2015, 7, 679–696. [Google Scholar] [CrossRef]
- Yang, G.Q.; Du, B.; Fan, L.-S. Bubble formation and dynamics in gas–liquid–solid fluidization—A review. Chem. Eng. Sci. 2007, 62, 2–27. [Google Scholar] [CrossRef]
- Qin, Z.; Suckale, J. Direct numerical simulations of gas–solid–liquid interactions in dilute fluids. Int. J. Multiph. Flow 2017, 96, 34–47. [Google Scholar] [CrossRef]
- Baltussen, M.W.; Kuipers, J.A.M.; Deen, N.G. Direct numerical simulation of effective drag in dense gas–liquid–solid three-phase flows. Chem. Eng. Sci. 2017, 158, 561–568. [Google Scholar] [CrossRef]
- Kim, J.H.; Simon, T.W.; Viskanta, R. Journal of heat transfer policy on reporting uncertainties in experimental measurements and results. ASME J. Heat Transf. 1993, 115, 5–6. [Google Scholar] [CrossRef]
- Hirt, C.W.; Nichols, B.D. Volume of fluid (VOF) method for free boundaries. J. Comput. Phys. 1981, 39, 201–225. [Google Scholar] [CrossRef]
Figure 1.
Test gullies with the convergent nozzle of: (a) beveled discharge; and (b) vertical discharge.
Figure 1.
Test gullies with the convergent nozzle of: (a) beveled discharge; and (b) vertical discharge.
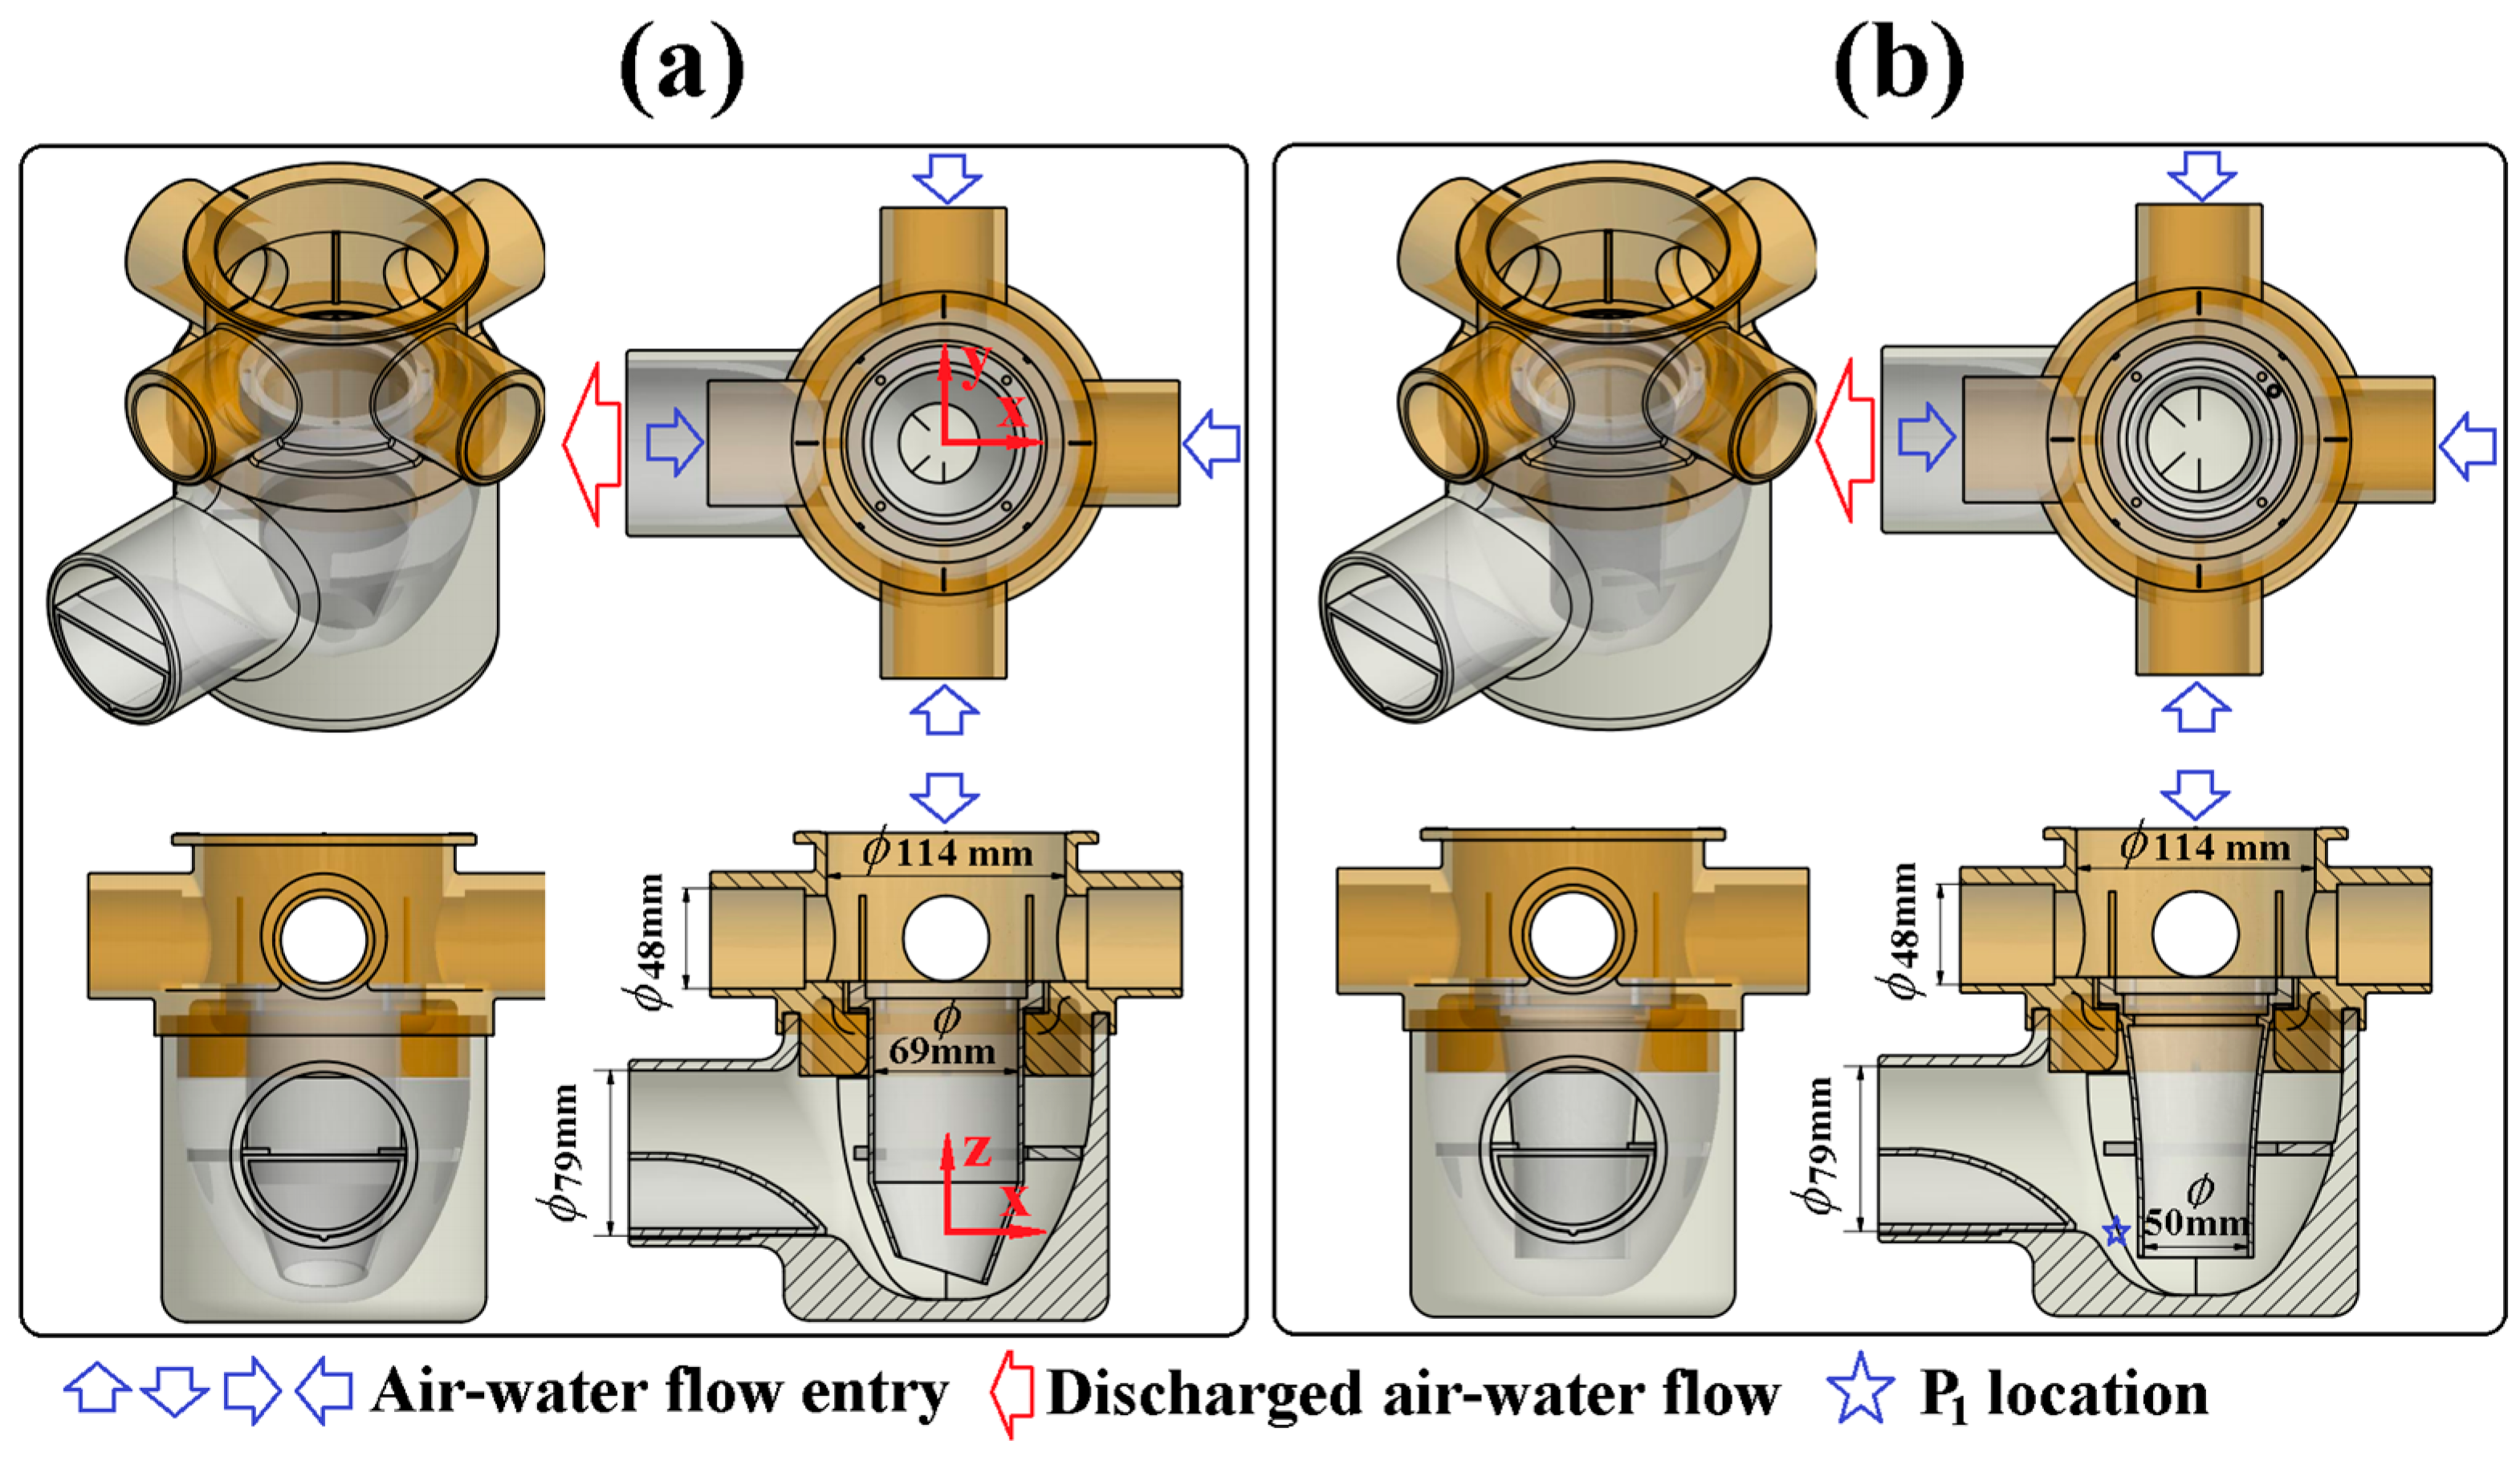
Figure 2.
Experimental facilities for testing: (a) sustainable positive and negative pressures at steady and unsteady conditions; (b) maximum flow rate; and (c) self-purification performance.
Figure 2.
Experimental facilities for testing: (a) sustainable positive and negative pressures at steady and unsteady conditions; (b) maximum flow rate; and (c) self-purification performance.
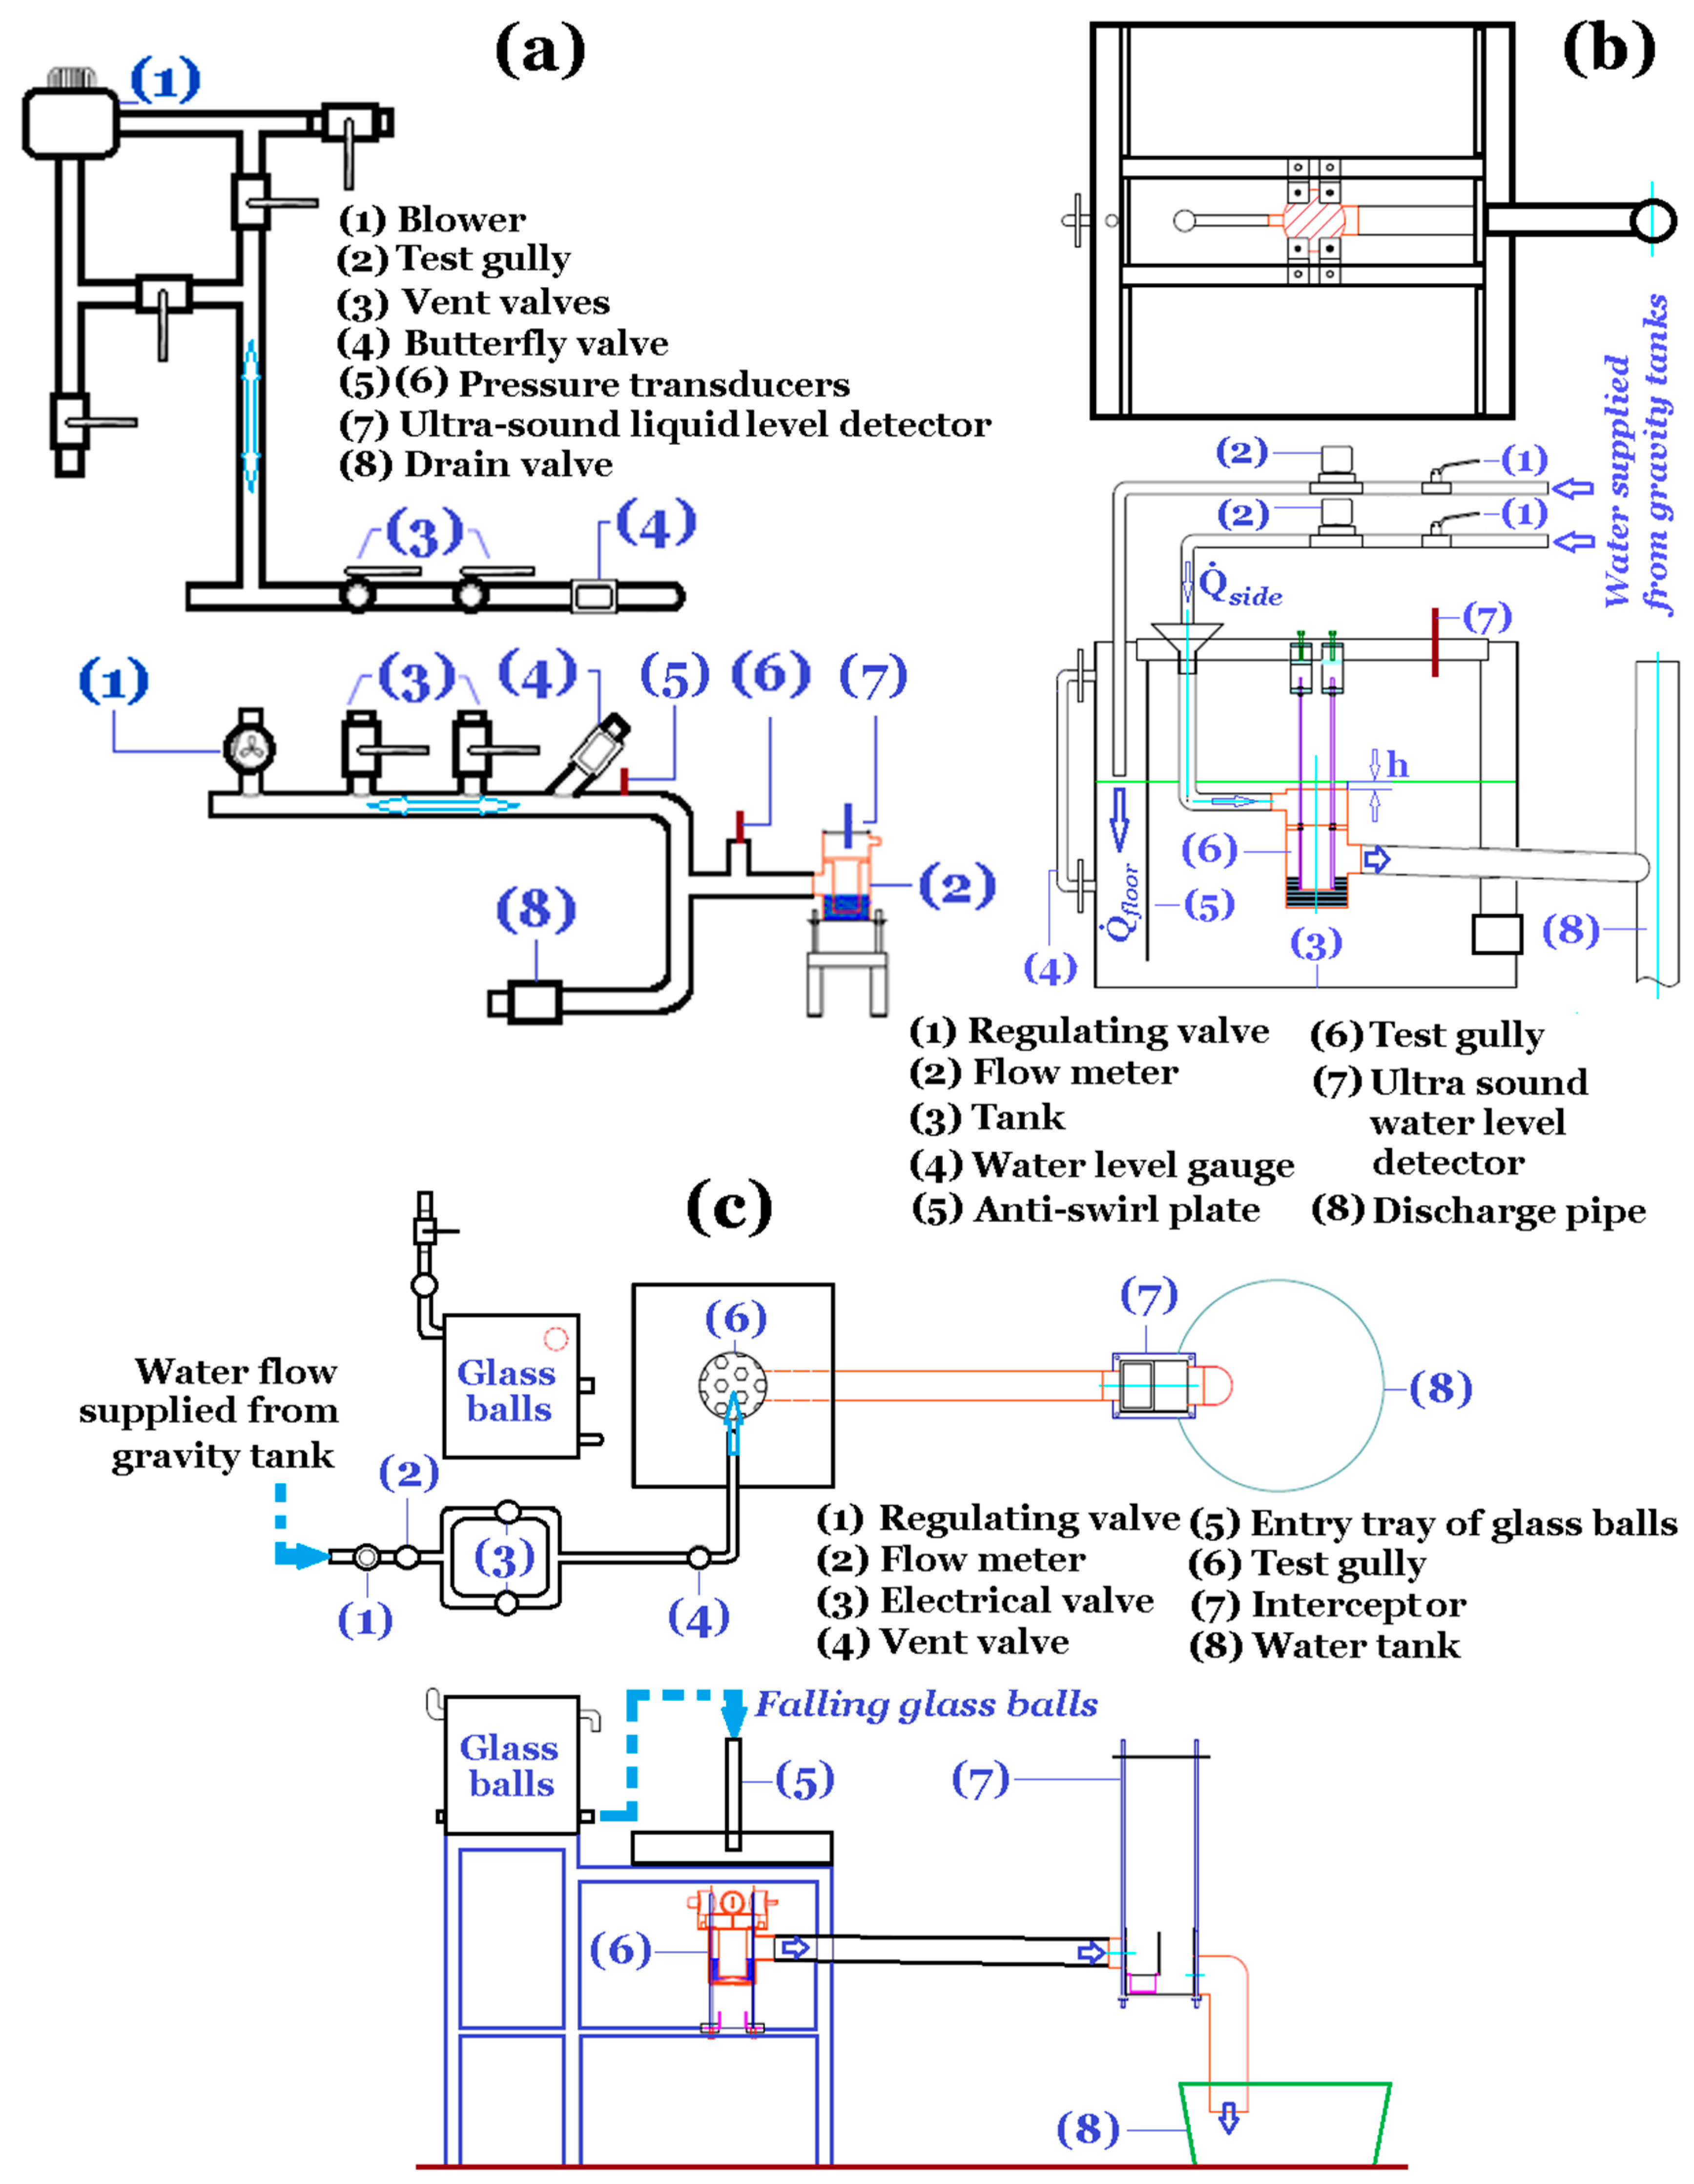
Figure 3.
(a) Simulated temporal u, v, and w variations at location P2 using the grids of h = 4 and 5 mm; and (b) comparisons of water level elevation from drum bottom at water flow rates of 0.4, 0.5, 0.6, 0.7 and 0.8 L/s between numerical predictions and experimental measurements.
Figure 3.
(a) Simulated temporal u, v, and w variations at location P2 using the grids of h = 4 and 5 mm; and (b) comparisons of water level elevation from drum bottom at water flow rates of 0.4, 0.5, 0.6, 0.7 and 0.8 L/s between numerical predictions and experimental measurements.

Figure 4.
Distributions of velocity and static-pressure at t = 2, 4, 6, 10 s on: (a) z = 0; and (b) x = 0 planes for test gully with beveled nozzle flow with = 0.6 L/s.
Figure 4.
Distributions of velocity and static-pressure at t = 2, 4, 6, 10 s on: (a) z = 0; and (b) x = 0 planes for test gully with beveled nozzle flow with = 0.6 L/s.

Figure 5.
Distributions of velocity and static-pressure at t = 2, 4, 6, 10 s on: (a) z = 0; and (b) x = 0 planes for test gully with downward nozzle flow with = 0.6 L/s.
Figure 5.
Distributions of velocity and static-pressure at t = 2, 4, 6, 10 s on: (a) z = 0; and (b) x = 0 planes for test gully with downward nozzle flow with = 0.6 L/s.
Figure 6.
Temporal variations of glass ball transportation through gully with beveled nozzle flow at entry water flow rate of 0.6 L/s.
Figure 6.
Temporal variations of glass ball transportation through gully with beveled nozzle flow at entry water flow rate of 0.6 L/s.

Figure 7.
Temporal variations of glass ball transportation through gully with downward nozzle flow at entry water flow rate of 0.6 L/s.
Figure 7.
Temporal variations of glass ball transportation through gully with downward nozzle flow at entry water flow rate of 0.6 L/s.
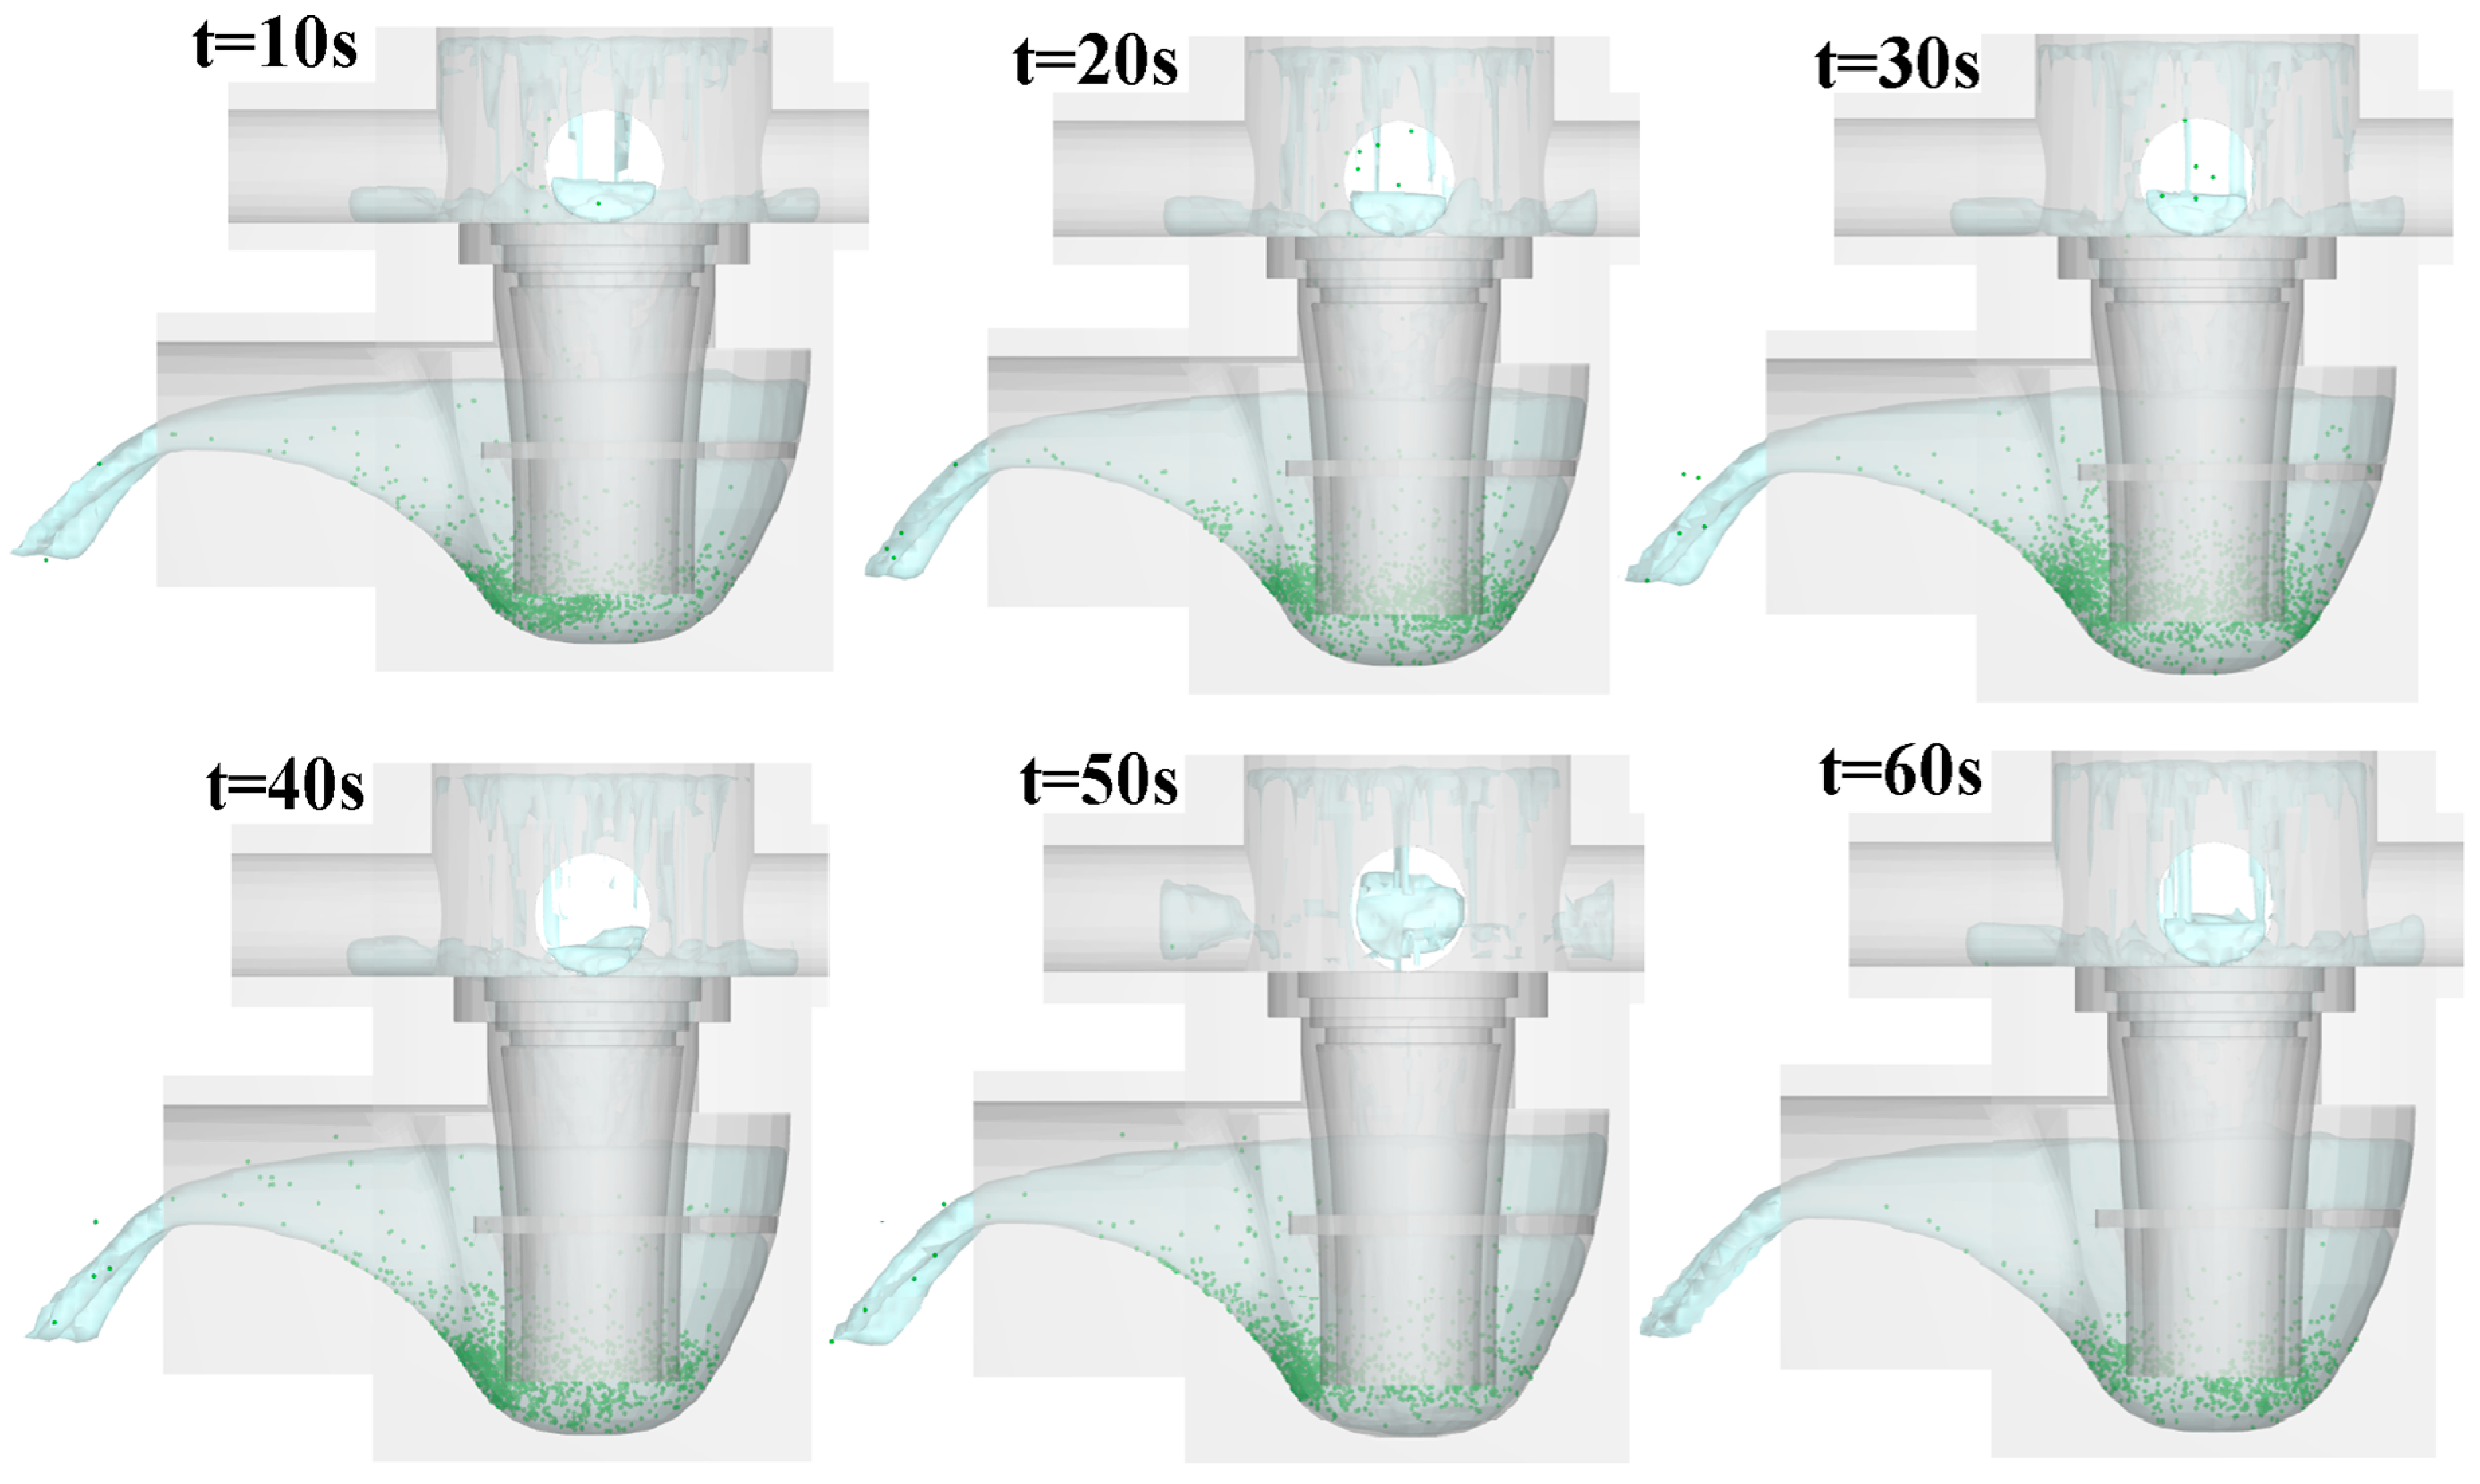
Figure 8.
Flow snapshots for gullies with: (a) beveled; and (b) downward nozzle flows at 0.6 L/s.

Figure 9.
Flow snapshots for glass ball transportation through gullies with: (a) beveled; and (b) downward nozzle flows at 0.8L/s.
Figure 9.
Flow snapshots for glass ball transportation through gullies with: (a) beveled; and (b) downward nozzle flows at 0.8L/s.
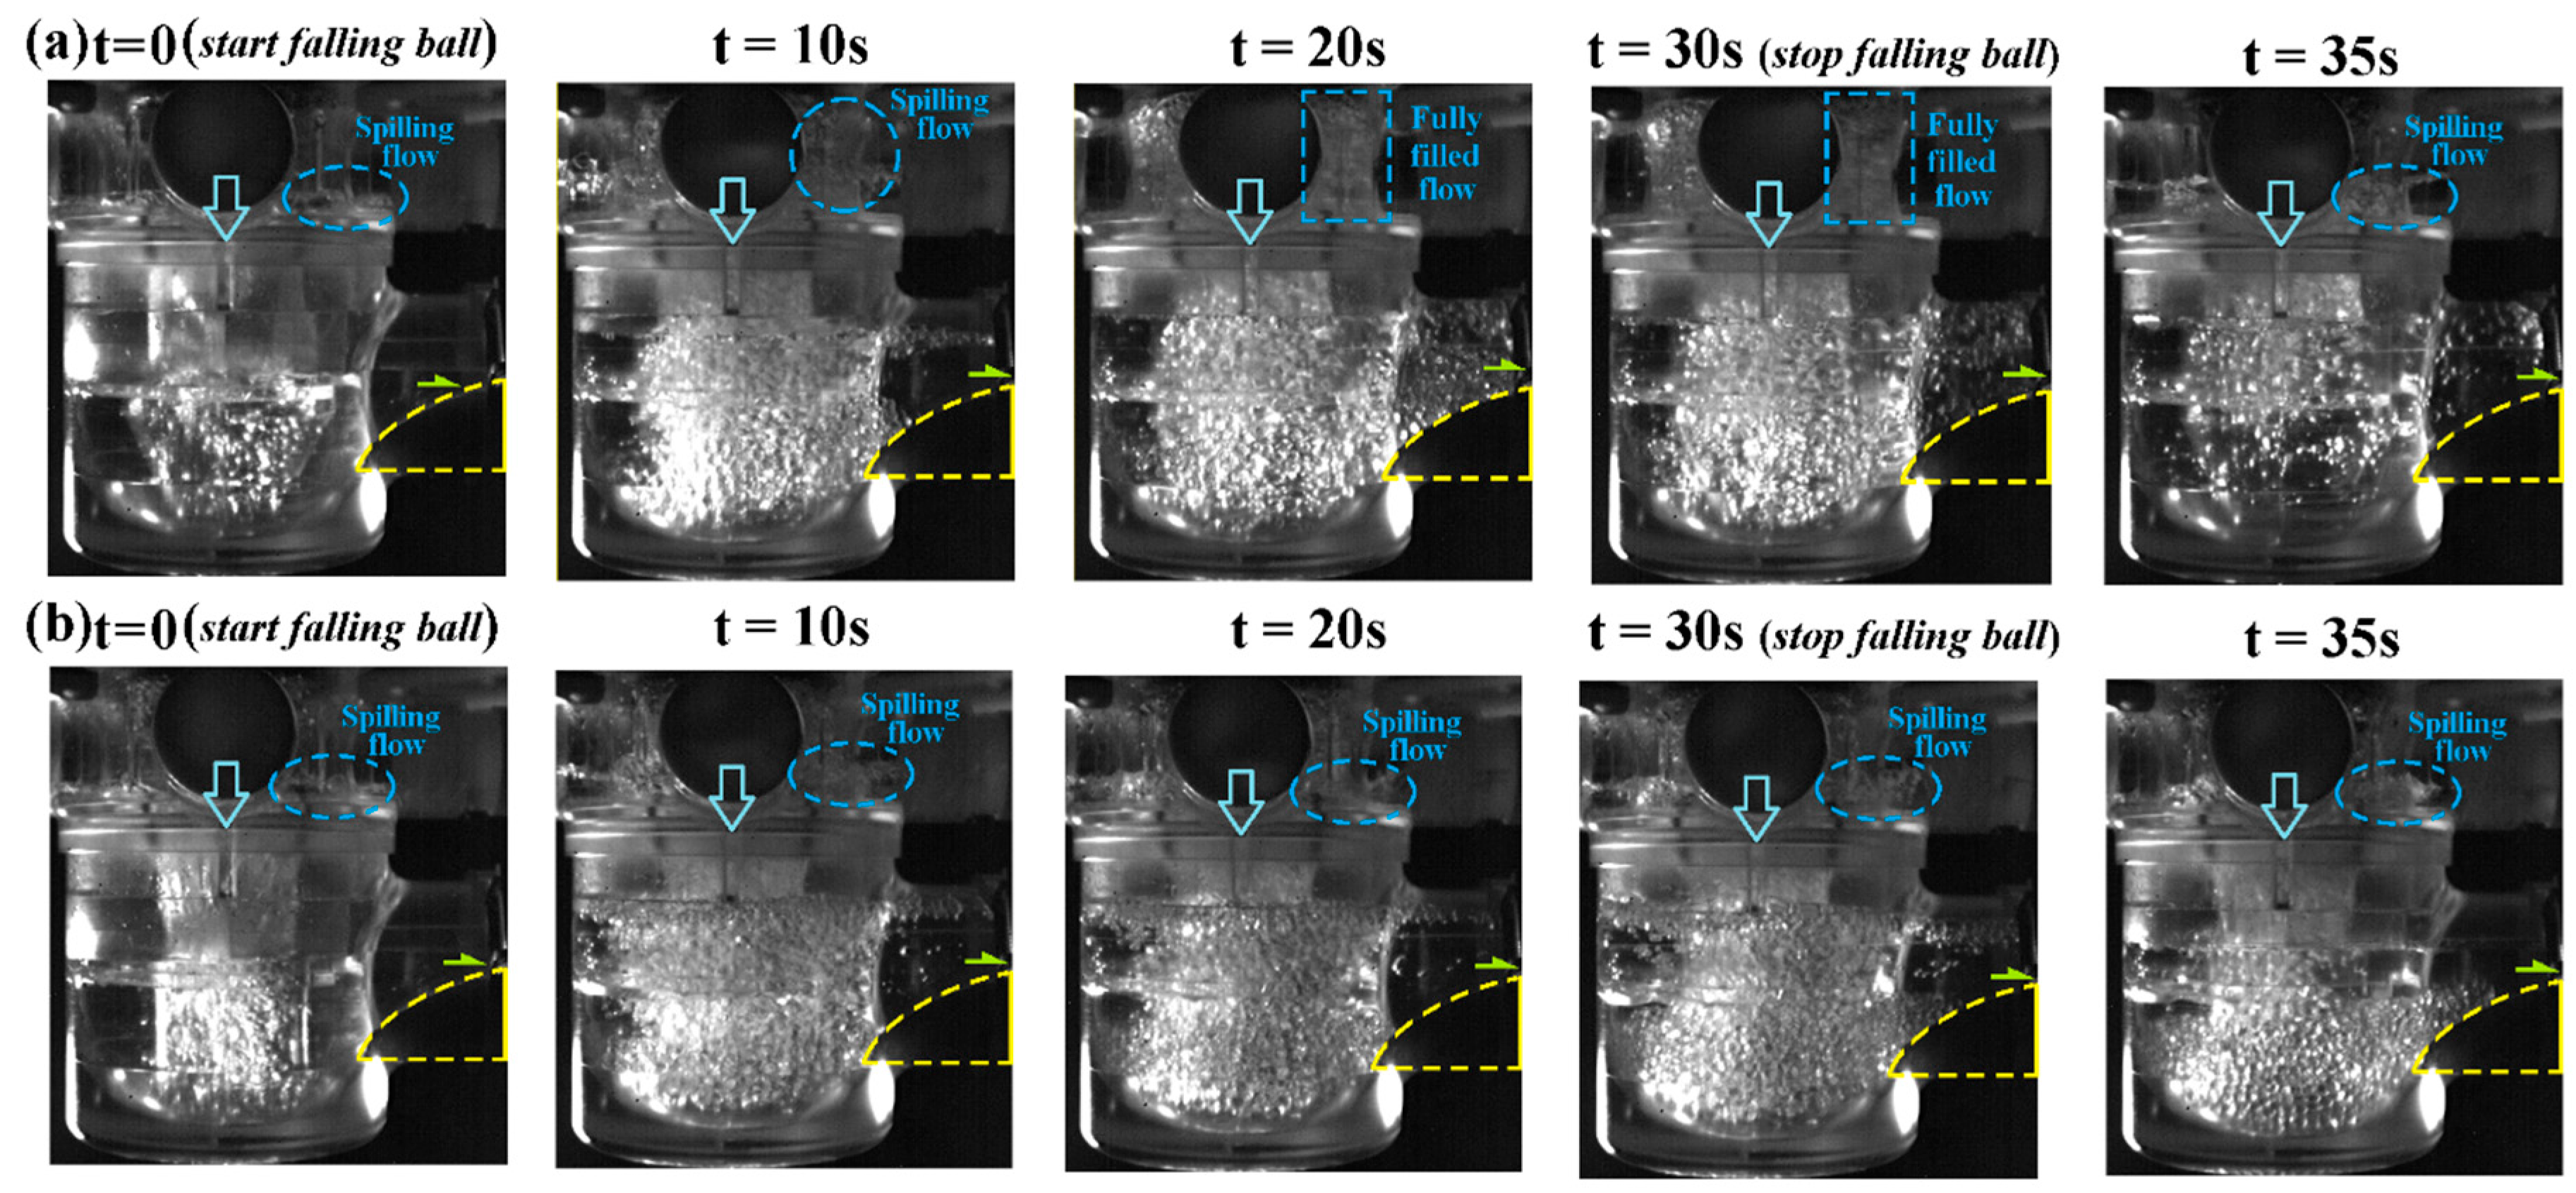
Figure 10.
Variations of mass ratio between intercepted and supplied glass balls against .

Figure 11.
Temporal variations of water trap level and air pressure in gully drums with (a) beveled and (b) downward nozzle flows.
Figure 11.
Temporal variations of water trap level and air pressure in gully drums with (a) beveled and (b) downward nozzle flows.
Figure 12.
Temporal variations of air pressure and water trap height at: (a) positive; and (b) negative pressure loadings for test gullies with beveled and downward nozzle exits.
Figure 12.
Temporal variations of air pressure and water trap height at: (a) positive; and (b) negative pressure loadings for test gullies with beveled and downward nozzle exits.

Table 1.
Experimental and numerical test conditions.
| Type of Tests | Test Conditions | |
|---|---|---|
| Experiment | CFD | |
| Sustainable pressures | ˇ(Tested) | |
| Flow structures | 0.6, 0.8 L/s | 0.6, 0.8 L/s |
| Maximum flow rate | ˇ(Tested) | |
| Self-purification | 0.5, 0.6, 0.7, 0.8 L/s | 0.5, 0.6, 0.7, 0.8 L/s |
Table 2.
Properties of the solid particles for Computational Fluid Dynamics (CFD) simulations.
| Diameter | Density | Number of Particles | Duration of Falling Particles into Gully |
|---|---|---|---|
| 5 mm | 2500 kg/m3 | 3000 | 0–30 s |
Table 3.
Maximum flow rates with various entry conditions.
| Flow Entry Condition | Gully with Beveled Nozzle Exit | Gully with Downward Nozzle Exit |
|---|---|---|
| (L/s) | 1.12 | 1.51 |
| (L/s) | ≥0.92 | ≥0.89 |
| (L/s) | ≥0.86 | ≥0.89 |
| (L/s) | ≥0.84 | ≥0.96 |
| (L/s) | ≥0.88 | ≥0.86 |
| + (L/s) | = 0.8, = 0.22 | = 0.8, = 0.52 |
| + (L/s) | = 0.8, = 0.09 | = 0.8, = 0.39 |
© 2018 by the authors. Licensee MDPI, Basel, Switzerland. This article is an open access article distributed under the terms and conditions of the Creative Commons Attribution (CC BY) license (http://creativecommons.org/licenses/by/4.0/).
Share and Cite
MDPI and ACS Style
Lo, D.-C.; Chang, S.W.; Liu, H.-F.; Chen, C.-Y. Experimental and Numerical Study of Hydrodynamic Characteristics of Gullies for Buildings. Water 2018, 10, 165. https://doi.org/10.3390/w10020165
AMA Style
Lo D-C, Chang SW, Liu H-F, Chen C-Y. Experimental and Numerical Study of Hydrodynamic Characteristics of Gullies for Buildings. Water. 2018; 10(2):165. https://doi.org/10.3390/w10020165
Chicago/Turabian StyleLo, Der-Chang, Shyy Woei Chang, Hsin-Feng Liu, and Chao-Yan Chen. 2018. "Experimental and Numerical Study of Hydrodynamic Characteristics of Gullies for Buildings" Water 10, no. 2: 165. https://doi.org/10.3390/w10020165
Note that from the first issue of 2016, this journal uses article numbers instead of page numbers. See further details here.