Removal of Nutrients, Sediment, and Heavy Metals by a Stormwater Treatment Train; a Medium-Density Residential Case Study in Southeast Queensland

1
Drapper Environmental Consultants (DEC), 12 Treetops Avenue, Springfield Lakes 4300, QLD, Australia
2
SPEL Environmental (SPEL), 96 Cobalt St, Carole Park 4300, QLD, Australia
*
Author to whom correspondence should be addressed.
†
These authors contributed equally to this work.
Water 2018, 10(10), 1307; https://doi.org/10.3390/w10101307
Submission received: 18 July 2018
/
Revised: 7 September 2018
/
Accepted: 21 September 2018
/
Published: 22 September 2018
(This article belongs to the Special Issue Stormwater Quality: Modelling, Monitoring, Risk Assessment and Remidiation)
Abstract
:Urban stormwater runoff from a medium-density residential development in southeast Queensland has been monitored in the field since November 2013. A treatment train installed on the site includes rainwater tanks collecting roofwater, 200-micron mesh baskets installed in grated gully pits, and two 850-mm-high media filtration cartridges installed in an underground 4-m3 vault. The site has been monitored over a 4.5-year period. Removal efficiencies were observed at this site for the regulated pollutants; the corresponding values for total suspended solids (TSS), total phosphorus (TP), and total nitrogen (TN) for the pit baskets were 61%, 28%, and 45%, respectively. The cartridge filters removed 78% of TSS, 59% of TP, 42% of TN, 40% of total copper, and 51% of total zinc. As the measured influent TSS and TP concentrations to the cartridge filters were low when compared to industry guidelines, the U.S. field dataset was truncated to anticipated guideline levels, confirming results at 90% for TSS and 76% for TP. The total gross pollutant generation rate from the medium-density residential catchment was observed to be 0.24 m3/Ha/year, with a corresponding air-dried mass of 142.5 kg/Ha/year. Less than 2% of the gross pollutant mass was anthropogenic. This paper concludes that the treatment train, and in particular the media filter, provides good removal of total copper and total zinc as well as TSS, TP, and TN from urban stormwater runoff, with higher inlet concentrations producing better performance. Field test data from 58 months of operation and standard maintenance suggests that breakthrough of TSS and TP has not occurred yet.

1. Introduction
Sustainable urban drainage system (SuDS) national standards and statutory approval bodies (SABs) were mandated in the United Kingdom by the Flood and Water Act in 2010 [1]. Planning policies in Australia since 2000 have sought to implement similar treatment systems, termed water sensitive urban design (WSUD), to achieve typical annual pollutant load reductions of 80% for total suspended solids (TSS), 60% for total phosphorus (TP), and 45% for total nitrogen (TN) [2,3]. The E.U. Water Framework Directive (2000/60/EC) requires that all emissions to water be identified, quantified, and managed [4]. Removal of sediment, nutrients, and heavy metals from runoff originating from urban areas, roads, and roof surfaces to achieve these objectives is often required since they contribute to the eutrophication of receiving waterways. Leaves, organic matter, coarse sediment, and anthropogenic litter found in urban runoff are typically defined as gross pollutants. Anthropogenic litter can consist of 20% to 80% of the overall volume of gross pollutants. Whilst many options exist for providing treatment to urban runoff from manufactured devices to green assets, scientific investigation of manufactured systems in the field appears limited [5,6,7,8,9,10].
A manufactured stormwater treatment train was implemented within a medium-density urban residential development in Ormiston, Southeast Queensland. A series of field-based tests were performed on the system, including flow-weighted water quality sampling, measurement of annual gross pollutant loads, and nutrient content analysis of captured pollutants. Data from over 4.5 years of field monitoring have been collated. The treatment train incorporates rainwater tanks, pit basket inserts, and media filters inside a detention tank. However, monitoring has focused on the performance of the pit basket inserts and the media filters. Initially investigating the reduction of TSS, TP, and TN, the monitored parameters were expanded during the study to include heavy metals for the media filters and gross pollutants captured in both devices. A suite of metals including arsenic, cadmium, chromium, copper, nickel, lead, zinc, and mercury was tested. Copper and zinc were the most readily observed metals in stormwater runoff from this site.
2. Site Details
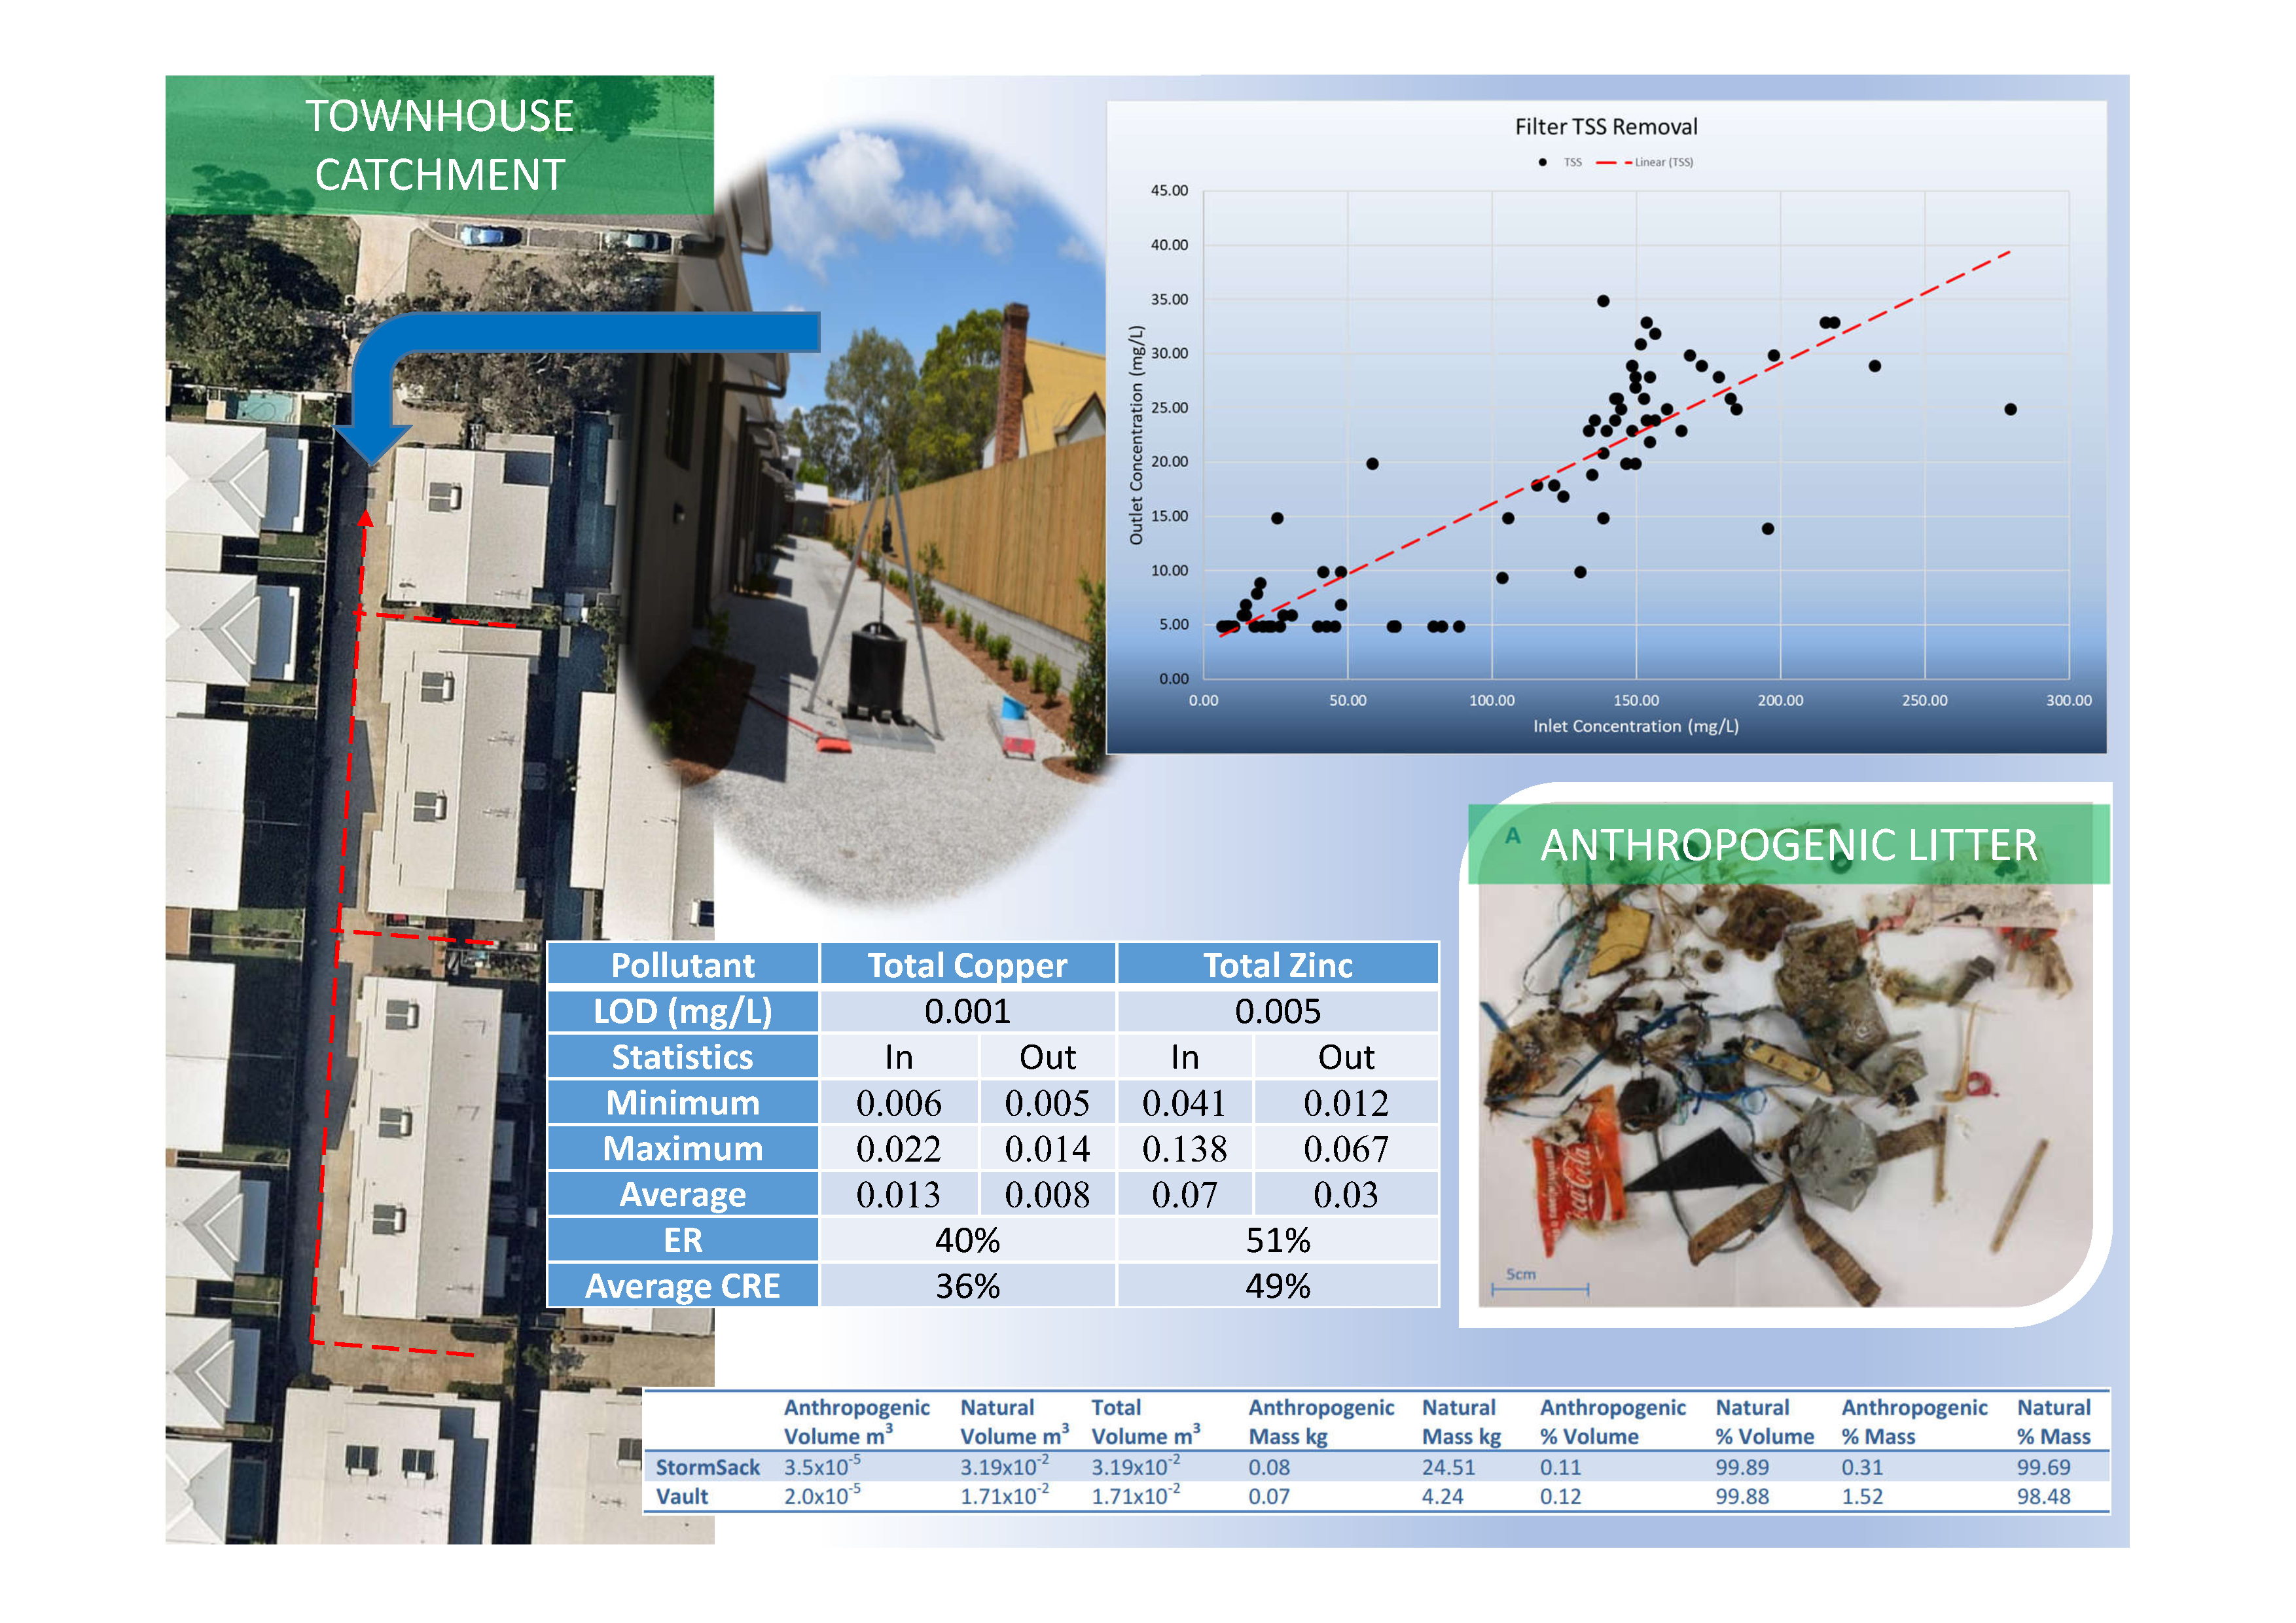
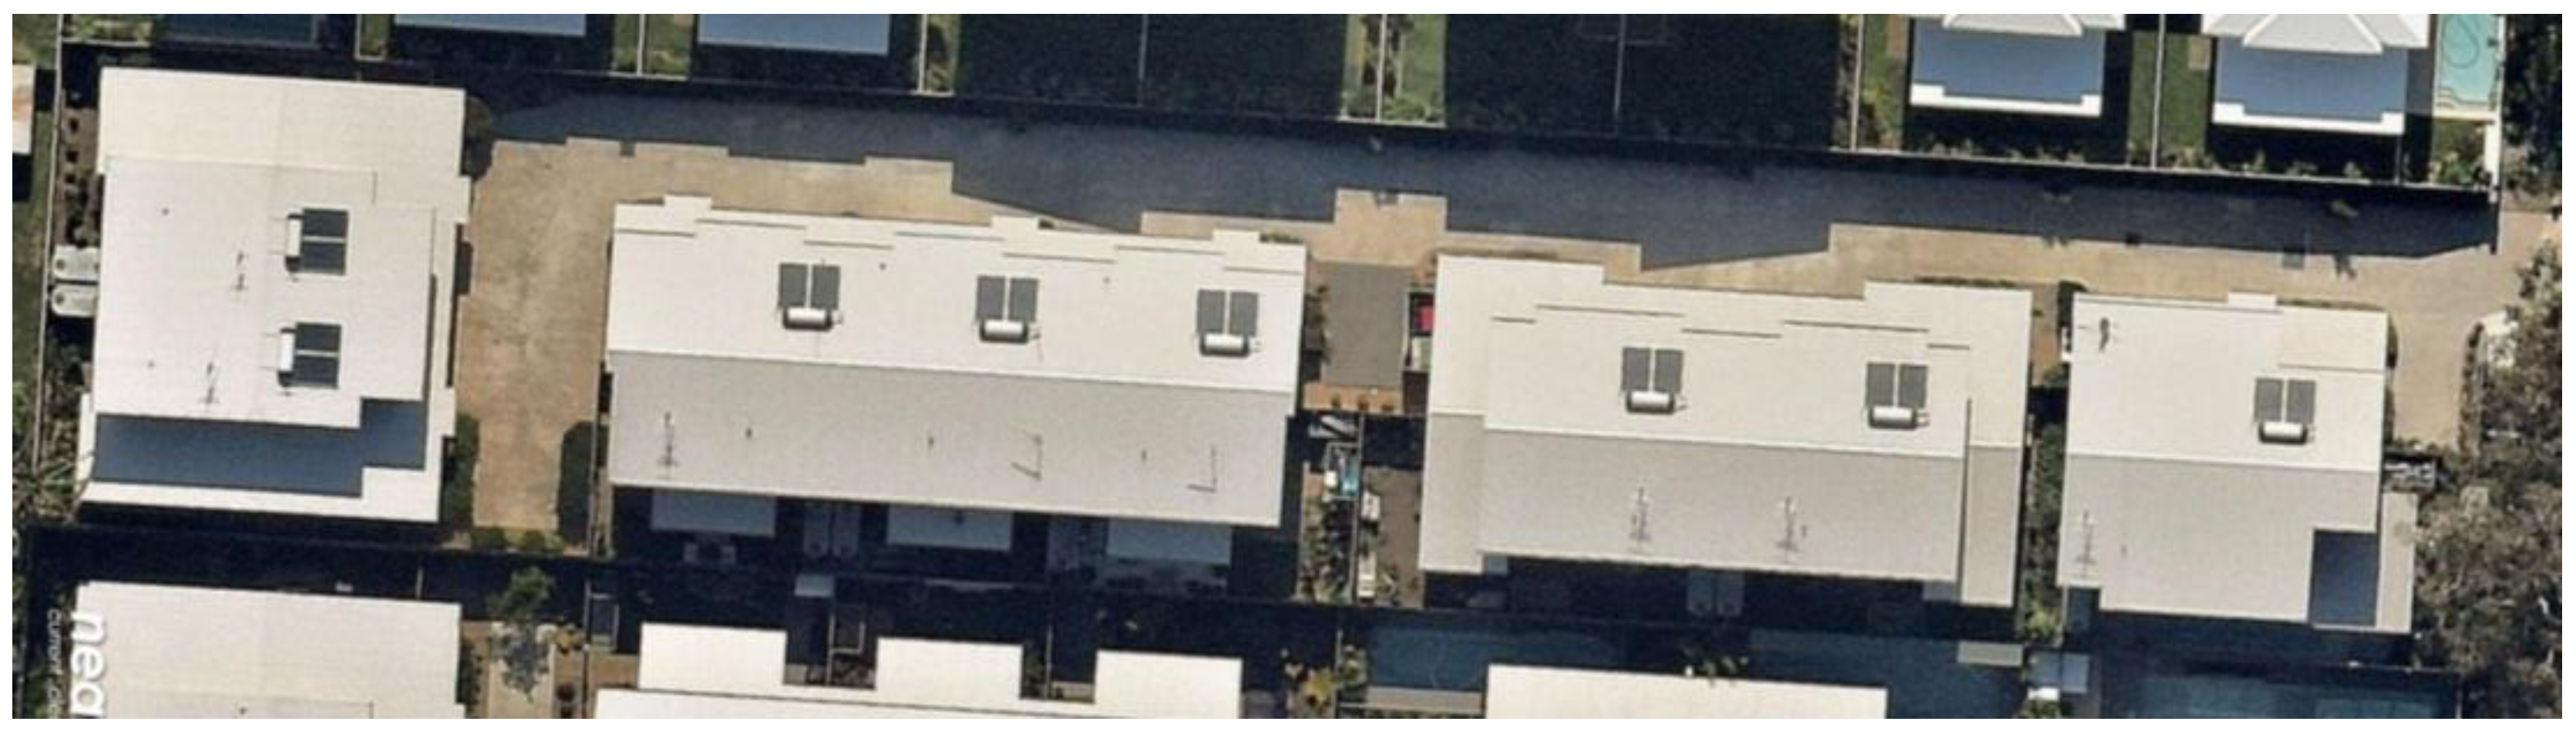
A stormwater treatment train was monitored over a 4.5-year period at a townhouse complex at Ormiston, about 28 km east of Brisbane, the capital city of Queensland. The site is within 1 km of Moreton Bay, a regionally sensitive waterbody. The monitored site has a total area of 2028 m2, with approximately 1140 m2 of roof area (56%), 500 m2 of concrete driveway (25%), and the remaining 388 m2 (19%) of landscaped area. An aerial photograph of the site is presented in Figure 1. This is a typical land use for the monitored treatment train, highly influenced by atmospheric fallout onto the roof and hardstand, runoff from landscaping, and small traffic levels.
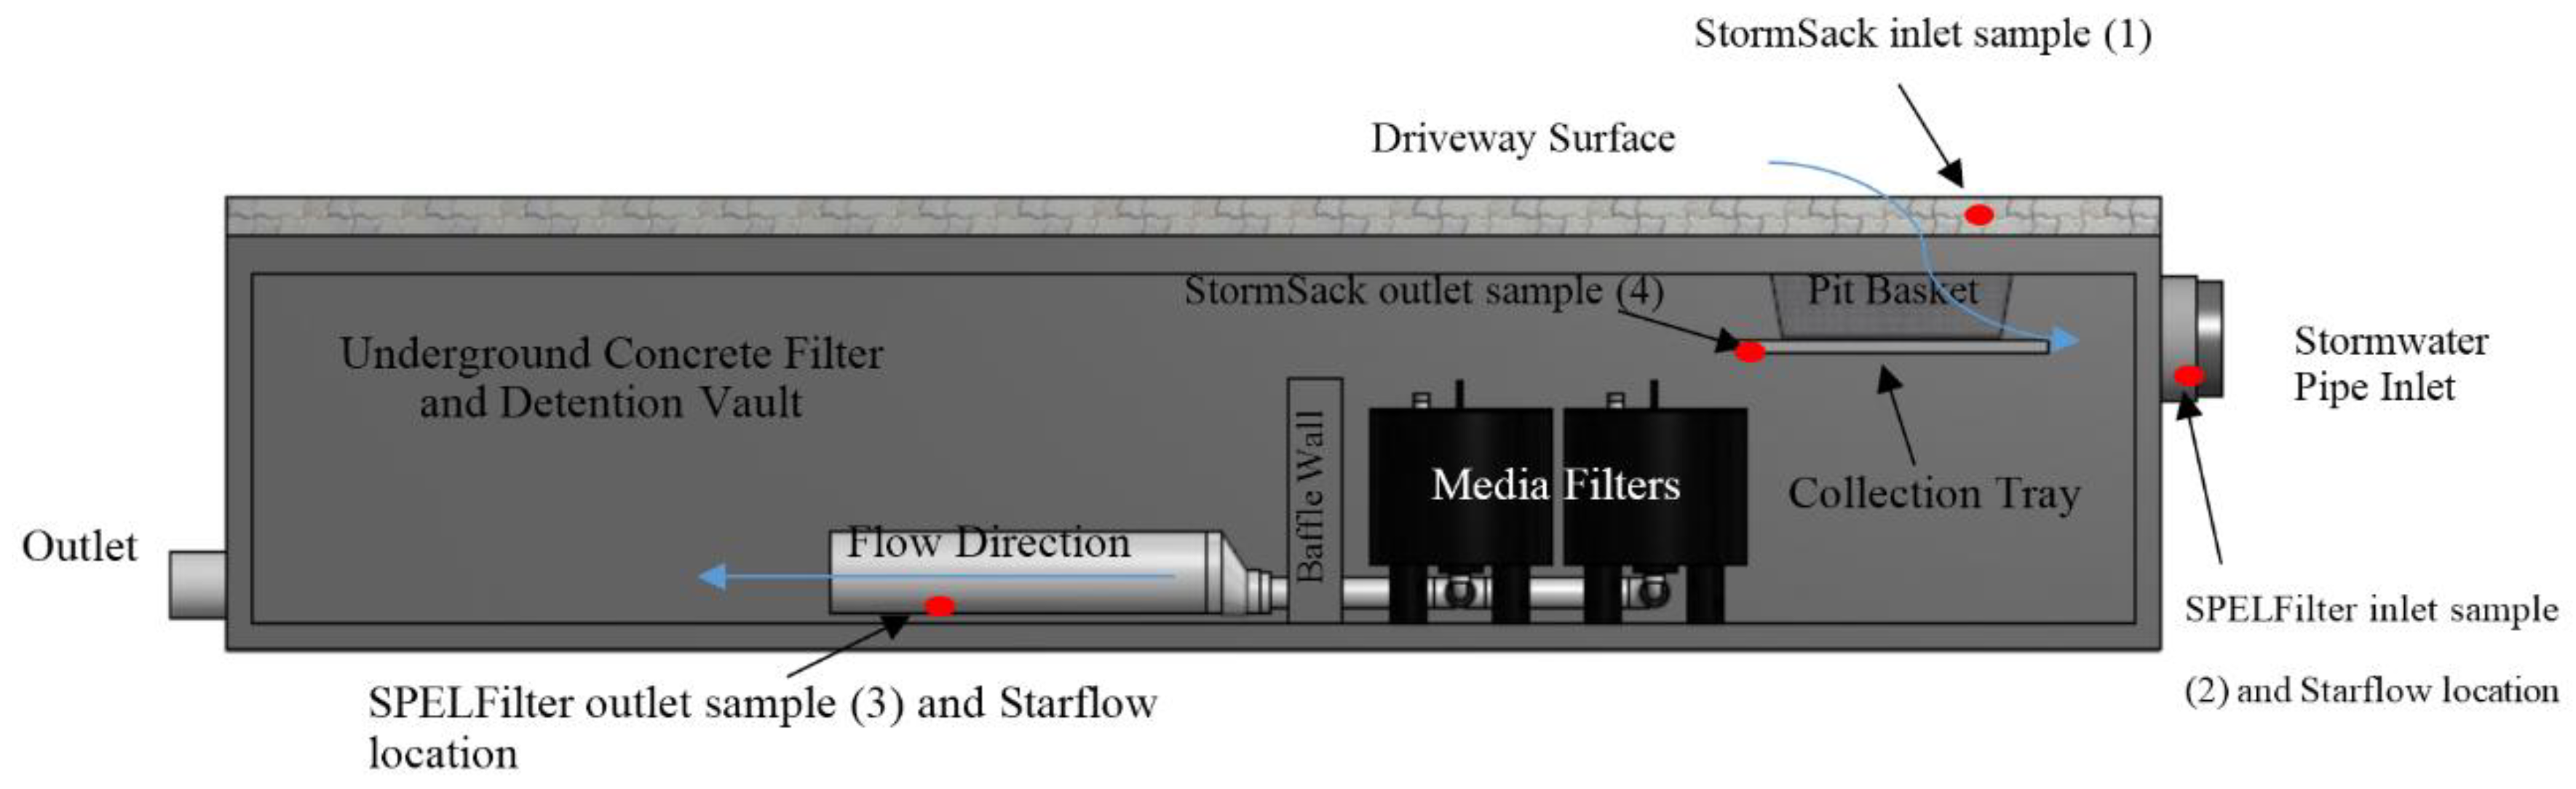
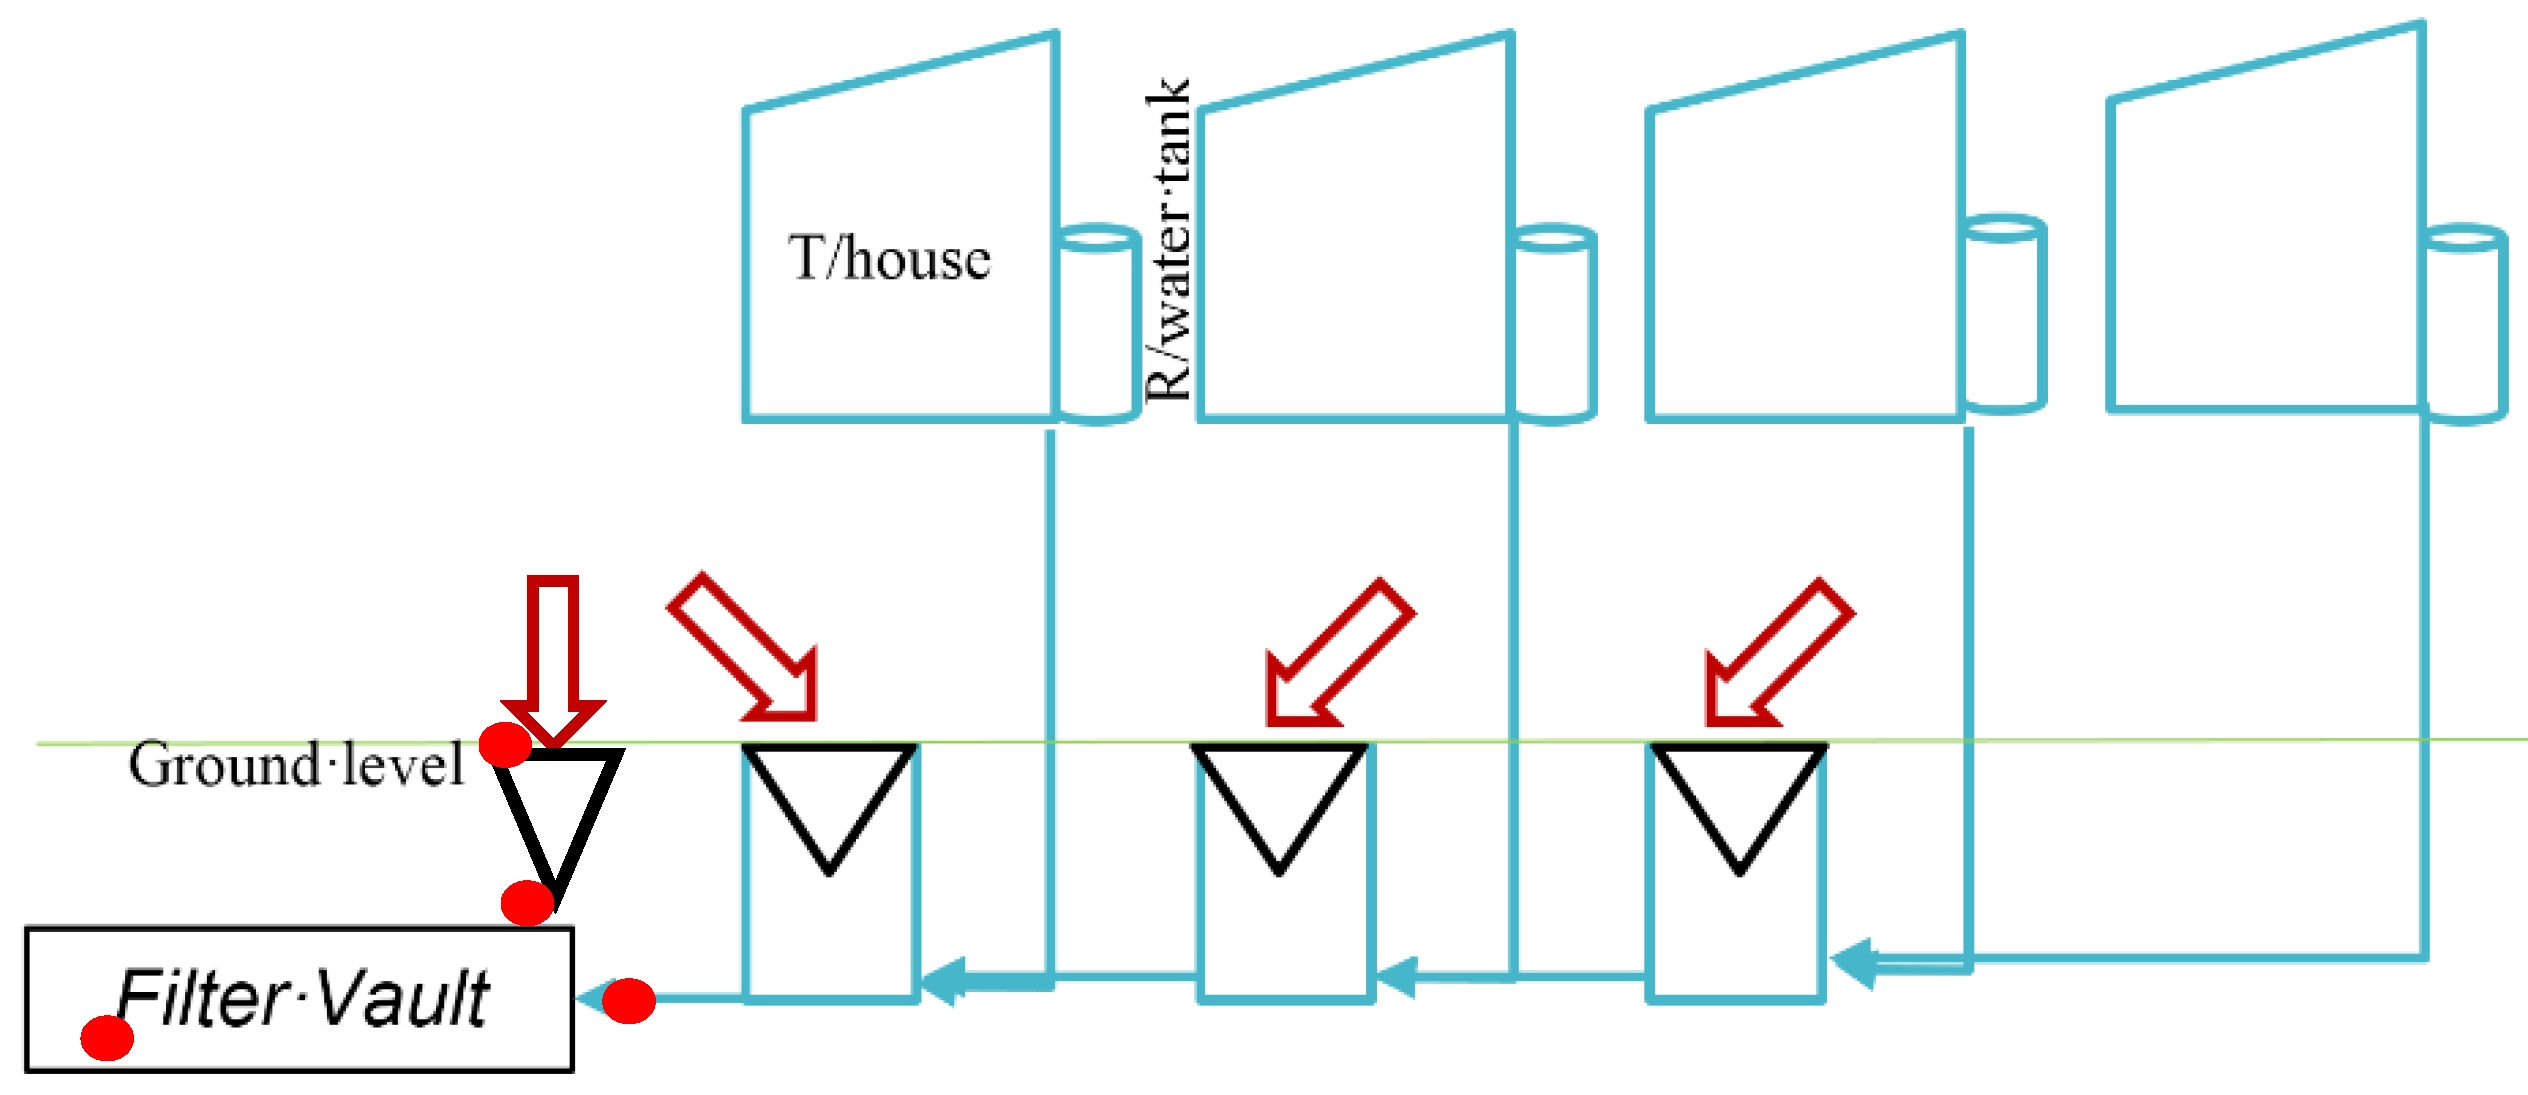
Roofwater is initially captured by rainwater tanks which supply water for internal and external townhouse use, with overflows plumbed into the underground drainage upstream of the filter vault, entering the system beneath the pit baskets. Grated inlets (catch basins) capture surface runoff from the site, carrying it to an underground vault containing the media filter cartridges after passage through inlet pit basket inserts via the same underground drainage system receiving rainwater tank overflows. The concrete filter vault also provides a detention function prior to release of treated stormwater to Council drainage. The cartridge filters utilise a perlite, zeolite, and activated alumina media to provide treatment of stormwater pollutants. The site, monitoring setup, and protocol have been described in earlier publications [11]. A schematic cross-section of the monitoring installation is shown in Figure 2, and a schematic of the site and stormwater network is shown in Figure 3.
3. Methodology
Several international standards were consulted to formulate a protocol to deliver a robust, scientifically defensible outcome [12,13,14]. The protocol was collaboratively formulated with research partners Queensland University of Technology (QUT) and Griffith University (GU). It is in alignment with Stormwater Australia’s draft Stormwater Quality Improvement Device Evaluation Protocol (SQIDEP) [15].
Composited, flow-weighted water sampling from the inlet and outlet points of the treatment devices provided event mean concentrations (EMCs) for each location. Samples were independently collected and analysed in National Association of Testing Authorities (NATA) registered laboratories. To provide an annual estimate of gross pollutant and coarse sediment loads generated on the site, quarterly maintenance of the pit baskets was deferred for a 12-month period in 2014. Gross pollutant and sediment samples from the pit baskets and filter vault were collected after 12 months of operation for weighing and nutrient analyses by the GU. Samples were air-dried and sieved, and anthropogenic materials were manually separated. A sub-sample of the solids from both the pit basket and vault were then analysed by the laboratory for TN and TP. Reports on the findings were prepared by the respective universities [16,17]. The average concentration removal efficiency (Av. CRE) and efficiency ratio (ER) of the analysed pollutants in runoff samples are discussed in this paper.
Average concentration removal efficiency (CRE) is calculated from Equation (1):
Efficiency ratio (ER) is calculated from Equation (2):
4. Results
Following more than 4.5 years of monitoring, 22 events qualifying with the protocol have been tested for the pit basket insert, and 15 events for the media filter. As is typical of environmental monitoring, the difference between the qualifying events for the two technologies is a result of flow volume, compliance with the testing protocol (e.g., aliquot numbers), and occasional equipment error.
Table 1 summarises the water quality data for the pit basket [18]. The results indicate that the pit basket has efficiency ratios of 61% of TSS, 28% of TP and 45% of TN. Both metrics for the pit basket converge to within 2%, indicating that the dataset is not unduly influenced by anomalous outliers.
Filter cartridge results are summarised in Table 2. The data indicates that the filters are receiving relatively low inflow concentrations of TSS, TP, and TN in comparison with industry guidelines [19]. Even so, ERs of 79%, 58% and 42% for TSS, TP, and TN, respectively, are observed from the qualifying events. ERs for total Cu and total Zn are 42% and 52%, respectively. CRE and ER metrics for the media filters are within 13% of each other. Results for arsenic, cadmium, chromium, nickel, lead, and mercury were mostly at or below detection limits in the inflow.
Events were sampled across all seasons during the monitoring period to incorporate varying rainfall patterns and seasonal processes. The rainfall amount for each event, and the peak rainfall intensity (recorded as millimetres over a 30 min period) are presented in Table 3. The average annual rainfall across the monitoring period was 1536 mm/year.
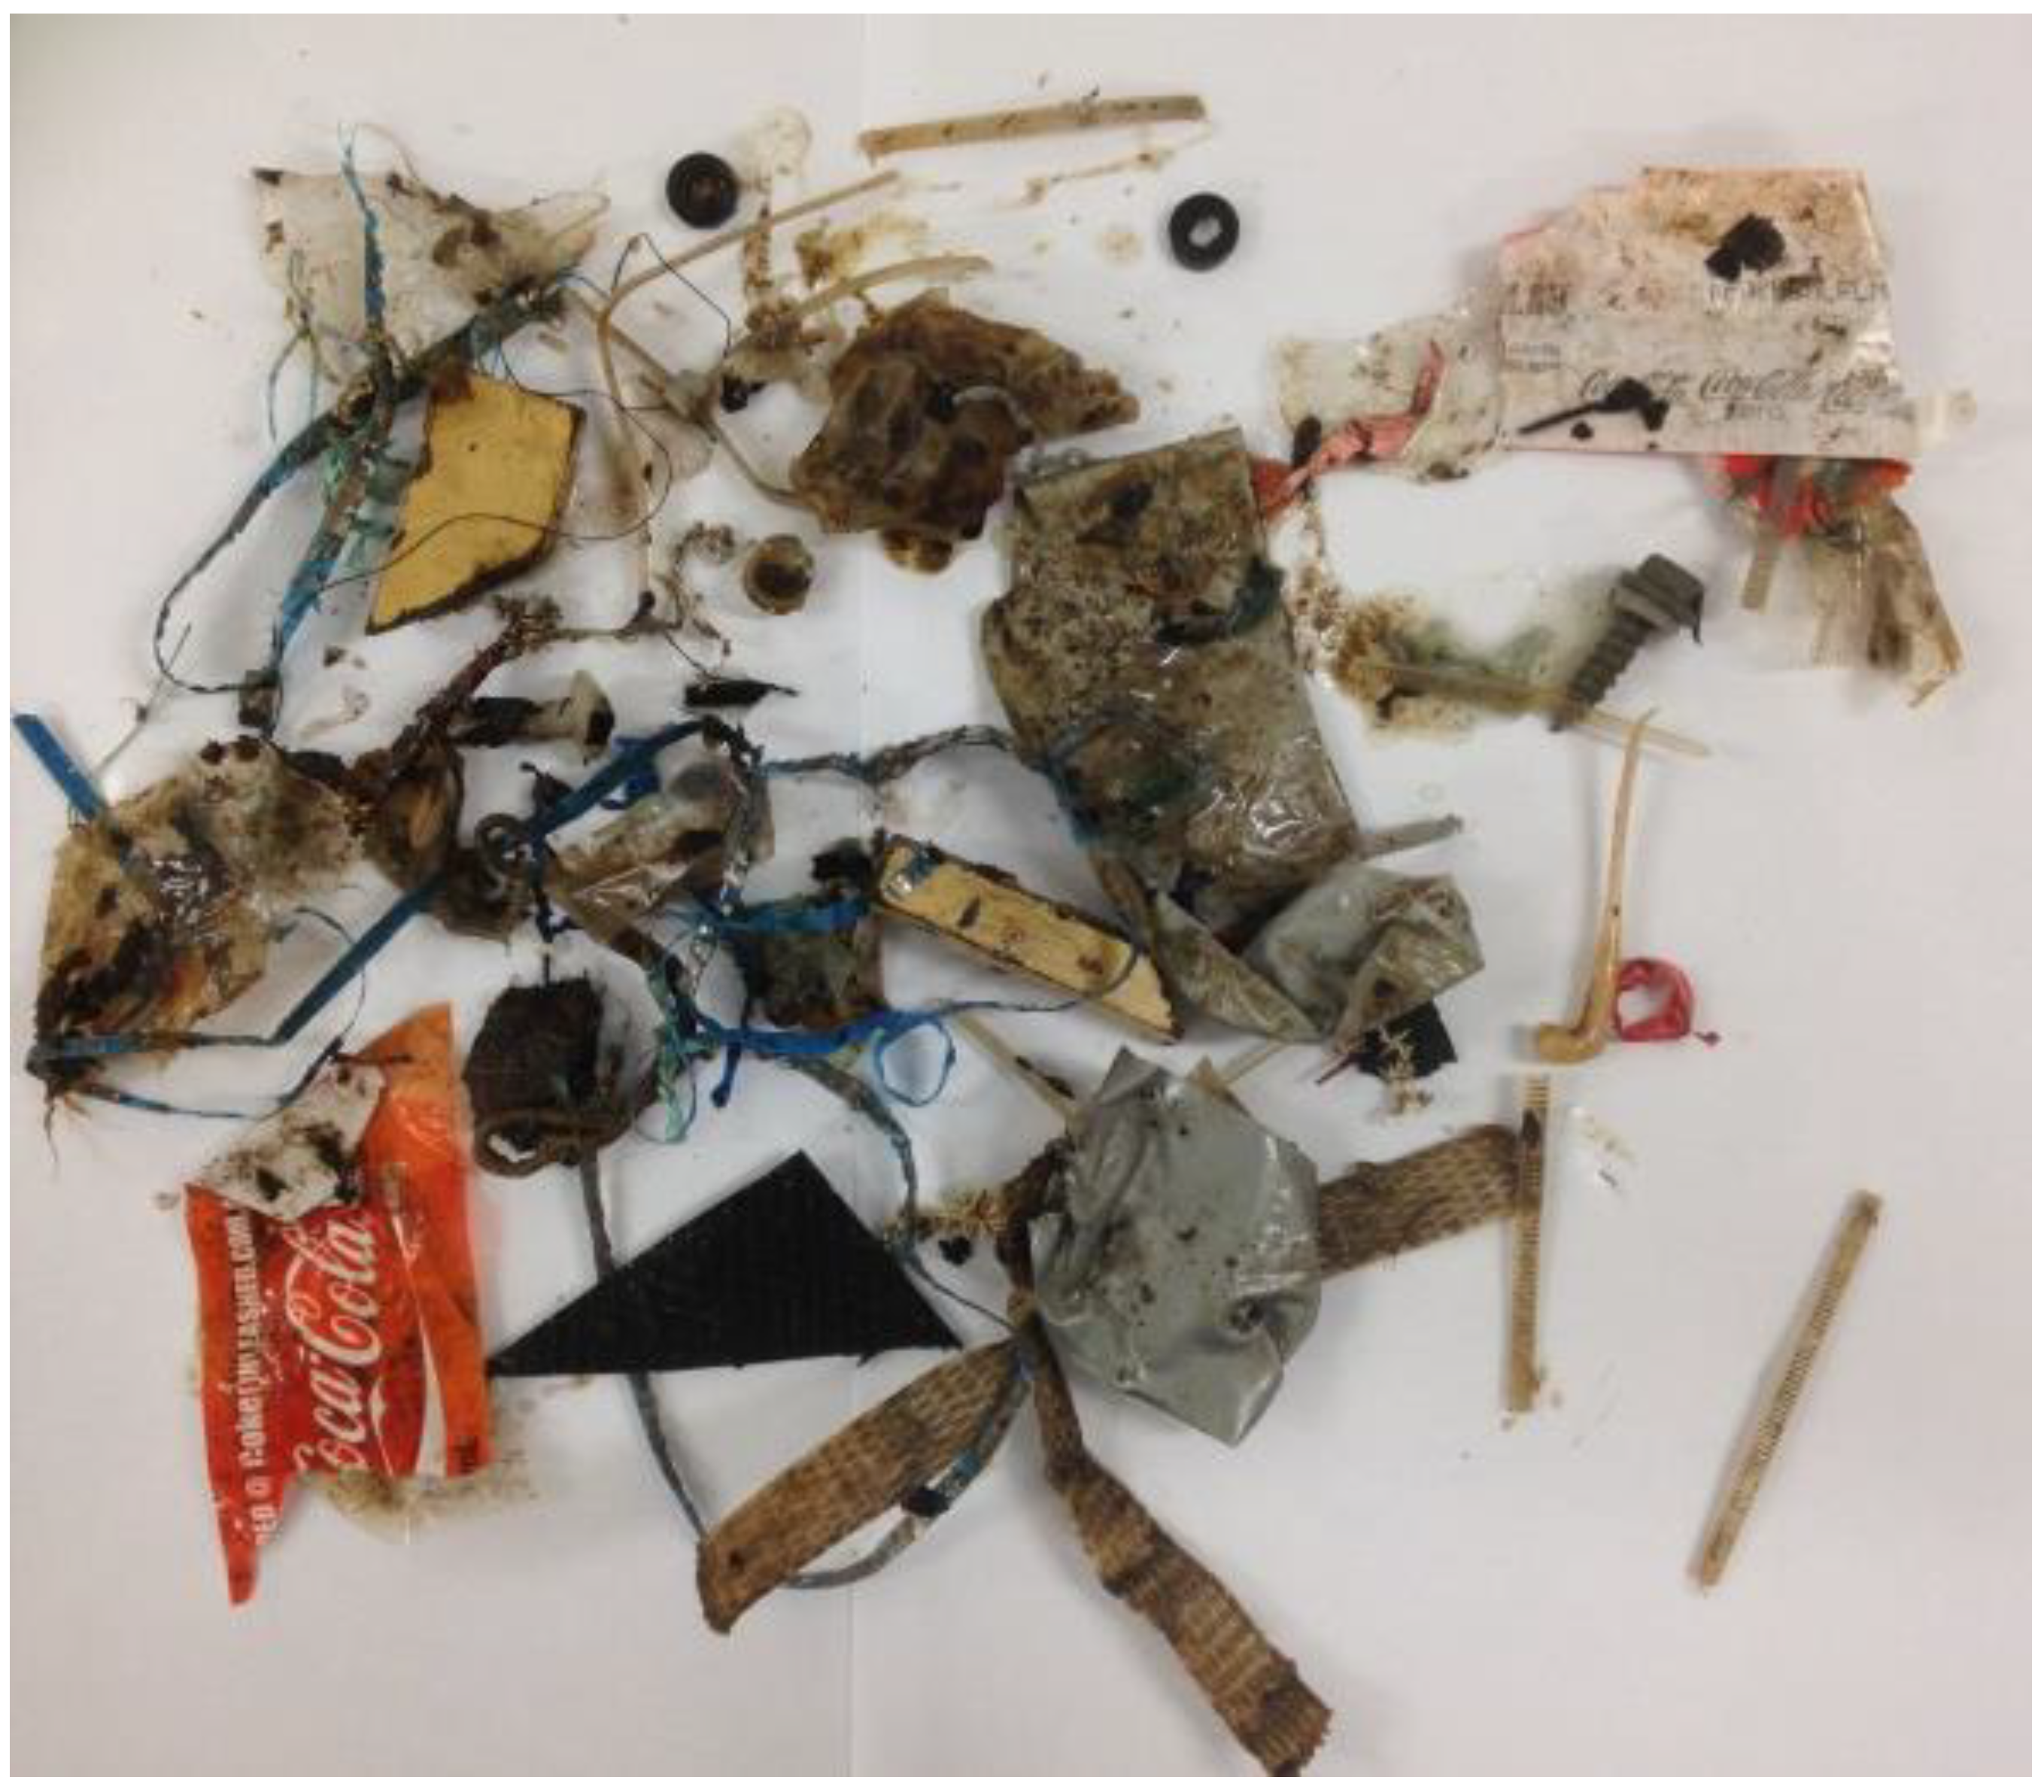
Three 20-L buckets of sediment and gross pollutants were collected from the pit baskets, and two 20-L buckets of pollutants were removed from the filter vault in November 2014. The contents of the buckets were homogenised before sub-samples were collected and sent for nutrient analysis. Results of the gross pollutant and nutrient evaluation are presented in Table 4. Anthropogenic items were those identified as originating from human interaction onsite. The anthropogenic items measured in the pit basket are shown in Figure 4.
Based on the above data, the total gross pollutant and coarse sediment load from this catchment is estimated to be 0.25 m3/Ha/year, with a corresponding air-dried mass of 142.5 kg/Ha/year. Of this total, the calculated anthropogenic litter load is 2.65 kg/Ha/year.
5. Discussion
Normality testing (Anderson–Darling) of the water quality datasets confirmed that, except for total copper at the filter outlet, all follow log-normal distributions. Paired Student’s t-tests were performed on the log-normal datasets and Wilcoxon rank sign tests were performed on the total copper datasets to evaluate statistical difference of the datasets. Results in Table 5 confirm that the inflow and outflow water quality datasets from both treatment devices are statistically significantly different for all pollutants. The findings of the field research in both the United States and Australia suggest that the stormwater treatment train holds promise for the removal of total copper, total zinc, TSS, TP, and TN.
Considering more than half of the Ormiston site is roof area, the gross pollutant generation rate is relatively high in comparison to the 30 kg/Ha/year previously reported for Australian urban catchments [20]. This is expected to be a function of the fact that previous gross pollutant research constrained evaluated material to be that greater than 5 millimetres, where the technologies tested at Ormiston can capture much smaller particles. Of interest, when the nutrient content of the material from both devices is converted to an annual load, both devices have captured a similar mass, as presented in Table 6.
The observed pollutant concentrations entering the treatment train are low in comparison with those anticipated historically from catchments of similar land use [21]. The observed concentrations from the surface (Stormsack) are compared with local guideline values in Table 7.
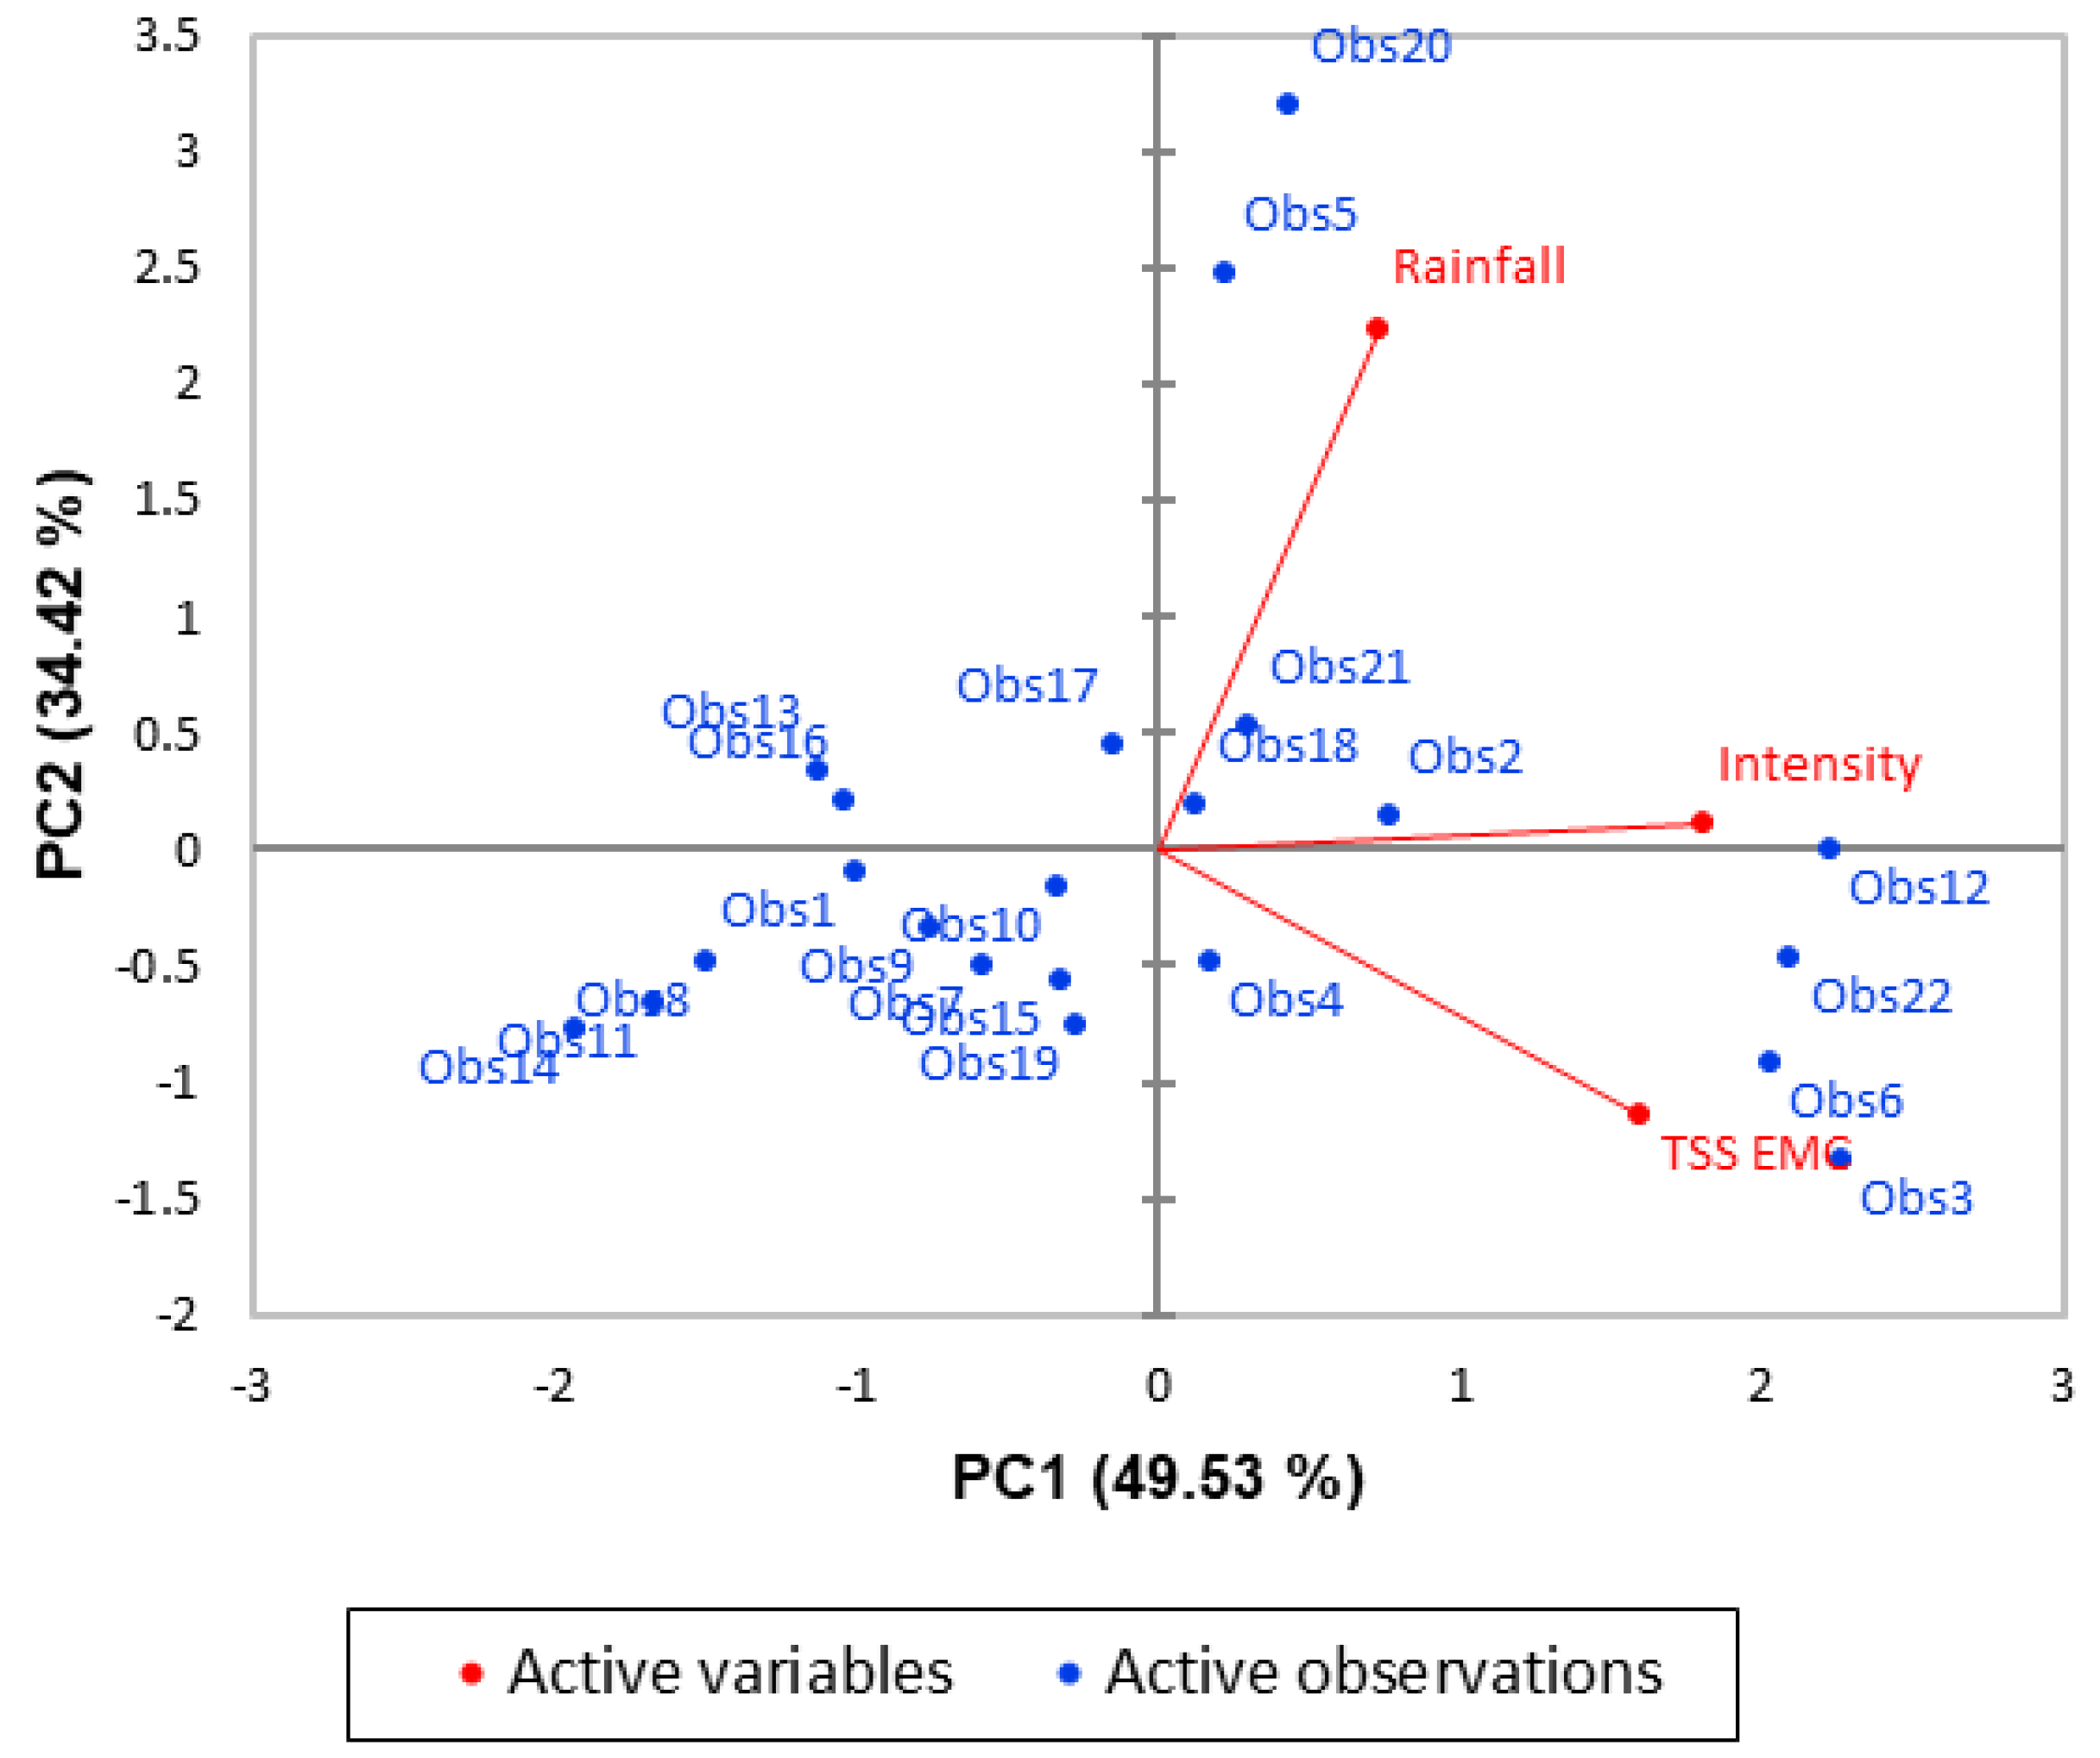
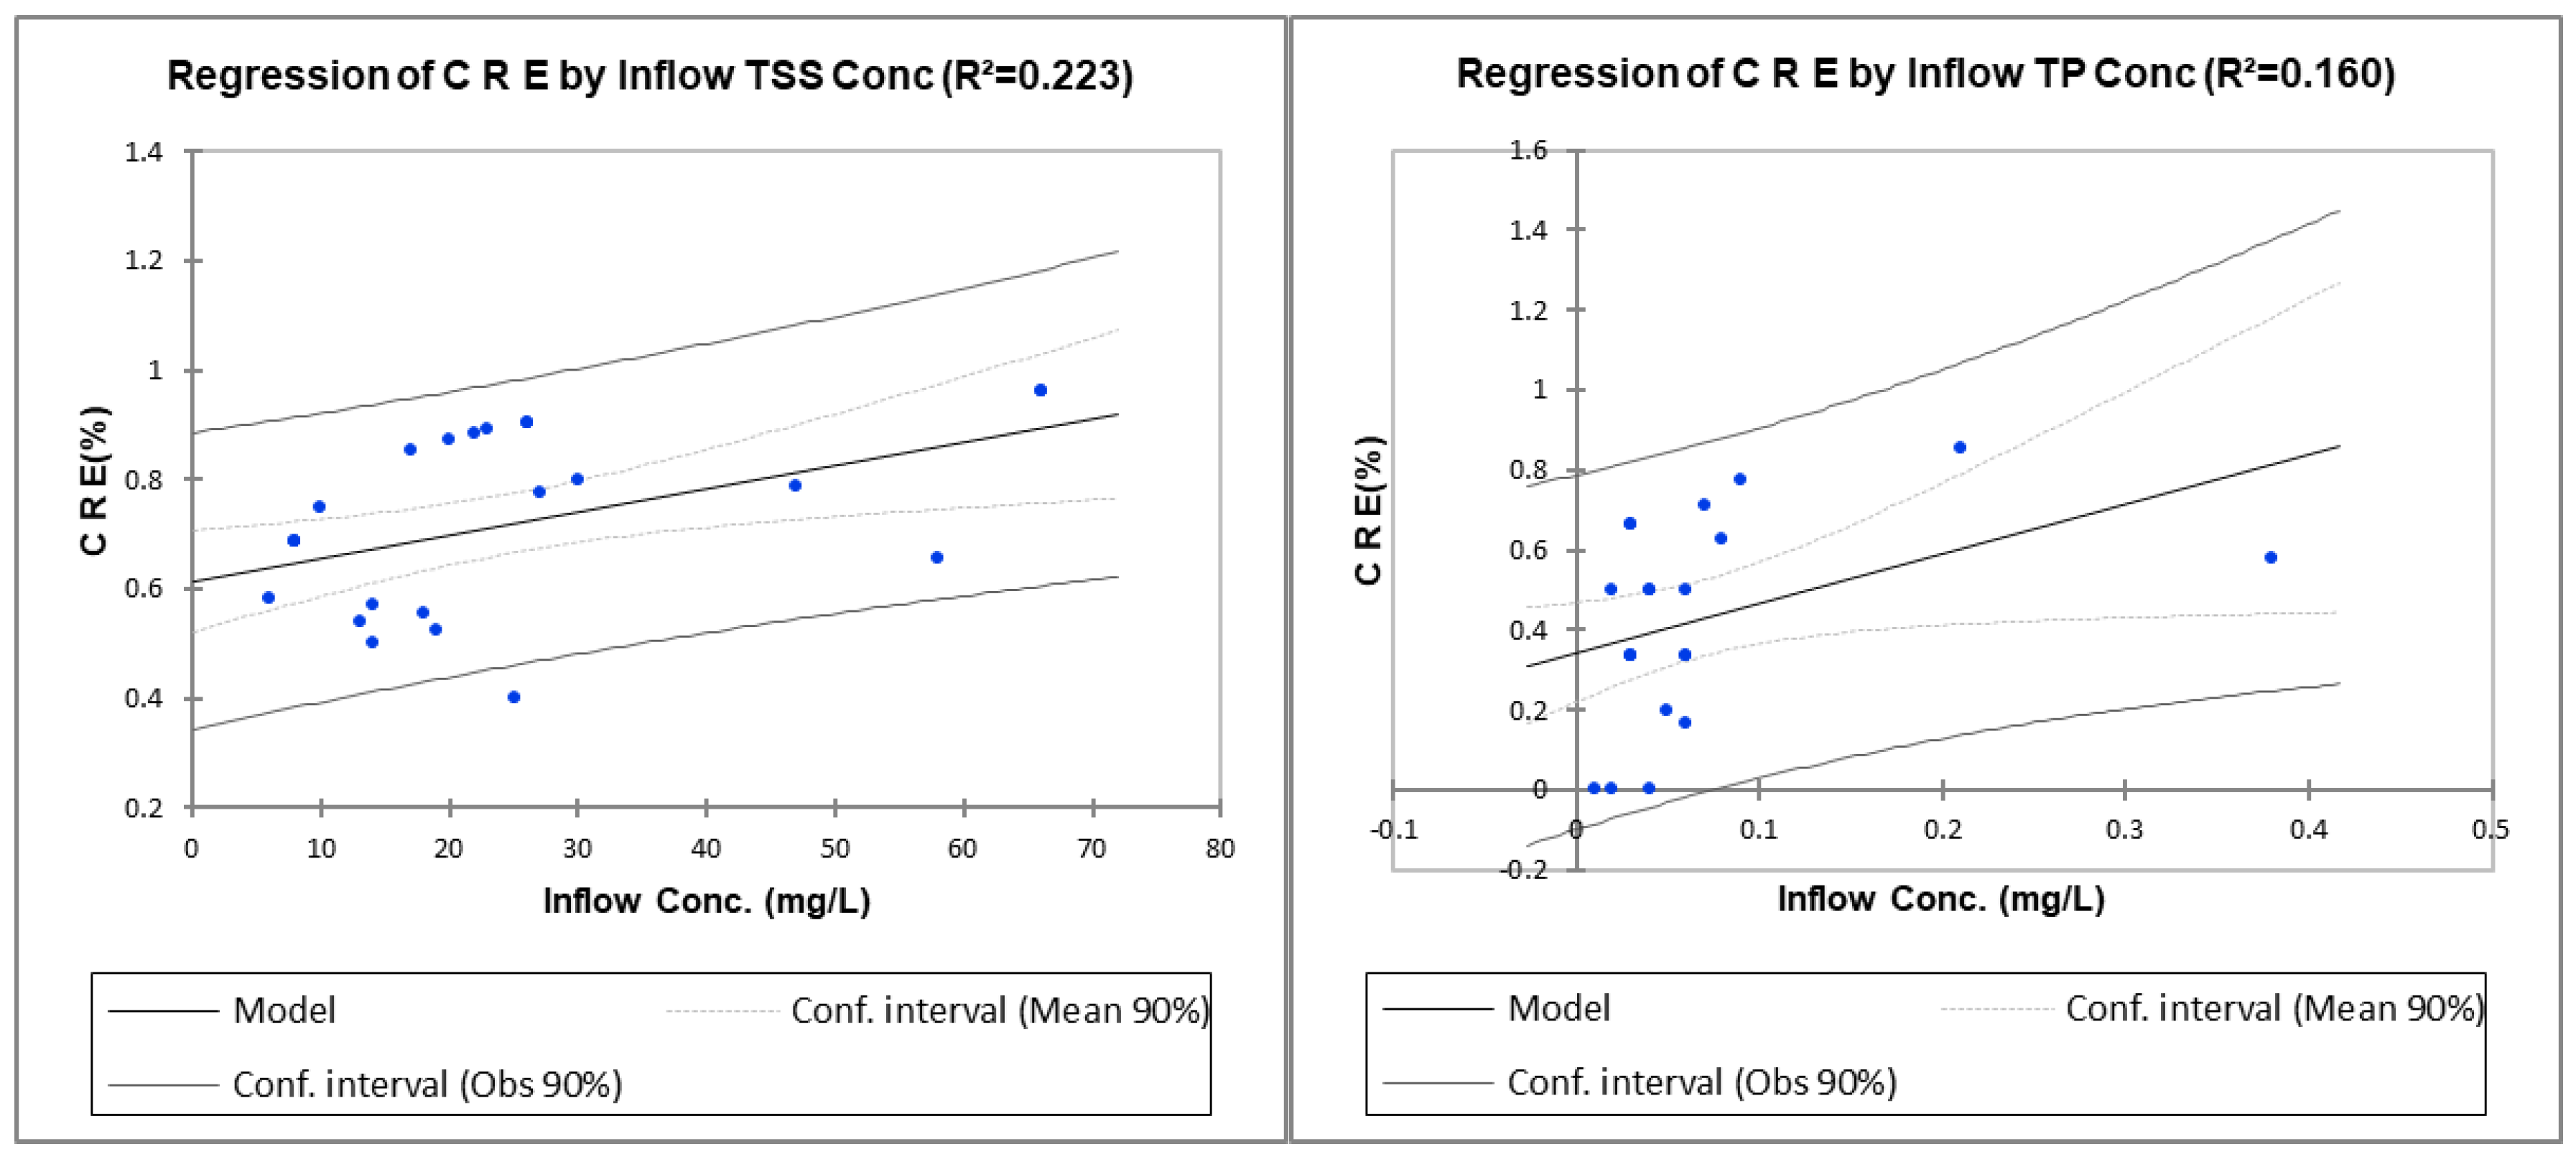
Principal component analysis (PCA) was performed on the inlet TSS, TP and TN concentrations to investigate possible correlations to event characteristics. Confirming the findings of previous research, PCA evaluation has concluded a significant, positive relationship between rainfall intensity and influent TSS concentration, with a weak, positive relationship to rainfall amount [21]. The PCA biplot is presented in Figure 5. Influent concentrations of TP and TN did not display significant relationships to either rainfall depth or intensity. Regression analysis confirms that 22% of the CRE variability for TSS and 16% for TP is explained by the inflow concentrations, as presented in Figure 6 (90% confidence). Further correlation tests were performed to evaluate potential relationships between CRE and rainfall depth or peak intensity. The analyses concluded that there was no significant correlation to rainfall depth. Peak rainfall intensity was observed to explain between 5% and 11% of CRE variability but was not statistically significant.
In the context of the relatively low influent concentrations observed at this site, and the identified trends between inlet concentration and CRE, the media filter dataset from U.S. field testing, with slightly higher influent concentrations, was truncated to comply with the upper limit of the SQIDEP concentrations [15,22]. Truncated U.S. results are summarised in Table 8, confirming that higher influent concentrations produce higher performance reduction metrics. Since similar testing and collection methods were used at both monitoring sites, as allowed by international and national protocols, the combined datasets produce removal results of 89% for TSS and 71% for TP [13,15].
Monitoring has continued at the Ormiston site to provide an indication of the long-term operation of the filter cartridges and to potentially identify whether pollutant breakthrough occurs, thereby indicating the triggering of cartridge replacement. Annual maintenance has included vacuum removal of captured sediments and litter from the vault. Observations to date suggest that the filter cartridges have remained functional ~ 58 months after they were installed. Further monitoring is continuing to determine whether a breakthrough occurs.
6. Conclusions
After more than 4.5-years of Australian field monitoring, 22 qualifying events for a pit basket insert and 15 qualifying events for media filters were evaluated. The pit basket had removal efficiencies of 61% for TSS, 28% for TP, and 45% for TN. The media filters had removal efficiencies of 79% for TSS, 58% for TP, 42% for TN, 47% for total Cu, and 55% for total Zn. International field data with higher influent concentrations truncated to satisfy local guidelines confirmed the media filters had removal efficiencies of 90% and 76% for TSS and TP, respectively, and 89% for TSS and 71% for TP when combined with the Australian dataset. These results conclude that the stormwater treatment train holds considerable promise for removing Cu and Zn, as well as the regulated pollutants of TSS, TP, and TN, and higher influent concentrations will produce better removal efficiency from the treatment train.
The total gross pollutant and coarse sediment load from the study site was estimated to be 0.24 m3/Ha/year with a corresponding air-dried mass of 142.5 kg/Ha/year. These values are higher than in prior literature, potentially due to the treatment measures capturing pollutants >200 microns compared to the previous 5-mm definition of gross pollutants. Further research into gross pollutant generation rates on small catchments is recommended.
Monitoring over the 58-month duration has not shown a defined breakthrough of TSS or TP at this point. Further monitoring will continue to evaluate any potential breakthrough indicating cartridge replacement is required.
Author Contributions
D.D. was engaged to project manage the research and supervise the ongoing operation of the monitoring system; A.H. is the Asia Pacific Team Leader for SPEL Environmental and pioneered the site selection, approvals, financing, and regulator liaison for the project. Both authors have contributed to the preparation of this journal article.
Funding
This research was funded by SPEL Environmental through a research grant to QUT.
Acknowledgments
Research partners at the QUT, including Ashantha Goonetilleke and Prasanna Egodawatta, were integral to the successful delivery of the field monitoring program. Researchers from the GU, Lawrence Hughes and Sally Obst, provided invaluable support and expertise for the gross pollutant and sediment analyses.
Conflicts of Interest
The research program behind the paper was independently undertaken by QUT & Griffith University under funding arrangements with SPEL.
References
- Research Excellence Framework (REF). Impact Case Study (REF3b), University of Leeds, C-17, Case 6—Improving National Surface Water Quality Using an Urban Non-Point Pollution Model and Supporting Database. 2014. Available online: http://impact.ref.ac.uk/CaseStudies/CaseStudy.aspx?Id=6353 (accessed on 2 January 2018).
- State of Queensland. Department of State Development, Infrastructure and Planning; State Planning Policy: Brisbane, Australia, 2013. [Google Scholar]
- Melbourne Water. MUSIC Guidelines; Recommended Input Parameters and Modelling Approaches for MUSIC Users; State Government of Victoria: Melbourne, Australia, 2010. [Google Scholar]
- Mitchell, G. Mapping hazard from urban non-point pollution: A screening model to support sustainable urban drainage planning. J. Environ. Manag. 2005, 74, 1–9. [Google Scholar] [CrossRef] [PubMed]
- Ellis, J.B.; Revitt, D.M. Incidence of heavy metals in street surface sediments: Solubility and grain size studies. Water Air Soil Pollut. 1981, 17, 87–100. [Google Scholar]
- Huber, M.; Welker, A.; Helreich, B. Critical review of heavy metal pollution on traffic are runoff: Occurrence, influencing factors and partitioning. Sci. Total Environ. 2016, 541, 895–919. [Google Scholar] [CrossRef] [PubMed]
- Drapper, D.; Tomlinson, R.; Williams, P. Pollutant Concentrations in Road Runoff: Southeast Queensland Case Study. J. Environ. Eng. 2000, 126, 313–320. [Google Scholar] [CrossRef]
- Alam, M.Z.; Faisal Anwar, A.H.M.; Sarker, D.C.; Heitz, A.; Rothleitner, C. Characterising stormwater gross pollutants captured in catch basin inserts. Sci. Total Environ. 2017, 586, 76–86. [Google Scholar] [CrossRef] [PubMed]
- Seitzinger, S.P.; Sanders, R.; Styles, R. Bioavailability of DON from natural and anthropogenic sources to estuarine plankton. Limnol. Oceanogr. 2002, 47, 353–366. [Google Scholar] [CrossRef] [Green Version]
- Madhani, J.; Brown, R.J. The capture and retention evaluation of a stormwater gross pollutant trap design. Ecol. Eng. 2015, 74, 56–59. [Google Scholar] [CrossRef]
- Drapper, D.; Hornbuckle, A. Field Evaluation of a Stormwater Treatment Train with Pit Baskets and Filter Media Cartridges in Southeast Queensland. Water 2015, 7, 4496–4510. [Google Scholar] [CrossRef] [Green Version]
- Auckland Regional Council. Proprietary Devices Evaluation Protocol (PDEP) for Stormwater Quality Treatment Devices; Version 3; Auckland Regional Council: Auckland, New Zealand, 2012. [Google Scholar]
- Washington Department of Ecology. Technical Guidance Manual for Evaluating Emerging Stormwater Treatment Technologies; Technology Assessment Protocol—Ecology (TAPE); Washington Department of Ecology: Washington, DC, USA, 2011. [Google Scholar]
- SWEMA—Stormwater Equipment Manufacturer’s Association. Evaluation of Hydrodynamic Separators; Stormwater Equipment Manufacturer’s Association: St. Paul, MN, USA, 2010. [Google Scholar]
- Stormwater Australia. Stormwater Quality Improvement Device Evaluation Protocol; v1.0.2; Stormwater Australia: Melbourne, Australia, 2015. [Google Scholar]
- Goonetilleke, A.; Egodawatta, P. Evaluation of Treatment Performance of the StormSack and SPELFilter Installations at Ormiston: Final Report; Science and Engineering Faculty, Queensland University of Technology: Brisbane, Australia, 28 February 2018. [Google Scholar]
- Hughes, L.; Obst, S. Gross Pollutant and Sediment Mass Balance Analyses; Griffith Centre for Coastal Management, Griffith University: Nathan, Australia, 2015. [Google Scholar]
- Water by Design (WBD). MUSIC Modelling Guidelines; SEQ Healthy Waterways Partnership: Brisbane, Queensland, 2010; ISBN 978-0-9806278-4-8. [Google Scholar]
- Allison, R.; Chiew, F.; McMahon, T. Nutrient contribution of leaf litter in urban stormwater. J. Environ. Manag. 1998, 54, 269–272. [Google Scholar] [CrossRef]
- Lucke, T.; Drapper, D.; Hornbuckle, A. Urban stormwater characterization and nitrogen composition from lot-scale catchments—New management implications. Sci. Total Environ. 2018, 619–620, 65–71. [Google Scholar] [CrossRef] [PubMed]
- Liu, A.; Guan, Y.; Egodawatta, P.; Goonetilleke, A. Selecting rainfall events for effective Water Sensitive Urban Design: A case study in Gold Coast City, Australia. Ecol. Eng. 2016, 92, 67–72. [Google Scholar] [CrossRef]
- Gaines, C.A., II. Technical Evaluation Report: Bayfilter EMC and BaySeparator Systems, Grandview Place Apartments, Vancouver, Washington and Woodinville Sammamish River Outfall; Washington Department of Ecology TAPE Process: Woodinville, WA, USA, 2014. [Google Scholar]
Figure 1.
Aerial photograph of the monitored site (Source: Nearmap).

Figure 2.
Schematic cross section of the field monitoring system and detention vault (not to scale).
Figure 2.
Schematic cross section of the field monitoring system and detention vault (not to scale).

Figure 3.
Schematic of the flowpaths at Ormiston. Red arrows indicate surface runoff entering the pit baskets. Blue arrows represent the stormwater drainage. The monitoring locations are shown by the red dots.
Figure 3.
Schematic of the flowpaths at Ormiston. Red arrows indicate surface runoff entering the pit baskets. Blue arrows represent the stormwater drainage. The monitoring locations are shown by the red dots.

Figure 4.
Photograph of anthropogenic items from a pit basket.

Figure 5.
Principal component analysis (PCA) biplot for observed event data for rainfall depth, intensity and TSS event mean concentrations (EMCs).
Figure 5.
Principal component analysis (PCA) biplot for observed event data for rainfall depth, intensity and TSS event mean concentrations (EMCs).

Figure 6.
Regression analysis of TSS and TP inflow concentration against CRE demonstrates a significant relationship between performance and inlet concentration.
Figure 6.
Regression analysis of TSS and TP inflow concentration against CRE demonstrates a significant relationship between performance and inlet concentration.


Table 1.
Pit basket water quality results [13].
Table 1.
Pit basket water quality results [13].
| Pollutant | TSS | TP | TN | ||||||
|---|---|---|---|---|---|---|---|---|---|
| LOD (mg/L) | 5 | 0.01 | 0.1 | ||||||
| Event | In (mg/L) | Out (mg/L) | CRE | In (mg/L) | Out (mg/L) | CRE | In (mg/L) | Out (mg/L) | CRE |
| 16 August 2014 | 122 | 40 | 67% | 0.13 | 0.10 | 23% | 0.90 | 0.40 | 56% |
| 18 August 2014 | 12 | 2.5 2 | 79% | 0.05 | 0.05 | 0% | 0.20 | 0.20 | 0% |
| 25 September 2014 | 346 | 253 | 27% | 0.58 | 0.36 | 38% | 2.40 | 1.90 | 21% |
| 9 December 2014 | 202 | 186 | 8% | 0.40 | 0.10 | 75% | 3.85 | 2.20 | 43% |
| 20 February 2015 | 34 | 6 | 82% | 0.09 | 0.02 | 78% | 0.70 | 0.30 | 57% |
| 30 April 2015 | 90 | 58 | 36% | 0.13 | 0.07 | 46% | 0.90 | 0.50 | 44% |
| 23 July 2015 | 62 | 30 | 52% | 0.11 | 0.08 | 27% | 1.20 | 0.90 | 25% |
| 18 September 2015 | 158 | 14 | 91% | 0.18 | 0.09 | 50% | 1.40 | 0.60 | 57% |
| 25 December 2015 | 543 | 33 | 94% | 0.21 | 0.14 | 33% | 1.80 | 1.00 | 44% |
| 1 March 2016 | 30 | 6 | 80% | 0.10 | 0.08 | 20% | 1.40 | 0.50 | 64% |
| 30 March 2016 | 82 | 27 | 67% | 0.15 | 0.13 | 13% | 1.70 | 1.20 | 29% |
| 14 April 2016 | 83 | 22 | 73% | 2.45 | 1.92 | 22% | 2.20 | 1.20 | 45% |
| 25 December 2016 | 31 | 18 | 42% | 0.18 | 0.25 | –39% | 2.50 | 1.20 | 52% |
| 26 December 2016 | 15 | 2.5 2 | 83% | 0.12 | 0.10 | 17% | 1.30 | 0.60 | 54% |
| 6 January 2017 | 20 | 9 | 55% | 0.38 | 0.26 | 32% | 0.90 | 0.70 | 22% |
| 5 March 2017 | 47 | 26 | 45% | 0.69 | 0.59 | 14% | 2.40 | 1.30 | 46% |
| 15 March 2017 | 24 | 9 | 63% | 0.38 | 0.28 | 26% | 1.10 | 0.60 | 45% |
| 18 March 2017 | 38 | 16 | 58% | 0.26 | 0.16 | 38% | 2.00 | 0.90 | 55% |
| 20 March 2017 | 32 | 10 | 69% | 0.06 | 0.04 | 33% | 1.40 | 0.60 | 57% |
| 5 April 2017 | 35 | 14 | 60% | 0.46 | 0.38 | 17% | 1.30 | 0.80 | 38% |
| 8 May 2017 | 10 | 2.5 | 75% | 0.06 | 0.04 | 33% | 1.00 | 0.60 | 40% |
| 10 June 2017 | 37 | 12 | 68% | 0.26 | 0.11 | 58% | 2.40 | 1.10 | 54% |
| Average | 93.3 | 36.2 | 0.34 | 0.24 | 1.59 | 0.88 | |||
| ER | 61% | 28% | 45% | ||||||
| Average CRE | 62% | 30% | 43% | ||||||
Results reported as below limit of detection (LOD) were substituted with 50% of the LOD concentration in statistical analysis. TSS: total suspended solids; TP: total phosphorus; TN: total nitrogen; CRE: concentration removal efficiency; ER: efficiency ratio.
Table 2.
Media filter cartridge TSS, TP, TN, Cu and Zn results.
| Pollutant | TSS | TP | TN | Total Cu | Total Zn | ||||||||||
|---|---|---|---|---|---|---|---|---|---|---|---|---|---|---|---|
| LOD (mg/L) | 5 | 0.01 | 0.1 | 0.001 | 0.005 | ||||||||||
| Event | In | Out | CRE | In | Out | CRE | In | Out | CRE | In | Out | CRE | In | Out | CRE |
| 16 August 2014 | 22 | 2.5 1 | 89% | 0.04 | 0.02 | 50% | 0.4 | 0.3 | 25% | ||||||
| 18 August 2014 | 26 | 2.5 1 | 90% | 0.06 | 0.04 | 33% | 0.4 | 0.2 | 50% | ||||||
| 25 September 2014 | 66 | 2.5 1 | 96% | 0.07 | 0.02 | 71% | 0.7 | 0.3 | 57% | ||||||
| 9 December 2014 | 25 | 15 | 40% | 0.03 | 0.02 | 33% | 0.4 | 0.2 | 50% | ||||||
| 20 February 2015 | 20 | 2.5 1 | 88% | 0.01 | 0.01 | 0% | 0.4 | 0.4 | 0% | ||||||
| 30 April 2015 | 66 | 2.5 1 | 96% | 0.03 | 0.01 | 67% | 0.3 | 0.1 | 67% | ||||||
| 30 March 2016 | 23 | 2.5 1 | 89% | 0.03 | 0.02 | 33% | 1 | 0.5 | 50% | 0.017 | 0.006 | 65% | 0.072 | 0.014 | 81% |
| 3 October 2016 | 13 | 6 | 54% | 0.04 | 0.02 | 50% | 1.3 | 0.2 | 85% | 0.016 | 0.005 | 69% | 0.072 | 0.012 | 83% |
| 12 October 2016 | 18 | 8 | 56% | 0.06 | 0.03 | 50% | 1.5 | 0.8 | 47% | 0.012 | 0.005 | 58% | 0.062 | 0.021 | 66% |
| 26 December 2016 | 17 | 2.5 1 | 85% | 0.03 | 0.01 | 67% | 0.8 | 0.4 | 50% | 0.022 | 0.006 | 73% | 0.044 | 0.027 | 39% |
| 5 March 2017 | 14 | 7 | 50% | 0.06 | 0.05 | 17% | 0.6 | 1.1 | –83% | 0.015 | 0.013 | 13% | 0.052 | 0.029 | 44% |
| 18 March 2017 | 58 | 20 | 66% | 0.08 | 0.03 | 63% | 1.3 | 0.6 | 54% | 0.019 | 0.013 | 32% | 0.072 | 0.029 | 60% |
| 20 March 2017 | 8 | 2.5 1 | 69% | 0.005 | 0.005 | 0% | 0.6 | 0.4 | 33% | 0.007 | 0.005 | 29% | 0.041 | 0.018 | 56% |
| 19 May 2017 | 19 | 9 | 53% | 0.38 | 0.16 | 58% | 0.9 | 0.4 | 56% | 0.015 | 0.014 | 7% | 0.057 | 0.067 | –18% |
| 10 June 2017 | 30 | 6 | 80% | 0.21 | 0.03 | 86% | 1.1 | 0.9 | 18% | 0.015 | 0.006 | 60% | 0.065 | 0.023 | 65% |
| Average | 28 | 6 | 0.08 | 0.03 | 0.78 | 0.45 | 0.015 | 0.008 | 0.060 | 0.027 | |||||
| ER | 79% | 58% | 42% | 47% | 55% | ||||||||||
| Average CRE | 73% | 45% | 37% | 45% | 53% | ||||||||||
Results reported as < LOD were substituted with 50% of the LOD concentration in statistical analysis.
Table 3.
Event characteristics.
| Event | Rainfall Amount (mm) | Peak Intensity (mm/30 min) |
|---|---|---|
| 16 August 2014 | 20.4 | 4.2 |
| 18 August 2014 | 24.8 | 13.8 |
| 25 September 2014 | 15.8 | 15.2 |
| 9 December 2014 | 12.8 | 11.6 |
| 20 February 2015 | 67.6 | 7.2 |
| 30 April 2015 | 24.4 | 12.8 |
| 23 July 2015 | 21.8 | 2.0 |
| 18 September 2015 | 9.0 | 2.2 |
| 25 December 2015 | 5.4 | 4.0 |
| 1 March 2016 | 19.0 | 8.4 |
| 30 March 2016 | 12.6 | 7.4 |
| 14 April 2016 | 5.4 | 3.2 |
| 3 October 2016 | 8.4 | 4.4 |
| 12 October 2016 | 13.2 | 7.4 |
| 25 December 2016 | 33.0 | 12.6 |
| 26 December 2016 | 15.4 | 10 |
| 6 January 2017 | 5.4 | 2.0 |
| 5 March 2017 | 5.8 | 3.4 |
| 15 March 2017 | 7.2 | 2.2 |
| 18 March 2017 | 37.6 | 14.4 |
| 20 March 2017 | 21.4 | 6.4 |
| 5 April 2017 | 13.2 | 5.6 |
| 8 May 2017 | 17.2 | 2.6 |
| 19 May 2017 | 6.6 | 0.6 |
| 10 June 2017 | 14.8 | 7.2 |
Table 4.
Gross pollutant and nutrient analysis for pit baskets and the filter vault after 12 months of operation.
Table 4.
Gross pollutant and nutrient analysis for pit baskets and the filter vault after 12 months of operation.
| Parameter | Pit Baskets | Filter Vault |
|---|---|---|
| Total volume (m3) | 3.19 × 10⁻² | 1.71 × 10⁻² |
| % Anthropogenic volume | 0.11 | 0.12 |
| Total mass (kg) | 24.59 | 4.31 |
| % Anthropogenic mass | 0.31 | 1.52 |
| TN (mg/kg) | 1070 | 5960 |
| TP (mg/kg) | 104 | 684 |
Table 5.
Parametric and non-parametric test results, paired samples, 90% confidence interval.
| Treatment Device | p-Value (Two-Tailed) t-Test, Log-Transformed Datasets | p-Value (Two-Tailed) Wilcoxon Signed-Rank Test | |||
|---|---|---|---|---|---|
| TSS | TN | TP | Total Zn | Total Cu | |
| Pit basket in vs. out | <0.001 | <0.001 | <0.001 | - | - |
| Filter cartridge in vs. out | <0.001 | 0.001 | <0.001 | <0.0001 | 0.001 |
Table 6.
Estimated annual pollutant loads captured by pit baskets and filters in Ormiston, Queensland.
Table 6.
Estimated annual pollutant loads captured by pit baskets and filters in Ormiston, Queensland.
| Treatment Device | Annual TN load | Annual TP Load | Annual Sediment and Litter Load |
|---|---|---|---|
| Units | kg/Ha/year | kg/Ha/year | kg/Ha/year |
| Pit baskets | 0.129 | 0.0126 | 121.25 |
| Filter cartridges | 0.127 | 0.0145 | 21.25 |
Table 7.
Comparison of Ormiston surface water quality results with Brisbane Model for Urban Stormwater Improvement Conceptualisation (MUSIC) Guidelines for urban residential areas.
Table 7.
Comparison of Ormiston surface water quality results with Brisbane Model for Urban Stormwater Improvement Conceptualisation (MUSIC) Guidelines for urban residential areas.
| Parameter | MUSIC Guideline Values (Lumped Urban Residential Catchment) 1 | Ormiston Surface Influent (Pit Basket Inflow) | ||||
|---|---|---|---|---|---|---|
| −1 SD | Mean | +1 SD | −1 SD | Mean | +1 SD | |
| TSS (mg/L) | 61.7 | 151 | 372 | 0 | 64.7 | 174.1 |
| TP (mg/L) | 0.162 | 0.339 | 0.708 | 0 | 0.27 | 0.697 |
| TN (mg/L) | 1.07 | 1.82 | 3.09 | 0 | 1.72 | 2.494 |
Note: 1 Reference: [19].
Table 8.
U.S. field results for media cartridges, truncated to comply with Stormwater Quality Improvement Device Evaluation Protocol (SQIDEP) maximum concentrations.
Table 8.
U.S. field results for media cartridges, truncated to comply with Stormwater Quality Improvement Device Evaluation Protocol (SQIDEP) maximum concentrations.
| Pollutant | TSS | TP | ||
|---|---|---|---|---|
| LOD (mg/L) | 5 | 0.01 | ||
| n | 18 | 11 | ||
| Statistics | In (mg/L) | Out (mg/L) | In (mg/L) | Out (mg/L) |
| Minimum | 7.3 | 2.5 | 0.14 | 0.021 |
| Maximum | 279 | 25 | 0.47 | 0.14 |
| Average | 74.5 | 7.5 | 0.24 | 0.06 |
| ER | 90% | 76% | ||
| Average CRE | 80% | 76% | ||
© 2018 by the authors. Licensee MDPI, Basel, Switzerland. This article is an open access article distributed under the terms and conditions of the Creative Commons Attribution (CC BY) license (http://creativecommons.org/licenses/by/4.0/).
Share and Cite
MDPI and ACS Style
Drapper, D.; Hornbuckle, A. Removal of Nutrients, Sediment, and Heavy Metals by a Stormwater Treatment Train; a Medium-Density Residential Case Study in Southeast Queensland. Water 2018, 10, 1307. https://doi.org/10.3390/w10101307
AMA Style
Drapper D, Hornbuckle A. Removal of Nutrients, Sediment, and Heavy Metals by a Stormwater Treatment Train; a Medium-Density Residential Case Study in Southeast Queensland. Water. 2018; 10(10):1307. https://doi.org/10.3390/w10101307
Chicago/Turabian StyleDrapper, Darren, and Andy Hornbuckle. 2018. "Removal of Nutrients, Sediment, and Heavy Metals by a Stormwater Treatment Train; a Medium-Density Residential Case Study in Southeast Queensland" Water 10, no. 10: 1307. https://doi.org/10.3390/w10101307
Note that from the first issue of 2016, this journal uses article numbers instead of page numbers. See further details here.