Article

Quantitative Analysis of Membrane Fouling Mechanisms Involved in Microfiltration of Humic Acid–Protein Mixtures at Different Solution Conditions

1
Shandong Provincial Key Laboratory of Water Pollution Control and Resource Reuse, School of Environmental Science and Engineering, Shandong University, Jinan 250100, China
2
School of Environmental and Municipal Engineering, North China University of Water Resources and Electric Power, Zhengzhou 450046, China
3
Department of mathematics and Physical Sciences, Louisiana State University of Alexandria, 8100 Hwy 71 S, Alexandria, LA 71302-9119, USA
4
Department of Civil and Environmental Engineering, Texas Tech University, 10th and Akron, Lubbock, TX 79409-1023, USA
*
Author to whom correspondence should be addressed.
Water 2018, 10(10), 1306; https://doi.org/10.3390/w10101306
Submission received: 23 August 2018 / Revised: 12 September 2018 / Accepted: 19 September 2018 / Published: 22 September 2018

Abstract

:
A systematical quantitative understanding of different mechanisms, though of fundamental importance for better fouling control, is still unavailable for the microfiltration (MF) of humic acid (HA) and protein mixtures. Based on extended Derjaguin–Landau–Verwey–Overbeek (xDLVO) theory, the major fouling mechanisms, i.e., Lifshitz–van der Waals (LW), electrostatic (EL), and acid–base (AB) interactions, were for the first time quantitatively analyzed for model HA–bovine serum albumin (BSA) mixtures at different solution conditions. Results indicated that the pH, ionic strength, and calcium ion concentration of the solution significantly affected the physicochemical properties and the interaction energy between the polyethersulfone (PES) membrane and HA–BSA mixtures. The free energy of cohesion of the HA–BSA mixtures was minimum at pH = 3.0, ionic strength = 100 mM, and c(Ca2+) = 1.0 mM. The AB interaction energy was a key contributor to the total interaction energy when the separation distance between the membrane surface and HA–BSA mixtures was less than 3 nm, while the influence of EL interaction energy was of less importance to the total interaction energy. The attractive interaction energies of membrane–foulant and foulant–foulant increased at low pH, high ionic strength, and calcium ion concentration, thus aggravating membrane fouling, which was supported by the fouling experimental results. The obtained findings would provide valuable insights for the quantitative understanding of membrane fouling mechanisms of mixed organics during MF.

1. Introduction

Microfiltration (MF) is increasingly applied in water treatment due to the continuously decreasing cost and progressively more efficient performance of MF membranes [1,2]. However, membrane fouling, mainly caused by natural organic matter (NOM), still remains the primary impediment for the widespread application of MF technology [3]. Humic acid (HA) was identified as the main component of NOM [4], and is considered to be one of the main culprits causing membrane fouling [5]. Furthermore, protein is also ubiquitous in natural water and more hydrophilic than HA. Some investigations found that hydrophilic matter could result in more serious membrane fouling than hydrophobic matter [6,7]. Thus, protein can also contribute to membrane fouling in spite of its lower content in natural water [8]. Early literature demonstrated the fouling mechanisms of individual HA or protein in low-pressure membranes, as well as the impact of solution conditions on fouling propensity [9,10]. However, natural water does not contain only one kind of foulant, but a mixture of organic foulants. Therefore, it is necessary to explore more complicated fouling mechanisms of mixed organics during MF.
The mechanisms involved in HA–protein mixture fouling were studied to certain extent. Madaeni et al. [11] found that the co-existence of bovine serum albumin (BSA) resulted in higher HA rejection and lower flux during ultrafiltration (UF), which was mainly attributed to pore blocking and cake deposition. Salehi et al. [12] studied the adsorption behavior of HA to a UF membrane in the presence of protein and proposed that intermolecular electrostatic interactions played an important role. Myat et al. [13] evaluated the importance of interactions between HA and BSA in membrane fouling and put forward that electrostatic interactions, hydrophobic interactions, and hydrogen-bonding interactions were the dominant types of interactions. These previous studies provided a sound starting point for understanding the complex fouling mechanisms of HA–BSA mixtures. However, to date, the relative contribution to membrane fouling of each individual interaction, at the quantitative level, still remains unknown. The lack of such useful information greatly hinders the development of more precise fouling control strategies.
The extended Derjaguin–Landau–Verwey–Overbeek (xDLVO) theory is widely acknowledged as the most notable approach for the quantitative analysis of major membrane fouling mechanisms [14,15]. However, its application mainly focuses on the case of single foulant, and it is rarely reported for more complicated organic mixture fouling. Recently, Lin et al. [16] utilized xDLVO theory to elucidate the relative roles of different fouling mechanisms involved in the UF of HA and fulvic acid (FA) mixtures, and demonstrated the feasibility of using xDLVO theory for predicting UF membrane fouling. Nevertheless, this study only focused on the interactions between membrane and foulants in the initial stage, neglecting those between foulants and foulants in the subsequent stage. Ding et al. [17] adopted xDLVO theory to explore the influence of varying proportions of BSA and sodium alginate (SA) mixtures on MF membrane fouling. It was reported that the physicochemical interactions between foulants and membrane and between foulant molecules are very complex, which are greatly impacted by solution conditions (i.e., ionic strength and divalent cations). However, to date, the xDLVO theory is yet to be applied for the quantitative analysis of membrane fouling mechanisms involved in MF of humic acid–protein mixtures.
In this work, the major mechanisms (i.e., Lifshitz–van der Waals (LW), electrostatic (EL), and acid–base (AB) interactions) underlying HA–protein mixture fouling was, for the first time, quantitatively analyzed in a systematical manner. The xDLVO theory was applied for both the initial membrane–foulant interactions and the subsequent foulant–foulant interactions. Furthermore, the effects of all classically investigated solution conditions (i.e., pH, ionic strength, and calcium ion concentration) on fouling mechanisms were quantitatively evaluated. The acquired results would further extend xDLVO application in elucidating organic mixture fouling, and would particularly provide valuable quantitative insight into humic acid–protein mixture fouling.

2. Materials and Methods

2.1. Microfiltration Membrane and Model Foulants

A polyethersulfone (PES) membrane with a pore size of 0.22 μm (Haichengshijie filtering equipments Co. Ltd., Beijing, China) was adopted in this study. Prior to use, the PES membrane was immersed in deionized (DI) water for 24 h to remove impurities or additives. Powdered humic acid (HA, Sigma Aldrich, Saint Louis, MO, USA) was chosen as the representative of humic substances in natural organic matter. The stock solution (1 g·L−1) was prepared by dissolving pre-weighed amounts of powdered HA in DI water, followed by filtration through a 0.45-μm nylon membrane to remove insoluble substances. Commercially available bovine serum albumin (BSA; Roche, Mannhein, Germany) was used as the protein-like substance in natural organic matter. According to the manufacturer, BSA has a molecular weight of 68 kDa and a molecular size of 14 nm × 4 nm × 4 nm. Humic substances in NOM accounted for 50–90% in natural water [18], and the concentrations usually ranged from 2 to 10 mg·L−1 [19]. To simulate natural water components, the applied raw concentrations of HA and BSA in the solution were set at 4:1, respectively, leading to a total concentration of 10 mg·L−1.
The solution ionic strength (NaCl) was amended to 10 mM and the pH was adjusted to 3.0, 4.7, 7.0, and 9.0 using small amounts of either 0.1 M HCl or NaOH. At the same time, the mixed solutions with different NaCl concentrations of 10, 20, 50, and 100 mM were used to investigate the influence of ionic strength when the solution pH was 7.0. The mixed solutions with different Ca2+ concentrations of 0, 0.2, 0.5, and 1.0 mM were prepared to study the effect of divalent cations at a constant pH of 7.0 and an NaCl concentration of 10 mM. In addition, the baseline solution conditions were set as pH = 7.0, ionic strength = 10 mM, and c(Ca2+) = 0 mM.

2.2. xDLVO Theory

According to Van Oss [20], the total interfacial interaction energy for aqueous systems comprises Lifshitz–van der Waals (LW), electrostatic (EL), and acid–base (AB) interactions, which can be written as follows:
U m l f T O T = U m l f L W + U m l f E L + U m l f A B ,
where U m l f T O T is the total interaction energy between a membrane surface and a foulant immersed in water, and U m l f L W , U m l f E L , and U m l f A B are the LW, EL, and AB interaction energy terms, respectively. The subscripts m, l, and f correspond to the membrane, bulk liquid (e.g., water in this study), and foulants (HA and BSA mixtures in this study), respectively.

2.2.1. Surface Thermodynamic Parameters

In order to calculate interfacial interaction energies, the surface tension parameters ( γ s L W , γ s + , and γ s ) of the membrane and HA–BSA mixtures were obtained using contact angle measurements, performing three probe liquids with well-known surface tension parameters and employing the extended Young equation, which can be given as follows [21,22]:
( 1 + cos θ ) γ l T O T = 2 ( γ s L W γ l L W + γ s + γ l + γ s γ l + ) ,
where θ is the contact angle and γ T O T ( = γ L W + γ A B ) is the total surface tension. γ L W is the Lifshitz–van der Waals component and γ A B ( = 2 γ + γ ) is the acid–base component. γ + and γ are the electron-acceptor and electron-donor components, respectively. The subscripts s and l represent solid surface and liquid, respectively.
The interfacial free energy per unit area between membrane and foulant contact in aqueous solution could be determined using the surface tension parameters calculated above. It is assumed that contact occurs at the minimum equilibrium cut-off distance, d0, which represents a value of 0.158 nm (±0.009 nm) [23]. The LW and AB free energies per unit are expressed as follows:
Δ G d 0 L W = 2 ( γ l L W γ m L W ) ( γ f L W γ l L W ) ;
Δ G d 0 A B = 2 γ l + ( γ m + γ f γ l ) + 2 γ l ( γ m + + γ f + γ l + ) 2 ( γ m + γ f + γ m γ f + ) .

2.2.2. Interfacial Interaction Energy

As the separation distance (d) between two surfaces increases, the LW and AB interaction energy components are gradually reduced by the interaction energy following the specific attenuation form. In order to obtain the actual interaction energies, Derjaguin’s technique was applied to calculate interaction energies between a spherical foulant and an infinite planar surface. The LW, AB, and EL interaction energy components can be given by [24]
U m l f L W ( d ) = A H a f 6 d ,
U m l f A B ( d ) = 2 π a f λ Δ G d 0 A B exp ( d 0 d λ ) ,
U m l f E L ( d ) = π ε r ε 0 a f ( 2 ζ m ζ f ln ( 1 + exp ( κ d ) 1 exp ( κ d ) ) + ( ζ m 2 + ζ f 2 ) ln ( 1 exp ( 2 κ d ) ) ) ,
where AH ( = 12 π d 0 2 Δ G d 0 L W ) is the Hamaker constant, af is the radius of the spherical foulant, d is the separation distance between foulant and membrane, λ (=0.6 nm) is the characteristic decay length of AB interaction in water, ε0 (=8.854 × 10⁻¹² C·V−1·m−1) is the dielectric permittivity in vacuum, εr (=78.5) is the relative permittivity of water, ζm and ζf are the zeta potentials of membrane and foulant, respectively, and κ is the inverse Debye screening length, which is determined by [25]
κ = e 2 Σ n i z i 2 ε r ε 0 k T ,
where e (=1.6 × 10⁻¹⁹ C) is the electron charge, ni is the number concentration of ion i in the bulk solution, zi is the valence of ion i, k (=1.38 × 10⁻²³ J·K−1) is the Boltzmann’s constant, and T is the absolute temperature. The background electrolyte concentration in this study was 0.01 M NaCl.
Likewise, interaction energies between two spherical foulant particles could also be calculated using Derjaguin’s technique.
U f l f L W ( d ) = A H a 1 a 2 6 d ( a 1 + a 2 ) ,
U f l f A B ( d ) = 2 π a 1 a 2 a 1 + a 2 λ Δ G d 0 A B exp ( d 0 d λ ) ,
U f l f E L ( d ) = π ε 0 ε r a 1 a 2 a 1 + a 2 ζ f 2 ln ( 1 + e κ d ) ,
where a1 and a2 are the radii of the interacting foulant particles.

2.3. Analytical Methods

Contact angles of the PES membrane and HA–BSA mixtures at different solution conditions were measured using the sessile drop method with a goniometer (JC2000C Contact Angle Meter, Shanghai Zhongchen Experiment Equipments Co. Ltd., Shanghai, China). The three kinds of probe liquids selected for contact angle measurements were DI water, glycerol, and diiodomethane. These probe liquids were chosen on the premise that two of them must be polar (DI water and glycerol) and the other must be non-polar (diiodomethane) [23]. At least seven measurements at different locations were averaged to obtain a reliable value for each sample.
The zeta potential of the PES membrane was determined using a zeta potential analyzer (SurPASS, Anton Paar, Graz, Austria). The zeta potential of foulants was measured using a zetasizer (3000HSa, Malvern Instruments, Malvern, UK). Dynamic light scattering (DLS; BI-200SM/BI-9000, Brookhaven, Holtsville, NY, USA) was used to measure the hydraulic diameters of foulant molecules at different solution conditions in order to calculate the interfacial interaction energies. Each data value is the average of three measurements. All the measurements in the study were performed at 20.0 ± 1.0 °C. The morphology of the fouled membrane surface was observed with scanning electron microscopy (SEM; JSM-7600F, JEOL, Tokyo, Japan) under baseline solution conditions. In order to ensure the reliability of experimental results, the same side of the HA–BSA fouled membrane was chosen for SEM image analysis.

2.4. Fouling Experiments

The dead-end MF experiments were conducted at constant pressure mode at room temperature (20 ± 1.0 °C). The experimental system is shown in Figure S1 of the Supplementary Materials. The stirred cell had an inner diameter of 8 cm, providing an effective filtration area of 50.26 cm2, and it was equipped with a built-in rotor. The stirring speed was set at 180 rpm [26] throughout the whole filtration process to prevent concentration polarization by means of applying shear stress on the membrane surface. Before each filtration of feed solution, DI water was filtered through the PES membrane with an operating pressure of 20 kPa for about 20 min to stabilize the filtration system, and the initial flux J0 was measured. Then, the mixed solution was introduced into the stirred cell, and permeate flux was measured by a balance connected to a computer. Filtration was stopped when permeate flux leveled off (approximately 5 L) and no change happened within 30 min.
To analyze fouling behaviors in different filtration stages, the entire filtration process was separated into initial and final stages, with correspondence to adhesion stage and cohesion stage, respectively. Following the initial stage, the final stage started (i.e., where the two stages were separated) when the ratio of filtration time t to cumulative permeate volume V was proportional to V, as expressed in the cake filtration model [27]:
t / V = a V + b ,
where α and b are model parameters.
Fouling potential (K) was adopted as a parameter indicating the severity of membrane fouling. It is defined as the reduction in relative flux caused by a unit mass of HA–BSA mixtures that is brought in contact with the membrane surface. Fouling potentials of initial and final stages were determined according to the following equation:
K = Δ ( J / J 0 ) C 0 × Δ V ,
where C0 is the concentration of feed solution.

3. Results and Discussion

3.1. Physicochemical Properties of the PES Membrane and Foulants

The average contact angles, as well as the zeta potentials of the clean membranes before usage and the fouled membranes fully covered with HA–BSA mixtures after usage, were systemically measured, and are listed in Table 1. Despite the contact angles of the PES membrane being reported in many references [28,29], the variation in PES membrane contact angle in different solution conditions remains unknown. It was found that the water contact angles (θW) of the PES membrane decreased with increasing pH, suggesting that water molecules are energetically favorable for contacting with the membrane. The reduced θW probably resulted from the more intensive hydrogen bonding between water molecules and the membrane surface at higher pH. A similar trend was also observed by Meng et al. measuring the θW of polyamide (PA) and polypropylene (PP) membranes at different solution pH [30]. On the contrary, the θW of the PES membrane increased with increasing ionic strength and calcium ion concentration. Though the contact angles of HA or BSA alone with solution conditions were measured in previous work [30,31], no information was available regarding HA–BSA mixtures. As shown in Table 1, it is interesting to note that the θW of the HA–BSA mixtures exhibited a similar trend with solution conditions to that of the PES membrane. The glycerol contact angles (θG) increased with decreasing pH or increasing ionic strength and calcium ion concentration, but not as significantly as θW. In contrast, no significant trends regarding the variation in diiodomethane contact angle (θD) with solution conditions were observed regardless of membrane and foulant.
The variations in zeta potential of the PES membrane and HA–BSA mixtures with solution conditions were also measured, as shown in Table 1. Zeta potentials of the membrane and foulants decreased remarkably (i.e., more negatively charged) with the increase in solution pH. This can be attributed to the intensified deprotonation of –COOH groups at higher solution pH. The increase in ionic strength lowered the absolute value of zeta potentials (i.e., less negatively charged). This phenomenon may be related with the shielding effect or double-layer compression by the increase in the number of counter ions with the increasing ionic strength [32]. Zeta potentials increased with the addition of calcium ions, probably due to the preferential adsorption of divalent cations to the negatively charged membrane/foulant surface.

3.2. Surface Tension Parameters of the PES Membrane and Foulants

The calculated surface tension parameters and free energy of cohesion of the PES membrane and HA–BSA mixtures at different solution conditions are summarized in Table 2. Both the PES membrane and HA–BSA mixtures possessed high electron-donor components (γ) and relatively low electron-acceptor components (γ+). This is consistent with previous studies, reporting that polymeric membranes and organic matter typically showed high electron-donor properties [33,34]. The γ values of the PES membrane and HA–BSA mixtures increased with increasing pH, while they decreased at a high ionic strength and calcium concentration. It can be noted that the trend of γ values with solution conditions was similar to that of the absolute value of zeta potentials. There seems to be a strong relationship between electron-donor components and negative surface charge. This may be ascribed to the deprotonation of surface groups, the enhancement of negative charge at high pH, and low ionic strength and calcium ion concentration. In contrast, no significant trend of γ+ values with solution conditions was observed. In addition, compared with LW surface tension (γLW), acid–base surface tension (γAB) was found to be much lower, which can be attributed to the smaller γ+ values.
ΔGsls represents the interaction energy per unit area when two surfaces with the same material composition come into contact with each other [35,36]. It can be used as an indicator of hydrophobic/hydrophilic properties with negative and positive values indicating hydrophobic and hydrophilic surfaces, respectively. As shown in Table 2, the positive ΔGsls of the PES membrane increased with increasing solution pH, suggesting that higher pH enhanced membrane hydrophilicity. In particular, the PES membrane changed from hydrophilic to hydrophobic when the ionic strength and calcium ion concentration reached 100 mM and 0.2 mM, respectively. This implies that the increasing ionic strength and the presence of calcium ions would make the HA–BSA mixtures deposit/adsorb onto the membrane surface easier. It can also be seen from Table 2 that the calculated ΔGsls of the HA–BSA mixtures at pH = 3.0, ionic strength = 100 mM, and c(Ca2+) = 1.0 mM was minimum, indicating that the HA–BSA mixtures was more hydrophobic and thermodynamically unstable. In addition, the ΔGsls of the HA–BSA mixtures under all the conditions tested was negative, suggesting that the HA–BSA mixtures was hydrophobic. However, previous studies found that BSA was hydrophilic and HA was more hydrophobic in natural water [37]. These results probably appeared because the high proportion of hydrophobic HA played a decisive role in the mixed solution.

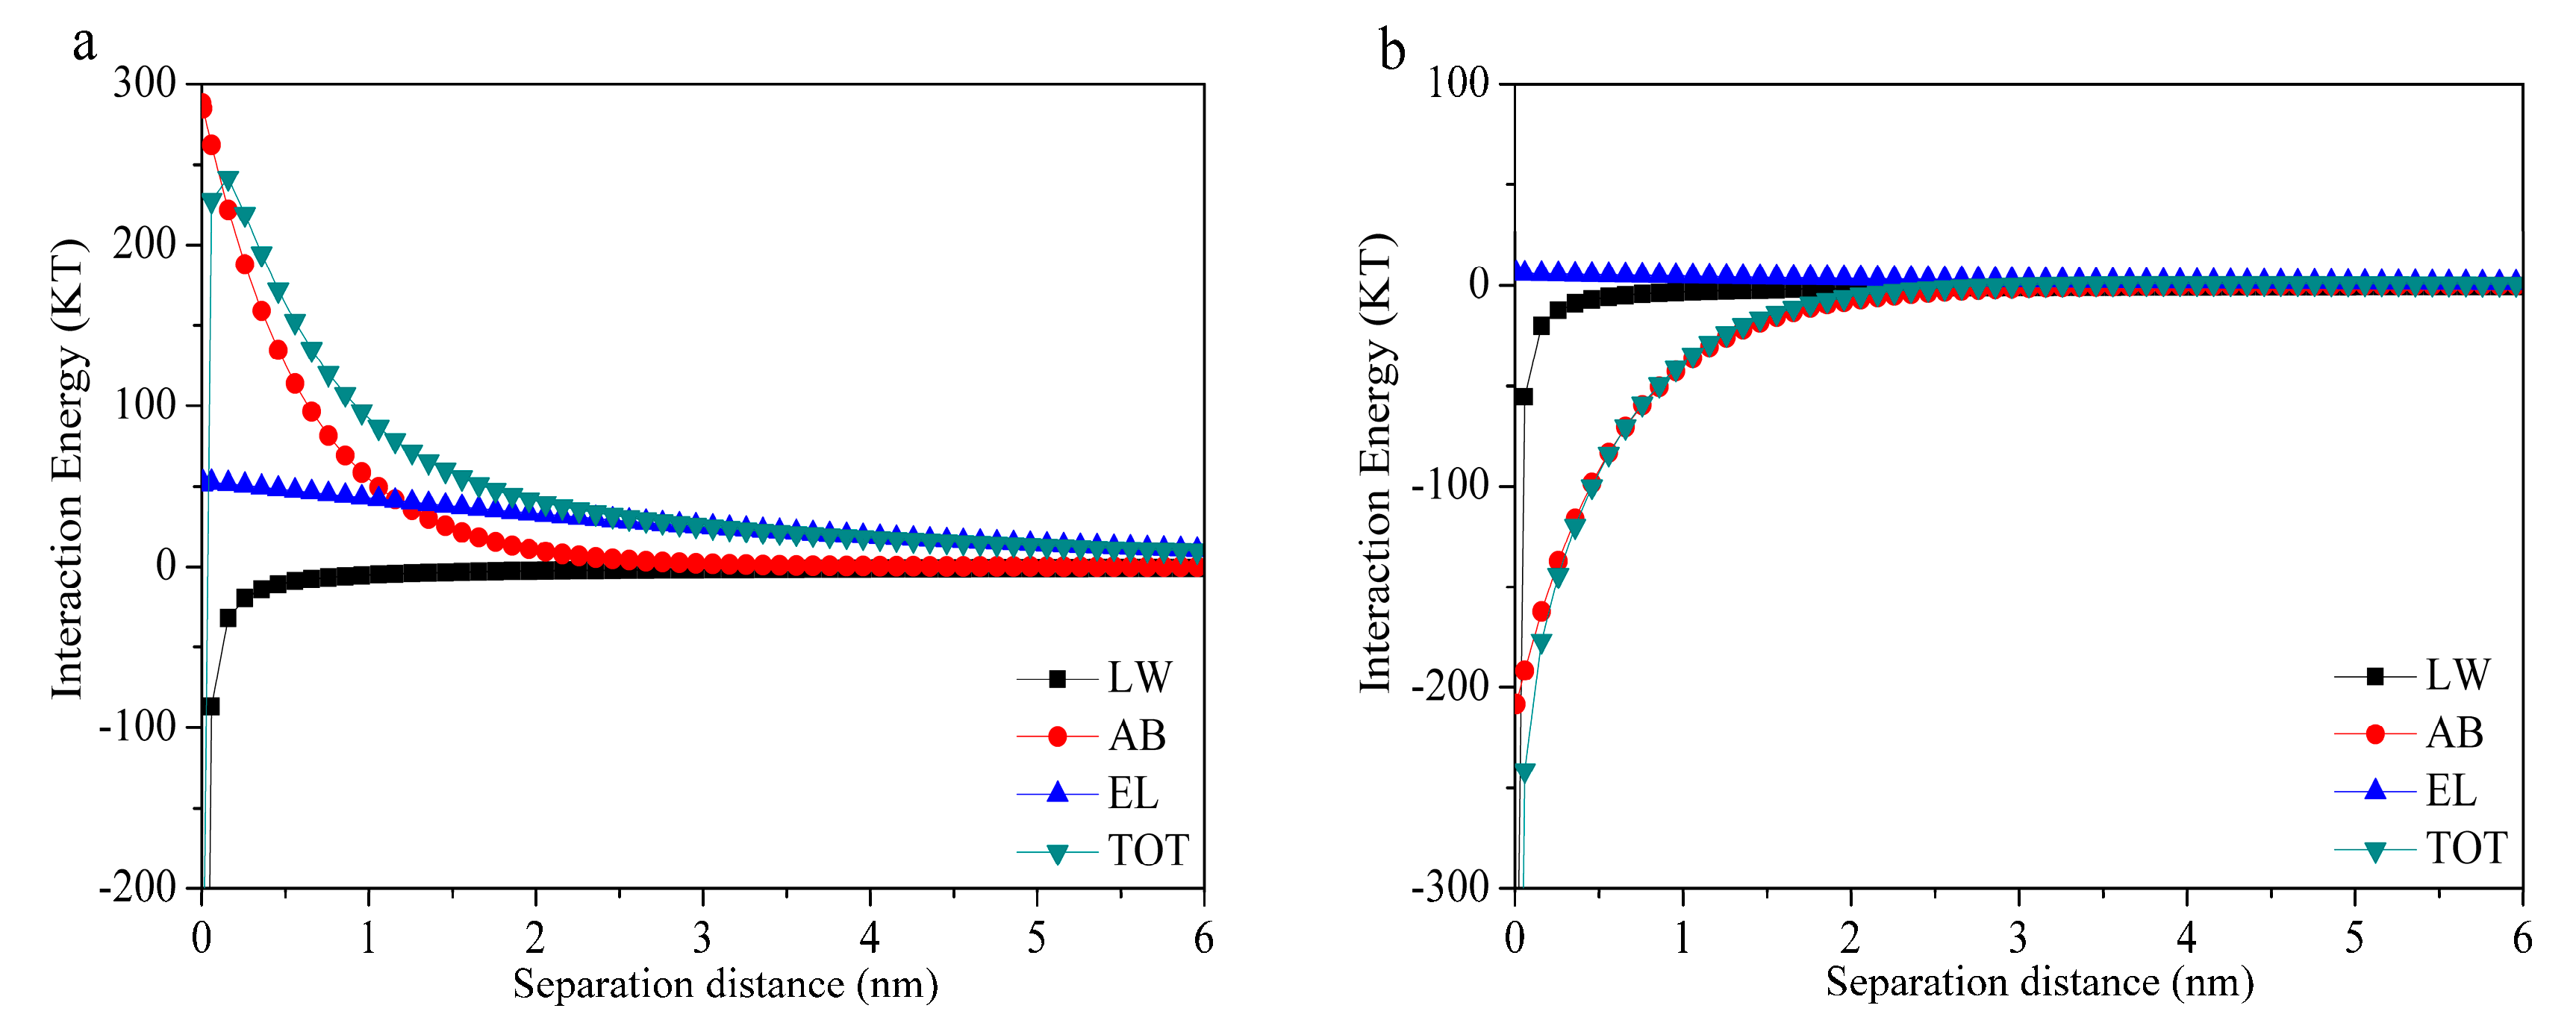
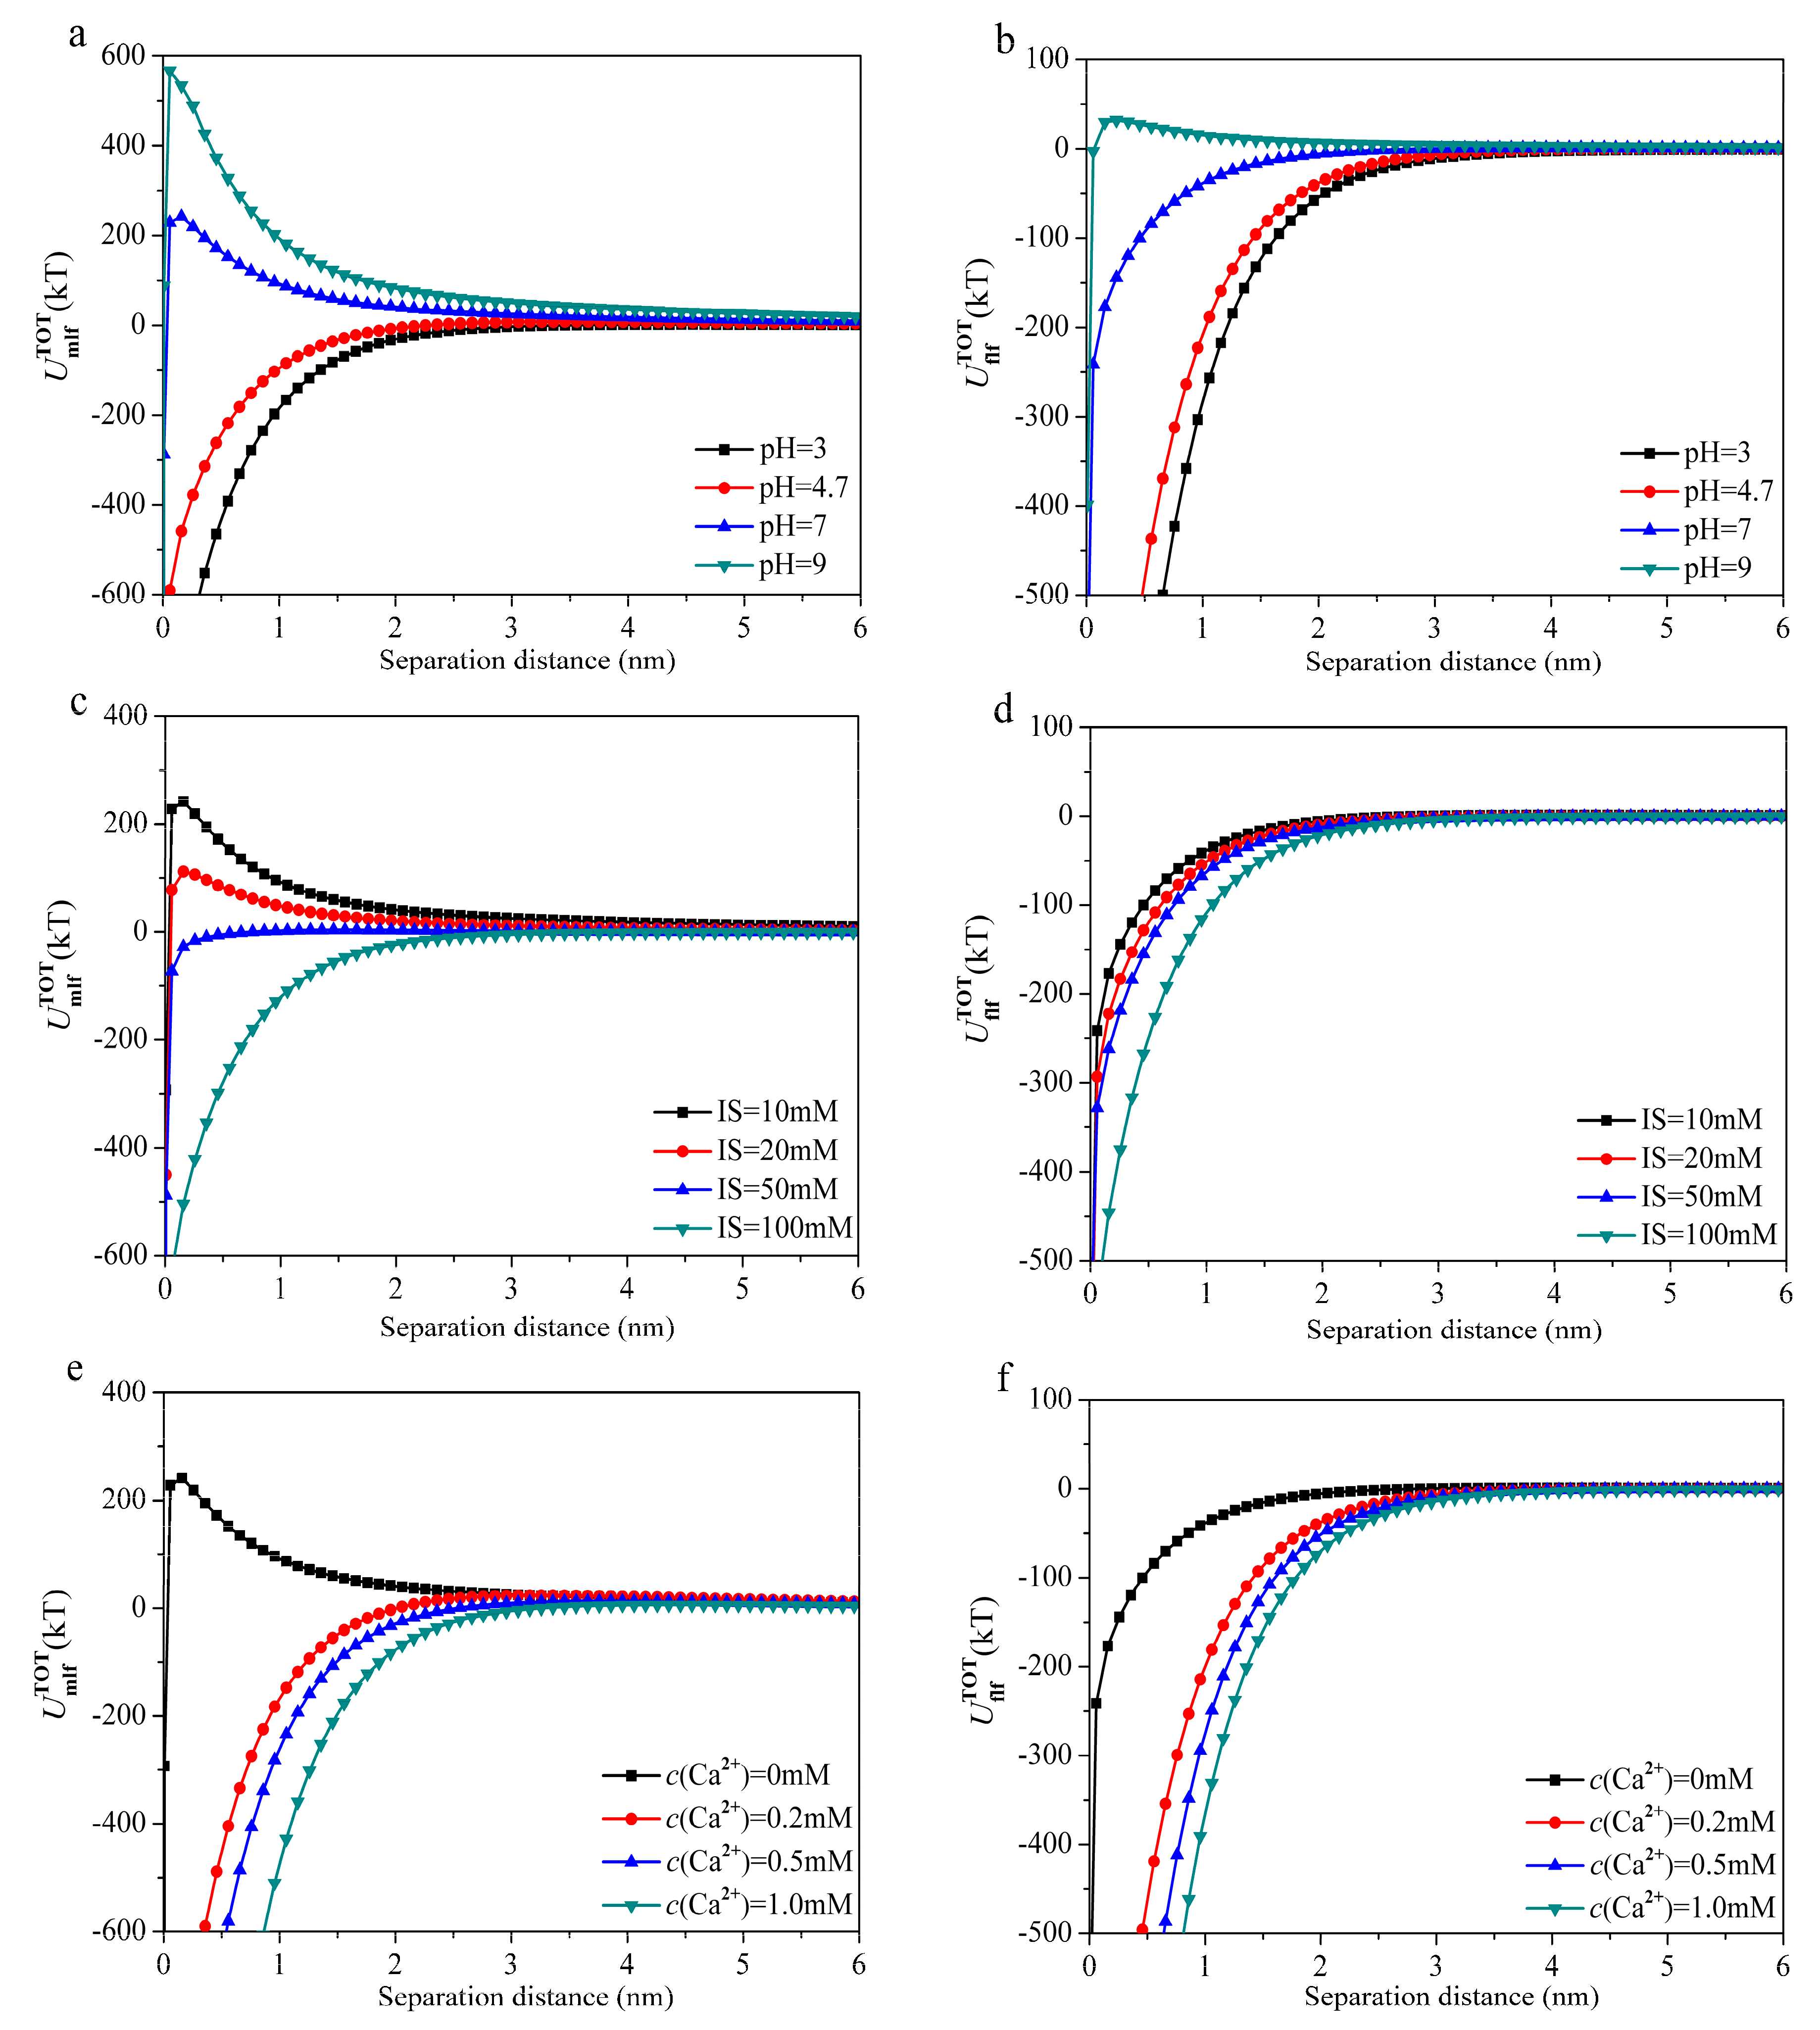
3.3. Interfacial Interaction Energies of Membrane–Foulant and Foulant–Foulant Combinations

Based on the above surface tension parameters, the interfacial interaction energies of membrane–foulant and foulant–foulant combinations at different solution conditions were calculated and are shown in Table 3. According to the xDLVO theory, a positive value of interaction energy implies repulsive interaction that hinders membrane fouling, while a negative value indicates attractive interaction that aggravates membrane fouling [16,38]. The greater absolute value of interfacial interaction energy signifies a stronger repulsive/attractive interaction between two surfaces.
According to the corresponding measurements, the change in membrane adhesive features before and after usage can be determined, corresponding to the clean membrane–foulant and fouled membrane–foulant interactions, respectively. Usually, membrane fouling behavior during the initial filtration period can be reasonably expected to be determined by the clean membrane–foulant interaction. As shown in Table 3, the PES–foulant combination had a negative LW interaction energy regardless of the variation in solution conditions, indicating that the LW component accelerates membrane fouling in the initial stage. The EL interaction energy was positive in the solution conditions studied, suggesting that the EL component can prevent initial membrane fouling. However, the AB interaction energy ( U m l f A B ) of the PES–foulant combination was negative at low pH, high ionic strength, and calcium ion concentration, indicating that the AB interaction can accelerate initial fouling. This is attributed to the more hydrophobic nature of the PES membrane at these solution conditions, which is indicated by ΔGsls shown in Table 2. Furthermore, compared with the LW and EL interaction energies, the absolute value of AB interaction energy was much higher. Therefore, the AB interaction energy plays an important role in determining both the sign and absolute value of the overall interaction energies between membrane and foulants.
As the entire membrane surface is covered with HA–BSA mixtures, the following membrane fouling behavior would be controlled by foulant–foulant interaction. It can also be seen from Table 3 that the trend of absolute value with solution conditions of all foulant–foulant interaction energies was similar as that of membrane–foulant energies. The LW interaction energy was negative, suggesting that LW interaction can boost the attachment of the approaching HA–BSA mixtures to the deposited mixtures. The EL interaction energy was positive, and thus, resisted the HA–BSA mixtures. The AB interaction energy, because of its much larger absolute value, also plays a critical role in determining the value of total interaction energy between foulants and foulants.
To further elucidate the role of different mechanisms in membrane fouling, the variation in interaction energy components with separation distance under baseline solution conditions is shown in Figure 1. It can be found from Figure 1a that the HA–BSA mixtures was subject to repulsive interactions (AB component) with a decrease in the distance between membrane and foulants (d < 3 nm). When the foulants approached the membrane surface, the total interaction energy became attractive, resulting in the adsorption of foulants. In addition, Figure 1b depicts that the AB and LW interaction energies between foulants and foulants exhibited entirely attractive interactions. The effect of EL interaction energy was of less importance to the total interaction energy, which agrees with certain studies [15,39]. These results clearly showed that the AB interaction energy was a main contributor to the total interaction energy when the separation distance between the membrane surface and HA–BSA mixtures was less than 3 nm.
Variations in total interaction energy were significantly influenced by different solution conditions. Figure 2 displays the variation in interaction energies of membrane–foulant and foulant–foulant with separation distance at different solution conditions. It can be found from Figure 2a that the energy barrier decreased with the decrease in pH from 9.0 to 7.0, and then disappeared with the further decrease in pH to 4.7 and 3.0. The energy barrier means that the foulants should have sufficient kinetic energy to overcome the barrier to arrive at the membrane surface [40]. Under alkaline conditions, the interaction energy between membrane and foulants exhibited entirely repulsive interactions because of the deprotonation of the HA–BSA mixtures, resulting in the increase of the energy barrier and reducing the adsorption of foulants. In addition, Hoek et al. [41] and Chen et al. [28] reported that surface morphology significantly influenced the fouling behavior of the membrane, and found that the great influence of roughness on the membrane surface was to reduce the primary energy barrier’s height, thus rendering rough surfaces more favorable for foulant deposition. As seen from Figure 2b, the interaction energy of foulant–foulant exhibited similar variation with solution pH as that of membrane–foulant. Figure 2c–f show that ionic strength and calcium ion concentration had significant influences on the total interaction energy. It was obvious that the attractive interaction energy increased substantially with the increases in ionic strength and calcium ion concentration. When the ionic strength and calcium ion concentration were 50 mM and 0.2 mM, respectively, the interaction energies were entirely attractive. The reduction in repulsive interaction can be ascribed to the charge neutralization effect with the addition of electrolytes. Thus, it can be concluded that the HA–BSA mixtures was subject to greater attractive interactions with the PES membrane at low pH, and high ionic strength and calcium ion concentration.
According to the above trends of total interaction energies with solution conditions, some qualitative predictions about MF membrane fouling caused by HA–BSA mixtures can be yielded. The membrane fouling potential of HA–BSA mixtures would follow the order of pH = 3.0 > pH = 4.7 > pH = 7.0 > pH = 9.0; IS = 100 mM > IS = 50 mM > IS = 20 mM > IS = 10 mM; and c(Ca2+) = 1.0 mM > c(Ca2+) = 0.5 mM > c(Ca2+) = 0.2 mM > c(Ca2+) = 0 mM.

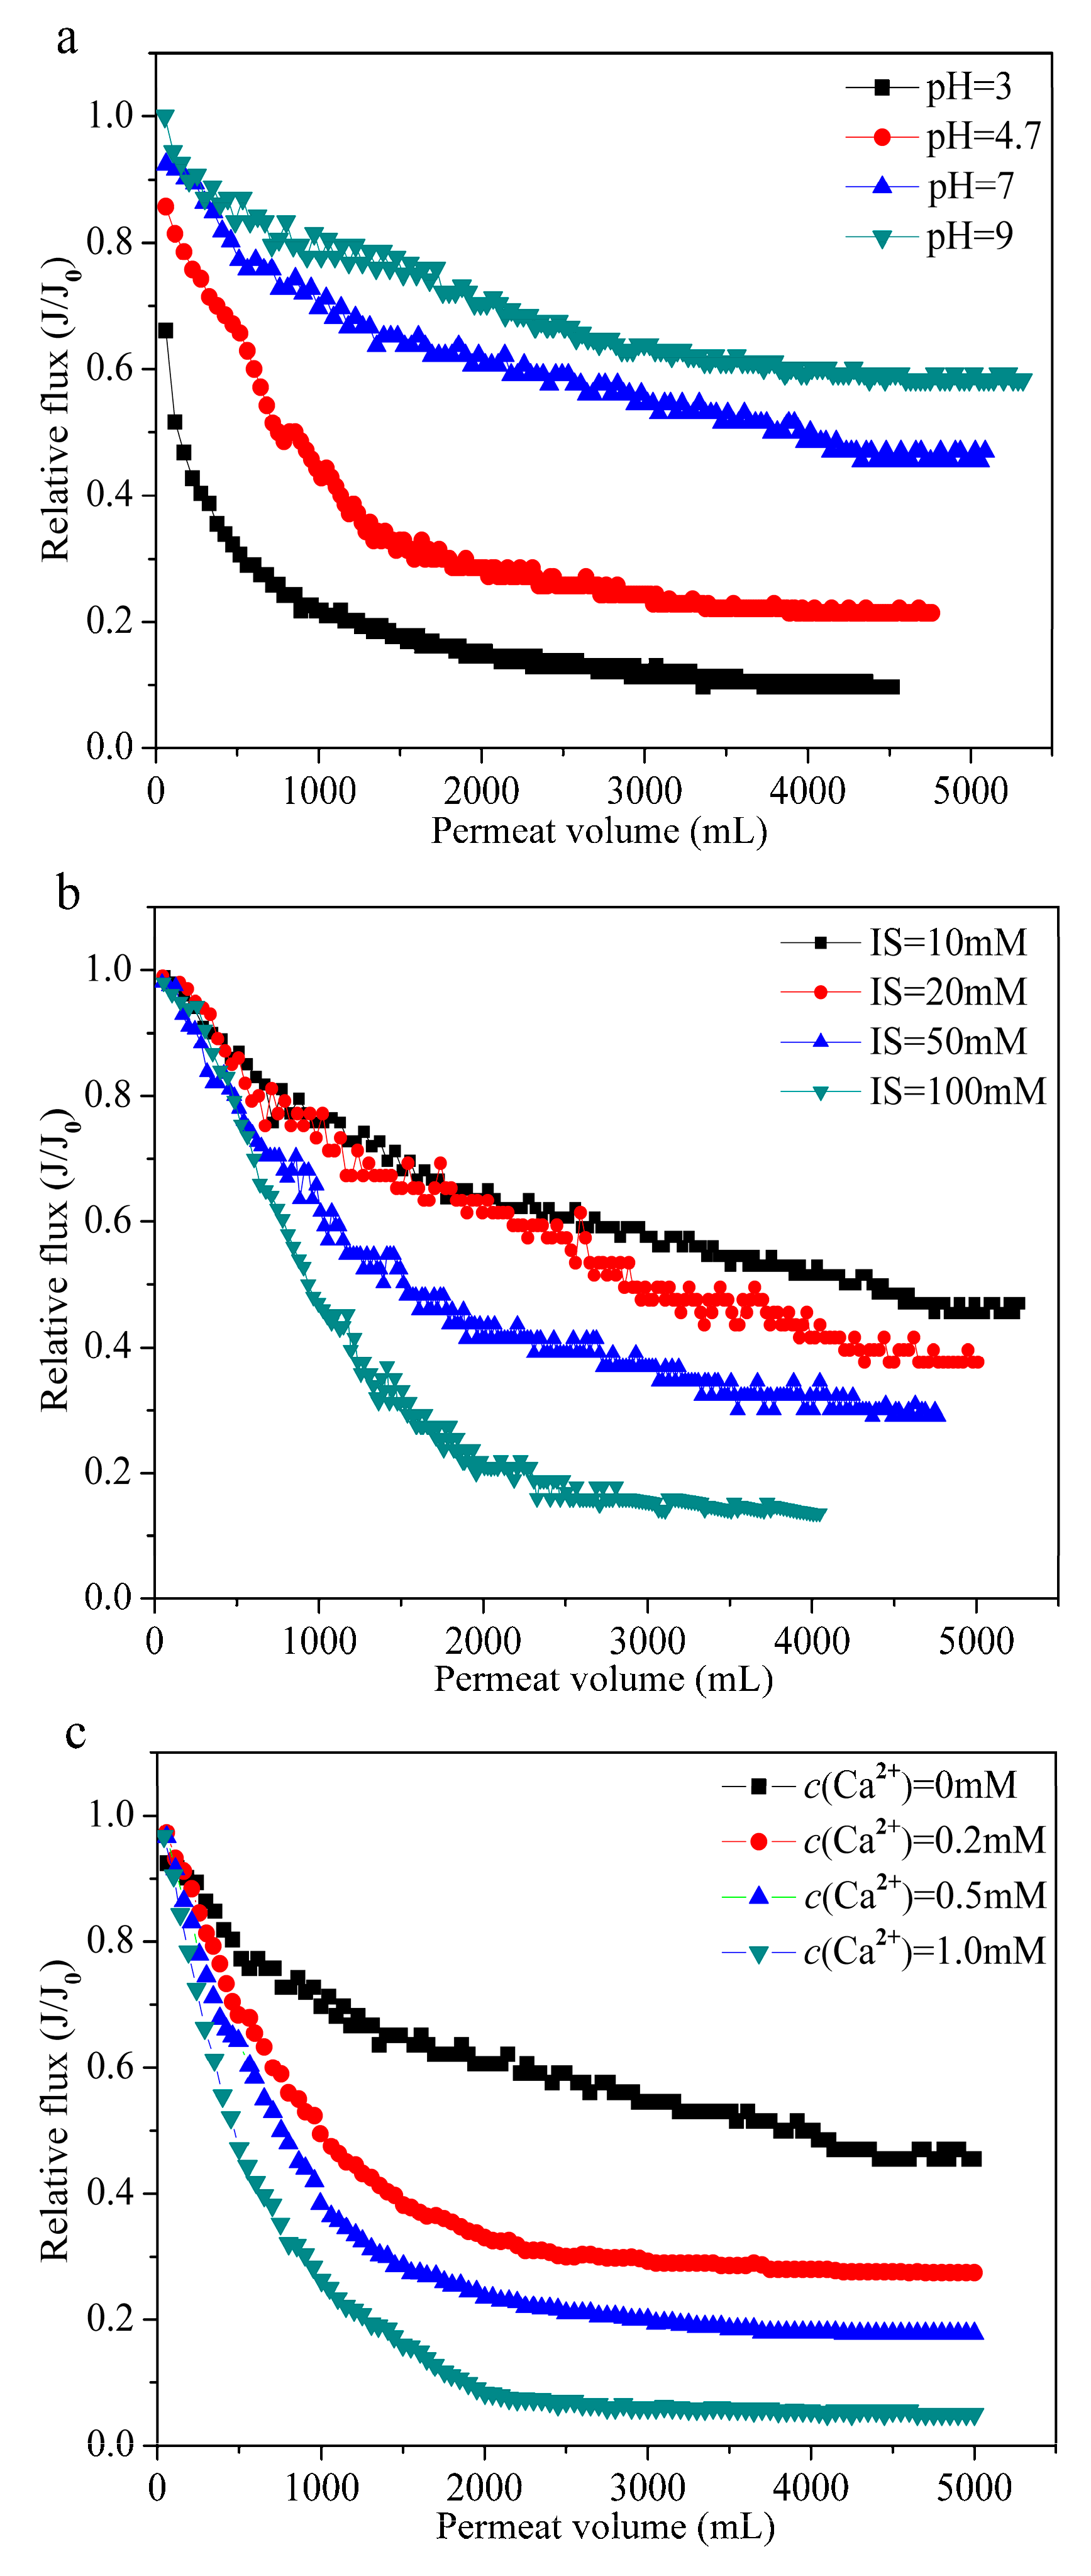
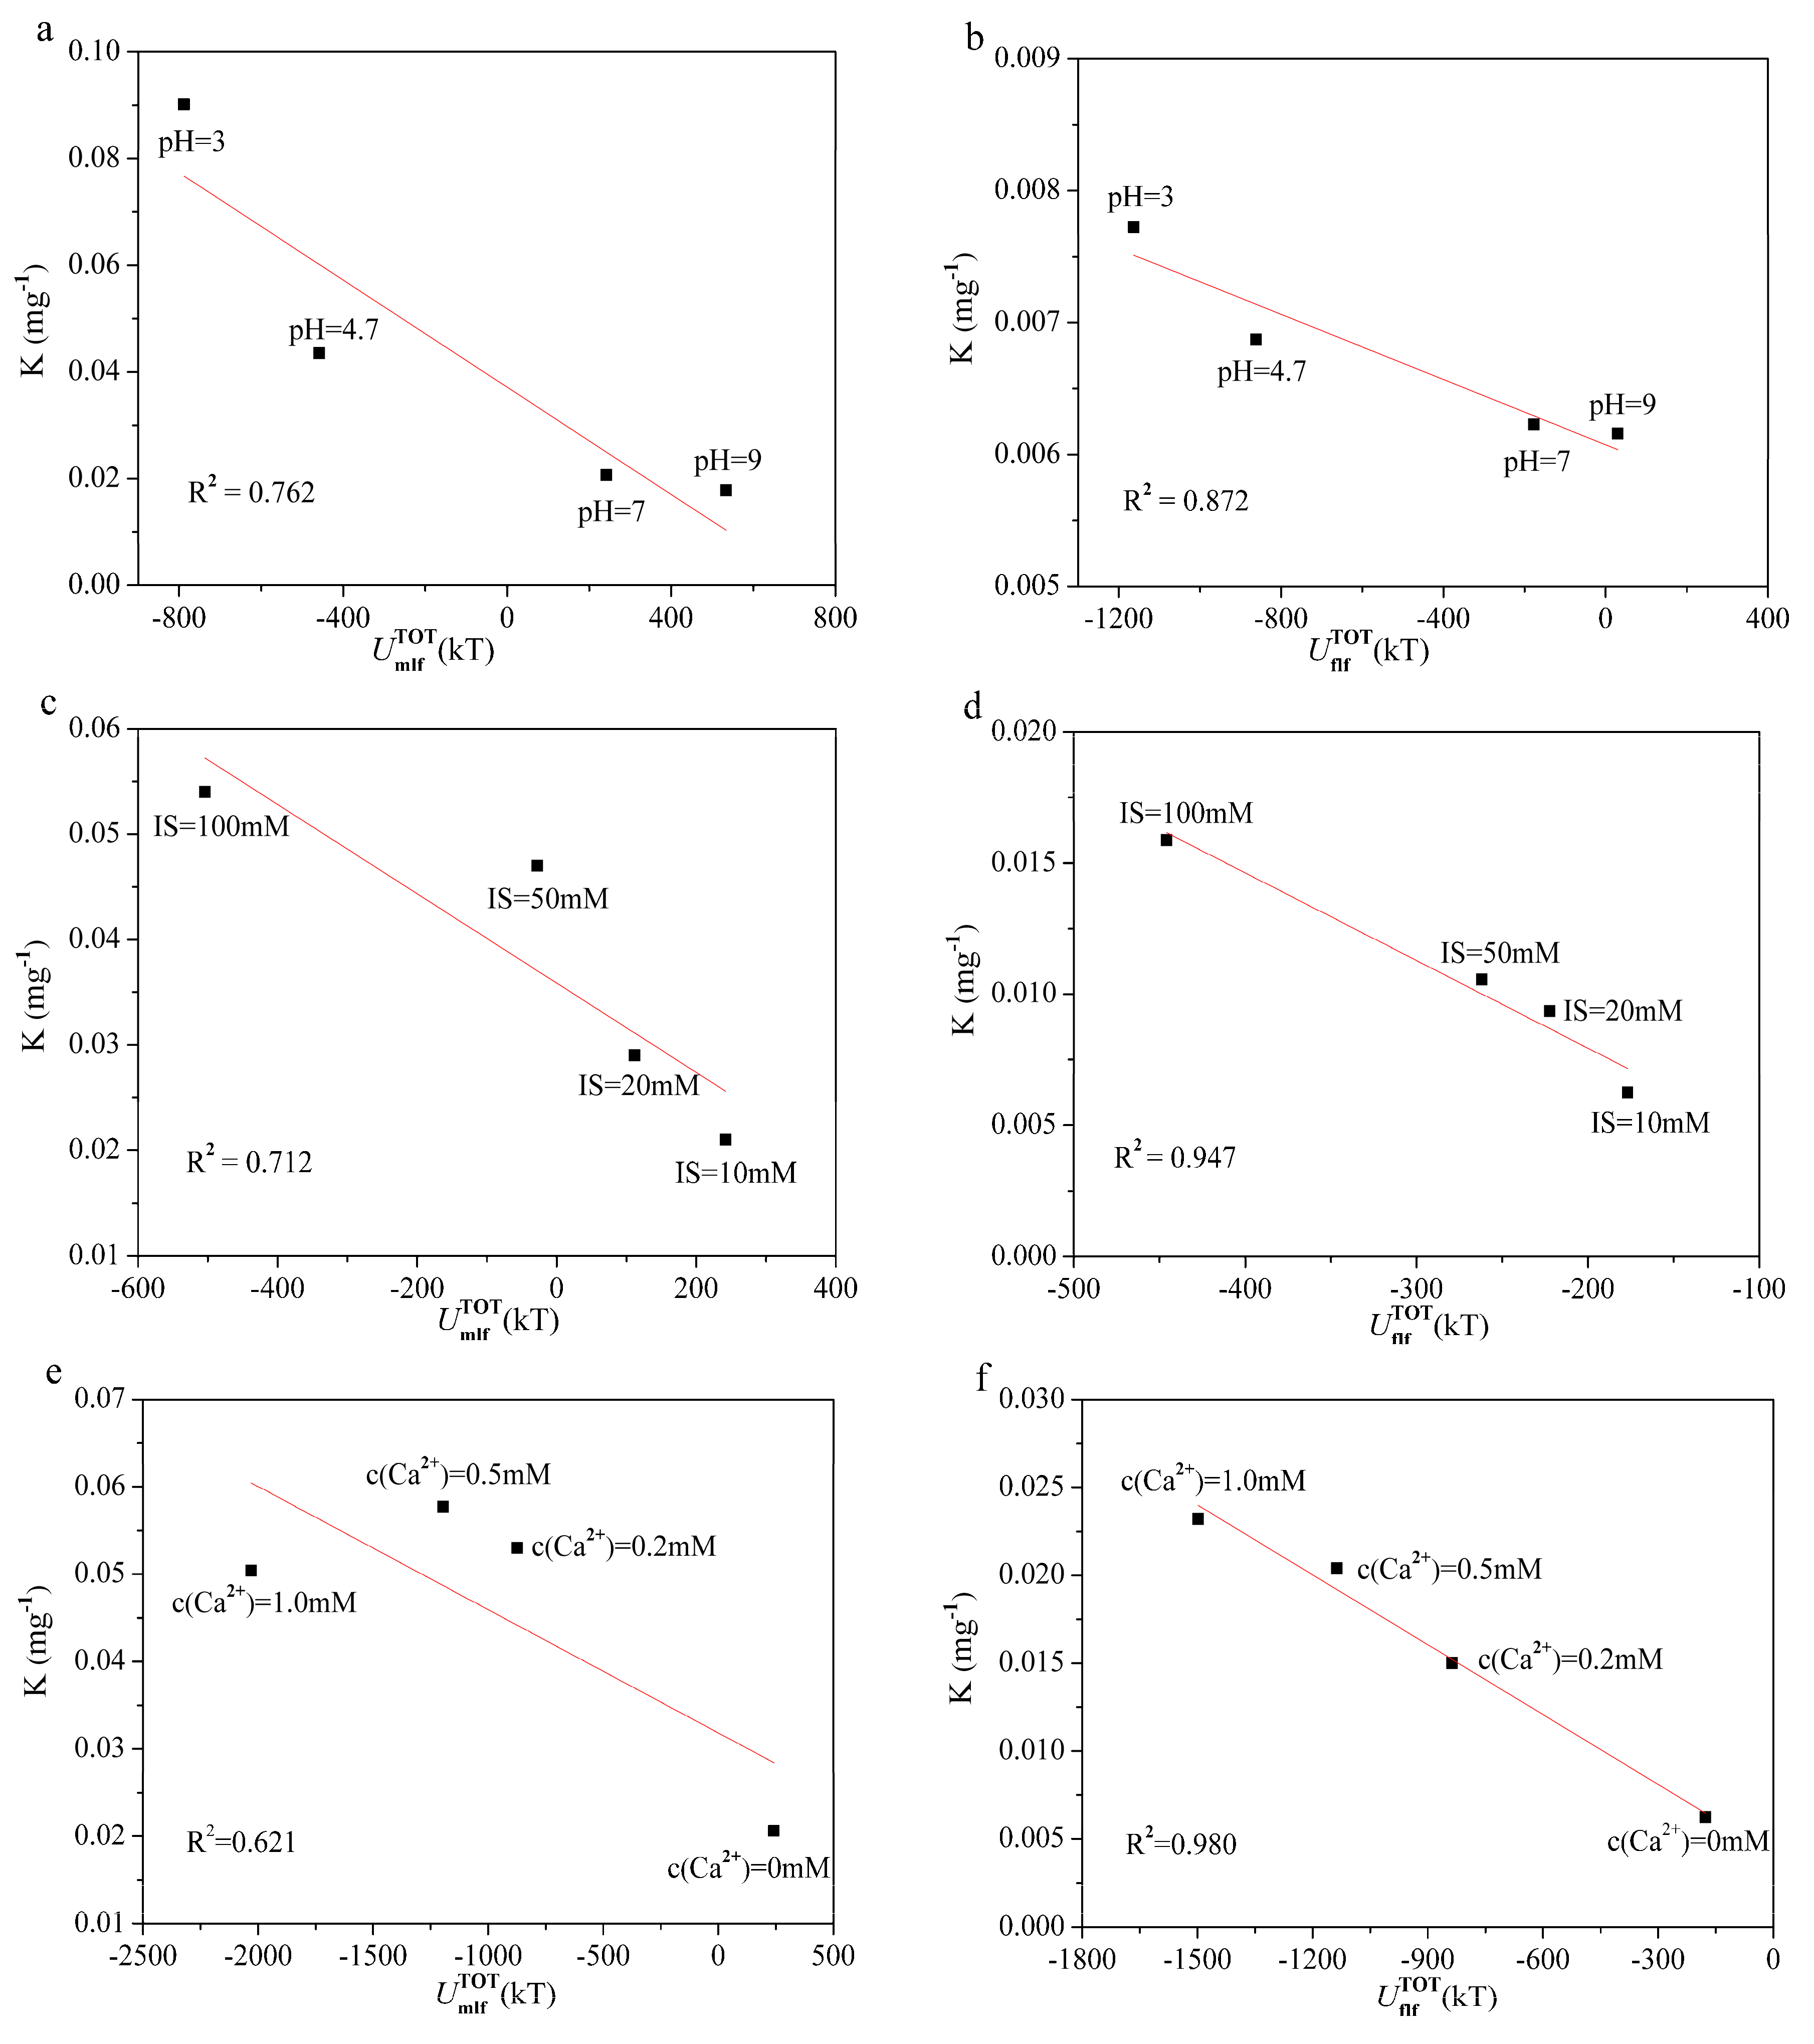
3.4. Experimental Verification

In order to verify the above theoretical predictions, the normalized flux reduction curves of the HA–BSA mixtures at different solution conditions are depicted in Figure 3. It can be observed that great flux decline was found at the beginning of filtration, and then, the speed of flux decline gradually decreased. This observation is consistent with previous reports on the behavior of membrane fouling during different filtration periods [42,43]. It can be seen from Figure 3a that when filtrating the HA–BSA mixtures at different solution pH, fouling propensity was in the order of pH = 3.0 > pH = 4.7 > pH = 7.0 > pH = 9.0. Moreover, the SEM image also shows that the HA–BSA-fouled membrane with baseline solution conditions displayed a homogeneous porous surface structure (Figure S2a). The porosity of the membrane surface decreased significantly when the solution pH decreased to 3.0 (Figure S2b). This may be attributed to the greater attractive interactions enhancing the HA–BSA mixture’s attachment at low pH.
Based on the xDLVO predictions, filtrating HA–BSA mixtures with an increase in ionic strength was expected to have greater fouling propensity. In fact, this fouling trend can be reflected in Figure 3b. When the ionic strength increased to 100 mM, the surface porosity of the PES membrane also decreased (Figure S2c). As expected (Figure 3c), the flux decline rate of the PES membrane was faster with the increase in calcium ion concentration. Following the addition of calcium ions, it would not only neutralize the negative charge on the membrane and foulant surface, but it would bridge between membrane surface and foulant molecules, resulting in the formation of a cross-linked chelate in the fouling layer [44,45]. A further addition of calcium ions can be evidenced by the fact that there were no pores on the membrane surface, and the deposited layer structure seemed to be much more compact (Figure S2d). The corresponding fouling experimental results were consistent with the above theoretical predictions.
Figure 4 presents the correlation analysis between interaction energies and fouling potentials at initial and final stages with different solution conditions. An obvious negative linear relationship was observed between fouling potential and interaction energy under various solution conditions for different filtration stages. The same correlations between fouling behaviors and adhesive and cohesive interaction energies were observed in previous studies [46,47]. It can be seen from Figure 4 that the attractive interaction energy in the initial and final stages increased with decreasing pH or increasing ionic strength and calcium ion concentration; thus membrane fouling was aggravated. These results would further extend the xDLVO application in elucidating the mechanisms of MF membrane fouling by HA–BSA mixtures at different solution conditions.

4. Conclusions

The xDLVO theory was used to quantitatively analyze the MF membrane fouling mechanisms of HA–protein mixtures at different solution conditions. Measured physicochemical properties revealed that the contact angles, as well as the zeta potentials of membrane and foulants, varied with solution conditions, which was due to the deprotonation of functional groups and the electrostatic shielding effect. Both the PES membrane and HA–BSA mixtures exhibited high electron-donor components (γ) and relatively low electron-acceptor components (γ+), and the minimum free energy of cohesion of the HA–BSA mixtures was exhibited at pH = 3.0, ionic strength = 100 mM, and c(Ca2+) = 1.0 mM, indicating the mixed solution was unstable and hydrophobic. The calculated interaction parameters showed that the AB interaction energy played an important role in the total interaction energy when the separation distance was less than 3 nm, while the contribution of EL interaction energy to the total interaction energy was of less importance. The attractive interaction energies of membrane–foulant and foulant–foulant were substantially increased with decreasing pH or increasing ionic strength and calcium ion concentration, thus aggravating membrane fouling. Fouling experiments showed that MF membrane fouling by the HA–BSA mixtures was more serious at low pH, and high ionic strength and calcium ion concentration, which was consistent with theoretical predictions. In addition, a strong negative linear relationship between fouling potential and corresponding interaction energy in both stages was observed. This study would provide valuable quantitative information for a more detailed understanding of membrane fouling mechanisms involved in the MF of humic acid–protein mixtures.

Supplementary Materials

The following are available online at https://www.mdpi.com/2073-4441/10/10/1306/s1. Figure S1: Schematic diagram of experimental system for constant pressure dead-end microfiltration; Figure S2: SEM characterization results at different solution conditions: (a) pH = 7.0, IS = 10 mM, c (Ca2+) = 0 mM; (b) pH = 3.0, IS = 10 mM, c (Ca2+) = 0 mM; (c) pH = 7.0, IS = 100 mM, c (Ca2+) = 0 mM; (d) pH = 7.0, IS = 10 mM, c (Ca2+) = 1.0 mM.

Author Contributions

The experimental work was conducted by S.L., C.S., N.Z., and X.L. The manuscript was written by C.S. and S.L. Data analysis was performed by C.S., N.Z., F.L., G.K., L.S., X.L., and S.L. All authors approved the final version of the article, including the authorship list.

Funding

This research was funded by the China Major Science and Technology Program for Water Pollution Control and Treatment (No. 2017ZX07101003), the National Natural Science Foundation of China (50908133), the Fundamental Research Funds of Shandong University (2017JC024), the Henan Province Science and Technology Major Project (161100310700), and the APC was funded by the China Major Science and Technology Program for Water Pollution Control and Treatment (No. 2017ZX07101003).

Acknowledgments

Assistance from Meiqi Yang and Yuxuan Ren for their cooperation in completion of laboratory experiments are acknowledged gratefully.

Conflicts of Interest

The authors declare no conflicts of interest.

References

  1. Guo, H.; Wyart, Y.; Perot, J.; Nauleau, F.; Moulin, P. Low-pressure membrane integrity tests for drinking water treatment: A review. Water Res. 2010, 44, 41–57. [Google Scholar] [CrossRef] [PubMed]
  2. Zhang, X.; Fan, L.; Roddick, F.A. Influence of the characteristics of soluble algal organic matter released from Microcystis aeruginosa on the fouling of a ceramic microfiltration membrane. J. Membr. Sci. 2013, 425, 23–29. [Google Scholar] [CrossRef]
  3. Hashino, M.; Hirami, K.; Katagiri, T.; Kubota, N.; Ohmukai, Y.; Ishigami, T.; Maruyama, T.; Matsuyama, H. Effects of three natural organic matter types on cellulose acetate butyrate microfiltration membrane fouling. J. Membr. Sci. 2011, 379, 233–238. [Google Scholar] [CrossRef]
  4. Lv, X.; Gao, B.; Sun, Y.; Shi, X.; Xu, H.; Wu, J. Effects of humic acid and solution chemistry on the retention and transport of cerium dioxide nanoparticles in saturated porous media. Water Air Soil Pollut. 2014, 225, 2167. [Google Scholar] [CrossRef]
  5. Dong, H.; Gao, B.; Yue, Q.; Sun, S.; Wang, Y.; Li, Q. Floc properties and membrane fouling of polyferric silicate chloride and polyferric chloride: The role of polysilicic acid. Environ. Sci. Pollut. Res. 2015, 22, 4566–4574. [Google Scholar] [CrossRef] [PubMed]
  6. Zhou, S.; Shao, Y.; Gao, N.; Li, L.; Deng, J.; Tan, C.; Zhu, M. Influence of hydrophobic/hydrophilic fractions of extracellular organic matters of Microcystis aeruginosa on ultrafiltration membrane fouling. Sci. Total Environ. 2014, 470, 201–207. [Google Scholar] [CrossRef] [PubMed]
  7. Gray, S.R.; Ritchie, C.; Tran, T.; Bolto, B. Effect of NOM characteristics and membrane type on microfiltration performance. Water Res. 2007, 41, 3833–3841. [Google Scholar] [CrossRef] [PubMed] [Green Version]
  8. Zheng, X.; Zietzschmann, F.; Plume, S.; Paar, H.; Ernst, M.; Wang, Z.; Jekel, M. Understanding and Control of Biopolymer Fouling in Ultrafiltration of Different Water Types. Water 2017, 9, 298. [Google Scholar] [CrossRef]
  9. Shao, J.; Hou, J.; Song, H. Comparison of humic acid rejection and flux decline during filtration with negatively charged and uncharged ultrafiltration membranes. Water Res. 2011, 45, 473–482. [Google Scholar] [CrossRef] [PubMed]
  10. Lim, Y.P.; Mohammad, A.W. Effect of solution chemistry on flux decline during high concentration protein ultrafiltration through a hydrophilic membrane. Chem. Eng. J. 2010, 159, 91–97. [Google Scholar] [CrossRef]
  11. Madaeni, S.; Sedeh, S.N.; De Nobili, M. Ultrafiltration of humic substances in the presence of protein and metal ions. Transp. Porous Media 2006, 65, 469–484. [Google Scholar] [CrossRef]
  12. Salehi, E.; Madaeni, S. Adsorption of humic acid onto ultrafiltration membranes in the presence of protein and metal ions. Desalination 2010, 263, 139–145. [Google Scholar] [CrossRef]
  13. Myat, D.T.; Stewart, M.B.; Mergen, M.; Zhao, O.; Orbell, J.D.; Gray, S. Experimental and computational investigations of the interactions between model organic compounds and subsequent membrane fouling. Water Res. 2014, 48, 108–118. [Google Scholar] [CrossRef] [PubMed] [Green Version]
  14. Shen, L.G.; Lei, Q.; Chen, J.-R.; Hong, H.-C.; He, Y.-M.; Lin, H.-J. Membrane fouling in a submerged membrane bioreactor: Impacts of floc size. Chem. Eng. J. 2015, 269, 328–334. [Google Scholar] [CrossRef]
  15. Lin, T.; Lu, Z.; Chen, W. Interaction mechanisms of humic acid combined with calcium ions on membrane fouling at different conditions in an ultrafiltration system. Desalination 2015, 357, 26–35. [Google Scholar] [CrossRef]
  16. Lin, T.; Lu, Z.; Chen, W. Interaction mechanisms and predictions on membrane fouling in an ultrafiltration system, using the XDLVO approach. J. Membr. Sci. 2014, 461, 49–58. [Google Scholar] [CrossRef]
  17. Ding, Y.; Tian, Y.; Li, Z.; Wang, H.; Chen, L. Interaction energy evaluation of the role of solution chemistry and organic foulant composition on polysaccharide fouling of microfiltration membrane bioreactors. Chem. Eng. Sci. 2013, 104, 1028–1035. [Google Scholar] [CrossRef]
  18. Nishijima, W.; Speitle, G.E., Jr. Fate of biodegradable dissolved organic carbon produced by ozonation on biological activated carbon. Chemosphere 2004, 56, 113–119. [Google Scholar] [CrossRef] [PubMed]
  19. Chang, H.; Qu, F.; Liu, B.; Yu, H.; Li, K.; Shao, S.; Li, G.; Liang, H. Hydraulic irreversibility of ultrafiltration membrane fouling by humic acid: Effects of membrane properties and backwash water composition. J. Membr. Sci. 2015, 493, 723–733. [Google Scholar] [CrossRef]
  20. Van Oss, C. Acid—Base interfacial interactions in aqueous media. Colloids Surf. A Physicochem. Eng. Asp. 1993, 78, 1–49. [Google Scholar] [CrossRef]
  21. Subramani, A.; Huang, X.; Hoek, E.M. Direct observation of bacterial deposition onto clean and organic-fouled polyamide membranes. J. Colloid Interface Sci. 2009, 336, 13–20. [Google Scholar] [CrossRef] [PubMed]
  22. Wang, Z.; Chen, Z.; Yang, L.; Tan, F.; Wang, Y.; Li, Q.; Chang, Y.-I.; Zhong, C.-J.; He, N. Effect of surface physicochemical properties on the flocculation behavior of Bacillus licheniformis. RSC Adv. 2017, 7, 16049–16056. [Google Scholar] [CrossRef] [Green Version]
  23. Brant, J.A.; Childress, A.E. Assessing short-range membrane–colloid interactions using surface energetics. J. Membr. Sci. 2002, 203, 257–273. [Google Scholar] [CrossRef]
  24. Hoek, E.M.; Agarwal, G.K. Extended DLVO interactions between spherical particles and rough surfaces. J. Colloid Interface Sci. 2006, 298, 50–58. [Google Scholar] [CrossRef] [PubMed]
  25. Lee, S.; Kim, S.; Cho, J.; Hoek, E.M. Natural organic matter fouling due to foulant–membrane physicochemical interactions. Desalination 2007, 202, 377–384. [Google Scholar] [CrossRef]
  26. Liang, S.; Zhao, Y.; Liu, C.; Song, L. Effect of solution chemistry on the fouling potential of dissolved organic matter in membrane bioreactor systems. J. Membr. Sci. 2008, 310, 503–511. [Google Scholar] [CrossRef]
  27. Ye, Y.; Le Clech, P.; Chen, V.; Fane, A.G.; Jefferson, B. Fouling mechanisms of alginate solutions as model extracellular polymeric substances. Desalination 2005, 175, 7–20. [Google Scholar] [CrossRef]
  28. Chen, L.; Tian, Y.; Cao, C.Q.; Zhang, J.; Li, Z.N. Interaction energy evaluation of soluble microbial products (SMP) on different membrane surfaces: Role of the reconstructed membrane topology. Water Res. 2012, 46, 2693–2704. [Google Scholar] [CrossRef] [PubMed]
  29. Shen, L.; Wang, X.; Li, R.; Yu, H.; Hong, H.; Lin, H.; Chen, J.; Liao, B.-Q. Physicochemical correlations between membrane surface hydrophilicity and adhesive fouling in membrane bioreactors. J. Colloid Interface Sci. 2017, 505, 900–909. [Google Scholar] [CrossRef] [PubMed]
  30. Meng, X.; Tang, W.; Wang, L.; Wang, X.; Huang, D.; Chen, H.; Zhang, N. Mechanism analysis of membrane fouling behavior by humic acid using atomic force microscopy: Effect of solution pH and hydrophilicity of PVDF ultrafiltration membrane interface. J. Membr. Sci. 2015, 487, 180–188. [Google Scholar] [CrossRef]
  31. Wang, X.; Zhou, M.; Meng, X.; Wang, L.; Huang, D. Effect of protein on PVDF ultrafiltration membrane fouling behavior under different pH conditions: Interface adhesion force and XDLVO theory analysis. Front. Environ. Sci. Eng. 2016, 10, 1–11. [Google Scholar] [CrossRef]
  32. Mo, H.; Tay, K.G.; Ng, H.Y. Fouling of reverse osmosis membrane by protein (BSA): Effects of pH, calcium, magnesium, ionic strength and temperature. J. Membr. Sci. 2008, 315, 28–35. [Google Scholar] [CrossRef]
  33. Wang, Q.; Wang, Z.; Zhu, C.; Mei, X.; Wu, Z. Assessment of SMP fouling by foulant–membrane interaction energy analysis. J. Membr. Sci. 2013, 446, 154–163. [Google Scholar] [CrossRef]
  34. Hong, H.; Peng, W.; Zhang, M.; Chen, J.; He, Y.; Wang, F.; Weng, X.; Yu, H.; Lin, H. Thermodynamic analysis of membrane fouling in a submerged membrane bioreactor and its implications. Biores. Technol. 2013, 146, 7–14. [Google Scholar] [CrossRef] [PubMed]
  35. Ding, Y.; Tian, Y.; Li, Z.; Wang, H.; Chen, L. Microfiltration (MF) membrane fouling potential evaluation of protein with different ion strengths and divalent cations based on extended DLVO theory. Desalination 2013, 331, 62–68. [Google Scholar] [CrossRef]
  36. Bayoudh, S.; Othmane, A.; Mora, L.; Ouada, H.B. Assessing bacterial adhesion using DLVO and XDLVO theories and the jet impingement technique. Colloids Surf. Biointerfaces 2009, 73, 1–9. [Google Scholar] [CrossRef] [PubMed]
  37. Yamamura, H.; Okimoto, K.; Kimura, K.; Watanabe, Y. Hydrophilic fraction of natural organic matter causing irreversible fouling of microfiltration and ultrafiltration membranes. Water Res. 2014, 54, 123–136. [Google Scholar] [CrossRef] [PubMed]
  38. Bower, M.J.D.; Bank, T.L.; Giese, R.F.; Oss, C.J.V. Nanoscale forces of interaction between glass in aqueous and non-aqueous media: A theoretical and empirical study. Colloids Surf. A Physicochem. Eng. Asp. 2010, 362, 90–96. [Google Scholar] [CrossRef]
  39. Subramani, A.; Hoek, E.M. Direct observation of initial microbial deposition onto reverse osmosis and nanofiltration membranes. J. Membr. Sci. 2008, 319, 111–125. [Google Scholar] [CrossRef]
  40. Redman, J.A.; Walker, S.L.; Elimelech, M. Bacterial adhesion and transport in porous media: Role of the secondary energy minimum. Environ. Sci. Technol. 2004, 38, 1777–1785. [Google Scholar] [CrossRef] [PubMed]
  41. Hoek, E.M.; Bhattacharjee, S.; Elimelech, M. Effect of Membrane Surface Roughness on Colloid−Membrane DLVO Interactions. Langmuir 2003, 19, 4836–4847. [Google Scholar] [CrossRef]
  42. Wang, L.; Miao, R.; Wang, X.; Lv, Y.; Meng, X.; Yang, Y.; Huang, D.; Feng, L.; Liu, Z.; Ju, K. Fouling behavior of typical organic foulants in polyvinylidene fluoride ultrafiltration membranes: Characterization from microforces. Environ. Sci. Technol. 2013, 47, 3708–3714. [Google Scholar] [CrossRef] [PubMed]
  43. Li, Q.; Xu, Z.; Pinnau, I. Fouling of reverse osmosis membranes by biopolymers in wastewater secondary effluent: Role of membrane surface properties and initial permeate flux. J. Membr. Sci. 2007, 290, 173–181. [Google Scholar] [CrossRef]
  44. Yang, Q.; Liu, Y.; Li, Y. Control of protein (BSA) fouling in RO system by antiscalants. J. Membr. Sci. 2010, 364, 372–379. [Google Scholar] [CrossRef]
  45. Li, Q.; Elimelech, M. Organic fouling and chemical cleaning of nanofiltration membranes: Measurements and mechanisms. Environ. Sci. Technol. 2004, 38, 4683–4693. [Google Scholar] [CrossRef] [PubMed]
  46. Kim, S.; Hoek, E.M. Interactions controlling biopolymer fouling of reverse osmosis membranes. Desalination 2007, 202, 333–342. [Google Scholar] [CrossRef]
  47. Jin, X.; Huang, X.; Hoek, E.M. Role of specific ion interactions in seawater RO membrane fouling by alginic acid. Environ. Sci. Technol. 2009, 43, 3580–3587. [Google Scholar] [CrossRef] [PubMed]
Figure 1. Variation in interaction energy components with separation distance under baseline solution conditions (pH = 7.0, ionic strength (IS) = 10 mM, c(Ca2+) = 0 mM): (a) membrane–foulant; (b) foulant–foulant.
Water 10 01306 g001
Figure 2. Variations in interaction energies of membrane–foulant and foulant–foulant with separation distance at different solution conditions: (a,b) pH; (c,d) IS; (e,f) Ca2+ concentration.
Water 10 01306 g002
Figure 3. Normalized flux reduction curves of the humic acid (HA)–bovine serum albumin (BSA) mixtures during microfiltration (MF) at different solution conditions: (a) pH; (b) IS; (c) Ca2+ concentration.
Water 10 01306 g003
Figure 4. The correlation analysis between interaction energies and fouling potentials at initial and final stages with different solution conditions: (a,b) pH; (c,d) IS; (e,f) Ca2+ concentration.
Water 10 01306 g004
Table 1. Contact angles and zeta potentials of the polyethersulfone (PES) membrane and humic acid (HA)–bovine serum albumin (BSA) mixtures at different solution conditions.
Solution ConditionsPES MembraneHA–BSA
θW (°)θG (°)θD (°)Zeta (mV)θW (°)θG (°)θD (°)Zeta (mV)
pH = 3.037.7 ± 1.9 a44.4 ± 2.140.0 ± 2.5−16.8 ± 2.190.2 ± 2.172.9 ± 3.130.4 ± 1.0−16.5 ± 2.5
pH = 4.732.0 ± 2.243.4 ± 2.037.7 ± 1.8−21.8 ± 1.884.6 ± 3.072.0 ± 0.941.9 ± 2.9−28.4 ± 2.7
pH = 7.027.5 ± 1.642.8 ± 1.836.9 ± 1.5−37.8 ± 2.369.1 ± 1.271.9 ± 2.739.0 ± 2.1−32.2 ± 1.9
pH = 9.023.0 ± 2.541.8 ± 1.940.5 ± 2.2−51.8 ± 1.562.6 ± 1.570.1 ± 2.735.8 ± 1.6−43.0 ± 2.1
IS = 10 mM27.5 ± 1.642.8 ± 1.836.9 ± 1.5−37.8 ± 2.369.1 ± 1.271.9 ± 2.739.0 ± 2.1−32.2 ± 1.9
IS = 20 mM34.1 ± 1.446.4 ± 1.136.4 ± 1.8−31.3 ± 1.970.4 ± 2.172.3 ± 1.339.8 ± 1.6−26.3 ± 1.2
IS = 50 mM41.8 ± 2.350.6 ± 1.536.8 ± 1.5−23.1 ± 1.371.9 ± 2.372.8 ± 2.247.9 ± 1.5−19.2 ± 2.4
IS = 100 mM53.7 ± 2.151.5 ± 2.938.5 ± 2.3−13.8 ± 2.776.3 ± 2.073.5 ± 2.150.2 ± 2.3−10.9 ± 2.6
c(Ca2+) = 0 mM27.5 ± 1.642.8 ± 1.836.9 ± 1.5−37.8 ± 2.369.1 ± 1.271.9 ± 2.739.0 ± 2.1−32.2 ± 1.9
c(Ca2+) = 0.2 mM53.4 ± 2.655.3 ± 2.029.3 ± 1.3−34.9 ± 2.476.8 ± 2.872.8 ± 0.736.5 ± 1.0−29.3 ± 2.3
c(Ca2+) = 0.5 mM54.5 ± 0.955.3 ± 2.230.2 ± 0.5−32.4 ± 1.481.1 ± 2.373.8 ± 1.243.0 ± 0.8−22.2 ± 1.8
c(Ca2+) = 1.0 mM64.7 ± 3.558.3 ± 2.932.2 ± 2.2−30.7 ± 1.285.3 ± 2.174.1 ± 1.940.6 ± 2.7−16.9 ± 2.6
a Sample mean ± standard deviation, number of measurements: n = 7 (contact angle); n = 3 (zeta potential). IS: ionic strength; θW: water contact angle; θG: glycerol contact angle; θD: diiodomethane contact angle.
Table 2. Surface tension parameters (γ) and interfacial free energy of cohesion, ΔGsls (mJ/m2) of the PES membrane and HA–BSA mixtures at different solution conditions. Surface tension components: γ+, electron acceptor; γ, electron donor; γAB, acid–base; γLW, Lifshitz–van der Waals; γTOT, total.
Solution ConditionsPES MembraneHA–BSA
γ+γγABγLWγTOTΔGslsγ+γγABγLWγTOTΔGsls
pH = 3.00.5234.538.5134.4742.9811.420.010.870.2144.0644.27−89.16
pH = 4.70.3739.327.6035.3742.9718.420.063.560.9538.6439.59−65.58
pH = 7.00.2942.937.0635.6742.7323.710.2419.474.3140.1144.42−17.16
pH = 9.00.3746.188.2734.2742.5428.210.4527.316.9841.6648.64−3.29
IS = 10 mM0.2942.937.0635.6742.7323.710.2419.474.3140.1144.42−17.16
IS = 20 mM0.1939.385.5435.8641.4019.200.2018.063.8239.7143.53−20.12
IS = 50 mM0.1334.374.2535.7139.9611.770.0317.051.5335.4436.97−21.33
IS = 100 mM0.4521.796.2835.0641.34−9.920.00112.240.0934.1634.25−34.02
c(Ca2+) = 0 mM0.2942.937.0635.6742.7323.710.2419.474.3140.1144.42−17.16
c(Ca2+) = 0.2 mM0.0524.052.0938.3340.42−7.450.1010.412.0441.3243.36−40.71
c(Ca2+) = 0.5 mM0.0722.862.5238.0440.56−9.630.0027.070.2138.0738.28−52.37
c(Ca2+) = 1.0 mM0.1813.993.1437.3740.51−28.400.063.120.8339.3140.14−68.23
Table 3. The calculated interfacial interaction energies (kT) of PES–foulant and foulant-foulant combinations at different solution conditions. LW, AB, and EL represent the Lifshitz–van der Waals, acid–base, and electrostatic contributions to energy, respectively, while m, l, and f represent the contact involving membrane, liquid, and foulant, respectively; d0 is the minimum equilibrium cut-off distance.
Solution ConditionsPES–FoulantFoulant–Foulant
U m l f L W ( d 0 )   U m l f A B ( d 0 )   U m l f E L ( d 0 )   U m l f T O T ( d 0 )   U f l f L W ( d 0 )   U f l f A B ( d 0 )   U f l f E L ( d 0 )   U f l f T O T ( d 0 )  
pH = 3.0−34.56−765.3512.04−787.87−28.49−1136.381.50−1163.37
pH = 4.7−28.68−455.1325.26−458.55−17.61−848.664.44−861.83
pH = 7.0−31.91221.9851.71241.78−20.37−162.225.74−176.85
pH = 9.0−30.88470.4993.88533.49−23.5343.1410.1729.78
IS = 10 mM−31.91221.9851.71241.78−20.37−162.225.74−176.85
IS = 20 mM−31.62108.9034.41111.69−19.59−206.473.75−222.31
IS = 50 mM−24.26−21.5018.00−27.76−12.13−251.711.93−261.91
IS = 100 mM−21.32−488.645.84−504.12−10.18−436.260.60−445.84
c(Ca2+) = 0 mM−31.91221.9851.71241.78−20.37−162.225.74−176.85
c(Ca2+) = 0.2 mM−66.18−879.5572.03−873.70−37.93−803.194.72−836.40
c(Ca2+) = 0.5 mM−53.92−1186.6945.60−1195.01−27.63−1113.584.51−1136.70
c(Ca2+) = 1.0 mM−56.37−1999.2226.05−2029.54−31.37−1468.171.56−1497.98

