A Simplified Infiltration Model for Predicting Cumulative Infiltration during Vertical Line Source Irrigation

1
Key Laboratory of Mechanics on Disaster and Environment in Western China, the Ministry of Education of China, College of Civil Engineering and Mechanics, Lanzhou University, Lanzhou 730050, China
2
College of Energy and Power Engineering, Lanzhou University of Technology, Lanzhou 730000, China
3
State Key Laboratory of Simulation and Regulation of Water Cycles in River Basins, China Institute of Water Resources and Hydropower Research, Beijing 100038, China
*
Author to whom correspondence should be addressed.
Water 2018, 10(1), 89; https://doi.org/10.3390/w10010089
Submission received: 24 November 2017
/
Revised: 22 December 2017
/
Accepted: 16 January 2018
/
Published: 20 January 2018
(This article belongs to the Special Issue Water and Solute Transport in Vadose Zone)
Abstract
:Vertical line source irrigation is a water-saving irrigation method for enhancing direct water and nutrient delivery to the root zone, reducing soil evaporation and improving water and nutrient use efficiency. To identify its influencing factors, we performed computer simulations using the HYDRUS-2D software. The results indicate that for a given soil, the line source seepage area, but not the initial soil water content and buried depth, has a significant effect on the cumulative infiltration. We thus proposed a simplified method, taking into account the seepage area for predicting the cumulative infiltration based on the Philip model. Finally, we evaluated the accuracy of the simplified method using experimental data and found the cumulative infiltrations predicted by the simplified method were in very good agreement with the observed values, showing a low mean average error of 0.028–0.480 L, a root mean square error of 0.043–0.908 L, a percentage bias of 0.321–0.900 and a large Nash-Sutcliffe coefficient close to 1.0 (NSE ≥ 0.995). The results indicate that this simplified infiltration model, for which the only emitter parameter required is the seepage area, could provide a valuable and practical tool for irrigation design.
1. Introduction
The arid regions of China have rich land resources, as well as abundant sunshine, and a large temperature difference between day and night, which are suitable for the development of the fruit industry. The establishment of the fruit industry in the area can achieve a win-win situation both economically and ecologically. However, the arid regions of China have encountered serious water shortages due to limited rainfall and great soil-moisture evaporation. Developing water-saving irrigation systems is an important way to alleviate the shortage of water resources [1,2]. Considering the surface evaporation and deep-rootedness characteristics of fruit trees, efficient irrigation methods are urgently required for enhancing direct water and nutrient delivery to the root zone, reducing soil evaporation and improving the efficiency of water and nutrient use.
Vertical Line Source Irrigation (VLSI) is a water-saving irrigation method suitable for deep-rooted plants. In this method, plastic perforated tubes of a specified length that are sealed at the bottom are placed vertically into the soil to allow the water supply direct access to the plant root, thus reducing the surface evaporation and improving the water use efficiency [3,4]. To clarify soil infiltration characteristics, which are important for the irrigation scheme design and irrigation quality evaluation, the infiltration model is commonly used to quantitatively simulate soil infiltration processes. Accordingly, many experimental and theoretical studies have been devoted to unravelling the infiltration mechanisms associated with different irrigation methods [5,6,7,8]. However, little research on the infiltration model of vertical line source irrigation has been reported. Therefore, developing a simple and easily estimated infiltration model for vertical line source irrigation is essential.
The physical properties of the soil (texture, bulk density, initial water content) and the emitter parameters (line source length, diameter and depth) are influencing factors for soil water movement under line source subsurface irrigation [9,10]. Of these, soil texture is important in determining irrigation design parameters, because of its great influence on infiltration [11,12]. Soil bulk density is an important factor that affects soil infiltration capacity. Under the same soil conditions, with soil bulk density increasing, soil porosity decreases, resulting in a decrease in soil infiltration capacity [13,14,15]. In addition, soil initial water content determines the soil water potential during the initial water infiltration stage, thereby significantly affecting the process of soil infiltration [16,17]. The length and diameter of the emitter are the most important design parameters for line source irrigation, because its size determines the seepage area of the line source, which has a great influence on infiltration [18]. The depth of the emitter directly affects the distribution of soil moisture, thus affecting the absorption of soil moisture and nutrients by crop roots. Realizing effective matching between soil wetted volume and crop root is a key factor [19].
Numerical simulation is often used in soil research to analyze soil water movement under different soil physical properties or design parameters [20,21,22]. In terms of line source infiltration, Skaggs et al. [23] assumed that drip irrigation was equivalent to a line source, and verified the accuracy of the HYDRUS-2D simulation with experimental observations. Li and Wang [24] have shown that the HYDRUS-2D software can be used to simulate soil water movement in the vertical line source with good accuracy.
We therefore implemented the HYDRUS-2D simulation with the following objectives: (1) to simulate and analyze the effect of various influencing factors on the cumulative infiltration in vertical line source irrigation and identify the dominant factors; and (2) to propose and verify a simplified infiltration model for estimating the cumulative infiltration of vertical line source irrigation.
2. Materials and Methods
2.1. VLSI Modeling
2.1.1. Governing Equation
Vertical line source irrigation can be simplified as an axisymmetric three-dimensional infiltration process. The governing equation used in this study was the Richards equation, which can be written in axisymmetric coordinates as follows:
where θ is the volumetric water content (cm3∙cm−3), t is the time (min), r is the radial (horizontal) coordinate (cm), K(h) is the unsaturated hydraulic conductivity (cm∙min−1), h is the soil water pressure head (cm), and z is the vertical coordinate that is positive downward (cm).
Equation (1) was solved numerically by HYDRUS-2D version 1.0 [25].
The soil water retention was modeled using the van Genuchten equation [26]:
where Se is the effective degree of saturation, θs and θr are respectively the saturated and residual water contents (cm3∙cm−3), α is an empirical parameter (cm−1) that is inversely related to the air entry value, and m and n are empirical constants affecting the shape of the retention curve. The value of m is restricted by m = 1−1/n.
The hydraulic conductivity as a function of Se was described using the closed form equation of van Genuchten, which combines the analytical expression (2) with the pore size distribution model of Mualem [27]:
where Ks is the saturated hydraulic conductivity (cm∙min−1), and l is the pore connectivity parameter estimated by Mualem to be about 0.5 as an average for many soils.
2.1.2. Modeled Scenarios
To address our main objectives, we have chosen to evaluate the following alternative scenarios: (1) irrigation quota (the economic irrigation quota is 40 L per line source emitter [28]); (2) five soil textures (clay loam, silt loam, loam, sandy loam, and sand [29]); (3) three initial soil water contents (SWC) expressed as the percentage of field capacity [30,31] at 40%, 50% and 60%, respectively; (4) three buried depths (25 cm, 35 cm, and 45 cm); (5) five tube lengths (10 cm, 15 cm, 20 cm, 25 cm, and 30 cm) and (6) five tube diameters (2 cm, 3 cm, 4 cm, 5 cm, and 6 cm).
2.1.3. Initial and Boundary Conditions
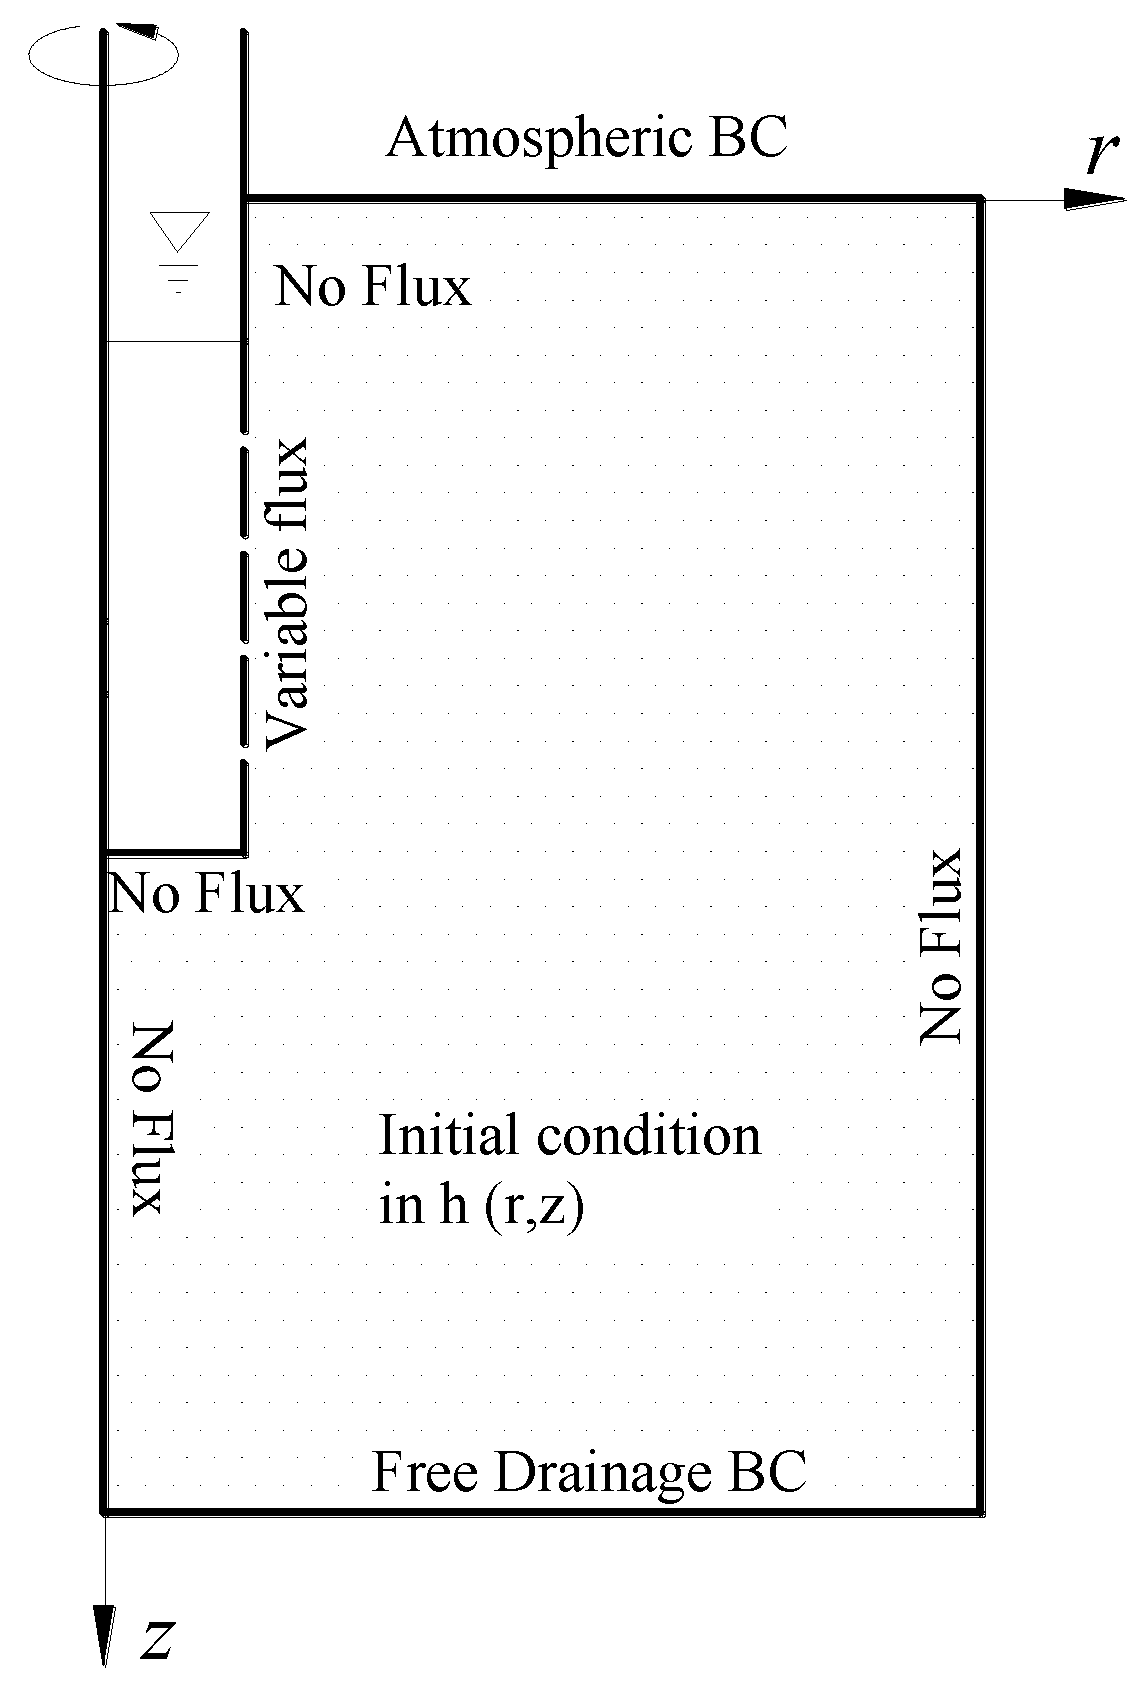
Figure 1 shows initial and boundary conditions (BC) considered for simulations of different modeling scenarios in this study.
The initial condition in the simulation was the initial pressure head distribution. In all simulated scenarios, the upper boundary of the transport domain was subjected to atmospheric conditions, while the lower boundary of the domain was free drainage. Boundaries at both vertical sides were assigned a “no-flux” BC. All emitters used in all cases were presented as a line source with a length of L and located on the left vertical boundary of the transport domain. The emitter bottom was assigned a “Variable Flux” BC.
2.2. Analytic Method
The cumulative infiltration and duration were described using the Philip model, given as Equation (4). In this study, five influence factors were analyzed, and the dominant factors were identified. In addition, a simplified equation was proposed for vertical line source infiltration based on the Philip model [32].
where I is the cumulative infiltration (mL), t is the time (min), S is the soil water sorptivity (mL∙min−0.5), and A is the steady infiltration rate (mL∙min−1).
2.3. Error Analysis
Four indicators, namely mean absolute error (MAE), root mean squared error (RMSE), percent bias (PBIAS), and Nash-Sutcliffe efficiency (NSE), were used for error analyses between the measured and simulated values of cumulative infiltration. Calculations of the MAE and RMSE are given by Singh et al. [33]. Both PBIAS and NSE are given by Moriasi et al. [34].
where is the ith observed data, is the ith simulated data, is the mean of observed data for the constituent being evaluated, and n is the total number of observations. MAE can be potentially used to identify the presence of bias. RMSE provides an overall measure of the degree to which the data differ from the model predictions. The values of MAE and RMSE being 0 indicate a perfect fit. PBIAS is the deviation of data being evaluated and expressed as a percentage. PBIAS within ±10% are considered to be within a very accurate range. NSE ranges between −∞ and 1.0, with NSE = 1 being the optimal value.
3. Results and Discussion
3.1. Different Factors Affecting Cumulative Infiltration of Vertical Line Source Irrigation
3.1.1. Effect of Initial SWC on Cumulative Infiltration
Simulations of five types of soils—namely clay loam, silt loam, loam sandy loam and sand—were investigated at different initial SWC levels with a tube length of 20 cm, diameter of 4 cm, buried depth of 35 cm, and irrigation quota of 40 L. The field capacities of the clay loam, silt loam, loam, sandy loam and sand were 0.355, 0.321, 0.290, 0.238 and 0.153 cm3·cm−3, respectively [30,31]. The cumulative infiltration curves at different initial SWC levels are shown in Figure 2. From the figure, it is clear that the initial SWC had little effect on the cumulative infiltration dynamics of vertical line source irrigation. With increasing SWC, the water potential gradient only slightly decreased, leading to a slight decrease in cumulative infiltration. Therefore, the impacts of initial SWC could be ignored in vertical line source irrigation research.
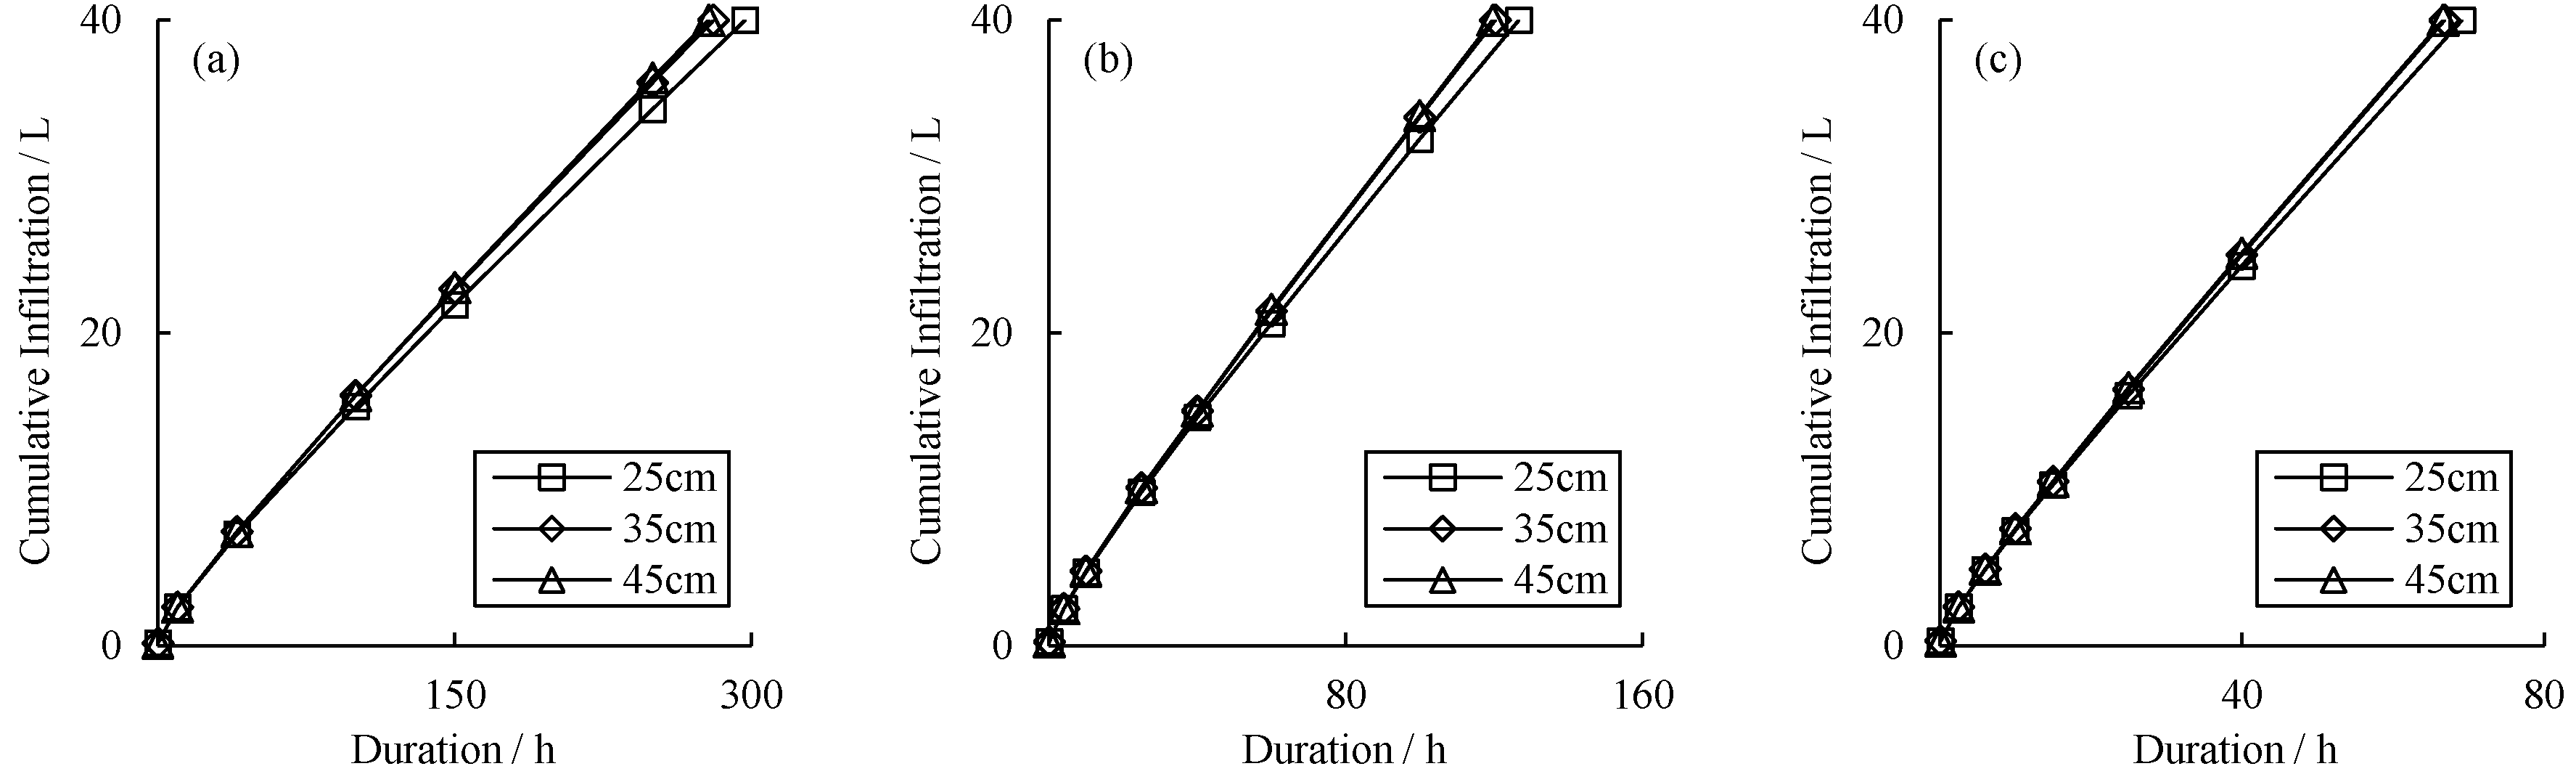
3.1.2. Effect of Tube Burial Depth on Cumulative Infiltration
The cumulative infiltration curves for three tube burial depths in clay loam, silt loam, loam, sandy loam and sand are shown in Figure 3. All simulations were conducted for a tube length of 20 cm, diameter of 4 cm, initial SWC of 50% field capacity, and irrigation quota of 40 L. The results showed that tube burial depth had little effect on the cumulative infiltration. As the tube burial depth decreased, infiltration slightly decreased. This is because when the line source was buried shallowly, the water easily migrated to the soil surface, resulting in the water potential gradient of the upper soil decreasing, and thus the infiltration decreased. It should be noted that the increase of surface water content will cause an increase in evaporation. Therefore, the depth of the line source should be increased to reduce evaporation. Considered comprehensively, the influence of the burial depth on cumulative infiltration can be ignored.
3.1.3. Effect of Tube Seepage Area on Cumulative Infiltration
The seepage area of vertical line source is can be calculated with Equation (9):
where Sa is the seepage area (cm2), D is the line source diameter (cm), and L is the line source length (cm).
The cumulative infiltration in silt loam, loam, and sandy loam of vertical line source irrigation under different Sa, D and L values was simulated at a burial depth of 35 cm, initial SWC of 50% field water capacity, and irrigation quota of 40 L. The influence of several selected soil texture classes, Sa, D and L on the cumulative infiltration is shown in Figure 4. Water moves faster through coarse-grained (sandy) soil with larger pores, compared to its movement through fine-grained (clayey) soil with smaller pores. For all treatments, the cumulative infiltration increased with an increase in Sa. From the above analyses, the effects of Sa should be taken into account in vertical line source irrigation research.
3.2. Establishment of a Simplified Model
In this section, we analyzed the characteristics of vertical line source infiltration of soils with five different textures. The cumulative infiltration was simulated with a buried depth of 35 cm, initial SWC of 50% field water capacity, and irrigation quota of 40 L.
The values of S and A, as shown in Table 1, could be obtained by fitting the simulated results of HYDRUS-2D to Equation (4). For different soil textures, the coefficients of determination (R2) were all larger than 0.95, indicating that the Philip model can adequately describe the relationship between cumulative infiltration and duration.
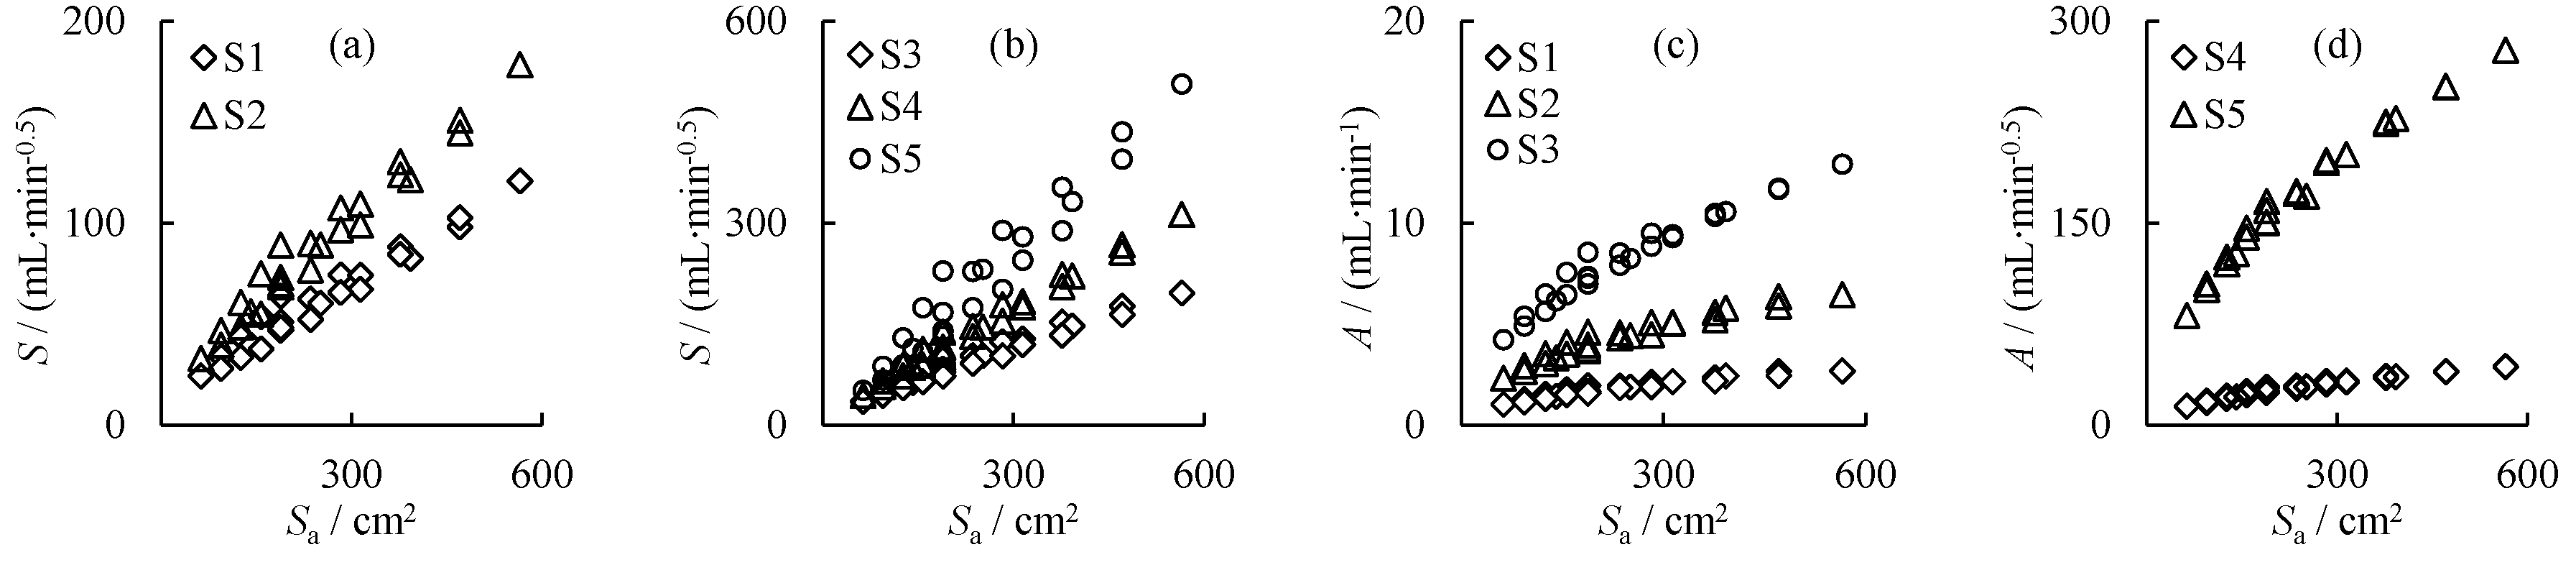
Based on the preceding analysis with the same soil texture, the initial SWC and burial depth have a weak effect on cumulative infiltration. Therefore, D and L were viewed as two main influencing factors in model establishment for a given soil. However, D and L together affect Sa, as shown in Equation (9). The cumulative infiltration increased as Sa increased. Further analyses of the relationship of Sa to S and A are shown in Figure 5.
As illustrated in Figure 5, the values of S and A increase with Sa in an approximately linear way. Thus, Equations (10) and (11) are proposed to describe these relationships:
where S is the soil water sorptivity (mL∙min−0.5), A is the steady infiltration rate (mL∙min−1), Sa is seepage area (cm2), and a, b, c, and d are the fitting parameters.
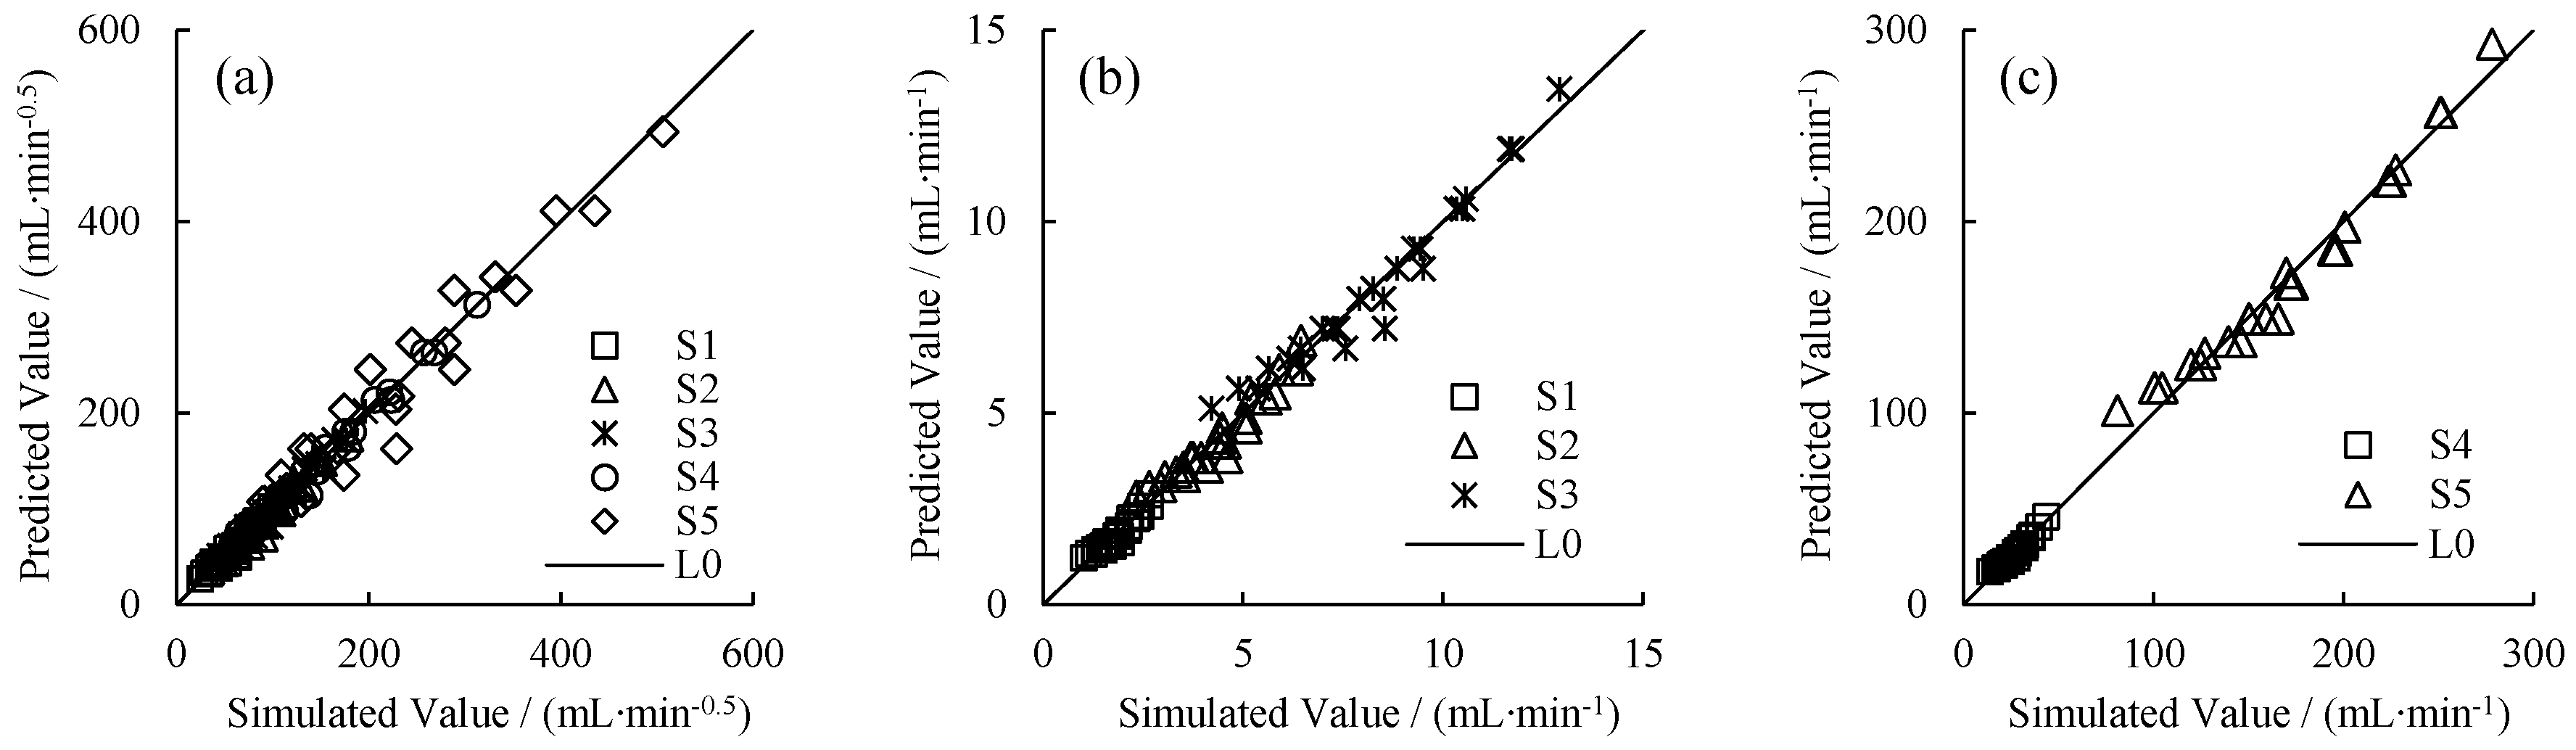
Table 1 compares parameters S and A for different soil textures, and Figure 6 shows the predicted values based on Equations (10) and (11). It is clear from the figures that the predicted value values of S and A were in good agreement with almost all simulated values, indicating that the simplified model can be used to predict S and A.
The combination of Equations (9) and (10), and Equations (9) and (11) results in:
Combining Equations (4), (12) and (13), a simplified model for predicting the cumulative infiltration is proposed:
The values of a, b, c, and d are firstly obtained by fitting Equations (12) and (13) to two sets of experiment data with different seepage areas. In addition, the cumulative infiltration of vertical source irrigation under other irrigation parameters can then be conveniently predicted through the model simplified above (i.e., Equation (14)).
3.3. Evaluation of the Simplified Model
In this section, we describe the results of laboratory experiments conducted using two soil types (sandy loam and aeolian sand) in the Minqin region in the Hexi Corridor of China to verify the reliability of the simplified model.
The experimental equipment consisted of three parts: soil tank, mariotte bottle and irrigation emitter. The soil tank was made from 10 mm thick transparent acrylic material, and measured 60 cm long, 60 cm wide and 100 cm deep. The bottom of the soil tank had numerous 2 mm holes for ventilation, and the side near the emitter had a 2 cm hole for measurement of the moisture content after irrigation. The space between the holes was 5 cm. The irrigation emitter adopted plastic tubes with certain length, diameter and small holes on their wall. The plastic pipe was divided into 1/4 cylinder, and the bottom was sealed. A mariotte bottle was used to maintain a constant water pressure head.
The soil sample was loaded into the soil tank in 5 cm layers to obtain a homogeneous soil profile with a designed bulk density. For convenient observation of soil wetting pattern, the emitter was placed close to the corner of the soil box. The experiment was set up to test applications with three diameters (3 cm, 4 cm and 5 cm) and four lengths (20 cm, 25 cm, 30 cm and 35 cm) of water emitters for a total of six treatments. Each treatment was repeated three times. Cumulative infiltration was recorded, and the wetting front was drawn on the soil box surface with a marker pen during the infiltration. Finally, when infiltration reached the irrigation quota (40 L), the water supply was stopped, and soil samples were collected from side holes, and the SWC was determined by recording the weight loss of the samples after oven drying at 105 °C for 24 h.
Two experimental treatments (D = 4 cm, L = 25 cm and D = 4 cm, L = 35 cm) were used to determine the simplified model parameters. In addition, the value of the fitting parameters a, b, c, and d for two soils are given in Table 2.
A simplified model for the vertical line source of the two soils was established.
For Minqin sandy loam:
For Minqin aeolian sand:
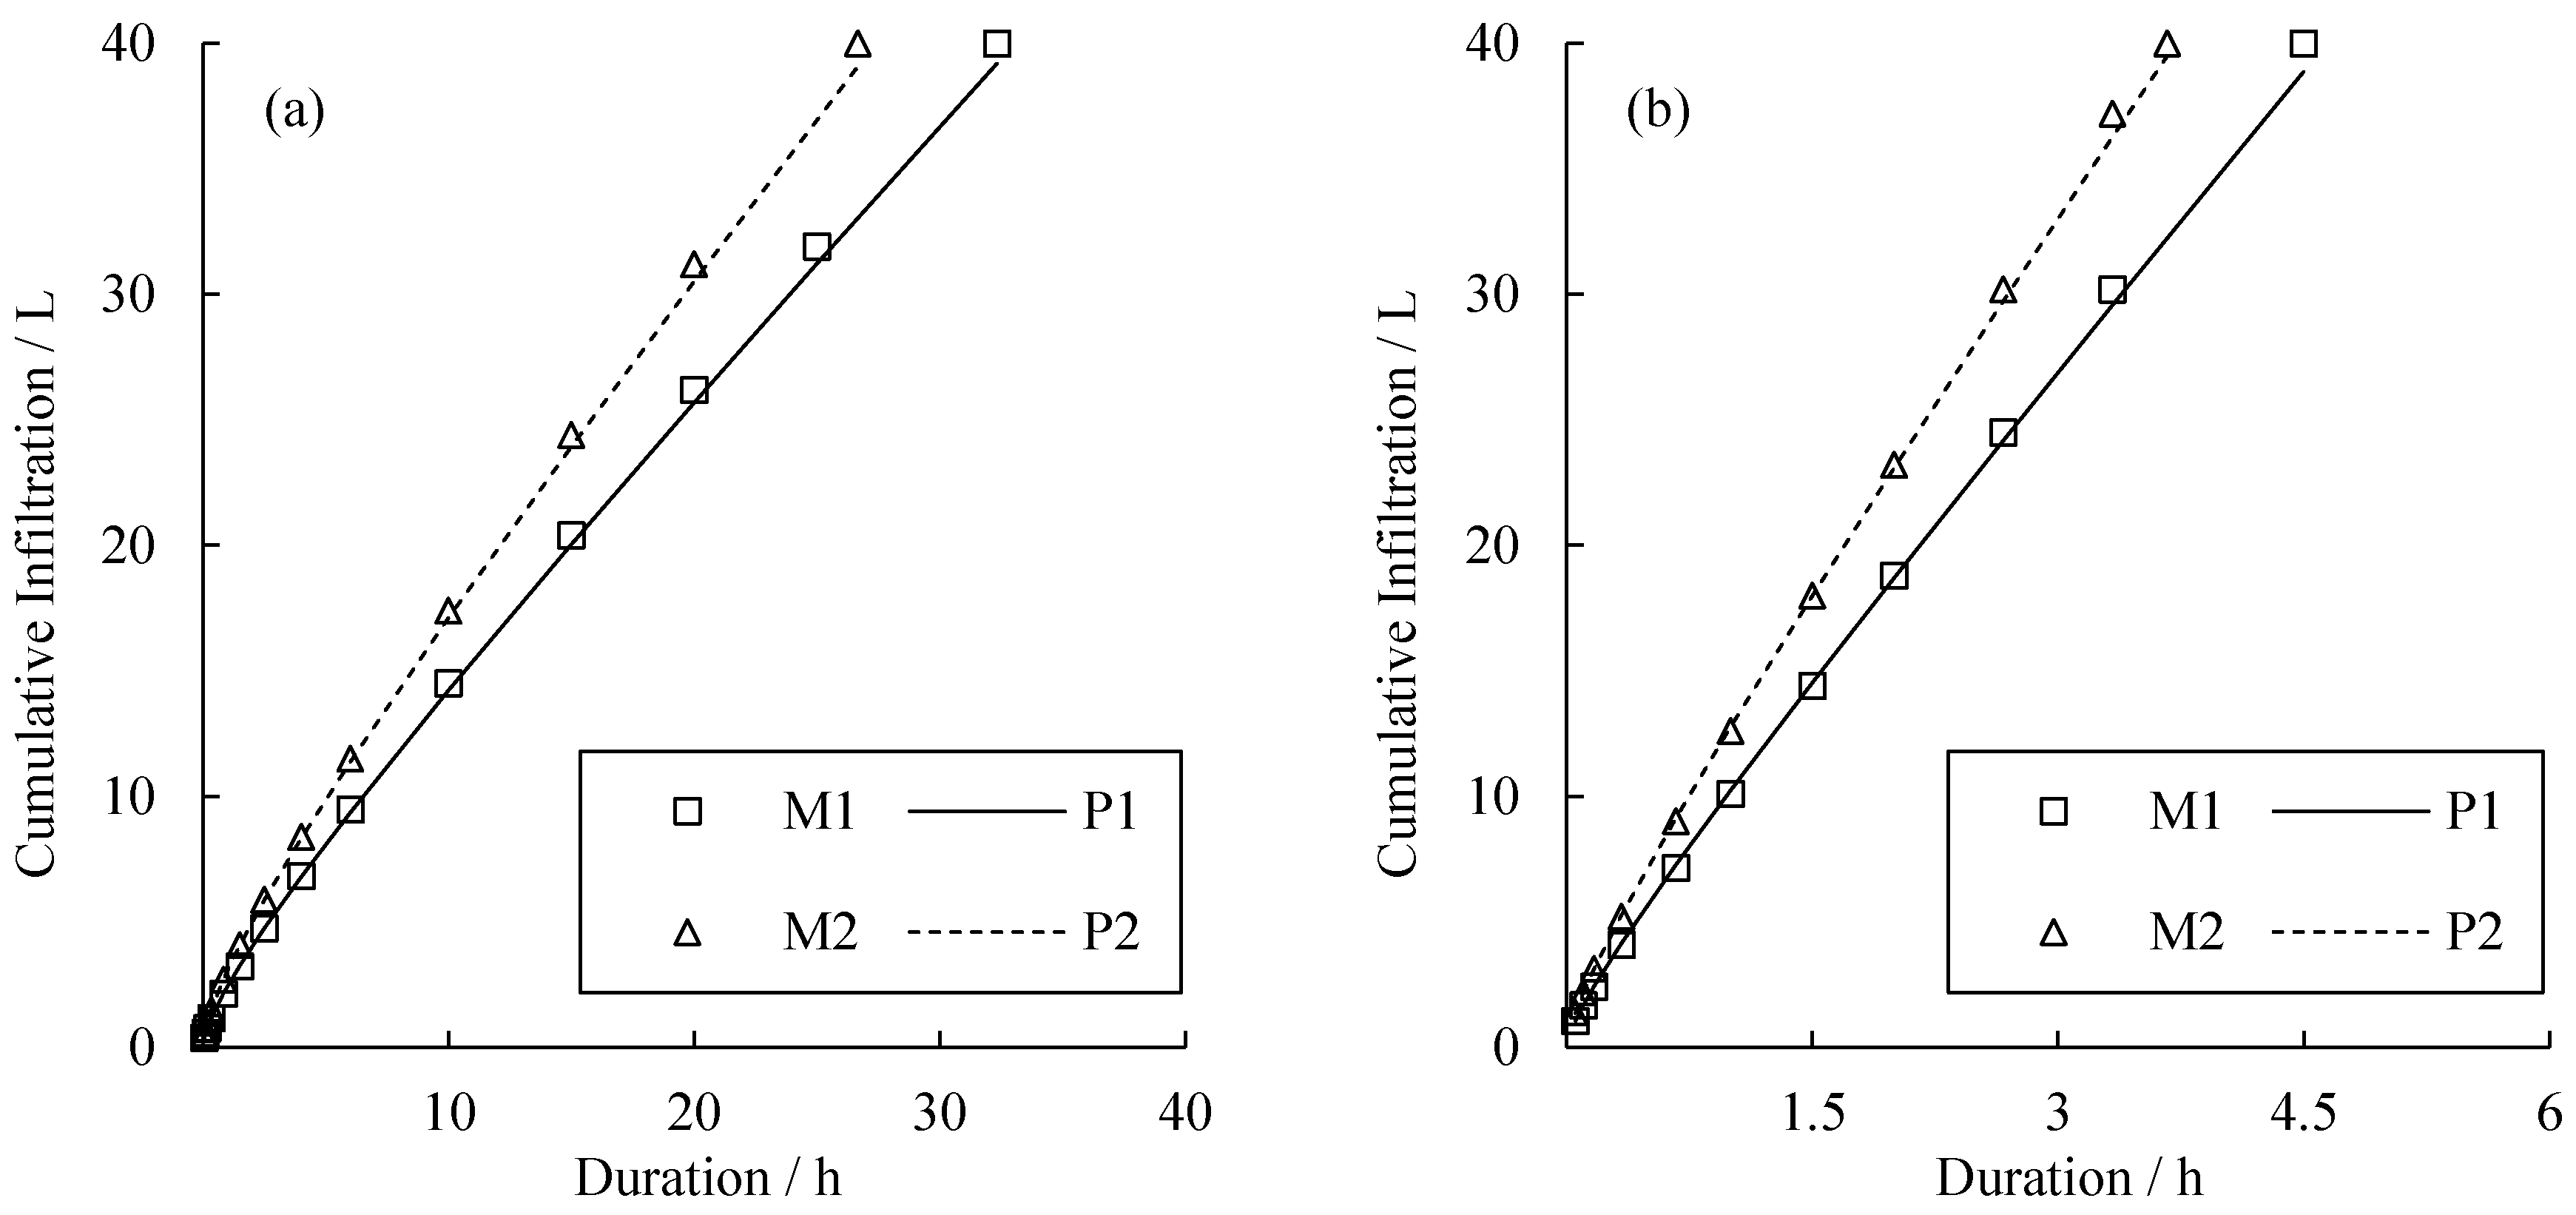
Comparison of measured data and model predictions for two soils are shown in Figure 7. Statistical analysis was performed using paired samples t-test. p-values were 0.956 and 0.971, respectively. Values of p > 0.05 indicate no significant difference between the predicted and measured data.
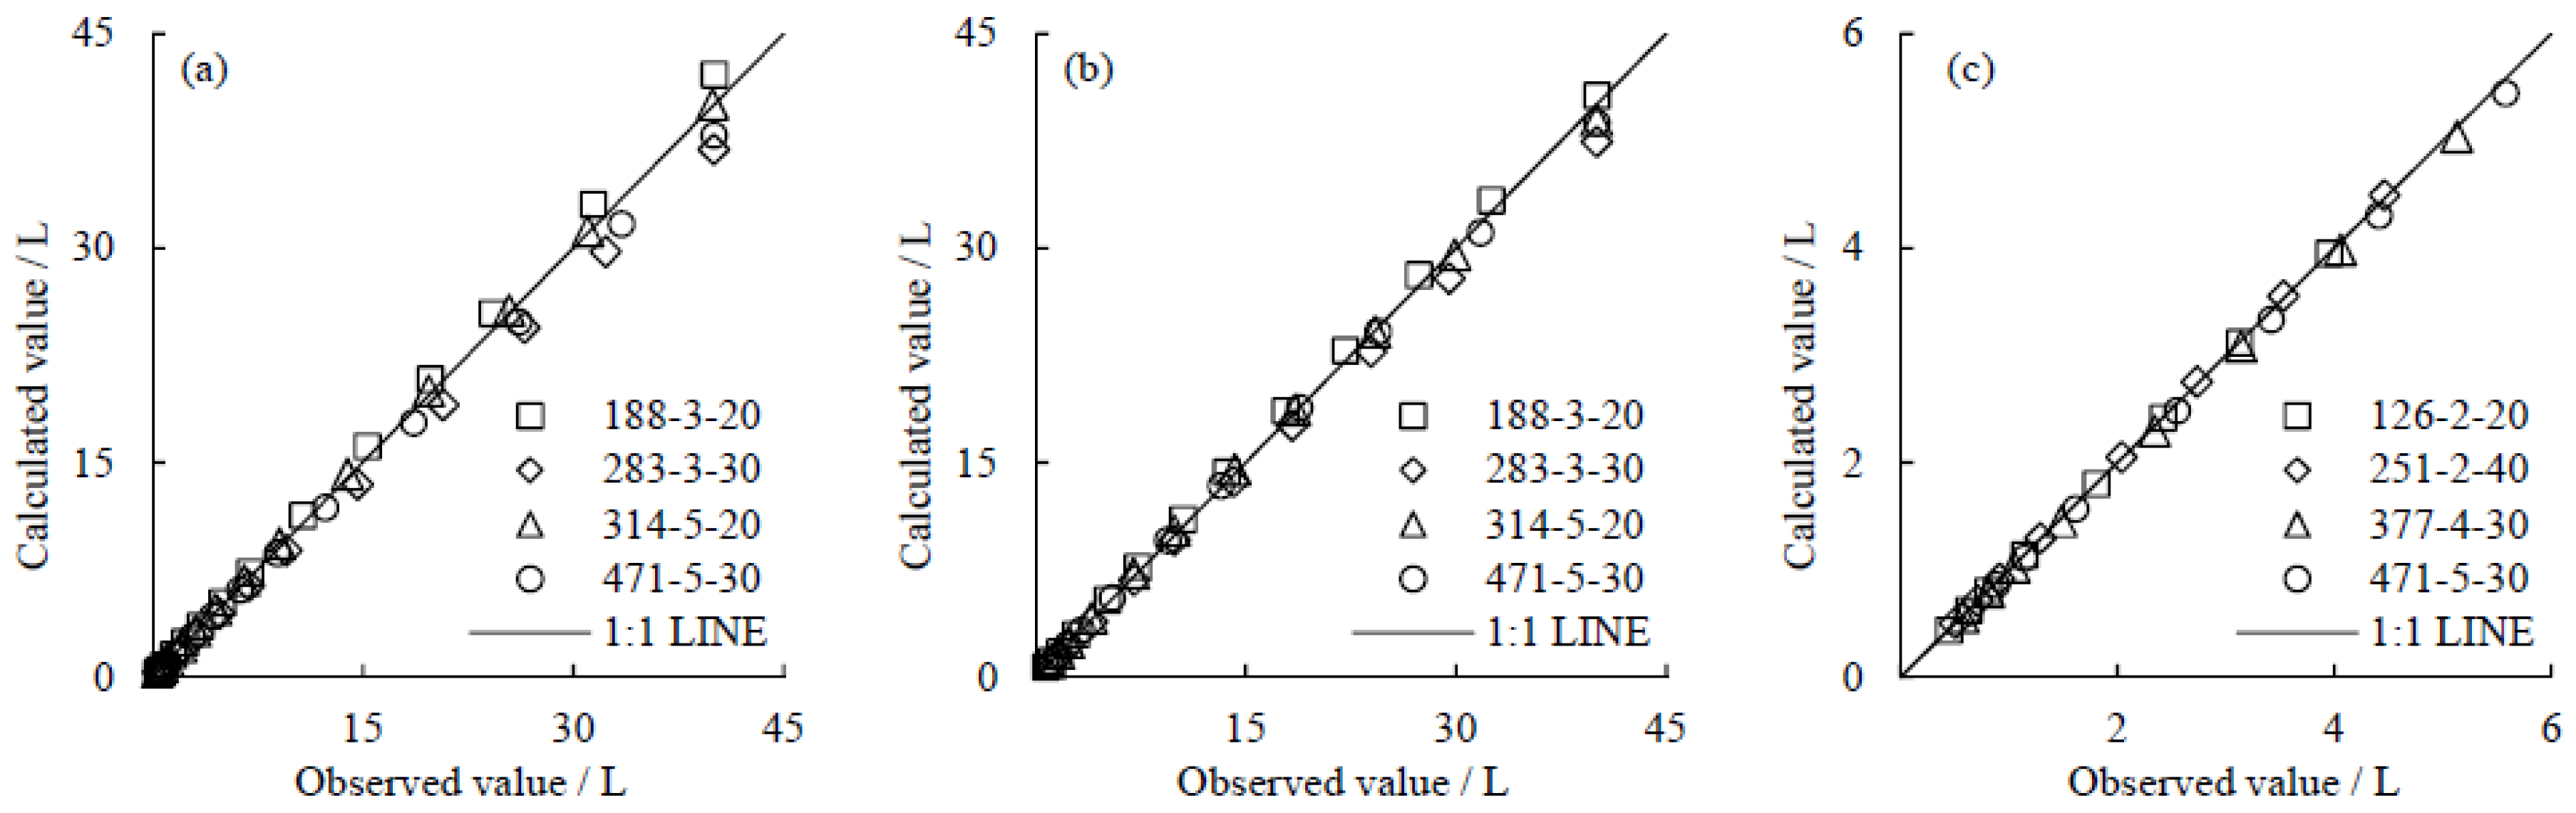
In addition, we also carried out experiments at two diameters (3 cm and 5 cm) and two lengths (20 cm and 30 cm). Figure 8a,b shows the comparison of the measured values and the calculated values obtained from Equations (15) and (16).
To more thoroughly evaluate the simplified model established in this study, we also compared the published data of clay loam from Shanshan region in the Turpan Depression, China [18]. The cumulative infiltration was analyzed with six different combinations of D and L values. Two fitting values of S (D = 2 cm, L = 30 cm, and D = 3 cm, L = 30 cm) were selected to calculate parameters a and b. Equation (17) is the simplified model for Shanshan clay loam. A comparison of values calculated from Equation (17) with the measured values of the cumulative infiltration under different D and L values is illustrated in Figure 8c.
The MAE, RMSE, PBIAS and NSE values for measured and calculated values are presented in Table 3. MAE, RMSE, and PBIAS values ranged from 0.028 to 0.480 L, 0.036 to 0.918 L, and 0.321% to 0.900%, respectively. Meanwhile, NSE values were very close to 1.0. Notably, all results were in good agreement, indicating that the model can effectively describe the characteristics of vertical line source irrigation.
4. Conclusions
Numerical simulations carried out in this study show that the initial SWC and buried depth have little effect on cumulative infiltration during vertical line source irrigation, whereas the line source seepage area (Sa) significantly affect the cumulative infiltration and increase with Sa. Furthermore, we proposed a simplified method for predicting the cumulative infiltration for vertical line source irrigation based on the Philip model. Finally, we conducted a comparative analysis of simulations and experiments using the following four statistical measures: mean absolute error (MAE), root mean squared error (RMSE), percent bias (PBIAS), and Nash-Sutcliffe efficiency (NSE). With a low MAE of 0.028–0.480 L, a low RMSE of 0.043–0.908 L, a good PBIAS range (PBIAS < ±1.0) and a great Nash-Sutcliffe coefficient close to 1.0 (NSE ≥ 0.995). This suggests that the predicted cumulative infiltration with simplified method was in a very good agreement with the observed values. For relatively homogeneous soil conditions, the model can be used by irrigation systems designers to estimate cumulative infiltration with irrigation emitter parameters of diameter (D) and length (L). It has to be noted that further research is needed to evaluate such empirical models under in field conditions, where other important factors, such as soil layering, may significantly affect water flow and distribution. In addition, only five soil types were tested in this study, the relationship between model fitting parameters and other soil textures still needs to be explored.
Acknowledgments
This research was supported by the National Key Research and Development Program of China (No. 2016YFC0500901), the National Natural Science Foundation of China (No. 51409137), and the Independent Research Project of the State Key Laboratory of Simulation and Regulation of Water Cycle in River Basin, China Institute of Water Resources and Hydropower Research (No. 2016ZY01). Special and sincere thanks to the Key Laboratory of Mechanics on Disaster and Environment in Western China, the Ministry of Education of China for the support for the experiments.
Author Contributions
Yanwei Fan designed the experiments; Yanwei Fan and Tong Zhao performed the experiments; Xiaoxia Shao analyzed the data; Yanwei Fan contributed analysis tools; Yanwei Fan wrote the paper; and Ning Huang, Jiaguo Gong and Jie Zhang revised the paper.
Conflicts of Interest
The authors declare no conflict of interest.
References
- Deng, X.P.; Shan, L.; Zhang, H.; Turner, N.C. Improving agricultural water use efficiency in arid and semiarid areas of China. Agric. Water Manag. 2006, 80, 23–40. [Google Scholar] [CrossRef]
- Du, S.; Kang, S.; Li, F.; Du, T. Water use efficiency is improved by alternate partial root-zone irrigation of apple in arid Northwest China. Agric. Water Manag. 2017, 179, 184–192. [Google Scholar] [CrossRef]
- Zeng, C.; Wang, Q.; Fan, J. Effect of initial water content on vertical line-source infiltration characteristics of soil. Trans. Chin. Soc. Agric. Eng. 2010, 26, 24–30. (In Chinese) [Google Scholar]
- Cheng, H.J.; Wang, Q.J.; Bai, Y.G.; Cai, J.S.; Zeng, C. Influence of line source length of vertical line source irrigation on wetted soil change characteristics. Trans. Chin. Soc. Agric. Eng. 2010, 26, 32–37. (In Chinese) [Google Scholar]
- Khatri, K.L.; Smith, R.J. Real-time prediction of soil infiltration characteristics for the management of furrow irrigation. Irrig. Sci. 2006, 25, 33–43. [Google Scholar] [CrossRef]
- Bamutaze, Y.; Tenywa, M.M.; Majaliwa, M.J.G.; Vanacker, V.; Bagoora, F.; Magunda, M.; Obandog, J.; Wasigeh, J.E. Infiltration characteristics of volcanic sloping soils on Mt. Elgon, Eastern Uganda. Catena 2010, 80, 122–130. [Google Scholar] [CrossRef]
- Bai, D.; He, J.; Guo, L.; Wang, X.; Liang, Z. Infiltration characteristics of vertical tube sub-irrigation as affected by various factors. Trans. Chin. Soc. Agric. Eng. 2016, 32, 101–105. (In Chinese) [Google Scholar]
- Li, Y.B.; Fan, Y.W.; Liu, Y.; Ma, X.Y. Influencing Factors and Simplified Model of Film Hole Irrigation. Water 2017, 9, 543. [Google Scholar] [CrossRef]
- El-Nesr, M.N.; Alazba, A.A.; Šimůnek, J. HYDRUS simulations of the effects of dual-drip subsurface irrigation and a physical barrier on water movement and solute transport in soils. Irrig. Sci. 2014, 32, 111–125. [Google Scholar] [CrossRef]
- Boštjan, N.; Kechavarzi, C.; Coulon, F.; Pintar, M. Numerical investigation of the influence of texture, surface drip emitter discharge rate and initial soil moisture condition on wetting pattern size. Irrig. Sci. 2014, 32, 421–436. [Google Scholar]
- Huang, M.; Barbour, S.L.; Elshorbagy, A.; Zettl, J.D.; Si, B.C. Infiltration and drainage processes in multi-layered coarse soils. Can. J. Soil Sci. 2011, 91, 185–197. [Google Scholar] [CrossRef]
- Khoshravesh-Miangoleh, M.; Kiani, R.A. Effect of magnetized water on infiltration capacity of different soil textures. Soil Use Manag. 2014, 30, 588–594. [Google Scholar] [CrossRef]
- Li, Z.; Wu, P.; Feng, H.; Zhao, X.; Huang, J.; Zhuang, W. Simulated experiment on effect of soil bulk density on soil infiltration capacity. Trans. Chin. Soc. Agric. Eng. 2009, 25, 40–45. (In Chinese) [Google Scholar]
- Yang, J.L.; Zhang, G.L. Water infiltration in urban soils and its effects on the quantity and quality of runoff. J. Soils Sediments 2011, 11, 751–761. [Google Scholar] [CrossRef]
- León, J.; Echeverría, M.T.; Martí, C.; Badía, D. Can ash control infiltration rate after burning? An example in burned calcareous and gypseous soils in the Ebro Basin (NE Spain). Catena 2015, 135, 377–382. [Google Scholar] [CrossRef]
- Liu, H.; Lei, T.W.; Zhao, J.; Yuan, C.P.; Fan, Y.T.; Qu, L.Q. Effects of rainfall intensity and antecedent soil water content on soil infiltrability under rainfall conditions using the run off-on-out method. J. Hydrol. 2011, 396, 24–32. [Google Scholar] [CrossRef]
- Stewart, R.D.; Rupp, D.E.; Najm, M.R.A.; Selker, J.S. Modeling effect of initial soil moisture on sorptivity and infiltration. Water Resour. Res. 2013, 49, 7037–7047. [Google Scholar] [CrossRef]
- Cheng, H. Experimental Studies on the Characteristics Soil of Water Moisture Movement and Growth Grapevine under Vertical Line Source Irrigation. Master’s Thesis, Xi’an University of Technology, Xi’an, China, 2010. (In Chinese). [Google Scholar]
- Patel, N.; Rajput, T.B.S. Effect of drip tape placement depth and irrigation level on yield of potato. Agric. Water Manag. 2007, 88, 209–223. [Google Scholar] [CrossRef]
- Šimůnek, J.; Genuchten, M.T.; Šejna, M. Development and applications of the HYDRUS and STANMOD software packages and related codes. Vadose Zone J. 2008, 7, 587–600. [Google Scholar] [CrossRef]
- Šimůnek, J.; Van Genuchten, M.T.; Šejna, M. Recent developments and applications of the HYDRUS computer software packages. Vadose Zone J. 2016, 15, 1–25. [Google Scholar] [CrossRef]
- Saito, H.; Simunek, J.; Scanlon, B.R.; Reedy, R.C. Numerical Analysis of Coupled Water, Vapor and Heat Transport in the Vadose Zone using HYDRUS. Vadose Zone J. 2006, 5, 784–800. [Google Scholar] [CrossRef]
- Skaggs, T.H.; Trout, T.J.; Šimůnek, J.; Shouse, P.J. Comparison of HYDRUS-2D Simulations of Drip Irrigation with Experimental Observations. J. Irrig. Drain. Eng. 2004, 130, 304–310. [Google Scholar] [CrossRef]
- Li, S.; Wang, Q. Simulation of Soil Water Distribution under Vertical Line Source Infiltration. Trans. Chin. Soc. Agric. Mach. 2011, 42, 51–57. (In Chinese) [Google Scholar]
- Šimůnek, J.; Van Genuchten, M.T.; Šejna, M. The HYDRUS Software Package for Simulating the Two-and Three-Dimensional Movement of Water, Heat, and Multiple Solutes in Variably Saturated Media; Technical Manual, Version 1.0; PC Progress: Prague, Czech Republic, 2006; p. 241. [Google Scholar]
- Van Genuchten, M.T. A closed-form equation for predicting the hydraulic conductivity of unsaturated soils. Soil Sci. Soc. Am. J. 1980, 44, 892–898. [Google Scholar] [CrossRef]
- Mualem, Y. A new model for predicting the hydraulic conductivity of unsaturated porous media. Water Resour. Res. 1976, 12, 513–522. [Google Scholar] [CrossRef]
- Zhang, L.J.; Wang, Y.K.; Xin, X.G.; Li, H.Y. Appropriate surge spring root irrigation layout and irrigation norm of jujube on mountain land. J. Northwest A F Univ. 2010, 38, 211–217. (In Chinese) [Google Scholar]
- Carsel, R.F.; Parrish, R.S. Developing joint probability distributions of soil water retention characteristics. Water Resour. Res. 1988, 24, 755–769. [Google Scholar] [CrossRef]
- Jiang, P.; Lei, T.; Liu, X.; Yang, W.; Xin, L.; Wang, Q. Principles and experimental verification of capillary suction method for fast measurement of field capacity. Trans. Chin. Soc. Agric. Eng. 2006, 22, 1–5. (In Chinese) [Google Scholar]
- Rab, M.A.; Chandra, S.; Fisher, P.D.; Robinson, N.J.; Kitching, M.; Aumann, C.D.; Imhof, M. Modelling and prediction of soil water contents at field capacity and permanent wilting point of dryland cropping soils. Soil Res. 2011, 49, 389–407. [Google Scholar] [CrossRef]
- Philip, J.R. The Theory of Infiltration: 4. Sorptivity and Algebraic Infiltration Equations. Soil Sci. 1957, 84, 257–264. [Google Scholar] [CrossRef]
- Singh, D.K.; Rajput, T.B.S.; Singh, D.K.; Sikarwar, H.S.; Sahoo, R.N.; Ahmad, T. Simulation of soil wetting pattern with subsurface drip irrigation from line source. Agric. Water Manag. 2006, 83, 130–134. [Google Scholar] [CrossRef]
- Moriasi, D.; Arnold, J.; Van Liew, M.W.; Veith, T.L. Model evaluation guidelines for systematic quantification of accuracy in watershed simulations. Trans. ASABE 2007, 50, 885–900. [Google Scholar] [CrossRef]
Figure 1.
The transport domain with applied initial and boundary conditions.

Figure 2.
Effect of initial SWC on cumulative infiltration from a vertical line source irrigation (for different initial soil moisture expressed as the percentage of field capacity). (a) clay loam; (b) silt loam; (c) loam; (d) sandy loam; and (e) sand.
Figure 2.
Effect of initial SWC on cumulative infiltration from a vertical line source irrigation (for different initial soil moisture expressed as the percentage of field capacity). (a) clay loam; (b) silt loam; (c) loam; (d) sandy loam; and (e) sand.
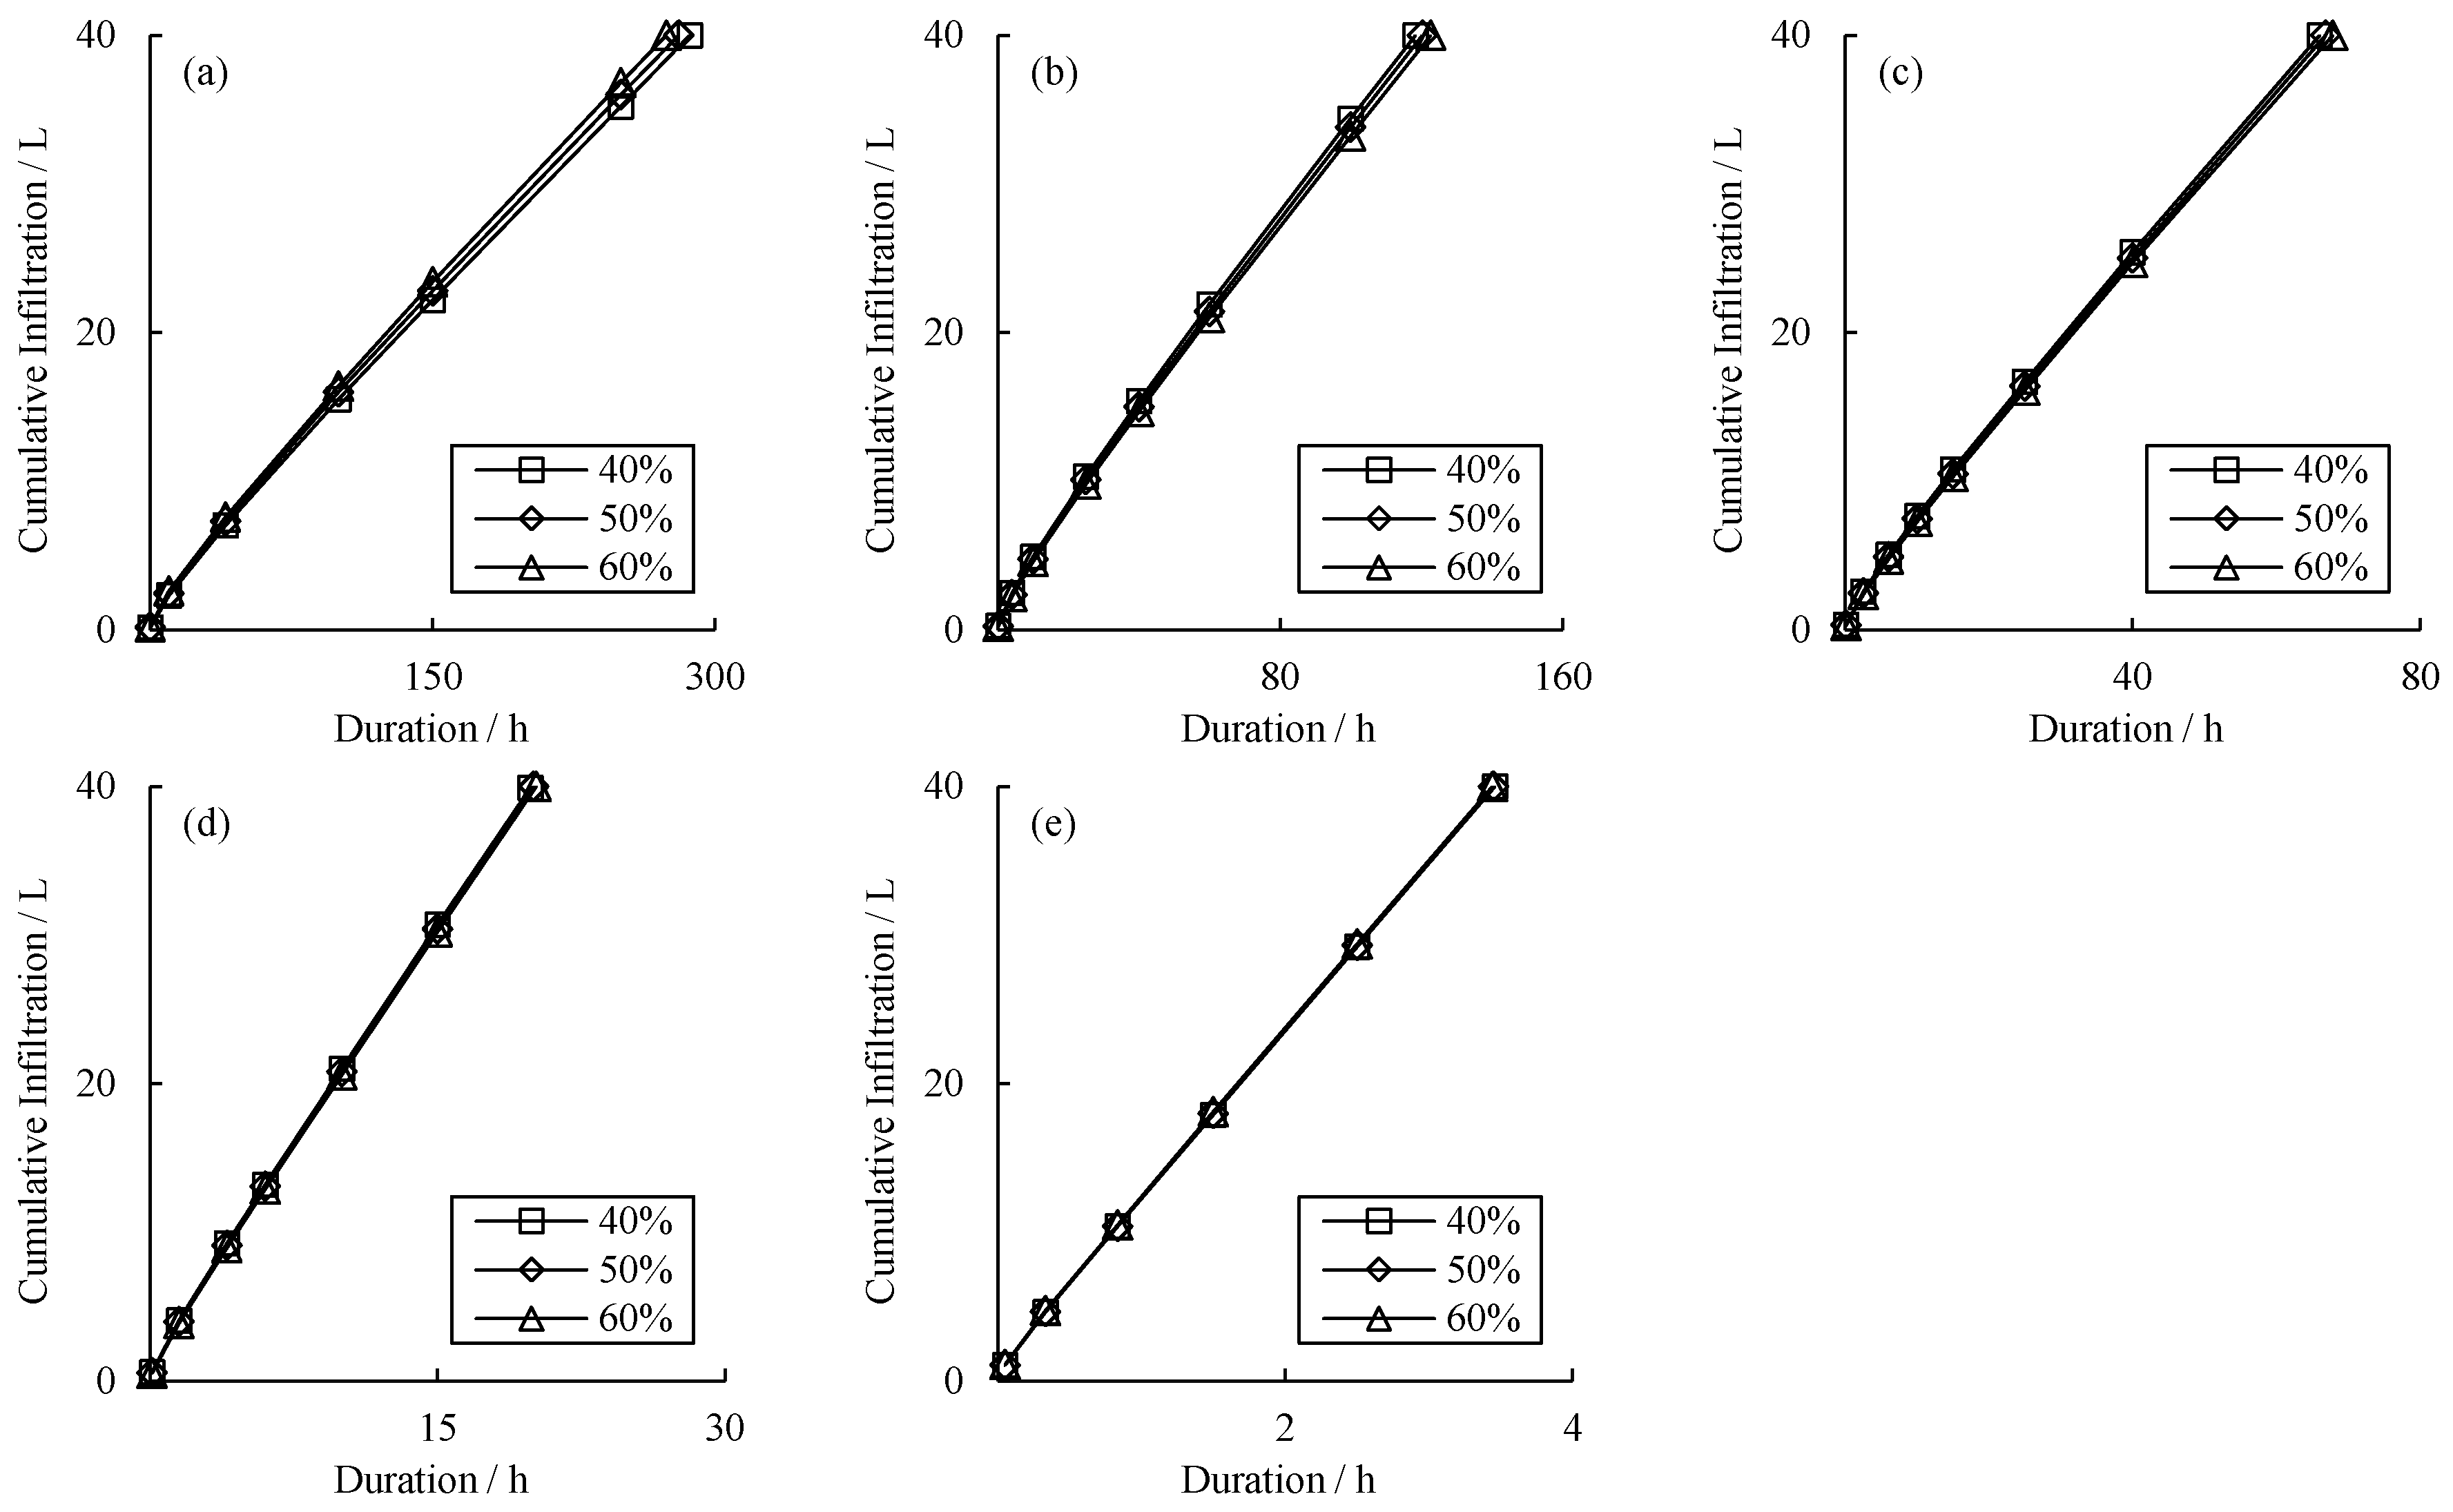
Figure 3.
Effect of tube burial depth on cumulative infiltration from a vertical line source irrigation. (a) clay loam; (b) silt loam; (c) loam; (d) sandy loam; and (e) sand.
Figure 3.
Effect of tube burial depth on cumulative infiltration from a vertical line source irrigation. (a) clay loam; (b) silt loam; (c) loam; (d) sandy loam; and (e) sand.

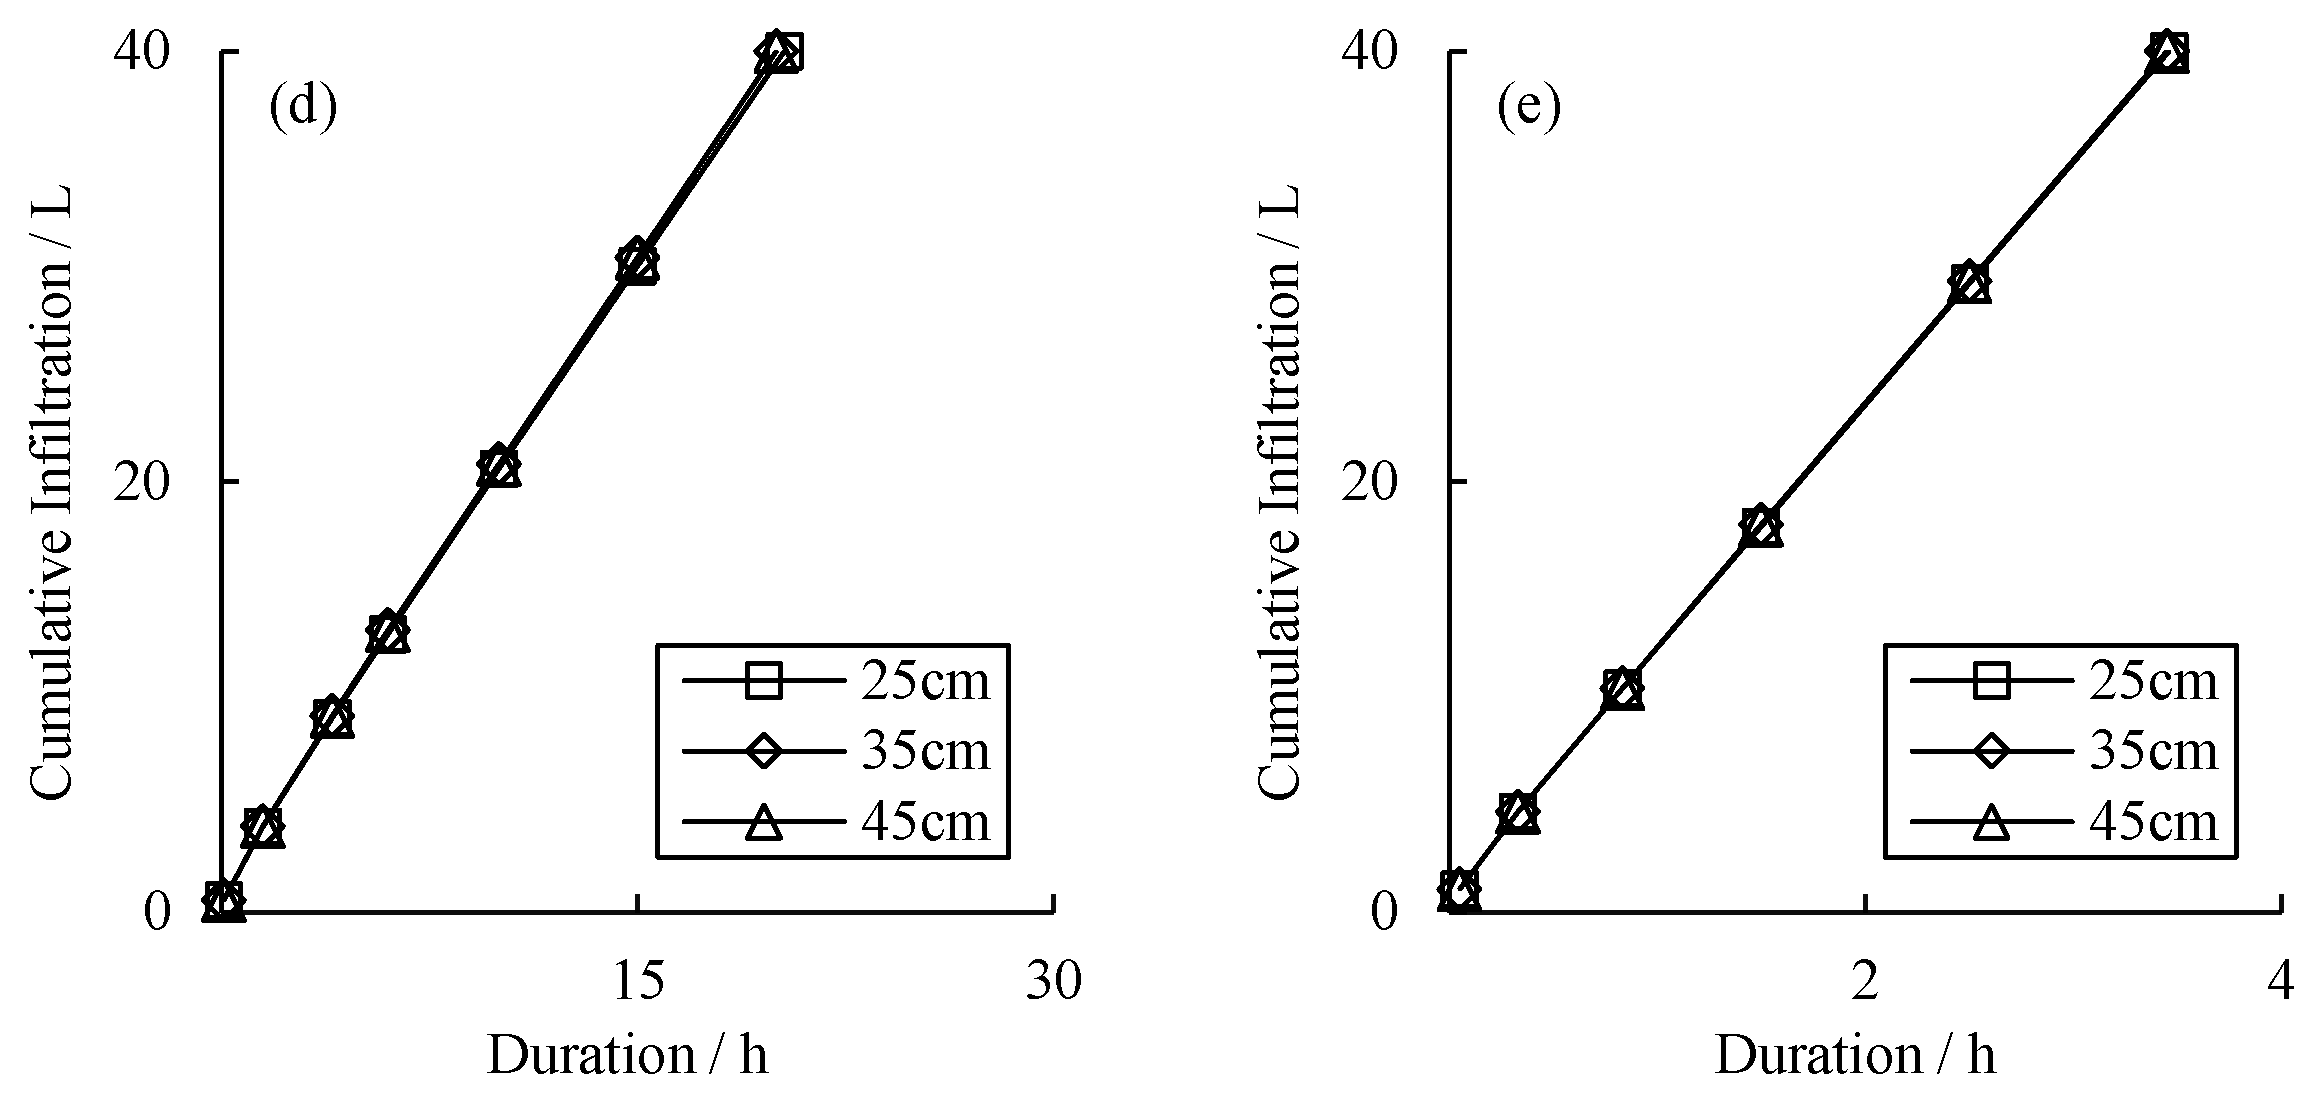
Figure 4.
Effect of tube seepage area, diameter and length on vertical line source irrigation. In the legend, the first values are the seepage area (Sa), cm2, the second values are the diameter (D), cm, and the third values are the length (L), cm. (a) silt loam; (b) loam; and (c) sandy loam.
Figure 4.
Effect of tube seepage area, diameter and length on vertical line source irrigation. In the legend, the first values are the seepage area (Sa), cm2, the second values are the diameter (D), cm, and the third values are the length (L), cm. (a) silt loam; (b) loam; and (c) sandy loam.
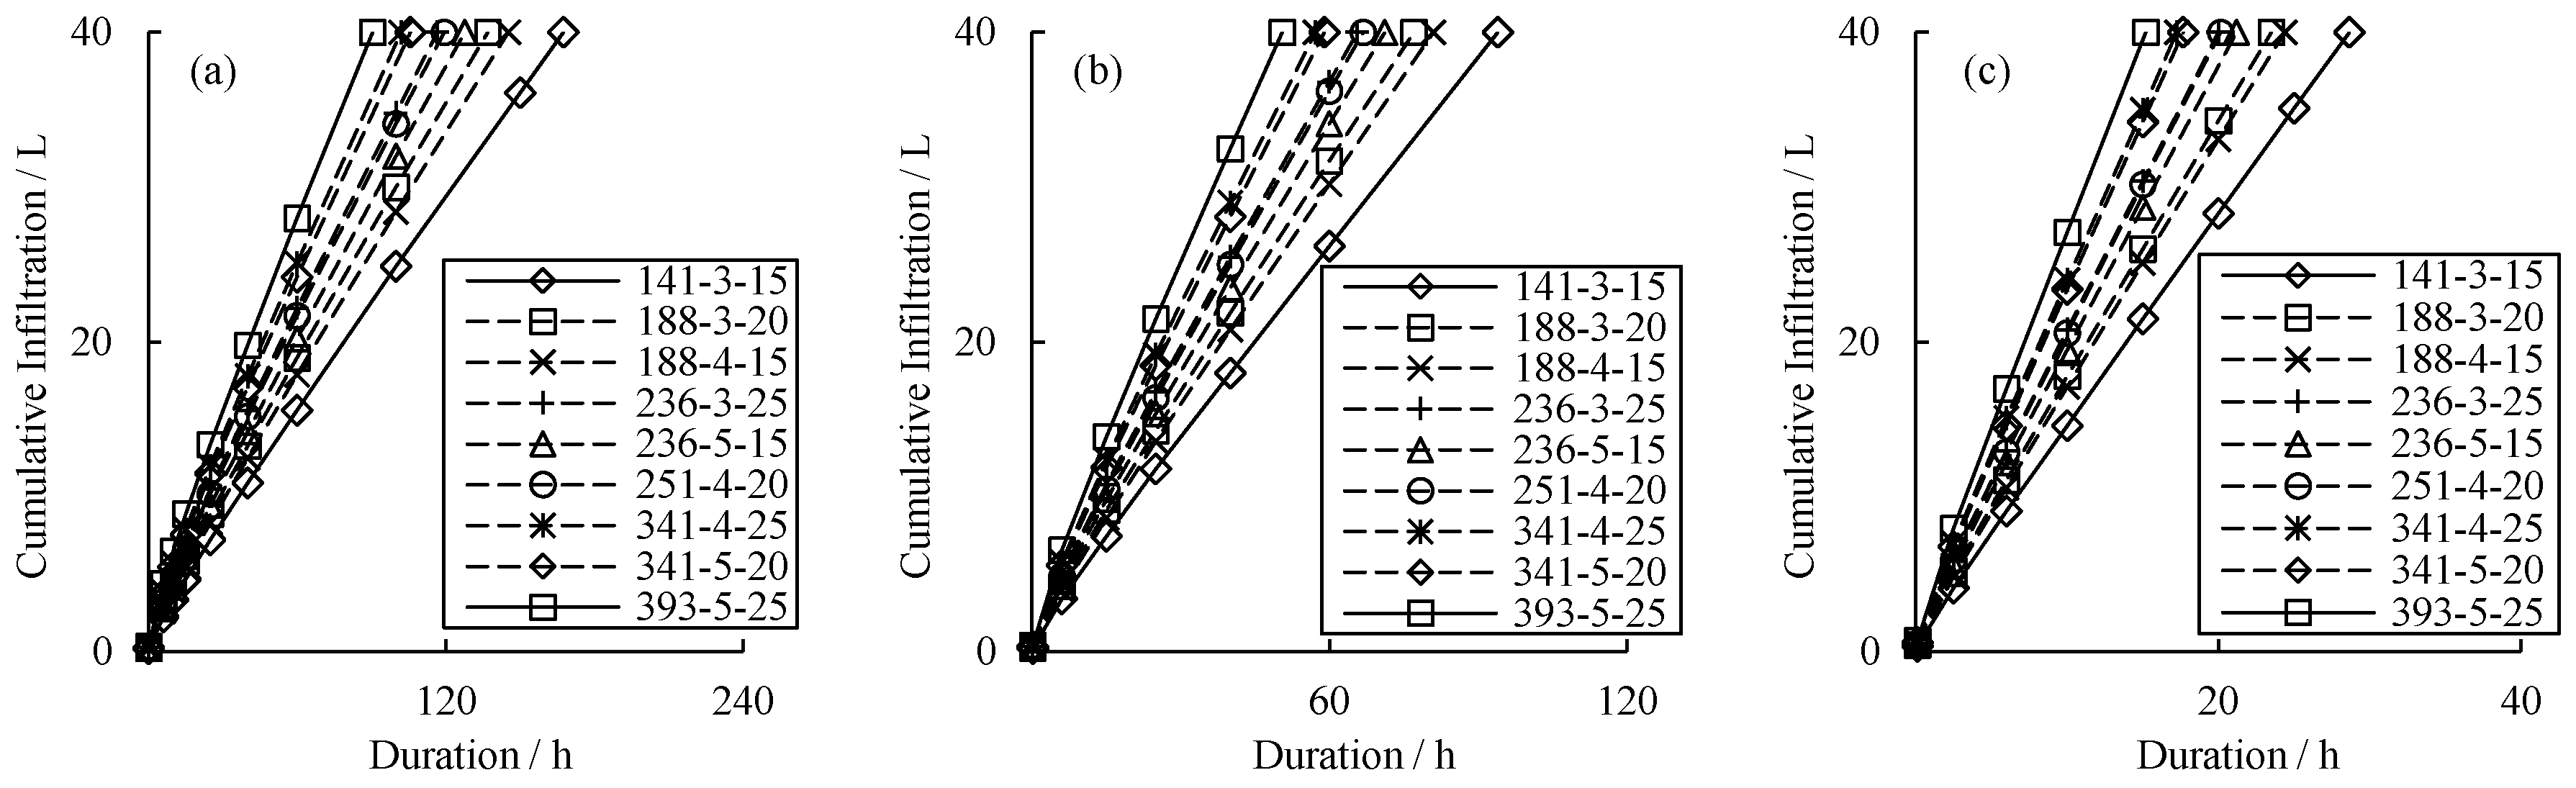
Figure 5.
Effect of tube seepage area on vertical line source irrigation. (a,b) soil water sorptivity; (c,d) steady infiltration rate. S1 = clay loam; S2 = silt loam; S3 = loam; S4 = sandy loam; and S5 = sand.
Figure 5.
Effect of tube seepage area on vertical line source irrigation. (a,b) soil water sorptivity; (c,d) steady infiltration rate. S1 = clay loam; S2 = silt loam; S3 = loam; S4 = sandy loam; and S5 = sand.

Figure 6.
Comparison of simulated and estimated S and A. (a) soil water sorptivity; (b,c) steady infiltration rate. S1 = clay loam; S2 = silt loam; S3 = loam; S4 = sandy loam; S5 = sand; and L0 = 1:1 line.
Figure 6.
Comparison of simulated and estimated S and A. (a) soil water sorptivity; (b,c) steady infiltration rate. S1 = clay loam; S2 = silt loam; S3 = loam; S4 = sandy loam; S5 = sand; and L0 = 1:1 line.

Figure 7.
Comparison of measured data and model predictions. (a) Minqin sandy loam; and (b) Minqin aeolian sand. M1 = measured value (D = 4 cm and L = 25 cm); P1 = predicted value (D = 4 cm and L = 25 cm); M2 = measured value (D = 4 cm and L = 35 cm); and P2 = predicted value (D = 4 cm and L = 35 cm);

Figure 8.
Comparison of the calculated values and observed values of cumulative infiltration of different soils. (a): Minqin sandy loam; (b): Minqin aeolian sand; (c): Shanshan clay loam.
Figure 8.
Comparison of the calculated values and observed values of cumulative infiltration of different soils. (a): Minqin sandy loam; (b): Minqin aeolian sand; (c): Shanshan clay loam.


Table 1.
Fitted infiltration parameter values.
| Diameter (cm) | Length (cm) | Seepage Area (cm2) | Clay Loam | Silt Loam | Loam | Sandy Loam | Sand | |||||
|---|---|---|---|---|---|---|---|---|---|---|---|---|
| S | A | S | A | S | A | S | A | S | A | |||
| 2 | 10 | 63 | 24.21 | 1.02 | 33.09 | 2.33 | 34.96 | 4.22 | 43.87 | 13.91 | 51.39 | 81.17 |
| 15 | 94 | 33.89 | 1.28 | 46.95 | 2.95 | 50.36 | 5.38 | 66.19 | 17.75 | 87.34 | 104.66 | |
| 20 | 126 | 43.70 | 1.52 | 60.77 | 3.54 | 65.89 | 6.49 | 88.95 | 21.43 | 129.49 | 124.90 | |
| 25 | 157 | 53.60 | 1.75 | 74.86 | 4.10 | 81.67 | 7.56 | 112.62 | 24.95 | 174.12 | 146.14 | |
| 30 | 188 | 63.82 | 1.95 | 89.14 | 4.60 | 98.12 | 8.55 | 137.98 | 28.13 | 228.90 | 165.76 | |
| 3 | 10 | 94 | 28.07 | 1.14 | 39.53 | 2.66 | 43.95 | 4.90 | 57.65 | 16.66 | 66.96 | 100.63 |
| 15 | 141 | 39.47 | 1.41 | 56.12 | 3.33 | 63.46 | 6.15 | 85.62 | 21.06 | 114.16 | 127.13 | |
| 20 | 188 | 51.01 | 1.67 | 73.11 | 3.95 | 83.00 | 7.36 | 115.46 | 25.07 | 167.27 | 150.20 | |
| 25 | 236 | 62.39 | 1.92 | 89.91 | 4.57 | 102.92 | 8.51 | 146.47 | 28.85 | 228.08 | 173.34 | |
| 30 | 283 | 74.33 | 2.12 | 107.35 | 5.08 | 123.59 | 9.50 | 178.67 | 32.36 | 289.28 | 196.40 | |
| 4 | 10 | 126 | 33.48 | 1.30 | 48.43 | 3.05 | 55.15 | 5.64 | 73.43 | 19.52 | 89.46 | 119.63 |
| 15 | 188 | 46.93 | 1.60 | 68.44 | 3.75 | 79.03 | 6.98 | 108.75 | 24.20 | 139.57 | 150.41 | |
| 20 | 251 | 60.15 | 1.89 | 88.98 | 4.42 | 103.18 | 8.25 | 145.54 | 28.48 | 231.22 | 169.96 | |
| 25 | 314 | 74.13 | 2.14 | 109.39 | 5.05 | 127.80 | 9.43 | 183.33 | 32.61 | 279.36 | 200.83 | |
| 30 | 377 | 88.13 | 2.35 | 130.34 | 5.58 | 152.95 | 10.48 | 223.24 | 36.15 | 353.32 | 223.69 | |
| 5 | 10 | 157 | 37.62 | 1.51 | 54.85 | 3.51 | 64.42 | 6.45 | 89.28 | 22.39 | 108.58 | 139.51 |
| 15 | 236 | 52.31 | 1.84 | 76.76 | 4.31 | 91.62 | 7.91 | 131.77 | 27.26 | 174.43 | 171.80 | |
| 20 | 314 | 67.18 | 2.15 | 98.95 | 5.08 | 119.25 | 9.28 | 175.19 | 31.93 | 244.54 | 200.53 | |
| 25 | 393 | 82.48 | 2.44 | 121.37 | 5.80 | 147.27 | 10.57 | 221.34 | 36.03 | 331.86 | 227.52 | |
| 30 | 471 | 97.97 | 2.66 | 144.54 | 6.37 | 176.23 | 11.66 | 267.90 | 39.90 | 435.52 | 250.93 | |
| 6 | 10 | 188 | 48.13 | 1.57 | 69.93 | 3.69 | 73.04 | 7.28 | 105.56 | 25.17 | 132.16 | 159.15 |
| 15 | 283 | 65.59 | 1.90 | 96.68 | 4.48 | 102.91 | 8.86 | 154.40 | 30.38 | 201.64 | 194.72 | |
| 20 | 377 | 84.37 | 2.18 | 123.78 | 5.20 | 133.32 | 10.34 | 205.64 | 35.06 | 288.74 | 224.75 | |
| 25 | 471 | 102.50 | 2.45 | 150.73 | 5.90 | 164.26 | 11.72 | 256.96 | 39.65 | 394.96 | 251.61 | |
| 30 | 565 | 120.73 | 2.67 | 178.33 | 6.44 | 196.17 | 12.91 | 312.54 | 43.51 | 506.28 | 278.22 | |
Table 2.
Fitting parameter values of simplified model for Minqin sandy loam and aeolian sand.
| Soil Texture | a | b | c | d |
|---|---|---|---|---|
| Minqin sandy loam | 0.521 | 29.91 | 0.017 | 10.48 |
| Minqin aeolian sand | 1.181 | 21.38 | 0.183 | 62.65 |
Table 3.
Correlation between the measured and calculated values of cumulative infiltration.
| Soil | MAE (L) | RMSE (L) | PBIAS (%) | NSE |
|---|---|---|---|---|
| Sandy loam from Hexi Corridor | 0.480 | 0.908 | 0.444 | 0.995 |
| Aeolian sand from Hexi Corridor | 0.428 | 0.642 | 0.321 | 0.997 |
| Clay loam from Turpan Depression | 0.028 | 0.043 | 0.900 | 1.000 |
© 2018 by the authors. Licensee MDPI, Basel, Switzerland. This article is an open access article distributed under the terms and conditions of the Creative Commons Attribution (CC BY) license (http://creativecommons.org/licenses/by/4.0/).
Share and Cite
MDPI and ACS Style
Fan, Y.; Huang, N.; Gong, J.; Shao, X.; Zhang, J.; Zhao, T. A Simplified Infiltration Model for Predicting Cumulative Infiltration during Vertical Line Source Irrigation. Water 2018, 10, 89. https://doi.org/10.3390/w10010089
AMA Style
Fan Y, Huang N, Gong J, Shao X, Zhang J, Zhao T. A Simplified Infiltration Model for Predicting Cumulative Infiltration during Vertical Line Source Irrigation. Water. 2018; 10(1):89. https://doi.org/10.3390/w10010089
Chicago/Turabian StyleFan, Yanwei, Ning Huang, Jiaguo Gong, Xiaoxia Shao, Jie Zhang, and Tong Zhao. 2018. "A Simplified Infiltration Model for Predicting Cumulative Infiltration during Vertical Line Source Irrigation" Water 10, no. 1: 89. https://doi.org/10.3390/w10010089
Note that from the first issue of 2016, this journal uses article numbers instead of page numbers. See further details here.