Bottled Water or Tap Water? A Comparative Study of Drinking Water Choices on University Campuses


Institute of Water Policy, Lee Kuan Yew School of Public Policy, National University of Singapore, L2 Tower Block, 469A Bukit Timah Road, Singapore 259770, Singapore
Water 2018, 10(1), 59; https://doi.org/10.3390/w10010059
Submission received: 6 November 2017
/
Revised: 6 January 2018
/
Accepted: 8 January 2018
/
Published: 11 January 2018
Abstract
:A cross-regional comparative study was conducted to survey the drinking behaviors of university students, in Singapore, Hong Kong, and Macau. In particular, I tested students’ preference for bottled water over filtered tap water, in a context where the latter option is widely accessible, free of charge, and meets drinking standards. It was found that Singapore has a relatively low rate of bottled water consumption within the young population of university students, while in Hong Kong and Macau one-fourth of the students still drink bottled water more frequently than tap water. Using the Theory of Planned Behavior framework, the perceptions and factors that determine the choices were studied. In terms of determinants of the drinking water choices, “Safety and Hygiene” and “Convenience and Availability” ranked highest for all three regions. “Taste”, “Price”, and “Personal and Family Habits” were valued next by different subsamples. Respondents from Singapore rated relatively high in the accessibility of filtered tap water, safety of tap water transfer, and trust in government, and these factors are considerably significant in driving the result of having the lowest consumption of bottle water on campus. Gender and the behaviors of students who stay in campus dorms were also explored.
1. Introduction
Water is an essential resource and one that is of imperative use. It is needed in everyday life and affects the well-being of each individual. Most of the governments in the world have succeeded to or aim to provide clean and safe drinking water to its residents, and many developed countries have already provided tap water to basic drinking standards [1]. However, recent decades have witnessed a rising global consumption of bottled water, especially in developed countries where water directly from the tap is drinkable. In the United States, bottled water consumption has been doubled to an average annual per capita volume of 138.17 L in 2015; this figure in the European Union is roughly 104.1 L [2,3]. Globally, the total bottled water consumption topped 329.33 billion L in 2015, an increase of more than 1/3 in per capita terms over a span of five years [4].
Bottled water initially emerged as a large, mainstream commercial beverage category in Western Europe and later expanded remarkably in the US market. In the last few years, several Asian markets have become major bottled water markets. In fact, Asia itself became the largest regional market in 2011, edging out North America and easily outshining Europe [5]. In Asia, Singapore, Hong Kong, and Macau are places where local water authorities confidently claim the safety and drinkability of municipal tap water [6,7,8]. However, despite the availability of drinkable tap water, people living in these three regions still consume a large amount of bottled water. Hong Kong has long been among the top 20 countries and regions across the world in annual per capita bottled water consumption, as high as 123.78 L in 2014 [5]. In Singapore, the sales volume of bottled water hit $134 million in 2015, up 24% from five years ago [9].
Why should the consumption of bottled water be a concern, especially in those places with drinkable tap water? Firstly, bottled water requires much more energy in terms of production and distribution. The total energy required for unit bottled water consumption ranges from 5.6 to 10.2 MJ per liter, while this number is typically 0.005 MJ per liter for tap water treatment and distribution [10]. Secondly, bottled water has a negative environmental impact, particularly plastic waste. Plastic bottles are made from petroleum, and most bottles are not recycled. In the US, the recycling rate for plastic was only 23% in the year 2007 [11]. Many plastic bottles still end up in landfills, or worse, as litter in forests, lakes, and oceans. Thirdly, regarding safety and health aspects, bottled water is less regulated than municipal tap water [12].
Convincing the public to adopt and maintain sustainable behaviors, such as drinking tap water instead of bottled water, is a challenging task despite the potential for significant environmental and social benefits [13]. In universities, education on sustainability has developed rapidly, and universities are perceived as playing active roles in providing the students with understanding about environment and sustainability [14]. Among others, university students are a community group thought to be more concerned about the environment and tend to adopt sustainable behaviors. Therefore, empirical study on this group in terms of their perceptions and choices of drinking water on university campuses is important, as it would serve as a stepping stone to understanding the general public’s behavior of drinking bottled water, as compared to that of drinkable tap water.
In this paper, I explore the drinking water choices of university students, examine the factors that determine their choices, and focus on whether and how this group makes bottled water choices out of pro-environmental intentions.
I carried out empirical studies in three regions: Singapore, Hong Kong, and Macau. Besides the common fact that municipal tap water has high direct drinking standards, the three cities have other similarities: they are all islands relying on the import of fresh water from their neighbors, they are categorized as high income cities, their populations consist of a large majority of ethnic Chinese, etc. Further, in the three university campuses of interest: the National University of Singapore (NUS), Hong Kong University (HKU), and Macau University (McU), filtered tap water drinking fountains and dispensers are generally available and commonly in use. It is merely a personal choice of each student to choose between tap water and bottled water as major drinking water source on campus. Hence, a comparative study was conducted to address the following research questions:
- What are the current behaviors of drinking water choices on campuses in NUS, HKU, and McU?
- What are the major factors that determine the drinking water choices of university students?
- Are university students concerned about the environment and does such sustainability intentions motivate the pro-environmental behavior of consuming less bottled water?
2. Health Implications of Drinking Bottled Water versus Tap Water
The health implications of drinking bottled waters and of drinking tap water are worth highlighting. Various studies have revealed that, relative to tap water, bottled water generally contains higher concentrations of essential minerals. In a book edited by a Swedish researcher [15], it is stated that bottled water with origin in especially limestone bedrock have higher concentrations of calcium and magnesium, along with HCO3 and some micro elements, than tap waters in Sweden. Both of Ca and Mg reduce tendencies of cardiovascular diseases, cancer, and osteoporosis. Bottled waters from the European continent or other areas, where the bedrock is younger and contains more Ca and Mg, generally have higher levels of both. Contrary, some Swedish bottled waters are supplemented with Na and K, causing levels of these elements that are harmful for people at risk of cardiovascular diseases. However, overconsumption of certain minerals harm our bodies. For instance, levels of fluoride above 1.5 mg/L would increase our risk of dental fluorosis, despite its benefits in protecting us from tooth decay. It is a concern that bottled water contains fluoride levels that are 12% to 218% of the recommended daily intake, much higher than that of tap water (0% to 62%) [15]. Considering wholly the mineral content of bottled and tap water, another study on the North American community shows that drinking tap water is associated with 14% to 17% more gastrointestinal illness than purified bottled water [16].
However, improper storage of bottled water would also harm its consumers. Elevated temperatures are responsible for the release of antimony from polyethylene terephthalate plastics used for water bottles [17]. Antimony is a regulated contaminant that can cause nausea, vomiting, diarrhea, and even chronic health effects in drinking water. The authors also found that the longer the water is stored in plastic bottles, the higher concentrations of antimony is leached. Considering the growing trend of using reverse osmosis in producing bottled water, there are concerns of drinking such demineralized water as it deprives consumers from minerals and their health benefits. In the United States, as prevalent as 24% of the bottled water consumed is filtered water (i.e., water produced by reverse osmosis) [18].
Shifting focus to our case study, authorities in Hong Kong ensure that its tap water is one of the safest in the world, implying less need for bottled water in terms of healthy consumption. Equipped with rigorous water treatment processes, the average chloroform levels in Hong Kong’s water was less than 50 mg/L, much lower than the upper limit of 300 mg/L set by WHO. Further, the Water Supplies department also mineralize water for health benefits, adding, for example, 0.5 mg of fluoride for every liter of water to prevent tooth decay. In Singapore, it is difficult to ascertain which type of water (tap or bottled) provides more health benefits, as the difference lies in the water source and treatment processes [19]. However, tap water in Singapore is of high quality, well within the WHO guidelines for drinking water quality according to the local water authority PUB. In Macau, there is a lack of studies on the safety of tap water and its health effects as compared to drinking bottled water.
In a nutshell, mineral content in water, bottled or tap, differs according to water source, how it is treated, and how it is stored, subsequently giving rise to different long-term health implications. Countries with established municipal water standards tend to find tap water as a healthy water choice. Drinking bottled water, on the other hand, is advantageous if consumers choose water with mineral content that meets recommended daily intake limits and store these bottles properly. Nevertheless, one should keep in mind that, given the prevalence of reverse osmosis technology in producing bottled water and/or filtered tap water, the health implications of such drinking water sources are further twisted. Consumers need to be much better educated to understand their water choices when making decisions.
3. Literature Review
There are a few studies on the public perceptions and choice of bottled water over tap water, most of which focus on analyzing different aspects of benefit and risk perceptions. Jakus et al. used a probability-based measure of risk and focused attention on the role that the perceived risks of tap water play in the demand for bottled water [20]. They studied a sample of people living in areas in the United States whose water supply was contaminated with arsenic, measured their perceived risk, and related it to observed behavior statistically. Besides convenience and price factors, they found that perceived risk was a statistically significant determinant of the amount of bottled water a person bought. Viscusi et al. examined decisions to choose bottled water using a large, nationally representative sample [21]. They showed that perceptions of superior safety, taste, and convenience boost consumption of bottled water. Those who had prior adverse experiences with tap water or had encountered water quality incidences tended to believe bottled water is safer or tastes better. They also found evidences of different ethnic effects and concluded that it was due to the exposure to unsafe water and varied risk beliefs. Doria explored some of the reasons why people choose an option that is often more expensive and less pleasant than tap water, besides the two frequently highlighted main factors: organoleptic dissatisfaction with tap water (especially taste) and risk concerns [22]. Many other factors, including demographic variables, the perceived quality of the water source, and trust in tap water companies, also seem to influence public behavior. The author found that people generally value “good quality water”, and some are prepared to splurge on what they perceived to be a “purer” or “healthier” product. Arnold and Larsen argued that people highly value clean drinking water, and may distrust the quality and safety of tap water due to perceived risks, especially after contamination incidents [23]. Hence, it becomes difficult to convince the public to adopt and maintain sustainable behaviors, such as drinking tap water instead of bottled water.
On the behaviors on university campuses related to tap or bottled water consumption, several work has shed light on the issue. Saylor et al. conducted a mixed method research in Purdue University, US and assessed the current behaviors as well as the perceived benefits and barriers to drinking tap water versus bottled water [13]. They found that perceived risks from tap water and the perceived safety, preferred taste, and convenience of bottled water were major determinants. The study also uncovered a gender difference in bottled water consumption. Due to the increasing concerns of environmental impacts of bottled water, activists and communities have joined forces to act on issues associated with bottled water. Mikhailovich and Fitzgerald studied a public program of the removal of bottled water on university campus community [24]. Their analysis indicated that such programs lead to changes in pro-environmental behaviors, such as the increased use of re-fillable bottles. However, there were other undesirable outcomes as well, such as drinking a lower quantity of water. Moreover, community perceptions were polarized: restrictions on freedom of choice, health concerns as a result of increased intake of sugary drinks, and the continued availability of other plastic drink bottles were provided as strong objections to the removal of bottled water from sale on campus. Van Der Linden proposed an applied social-psychological understanding of how to reduce bottled water consumption, testing different strategies for behavioral change of drinking less bottled water [25]. Findings showed that beliefs about health, taste, water quality, lifestyle, the environment, and perceived alternatives are all correlated with bottled water consumption.
This work is strongly related to that of Saylor et al.’s. Extending their method to a cross-country study of three countries/regions, this paper, to the best of our knowledge, is the first comparative study across regions on the issue of drinking water choices on university campuses. Further, existing cross-country or regional comparative works mainly focus on the water supply issue and consumer’s attitude on water quality as well as quantity [26], and my work adds to the literature in expanding such studies to the drinking water area. I aim not only to provide empirical evidence of the current behaviors as well as the underlying perceptions but also to test the synthesized framework originated from the theory of planned behavior, in explaining the drinking water choices among university students.
4. Framework
Numerous theoretical frameworks have been developed to explain the factors that determine certain behaviors. Drinking tap versus bottled water is considered in this work to be an environmentally affected behavior [27]; thus, I would like to adopt a framework that draws attention to pro-environmental behaviors. To explain the attitude–behavior relation, Ajzen and Fishbein’s theory of reasoned action has been the cornerstone for more sophisticated models and frameworks [28,29]. In the model of responsible environmental behavior, Hines et al. identified factors associated with responsible pro-environmental behavior including knowledge of issues, knowledge of action strategies, locus of control, attitudes, verbal commitment, and individual responsibility [30]. Stern developed a value–belief–norm (VBN) theory of environmentalism, which links value theory, norm-activation theory and the New Environmental Paradigm perspective through a causal chain of variables (personal values, beliefs about environment, personal norms, etc.) leading to behavior [31]. Kollmuss and Agyeman developed an integrated model of Pro-environmental Behavior, forming a diagram of factors [32]. They emphasized “pro-environmental consciousness”, which incorporates knowledge, attitudes, and emotional involvement—factors that are embedded in broader personal values rather than directly impacting behavior.
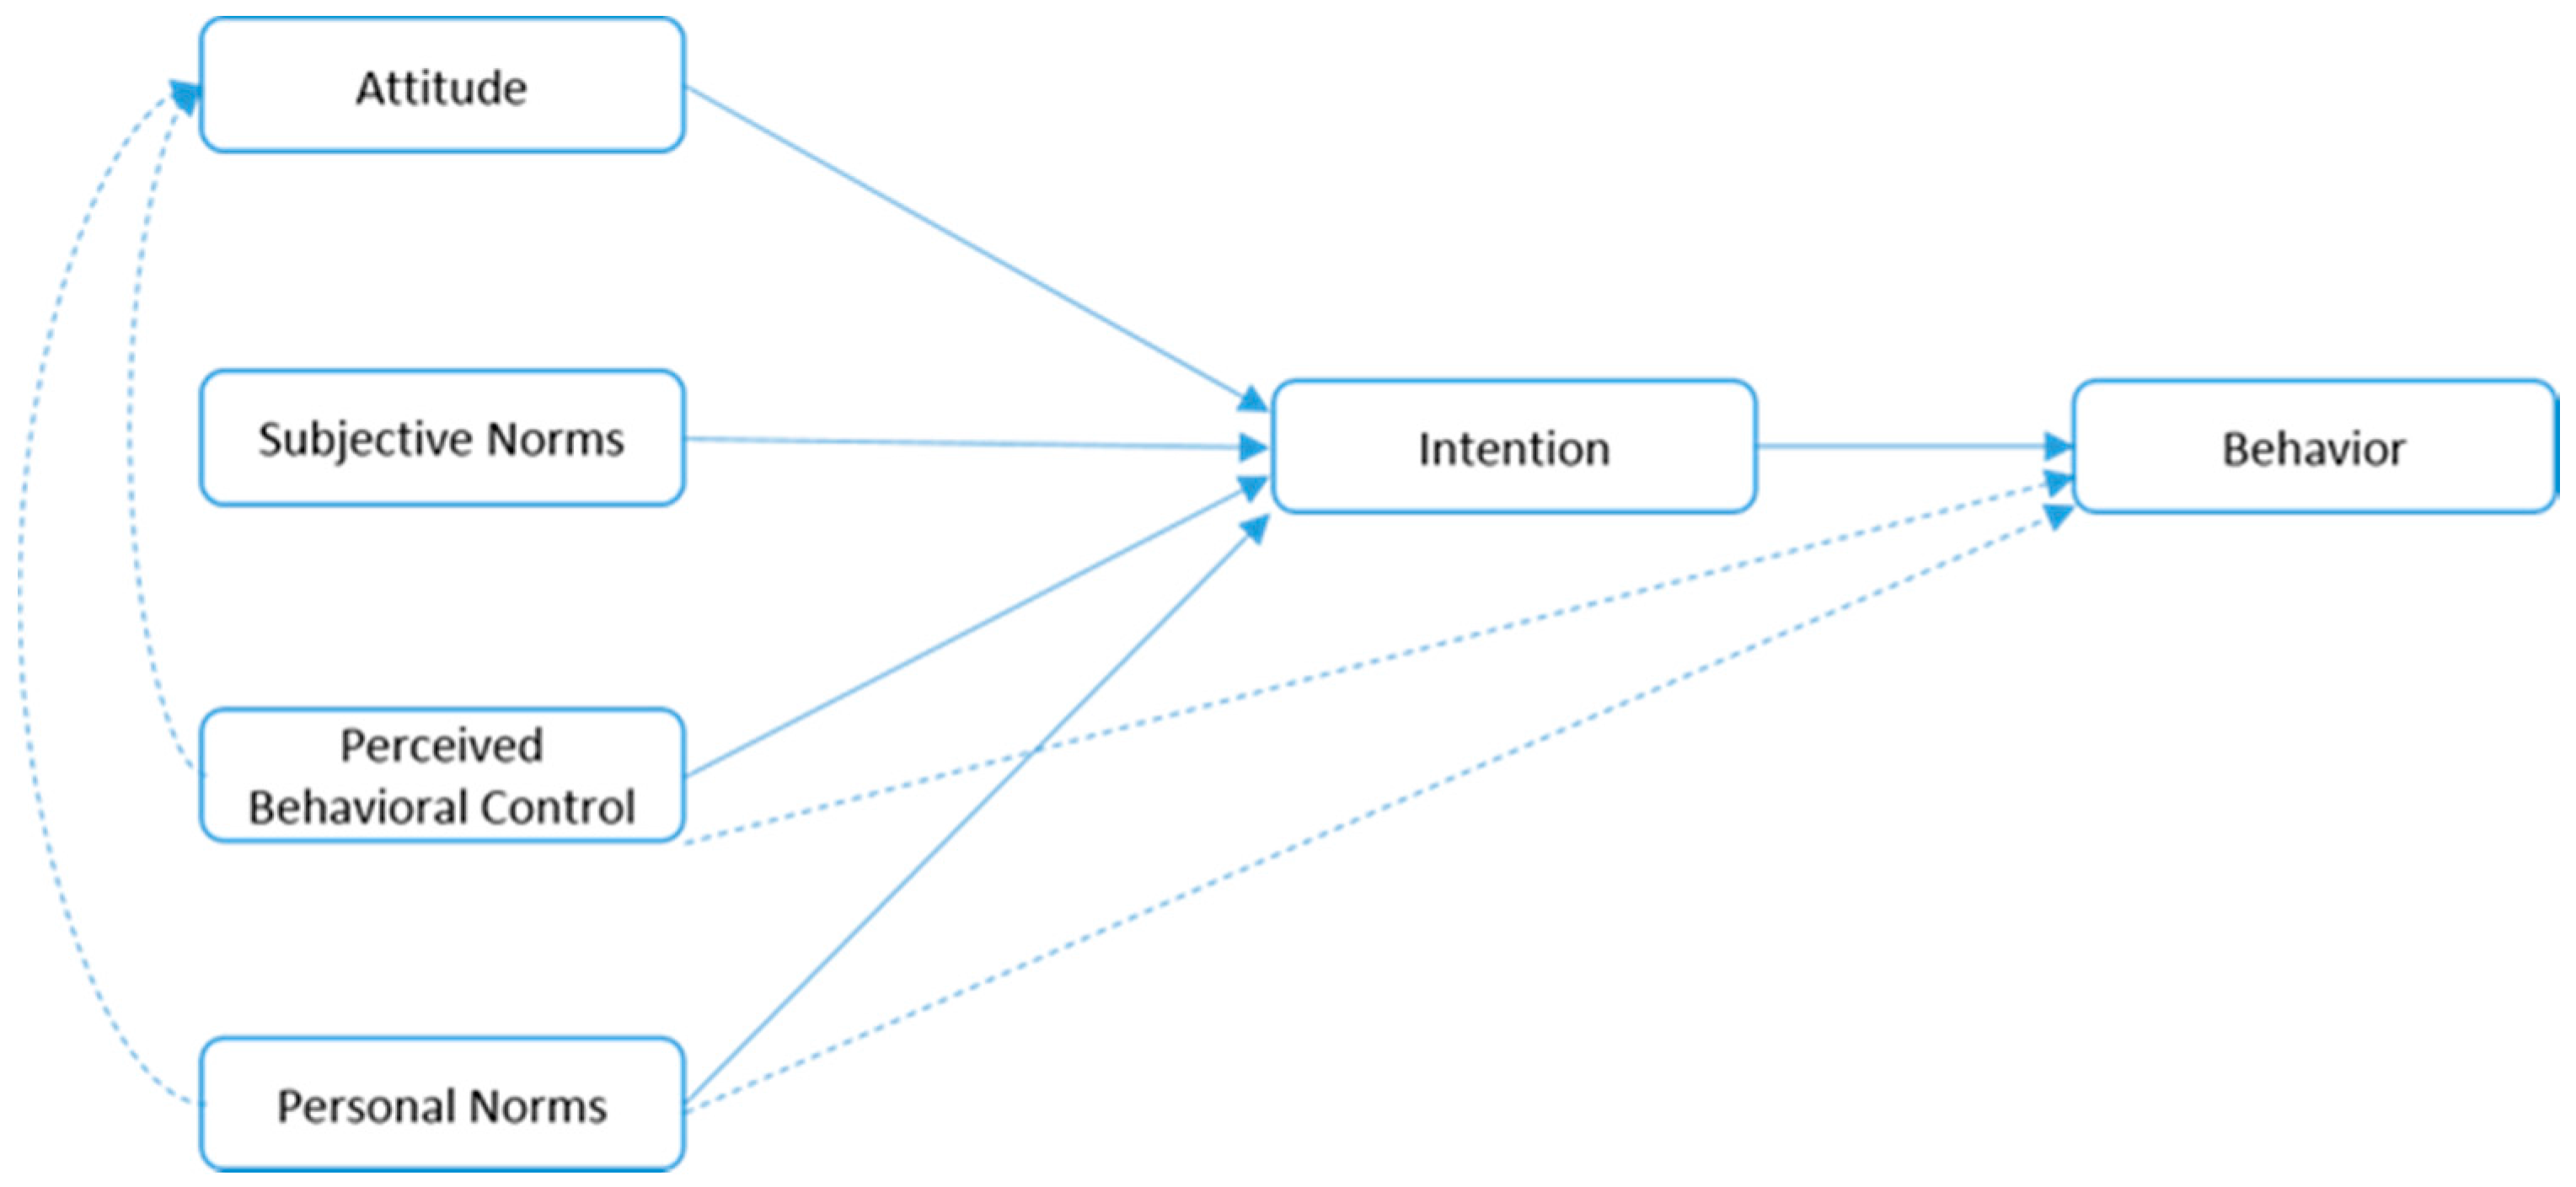
Synthesizing the earlier theories, I focused on the theory of planned behavior (TPB) by Ajzen [33] and the work of Harland et al., which highlight the role of personal norms [34]. In the TPB theory, it is argued that the behaviors are predicted by behavioral intentions, which in turn are anteceded by the attitude, the subjective norms, and the perceived behavioral control. Attitudinal factors include a general attitude towards the behavior, about the product attributes and perceived costs, benefits, and risks; subjective norms refer to individuals’ perception of norms and conventions regarding the particular pro-environmental behavior, i.e., how others would view such behavior and the motivation to comply with the views; the perceived behavior control relates to individuals’ perception of the extent to which performance of the behavior is easy or difficult. Besides these factors prescribed by the TPB theory, Schwartz defines personal norm as self-expectations that are based on internalized values [35]. Such personal norms reflect commitment with internalized values and are experienced as feelings of personal obligation to engage in a certain behavior. Harland et al. conducted a combined study of TPB and the personal norm theory in explaining the environmentally relevant behavior and found that personal norms are of importance in themselves and improve the explanatory power of TPB [34].
5. Data and Analysis
5.1. Sample
A quantitative survey was used to learn about the behavior and perceptions of university students in the National University of Singapore (NUS), Hong Kong University (HKU), and Macau University (McU). Subjects were recruited through convenience sampling: the research assistants (RAs) utilized university open directory emails and social networks to attract students to participate in the surveys; those who were interested could contact the RAs to complete the questionnaire, and redeem a token of around $8.
A total of 406 questionnaires were completed, with the respondents’ characteristics summarized in Table 1 for the three regions. From Singapore, there were 186 sample observations, 105 from Hong Kong, and 115 from Macau. Gender composition was almost balanced; local respondents constituted larger proportions in the NUS and HKU samples, relative to the McU sample. Most of the respondents were staying more than two years locally, and most of them were undergraduate students. NUS had a larger proportion of participants who were religious, compared to the other two regions.
5.2. Current Behavior
Given that in all three regions the tap water is treated to meet drinking standards, and that filtered tap water facilities for drinking purposes (such as water dispensers or water fountains) are generally available in universities, the respondents were asked to choose between “bottled water” and “filtered tap water”. Among all respondents, 79 out of 406 (19.46%) reported consuming bottled water more often on campus than filtered tap water. Comparing the regions, the F-test (p = 0.0187) shows that the mean consumption of bottled water is significantly different across the three universities. Table 2 shows the drinking water choice by region. In Singapore, only 13.44% of respondents drink bottled water more often, while in both Hong Kong and Macau, the rate is almost one out of four, significantly higher than that of Singapore.
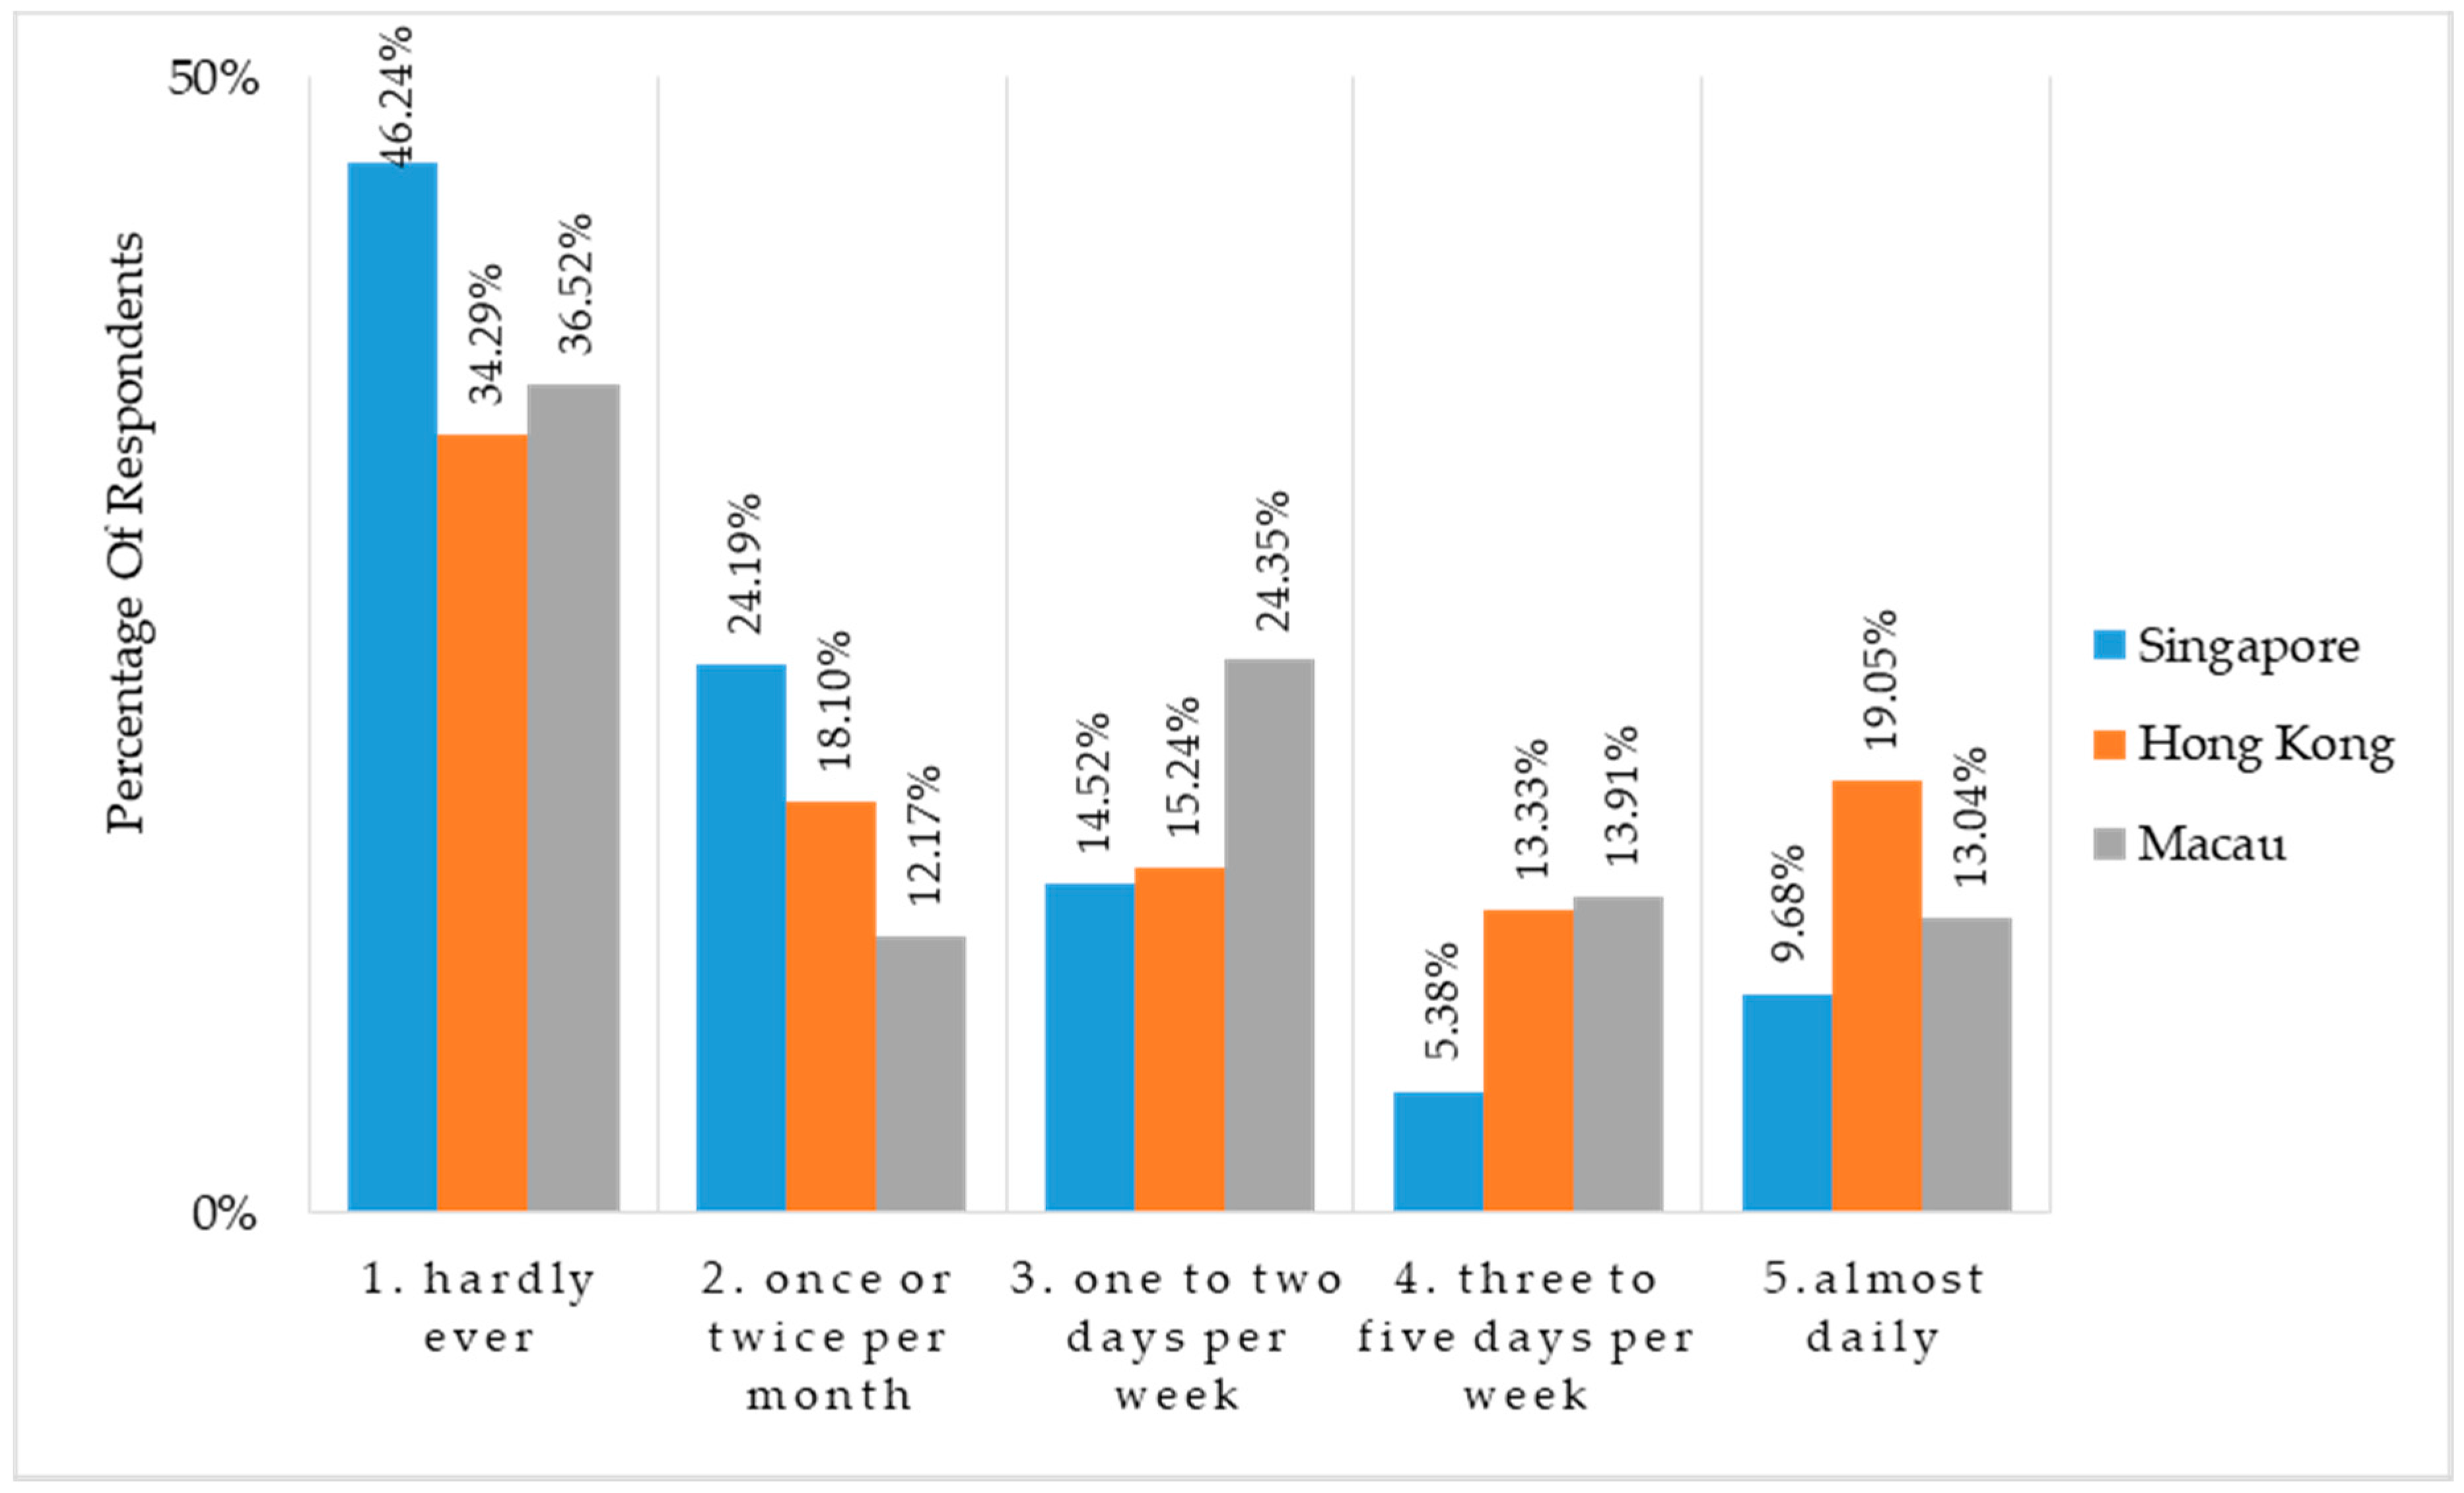
Considering the frequency of drinking bottled water, it was found that in general 40.39% of the respondents “hardly ever” drink bottled water, and 13.05% drink bottled water “almost daily”. Such frequency also differs significantly (p = 0.001) across regions, with Singaporeans drinking the least bottled water, as shown in Figure 2. Only 9.68% of NUS respondents drink bottle almost daily; while the corresponding figures for HKU and McU stand at 19.05% and 13.04%, respectively. Frequent bottled water drinkers (those who drink bottle more than once a week) account for less than a third of the Singapore sample (29.58%), which pales in comparison to 47.62% in Hong Kong and 51.3% in Macau.
5.3. Factors for Drinking Water Choices
Students were given seven general factors that influence drinking water choice and were asked to evaluate how influential these factors were to themselves on a 1–5 scale. The mean score of each factor with standard deviation by region is illustrated in Table 3. For all three regions, “Safety and Hygiene” and “Convenience and Availability” were rated highest on average; NUS and HKU respondents ranked “Price” as the third important factor, while McU respondents cared more about “Taste”. All but two factors, “Religious Conventions” and “Environmental Concerns”, were significantly different across regions in terms of average score. The stated importance of “Environmental Concerns” on drinking water choice is almost invariant across regions, averaging around 3.51, which is lower than the top three factors but even higher than “Personal and Family Habits”. This is surprising since there are well documented results that habits should be a significant factor shaping environmentally significant behavior [31].
General factors depict a rough outline for understanding the determinants of a particular behavior. In the context of preferring bottled water over (filtered) tap water on campus, such general factors are represented by specific sub-factors, which on one hand influence the stated behavior (“drink bottle” or “drink tap”) and on the other hand provide testable grounds for the theoretical framework. I devised a list of statements, and asked the students to indicate their opinions on the statements on a 1–5 scale, from “strongly disagree” to “strongly agree”. Then the statements were grouped under the general factors, and a compounded score for each general factor was computed. Note that the score was computed in a manner whereby opinions that support drinking bottled water are assigned lower scores, and those that imply a higher tendency to drink tap water are assigned higher scores. Hence, statements that indicate inclination towards drinking bottled water had the score reversed, i.e., a 1–5 scale, from “strongly disagree” to “strongly agree”, corresponding to score −1 to −5. The detailed statements and the expected direction of correlation are shown in Table 4.
Spearman’s test was carried out to evaluate the correlation of the factors with the behavior of drinking bottled water. Consistent with the statistics reflected in the general factors, the three factors elaborated with specific contextual statements, “Safety and Hygiene”, “Convenience and Availability”, and “Taste” were still significantly correlated with drinking bottled water, with the correlation coefficients to be −0.196, −0.199, and −0.1335 and p-values of 0.001, 0.000, and 0.007, respectively. Note that “Price” statements were not included since filtered tap water is free of charge on campus. This implies that the more students felt tap water was safe, hygienic, convenient, and widely available, as well as tasty, the less frequently they would drink bottled water on campus. Among others, “Convenience and Availability” is most strongly correlated with drinking bottled water.
Although in the general factors evaluation “Personal and Family Habits” was scored lower than “Environmental Concerns”, with contextual specific factors supplied, the former was shown to be highly correlated (0.351 and 0.115) and significant (p = 0.000 and 0.020). “Environmental Concerns” was still robustly associated with drinking bottled water, given a correlation of −0.126 with p = 0.011. Furthermore, I tested the detailed factors of “Trust in Authority”, “Barriers to Bottle Reuse”, and “Self-Impact”, which are examined in other literature [13,36,37]. The results also showed significant correlations of −0.1243, 0.140 and −0.126, respectively. Summarizing the factors and statistical results, the framework set up earlier on could be tested (Table 5).
For each country/region, Ordinary Least Squares (OLS) regressions were conducted to identify the important factors that drive drinking water decisions. In Singapore, it was found that easy access to tap water (p = 0.000), less contamination in tap water transfer (p = 0.05), and trust in the government (p = 0.06) were the most significant factors. In Hong Kong, “Convenience and Availability” (p = 0.045) and “Environmental Concerns” (p = 0.001) were the most important determinants. In Macau, respondents reported that superior taste (p = 0.007) and the safety of bottled water (p = 0.069) were key underlying factors.
5.4. Gender Difference
The effect of gender was also tested on both stated behavior and driving factors. For the total sample, there was no effect of gender on drinking water choice. In terms of the driving factors, females ranked “Taste” and “Personal and Family Habits” significantly higher than males (p = 0.014 and 0.0017, respectively).
However, within different cities, gender variation plays a role in drinking water choice in different ways. In NUS, females drank slightly more frequent bottled water (p = 0.05) and valued the “Convenience and Availability” (p = 0.04) less. In Hong Kong, female respondents cared more about “Safety and Hygiene” (p = 0.032) as well as “Taste” (0.05). In Macau, males reported a slightly higher score on the impact of “Religious Beliefs” (p = 0.06).
5.5. Drinking Behavior of Students Staying on Campus
The subgroup of students who stayed in the campus dorms were separately investigated. This subsample consisted of 58.37% of the total respondents, with 64/186 in NUS, 68/105 in HKU, and 105/115 in McU.
In terms of drinking water choices, answers were significantly different across the three regions in the frequency of drinking “tap water”, “bottled water”, and “boiled tap water”. Bottled water was the least popular among NUS students, with only 12.5% of them reporting “frequently” or “always” drinking bottled water, while 17.65% and 28.57% of their HKU and McU counterparts respectively did so. Further, only 15.63% of the students in Singapore “boiled” tap water before drinking it, but there were as many as 32.35% in Hong Kong and 37.14% in Macau who reported doing so. This result is consistent with the findings for the total sample.
6. Conclusions
From this comparative study of three different regions, I firstly answer statistically the question: what is the young population’s drinking behavior on university campus, an environment where the low-cost, environmentally friendly choice of drinking filtered tap water is readily available? In two of the three regions, one-fourth of the students still drink bottled water more frequently than tap water. This raises the concern of the overconsumption of bottled water, which potentially costs more energy and burdens the environment. For a relatively higher educated and more informed population (university students), especially where tap water is easily accessible (university campus in developed cities), bottled water is still widely used. One can expect that the overall situation of bottled water consumption for the entire society might be even worse. Thus, it is necessary for governments and institutions to correct for this negative externality on the environment via public education on the overconsumption of bottled water.
Secondly, to understand why people prefer certain types of drinking water, certain significant factors were identified. Among others, “Safety and Hygiene” and “Convenience and Availability” ranked highest for all three regions. “Taste”, “Price”, and “Personal and Family Habits” were valued next by different subsamples. Although the subsamples’ average scores for the above factors differ significantly across regions, relatively similar scores were found for both “Religious conventions” and “Environmental concerns”. NUS respondents reported a high score in the accessibility of filtered tap water, the safety of tap water transfer, and trust in government, which are significant forces driving the consumption of bottle water on campus down to the lowest level among all three regions.
Thirdly, I use specific sub-factors in the context of “drink bottle” vs. “drink tap” to construct and test the theory of planned behavior, taking into account personal norms. It was found that personal norms represented by both the self-impact (feeling guilty when drinking bottled water) and the intention to impact others (persuading others to drink bottled water less) do have a significant effect on the drinking water behavior. This sheds some light on how certain behavioral change can be induced to care more for the environment and engage more with the community. If education and policies can be designed to enact personal norms favoring such behaviors, they might foster targeted behavioral change.
Lastly, a gender difference was found in both drinking water behavior and its driving factors, either in the total sample or in specific countries. Moreover, the drinking behavior of students who stay in campus dorms was also found to be consistent with the general sample.
Supplementary Materials
The following are available online at www.mdpi.com/2073-4441/10/1/59/s1.
Acknowledgments
The author acknowledges the research assistance from Ms Jiao Xin Ping. This work benefitted from the funding support of a Water Research Grant (R-603-000-182-490) from the Institute of Water Policy, Lee Kuan Yew School of Public Policy, National University of Singapore.
Conflicts of Interest
The author declares no conflict of interest.
References
- Ashton, D. A Traveller’s Guide to Tap Water. Available online: http://neomam.com/blog/tap-water/ (accessed on 2 November 2017).
- Cabejskova, Z. The Role of Tap Water in Public Health and Hydration; Water UK: London, UK, 2016. [Google Scholar]
- Gleick, P.H.; Cooley, H. Energy implications of bottled water. Environ. Rese. Lett. 2009, 4, 014009. [Google Scholar] [CrossRef]
- Rodwan, J.G.J. Bottled Water. 2015. Available online: http://www.bottledwater.org/public/BWR_Jul-Aug_2016_BMC%202015%20bottled%20water%20stat%20article.pdf#overlay-context=economics/industry-statistics (accessed on 2 November 2017).
- Bottled Water. Available online: http://www.bottledwater.org/economics/industry-statistics (accessed on 2 November 2017).
- DSAMA. 2014. Available online: http://www.marine.gov.mo/images/waterreport2013_2014.pdf (accessed on 2 November 2017).
- HKWSD. 2016. Available online: http://www.wsd.gov.hk/tc/faqs/water_quality/#tape (accessed on 2 November 2017).
- Drinking Water Quality. Available online: https://www.pub.gov.sg/watersupply/waterquality/drinkingwater (accessed on 2 November 2017).
- Lim, L. Singapore’s S$134 m Bottled Water Addiction. Available online: http://www.channelnewsasia.com/news/singapore/singapore-s-s-134m-bottled-water-addiction/3364034.html (accessed on 2 November 2017).
- Burton, F.L. Water and Wastewater Industries: Characteristics and Energy Management Opportunities. Electric Power Research Institute. Available online: http://www.epri.com/abstracts/Pages/ProductAbstract.aspx?ProductId=CR-106941 (accessed on 2 November 2017).
- Fisherman, C. Message in a Bottle. Fast Company Magazine, July/August Issue 2007:117. Available online: https://www.fastcompany.com/59971/message-bottle (accessed on 11 January 2018).
- Shapley, D. 6 Indictments against Bottled Water. Available online: http://www.goodhousekeeping.com/home/a17834/bottled-water-47091001/ (accessed on 2 November 2017).
- Saylor, A.; Prokopy, L.S.; Amberg, S. What’s wrong with the Tap? Examining Perceptions of Tap Water and Bottled Water at Purdue University. Environ. Manag. 2011, 48, 588–601. [Google Scholar] [CrossRef] [PubMed]
- Jones, P.; Selby, D.; Sterling, S.R. Sustainability Education: Perspectives and Practice across Higher Education; Earthscan: London, UK, 2010; ISBN 978-1844078776. [Google Scholar]
- Rosborg, I. Drinking Water Minerals and Mineral Balance; Springer: Berlin, Germany, 2016. [Google Scholar]
- Payment, P.; Siemiatycki, J.; Richardson, L.; Renaud, G.; Franco, E.; Prevost, M. A prospective epidemiological study of gastrointestinal health effects due to the consumption of drinking water. Int. J. Environ. Health Res. 1997, 7, 5–31. [Google Scholar] [CrossRef]
- Shotyk, W.; Krachler, M.; Chen, B. Contamination of Canadian and European bottled waters with antimony from PET containers. J. Environ. Monit. 2006, 8, 288–292. [Google Scholar] [CrossRef] [PubMed]
- Magill, K. Bottled Water vs. Filtered Tap Water|Care2 Healthy Living. Available online: http://www.care2.com/greenliving/bottled-water-vs-filtered-tap-water.html (accessed on 21 December 2017).
- Ng, A.W. The truth about bottled water. The Straits Times. May 2017. Available online: http://www.straitstimes.com/singapore/health/the-truth-about-bottled-water (accessed on 21 December 2017).
- Jakus, P.M.; Shaw, W.D.; Nguyen, T.N.; Walker, M. Risk perceptions of arsenic in tap water and consumption of bottled water. Water Resour. Res. 2009, 45. [Google Scholar] [CrossRef]
- Viscusi, W.K.; Huber, J.; Bell, J. The Private Rationality of Bottled Water Drinking. Contemp. Econ. Policy 2014, 33, 450–467. [Google Scholar] [CrossRef]
- Doria, M.F. Bottled water versus tap water: Understanding consumers’ preferences. J. Water Health 2006, 4, 271–276. [Google Scholar] [CrossRef] [PubMed]
- Arnold, E.; Larsen, J. Plan B Updates—51: Bottled Water—Pouring Resources down the Drain. Available online: http://www.earth-policy.org/plan_b_updates/2006/update51 (accessed on 2 November 2017).
- Mikhailovich, K.; Fitzgerald, R. Community responses to the removal of bottled water on a university campus. Int. J. Sustain. High. Educ. 2014, 15, 330–342. [Google Scholar] [CrossRef]
- Linden, S.V.D. Exploring Beliefs about Bottled Water and Intentions to Reduce Consumption. Environ. Behav. 2013, 47, 526–550. [Google Scholar] [CrossRef]
- Chenoweth, J.; Barnett, J.; Capelos, T.; Fife-Schaw, C.; Kelay, T. Comparison of Consumer Attitudes between Cyprus and Latvia: An Evaluation of Effect of Setting on Consumer Preferences in the Water Industry. Water Resour. Manag. 2010, 24, 4339–4358. [Google Scholar] [CrossRef] [Green Version]
- Stern, P.C. Toward a working definition of consumption for environmental research and policy. In Environmentally Significant Consumption: Research Directions; National Academy Press: Washington, DC, USA, 1997; ISBN 0-309-05598-9. [Google Scholar]
- Ajzen, I.; Fishbein, M. The prediction of behavior from attitudinal and normative variables. J. Exp. Soc. Psychol. 1970, 6, 466–487. [Google Scholar] [CrossRef]
- Ajzen, I.; Fishbein, M. Attitude-behavior relations: A theoretical analysis and review of empirical research. Psychol. Bull. 1977, 84, 888–918. [Google Scholar] [CrossRef]
- Hines, J.M.; Hungerford, H.R.; Tomera, A.N. Analysis and Synthesis of Research on Responsible Environmental Behavior: A Meta-Analysis. J. Environ. Educ. 1987, 18, 1–8. [Google Scholar] [CrossRef]
- Stern, P.C. New Environmental Theories: Toward a Coherent Theory of Environmentally Significant Behavior. J. Soc. Issues 2000, 56, 407–424. [Google Scholar] [CrossRef]
- Kollmuss, A.; Agyeman, J. Mind the Gap: Why do people act environmentally and what are the barriers to pro-environmental behavior? Environ. Educ. Res. 2002, 8, 239–260. [Google Scholar] [CrossRef]
- Ajzen, I. The theory of planned behavior. Organ. Behav. Hum. Decis. Processes 1991, 50, 179–211. [Google Scholar] [CrossRef]
- Harland, P.; Staats, H.; Wilke, H.A.M. Explaining Proenvironmental Intention and Behavior by Personal Norms and the Theory of Planned Behavior1. J. Appl. Soc. Psychol. 1999, 29, 2505–2528. [Google Scholar] [CrossRef]
- Schwartz, S.H. Normative Influences on Altruism. Adv. Exp. Soc. Psychol. 1977, 10, 221–279. [Google Scholar] [CrossRef]
- De França Doria, M. Factors influencing public perception of drinking water quality. Water Policy 2010, 12, 1–19. [Google Scholar] [CrossRef]
- Fielding, K.S.; Gardner, J.; Leviston, Z.; Price, J. Comparing Public Perceptions of Alternative Water Sources for Potable Use: The Case of Rainwater, Stormwater, Desalinated Water, and Recycled Water. Water Resour. Manag. 2015, 29, 4501–4518. [Google Scholar] [CrossRef]
Figure 1.
Theory of planned behavior (TPB) framework adapted from Ajzen and Harland et al.

Figure 2.
Frequency of drinking bottled water on campus.


Table 1.
Summary of sample.
| City | Singapore | Hong Kong | Macau |
|---|---|---|---|
| Sample size | N = 186 | N = 105 | N = 115 |
| Female | 58.06% | 51.43% | 65.22% |
| Local | 74.19% | 80.95% | 43.38% |
| Have stayed for >2 years locally | 95.16% | 95.24% | 70.43% |
| Undergraduate | 95.70% | 80% | 95.65% |
| Religion | |||
| No Religion | 47.31% | 73.33% | 84.35% |
| Buddhism | 25.27% | 1.90% | 7.83% |
| Christian | 18.82% | 24.76% | 6.96% |
| Islam | 3.23% | 0 | 0.87% |
| Others | 5.38% | 0 | 0 |
Table 2.
Drinking water choice on campus by region.
| City | Singapore | Hong Kong | Macau |
|---|---|---|---|
| Drink bottled water more often on campus | 13.44% | 24.76% | 24.35% |
| Mean difference compare to Singapore (t-test) | p = 0.011 | p = 0.011 | |
Table 3.
General factors for drinking water choice.
| General Factors for Drinking Water Choice | Singapore | Hong Kong | Macau | F-Test p-Value |
|---|---|---|---|---|
| Mean (SD) | Mean (SD) | Mean (SD) | ||
| Price | 4.12 (0.83) | 3.65 (1.07) | 3.20 (1.11) | 0.000 |
| Safety and Hygiene | 4.63 (0.62) | 4.42 (0.87) | 4.42 (0.78) | 0.014 |
| Convenience and Availability | 4.44 (0.68) | 4.22 (0.78) | 3.96 (0.91) | 0.000 |
| Taste | 3.83 (1.04) | 3.49 (1.19) | 3.63 (1.11) | 0.032 |
| Personal and Family Habits | 3.34 (1.28) | 3.00 (1.15) | 3.41 (1.09) | 0.024 |
| Religious Conventions | 1.60 (1.03) | 1.64 (1.05) | 1.73 (1.09) | 0.560 |
| Environmental Concerns | 3.51 (1.07) | 3.50 (1.24) | 3.52 (1.10) | 0.985 |
Table 4.
Specific factors for drinking water choice.
| General and Specific Sub-Factors | Expected Impact on Drinking Bottled Water |
|---|---|
| Safety and Hygiene | negative |
| Tap water in general is unsafe to drink directly. (-) | |
| Bottled water is safer than tap water. (-) | |
| Tap water is treated to be drinkable, but contamination may happen during storage and transfer. (-) | |
| Tap water is more regulated and safer than bottled water. | |
| Convenience and Availability | negative |
| Filtered tap water is easily accessible on campus. | |
| Taste | negative |
| Filtered tap water tastes almost the same as bottled water. | |
| Trust in Authority | negative |
| The government is trustworthy in providing safe tap water for drinking. | |
| Personal and Family Habits | positive |
| Your preference on drinking water. | |
| Your family’s preference on drinking water. | |
| Environmental Concerns | negative |
| Consumption of bottled water causes damage to the environment. | |
| Using less bottled water reduces oil consumption to make plastic as well as contributes less plastic to landfills. | |
| By using reusable bottles or recycle bottles, I’m reducing my personal contribution to global climate change. | |
| Barriers to Bottle Reuse | positive |
| Reusable bottles may contain harmful chemicals or germs. | |
| Reusable bottles require too much time and effort to clean. | |
| Reusable bottles are inconvenient to carry around on a daily basis and easy to lose/forget. | |
| There are not enough locations to recycle plastic bottles on campus. | |
| Self-impact | negative |
| I feel guilty throwing away plastic bottles after only using them once. | |
| I would persuade my friends to consume less bottled water. |
Note: 1. Only the factors that are significantly correlated with drinking bottled water are reported; 2. (-) denotes reversed score, i.e., 1–5 scale, from “strongly disagree” to “strongly agree” corresponding to scores −1 to −5; 3. Barriers and self-impact are included to represent the additional significant specific factors (statements).
Table 5.
Correlations tested in the TPB framework.
| TPB Framework | Representing Factors | Correlation to Behavior | p-Value |
|---|---|---|---|
| Attitude | Safety and Hygiene | −0.1691 | 0.0006 |
| Convenience and Availability | −0.199 | 0.000 | |
| Taste | −0.1335 | 0.007 | |
| Trust in authority | −0.1243 | 0.012 | |
| Subjective Norms | Personal Habits | 0.351 | 0.000 |
| Family Habits | 0.115 | 0.020 | |
| Environmental Concerns | −0.1263 | 0.011 | |
| Perceived Behavioral Control | Barriers to bottle reuse | 0.14 | 0.005 |
| Personal Norms | Self-impact | −0.1261 | 0.011 |
© 2018 by the author. Licensee MDPI, Basel, Switzerland. This article is an open access article distributed under the terms and conditions of the Creative Commons Attribution (CC BY) license (http://creativecommons.org/licenses/by/4.0/).
Share and Cite
MDPI and ACS Style
Qian, N. Bottled Water or Tap Water? A Comparative Study of Drinking Water Choices on University Campuses. Water 2018, 10, 59. https://doi.org/10.3390/w10010059
AMA Style
Qian N. Bottled Water or Tap Water? A Comparative Study of Drinking Water Choices on University Campuses. Water. 2018; 10(1):59. https://doi.org/10.3390/w10010059
Chicago/Turabian StyleQian, Neng. 2018. "Bottled Water or Tap Water? A Comparative Study of Drinking Water Choices on University Campuses" Water 10, no. 1: 59. https://doi.org/10.3390/w10010059
Note that from the first issue of 2016, this journal uses article numbers instead of page numbers. See further details here.