Abrupt Climate Shift in the Mature Rainy Season of the Philippines in the Mid-1990s
by
 ,
,
Lyndon Mark Olaguera
1,* ,
,
Jun Matsumoto
1,2,
Hisayuki Kubota
2,3,
Tomoshige Inoue
1,
Esperanza O. Cayanan
4 and
Flaviana D. Hilario
4 1
Department of Geography, Tokyo Metropolitan University, 1-1 Minami-Osawa, Hachioji-Shi, Tokyo 192-0397, Japan
2
Department of Coupled-Ocean-Atmosphere-Land Processes Research, Japan Agency for Marine Earth Science and Technology, Yokosuka 237-0061, Japan
3
Faculty of Science, Hokkaido University, Kita-10 Nishi-8, Kita-ku, Sapporo 060-0810, Japan
4
Philippine Atmospheric, Geophysical and Astronomical Services Administration, Quezon City 1100, Philippines
*
Author to whom correspondence should be addressed.
Atmosphere 2018, 9(9), 350; https://doi.org/10.3390/atmos9090350
Submission received: 11 August 2018
/
Revised: 7 September 2018
/
Accepted: 7 September 2018
/
Published: 9 September 2018
(This article belongs to the Special Issue Monsoons)
Abstract
:A robust climate shift around 1993/1994 from early August to early September, which corresponds to the mature rainy season of the Philippines, was identified in stations located over the western coast of the country. The convection in the mature rainy season during 1994–2008 (E2) was suppressed compared with 1979–1993 (E1). The possible role of the changes in the large-scale conditions and tropical cyclone (TC) activity were analyzed. The results show that the western North Pacific Subtropical High has extended further westward in E2 leading to an enhanced lower-level divergence and less moisture transport over the Philippines. The changes in the large-scale conditions, which featured a mid-tropospheric descent, a decrease in low-level relative humidity, an enhanced vertical zonal wind shear, and a decrease in the perturbation kinetic energy, also inhibited the synoptic-scale disturbances in the vicinity of the Philippines. In particular, fewer TCs developed and made landfall over the Philippines in E2. We also found inconsistent climate shifts in May, June, July, and September between the rainfall data from the stations and the Climate Prediction Center Merged Analysis of Precipitation, which highlights the importance of sub-seasonal analysis in decadal-to-interdecadal climate change studies.

1. Introduction
Rainfall variability is an important issue in many climate studies because of its impact on the economy especially in agricultural countries such as the Philippines. Generally, the rainfall of the Philippines is influenced by multi-scale systems and their interactions (e.g., tropical cyclone (TC)-enhanced monsoons) such as the monsoons, El Niño Southern Oscillation (ENSO), TC activity, intraseasonal oscillations, and other mesoscale processes [1,2,3,4,5,6] that contributes to rainfall variability. In particular, the seasonal transition of the Asian summer monsoon leads to regional differences in the rainfall over the Philippines. The western coast of the country, for example, has a distinct dry season in winter and a wet season in summer, while the eastern coast has no dry season and experience more rainfall in winter [7,8].
A number of studies, using the long available observation data in the Asian monsoon region, found significant decadal-to-interdecadal changes, especially in the recent decade [9,10,11,12]. For example, a prominent interdecadal shift has been identified after the late 1970s over East Asia [10,13,14,15,16]. Wang [16] suggested that the Asian monsoon system has weakened after the 1970s. Some studies have linked this interdecadal shift to the changes in the sea surface temperature (SST) over the tropical Pacific and Indian Ocean [17,18,19,20,21]. The impact of the snow cover over the Tibetan Plateau in the preceding winter/spring was also suggested [20]. Quite recently, several studies have found another interdecadal shift in the mid (i.e., 1992/1993 or 1993/1994) to late 1990s (i.e., 1999) especially over East Asia [22,23,24,25,26,27,28]. According to Liu et al. [26], the abrupt changes around 1993 features an increase in the summer rainfall over South China (SC), while that in 1999 features a decrease in rainfall over northeast China. Wu et al. [27] found that the increase in rainfall over SC is accompanied by an increase in the low-level convergence, mid-tropospheric ascent, and upper-level divergence, while other studies such as Kwon et al. [25], Kim et al. [29], and Chen et al. [30] attributed this increase in rainfall to the increase in the number of TCs over the western North Pacific (WNP) in the mid-1990s. The impact of the shifting of the Pacific Decadal Oscillation (PDO) to a negative phase has also been linked to the changes in the summer rainfall over eastern China [28]. Additionally, some studies have also found interdecadal changes in the intraseasonal variability (ISV) over the WNP [31,32,33,34]. In particular, Kajikawa et al. [31] found that the periodicity of ISV over the South China Seas (SCS) became shorter after the mid-1990s. Most of these studies on the decadal-to-interdecadal changes in the monsoon system focused on the seasonal mean fields (i.e., average from June to August (JJA)). However, it is known that rainfall also exhibits strong sub-seasonal (i.e., monthly) variabilities [11,13,23,32,33,34,35,36].
The rainfall over the Philippines has also experienced long-term changes [2,7,9,12,37]. For example, Cruz et al. [2] found a significant decreasing rainfall trend in stations located over the western coast of the country from 1961 to 2010 but no detailed mechanisms for the trends were presented. Meanwhile, in analyzing the decadal changes in the East Asian summer monsoon circulation, Kwon et al. [25] found a significant strengthening of upper level (i.e., 200-hPa) convergence over the Philippines around 1993/1994 (see their Figure 2a). However, their analysis used seasonal mean fields (JJA) and mainly focused on East Asia. As such, no detailed mechanisms for the change over the Philippines were presented. Akasaka [7] found that the variability of the onset of the Philippine summer monsoon (PSM) has increased greatly since the 1970s (see her Figure 7). Early onset dates of the PSM has been linked to the “great approach” of the easterly waves originating from WNP [7] and the presence of TCs in the vicinity of the Philippines that can initiate the moist southwesterly winds over the southwestern portion of the country [37]. The onset of the PSM occurs almost five days (P29; 21 May–25 May) following the onset of the summer monsoon over the SCS (SCSSM) [4,7,38,39]. Recently, Kajikawa and Wang [22] found a significant advance in the SCSSM onset dates around 1993/1994. It is suggested that the increase in the TC activity in May, changes in ISV [22], earlier retreat of the western North Pacific Subtropical High (WNPSH) [40], and a La Niña-like pattern SST change over the Pacific basin [41] are responsible for the advanced SCSSM onset. Other studies such as Kajikawa et al. [23] hypothesized that the variability in the thermal contrast, induced by aerosols and dust, between the Asian landmass and the Indian Ocean is responsible for the advanced onset over the south and southeastern monsoon regions including the Bay of Bengal (BoB), the Indochina Peninsula, and western Pacific region (120–140° E). The role of natural decadal variability other than anthropogenic forcing in relation to the advanced summer monsoon onset has also been suggested [41]. Furthermore, Xu and Wang [42] attributed the changes in TC activity in May to the increase in genesis potential index, maximum potential intensity, and vertical wind shear after the late 1990s over the WNP.
In this study, we addressed the following issues:
- (1)
- With the observed decadal changes in the summer monsoon of the adjacent regions, it is necessary to confirm whether such an interdecadal change can be observed locally over the Philippines. In fact, an inconspicuous rainfall trend can be seen in Figure 1 of Kajikawa et al. [23] using reanalysis datasets over Luzon Island. In particular, the increasing rainfall trend in May (see their Figure 1a) only appears over the central and southern Philippines and the decreasing rainfall trend in June (see their Figure 1b) can only be depicted over the SCS. It is worth mentioning that the complex topography of the Philippines gives rise to four different climate types [8]. The current resolution of available reanalysis datasets present difficulties in representing the correct sub-regional characteristics of rainfall. Thus, to better capture the changes in rainfall in the sub-regional scale, station-based rainfall data are preferred. In this study, we used the station-based rainfall data and supplemented it by the rainfall estimates from the Climate Prediction Center Merged Analysis of Precipitation (CMAP) during 1979–1993 and 1994–2008 following the change point used by Kwon et al. [25] and Kajikawa and Wang [22] around 1993/1994. We also investigated other periods with remarkable changes. Additional tests were performed in both datasets to confirm whether this change point in the mid-1990s is significant or not over the Philippines.
- (2)
- To the best of our knowledge, very few studies have examined the decadal-to-interdecadal changes in rainfall over the Philippines. Previous studies (e.g., by Cruz et al. [2], Villafuerte et al. [12], and Cinco et al. [9]) only focus on long-term trends and variability of seasonal and annual rainfall or temperature. This study is part of our on-going endeavor in understanding the multi-temporal variability of rainfall in the Philippines.
2. Data Sources and Methodology
2.1. Data Sources
Daily rainfall data from the Philippine Atmospheric, Geophysical and Astronomical Services Administration (PAGASA) for the seven stations located over the west coast of the Philippines and for the period 1979–2008 were used in this study. The seven stations are Laoag, Baguio, Iba, Dagupan, Science Garden, Ambulong, and Coron stations (blue circles in Figure 1). These stations were chosen because they have a relatively complete data during the study period, which is suitable for decadal change analysis. Furthermore, these stations are currently used by PAGASA in monitoring the summer monsoon of the Philippines. According to Cruz et al. [2], the western coast of the Philippines, where these stations are located, receives about 80–90% of the 30-year mean annual total rainfall (1961–1990) during the summer monsoon season (June–September).
Daily data of zonal (U) and meridional (V) components of winds, geopotential height (HGT), vertical velocity (ω), and relative humidity (RH) at multiple levels from the National Centers for Environmental Prediction-Department of Energy (NCEP-DOE) Atmospheric Model Intercomparison Project (AMIP-II) Reanalysis (hereafter NCEP-R2) [43] with 2.5 × 2.5° grid resolution were used to depict changes in the large-scale conditions. We also used the reanalysis data from the Japan Meteorological Agency (JMA) 55-year reanalysis with 1.25 × 1.25° grid resolution (hereafter, JRA55) [44] to test the consistency of the results. Our comparison of the two reanalysis datasets actually yielded the same results. Thus, most figures presented here are based on NCEP-R2 data. Pentad-mean rainfall estimates from CMAP [45], with 2.5 × 2.5° grid resolution from 1979 to 2008 were also used to supplement the station-based rainfall.
We also used the best track data provided by the Joint Typhoon Warning Center (JTWC; www.usno.navy.mil/NOOC/nmfc-ph/RSS/jtwc/best_tracks/wpindex.php) to depict TC activity. To check the consistency of the results, we compared the JTWC best track data with the TC track data from the Regional Specialized Meteorological Center of the Japan Meteorological Agency (hereafter, RSMC-Tokyo; http://www.jma.go.jp/jma/jma-eng/jma-center/rsmc-hp-pub-eg/trackarchives.html). Due to the difference in TC categories between these two datasets, we only consider TCs above Tropical Storm (TS) category or TCs with maximum wind speeds (Vmax) above 17.5 m s−1 (34 knots). In addition, we only considered TCs that entered the Philippine Area of Responsibility (PAR; 115° to 135° E and 5° to 25° N). The genesis location is defined as the location when the TC first attained a TS category [46,47]. It is worth mentioning that the RSMC-Tokyo and JTWC TC datasets yielded similar results. Thus, most of the figures presented in this study are only based on JTWC TC tracks.
2.2. Methodology
First, we divided the analysis period into two epochs, namely: 1979–1993 (hereafter, E1) and 1994–2008 (hereafter, E2) following Kwon et al. [25] and Kajikawa and Wang [22]. Later, we performed the Pettitt test to confirm whether the shift is significant over the western coast of the Philippines. Unless otherwise stated, the daily variables from the reanalysis and PAGASA datasets were converted to five-day consecutive and non-overlapping averages (hereafter, pentads), where the first pentad corresponds to the first five days of January and the last pentad corresponds to the last five days of December. There are 73 pentads in a year. We also applied a running three pentad 1–2–1 filter to reduce the high-frequency fluctuations in all the datasets [32,48].
The Pettitt test is a non-parametric test that detects the changes in the median of a sequence of observations. This test is commonly used in detecting change points in climatic and hydrological time series [49,50,51,52,53,54,55]. For instance, Ha and Ha [50] used this test in detecting the climate shift in rainfall over the Korean Peninsula. Bates et al. [49] also used this test in detecting the change points in the North Atlantic Oscillation index, relative humidity fields, and typhoon count series. The Pettitt test is performed as follows:
Let T be the length of the time series and t be the probable change point. Then, the single time series can be considered as two samples and represented by X1, …, Xt and Xt+1, …, XT with distributions F1(X) and F2(X), respectively. The null hypothesis of this test is that the two samples are independent and have identical distributions (i.e., ). The non-parametric test statistic (KT) is defined by:
where
Here, Ut,T, is equivalent to the Mann–Whitney statistic for testing whether the two samples belong to the same population. The value of t where the maximum KT occurs is the estimated change point in the sequence. The significance probability of KT can be approximated as:
A complete description and derivation of this test can be found in Pettitt [56]. We also used the t-test [57] for testing the significance of the difference plots. It should be noted that we applied a logarithmic transformation to the rainfall data prior to applying t-test since rainfall does not follow a normal distribution.
In generating the TC track density, the TC track data were interpolated onto a 5 × 5° grid boxes [58]. The same TC within a grid box is only counted once. Then, we derived the accumulated TC tracks in each grid box and divided it by the total number of years (i.e., 15 years in each epoch) to get the TC frequency in each year.
3. Results
3.1. Changes in Rainfall
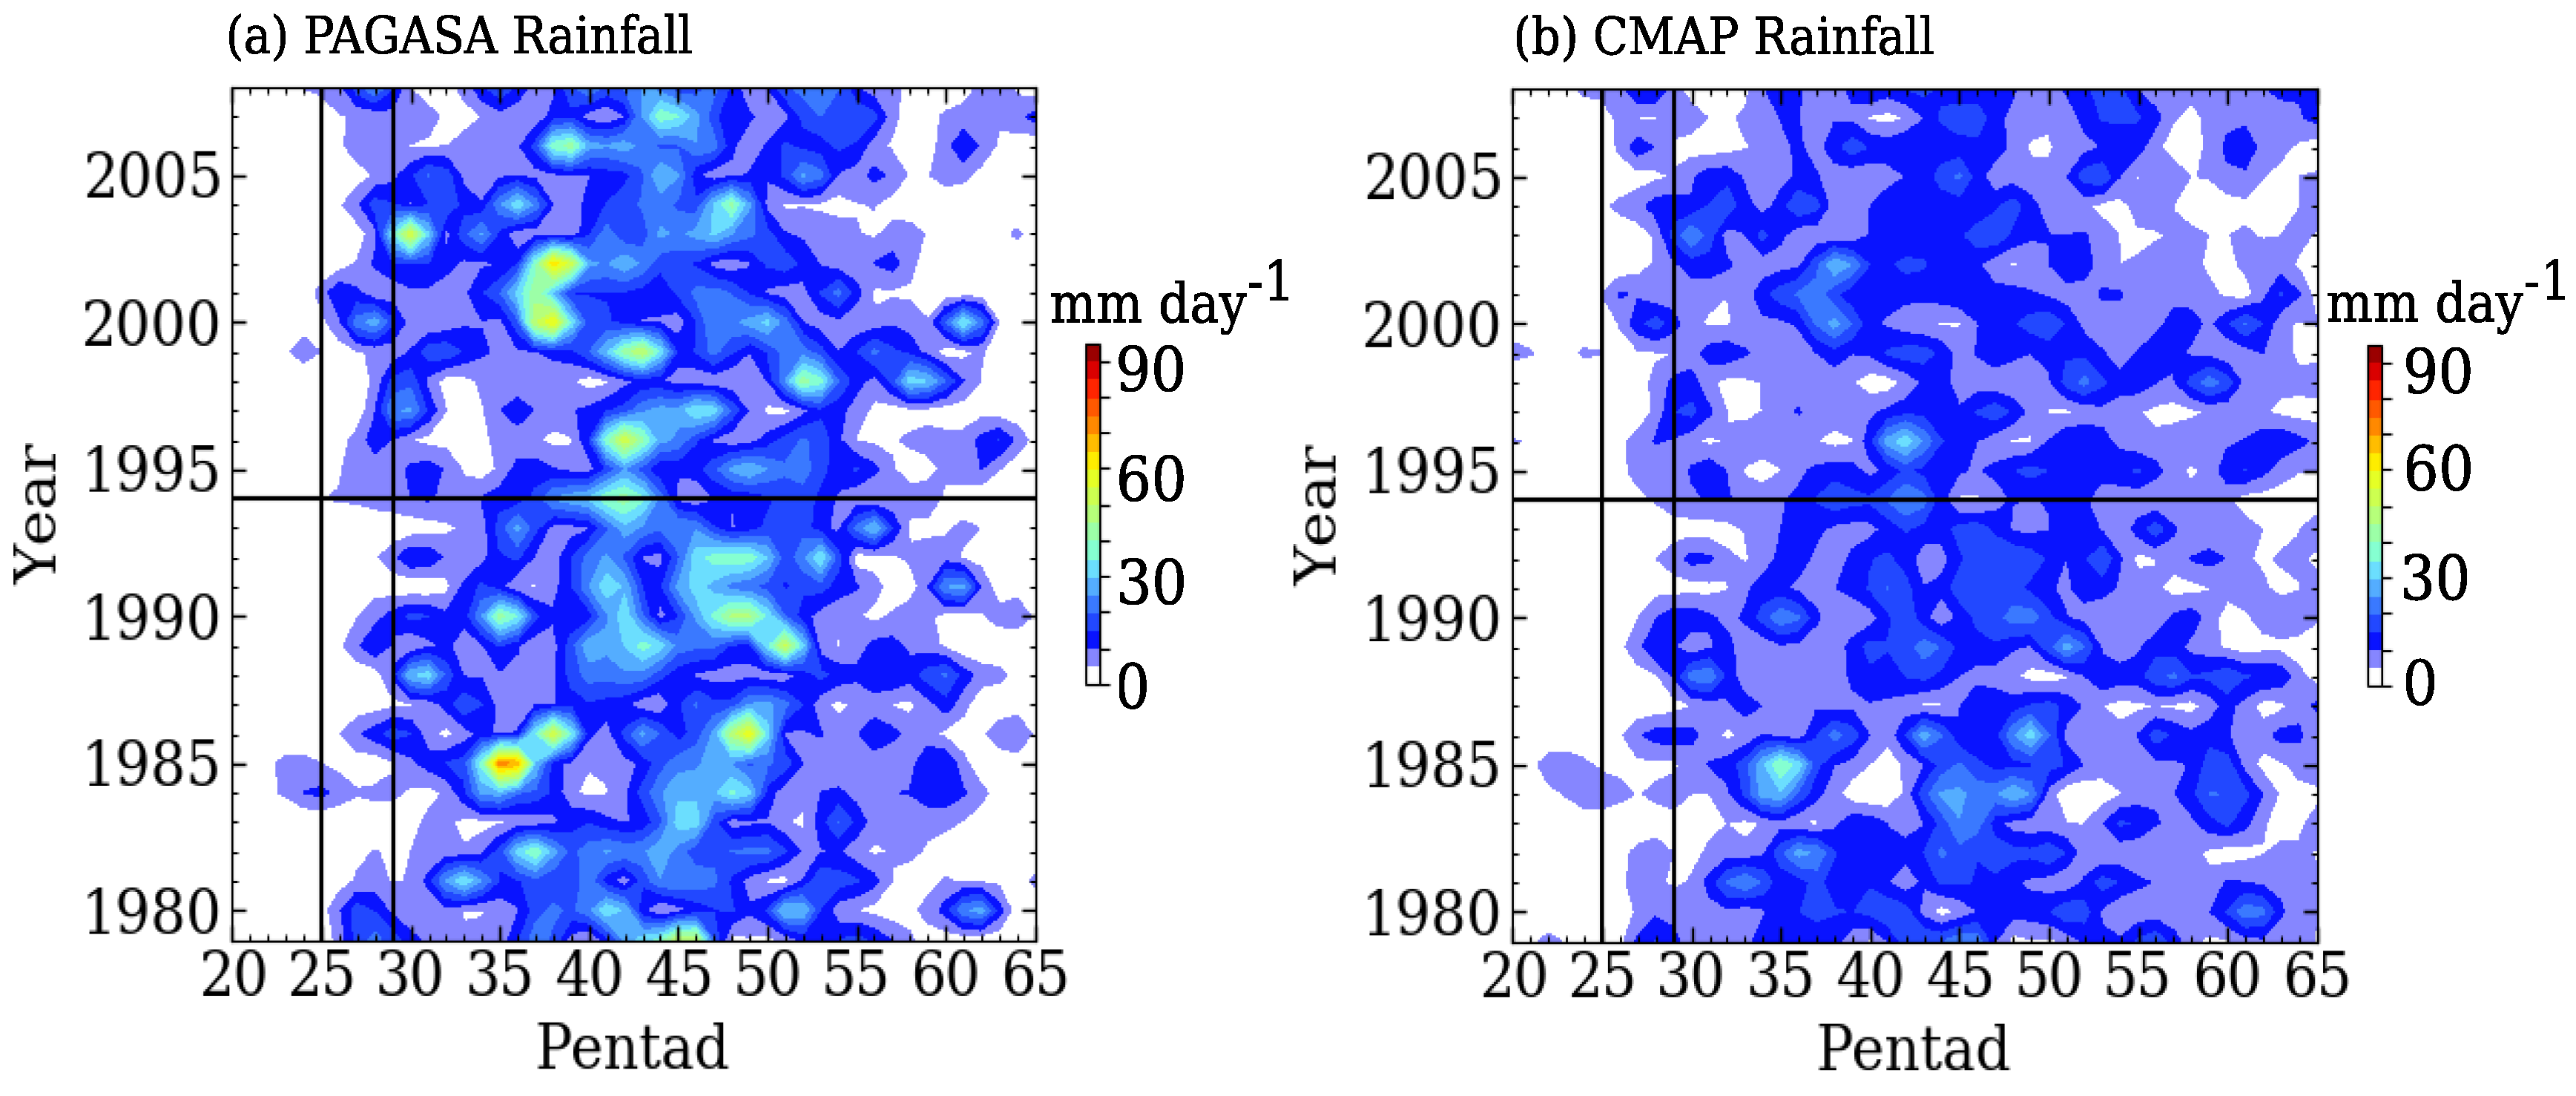
Figure 2a,b shows the smoothed pentad-mean rainfall distribution averaged across the seven PAGASA stations (Figure 1) and CMAP dataset extracted from the nearest five grid (red triangles in Figure 1) points to the PAGASA station location from 1979 to 2008, respectively. Climatologically, the rainy season over the western coast of the Philippines starts in mid-May and lasts until September [7]. The peak of the PSM usually occurs between P41 and P49 (20 July–2 September) based on Wang and LinHo [59], which is concurrent with the peak of the western North Pacific monsoon (WNPM) [15,48,59]. Using the rainfall data from the period 1961–2000 and from the 39 synoptic stations across the Philippines, Akasaka [7] found that the climatological onset date of the PSM is around P29 (May 21–May 25). The onset pentad is indicated by the vertical line in Figure 2a,b. The CMAP rainfall dataset was able to capture the changes in rainfall structure although the values are underestimated in most of the pentads. In particular, the CMAP dataset was not able to capture the rainfall above 35 mm day−1 despite the high correlation (0.88) between the two datasets (Figure not shown). Such a difference in magnitude of rainfall can be attributed to the coarse resolution of the CMAP dataset. An obvious increase in rainfall above 5 mm day−1 between P25 and P29 after the mid-1990s can be seen in Figure 2a,b. This result is consistent with a recent study by Kubota et al. [37], who also found a tendency for more rainfall occurrence in May after the mid-1990s. A decrease in rainfall occurrence above 25 mm day−1 (10 mm day−1) can also be seen between P46 to P50 (14 August to 7 September) in the PAGASA (CMAP) dataset.
Figure 3a,b shows the smoothed rainfall time series between the two epochs and their difference, respectively, using the PAGASA dataset. It is worth mentioning that similar features were observed in the CMAP dataset (Figure not shown). We found seven periods with significant rainfall differences (P28–P31, P33–P36, P38–P39, P43–P44, P45–P50, P52–P54, and P59–P60) as indicated by the shaded pentads in Figure 3a. For instance, an obvious increase in rainfall from P28 to P31 (16 May–4 June) can be seen in Figure 3a,b with a peak around P30 (26 May–30 May). The average daily rainfall for P28–P31 in E1 is about 8 mm day−1 (7 mm day−1), while that in E2 is about 12 mm day−1 (13 mm day−1) using the PAGASA (CMAP) dataset. The difference in rainfall between the two epochs is statistically significant above the 95% confidence level using the t-test in both datasets. The increase in rainfall in May is followed by a decrease in rainfall from P33 to P36 (10 June–29 June). The same features were observed by Kajikawa et al. [23], where areas with increasing rainfall in May experience a decreasing rainfall in June (see their Figure 1b) especially over the SCS. They attributed this to the slowing down of the northward propagation of the first ISV. The average daily rainfall for P33–P36 in E1 is about 16 mm day−1 (13 mm day−1), while that in E2 is about 10 mm day−1 (9 mm day−1) using the PAGASA (CMAP) dataset. The difference in rainfall is also significantly above the 95% confidence level in both datasets. The decrease in rainfall from early to late June is followed by a sharp increase in rainfall from P38 to P39 (5 July–14 July) in E2. Climatologically, there is a simultaneous break (grand break) between the Indian summer monsoon (ISM), East Asian summer monsoon (EASM), and the WNPM during this period [12,15] from P36 to P39. This break appears shorter in E2. Additionally, the sharp increase in rainfall from P38 to P39 in E2 is not significant in the CMAP dataset. An increase in rainfall from P41 to P44 can also be seen in Figure 3a,b. However, only the increase in rainfall from P43 to P44 (30 July–8 August) is statistically significant at the 99% confidence level using the PAGASA dataset. A decrease in rainfall from P45 to P50 is apparent in E2, which is statistically significant at the 99% confidence level in both datasets. The average daily rainfall for P45–P50 in E1 is about 22 mm day−1 (15 mm day−1), while that in E2 is about 16 mm day−1 (10 mm day−1) using the PAGASA (CMAP) dataset.
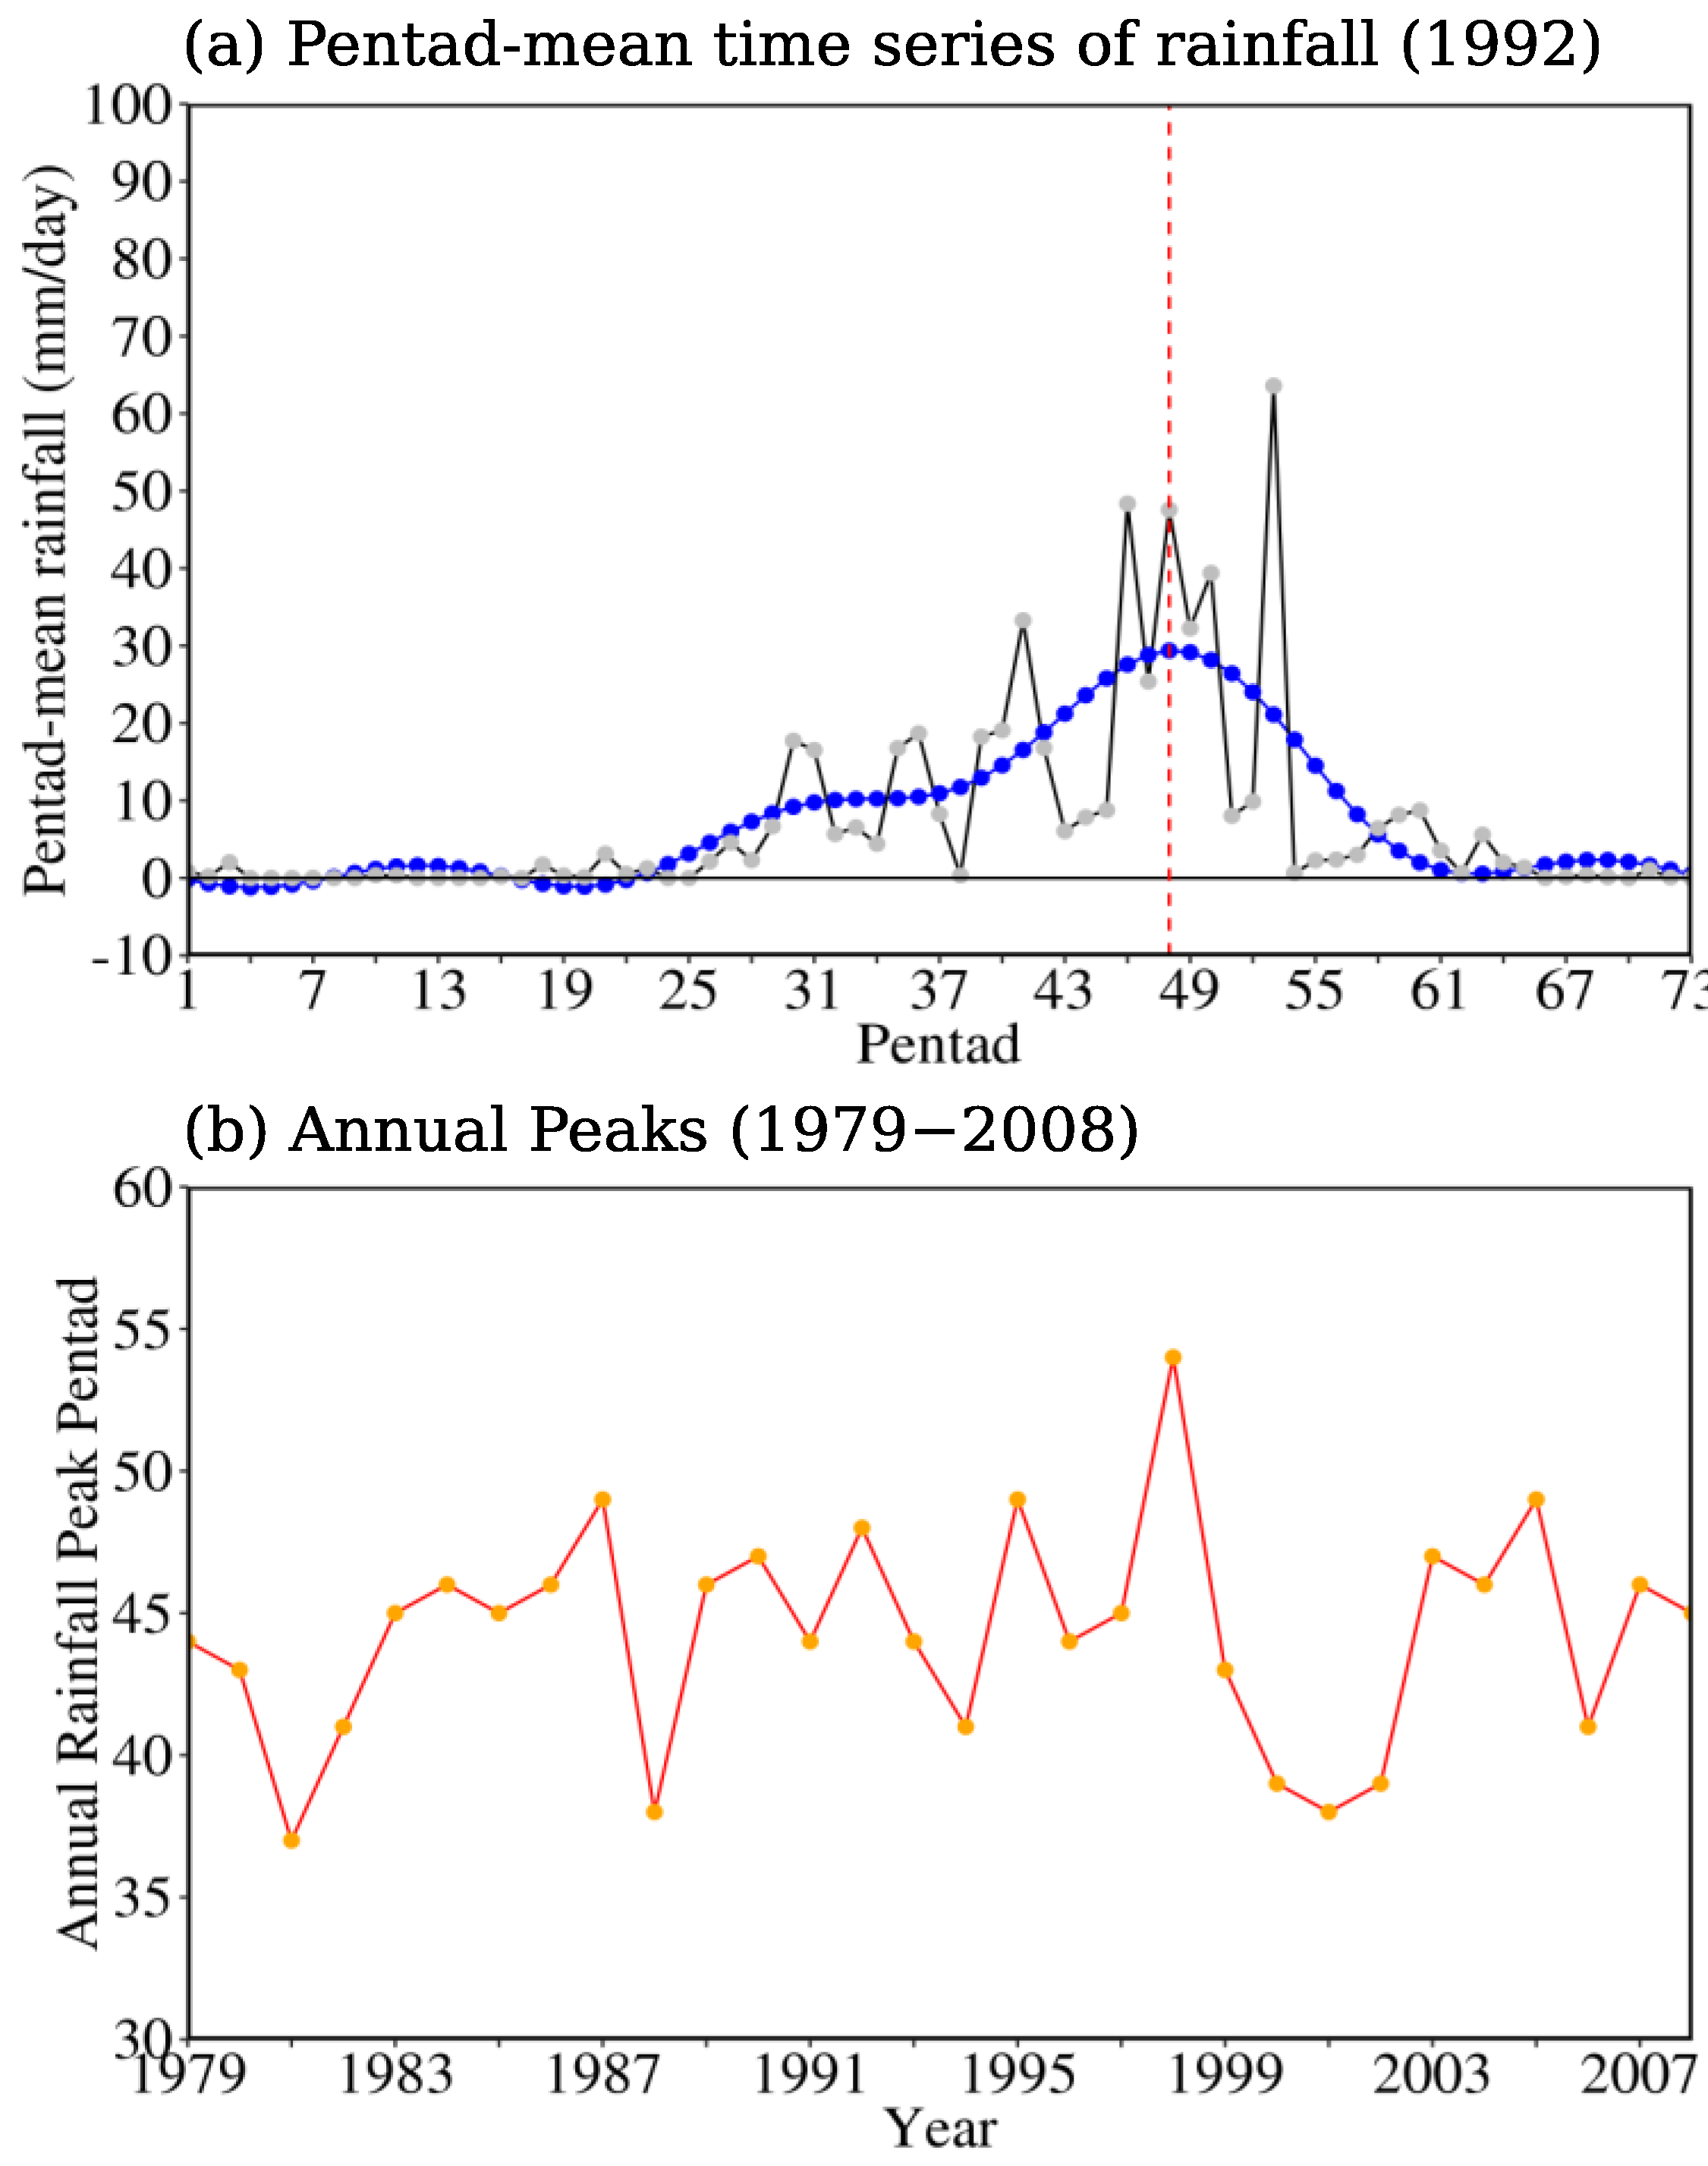
The peak of the summer monsoon in E1 appears to be shifted earlier in E2 (Figure 3a). To verify this, we estimated the annual rainfall peak using the sum of the first four Fourier harmonics of the pentad-mean rainfall time series (i.e., a smoothed time series) in each year. The first four Fourier harmonics represent the slowly-varying component of rainfall (i.e., low-frequency oscillations with periods longer than 90 days). As a test case, Figure 4a shows the pentad-mean rainfall time series for a typical year (1992; black line) and the sum of the first four Fourier harmonics (blue line). The annual peak can then be estimated as the pentad when the smoothed series attains its maximum. For 1992, the annual peak occurs at P48. The time series of annual peaks from 1979 to 2008 using the method above is shown in Figure 4b. We found no significant shift in the annual peaks of rainfall using the Pettitt test. In fact, the average rainfall peak for both epochs is around P44. This result suggests that the decrease in rainfall during P45–P50 is not related to the shifting of the rainfall peak. A significant increase in rainfall (above the 95% confidence level) from P52 to P54 (13 September–27 September) follows the decrease in rainfall during P45–P50 in E2. This increase in rainfall is only significant in the PAGASA dataset. The last period with a significant rainfall difference occurs from P59 to P60 (18 October–27 October), which features a decrease in rainfall in E2. The rainfall difference is significant at the 99% confidence level in both datasets. According to Wang and Xu [60], the last wet spell of the WNPM and PSM usually occurs during this period.
To confirm whether the change point significantly occurred around 1993/1994, we performed the Pettitt test on the smoothed average rainfall time series between the seven periods. The calculated change points are summarized in Table 1. Although there is a clear tendency for increased precipitation from P28 to P31 after 1994 (Figure 2), the climate shift was found around 1995/1996 in the PAGASA dataset and no significant change point can be detected in the CMAP dataset. These results are still consistent with the earlier results of Kajikawa et al. [23] (see their Figure 1a) using the CMAP data. The climate shift after 1994 cannot be detected in the CMAP dataset because it underestimates the rainfall in E2. The climate shift for P33–P36 occurred around 1993/1994 and 1992/1993 in the PAGASA and CMAP datasets, respectively. This climate shift is significant at 95% confidence level. Furthermore, the climate shift during P38–P39 was detected around 1998/1999 in both sets. However, only the shift in the PAGASA dataset is significant above the 90% confidence level. Additionally, a significant climate shift during P45–P50 was also detected around 1993/1994 in both datasets, while the climate shift during P59–P60 was detected around 1999/2000. Only the periods P45–P50 and P59–P60 show a robust climate shift (i.e., similar change points in the two rainfall datasets) from the mid to late 1990s, respectively. In the succeeding sections, we mainly focus the discussion on the climate shift from P45 to P50 since the changes in other periods are not robust or occurred later (1999/2000; e.g., P59–P60). Furthermore, P45–P50 coincides with the mature phase of the PSM. Thus, its relative importance outweighs the other periods. We checked and confirmed that the decrease in rainfall from P45 to P50 in E2 is present at all seven PAGASA stations. Thus, taking the averaged time series across the seven stations can reasonably represent the observed trends over the west coast of the Philippines.
We also performed a running t-test with varying time windows following the methodology of Choi et al. [61] to check the robustness of the change points in Table 1. A significant change point corresponds to the year with the largest absolute t-statistic value exceeding a certain level of significance and should be the same for the different time windows. We found that the change points detected by the running t-test are consistent with the results from the Pettitt test, which suggests that the change points in Table 1 are robust. Only the period P28–P31 shows an unclear change point in the running t-test because the different time windows resulted in different maximum t-statistics. The change point during this period is also insignificant using the Pettitt test. Nonetheless, the focus of the study is the P45–P50 period and we obtained the same change points for both the CMAP and PAGASA datasets.
To further depict the large-scale change in rainfall, we illustrate the epochal difference (E2 minus E1) in CMAP rainfall during P45–P50 in Figure 5. A significant decrease in rainfall can be seen over the eastern Indochina Peninsula, the Korean Peninsula, Luzon Island, and some parts of Visayas Islands (121–127.5° E; 8–12.5° N) in the Philippines. In contrast, a significant increase in rainfall can be depicted over southeastern China along 25–30° N and Mindanao Island (121–127.5° E; 5–8° N). The possible mechanisms for the changes in rainfall will be discussed further in the succeeding section.
3.2. Possible Influencing Factors
In this section, we investigate the possible causes leading to the abrupt shift in the rainfall during P45–P50.
3.2.1. Changes in Moisture Transport
Moisture transported from the Indian Ocean by the monsoon winds are essential in the formation of rainfall over the Asian monsoon region [62,63]. Thus, we examined first the possible contribution of the changes in the vertically integrated moisture flux (VMF) and vertically integrated moisture flux divergence (VMFD) to the changes in rainfall. The VMFD is calculated as: , where Ps, P300, q, g, and V are the pressure at the surface, the pressure at 300-hPa, specific humidity, gravitational acceleration constant (9.8 m s−2), and wind vectors, respectively.
Figure 6 shows the time series of area-averaged VMFD over Luzon Island (117.5–122.5° E; 10–20° N). The average VMFD in E1 is about −3 kg m−2 s−1, while that in E2 is about −1 kg m−2 s−1. The epochal difference is statistically significant at the 99% confidence level by t-test. This result indicates that the reduction of rainfall in E2 over Luzon Island can be associated with the weakening of the eastward moisture transport by the summer monsoon.
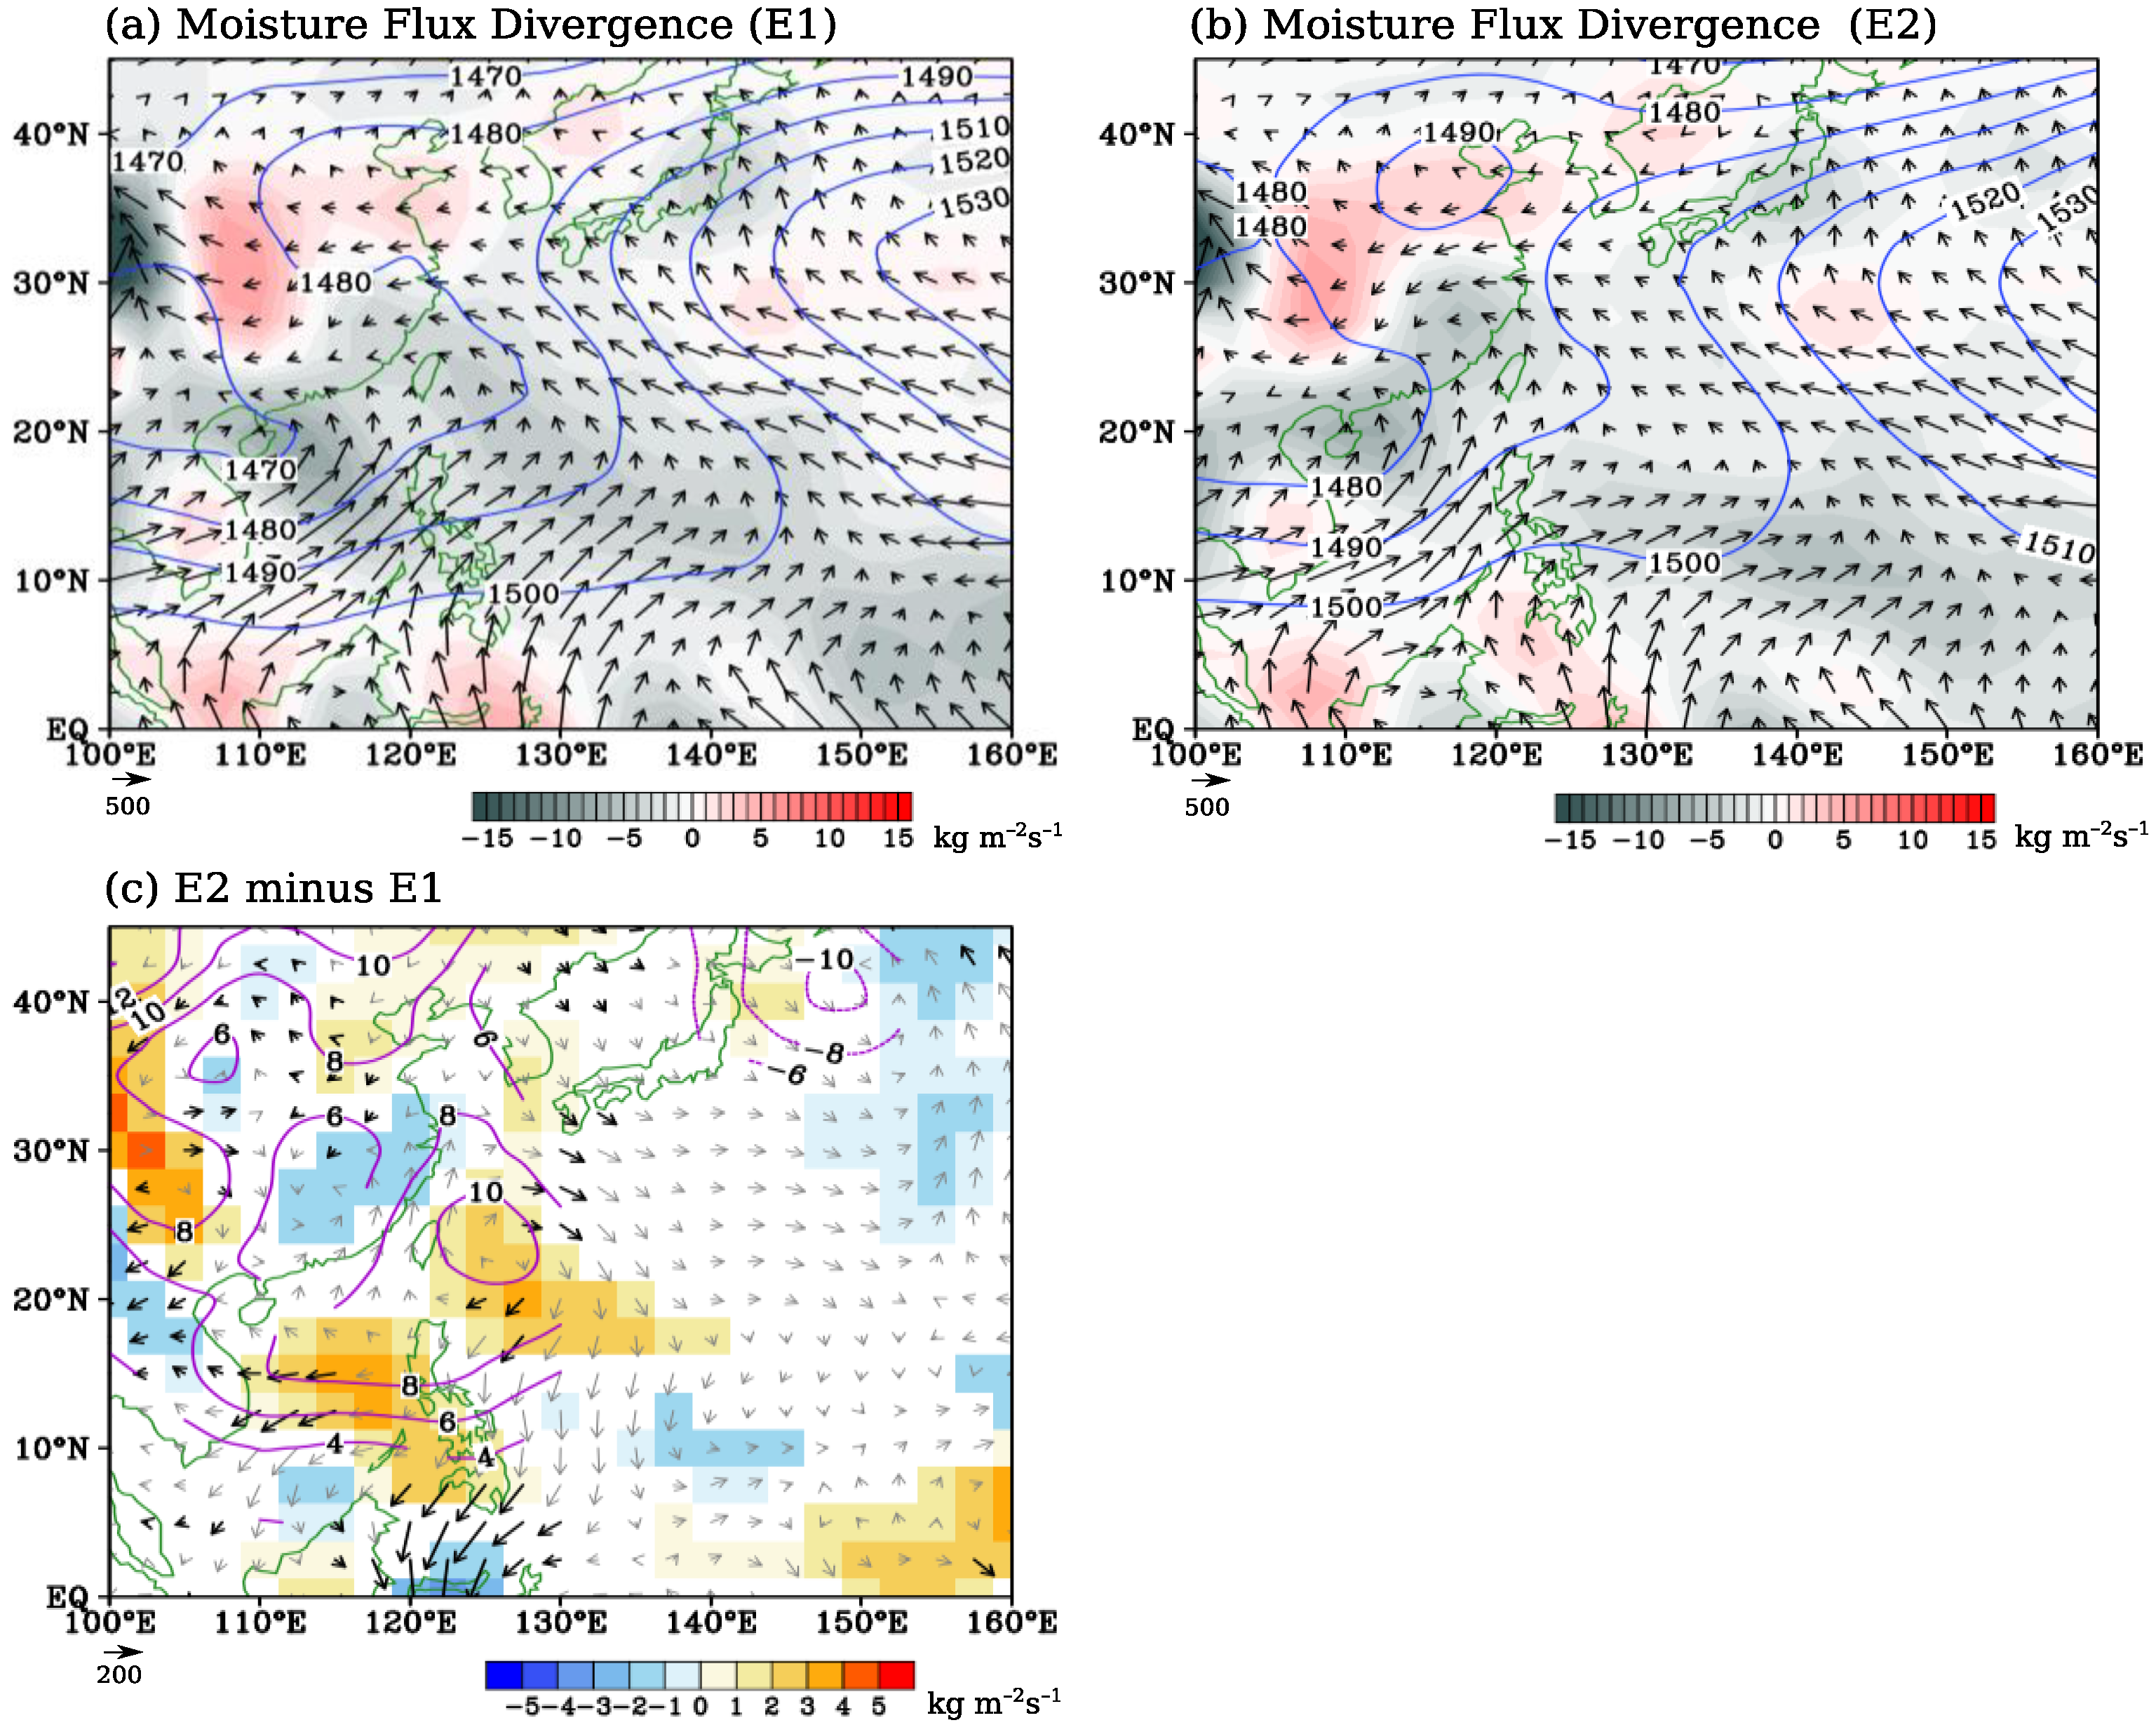
To further clarify the changes in the moisture transport between the two epochs, we illustrate the spatial patterns of VMF and VMFD including their epochal difference in Figure 7. The most remarkable feature is the increase of VMFD over the Philippines in E2 (Figure 7b). In particular, the moisture convergence (i.e., negative VMFD), which is centered around 112° E, 20° N and stretches over the western coast the Philippines in E1 (Figure 7a), weakens in E2. Additionally, a northwest–southeast tilted moisture convergence, which corresponds to the monsoon trough, near Taiwan that stretches around 115° E, 25° N to the equatorial WNP (around 150° E, 5° N) can be seen in E1. In contrast, the monsoon trough appears more southward and stretches from 125° E, 15° N to the equatorial WNP in E2. The VMF also appears to bifurcate to southwesterly and westerly direction over the Luzon Island in E2. This bifurcation leads to the strengthening of VMFD over the Luzon Island. On the other hand, the VMF in E1 is southwesterly over the Philippines and extends eastward up to 140° E along 15° N. These results imply that the monsoon trough near the Philippines has weakened in E2. What causes this bifurcation in the moisture flux in E2? We illustrate the 850-hPa HGT in Figure 7a,b (blue contours) since the wind vectors generally follow the HGT contours. It turns out that the western ridge of the WNPSH has extended further westward during E2. In particular, the 1490-m contour line is located near 120° E in E2 and crosses the Korean Peninsula. In E1, this contour line is located near 130° E. Additionally, the 1500-m contour line, which is located along 9° N and crosses the northern part of Mindanao Island in E1, has shifted northwards along the Visayas Islands in E2. In general, the bifurcation of VMF appears to result from the westward extension of the WNPSH.
We also check the epochal difference in relative vorticity at 850-hPa to confirm the weakening of the monsoon trough (Figure S1a) and found significant negative low-level relative vorticity difference (anticyclonic circulation) over the SCS and northeast of the Philippines. The epochal difference in the VMFD in Figure 7c also shows significant divergence over the SCS including the western coast and the northeast of the Philippines along 20° N, which indicates a weakening of monsoon westerly/southwesterly winds. To confirm this, we also checked the epochal difference in zonal winds at 850-hPa (Figure S1b) and found an apparent decrease between 10 and 20° N, with a significant change over the SCS and eastern Indochina Peninsula. The epochal difference in 850-hPa HGT in Figure 7c shows significant positive difference along 10–30° N, which indicates the strengthening of the WNPSH.
3.2.2. Changes in TC Activity
The rainfall peak from August to September in the PSM is usually attributed to TC activity and TC-monsoon interaction (e.g., Cinco et al. [58]; see their Figure 4). Thus, the apparent weakening of rainfall from P45 to P50 might be related to the changes in the TC activity (i.e., changes in TC tracks, genesis location, occurrence frequency, etc.). An earlier study by Kubota and Wang [64] found that the TC-induced rainfall accounts for about 30–50% of the total rainfall during the TC season (July to October) in stations located over the eastern coast and the northern Philippines (see their Table 2), while that over the western coast of the Philippines accounts for about 40% (e.g., Bagtasa [65]; see his Figure 5c). Aside from landfalling TCs, non-landfalling TCs also contribute to the rainfall over the western coast of the country by enhancing the prevailing summer monsoon system [1,37]. In this section, we examine the changes in the TC activity.
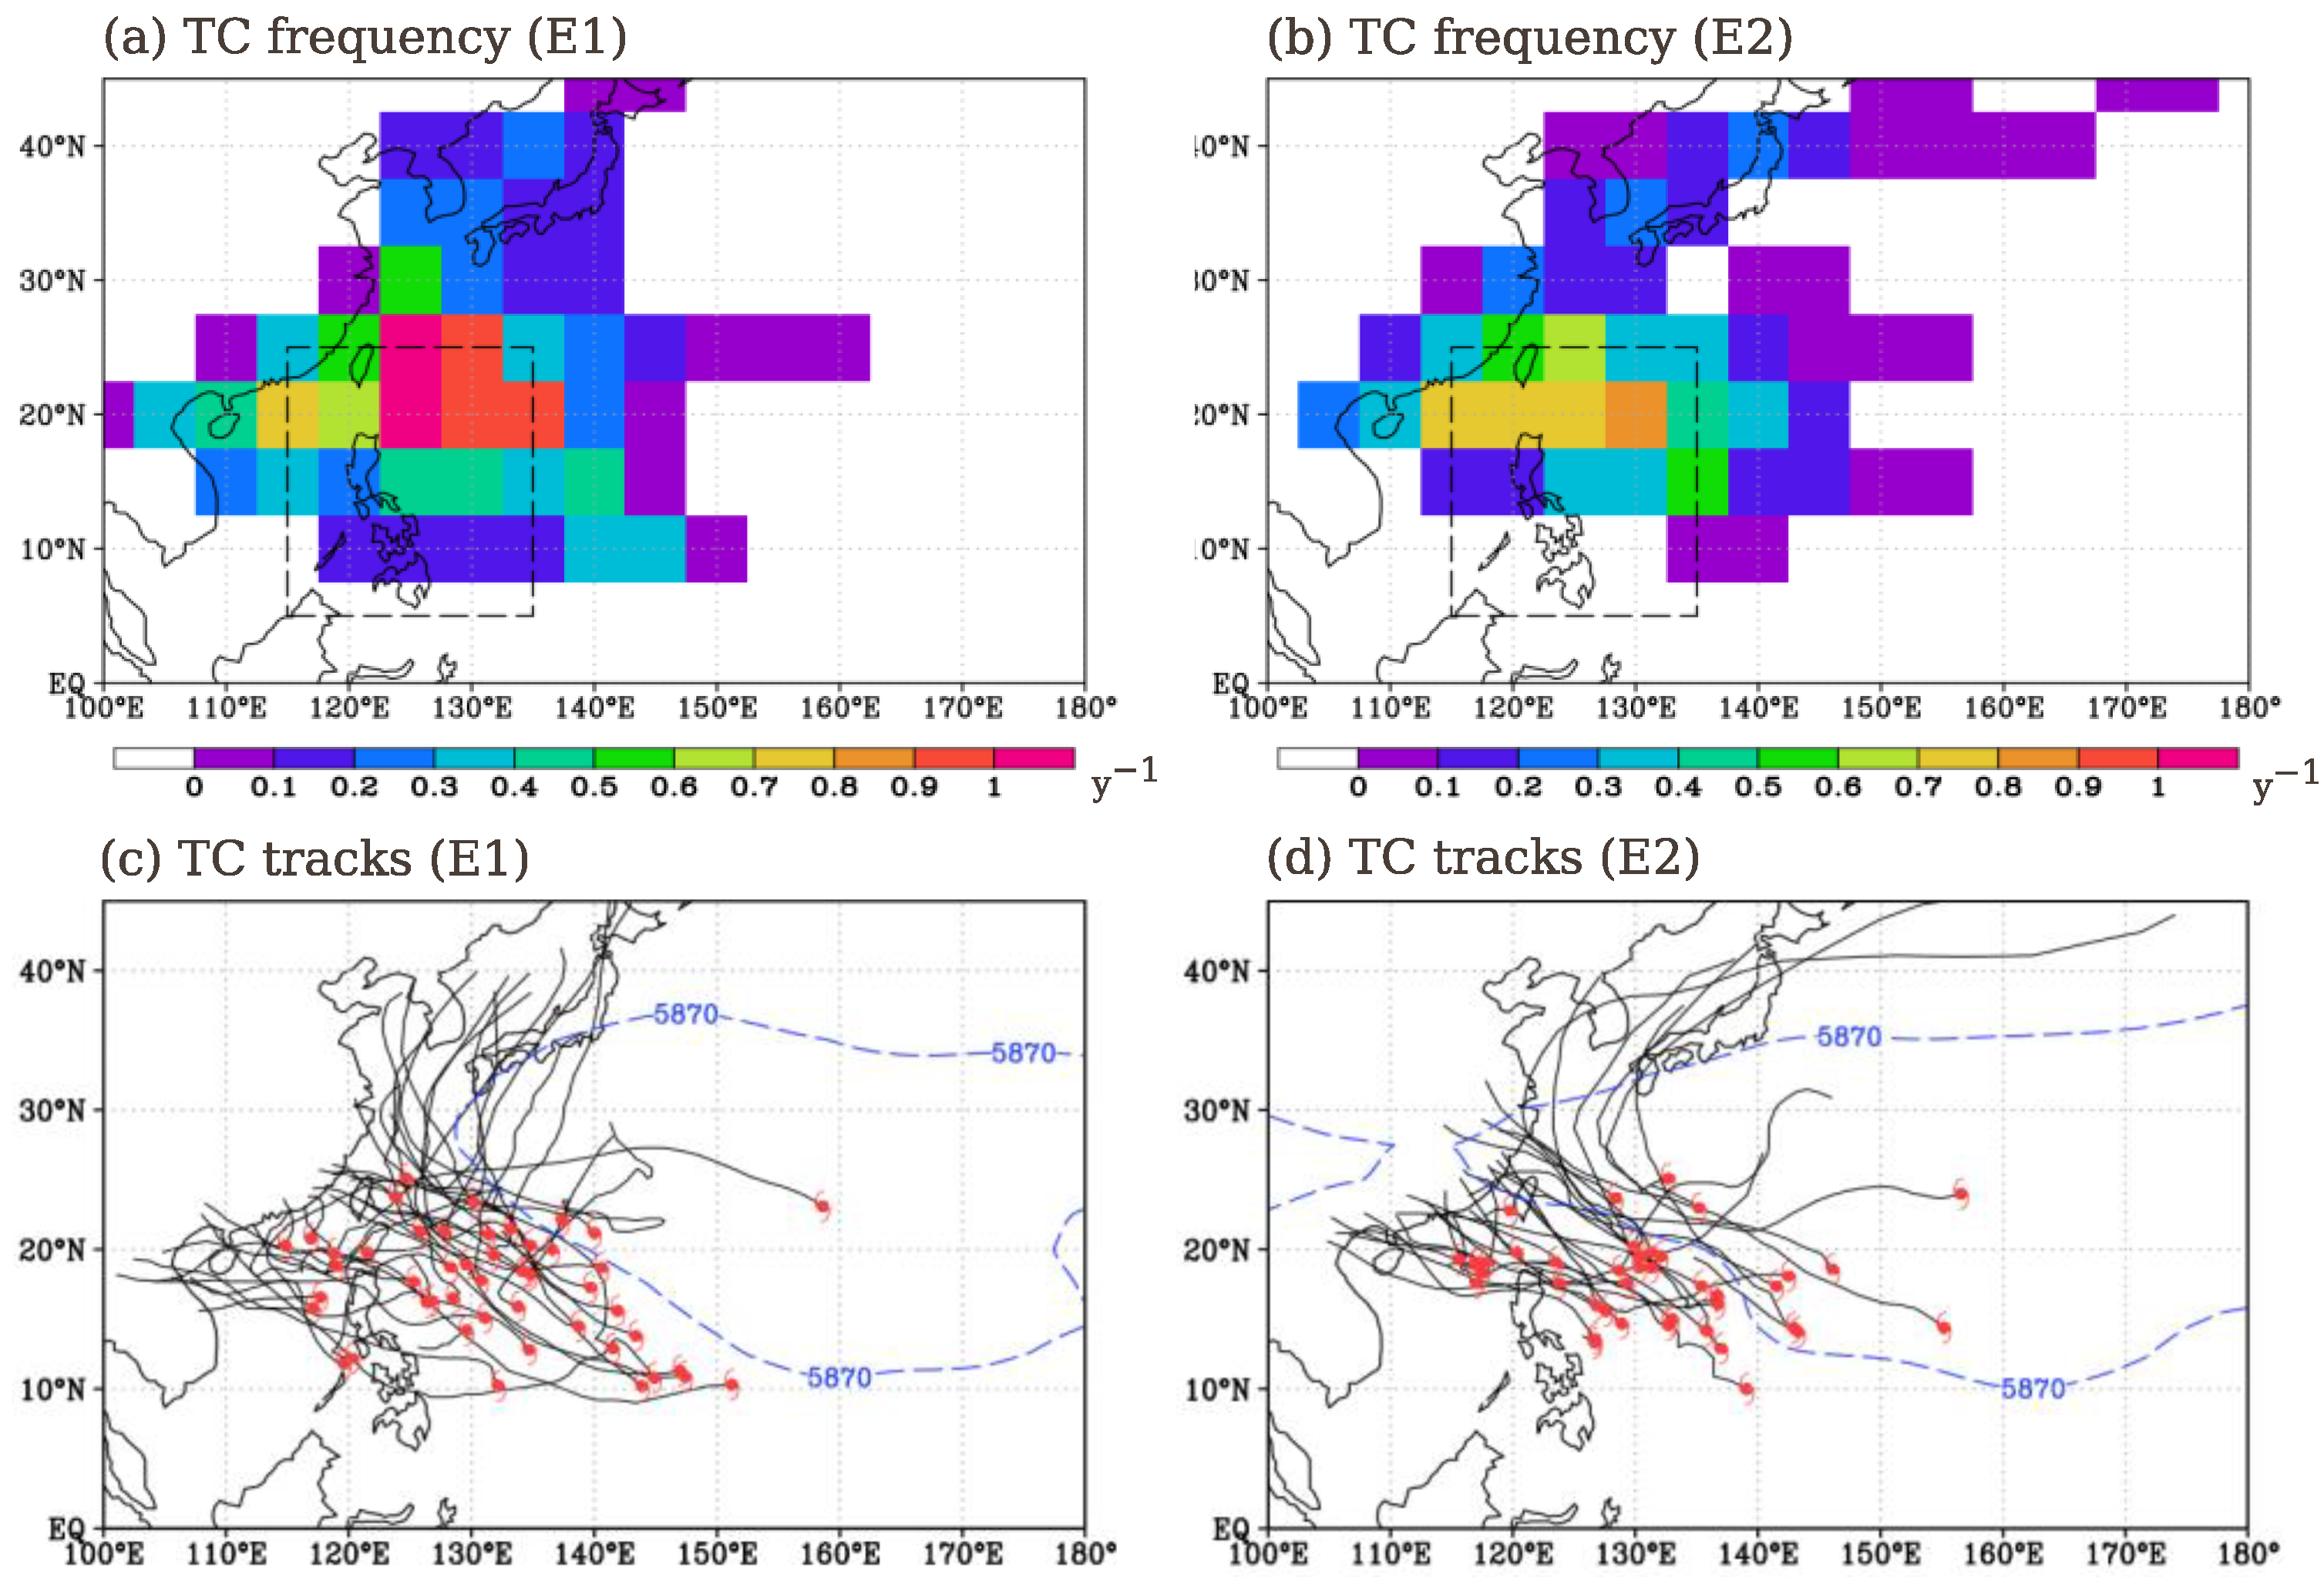
Figure 8 shows the TC tracks, passage frequency over a 5 × 5° grid, and the mean location of 500-hPa HGT in the two epochs during P45–P50. There are 48 (43) TCs that entered the PAR in E1, while there are 40 (37) TCs in E2 using the JTWC (RSMC-Tokyo, Japan) dataset. A decrease in the TC activity northeast of Luzon Island during E2 between 20 and 25° N can be seen in Figure 8b. The TC frequency between these latitudes is about 0.5 to 1 y−1 in E1. In contrast, an increase in TC frequency can be seen north of Luzon Island around 20° N and 120° E in E2. Over central Luzon Island and SCS (along 15° N), the TC frequency decreased from 0.3 y−1 to 0.1 y−1 in E2 (Figure 8b). Furthermore, no TC occurrence can be depicted over the Visayas and Mindanao Islands in E2 along 10° N. The TC tracks in Figure 8c,d show that less TCs made landfall over the Philippines in E2. There is also a northwestward shift in the genesis location and fewer northeastward recurving TCs in E2 compared to E1. The changes in the TC tracks are consistent with a recent study by He et al. [66], who found a decrease in northeastward recurving TCs towards Japan and increase in TC frequency over southeastern China and the Okinawa region during July to October in the late 1990s. The TC tracks in E2 also appears to be similar to the TC tracks during La Niña years (e.g., see Figure 2d of Fudeyasu et al. [46]). Earlier studies such as Saunders et al. [67] and Zhang et al. [68] found a significant increase in the number of landfalling TCs over the Philippines during the peak of La Niña years because of the shift in the mean genesis location. However, this is not the case in the observed TC tracks in E2. The changes in the tracks might also be related with the changes in the steering flow pattern. Previous studies such as Choi et al. [69], Hirata and Kawamura [70], and Yang et al. [71] have shown that the steering flow of TCs is highly influenced by the western ridge of the WNPSH. Thus, we illustrate the location of the WNPSH as represented by the 5870-m (dashed) contour line in Figure 8c,d. The 5870-m contour line expands further westward near 90° E in E2, whereas its western ridge is located near 125° E in E1. The westward extension of the WNPSH in E2 reduced the number of recurving TCs towards Japan and allowed more northwestward moving TCs towards southeastern China. Additionally, the increase in TC frequency north of Luzon Island between 18 and 20° N in E2 can be attributed to this change in the location of the western ridge of the WNPSH. It is worth mentioning that we observed the same features in the tracks and genesis location using the RSMC-Tokyo dataset, which highlights the consistency of these results.
To quantify the rainfall contribution of TCs to the climate shift during P45–P50, we derived the total TC-induced rainfall (PTC) following the estimation method by Kubota and Wang [64] and Bagtasa [65]. In these studies, the TC rainfall rate is expressed as a function of the distance of each station to the TC center from the 6-hourly best track data. They found that the optimum distance for TC-induced rainfall over the Philippines is about 10° (~1000–1100 km). In this study, we classified the PTC when the distance between the TC center and the station is within 1100 km [65]. We interpolated the daily rainfall data into six-hourly data in each station to match the best track data. We derived the accumulated PTC during P45–P50 in each station and for each epoch. The remaining rainfall other than PTC was classified as PNOTC. The results are summarized in Table 2. The accumulated rainfall (PTOTAL) averaged across the seven PAGASA stations during the entire period (1979–2008) is 558 mm, about 46% of which (256 mm) comes from PTC using the JTWC dataset and 54% comes from PNOTC. The average PTC in E1 is about 352 mm (~54% of 651 mm) and decreased to about 160 mm (~35% of 464 mm) during E2. The difference between the two epochs is significant at 90% confidence level by t-test. These results clearly indicate that the decrease in rainfall during E2 can be partly attributed to the decrease in TC activity.
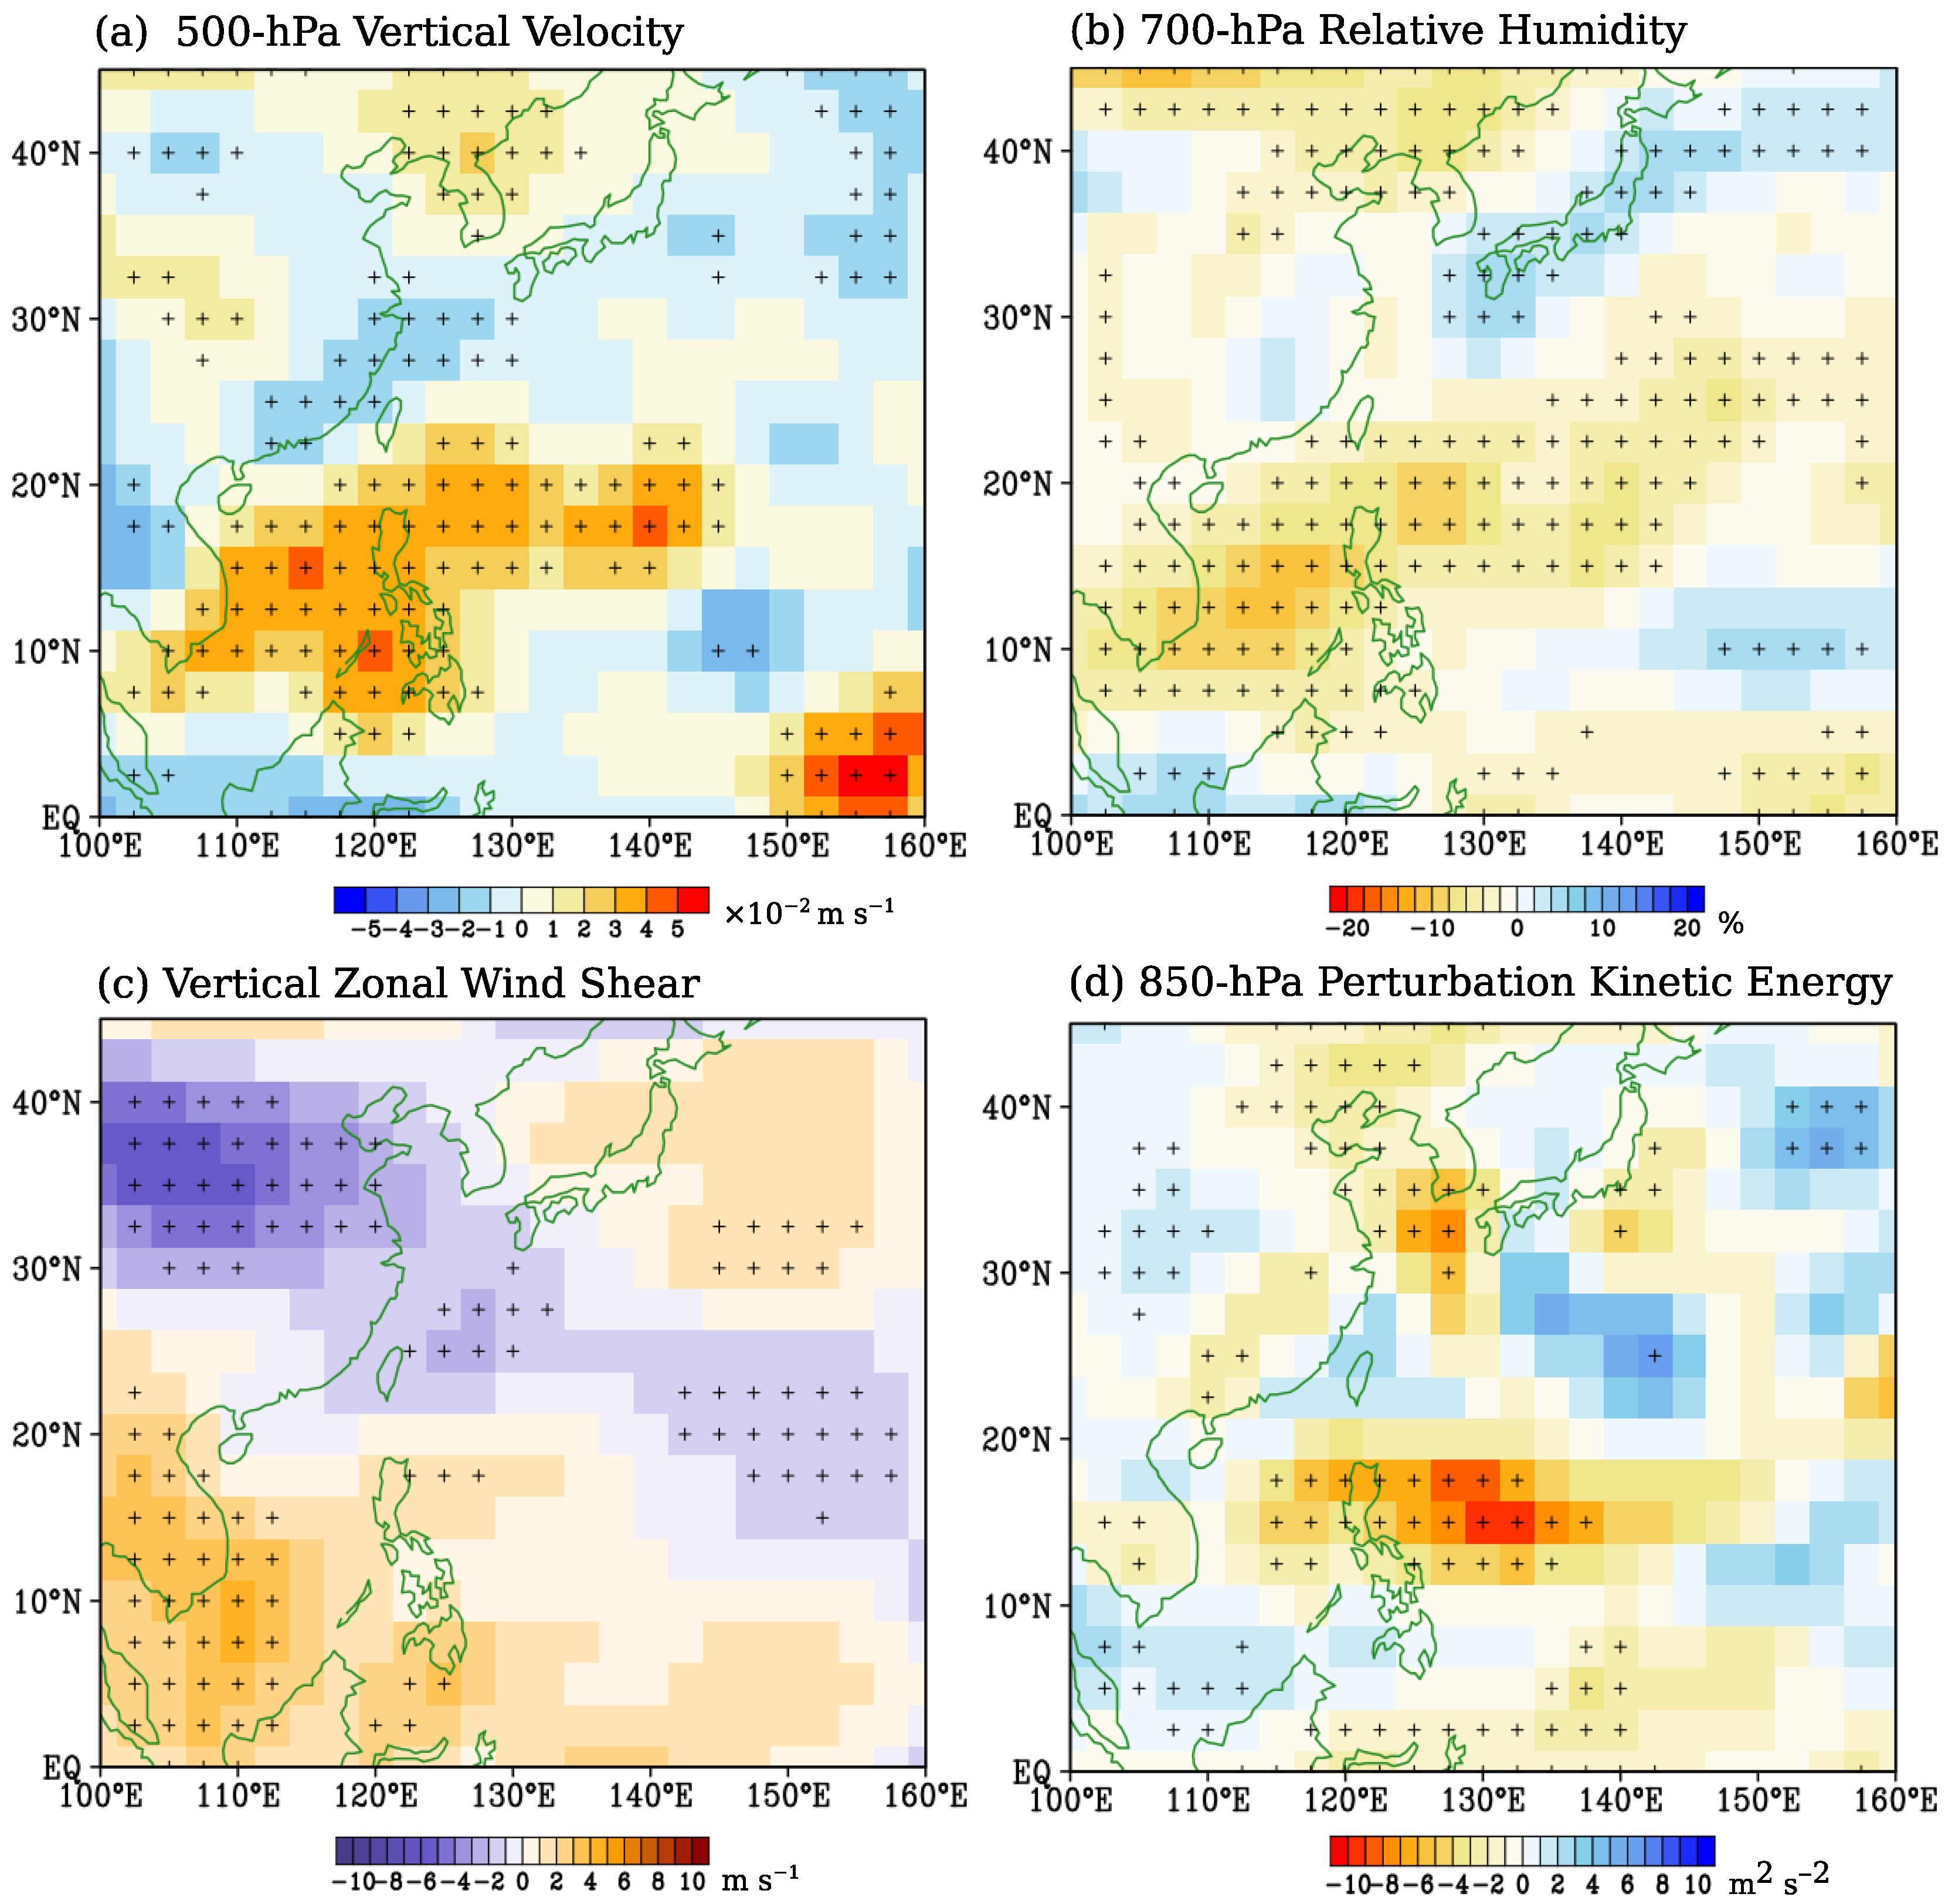
The changes in the TC activity in the vicinity of the Philippines raises some important issues: (1) there are fewer TCs that made landfall over the Philippines in E2 than in E1; and (2) no TC was formed over the western coast of the Philippines in E2 compared with E1. To clarify these issues, we examined the changes in the 500-hPa ω, 700-hPa RH, and vertical zonal wind shear (U200hPa minus U850hPa) that are essential for the formation of TCs [66,72] in Figure 9.
The changes in the 500-hPa ω (Figure 9a) and 700-hPa RH (Figure 9b) are largely consistent with the changes in rainfall in Figure 5. For instance, the epochal difference in the ω features significant mid-tropospheric descent (subsidence) over the Philippines and ascent over southeastern China. A significant mid-tropospheric descent can also be depicted near 160° E. However, the rainfall change over this longitude is not significant. The subsidence over the Philippines is accompanied by a decrease in RH as shown in Figure 9b. On the other hand, a significant increase in RH can be depicted over mainland Japan, which resembles a negative Pacific-Japan (PJ) pattern [62]. Huang and Sun [73] and Zhou and Cui [74] suggested that the weakened convection over the Philippines leads to a southward shifting of the WNPSH, which induces a negative PJ pattern [75,62]. On the other hand, an apparent increase in the vertical zonal wind shear (Figure 9c) can be seen along 10–20° N west of 140° E, which is also unfavorable for TC activity [66].
Several studies suggest that an anticyclonic circulation over the WNP inhibits the development of TCs [21,57,74,76]. Kubota and Wang [64] also noted that an anticyclonic circulation located over the Philippine sea causes the TC-induced rainfall to be shifted further eastward, which leads to a decrease in the total rainfall of the Philippines. To confirm whether the synoptic-scale disturbances changed in the vicinity of the Philippines, we derived the perturbation kinetic energy (PKE) of the low-level winds (Figure 9d). The PKE can be used to depict synoptic-scale disturbances including those disturbances weaker than TCs such as residual lows and frontal activities in mid-latitudes [29,77,78]. The PKE can be calculated using the formula: , where u′ and v′ are the perturbations obtained by subtracting an 11-day running mean to the daily U and V wind components, respectively, while the overbar denotes the epochal mean of the daily PKE values. There is an apparent decrease in PKE over Luzon Island along 10–18° N with stronger change over the Philippine Sea near 140° E. This result suggests that the low-level divergence and subsidence in the vicinity of the Philippines inhibits the formation of synoptic-scale disturbances. In general, the changes in the ambient environmental conditions became unfavorable for TC development and other synoptic-scale disturbances in the vicinity of the Philippines as substantiated by the decrease in PKE.
4. Summary and Discussion
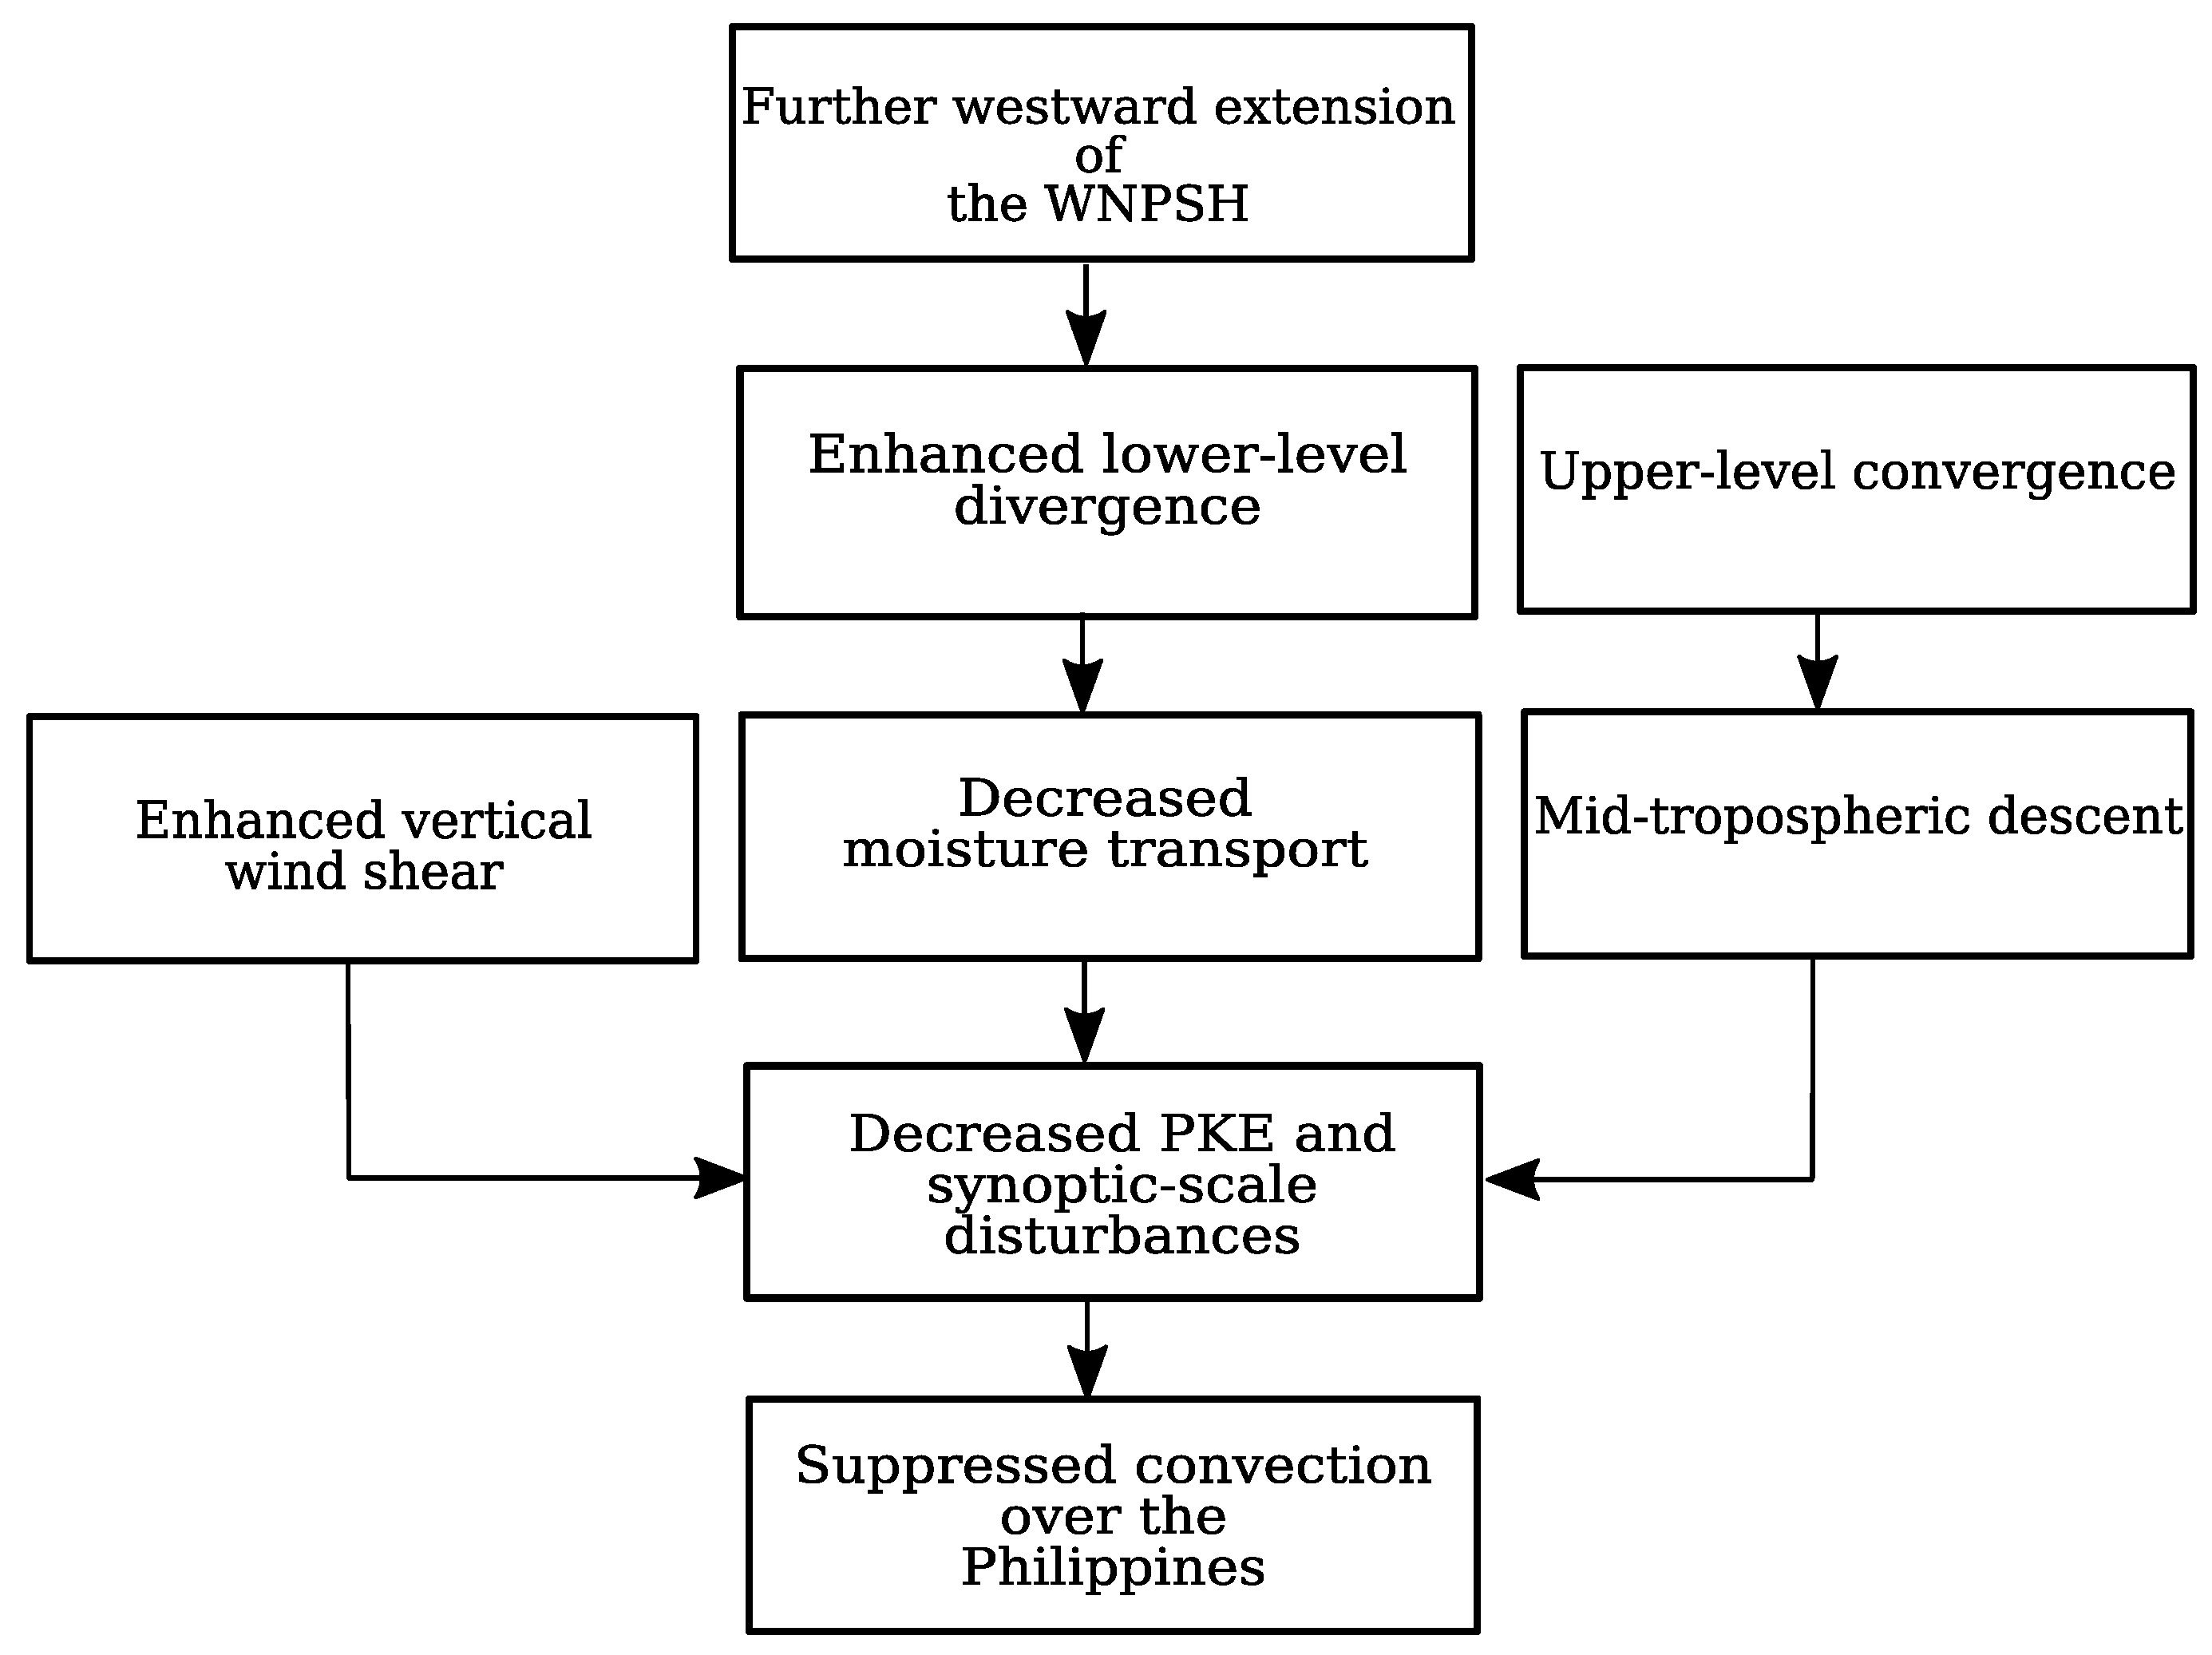
This study examined the recent interdecadal changes in the summer monsoon rainfall of the Philippines and investigated the associated changes in the large-scale conditions and TC activity. As noted earlier, many studies found a significant climate shift around the mid-1990s. In this study, we clarified whether such climate shift can be observed locally over the Philippines and examined its robustness (i.e., the same change can be depicted in the station and reanalysis datasets). We provided a schematic diagram to summarize the interdecadal changes in the large-scale conditions and TC activity, and how they contribute to the decrease in rainfall over the Philippines after the mid-1990s (Figure 10).
We found a robust interdecadal shift in rainfall in stations located over the western coast of the Philippines around 1993/1994 from early August to early September, which corresponds to the mature phase of the summer rainy season over this area. In particular, the average daily rainfall during 1994–2008 (E2; ~16 mm day−1) is significantly lower than during 1979–1993 (E1; ~22 mm day−1). We also found inconsistent climate shifts in May, June, July, and September between the rainfall data from the stations and the Climate Prediction Center Merged Analysis of Precipitation, which highlights the importance of sub-seasonal analysis in decadal-to-interdecadal climate change studies. Since this decreasing period corresponds to the peak rainy season of the country, this may partly explain the recent rainfall decrease in the Philippines [2].
We examined the plausible role of the changes in the moisture transport and TC activity in suppressing the convection during E2. The results show enhanced low-level moisture flux divergence over the Philippines, which is accompanied by weak monsoon westerlies and less moisture transport. On the other hand, the TC frequency (e.g., less landfall and formation) has decreased over the Philippines in E2. These changes can be attributed to the unfavorable background conditions for synoptic-scale disturbances, which featured a mid-tropospheric descent, enhanced vertical zonal wind shear, and a decrease in low-level relative humidity in the vicinity of the Philippines. This is further substantiated by the decrease in the perturbation kinetic energy, which can represent synoptic-scale disturbances other than TCs. We also found that the averaged TC contribution has significantly decreased by about 20% in E2. The steering flow of TCs, which is highly influenced by the western ridge of the WNPSH, has also changed in E2. In particular, the WNPSH has extended further westward in E2 that led to more landfalling TCs over southeastern China and northern Luzon Island. Additionally, the number of recurving TCs towards Japan has decreased in E2.
Some studies have shown a La Niña-like SST change over the tropical Indo-Pacific region in the recent decade, with cooling over the central eastern Pacific and warming over the western Pacific including the SCS and the equatorial Indian Ocean [41,61,62,66,79,80]. It has been suggested that the warming of the Indian Ocean can induce a lower-level anticyclonic circulation (low-level divergence) over the SCS [21,27,74,76], which is unfavorable for the development of TCs. Du et al. [76] suggested that the warming of the Indian Ocean induces a northeastward propagating warm Kelvin wave that promotes surface divergence and reduces rainfall over the WNP. On the other hand, He et al. [66] found a significant decrease in TC activity (e.g., Genesis, TC frequency, etc.) over the southern WNP (105–170° E; 5–20° N), which they also attributed to the Indo-Pacific SST warming (see their Figure 11) after the late 1990s. They suggested that the cooling of SST over the central eastern Pacific can shift the Walker cell leading to suppressed convection around 160° E, which, in turn, can induce an anticyclone to the northwest through a Rossby wave response [81] and enhanced convection over the maritime continent. We checked the spatial difference of monthly SST (E2 minus E1) and found significant warming over the equatorial Indian Ocean during E2. However, the SST warming appears throughout the summer season (i.e., from June to September; Figure S2) and the cooling of SST over the central eastern Pacific is not very clear and insignificant. The decrease in rainfall around 160° E is also not significant. It should be noted that the decrease in rainfall over the Philippines is only limited from early August to early September in E2 and we found no significant rainfall decrease in July and September. Thus, the decrease in rainfall in E2 cannot be solely explained by the changes in the SST.
In this study, we speculate that the decrease in rainfall is due to the further westward extension of the WNPSH, which resulted to the bifurcation of moisture flux, weakening of the monsoon trough, and enhanced low-level divergence over the Philippines. As noted earlier, these changes inhibit synoptic-scale disturbances. Furthermore, the low-level divergence is reinforced by the anomalous upper-level cyclonic circulation centered around 100° E and 28° N (Figure S3) [24,25]. Kwon et al. [25] suggested that this upper-level cyclonic circulation is a barotropic response from the enhanced convection over southeastern China. They also suggested that the enhanced TC activity after the mid-1990s is partly responsible for the increase in rainfall.
Some studies also found interdecadal changes in the intraseasonal variability (ISV) over the WNP [31,34], which has been associated with the changes in SST. For example, Kajikawa et al. [31] found that the periodicity of ISV over the SCS in boreal summer became shorter during 1994–2007 compared with 1979–1993. Additionally, Yamaura and Kajikawa [34] found that the boreal summer ISO activity has been enhanced after 1998/1999 with more remarkable change during August to October. These two studies suggested the possible role of the changes in the SST over the tropical Indo-Pacific region in modifying the ISV over the WNP. However, how the changes in SST contribute to the interdecadal changes in the ISV is still unclear. Numerical simulations to quantify the contribution of the SST to the changes in ISV is warranted. Additionally, the impact of the changes in ISV on the rainfall of the Philippines will be examined in future studies.
We also found significant climate shifts during early to late June (P33–P36) and during mid to late October (P59–P60) around 1993/1994 and 1999/2000, respectively. As noted earlier, Kajikawa et al. [23] suggested that the decreasing rainfall trend in June may be related to the slowing down of the northward propagating ISV. However, other factors such as the role of the changes in TC activity and the largescale circulation should also be considered. Additionally, October corresponds to the transition from the summer to the winter monsoon over the Philippines. Thus, it is also interesting to examine the interdecadal changes in the transition period of the summer monsoon in future studies. Additionally, we only found a single shift in the rainfall time series due to limited rainfall data. Whether this shift is permanent or will change in the future is another important issue to address in future studies. The performance of state-of-the-art climate models in simulating these interdecadal variabilities is also of great interest.
Supplementary Materials
The following are available online at https://www.mdpi.com/2073-4433/9/9/350/s1, Figure S1: Epochal difference (E2 minus E1) in smoothed (1–2–1 filter): (a) 850-hPa relative vorticity (×10−6 s−1); and (b) 850-hPa zonal winds (m s−1). Cross (+) markings indicate statistical significance above the 90% confidence level, Figure S2: Epochal difference (E2 minus E1) in smoothed SST (1–2–1 filter; °C) during: (a) June; (b) July; (c) August; and (d) September. Dotted areas indicate statistical significance above the 90% confidence level by t-test. The SST data came from monthly Hadley Center sea ice and sea surface temperature dataset (HadISST version 1.1; Rayner et al. [82]), Figure S3: Epochal difference (E2 minus E1) in smoothed (1–2–1 filter) 200-hPa winds. Black vectors are statistically significant above the 90% confidence level.
Author Contributions
L.M.O. proposed the topic, conceived, designed, and carried out the experimental study. J.M., H.K., T.I., E.O.C., and F.D.H. helped in the analysis and interpretation of the data provided through E.O.C. of PAGASA. All authors read and approved the final manuscript.
Funding
Lyndon Mark Olaguera and Jun Matsumoto were supported by the Tokyo Human Resources Fund at Tokyo Metropolitan University from the Tokyo Metropolitan Government. Jun Matsumoto and Hisayuki Kubota were supported by Grant-in-Aid for Scientific Research No. (25282085,15KK0030; PI HK), No. (26220202; PI JM), No. 16H04053, No. 16H03116 and Young Scientific Research No. (21684028; PI HK) funded by the Japan Society for the Promotion of Science (JSPS). This research was also supported by the Science and Technology Research Partnership for Sustainable Development (SATREPS) funded by the Japan Science and Technology Agency (JST) and Japan International Cooperation Agency (JICA), and the e-ASIA Joint Research Program, funded by JST.
Acknowledgments
The authors are grateful to Dr. Hiroshi G. Takahashi of the Department of Geography, Tokyo Metropolitan University for the useful comments and suggestions. We are also grateful to the reviewers for their constructive comments and suggestions that led to a significantly improved paper.
Conflicts of Interest
The authors declare no conflict of interest.
References
- Cayanan, E.O.; Chen, T.; Argete, J.; Ten, M.; Nilo, P. The effect of tropical cyclones on southwest monsoon rainfall in the Philippines. J. Meteorol. Soc. Jpn. 2011, 89, 123–139. [Google Scholar] [CrossRef]
- Cruz, F.T.; Narisma, G.T.; Villafuerte, M.Q.; Chua, K.C.; Olaguera, L.M. A climatological analysis of the southwest monsoon rainfall in the Philippines. Atmos. Res. 2013, 122, 609–616. [Google Scholar] [CrossRef]
- Lyon, B.; Camargo, S.J. The seasonally varying influence of ENSO on rainfall and tropical cyclone activity in the Philippines. Clim. Dyn. 2009, 32, 125–141. [Google Scholar] [CrossRef]
- Matsumoto, J. The seasonal changes in Asian Australian monsoon regions. J. Meteorol. Soc. Jpn. 1992, 70, 257–273. [Google Scholar] [CrossRef]
- Matsumoto, J. Seasonal transition of summer rainy season over Indochina and adjacent monsoon region. Adv. Atmos. Sci. 1997, 14, 231–245. [Google Scholar] [CrossRef]
- Pullen, J.; Gordon, A.L.; Flatau, M.; Doyle, J.D.; Villanoy, C.; Cabrera, O. Multiscale influences on extreme winter rainfall in the Philippines. J. Geophys. Res. Atmos. 2015, 120, 3292–3309. [Google Scholar] [CrossRef] [Green Version]
- Akasaka, I. Interannual variations in seasonal march of rainfall in the Philippines. Int. J. Climatol. 2010, 30, 1301–1314. [Google Scholar] [CrossRef]
- Kintanar, R.L. Climate of the Philippines; PAGASA: Quezon City, Philippines, 1984.
- Cinco, T.A.; de Guzman, R.G.; Hilario, F.D.; Wilson, D.M. Long-term trends and extremes in observed daily precipitation and near surface air temperature in the Philippines for the period 1951–2010. Atmos. Res. 2014, 145, 12–26. [Google Scholar] [CrossRef]
- Ding, Y.; Wang, Z.; Sun, Y. Interdecadal variation of summer precipitation in east China and its association with decreasing Asian summer monsoon. Part I: Observed evidences. Int. J. Climatol. 2008, 28, 1139–1161. [Google Scholar] [CrossRef]
- Inoue, T.; Matsumoto, J. Abrupt climate changes observed in late August over central Japan between 1983 and 1984. J. Clim. 2007, 20, 4957–4967. [Google Scholar] [CrossRef]
- Villafuerte, M.Q.; Matsumoto, J.; Akasaka, I.; Takahashi, H.G.; Kubota, H.; Cinco, T.A. Long-term trends and variability of rainfall extremes in the Philippines. Atmos. Res. 2014, 137, 1–13. [Google Scholar] [CrossRef]
- Ha, K.J.; Yun, K.S.; Jhun, J.G.; Li, J. Circulation changes associated with the interdecadal shift of Korean August rainfall around late 1960s. J. Geophys. Res. 2009, 114. [Google Scholar] [CrossRef] [Green Version]
- Nitta, T.; Yamada, S. Recent warming of the tropical sea surface temperature and its relationship to the northern hemisphere circulation. J. Meteorol. Soc. Jpn. 1989, 67, 375–383. [Google Scholar] [CrossRef]
- Wang, B. Interdecadal change in El Niño onset in the last four decades. J. Clim. 1995, 8, 267–285. [Google Scholar] [CrossRef]
- Wang, H.J. Weakening of the Asian monsoon circulation after the end of 1970s. Adv. Atmos. Sci. 2001, 18, 376–386. [Google Scholar] [CrossRef]
- Nitta, T. Convective activities in the tropical western Pacific and their impact on the northern hemisphere summer circulation. J. Meteorol. Soc. Jpn. 1987, 65, 373–393. [Google Scholar] [CrossRef]
- Gong, D.Y.; Ho, C.H. Shift in the summer rainfall over the Yangtze River valley in the late 1970s. Geophys. Res. Lett. 2002, 29. [Google Scholar] [CrossRef]
- Fu, J.J.; Li, S.L.; Luo, D.H. Impact of global SST on decadal shift of East Asian summer climate. Adv. Atmos. Sci. 2009, 26, 192–201. [Google Scholar] [CrossRef] [Green Version]
- Ding, Y.; Sun, Y.; Wang, Z.; Zhu, Y.; Song, Y. Interdecadal variation of summer precipitation in east China and its association with decreasing Asian summer monsoon. Part II: Possible causes. Int. J. Climatol. 2009, 29, 1926–1944. [Google Scholar] [CrossRef]
- Wang, L.; Huang, R.; Wu, R. Interdecadal variability in tropical cyclone frequency over the South China Sea and its association with the Indian Ocean sea surface temperature. Geophys. Res. Lett. 2013, 40, 768–771. [Google Scholar] [CrossRef] [Green Version]
- Kajikawa, Y.; Wang, B. Interdecadal change of the South China Sea summer monsoon onset. J. Clim. 2012, 25, 3207–3218. [Google Scholar] [CrossRef]
- Kajikawa, Y.; Yasunari, T.; Yoshida, S.; Fujinami, H. Advanced Asian summer monsoon onset in recent decades. Geophys. Res. Lett. 2012, 39. [Google Scholar] [CrossRef] [Green Version]
- Kwon, M.; Jhun, J.G.; Wang, B.; An, S.I.; Kug, J.S. Decadal change in relationship between East Asian and WNP summer monsoons. Geophys. Res. Lett. 2005, 32. [Google Scholar] [CrossRef]
- Kwon, M.; Jhun, J.G.; Ha, K.J. Decadal change in East Asian summer monsoon circulation in the mid-1990s. Geophys. Res. Lett. 2007, 34. [Google Scholar] [CrossRef]
- Liu, Y.; Huang, G.; Huang, R. Interdecadal variability of summer rainfall in eastern China detected by Lepage test. Theor. Appl. Climatol. 2011, 106, 481–488. [Google Scholar] [CrossRef]
- Wu, R.; Wen, Z.; Yang, S.; Li, Y. An interdecadal change in Southern China summer rainfall around 1992/1993. J. Clim. 2010, 23, 2389–2403. [Google Scholar] [CrossRef]
- Zhu, Y.; Wang, H.; Zhou, W.; Ma, J. Recent changes in the summer precipitation pattern in East Asia and the background circulation. Clim. Dyn. 2011, 36, 1463–1473. [Google Scholar] [CrossRef]
- Kim, J.H.; Wu, C.C.; Sui, C.H.; Ho, C.H. Tropical cyclone contribution to interdecadal change in summer rainfall over South China in the early 1990s. Terr. Atmos. Ocean. Sci. 2012, 23, 49–58. [Google Scholar] [CrossRef]
- Chen, J.; Wu, R.; Wen, Z. Contribution of the South China Sea tropical cyclones to an increase in Southern China rainfall around 1993. Adv. Atmos. Sci. 2012, 29, 585–598. [Google Scholar] [CrossRef]
- Kajikawa, Y.; Yasunari, T.; Wang, B. Decadal change in intraseasonal variability over the South China Sea. Geophys. Res. Lett. 2009, 36. [Google Scholar] [CrossRef]
- Kim, W.M.; Jhun, J.G.; Ha, K.J.; Kimoto, M. Decadal changes in climatological intraseasonal fluctuation of subseasonal evolution of summer precipitation over the Korean Peninsula in the mid-1990s. Adv. Atmos. Sci. 2011, 28, 591–600. [Google Scholar] [CrossRef]
- Luo, X.; Zhang, Y. Interdecadal change in the seasonality of rainfall variation in South China. Theor. Appl. Climatol. 2015, 119, 1–11. [Google Scholar] [CrossRef]
- Yamaura, T.; Kajikawa, Y. Decadal change in the boreal summer intraseasonal oscillation. Clim. Dyn. 2016, 45, 3003–3014. [Google Scholar] [CrossRef]
- Takahashi, H.; Yasunari, T. Decreasing trend in rainfall over Indochina during the late summer monsoon: Impact of tropical cyclones. J. Meteorol. Soc. Jpn. 2008, 86, 429–438. [Google Scholar] [CrossRef]
- Takahashi, H. Long-term changes in rainfall and tropical cyclone activity over South and Southeast Asia. Adv. Geosci. 2011, 30, 17–22. [Google Scholar] [CrossRef] [Green Version]
- Kubota, H.; Shirooka, R.; Matsumoto, J.; Cayanan, E.O.; Hilario, F.D. Tropical cyclone influence on the long-term variability of the Philippines summer monsoon onset. Prog. Earth Planet. Sci. 2017, 4, 1–12. [Google Scholar] [CrossRef]
- Chen, T.C.; Tsay, J.D.; Matsumoto, J.; Alpert, J. Impact of summer monsoon westerlies in the South China Sea tropical cyclone genesis in May. Weather Forecast. 2017, 32, 925–947. [Google Scholar] [CrossRef]
- Lau, K.M.; Yang, S. Climatology and interannual variability of the southeast Asian summer monsoon. Adv. Atmos. Sci. 1997, 14, 141–162. [Google Scholar] [CrossRef]
- Yuan, F.; Chen, W. Roles of the tropical convective activities over different regions in the earlier onset of the South China Sea summer monsoon after 1993. Theor. Appl. Climatol. 2013, 13, 175–185. [Google Scholar] [CrossRef]
- Xiang, B.; Wang, B. Mechanisms for the advanced Asian summer monsoon onset since the mid-to-late 1990s. J. Clim. 2013, 26, 1993–2009. [Google Scholar] [CrossRef]
- Xu, S.; Wang, B. Enhanced western North Pacific tropical cyclone activity in May in recent years. Clim. Dyn. 2014, 42, 2555–2563. [Google Scholar] [CrossRef]
- Kanamitsu, M.; Ebisuzaki, W.; Woollen, J.; Yan, S.K.; Hnilo, J.J.; Fiorino, M.; Potter, G.L. NCEP-DOE AMIP-II Reanalysis (R-2). Bull Amer. Meteor. Soc. 2002, 83, 1631–1643. [Google Scholar] [CrossRef]
- Kobayashi, S.; Ota, Y.; Harada, Y.; Ebita, A.; Moriya, M.; Onoda, H.; Onogi, K.; Kamahori, H.; Kobayashi, C.; Endo, H.; Miyaoka, H.; Takahashi, K. The JRA-55 Reanalysis: General specifications and basic characteristics. J. Meteorol. Soc. Jpn. 2015, 93, 5–48. [Google Scholar] [CrossRef]
- Xie, P.; Arkin, P. Global precipitation: A 17-year monthly analysis based on gauge observations, satellite estimates, and numerical model outputs. Bull. Am. Meteorol. Soc. 1997, 78, 2539–2558. [Google Scholar] [CrossRef]
- Fudeyasu, H.; Iizuka, S.; Matsuura, T. Impact of ENSO on landfall characteristics of tropical cyclones over the western North Pacific during summer monsoon season. Geophys. Res. Lett. 2006, 33. [Google Scholar] [CrossRef]
- Wang, B.; Chan, J.C. How strong ENSO events affect tropical storm activity over the western North Pacific. J. Clim. 2002, 13, 1643–1658. [Google Scholar] [CrossRef]
- Murakami, T.; Matsumoto, J. Summer monsoon over the Asian Continent and Western North Pacific. J. Meteorol. Soc. Jpn. 1994, 72, 719–745. [Google Scholar] [CrossRef]
- Bates, B.C.; Chandler, R.E.; Browman, A.W. Trend estimation and change point detection in individual climatic series using flexible regression methods. J. Geophys. Res. 2012, 117. [Google Scholar] [CrossRef] [Green Version]
- Ha, K.J.; Ha, E. Climatic change and interannual fluctuations in the long-term record of monthly precipitation for Seoul. Int. J. Climatol. 2006, 26, 607–618. [Google Scholar] [CrossRef] [Green Version]
- Mallakpour, I.; Villarini, G.A. simulation study to examine the sensitivity of the Pettitt test to detect abrupt changes in mean. Hydrolog. Sci. J. 2016, 61, 245–254. [Google Scholar] [CrossRef]
- Salarijazi, M.; Akhond-Ali, A.M.; Adib, A.; Daneshkhah, A. Trend and change-point detection for the annual stream-flow series of the Karun River at the Ahvaz hydrometric station. Afr. J. Agric. Res. 2012, 32, 4540–4552. [Google Scholar] [CrossRef]
- Stone, R.J. Comments on “Observed trends in indices of daily temperature extremes in south America 1960–2000”. J. Clim. 2010, 24, 2880–2883. [Google Scholar] [CrossRef]
- Vincent, L.A.; Zhang, X.; Wang, X.L. Reply to the comments on “Observed trends in indices of daily temperature extremes in south America 1960–2000”. J. Clim. 2011, 24, 2884–2887. [Google Scholar] [CrossRef]
- Yeh, C.F.; Wang, J.; Yeh, H.F.; Lee, C.H. Spatial and temporal streamflow trends in northern Taiwan. Water 2015, 7, 634–651. [Google Scholar] [CrossRef]
- Pettitt, A.N. A non-parametric approach to the change-point problem. J. Roy. Stat. Soc. 1979, 28, 126–135. [Google Scholar] [CrossRef]
- Wilks, D.S. Statistical Methods in the Atmospheric Sciences, 3rd ed.; Academic Press: Oxford, UK; Waltham, MA, USA, 2011; pp. 143–144. ISBN 978-0-12-385022-5. [Google Scholar]
- Cinco, T.A.; de Guzman, R.; Ortiz, A.M.; Delfina, R.J.; Lasco, R.D.; Hilario, F.D.; Juanillo, E.L.; Barba, R.; Ares, E.D. Observed trends and impacts of tropical cyclones in the Philippines. Int. J. Climatol. 2016, 36, 4638–4650. [Google Scholar] [CrossRef]
- Wang, B.; LinHo. Rainy season of the Asian-Pacific summer monsoon. J. Clim. 2002, 15, 386–398. [Google Scholar] [CrossRef]
- Wang, B.; Xu, X. Northern Hemisphere summer monsoon singularities and climatological intraseasonal oscillation. J. Clim. 1997, 10, 1071–1085. [Google Scholar] [CrossRef]
- Choi, J.W.; Cha, Y.; Kim, H.D. Interdecadal variation of precipitation days in August in the Korean Peninsula. Dyn. Atmos. Oceans 2017, 77, 74–88. [Google Scholar] [CrossRef]
- Nguyen-Le, D.; Matsumoto, J.; Ngo-Duc, T. Climatological onset date of summer monsoon in Vietnam. Int. J. Climatol. 2014, 34, 3237–3250. [Google Scholar] [CrossRef]
- Okada, Y.; Yamazaki, K. Climatological evolution of the Okinawa Baiu and differences in large-scale features during May and June. J. Clim. 2012, 25, 6287–6303. [Google Scholar] [CrossRef]
- Kubota, H.; Wang, B. How much do tropical cyclones affect seasonal and interannual rainfall variability over the western North Pacific? J. Clim. 2009, 22, 5495–5510. [Google Scholar] [CrossRef]
- Bagtasa, G. Contribution of tropical cyclones to rainfall in the Philippines. J. Clim. 2017, 30, 3621–3633. [Google Scholar] [CrossRef]
- He, H.; Yang, J.; Gong, D.; Mao, R.; Wang, Y.; Gao, M. Decadal changes in tropical cyclone activity over the western North Pacific in the late 1990s. Clim. Dyn. 2015, 45, 3317–3329. [Google Scholar] [CrossRef]
- Saunders, M.A.; Chandler, R.E.; Merchant, C.J.; Roberts, F.P. Atlantic hurricanes and NW Pacific typhoon: ENSO spatial impacts on occurrence and landfall. Geophys. Res. Lett. 2000, 27, 1147–1150. [Google Scholar] [CrossRef]
- Zhang, W.; Graf, H.F.; Leung, Y.; Herzog, M. Different El Niño types and tropical cyclone landfall in East Asia. J. Clim. 2012, 25, 6510–6523. [Google Scholar] [CrossRef]
- Choi, K.S.; Wu, C.C.; Cha, E.J. Change of tropical cyclone activity by Pacific-Japan teleconnection pattern in the western North Pacific. J. Geophys. Res. 2010, 115. [Google Scholar] [CrossRef] [Green Version]
- Hirata, H.; Kawamura, R. Scale interaction between typhoons and the North Pacific subtropical high and associated remote effects during the Baiu/Mei-yu season. J. Geophys. Res. 2014, 119, 5157–5170. [Google Scholar] [CrossRef]
- Yang, L.; Du, Y.; Wang, C.; Wang, X. Impact of intraseasonal oscillation on the tropical cyclone track in the South China Sea. Clim. Dyn. 2015, 44, 1505–1519. [Google Scholar] [CrossRef]
- Ha, Y.; Zhong, Z. Decadal change in tropical cyclone activity over the South China Sea around 2002/03. J. Clim. 2015, 28, 5935–5951. [Google Scholar] [CrossRef]
- Huang, R.; Sun, F. Impacts of tropical western Pacific on the East Asian summer monsoon. J. Meteorol. Soc. Jpn. 1992, 70, 243–256. [Google Scholar] [CrossRef]
- Zhou, B.; Cui, X. Hadley circulation signal in the tropical cyclone frequency over the western North Pacific. J. Geophys. Res. 2008, 113. [Google Scholar] [CrossRef]
- Kubota, H.; Kosaka, Y.; Xie, S.P. A 117-year long index of the Pacific-Japan pattern with application to interdecadal variability. Int. J. Climatol. 2015, 36, 1575–1589. [Google Scholar] [CrossRef] [Green Version]
- Du, Y.; Yang, L.; Xie, S.P. Tropical Indian Ocean influence on northwest Pacific tropical cyclones in summer following strong El Nino. J. Clim. 2011, 24, 315–322. [Google Scholar] [CrossRef]
- Maloney, E.D.; Dickinson, M.J. The intraseasonal oscillation and the energetics of summertime tropical western North Pacific synoptic-scale disturbances. J. Atmos. Sci. 2003, 60, 2153–2168. [Google Scholar] [CrossRef]
- Takahashi, H.; Yasunari, T. A climatological monsoon break in rainfall over Indochina- A singularity in the seasonal march of the Asian summer monsoon. J. Clim. 2006, 19, 1545–1556. [Google Scholar] [CrossRef]
- Xu, K.; Lu, R. Decadal change of the western North Pacific summer monsoon break around 2002/2003. J. Clim. 2018, 31, 177–193. [Google Scholar] [CrossRef]
- Zhang, L.; Karnauskas, K.B. The role of tropical interbasin SST gradients in forcing Walker circulation trends. J. Clim. 2017, 30, 499–508. [Google Scholar] [CrossRef]
- Gill, A.E. Some simple solutions for heat-induced tropical circulation. Q. J. Royal Meteorol. Soc. 1980, 106, 447–462. [Google Scholar] [CrossRef]
- Rayner, N.A.; Parker, D.E.; Horton, E.B.; Folland, C.K.; Alexander, L.V.; Rowell, D.P.; Kent, E.C.; Kaplan, A. Global analysis of sea surface temperature, sea ice, and night marine air temperature since the late nineteenth century. J. Geophys. Res. 2003, 108. [Google Scholar] [CrossRef]
Figure 1.
Location of the seven meteorological stations of the Philippine Atmospheric, Geophysical and Astronomical Services Administration (PAGASA; blue circles), Climate Prediction Center Merged Precipitation Analysis (CMAP) grid points (+ markings), and the topography of the Philippines above 250 m (grey contour lines). The contour interval of the topography is 250 m. The red triangles indicate the nearest five CMAP grid points to the location of the PAGASA stations.
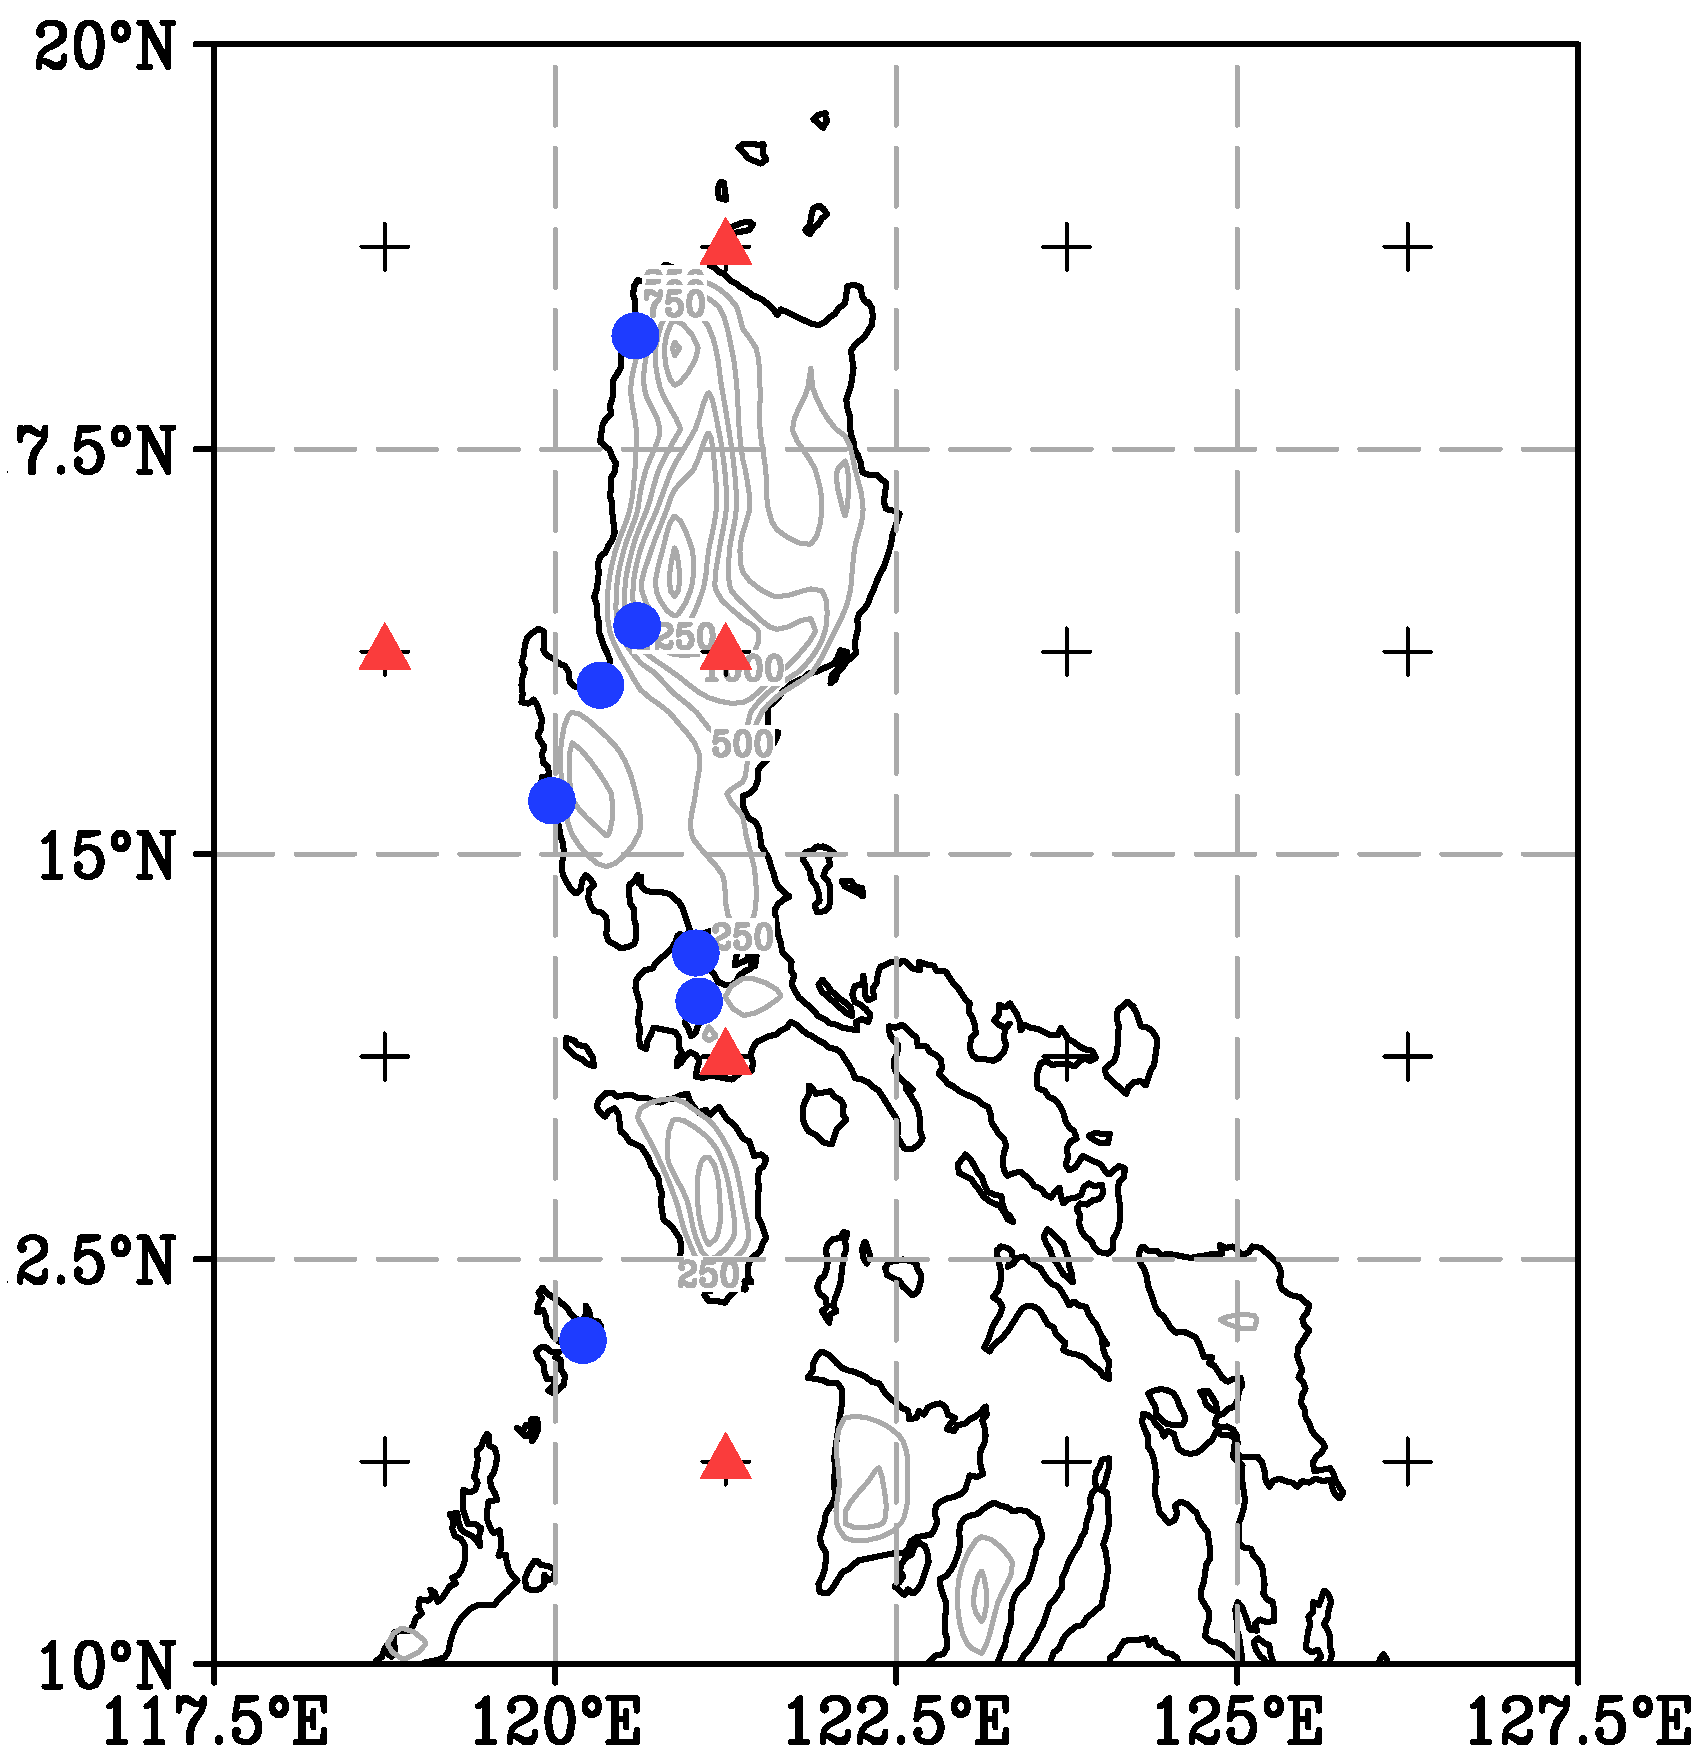
Figure 2.
Rainfall distribution (mm day−1) from 1979–2008 averaged across the: (a) seven PAGASA stations; and (b) five nearest CMAP grid points to the PAGASA stations. The rainfall distributions are smoothed by 1–2–1 filter in both x- and y-axis. The two vertical lines in (a,b) indicates P25 (start of May) and P29 (climatological onset based on Akasaka [7]), respectively. The horizontal line in (a,b) indicates 1994.
Figure 3.
(a) Smoothed (1–2–1 filter) pentad-mean rainfall between E1 (1979–1993) and E2 (1994–2008) averaged across the seven PAGASA stations on the western coast of the Philippines; and (b) their epochal difference. Shaded pentads in (a) and grey bars in (b) indicate statistically significant difference above the 95% confidence level using the t-test.
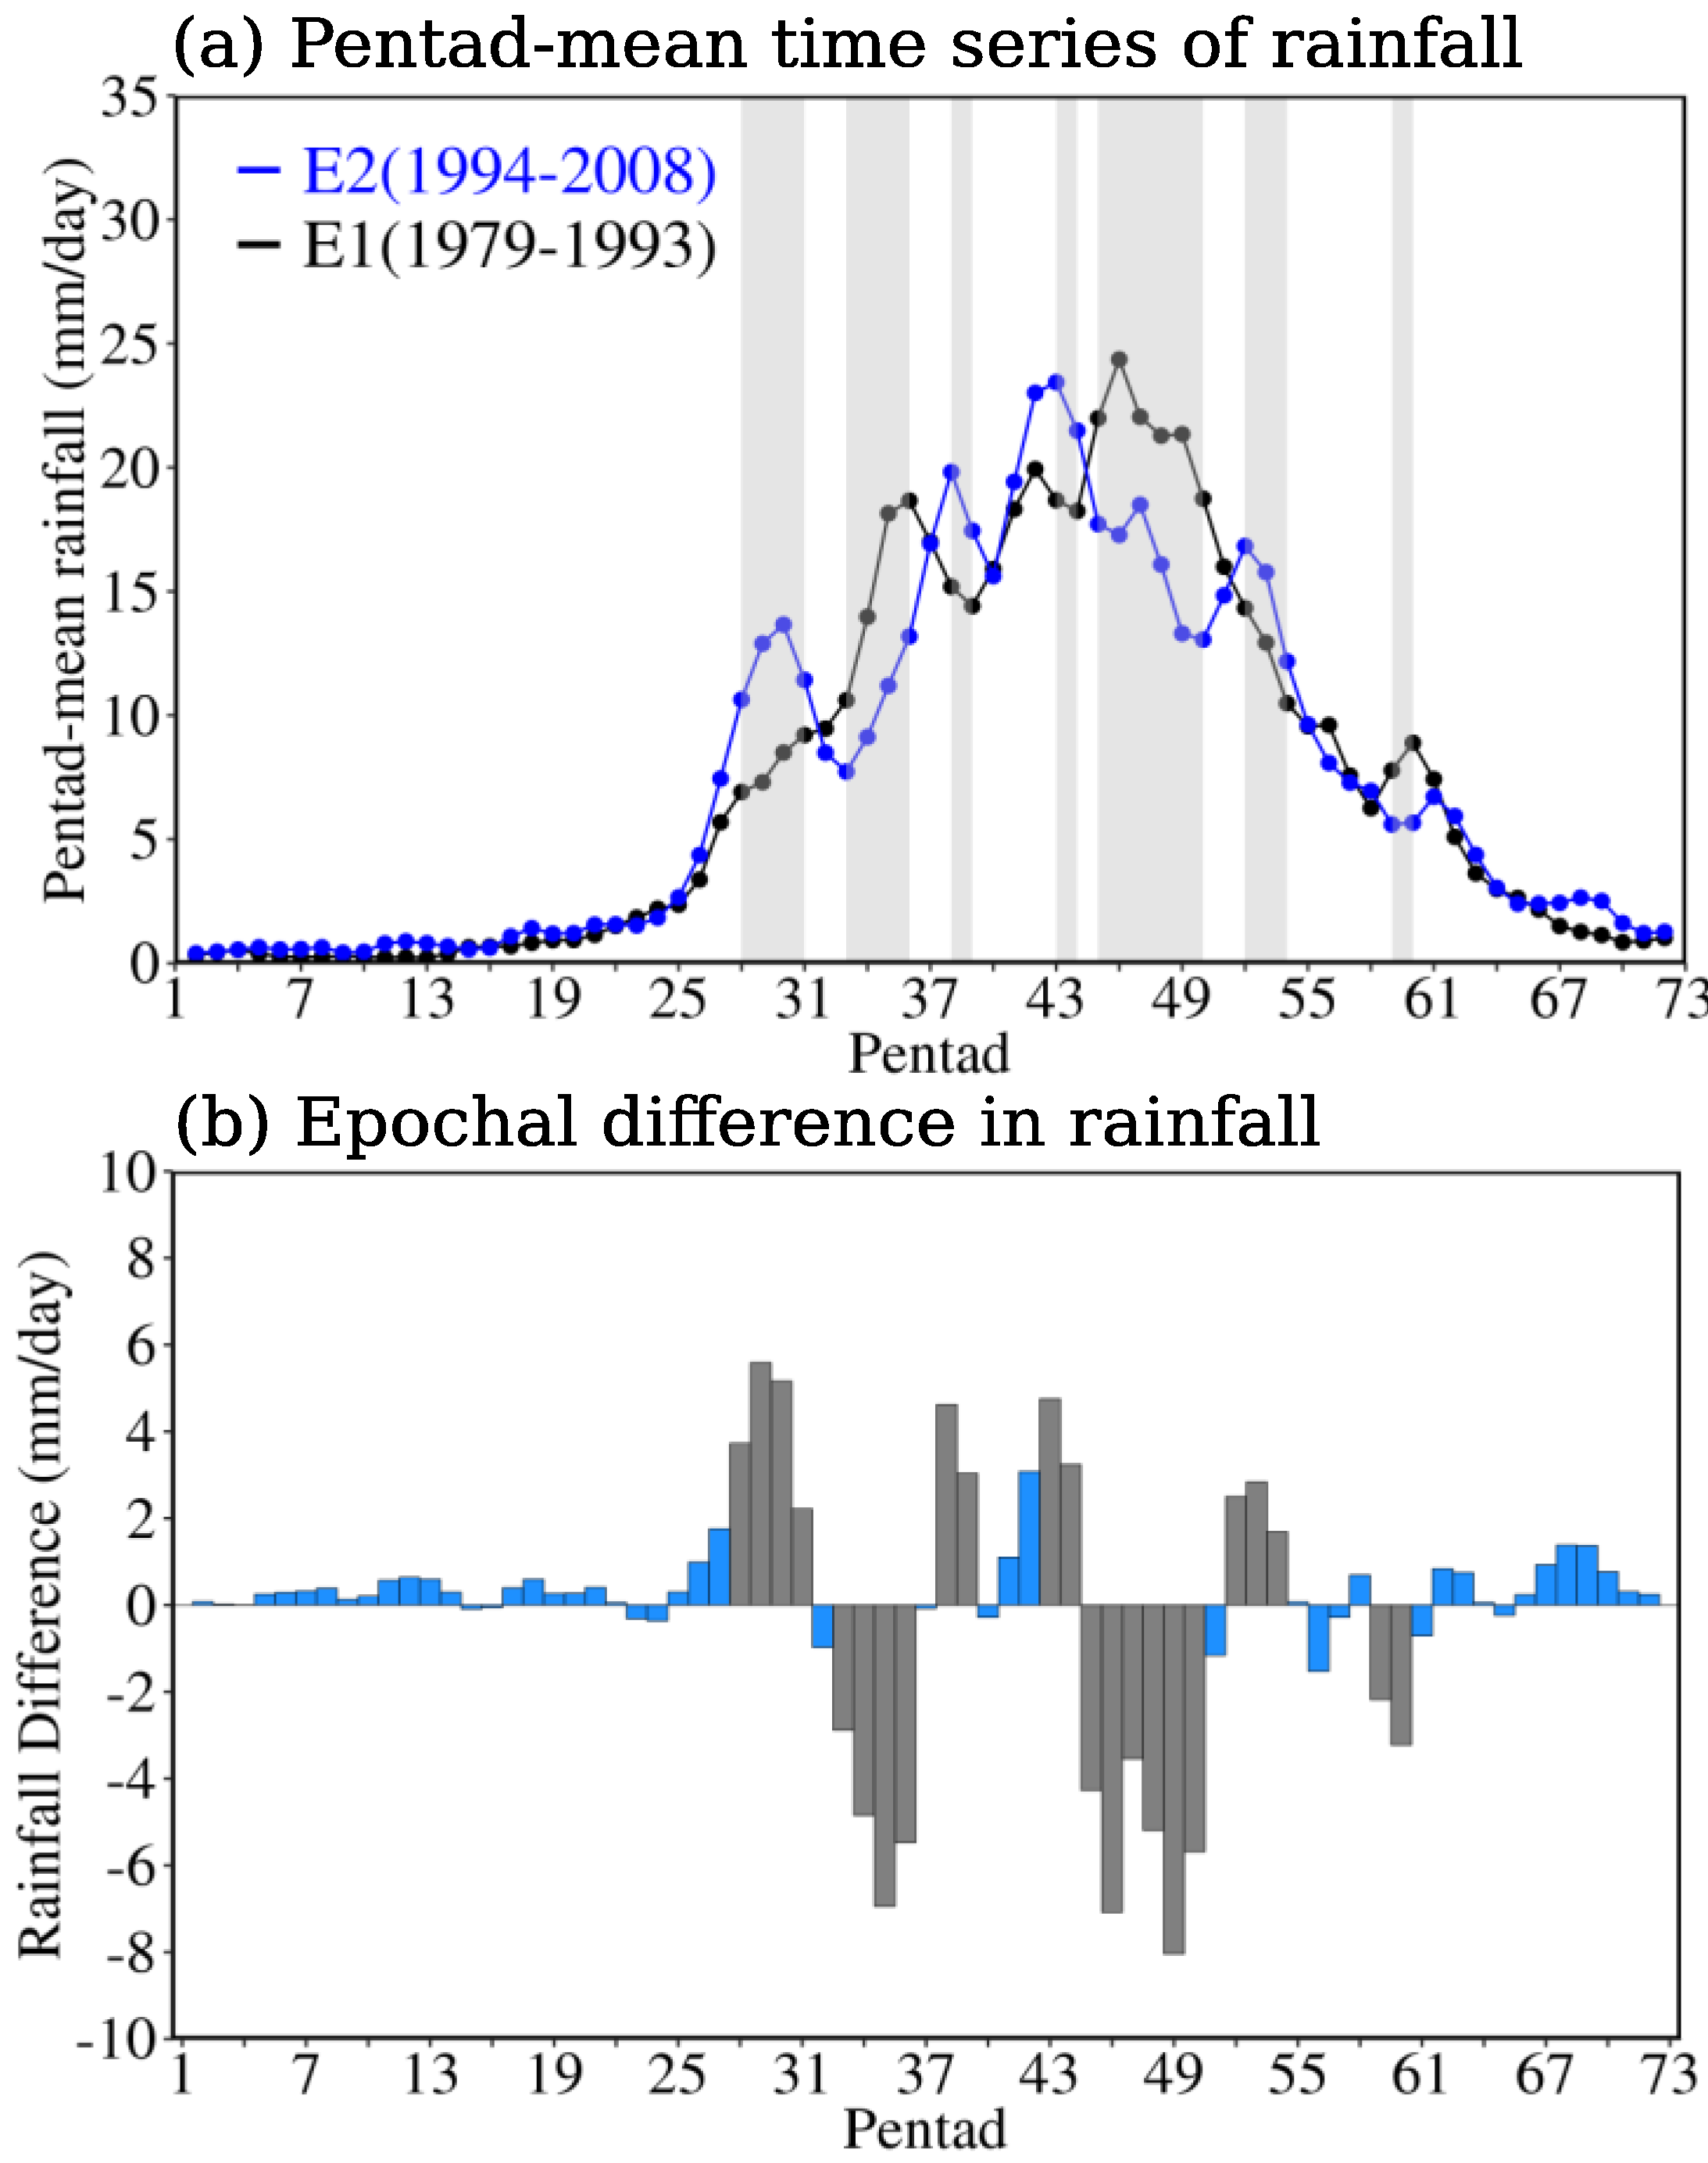
Figure 4.
(a) Pentad-mean rainfall time series for a typical year (1992; black line; mm day−1) and its equivalent smoothed time series (blue line) obtained by adding the first four Fourier harmonics of the original time series; and (b) time series of annual peak pentads, defined as the maximum of the smoothed time series, from 1979 to 2008.

Figure 5.
Epochal difference (E2 minus E1) in the spatially smoothed (1–2–1 filter; both longitudinal and latitudinal direction) CMAP rainfall (mm day−1) during P45–P50. Cross (+) markings indicate statistical significance above the 90% confidence level.
Figure 5.
Epochal difference (E2 minus E1) in the spatially smoothed (1–2–1 filter; both longitudinal and latitudinal direction) CMAP rainfall (mm day−1) during P45–P50. Cross (+) markings indicate statistical significance above the 90% confidence level.
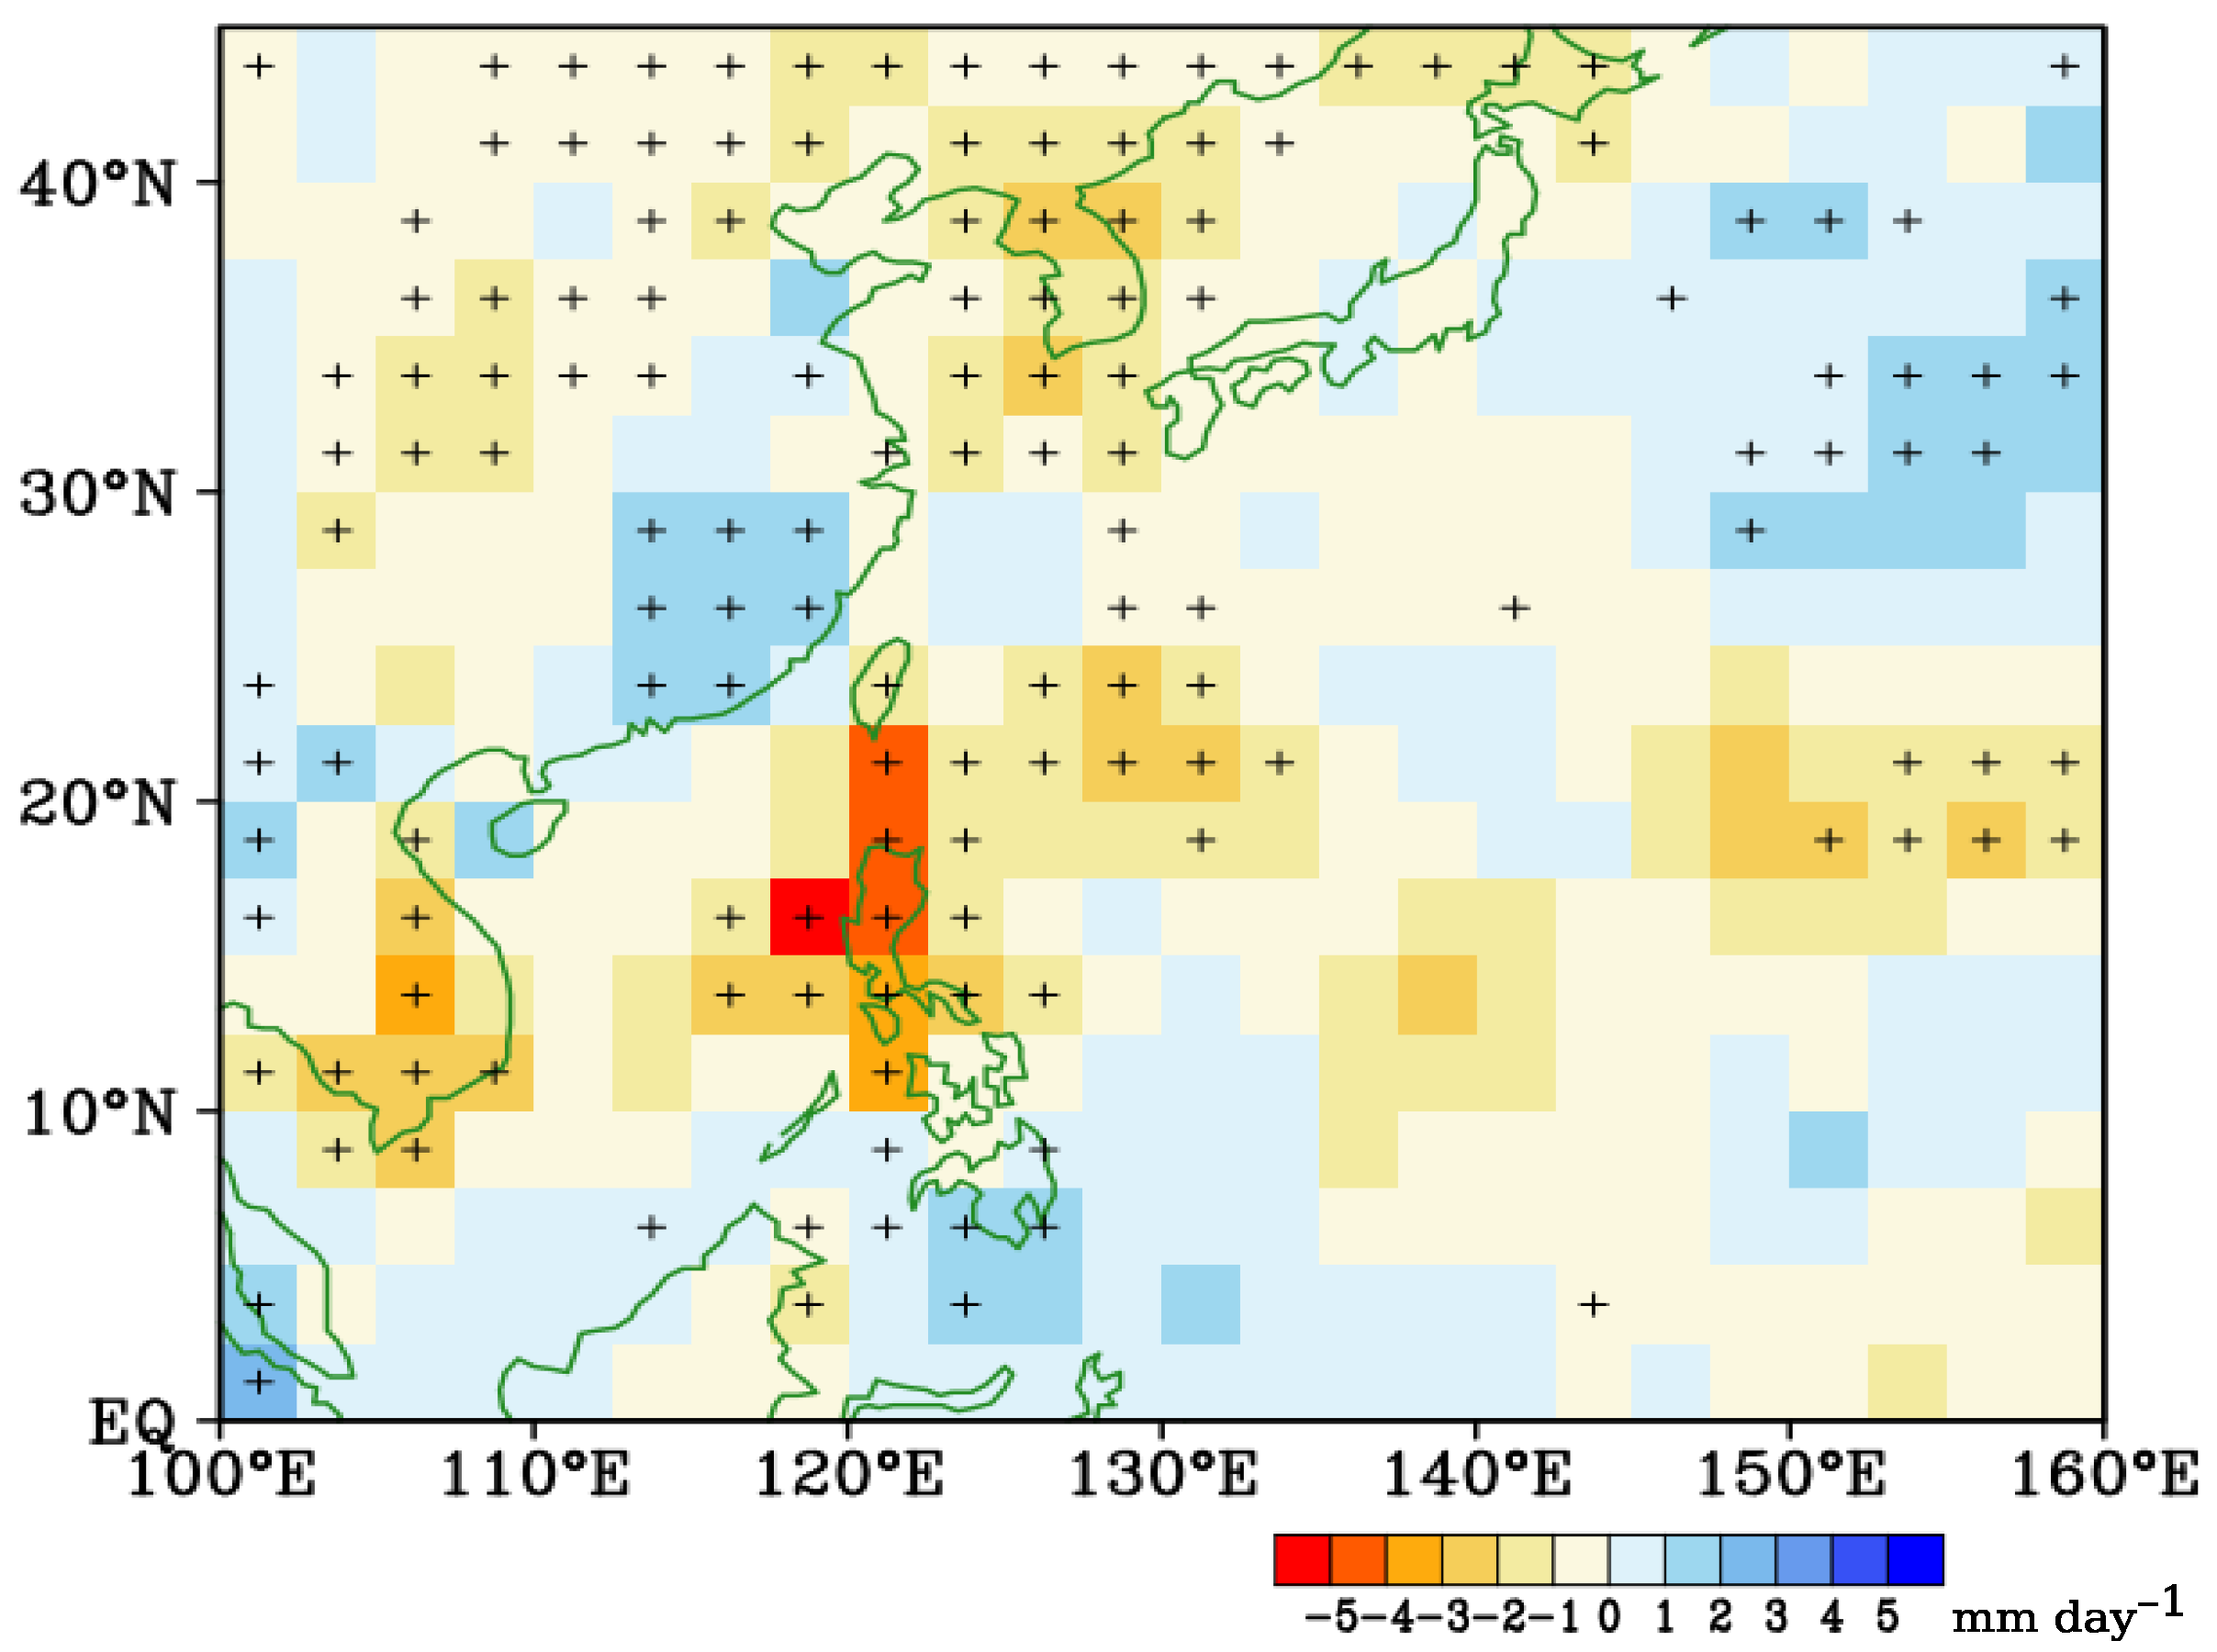
Figure 6.
Time series of area-averaged vertically integrated moisture flux divergence (kg m−2 s−1) over Luzon Island (117.5–122.5° E; 10–20° N) during P45–P50. The blue (red) line is the unfiltered (1–2–1 filtered) time series. Dashed horizontal lines indicate the epochal means.
Figure 6.
Time series of area-averaged vertically integrated moisture flux divergence (kg m−2 s−1) over Luzon Island (117.5–122.5° E; 10–20° N) during P45–P50. The blue (red) line is the unfiltered (1–2–1 filtered) time series. Dashed horizontal lines indicate the epochal means.
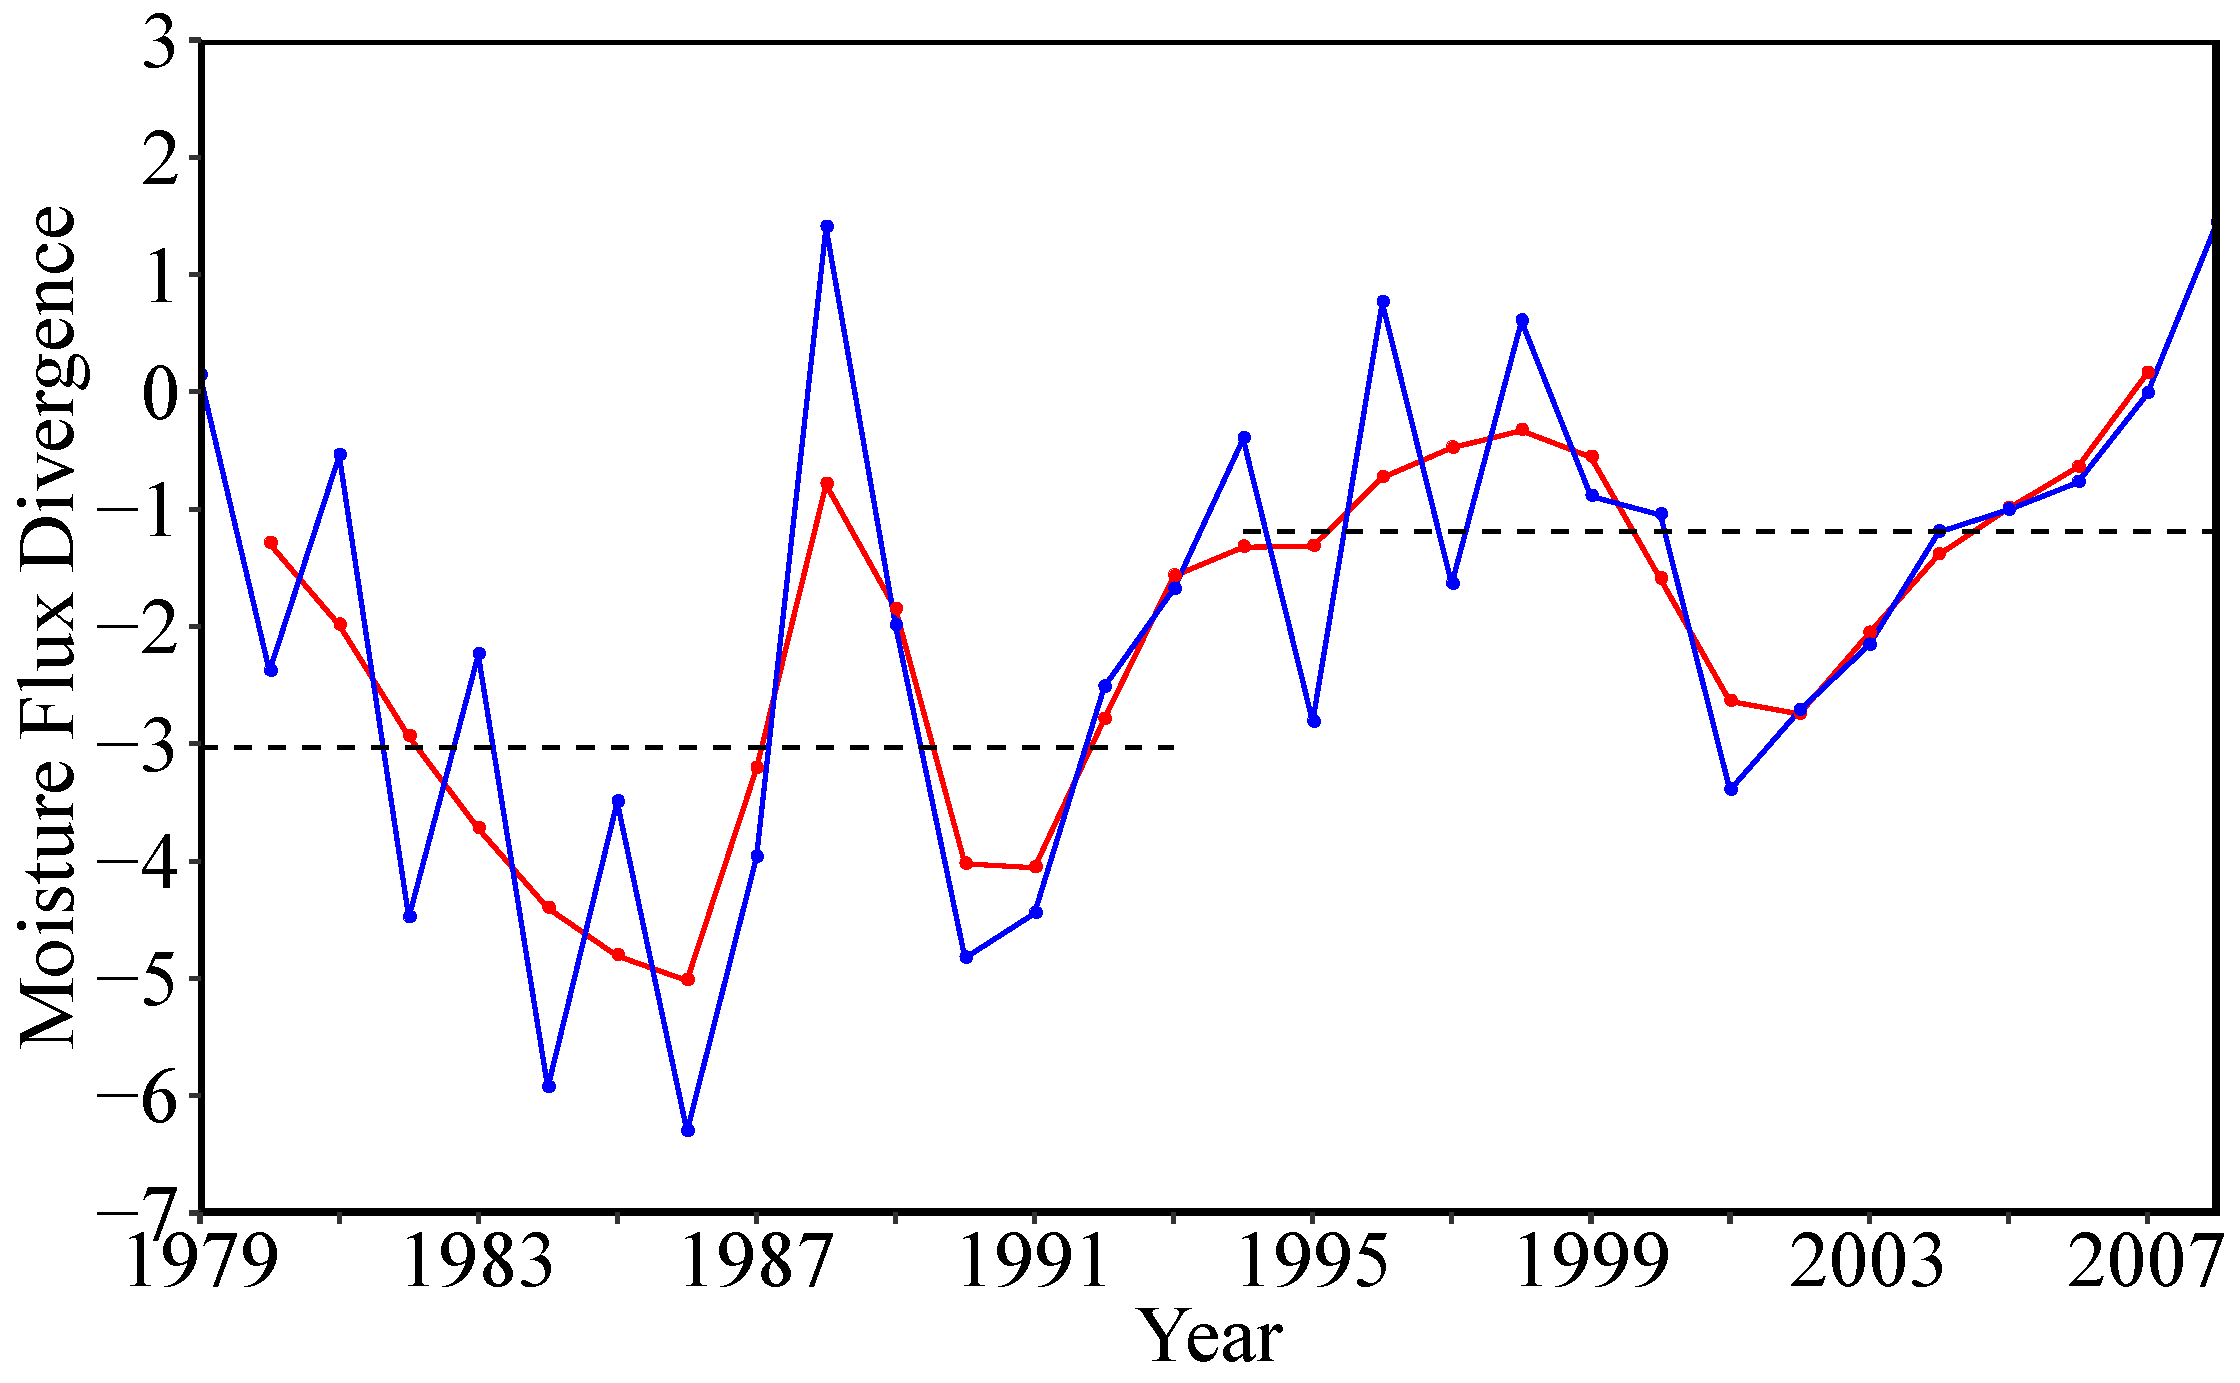
Figure 7.
Smoothed (1–2–1 filter) vertically integrated moisture flux (vectors; kg m−1 s−1), moisture flux divergence (kg m−2 s−1; shading), and 850-hPa geopotential height (contours; m) for P45–P50 during: (a) E1 (1979–1993); (b) E2 (1994–2008); and their (c) epochal difference (E2 minus E1). (a–c) The contour interval is 10 m. Shaded areas, black arrows, and purple contours in (c) indicate statistical significance above the 90% confidence level. The scale of the vectors is indicated on the lower-left corner of each figure.

Figure 8.
Tropical cyclone track frequency (per year) in P45–P50 interpolated onto a 5 × 5° grid for: (a) E1 (1979–1993); and (b) E2 (1994–2008) based on JTWC track dataset. As in (a) but for TC tracks and location of 5870-m contour line of the 500-hPa geopotential height (dashed blue line) from: (c) E1 and (d) E2. Dashed box in (a,b) indicates the Philippine Area of Responsibility (PAR; 115° to 135° E and 5° to 25° N). The genesis locations in (c,d) are indicated by the red markings.
Figure 9.
As in Fig. 5 but for: (a) 500-hPa vertical velocity (×10−2 m s−1); (b) 700-hPa relative humidity; (c) vertical zonal wind shear (m s−1; U200hPa minus U850hPa); and (d) 850-hPa perturbation kinetic energy (m2 s−2). Cross (+) markings indicate statistical significance above the 90% confidence level.
Figure 10.
Schematic diagram showing the possible mechanism leading to the decrease in rainfall over the Philippines from early August to early September occurring in the mid-1990s (1993/1994).
Figure 10.
Schematic diagram showing the possible mechanism leading to the decrease in rainfall over the Philippines from early August to early September occurring in the mid-1990s (1993/1994).

Table 1.
Summary of change points based on the Pettitt test between the CMAP and PAGASA rainfall datasets.
Table 1.
Summary of change points based on the Pettitt test between the CMAP and PAGASA rainfall datasets.
| PERIOD | CMAP | PAGASA |
|---|---|---|
| P28–P31 | 1986/1987 | 1995/1996 ** |
| P33–P36 | 1992/1993 ** | 1993/1994 ** |
| P38–P39 | 1998/1999 | 1998/1999 * |
| P43–P44 | 1989/1990 * | 1993/1994 ** |
| P45–P50 | 1993/1994 *** | 1993/1994 ** |
| P52–P54 | 1990/1991 | 1990/1991 ** |
| P59–P60 | 1999/2000 ** | 1999/2000 *** |
* Significant at the 90% confidence level; ** significant at the 95% confidence level; *** significant at the 99% confidence level.
Table 2.
The seven-station averaged PTOTAL, PTC, and PNOTC for P45–P50 (9 August–7 September) during E1 (1979–1993) and E2 (1994–2008).
Table 2.
The seven-station averaged PTOTAL, PTC, and PNOTC for P45–P50 (9 August–7 September) during E1 (1979–1993) and E2 (1994–2008).
| E1 (1979–1993) | E2 (1994–2008) | Average | |
|---|---|---|---|
| PTOTAL (mm) | 651.00 | 464.11 | 557.55 |
| PTC (mm) | 352.03 | 160.42 | 256.22 |
| PNOTC (mm) | 298.97 | 303.69 | 301.33 |
© 2018 by the authors. Licensee MDPI, Basel, Switzerland. This article is an open access article distributed under the terms and conditions of the Creative Commons Attribution (CC BY) license (http://creativecommons.org/licenses/by/4.0/).
Share and Cite
MDPI and ACS Style
Olaguera, L.M.; Matsumoto, J.; Kubota, H.; Inoue, T.; Cayanan, E.O.; Hilario, F.D. Abrupt Climate Shift in the Mature Rainy Season of the Philippines in the Mid-1990s. Atmosphere 2018, 9, 350. https://doi.org/10.3390/atmos9090350
AMA Style
Olaguera LM, Matsumoto J, Kubota H, Inoue T, Cayanan EO, Hilario FD. Abrupt Climate Shift in the Mature Rainy Season of the Philippines in the Mid-1990s. Atmosphere. 2018; 9(9):350. https://doi.org/10.3390/atmos9090350
Chicago/Turabian StyleOlaguera, Lyndon Mark, Jun Matsumoto, Hisayuki Kubota, Tomoshige Inoue, Esperanza O. Cayanan, and Flaviana D. Hilario. 2018. "Abrupt Climate Shift in the Mature Rainy Season of the Philippines in the Mid-1990s" Atmosphere 9, no. 9: 350. https://doi.org/10.3390/atmos9090350
Note that from the first issue of 2016, this journal uses article numbers instead of page numbers. See further details here.