Symmetry of Energy Divergence Anomalies Associated with the El Niño-Southern Oscillation


1
Institute of Water Security and Science. 3107 Agricultural Sciences Building, Davis College of Agriculture, Natural Resources and Design, West Virginia University, Morgantown, WV 26506, USA
2
Davis College of Agriculture, Natural Resources and Design. 4121 Agricultural Sciences Building, West Virginia University, Morgantown, WV 26506, USA
3
Institute of Water Security and Science. 4121 Agricultural Sciences Building, West Virginia University, Morgantown, WV 26506, USA
4
Fitzgerald Hall 016, School of Education, Saint Louis University, Saint Louis, MO 63103, USA
5
Department of Atmospheric Sciences, 302-E ABNR Building, School of Natural Resources, University of Missouri, Columbia, MO 65201, USA
*
Author to whom correspondence should be addressed.
Atmosphere 2018, 9(9), 342; https://doi.org/10.3390/atmos9090342
Submission received: 10 July 2018
/
Revised: 25 August 2018
/
Accepted: 28 August 2018
/
Published: 1 September 2018
(This article belongs to the Section Meteorology)
Abstract
:The El Niño-Southern Oscillation (ENSO) is a dominant source of global climate variability. The effects of this phenomenon alter the flow of heat from tropical to polar latitudes, resulting in weather and climate anomalies that are difficult to forecast. The current work quantified two components of the vertically integrated equation for the total energy content of an atmospheric column, to show the anomalous horizontal redistribution of surface heat flux anomalies. Symmetric and asymmetric components of the vertically integrated latent and sensible heat flux divergence were quantified using ERA-Interim atmospheric reanalysis output on 30 model layers between 1979 and 2016. Results indicate that asymmetry is a fundamental component of ENSO-induced weather and climate anomalies at the global scale, challenging the common assumption that each phase of ENSO is equal and opposite. In particular, a substantial asymmetric component was identified in the relationship between ENSO and patterns of extratropical climate variability that may be proportional to differences in sea surface temperature anomalies during each phase of ENSO. This work advances our understanding of the global distributions of source and sink regions, which may improve future predictions of ENSO-induced precipitation and surface temperature anomalies. Future studies should apply these methods to advance understanding and to validate predictions of ENSO-induced weather and climate anomalies.
1. Introduction
Coupled atmosphere–hydrosphere interactions have gained attention in recent decades, given the recognition of the El Niño-Southern Oscillation (ENSO) as a dominant source of inter-annual climate variability [1]. ENSO impacts ecosystem productivity (e.g., agriculture), natural resource management (e.g., freshwater), and atmospheric convection (e.g., hurricanes and thunderstorm frequency and intensity) globally [2]. El Niño and La Niña events are described through the analysis of sea surface temperature (SST) anomalies within the Niño 3.4 region (170° W to 120° W, 5° S to 5° N [3]). El Niño represents the warm phase, whereas La Niña represents the cool phase of the ENSO phenomena, and both phases typically reach peak magnitude during the month of December when the SST anomaly variance is maximized in the Niño 3.4 region [4]. The Southern Oscillation is quantified as the difference in mean sea level pressure (MSLP) between Tahiti and Darwin, Australia [5]. Longitudinal gradients in MSLP associated with the Southern Oscillation influence the magnitude, and in some cases, the direction (i.e., westerly wind bursts [6]) of the equatorial easterly trade winds [7]. The combination of anomalous SSTs (i.e., El Niño or La Niña) and wind patterns (i.e., Southern Oscillation) force anomalous heat fluxes at the ocean-atmosphere interface, altering the flow of heat from tropical to polar latitudes [1,8].
Studies have repeatedly and conclusively shown that anomalous surface fluxes of sensible and latent heat associated with SST anomalies in the Niño 3.4 region are mechanistically responsible for a cascade of global climate impacts that are only partially understood [1,9,10]. The tropical atmosphere is characterized by two overturning circulations, the meridional Hadley circulation and the zonal Walker circulation, which are coupled with cloud and precipitation patterns [11]. For example, convection shifts toward the maximum positive SST anomaly in the equatorial Pacific Ocean reducing outgoing longwave radiation and shifting the ascending branch of the Walker circulation, thereby amplifying Rossby wave generation [1,12]. The meridional propagation of Rossby waves influences the position and strength of subtropical and mid-latitude jet streams (i.e., Hadley circulation), and the probability density functions of recurring patterns of low-frequency climate variability (i.e., teleconnections; [13,14]). Given these cascading effects, anomalous surface heat fluxes associated with ENSO induce a multitude of detrimental weather and climate anomalies that extend into extratropical latitudes and remain confounding to researchers [1].
Teleconnection patterns including, but not limited to, the Pacific North American (PNA) pattern and North Atlantic Oscillation (NAO) are influenced by ENSO, and force extratropical patterns of anomalous precipitation and surface temperatures [1,14]. The PNA pattern is a mode of climate variability that is distinct from ENSO, but El Niño events increase the probability of a positive PNA pattern and vice versa for La Niña events [15]. Most winters cannot be characterized solely by a canonical NAO structure, due to the substantial intra-seasonal variability that is induced by multiple forcing mechanisms [16], indicating that ENSO’s influence on the NAO is more nuanced and not well-understood [17]. Additionally, a diverse continuum of ENSO events exists, with variable extratropical weather and climate impacts that limit the predictability due to stochastic atmospheric noise and a variety of feedback mechanisms [14,18]. Ultimately, variability in anomalous surface heat fluxes unpredictably impacts regional to global patterns of precipitation and surface temperature [14,18].
Composite analyses of observed temperature and precipitation patterns that are associated with ENSO have been documented [19,20], but surface observation stations are irregularly located over continents, and with the exception of data buoys [21], are absent over the oceans [1]. A limited surface observation network has motivated the use of combined satellite observations, rain gauge records, and reanalysis output to estimate global precipitation anomalies associated with ENSO [22]. Subsequent analyses of ENSO-induced weather and climate anomalies have typically been performed at regional scales [23,24,25], and many of the regional scale studies have focused on the Northern Hemisphere (NH; [26]). Fewer studies, however, have attempted to quantify the influence of ENSO on the Southern Hemisphere’s (SH’s) extratropical circulation, due to the lack of meteorological and oceanographic data [27] and an apparently weaker and more variable atmospheric response [1]. However, well-regarded and widely used atmospheric reanalysis data sets (e.g., ERA-Interim; [28]) provide an opportunity to refine existing global scale analyses of weather and climate anomalies forced by ENSO. Novel applications of global atmospheric reanalysis products (e.g., the horizontal redistribution of anomalous surface heat fluxes) can be used to better understand the spatial distribution of ENSO-induced weather and climate anomalies, particularly in locations with limited surface observation networks.
Atmospheric reanalysis involves processing large quantities of historic observations using advanced data assimilation methods (e.g., 4D-Var [28]) to provide physically consistent analyses of a suite of atmospheric quantities on many vertical layers. However, atmospheric reanalysis output is typically used for regression or composite analyses of seasonal MSLP or geopotential height anomalies on standard isobaric surfaces (i.e., 500 or 700 hPa [14,29,30]) suggesting that the vertical resolution of atmospheric reanalysis output has been underused. Similar analyses have been used to assess the validity of the common assumption that weather and climate anomalies during each phase of ENSO are symmetric (i.e., equal and opposite [29]). Theoretically, well-known asymmetries in the magnitude and duration of SST anomalies during El Niño and La Niña events [4,31] would proportionally influence surface heat fluxes [8], but the magnitude and spatial distribution of asymmetric weather and climate anomalies remains controversial [14,26]. For example, [29] identified substantial asymmetries at low relative to mid or high latitudes, but [28] concluded that asymmetry is a fundamental feature of recent ENSO events across North America. Given the evidence in the literature, it is clear that analyses commonly used to assess ENSO’s extratropical influence are underusing the high vertical resolution of contemporary atmospheric reanalysis output. The consequences of this may be hindering advancements to scientific understanding of ENSO-induced weather and climate anomalies, and their symmetry.
Asymmetries in the magnitude and duration of SST anomalies associated with El Niño and La Niña events have been well-documented [4], but the magnitude and spatial distribution of asymmetric weather and climate anomalies remains controversial [14]. One explanation for the controversy is that studies addressing extratropical weather and climate anomalies typically use a limited subset of atmospheric reanalysis datasets, including anomalous patterns of geopotential height, surface temperature, and/or precipitation [29,32,33,34]. However, reanalysis output on original model levels is more accurate than interpolating the output onto geopotential surfaces [35], and reanalysis of the output of surface temperature and precipitation is subject to bias from changes in the observation density [36,37]. Furthermore, the combination of irregularly spaced surface observations over land [1], complex sub-grid scale processes [38], sharp precipitation gradients in time and space [39], and the lack of surface observations over oceans, limits the global scale accuracy of reanalyzed fields of surface temperature and precipitation. Collectively, direct assessment of ENSO-induced weather and climate anomalies using reanalyzed fields of surface temperature and precipitation anomalies has become repetitive, and complexities inherent to these fields may be hindering advancements to scientific understanding, and thus the predictability of ENSO.
Surface fluxes of latent and sensible heat flux are a core component of ENSO-induced climatic variability [40], but the horizontal redistribution of anomalous heat fluxes has received relatively little attention. In terms of the landscape and land surface processes, previous literature has indicated that vertically integrated latent heat flux divergence provides a better estimate of streamflow than reanalyzed fields of precipitation [41] and a similar relationship exists between the sensible heat flux divergence and surface temperature [42,43]. Quantifying the divergence of vertically integrated fluxes of sensible and latent heat provides an estimate of source and sink regions of sensible and latent heat corresponding to anomalous surface temperature and precipitation patterns, respectively.
The overarching objective of the current work was to quantify the global distribution of anomalous latent and sensible heat flux divergence averaged over the meteorological winter (i.e., December, January, and February) during all El Niño and La Niña events between 1979 and 2016. A sub-objective was to quantify the symmetric and asymmetric components of ENSO-induced latent and sensible heat flux divergence anomalies, to advance the understanding of ENSO dynamics and increase the predictability of future ENSO-induced precipitation and surface temperature anomalies.
2. Experiments
The following investigation was global in extent, with data analyses being restricted to the ERA-Interim atmospheric reanalysis output. ERA-Interim is a well-regarded reanalysis product that has a large and diverse user base associated with a variety of data products [27]. To accomplish the objectives of this work, novel analytical methods typical of the vertically integrated energy budget were applied to the problem of extratropical weather and climate anomalies associated with ENSO forcing. In particular, the divergences of vertically integrated horizontal fluxes of latent and sensible heat were quantified. This approach is justified because surface heat fluxes are a core component of ENSO-induced climatic variability [40], but their horizontal redistribution has not received adequate attention. Traditional methods (i.e., MSLP or geopotential height anomalies), while informative, would have been repetitive relative to other previous works [32,33,34] and were also beyond the scope of the current work.
2.1. ENSO Events
El Niño or La Niña events are often defined by at least five consecutive tri-monthly moving averages of SST anomalies within the Niño 3.4 region that are above and below 0.5 °C and −0.5 °C, respectively, and are more commonly referred to as the Oceanic Niño Index (ONI; [44]). Other ENSO metrics exist including the Southern Oscillation Index (SOI; [45]) and the multivariate ENSO index (MEI; [46,47]), but ONI was preferred for this work due to the direct relationship between surface heat fluxes and SST anomalies [8]. For historical purposes, the occurrence of all ENSO events since 1950 has been documented by the Climate Prediction Center (CPC; [48]) using data from the most up-to-date version of the Extended Reconstructed Sea Surface Temperature project (ERSSTv5; [49]). However, due to temporal limits of the ERA-Interim Reanalysis (1979 to present; [27]), only the ENSO events occurring between 1979 and 2016 were considered for this work, resulting in a total of 25 ENSO events, 12 La Niña events and 13 El Niño events (Table 1). Maximum ONI values were recorded during the November, December, January (NDJ) period for nine of the 13 El Nino events and eight of the 60 La Nina events (not shown) consistent with a December peak in monthly SST anomaly variance [4]. Given that extratropical weather and climate anomalies lag behind SST anomalies by approximately one month [50], analyses in this work were focused on the boreal winter, defined here as December through February (DJF). ONI values for the DJF period of each ENSO event is shown in Table 1, and the average of all El Niño events was 1.3 °C and the average of all La Niña events was −1.1 °C, consistent with inherent asymmetries in SST anomalies [4]. Selecting the DJF period was a reasonable approach, given that composite analyses during the DJF period is a common approach for assessing extratropical weather and climate anomalies forced by ENSO [14,51,52]. The timing of the peak magnitude and the duration of individual ENSO events is variable, but examining event-to-event differences was beyond the scope of the current work.
2.2. Reanalysis Data
Contemporary atmospheric reanalysis datasets provide spatially complete multivariate records of the global atmospheric circulation that are critically important for advancing the understanding of the Earth’s irregularly observed atmosphere [27]. Development of such reanalysis products requires processing large quantities of historic observations using advanced data assimilation methods (e.g., 4D-Var; [27]). ERA-Interim was produced at high spatial (~0.7° lat/lon) and temporal (6-hourly analyses) resolution over a global domain between January 1979 to the present by the European Centre for Medium-Range Weather Forecasts [53,54]. Data were acquired from the Computation and Information Systems Laboratory at the National Center for Atmospheric Research (CISL NCAR). The subset of the ERA-Interim output utilized for the current work were six-hourly model analyses of specific humidity (q), temperature (T), and zonal (u) and meridional (v) components of wind provided on model levels between January 1979 and June 2016. ERA-I model levels adhered to the eta vertical coordinate system characterized by terrain-following sigma coordinates at the lowest model levels and the model surface, hybrid pressure-sigma coordinates at mid to low-levels, and pressure coordinates in the upper atmosphere [55]. Pressure in the eta coordinate system is a function of surface pressure (ps) and a pair of time-independent, spatially invariant coefficients denoted by a and b (Equation (1)), which vary in the vertical, but not horizontal dimensions.
Here k is a generalized vertical index for each of the 60 vertical model levels, x represents longitude, y represents latitude, t represents time, and ps represents surface pressure. For the purposes of the current work, only the lowest 30 model levels were considered, given the higher vertical resolution, uncertainties regarding stratosphere-troposphere transport [56], and the lack of moisture above the 30th model level [57] that is, at 202.09 hPa (assuming a standard surface pressure of 1013.25 hPa). The most accurate density-weighted vertical averages denoted by 〈∙〉 were calculated using reanalysis output on the original model levels [58], which were evaluated according to Equation (2):
Here, ml30 represents the 30th model level, ps represents surface pressure, dp represents the pressure thickness between model layers, and g represents gravitational constant. The mass-weighted vertically averaged horizontal sensible and latent heat fluxes are 〈vT〉 and 〈vq〉, respectively, where v = (u,v) with a slight abuse of notation. Divergence was calculated at each six-hourly time step after performing the mass-weighted vertical average using MATLAB’s© (Mathworks, Natick, MA, USA) divergence function. Six-hourly outputs of sensible and latent heat fluxes and their divergence was averaged weekly and stored in multi-dimensional arrays according to the following structure [latitude, longitude, week of year, year]. Each month was split into four weeks of equal length such that week length for the DJF period was variable between 7 and 7.75 days, depending on month length.
2.3. Vertically Integrated Energy Budget
Mayer and Haimberger [59] define the vertically integrated equation for the total energy content of an atmospheric column:
In Equation (3), g denotes gravitational acceleration; p is pressure; ps is surface pressure; cp is the specific heat at constant pressure; T is temperature; ϕ is geopotential; L is latent heat of vaporization; q is specific humidity; k is specific kinetic energy; v is horizontal wind; Fs is the net energy balance at the surface; and RadTOA is the net radiative balance at the top of the atmosphere (TOA). When fully expanded, the second term on the left hand side of (3) contains the divergence of vertically integrated latent and sensible heat terms that are analyzed in this work. Divergence of 〈vT〉 and 〈vq〉 terms results in sources and sinks of latent and sensible heat corresponding to changes in non-radiative terms of the surface energy balance, defined as:
In Equation (4), ΔSWabsorbed refers to absorbed shortwave radiation, ΔLWdown refers to downward longwave radiation, ΔLWup represents upward longwave radiation, ΔSH represents sensible heat fluxes, and ΔLH represents latent heat fluxes [60].
2.4. Data Scaling
After preceding calculations were performed, data were scaled to provide the divergence of horizontal fluxes of sensible and latent heat in the same units (kJ m−2 s−1), and to allow for direct comparison of heat flux divergence [35]. All horizontal fluxes of sensible heat were scaled by the specific heat of water (4.181 kJ kg−1 K−1) under standard atmospheric conditions (20 °C, 1013.25 hPa). All horizontal fluxes of latent heat were scaled by the latent heat of vaporization of water (2265 kJ kg−1) at standard atmospheric conditions. Additional scaling was performed to each figure panel such that the maximum plotted scalar divergence or vector magnitude was equal to the maximum value of the corresponding color bar. Reducing the maximum vector magnitudes in each plot to a common value (i.e., maximum of color bar) did not alter the vector direction, and clarified the spatial patterns of vectors away from the global maximum values. Given the global domain, the Eckert IV map projection was chosen to substantially reduce graphical distortion [61], and was centered on the central Pacific Ocean where the ENSO phenomena occurs.
2.5. Symmetry and Asymmetry
The symmetric component of anomalous horizontal, and tropospheric mean fluxes of sensible and latent heat were quantified by subtracting the composite analyses of each vector component during La Niña from that of the El Niño composites [26,29]. The asymmetric component of the anomalous horizontal, and tropospheric-mean fluxes of sensible and latent heat were quantified by adding each vector component of the composite analyses of El Niño and La Niña [26,29]. Addition or subtraction of composite analyses was performed after all spatial and temporal averages were performed as described above. Therefore, the symmetric component shows the linearity (i.e., mirror image) of anomalies during El Niño and La Niña events whereas the asymmetric component shows the non-linearity (i.e., El Niño is > or <La Niña) of anomalies. Assuming perfect symmetry, the asymmetric component is equal to zero, and the symmetric component is double the anomalies that are associated with either El Niño or La Niña [62].
3. Results
The results of the current work are focused on the spatial distribution of large sensible (>300 kJ m−2 s−1) and latent (>0.0025 kJ m−2 s−1) heat flux divergence anomalies that may result in predictable surface temperature and precipitation anomalies, respectively. Additional results detailing the anomalous vector magnitude are included in Appendix A for reference.
3.1. Sensible Heat Flux Divergence
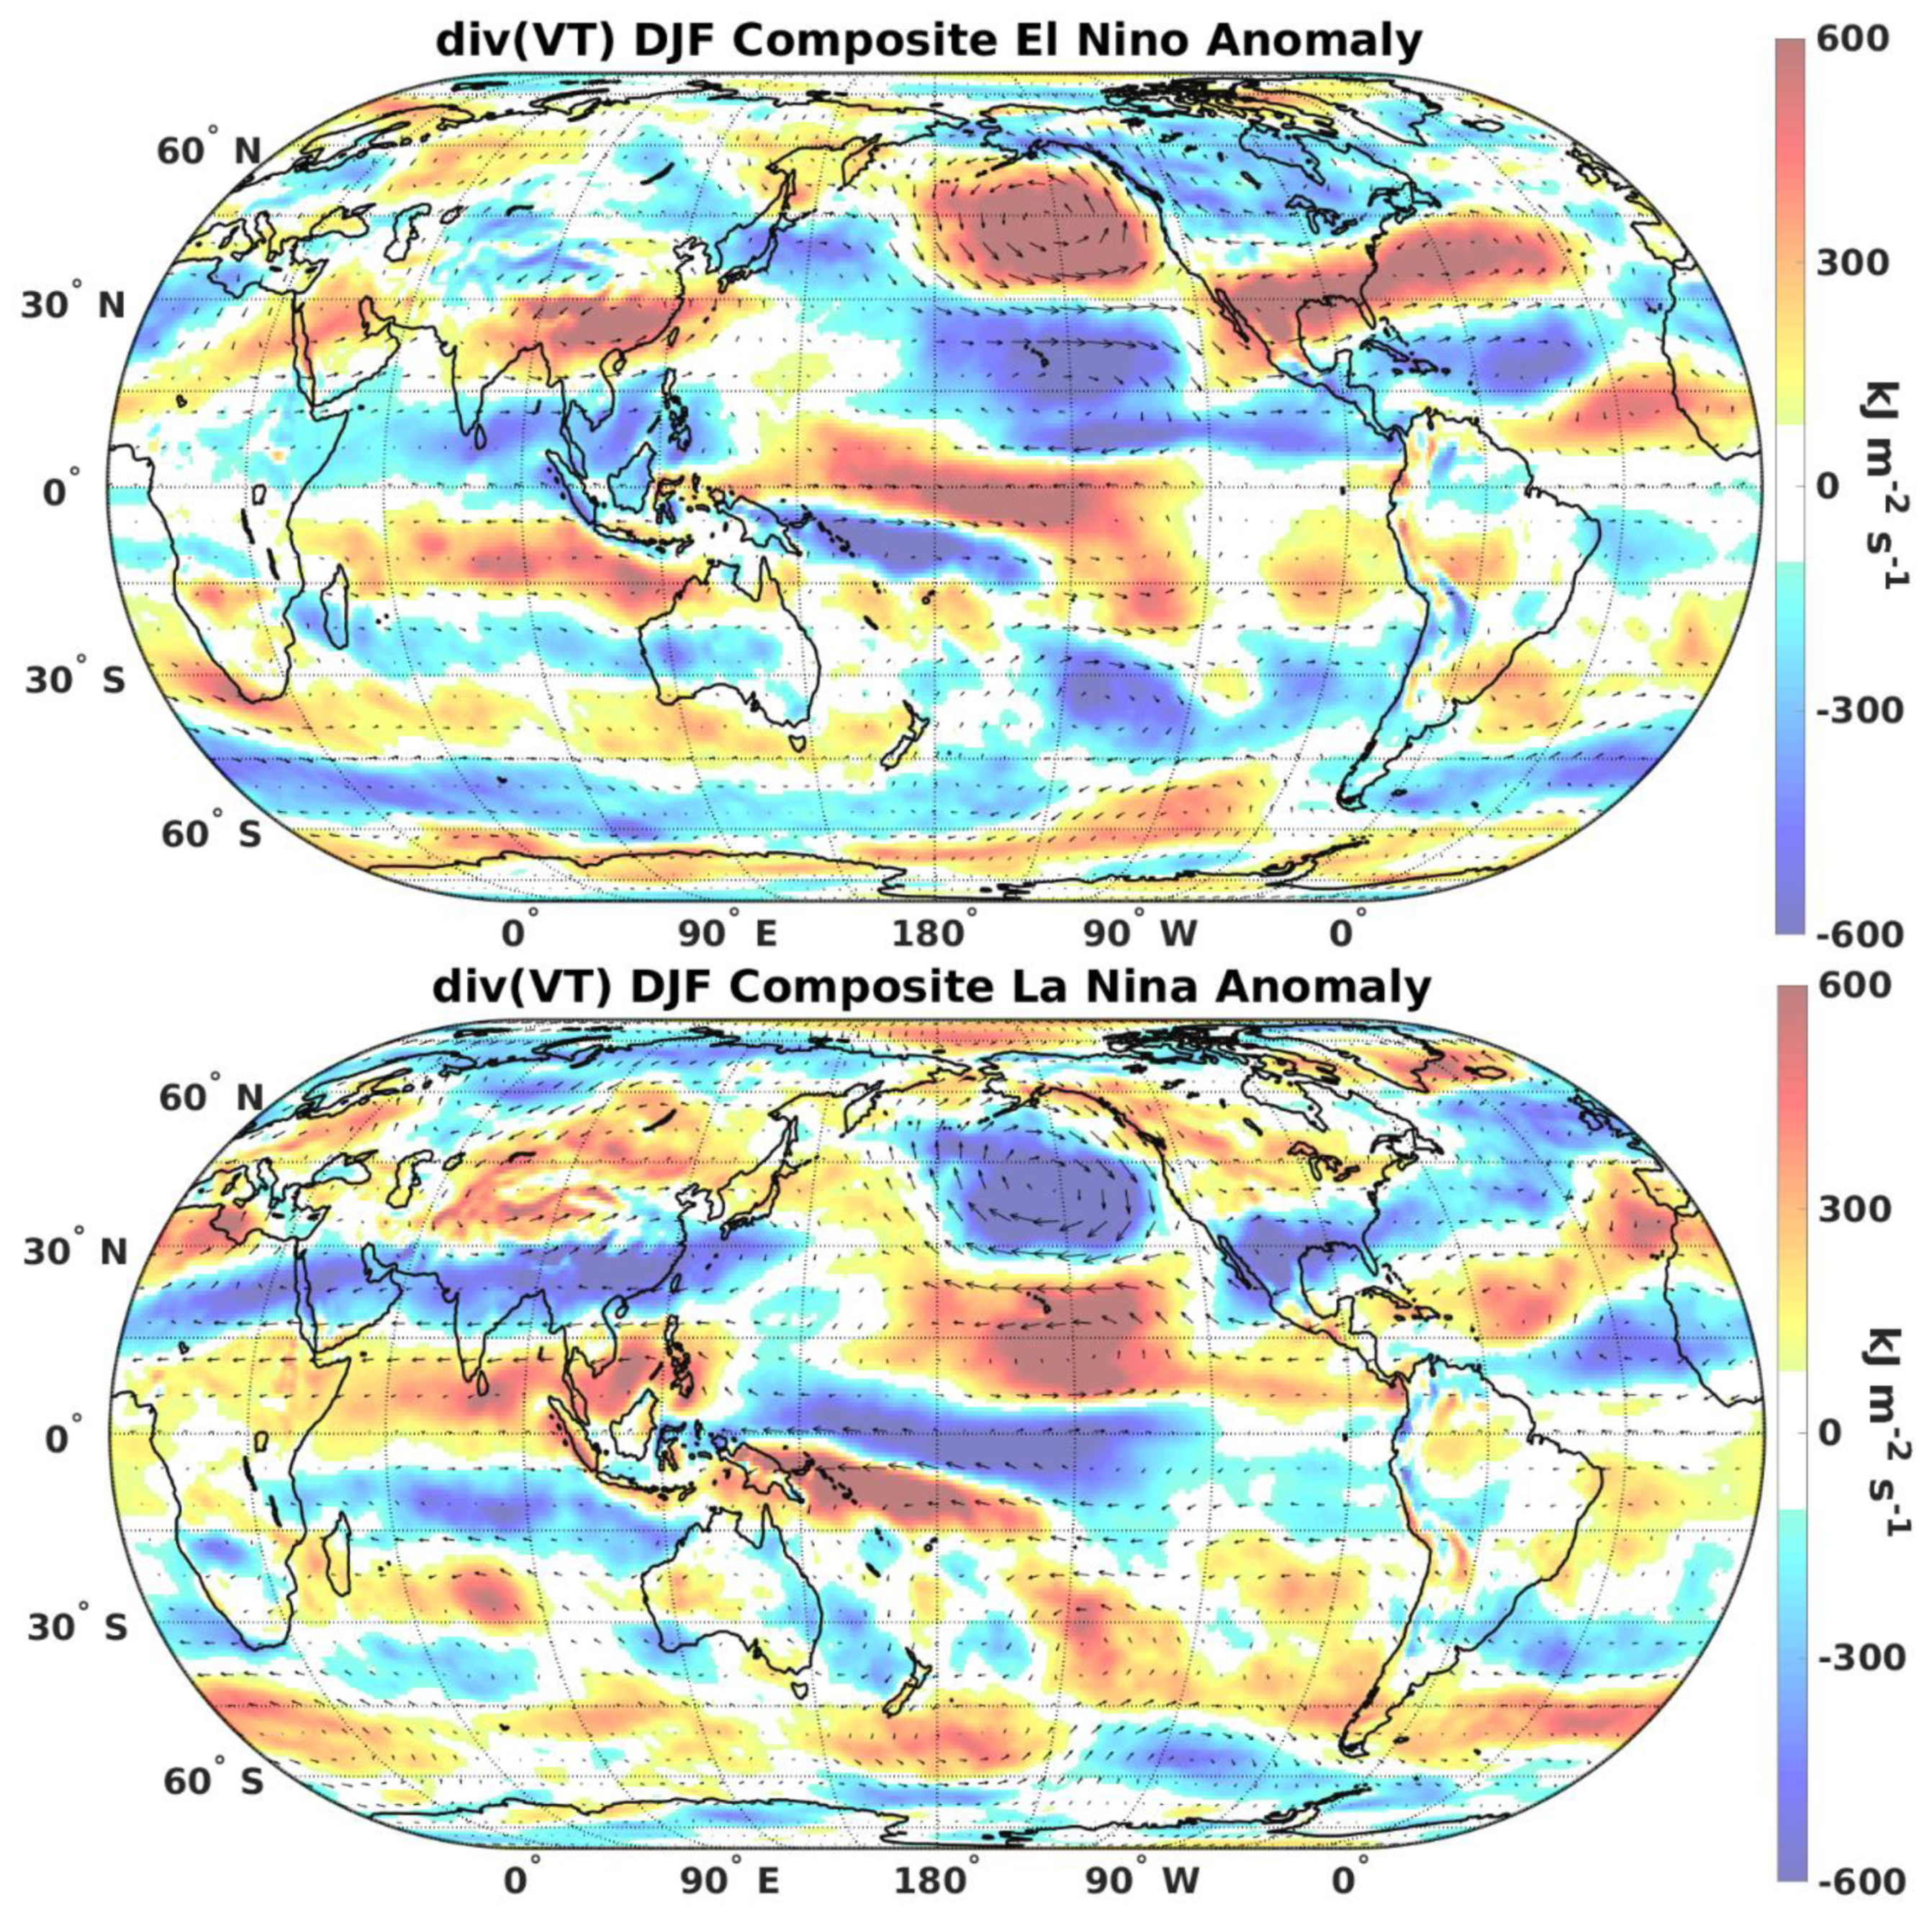
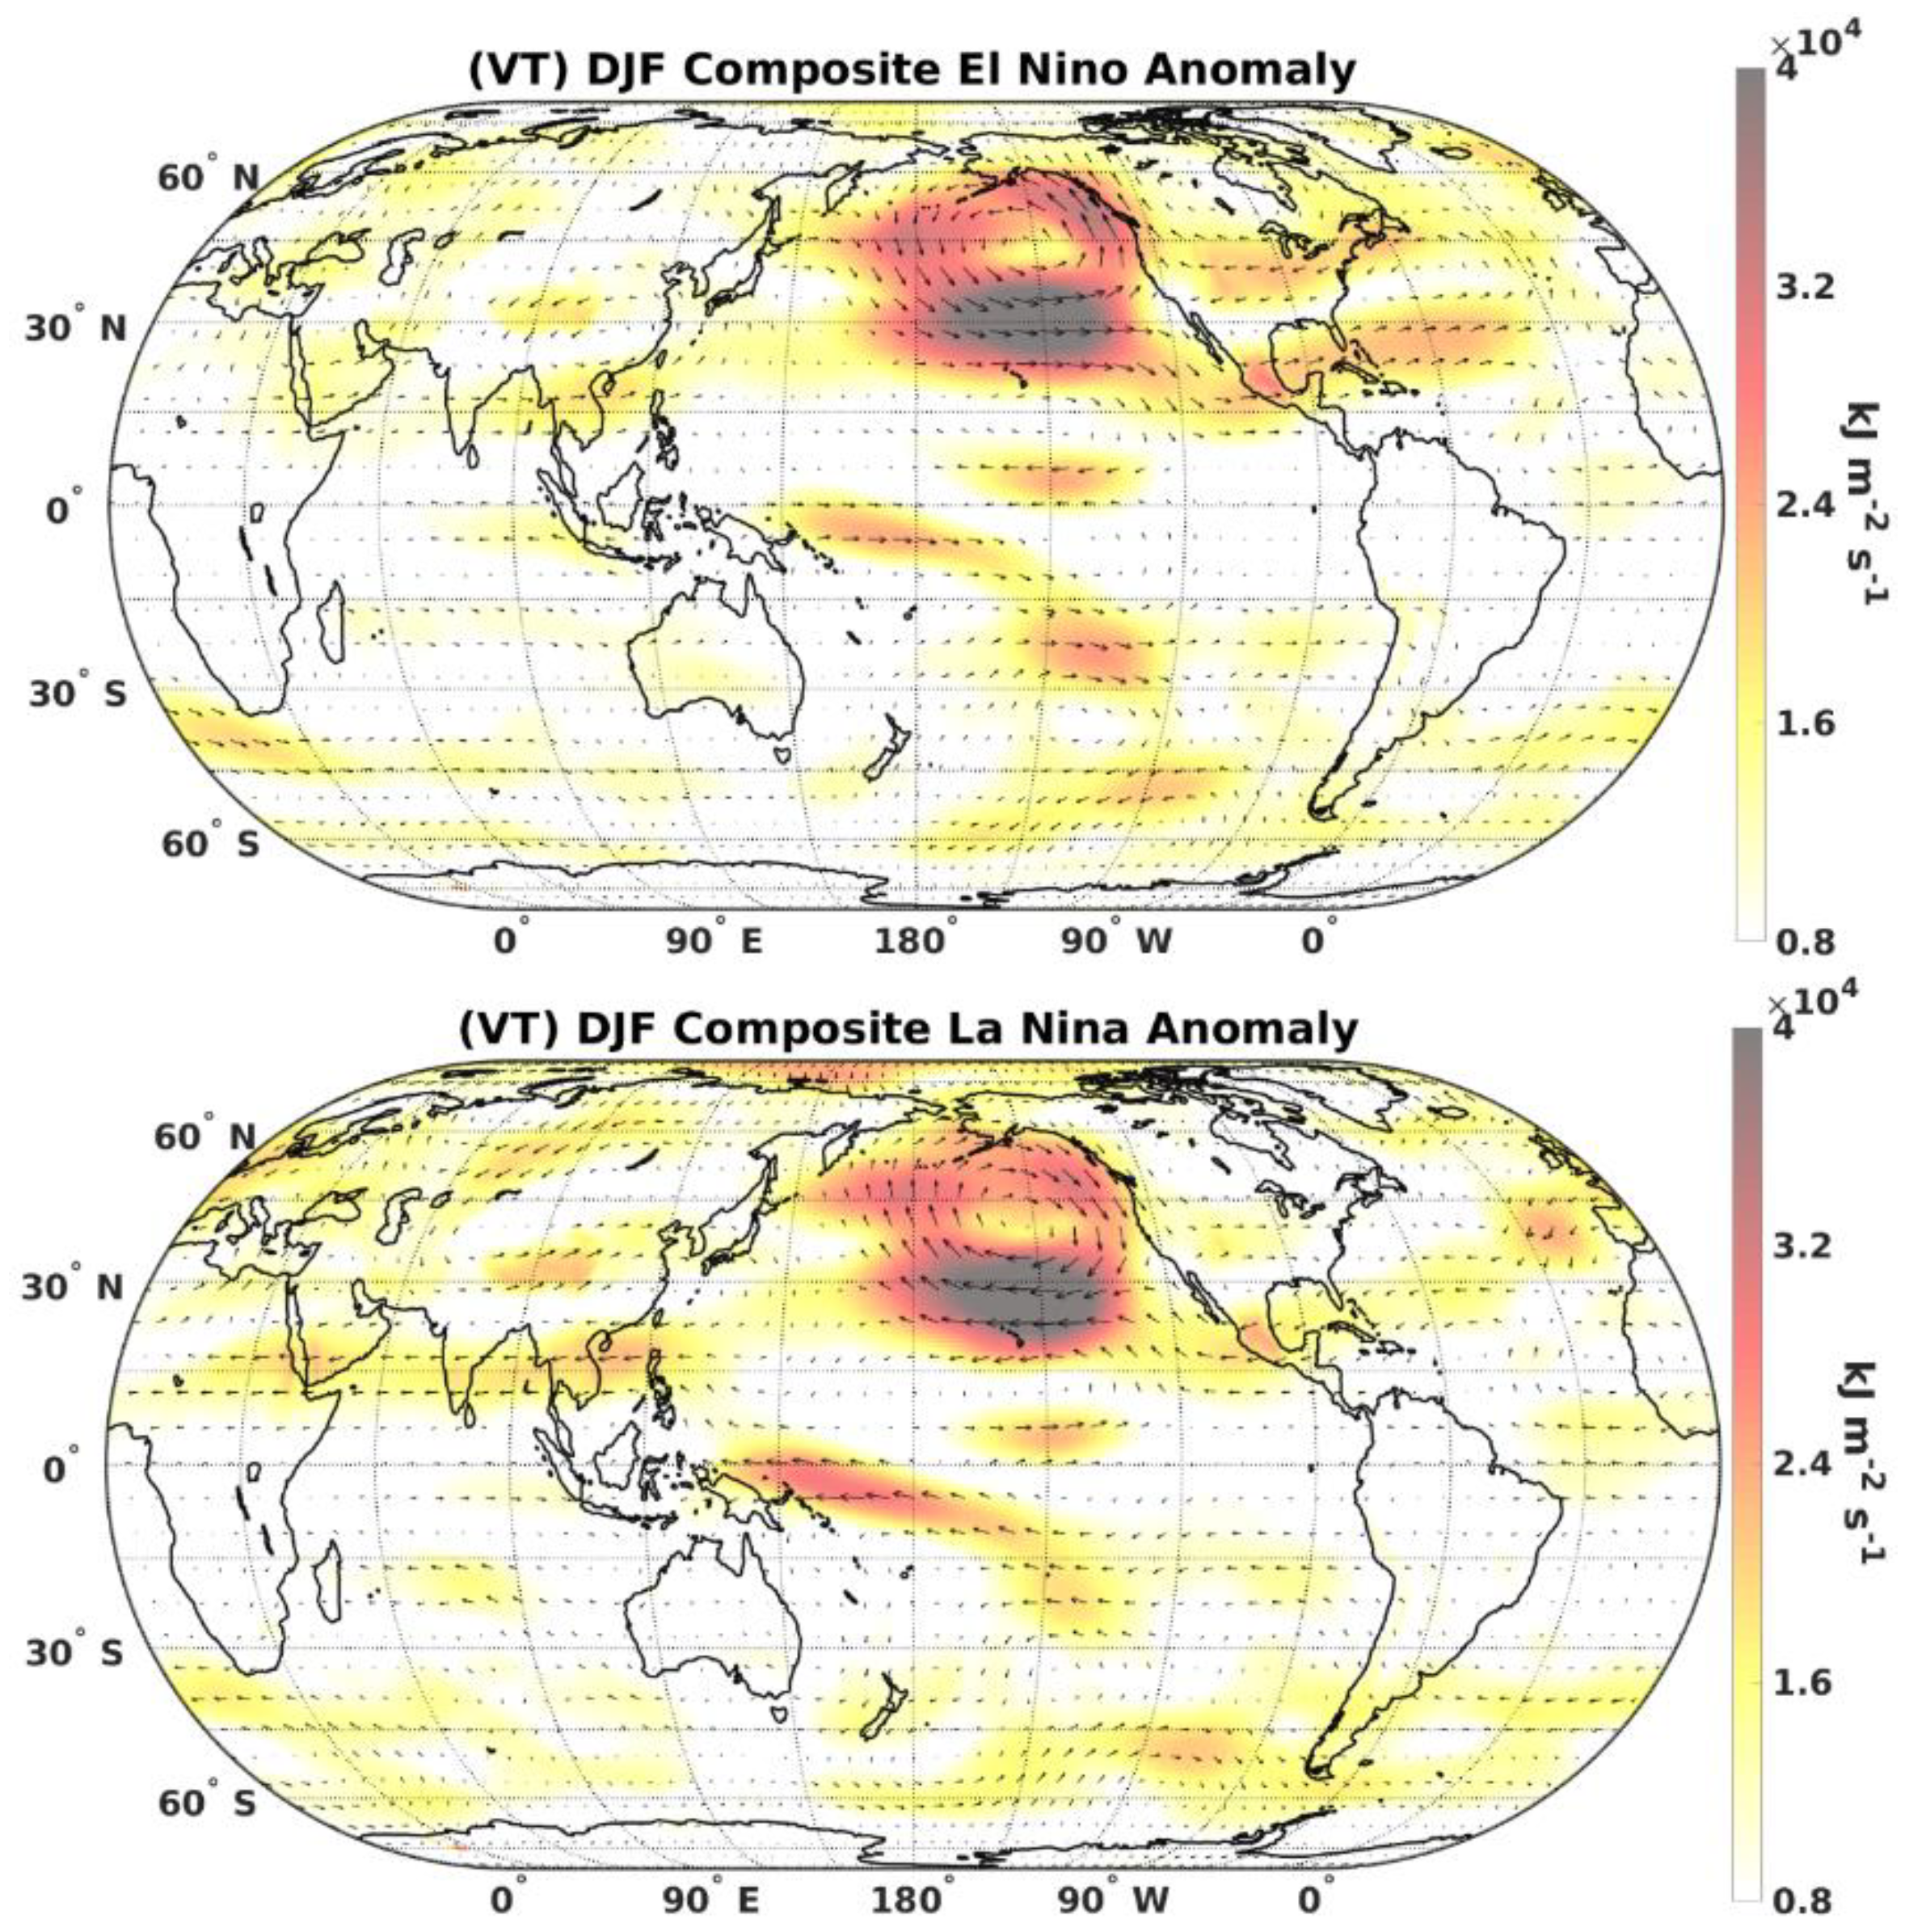
Regions of anomalous sensible heat flux divergence and convergence alternated sign depending on the latitude across the East Pacific Ocean (180° to 120° W in NH; 150° W to 90° W in SH). For example, anomalous divergence was apparent directly over the Niño 3.4 region during El Niño events, whereas anomalous convergence was apparent in this region during La Niña events (Figure 1). Across the northeast Pacific Ocean, a strongly anomalous (>600 kJ m−2 s−1) region of anomalous sensible heat flux convergence was located between 30° N and 60° N during El Niño events, whereas La Niña events were characterized by strongly anomalous divergence (Figure 1). An analogous region of somewhat less anomalous (<300 kJ m−2 s−1) sensible heat flux convergence or divergence was across the southeast Pacific Ocean (150° W to 90° W, 20° S to 45° S) during El Niño or La Niña events, respectively (Figure 1). At polar latitudes (>60° N/° S), divergence was favored during El Niño events and convergence was favored during La Niña events (Figure 1). Results therefore illustrate that El Niño (La Niña) events result in anomalous sensible heat flux divergence (convergence) at tropical latitudes, but they alternate sign twice with increasing latitude across each hemisphere of the East Pacific Ocean.
Results show that during the period of study, a pattern characterized by regions of convergence and divergence alternating with increasing latitude existed across most of the globe, and were of opposite sign, depending on the phase of ENSO. For example, results across North and Central America indicated anomalous divergence at tropical (<20° N) latitudes, convergence at subtropical (20° N to 40° N) latitudes, and divergence at extratropical (40° N to 70° N) latitudes during El Niño events, and vice versa during La Niña events. Similar alternating patterns are particularly apparent across the South Indian Ocean during El Niño events and Eurasia during La Niña events. Additionally, the generally east-to-west oriented regions of anomalous sensible heat fluxes were tilted from northwest to southeast across the Pacific Ocean, and from southwest to northeast across the Atlantic Ocean basin, particularly across the NH. In general, east-to-west oriented regions of anomalous sensible heat fluxes alternated sign, depending on latitude, and were generally of the opposite sign based on the phase of ENSO, but regions exhibited a meridional tilt across the Pacific and Atlantic Ocean basins.
3.2. Symmetry and Asymmetry of Sensible Heat Flux Divergence
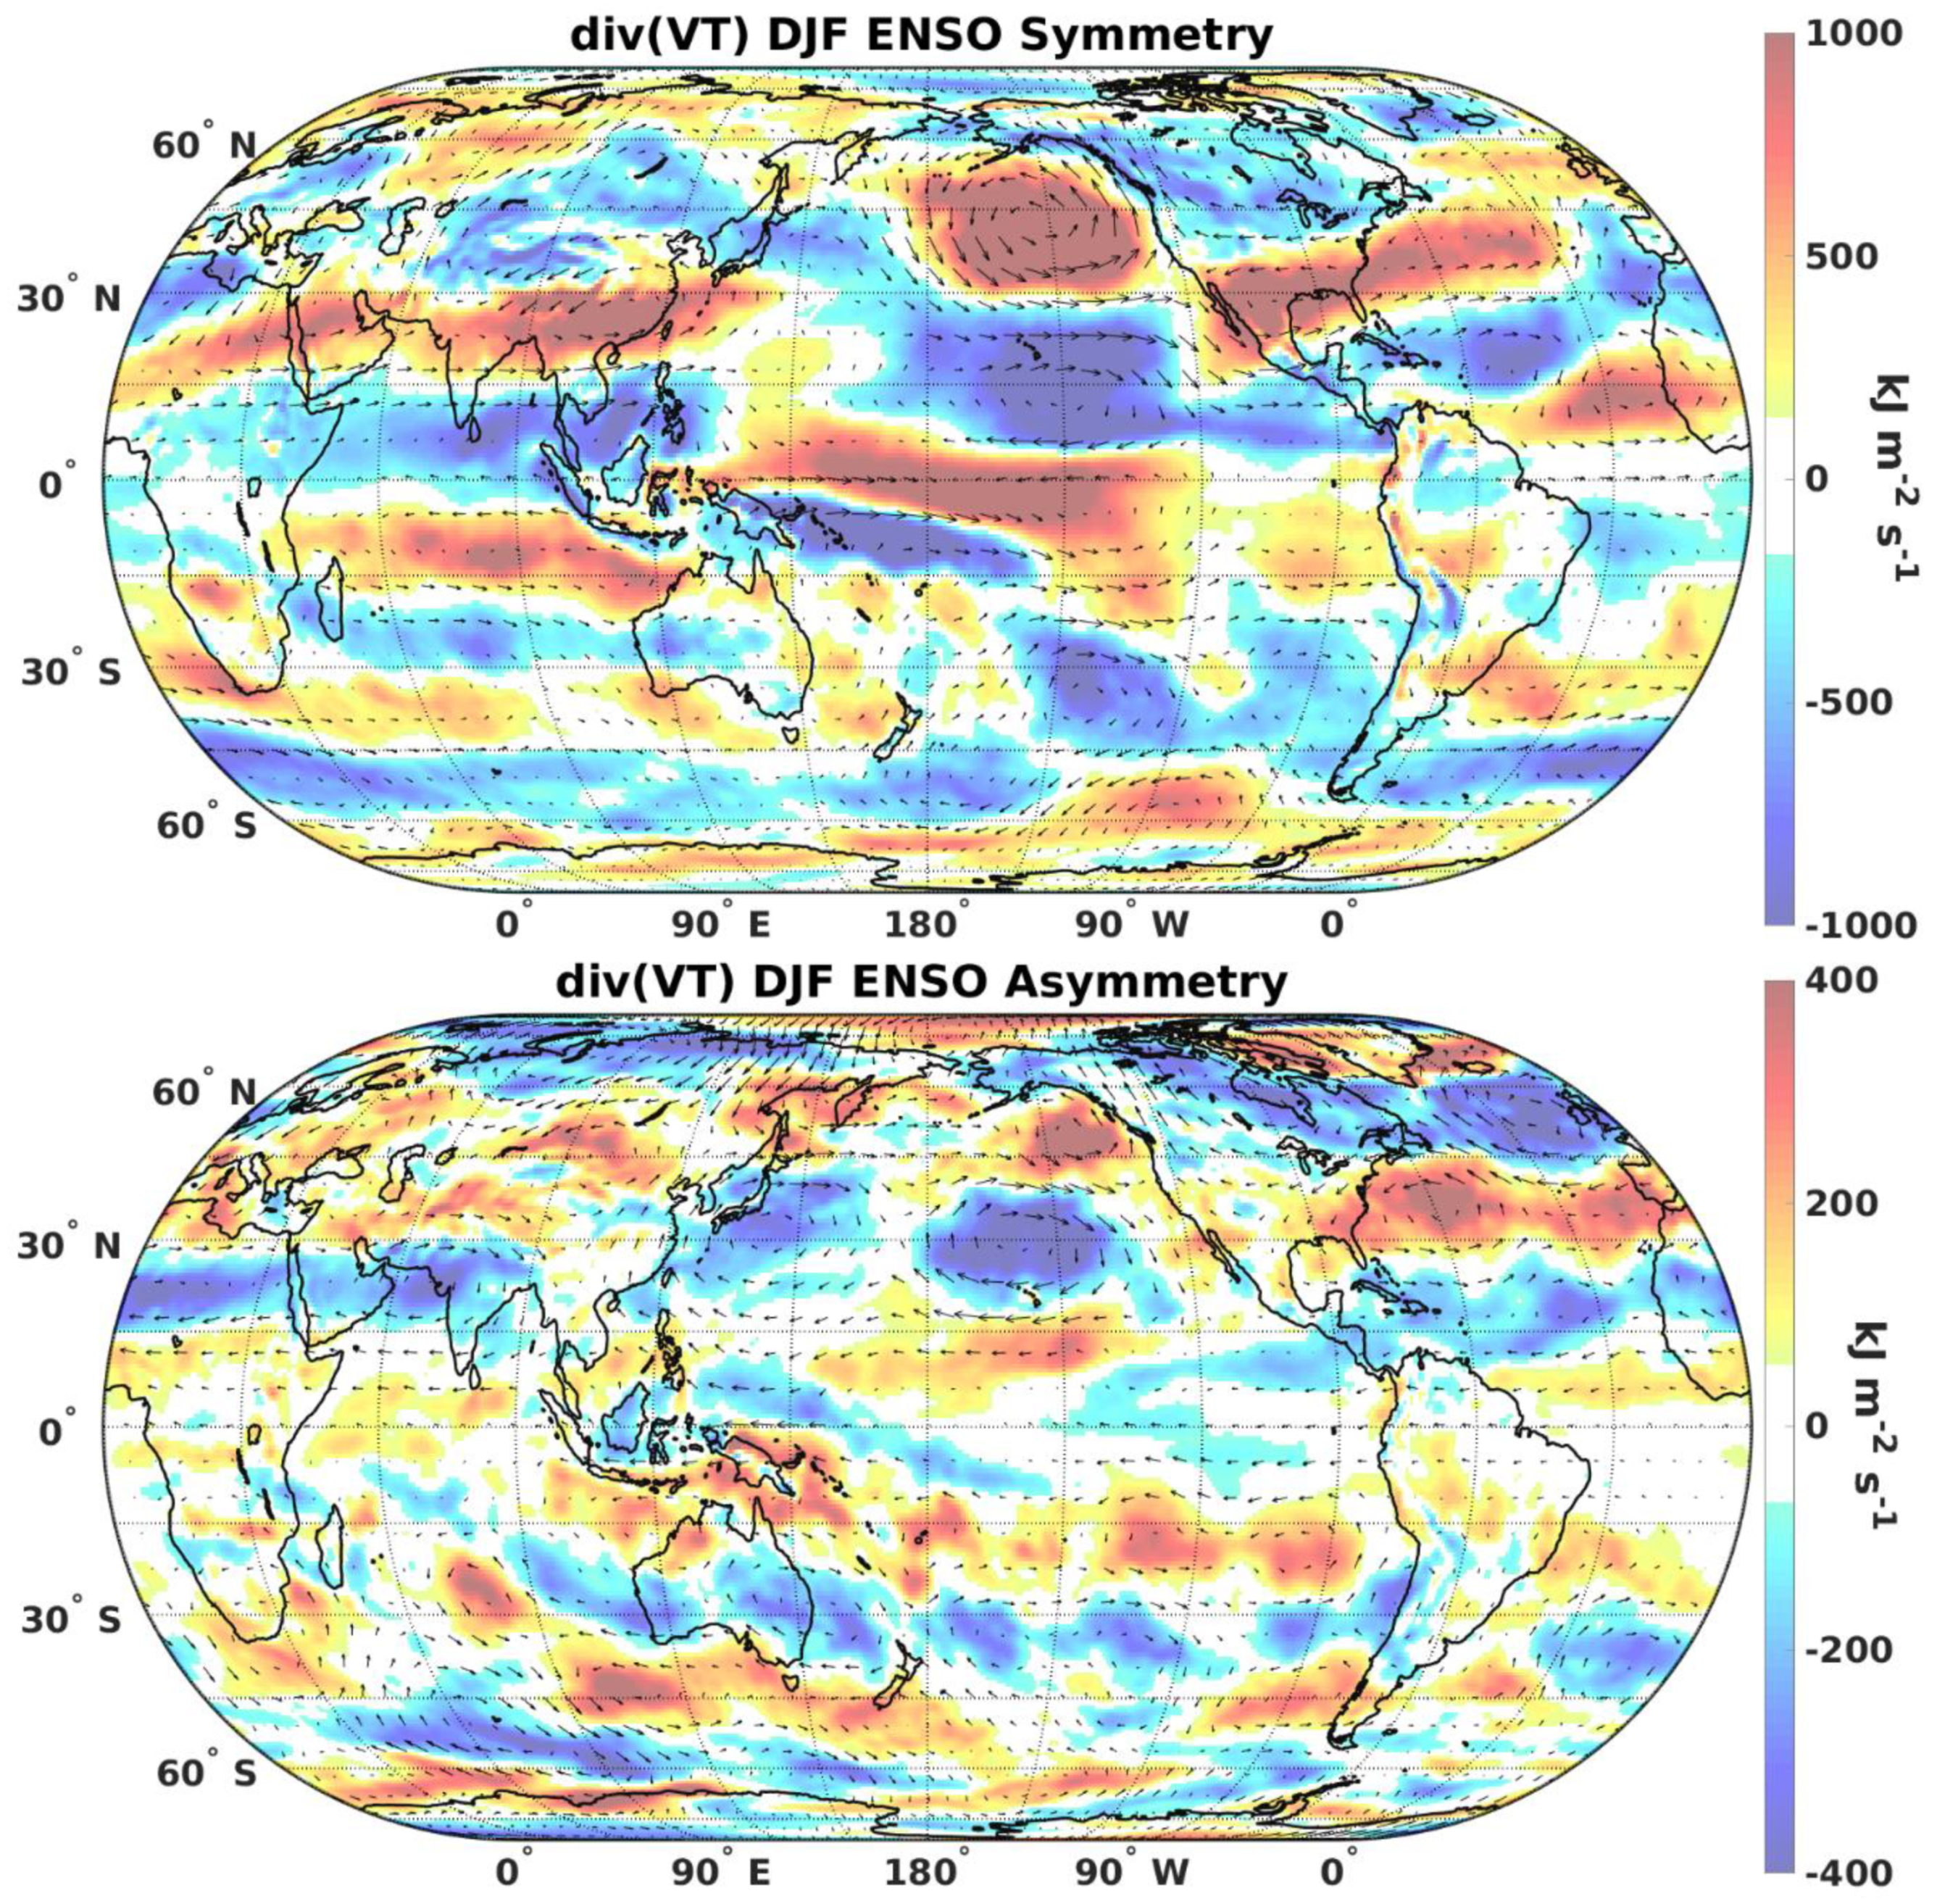
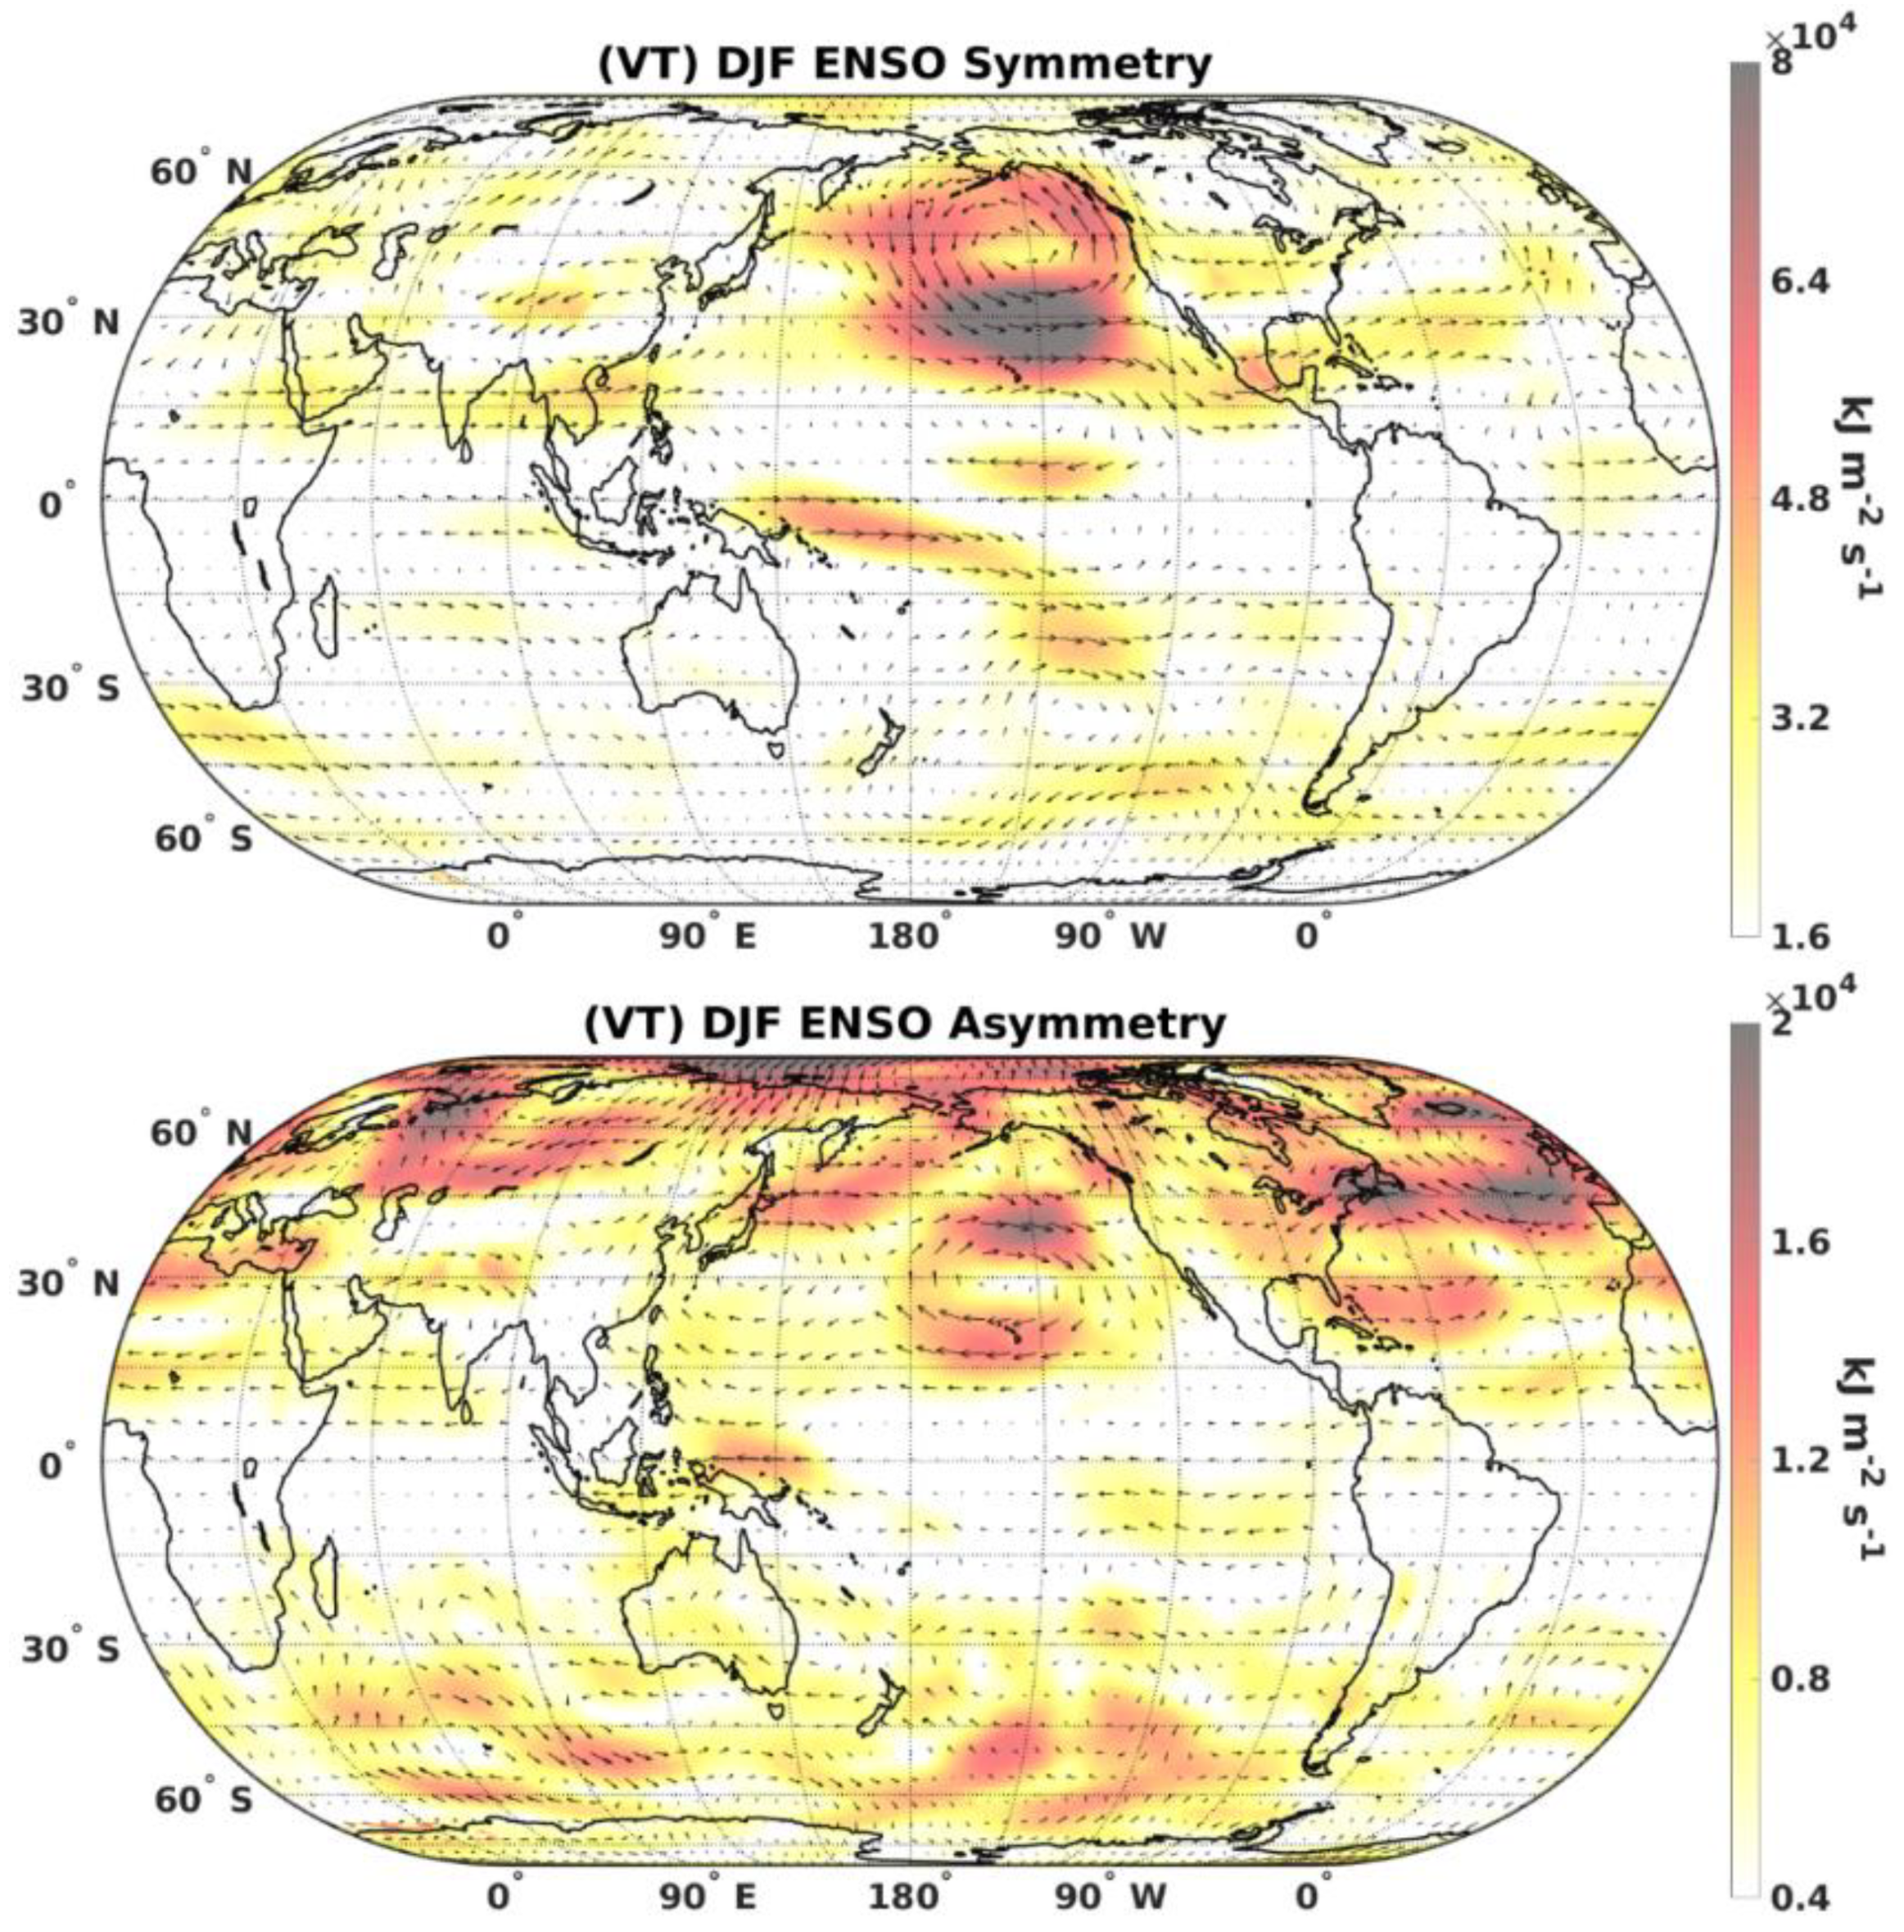
The symmetric component showed regions of convergent and divergent sensible heat flux anomalies that were generally larger than the asymmetric component, and alternated, depending on the latitude and phase of ENSO. However, in certain regions, asymmetric component anomalies were of similar magnitude to the symmetric component. For example, across the North Atlantic Ocean and eastern North America, the asymmetric component was large (>300 kJ m−2 s−1; Figure 2) and of the same sign as the symmetric component, indicating differences in the magnitude of convergence, or divergence during each phase of ENSO. However, symmetric and asymmetric components were of opposite signs across the eastern North Atlantic Ocean and Western Europe, indicating differences in the magnitude and sign (i.e., convergence or divergence) during each phase of ENSO. Similar differences in the magnitude and sign of symmetric and asymmetric components of sensible heat flux divergence extended across most of Eurasia and North Africa, suggesting substantial asymmetries in ENSO-induced weather and climate anomalies. Across the Southern Hemisphere, the asymmetric component was generally maximized, where gradients in the symmetric component were large, suggesting slight differences in position or magnitudes of regions of anomalous sensible heat flux divergence during each phase of ENSO. Results indicated that the symmetric component was larger than the asymmetric component, but that substantial asymmetries were apparent in many locations globally.
3.3. Latent Heat Flux Divergence
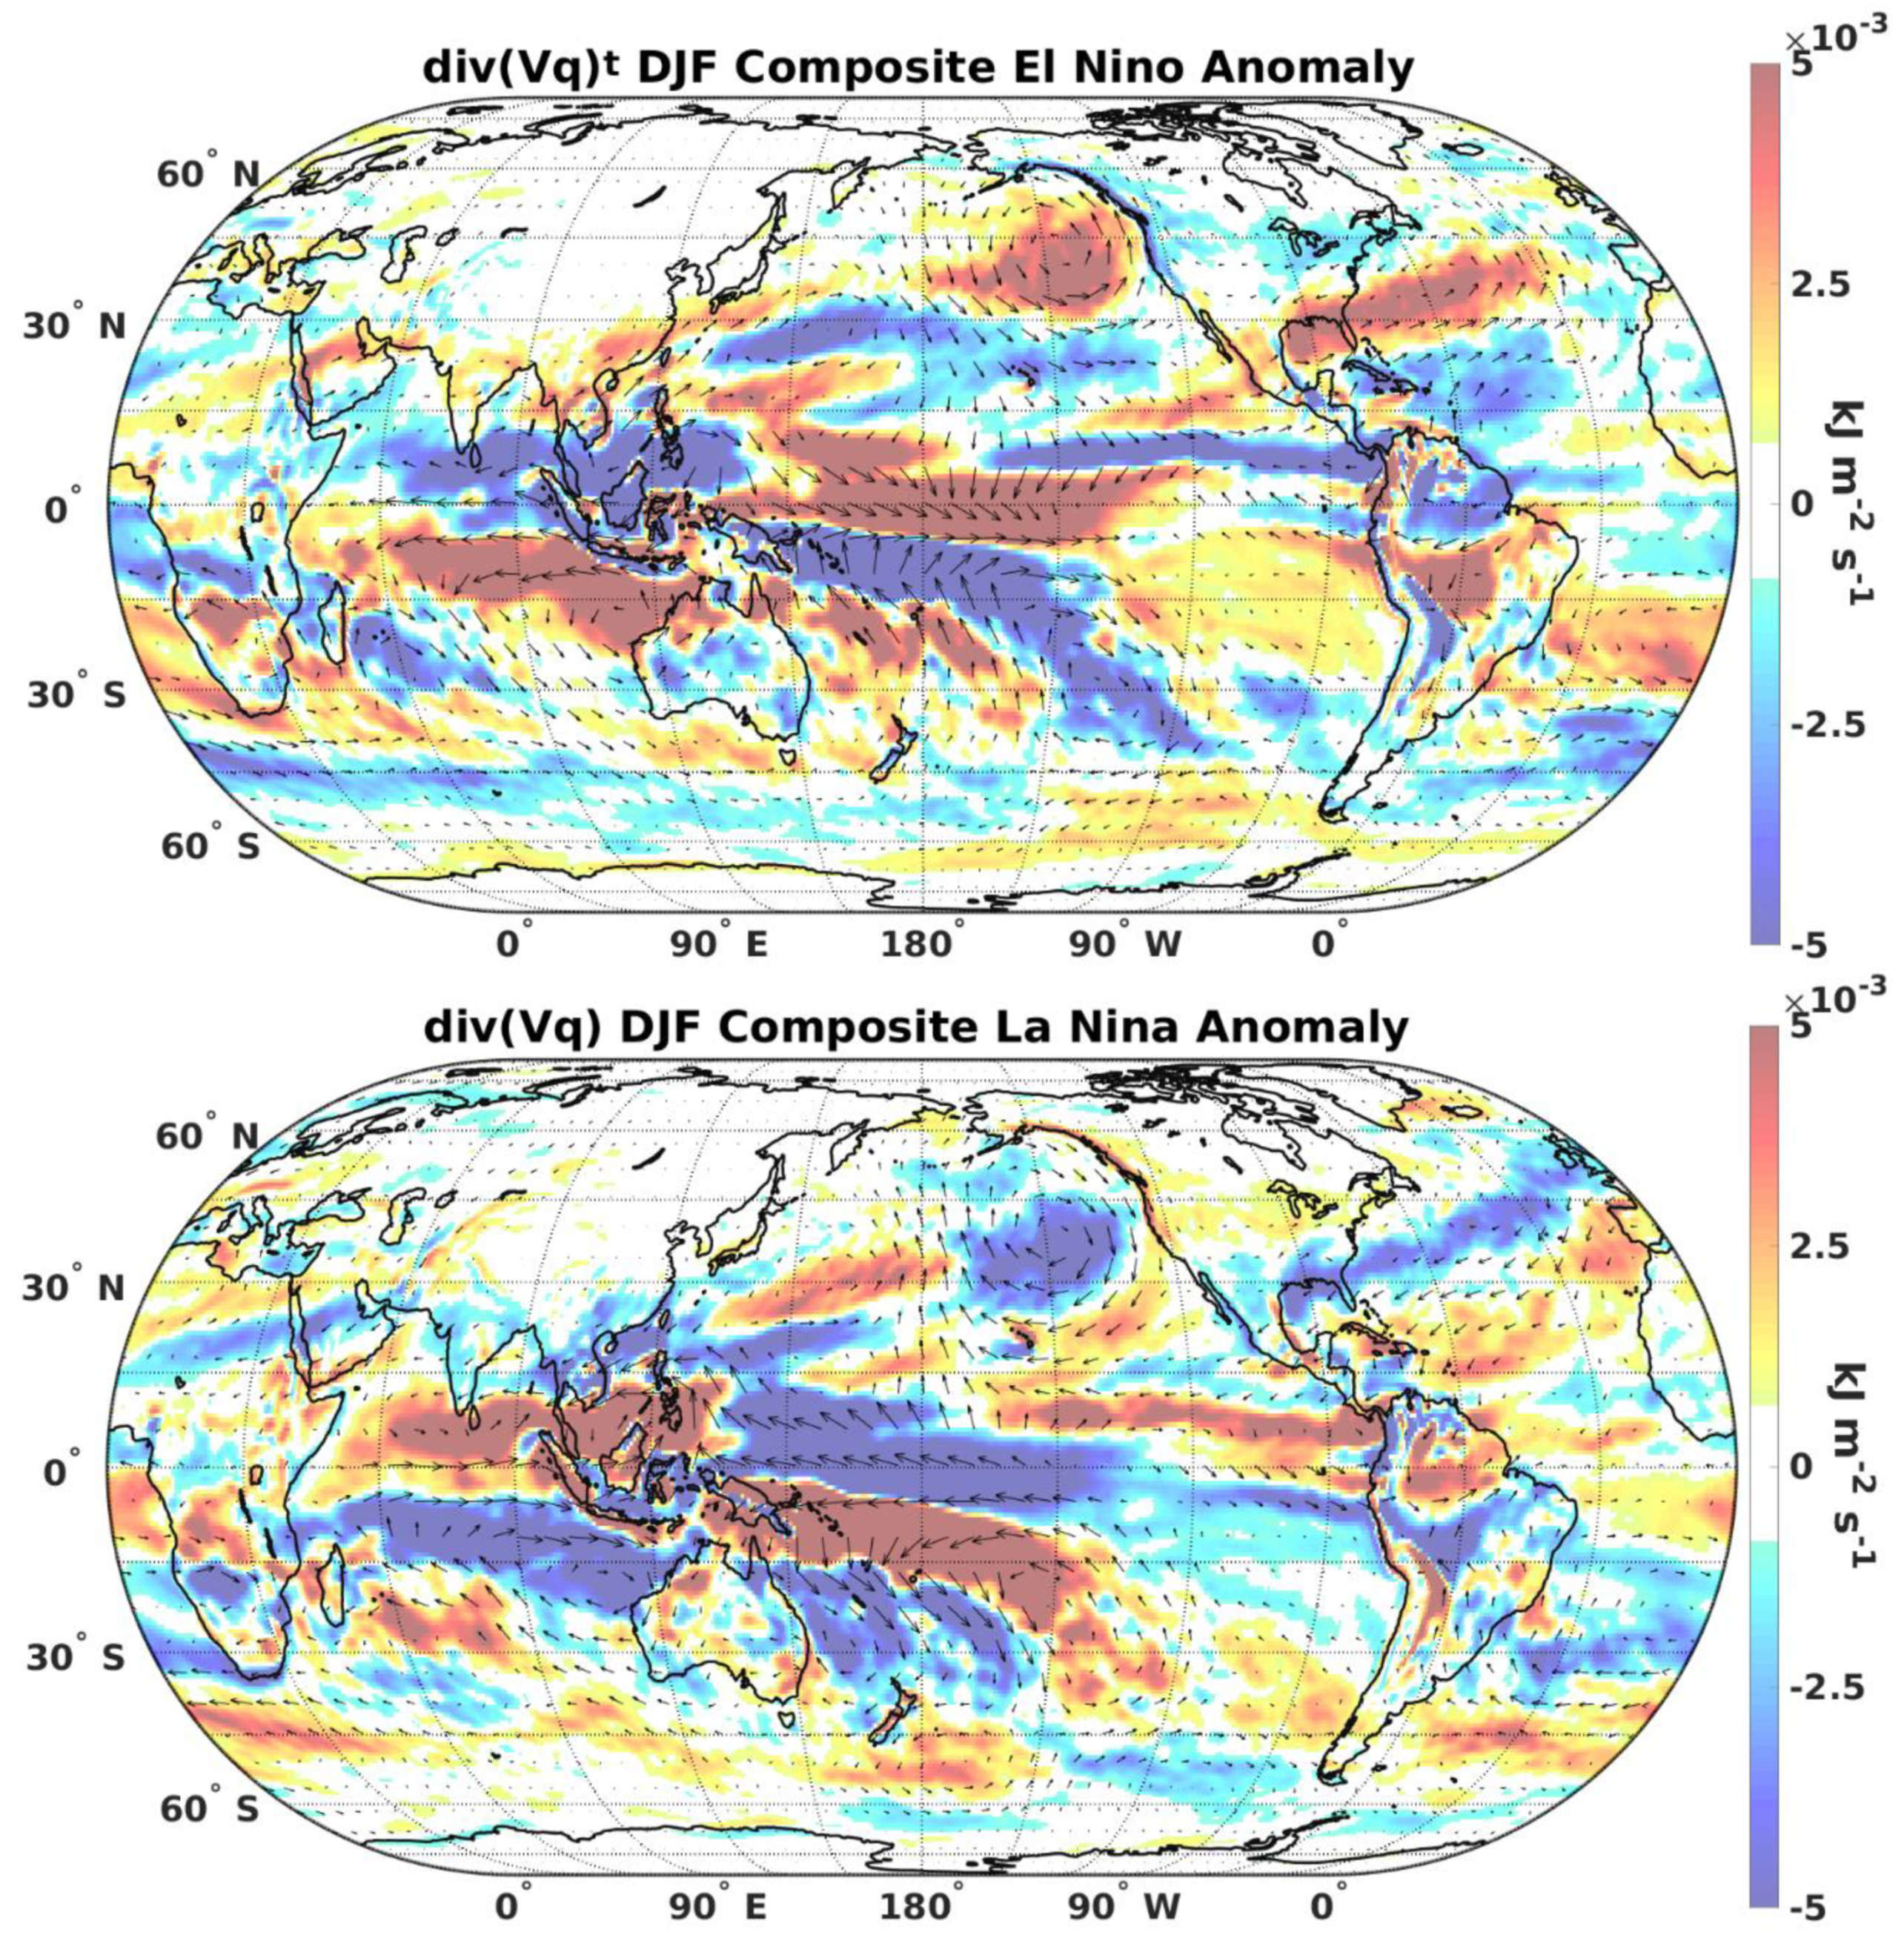
Latent heat flux divergence anomalies were largest (>5 × 10⁻³ kJ m−2 s−1) across the tropical Indian Ocean, Pacific Ocean, and adjacent land masses, but anomalies were also large across parts of extratropical North America, South America, Africa, and Europe (Figure 3). Large latent heat flux divergence (convergence) anomalies were shown along the west coast of North America and adjacent mountain ranges during El Niño (La Niña) events. Across eastern North America, similarly large anomalies of the opposite sign were shown across the Gulf of Mexico and southeastern North America with smaller anomalies (<2.5 × 10⁻³ kJ m−2 s−1) located to the north at approximately 45° N. In Europe, El Niño events resulted in divergent latent heat flux anomalies in the Alps (approximately 15° E 50° N) and generally convergent latent heat flux anomalies across the Mediterranean and the Black Sea, and vice versa for La Niña events (Figure 3). Results across Africa showed a region of large anomalies (>± 2.5 × 10⁻³ kJ m−2 s−1) extending northwest to southeast across tropical southern Africa (<15° S), and a similar region of the opposite sign was shown further to the south (>15° S) that included coastal South Africa, and both regions alternated sign based on ENSO phase. Large latent heat flux divergence (convergence) anomalies were apparent across the Southern (northern) Andes Mountains during El Niño (La Niña) events. However, a generally opposite north-to-south gradient was shown across eastern South America (Figure 3). Additionally, a distinct couplet of divergence and convergence was associated with the Hawaiian Islands (155° W 20° N) that reversed polarity based on the phase of ENSO. As shown in Figure 3, latent heat flux divergence anomalies were largest across tropical oceans and adjacent land areas, but also extended to extratropical latitudes in multiple locations.
3.4. Symmetry and Asymmetry of Latent Heat Flux Divergence
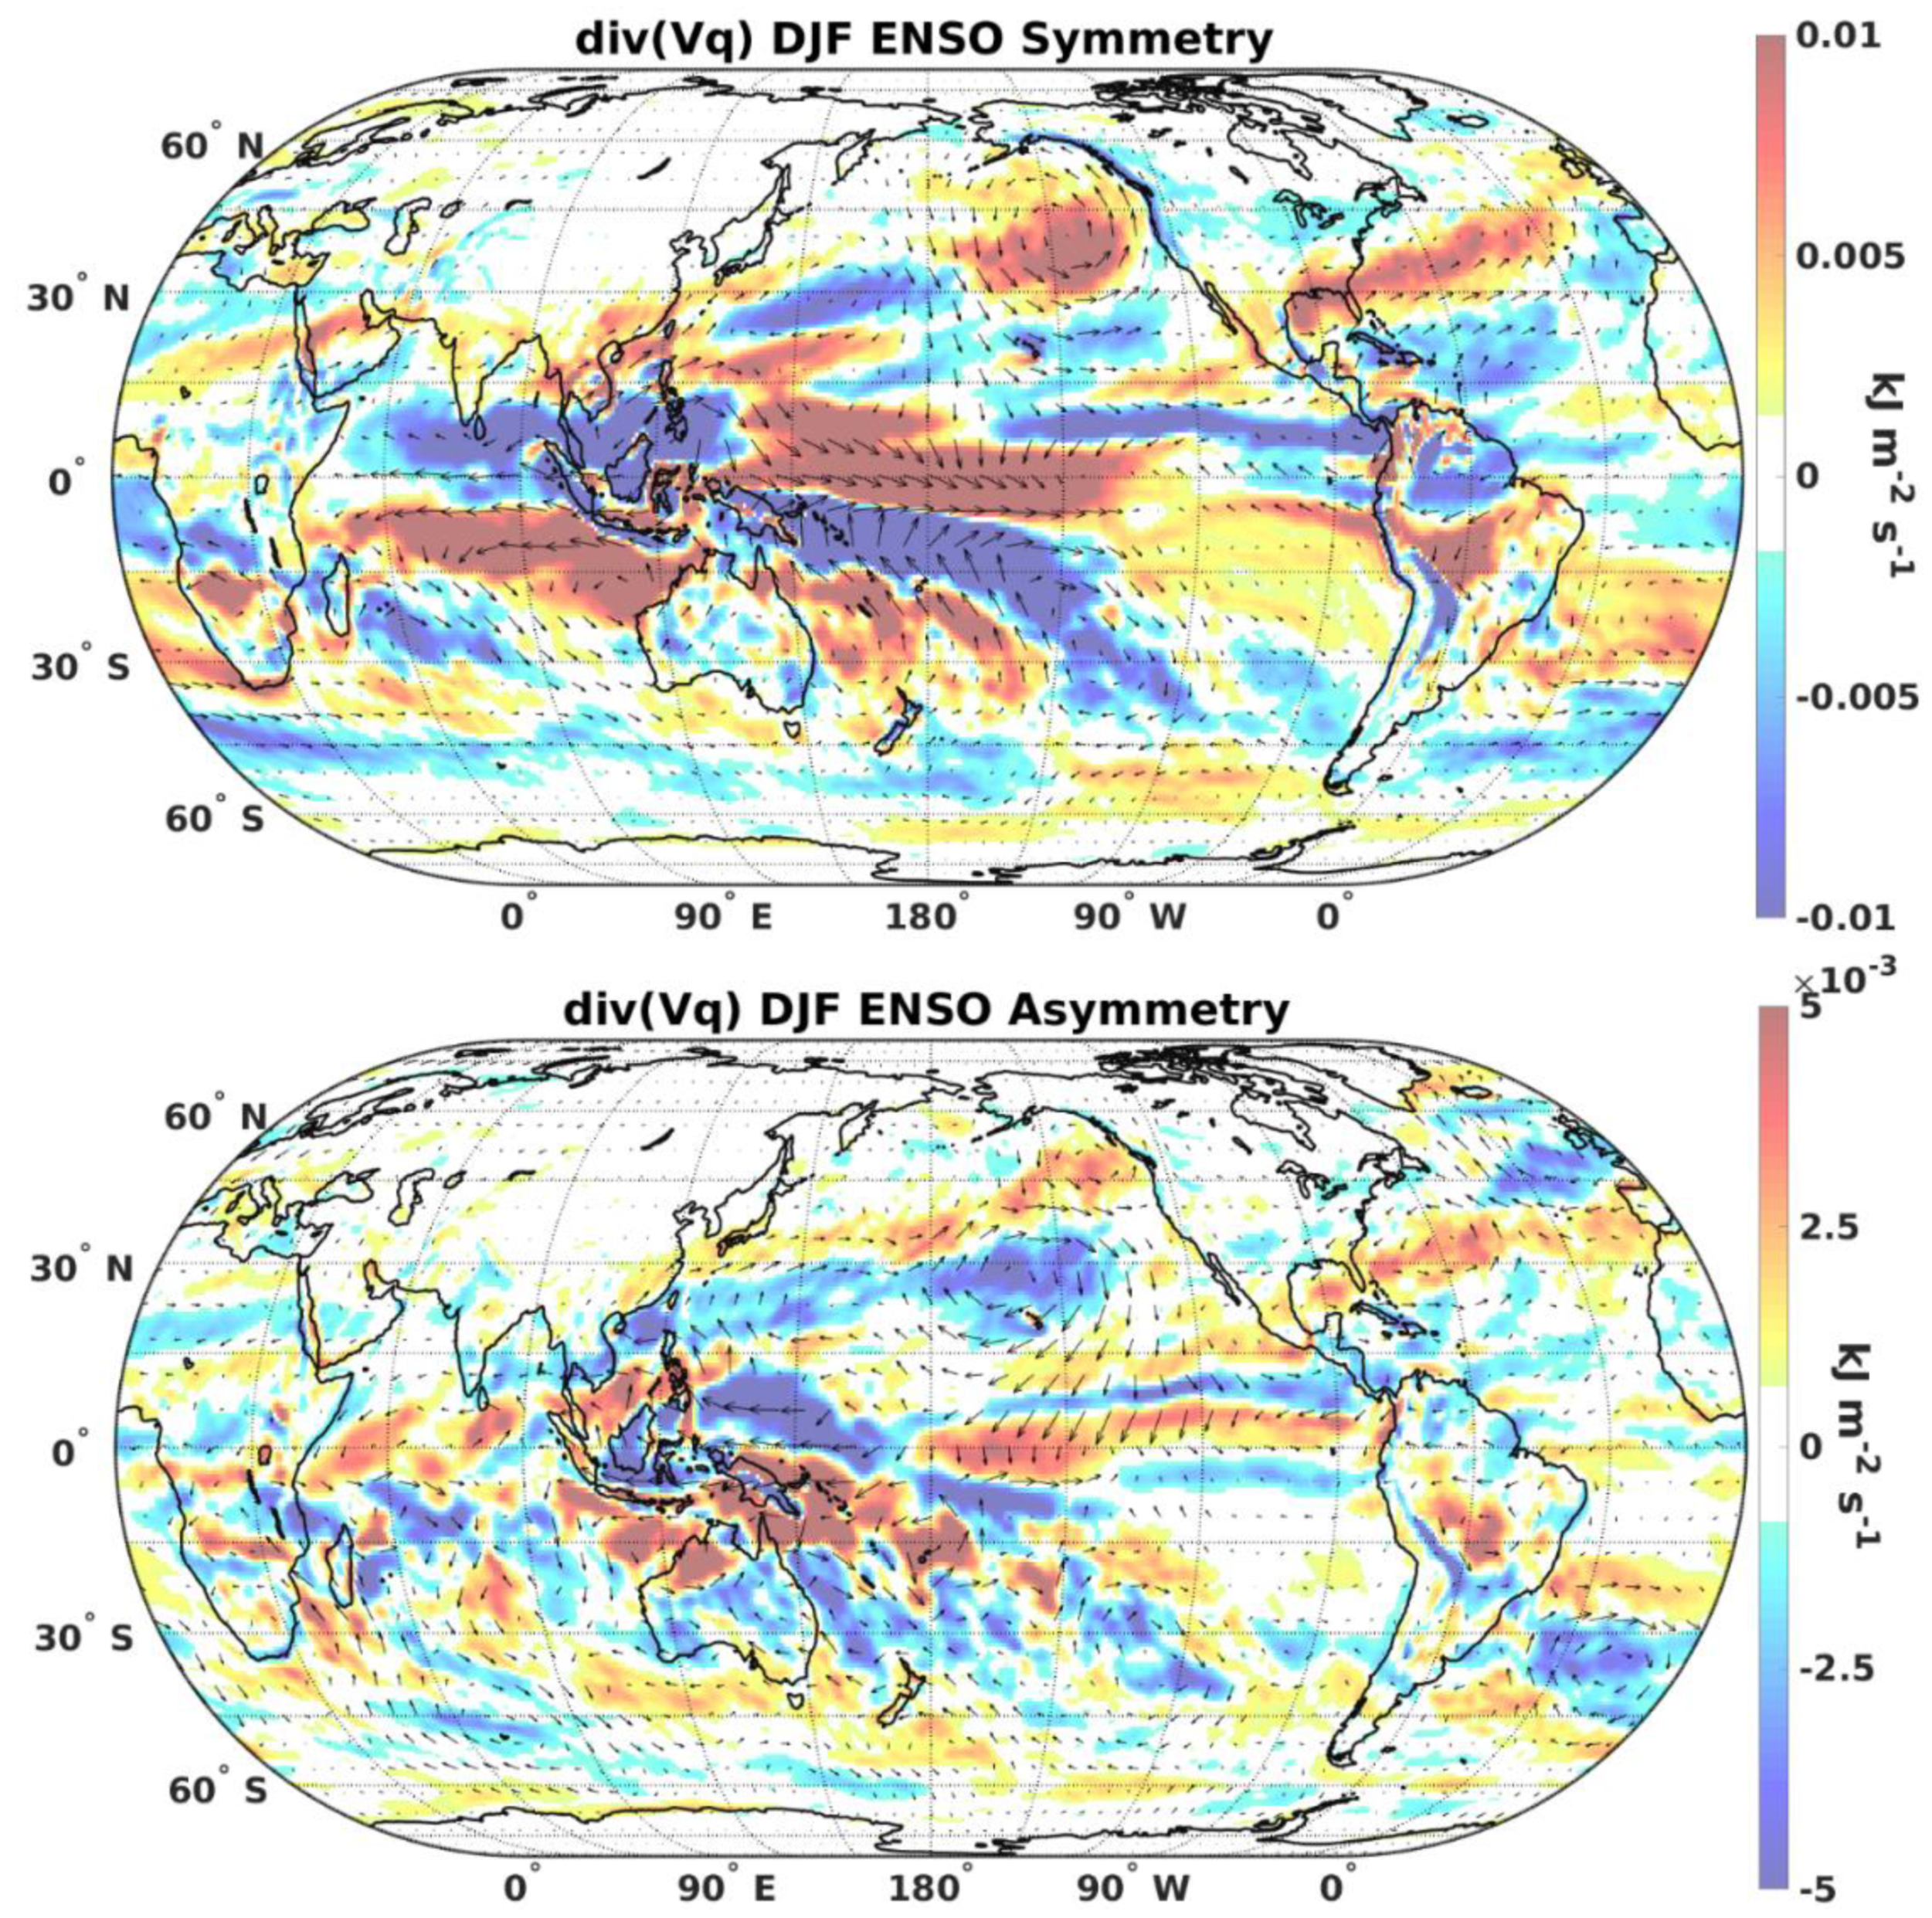
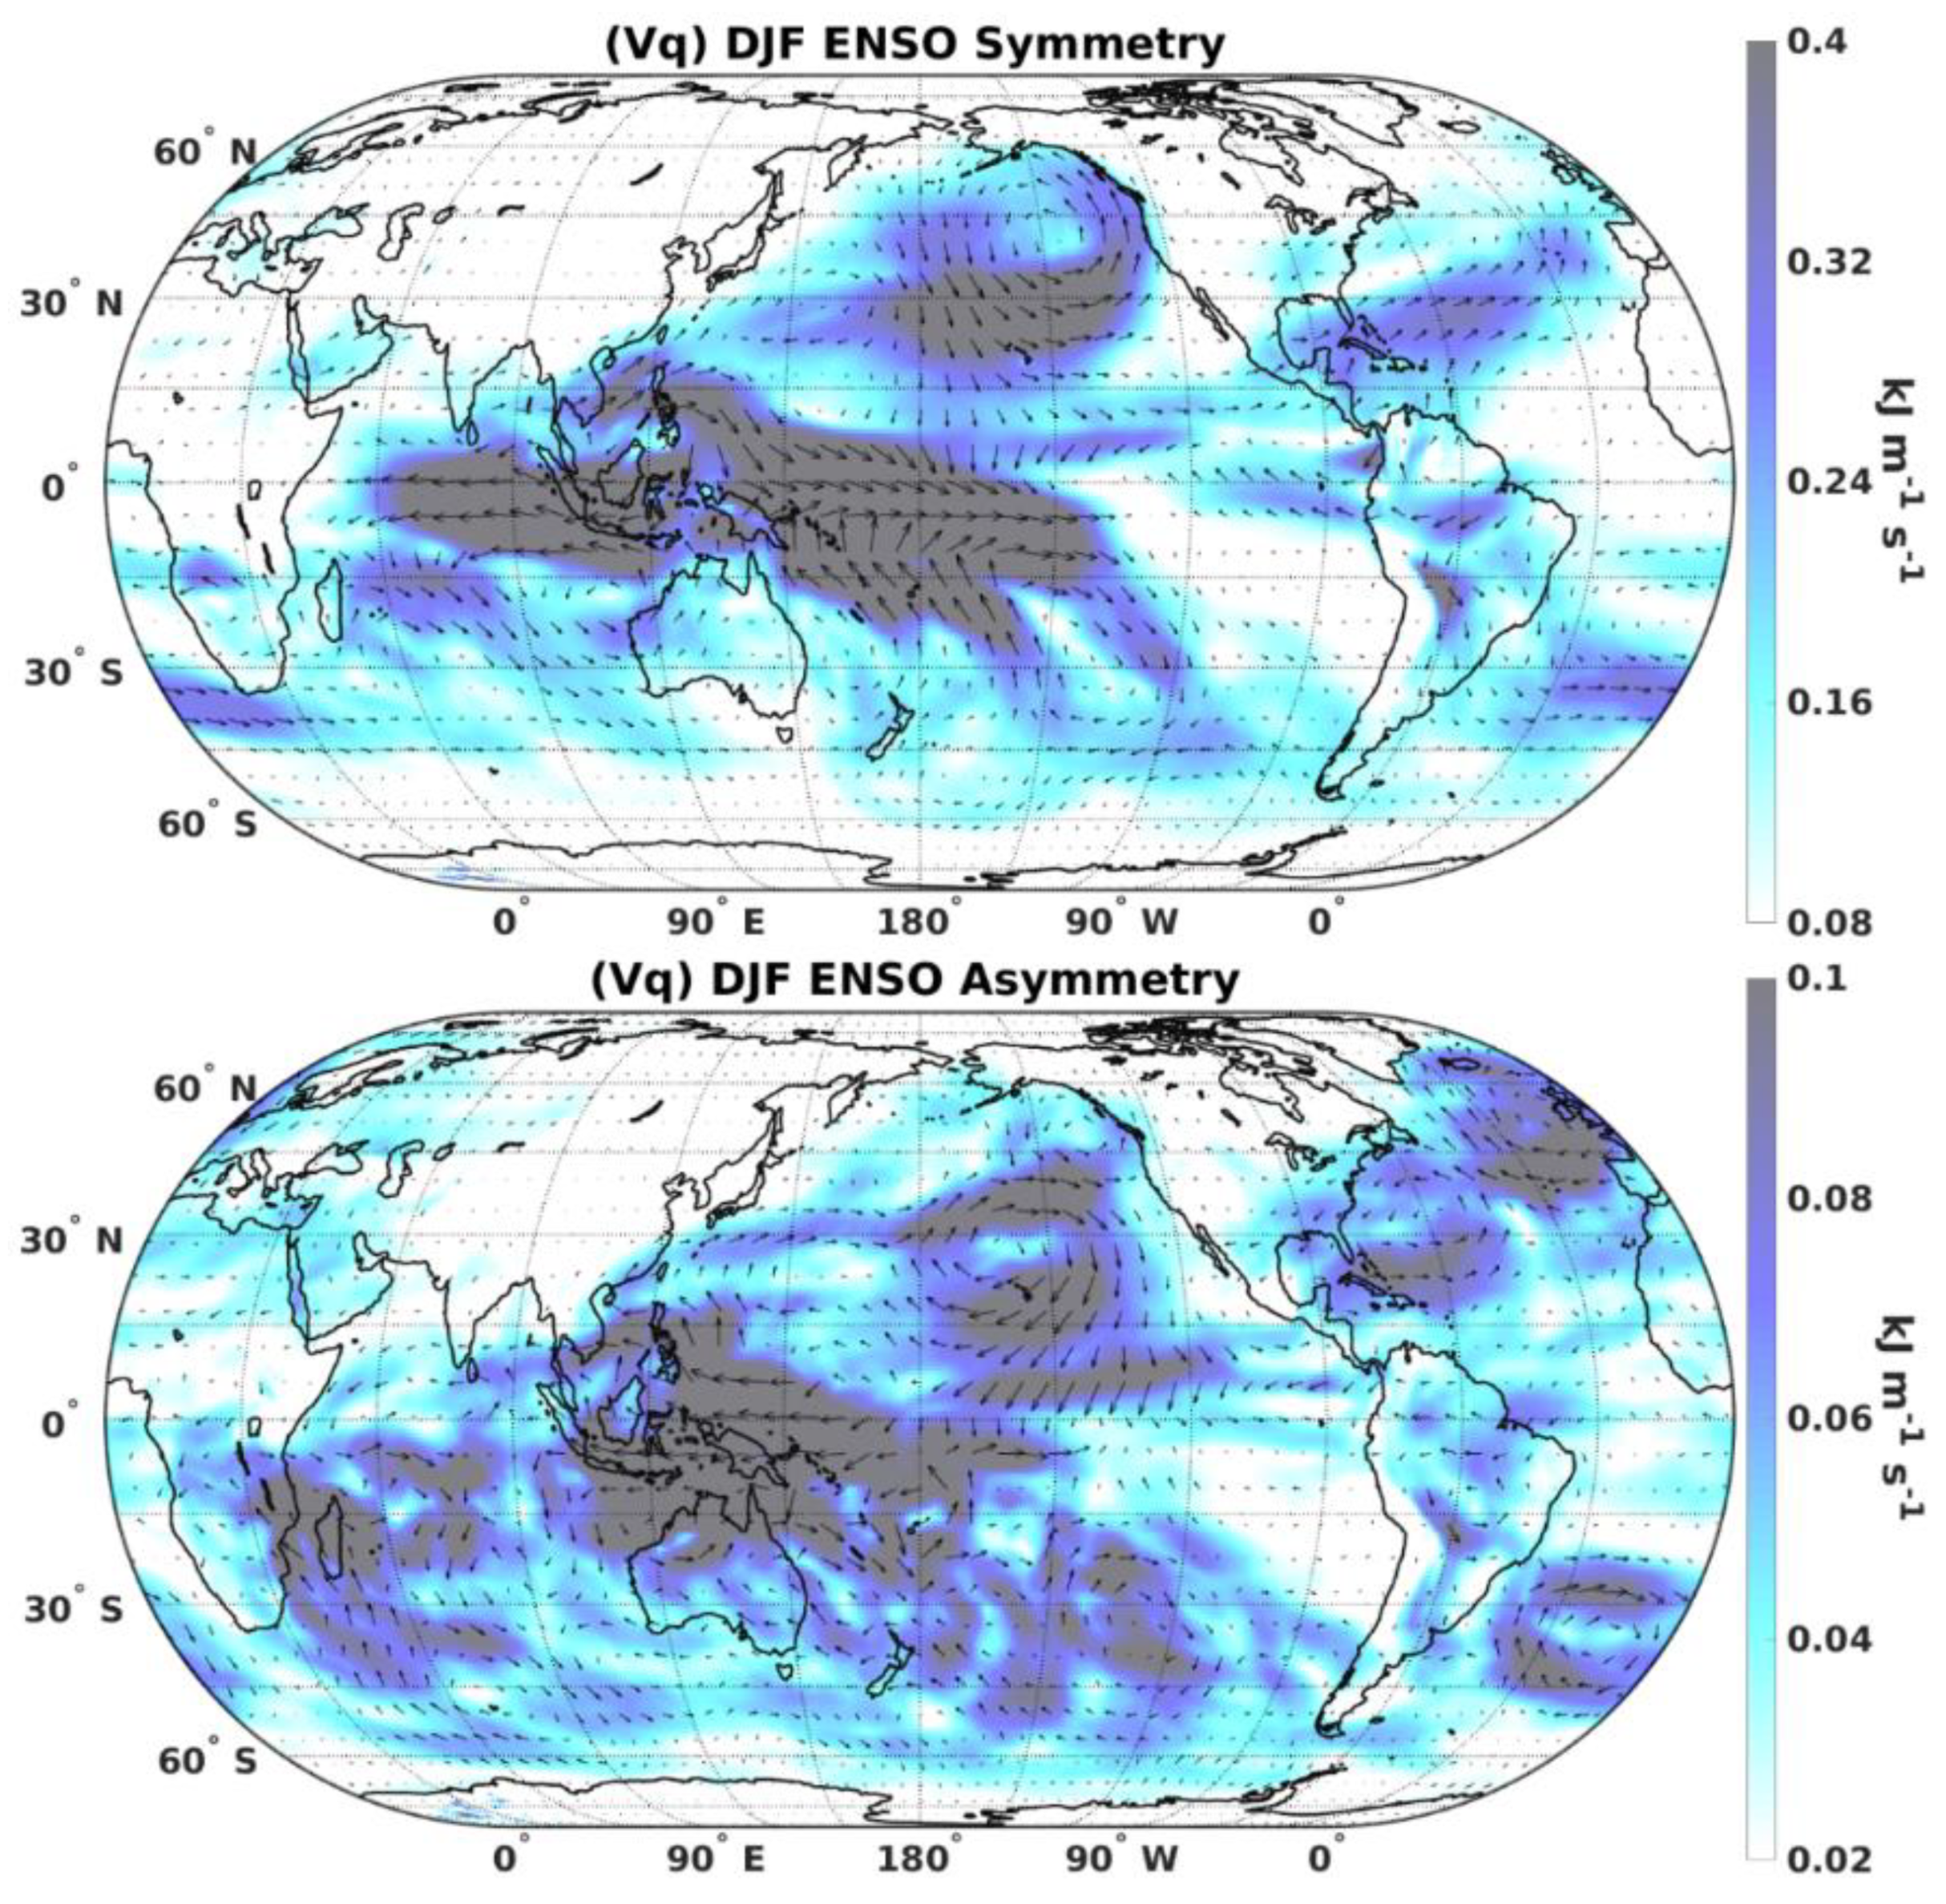
The symmetric component may show ENSO-induced alterations to the Hadley and Walker Circulations, and the symmetric component was larger than the asymmetric component, but substantial asymmetries extended into the mid-latitudes of both hemispheres. The symmetric component showed a region of strongly anomalous divergence centered in the equatorial West Pacific Ocean near 135° E, indicating a weakened Walker Circulation during El Niño events, and vice versa during La Niña events (Figure 4). Additionally, the symmetric component showed similar values across the southeast coasts of Asia and North America and the east coasts of Australia and South America near 30° N/S, consistent with the Hadley Circulation. The asymmetric component was typically the largest (>2.5 × 10⁻³ kJ m−2 s−1) where the gradient in the symmetric component was large, indicating differences in the position or intensity of anomalous circulations induced by each phase of ENSO. For example, the asymmetric component was large (>2.5 × 10⁻³ kJ m−2 s−1) across the northeastern Pacific Ocean where the symmetric component showed a strongly anomalous (>10 × 10−3 kJ m−2 s−1) convergent cyclonic anomaly. Thus, the asymmetric component indicates the convergent anomaly associated with El Niño is positioned closer to the west coast of British Columbia, and the divergent anomaly associated with La Niña is positioned immediately north of the Hawaii Islands (155° W 20° N; Figure 4). Results across the Hawaiian island chain showed a mesoscale couplet of opposite polarity in the symmetric and asymmetric components of latent heat flux divergence. In summary, the symmetric component of anomalous latent heat flux divergence may have shown alterations to the Hadley and Walker Circulations, and while the asymmetric component was smaller, it was generally largest where the gradient in the symmetric component was large.
4. Discussion
The current work was undertaken to investigate horizontal sensible and latent heat flux divergence anomalies that represent physically based proxies for ENSO-induced surface temperature and precipitation anomalies. This approach is justified due to complexities inherent to modeling the dynamic surface temperature and precipitation fields with a limited observation network [1,38,39]. Complex sub-grid scale processes and sharp gradients in the time and space of each variable suggest that alternatives to the reanalyzed fields of surface temperature and precipitation may provide further insight into ENSO-induced weather and climate anomalies at the global scale. More specifically, some of the most important effects of ENSO-induced climate variability (e.g., agriculture and freshwater) are best represented by values of heat and moisture exchange within the soil-plant-atmosphere continuum [63]. Therefore, the results of the current work may be fundamental to improving our understanding of ecosystem responses to ENSO, but many challenges still exist.
ENSO event diversity (e.g., amplitude, position, and timing) is arguably the greatest challenge for improved forecasts of detrimental weather and climate anomalies at a variety of spatial and temporal scales [18]. Neither event-to-event variability nor statistical significance were addressed in the current work, due to a small sample size and problems associated with spatial and temporal autocorrelation in the analyzed fields [64]. While not shown, the standard deviation of latent and sensible heat flux divergence across all El Niño and La Niña events was approximately one order of magnitude larger than the composite means shown in this work. However, the symmetric component (El Niño–La Niña) of standard deviations were of the same order of magnitude as the composite means shown in this work. Therefore, both El Niño and La Niña events have a similar magnitudes of event diversity that may be consistent with stochastic noise [14,18].
4.1. ENSO, PNA, and NAO Climate Variability
The symmetric components of both latent and sensible heat was generally larger than the asymmetric components. However, results presented in Figure 2 and Figure 4 indicate that in many regions globally, both components were the same order of magnitude during the period of study. This result implies the climatologically relevant surface temperature and precipitation anomalies associated with each component, and challenges the common assumption that each phase of ENSO is equal and opposite. For example, El Niño events are known to strengthen the Aleutian low in the North Pacific Ocean, consistent with a positive PNA pattern [65] and vice versa for La Niña events, which is shown in Figure 1 and Figure 3. However, the asymmetric component showed a large (>400 kJ m−2 s−1) convergent anomaly east of the corresponding symmetric anomaly, suggesting the strengthened Aleutian low was positioned closer to the west coast of North America during El Niño events (Figure 2). Conversely, a large divergent anomaly positioned north of Hawaii (155° W 20° N) suggests the weakened Aleutian low associated with La Niña events was positioned farther from the west coast of North America (Figure 2). Positional differences of Aleutian low anomalies associated with each ENSO phase a consistent with previous composite analyses during the DJF period [26]. Results suggest that smaller SST anomalies during La Niña events and larger SST anomalies during El Niño events may proportionally influence the east-to-west positioning of Aleutian low anomalies in the PNA region. Altogether, symmetric and asymmetric components of sensible and latent heat flux divergence indicate a substantial asymmetric component in the relationship between ENSO and PNA patterns of climate variability that may be proportional to differences in SST anomalies.
Similarly, symmetric and asymmetric components were large across the North Atlantic Ocean and adjacent land masses, suggesting that the asymmetry is fundamental to the relationship between ENSO and NAO patterns of climate variability (Figure 2). Previous literature documented ENSO as one of multiple factors influencing the predictability of NAO phase, but ENSO’s influence is not well understood [10,16,66]. Results of the current work indicated that El Niño events resulted in larger anomalies along the east coast of North America, whereas La Niña resulted in larger anomalies across Europe, suggesting that a distinct relationship exists between NAO and each phase of ENSO. Larger anomalies to the west during El Niño and to the east during La Niña suggest that the distinct relationship may be inversely proportional to the SST anomaly magnitude. Therefore, the asymmetric component is non-negligible across PNA and NAO regions, indicating that asymmetry is a fundamental component of ENSO-induced climate variability across North America and Europe that may be inversely proportional to differences in SST anomalies.
4.2. Eurasia and the Southern Hemisphere
The asymmetric component was also large across most of Eurasia, and symmetric and asymmetric components were of opposite sign, indicating that La Niña events resulted in larger implied winter surface temperature anomalies than El Niño events. La Niña events have been shown to decrease the rainfall associated with the East Asian winter monsoon, and El Niño events have been shown to increase rainfall, particularly across southeastern China [67,68]. The results presented in Figure 3 and Figure 4 are consistent with previous findings of ENSO’s influence on the East Asian winter monsoon. However, most previous studies of the relationship between ENSO and Eurasian climate have focused on the warm season when La Niña events have been implicated in severe droughts and heatwaves in Russia [69], and extreme monsoonal flooding in Pakistan and northwest India [70]. Consequently, the results of the current work suggest that severe warm season climate anomalies associated with ENSO in Eurasia could be foreshadowed during the boreal winter, which could improve detection and increasing preparedness months in advance.
Relatively fewer studies have addressed climate variability across the extratropical Southern Hemisphere, due to the lack of meteorological and oceanographic data [1]. However, symmetric and asymmetric components of sensible and latent heat flux divergence were of the same order of magnitude in many locations (Figure 2 and Figure 4), indicating that asymmetry is also a fundamental component of ENSO-induced weather and climate anomalies in the SH. For example, each component of the anomalous latent heat fluxes was large across southern Africa, where ENSO and the Indian Ocean Dipole (IOD) variably influence precipitation [71]. Thus, the large asymmetric component across southern Africa could be associated with two distinct modes of climate variability. The asymmetric component of sensible heat flux was typically the largest near gradients in the symmetric component, suggesting that asymmetries in magnitude of SST anomalies associated with each ENSO phase may proportionally influence the position or magnitude of SH weather and climate anomalies. As an example, a gradient in the symmetric component existed at 30° S, 45° S, and 60° S in the South Indian Ocean, but the asymmetric component showed patterns of anomalous divergence along each aforementioned parallel. This result suggests slight differences in position or magnitude of phase-dependent ENSO-induced climate and weather anomalies in the South Indian Ocean. Therefore, asymmetry is a fundamental aspect of ENSO-induced weather and climate anomalies in both hemispheres, which may be proportional to the asymmetries in surface heat fluxes associated with each phase of ENSO, but additional research is required to confirm these findings.
4.3. Directions for Future Work
Given the profound influence of ENSO on global weather and climate anomalies, and the increasing severity of weather-induced economic and environmental impacts associated with a warming climate [72], the value of accurate seasonal forecasts has never been greater [14]. However, the high spatial and temporal resolution of contemporary atmospheric reanalysis datasets is often underused, indicating a need for studies using reanalysis output on many vertical levels at intra-seasonal time scales. Specifically, analyses focused during ENSO event genesis and decay may yield further insight into positive and negative feedback mechanisms that are responsible for the oscillation between warm and cool ENSO phases [73]. Composite analyses of weak and strong ENSO events are needed to further examine the potential for proportional differences in position or magnitude of weather and climate anomalies that are associated with variable SST anomaly magnitudes. The influence of different ENSO event classifications (e.g., ONI, MEI, SOI) is needed to better understand the different aspects of ocean-atmosphere coupling associated with ENSO. Additional future investigations may include contributions from transient, zonal mean, and stationary wave portions of the circulation [40], diversity in timing, duration, and position of maximum SST anomalies (i.e., ENSO diversity [18]), or verification of the existing climate model output [74]. Furthermore, methods outlined in the current work may be used to validate the spatiotemporal characteristics of the ENSO phenomena that climate models struggle to simulate [75]. Therefore, further investigation using methods similar to those presented in this work may critically improve the currently incomplete understanding of the extratropical atmospheric response to ENSO forcing [14].
5. Conclusions
In the current work, anomalous horizontal fluxes of vertically integrated latent and sensible heat, their divergence, and symmetric and asymmetric components of each, were quantified at the global scale using a well-regarded and widely used atmospheric reanalysis dataset. The novel application of global energy budget methodology to the problem of ENSO-induced weather and climate anomalies, and their symmetry, indicated the potential to improve tremendously valuable seasonal forecasts of anomalous temperature and precipitation patterns. The results showed the far-reaching influence of ENSO forcing, and they challenged the common assumption that weather and climate anomalies associated with each phase of ENSO are simply equal and opposite. The symmetric component of sensible and latent heat flux divergence anomalies was generally larger than the asymmetric component, but asymmetry was shown to be a fundamental component of global scale ENSO-induced weather and climate anomalies. For example, results indicated each phase of ENSO has a distinct influence on weather and climate anomalies across the PNA and NAO regions, which may be proportional to known asymmetries in SST anomalies and subsequent surface heat fluxes across the Niño 3.4 region. Therefore, the novel application of existing methods to ENSO-induced weather and climate anomalies may improve valuable seasonal forecasts while providing multiple directions for future research.
Author Contributions
Conceptualization, E.K., J.H., T.E., and A.L.; Data curation, E.K.; Formal analysis, E.K.; Funding acquisition, J.H.; Investigation, E.K.; Methodology, E.K., J.H., T.E., and A.L.; Supervision, J.H., T.E., and A.L.; Visualization, E.K.; Writing—original draft, E.K.; Writing—review & editing, J.H., T.E., and A.L.
Funding
This work was supported by the National Science Foundation under Award Number OIA-1458952, the USDA National Institute of Food and Agriculture, Hatch project 1011536, and the West Virginia Agricultural and Forestry Experiment Station.
Acknowledgments
Special thanks are due to the many scientists of the Interdisciplinary Hydrology Laboratory (www.forh2o.net) and multiple helpful comments and suggests from anonymous reviewers.
Conflicts of Interest
The authors declare no conflict of interest. The funders had no role in the design of the study; in the collection, analyses, or interpretation of data; in the writing of the manuscript, and in the decision to publish the results.
Appendix A
Figure A1.
Tropospheric latent heat flux anomalies for DJF during composites of all 13 El Nino events (top) and all 12 La Niña events (bottom) occurring between 1979 and 2016 (Table 1). Color shading represents the vector magnitude (kJ m−1 s−1).
Figure A1.
Tropospheric latent heat flux anomalies for DJF during composites of all 13 El Nino events (top) and all 12 La Niña events (bottom) occurring between 1979 and 2016 (Table 1). Color shading represents the vector magnitude (kJ m−1 s−1).

Figure A2.
Symmetric (top) and asymmetric (bottom) components of the tropospheric latent heat flux anomalies for DJF during all ENSO events occurring between 1979 and 2016 (Table 1). Color shading represents vector magnitude (kJ m−1 s−1).
Figure A2.
Symmetric (top) and asymmetric (bottom) components of the tropospheric latent heat flux anomalies for DJF during all ENSO events occurring between 1979 and 2016 (Table 1). Color shading represents vector magnitude (kJ m−1 s−1).

Figure A3.
Tropospheric sensible heat flux anomalies for DJF during composites of all 13 El Nino events (top) and all 12 La Niña events (bottom) occurring between 1979 and 2016 (Table 1). Color shading represents the vector magnitude (kJ m−1 s−1).
Figure A3.
Tropospheric sensible heat flux anomalies for DJF during composites of all 13 El Nino events (top) and all 12 La Niña events (bottom) occurring between 1979 and 2016 (Table 1). Color shading represents the vector magnitude (kJ m−1 s−1).

Figure A4.
Symmetric (top) and asymmetric (bottom) components of the tropospheric sensible heat flux anomalies for DJF during all ENSO events occurring between 1979 and 2016 (Table 1). Color shading represents the vector magnitude (kJ m−1 s−1).
Figure A4.
Symmetric (top) and asymmetric (bottom) components of the tropospheric sensible heat flux anomalies for DJF during all ENSO events occurring between 1979 and 2016 (Table 1). Color shading represents the vector magnitude (kJ m−1 s−1).

References
- Trenberth, K.E.; Branstator, G.W.; Karoly, D.; Kumar, A.; Lau, N.C.; Ropelewski, C. Progress during TOGA in understanding and modeling global teleconnections associated with tropical sea surface temperatures. J. Geophys. Res. Oceans 1998, 103, 14291–14324. [Google Scholar] [CrossRef] [Green Version]
- Collins, M.; An, S.I.; Cai, W.; Ganachaud, A.; Guilyardi, E.; Jin, F.F.; Jochum, M.; Lengaigne, M.; Power, S.; Timmermann, A.; et al. The impact of global warming on the tropical Pacific Ocean and El Niño. Nat. Geosci. 2010, 3, 391. [Google Scholar] [CrossRef]
- Barnston, A.G.; Glantz, M.H.; He, Y. Predictive skill of statistical and dynamical climate models in SST forecasts during the 1997–1998 El Niño episode and the 1998 La Niña onset. Bull. Am. Meteorol. Soc. 1999, 80, 217–244. [Google Scholar] [CrossRef]
- Okumura, Y.M.; Deser, C. Asymmetry in the duration of El Niño and La Niña. J. Clim. 2010, 23, 5826–5843. [Google Scholar] [CrossRef]
- Ropelewski, C.F.; Jones, P.D. An extension of the Tahiti–Darwin southern oscillation index. Mon. Weather Rev. 1987, 115, 2161–2165. [Google Scholar] [CrossRef]
- McPhaden, M.J.; Bahr, F.; Du Penhoat, Y.; Firing, E.; Hayes, S.P.; Niiler, P.P.; Richardson, P.L.; Toole, J.M. The response of the western equatorial Pacific Ocean to westerly wind bursts during November 1989 to January 1990. J. Geophys. Res. Oceans 1992, 97, 14289–14303. [Google Scholar] [CrossRef]
- Rasmusson, E.M.; Carpenter, T.H. Variations in tropical sea surface temperature and surface wind fields associated with the Southern Oscillation/El Niño. Mon. Weather Rev. 1982, 110, 354–384. [Google Scholar] [CrossRef]
- Cayan, D.R. Latent and sensible heat flux anomalies over the northern oceans: Driving the sea surface temperature. J. Phys. Oceanogr. 1992, 22, 859–881. [Google Scholar] [CrossRef]
- Ropelewski, C.F.; Halpert, M.S. North American precipitation and temperature patterns associated with the El Niño/Southern Oscillation (ENSO). Mon. Weather Rev. 1986, 114, 2352–2362. [Google Scholar] [CrossRef]
- Brönnimann, S. Impact of El Niño–southern oscillation on European climate. Rev. Geophys. 2007, 45. [Google Scholar] [CrossRef]
- Stechmann, S.N.; Ogrosky, H.R. The Walker circulation, diabatic heating, and outgoing longwave radiation. Geophys. Res. Lett. 2014, 41, 9097–9105. [Google Scholar] [CrossRef]
- Johnson, N.C.; Kosaka, Y. The impact of eastern equatorial Pacific convection on the diversity of boreal winter El Niño teleconnection patterns. Clim. Dyn. 2016, 47, 3737–3765. [Google Scholar] [CrossRef]
- Franzke, C.; Feldstein, S.B. The continuum and dynamics of Northern Hemisphere teleconnection patterns. J. Atmos. Sci. 2005, 62, 3250–3267. [Google Scholar] [CrossRef]
- Deser, C.; Simpson, I.R.; McKinnon, K.A.; Phillips, A.S. The Northern Hemisphere extratropical atmospheric circulation response to ENSO: How well do we know it and how do we evaluate models accordingly? J. Clim. 2017, 30, 5059–5082. [Google Scholar] [CrossRef]
- Straus, D.M.; Shukla, J. Does ENSO force the PNA? J. Clim. 2002, 15, 2340–2358. [Google Scholar] [CrossRef]
- Scaife, A.A.; Arribas, A.; Blockley, E.; Brookshaw, A.; Clark, R.T.; Dunstone, N.; Eade, R.; Fereday, D.; Folland, C.K.; Gordon, M.; et al. Skillful long-range prediction of European and North American winters. Geophys. Res. Lett. 2014, 41, 2514–2519. [Google Scholar] [CrossRef] [Green Version]
- Hurrell, J.W.; Deser, C. North Atlantic climate variability: The role of the North Atlantic Oscillation. J. Mar. Syst. 2010, 79, 231–244. [Google Scholar] [CrossRef]
- Capotondi, A.; Wittenberg, A.T.; Newman, M.; Di Lorenzo, E.; Yu, J.Y.; Braconnot, P.; Cole, J.; Dewitte, B.; Giese, B.; Guilyardi, E.; et al. Understanding ENSO diversity. Bull. Am. Meteorol. Soc. 2015, 96, 921–938. [Google Scholar] [CrossRef]
- Ropelewski, C.F.; Halpert, M.S. Precipitation patterns associated with the high index phase of the Southern Oscillation. J. Clim. 1989, 2, 268–284. [Google Scholar] [CrossRef]
- Halpert, M.S.; Ropelewski, C.F. Surface temperature patterns associated with the Southern Oscillation. J. Clim. 1992, 5, 577–593. [Google Scholar] [CrossRef]
- Freeman, E.; Woodruff, S.D.; Worley, S.J.; Lubker, S.J.; Kent, E.C.; Angel, W.E.; Berry, D.I.; Brohan, P.; Eastman, R.; Gates, L.; et al. ICOADS Release 3.0: A major update to the historical marine climate record. Int. J. Climatol. 2017, 37, 2211–2232. [Google Scholar] [CrossRef] [Green Version]
- Dai, A.; Wigley, T.M.L. Global patterns of ENSO-induced precipitation. Geophys. Res. Lett. 2000, 27, 1283–1286. [Google Scholar] [CrossRef] [Green Version]
- Mo, K.C. Interdecadal modulation of the impact of ENSO on precipitation and temperature over the United States. J. Clim. 2010, 23, 3639–3656. [Google Scholar] [CrossRef]
- Zhang, Q.; Li, J.; Singh, V.P.; Xu, C.Y.; Deng, J. Influence of ENSO on precipitation in the East River basin, South China. J. Geophys. Res. Atmos. 2013, 118, 2207–2219. [Google Scholar] [CrossRef]
- Davey, M.K.; Brookshaw, A.; Ineson, S. The probability of the impact of ENSO on precipitation and near-surface temperature. Clim. Risk Manage. 2014, 1, 5–24. [Google Scholar] [CrossRef]
- Garreaud, R.; Battisti, D.S. Interannual (ENSO) and interdecadal (ENSO-like) variability in the Southern Hemisphere tropospheric circulation. J. Clim. 1999, 12, 2113–2123. [Google Scholar] [CrossRef]
- Dee, D.P.; Uppala, S.M.; Simmons, A.J.; Berrisford, P.; Poli, P.; Kobayashi, S.; Andrae, U.; Balmaseda, M.A.; Balsamo, G.; Bauer, D.P.; et al. The ERA-Interim reanalysis: Configuration and performance of the data assimilation system. Q. J. R. Meteorol. Soc. 2011, 137, 553–597. [Google Scholar] [CrossRef]
- Zhang, T.; Perlwitz, J.; Hoerling, M.P. What is responsible for the strong observed asymmetry in teleconnections between El Niño and La Niña? Geophys. Res. Lett. 2014, 41, 1019–1025. [Google Scholar] [CrossRef] [Green Version]
- Frauen, C.; Dommenget, D.; Tyrrell, N.; Rezny, M.; Wales, S. Analysis of the nonlinearity of El Niño–Southern Oscillation teleconnections. J. Clim. 2014, 27, 6225–6244. [Google Scholar] [CrossRef]
- Larkin, N.K.; Harrison, D.E. ENSO warm (El Niño) and cold (La Niña) event life cycles: Ocean surface anomaly patterns, their symmetries, asymmetries, and implications. J. Clim. 2002, 15, 1118–1140. [Google Scholar] [CrossRef]
- Hoerling, M.P.; Kumar, A.; Zhong, M. El Niño, La Niña, and the nonlinearity of their teleconnections. J. Clim. 1997, 10, 1769–1786. [Google Scholar] [CrossRef]
- Dogar, M.M.; Kucharski, F.; Azharuddin, S. Study of the global and regional climatic impacts of ENSO magnitude using SPEEDY AGCM. J. Earth Syst. Sci. 2017, 126, 30. [Google Scholar] [CrossRef]
- Kim, S.; Son, H.Y.; Kug, J.S. Relative roles of equatorial central Pacific and western North Pacific precipitation anomalies in ENSO teleconnection over the North Pacific. Clim. Dyn. 2017, 1–11. [Google Scholar] [CrossRef]
- Xie, S.P.; Zhou, Z.Q. Seasonal modulations of El Niño–related atmospheric variability: Indo–western Pacific Ocean feedback. J. Clim. 2017, 30, 3461–3472. [Google Scholar] [CrossRef]
- Shaw, T.A.; Pauluis, O. Tropical and subtropical meridional latent heat transports by disturbances to the zonal mean and their role in the general circulation. J. Atmos. Sci. 2012, 69, 1872–1889. [Google Scholar] [CrossRef]
- Piani, C.; Haerter, J.O.; Coppola, E. Statistical bias correction for daily precipitation in regional climate models over Europe. Theor. Appl. Climatol. 2010, 99, 187–192. [Google Scholar] [CrossRef]
- Simmons, A.J.; Willett, K.M.; Jones, P.D.; Thorne, P.W.; Dee, D.P. Low-frequency variations in surface atmospheric humidity, temperature, and precipitation: Inferences from reanalyses and monthly gridded observational data sets. J. Geophys. Res. Atmos. 2010, 115. [Google Scholar] [CrossRef] [Green Version]
- Atlaskin, E.; Vihma, T. Evaluation of NWP results for wintertime nocturnal boundary-layer temperatures over Europe and Finland. Q. J. R. Meteorol. Soc. 2012, 138, 1440–1451. [Google Scholar] [CrossRef] [Green Version]
- Shrestha, D.L.; Robertson, D.E.; Wang, Q.J.; Pagano, T.C.; Hapuarachchi, H.A.P. Evaluation of numerical weather prediction model precipitation forecasts for short-term streamflow forecasting purpose. Hydrol. Earth. Syst. Sci. 2013, 17, 1913–1931. [Google Scholar] [CrossRef] [Green Version]
- Yu, L.; Weller, R.A. Objectively analyzed air–sea heat fluxes for the global ice-free oceans (1981–2005). Bull. Am. Meteorol. Soc. 2007, 88, 527–540. [Google Scholar] [CrossRef]
- Newman, M.; Kiladis, G.N.; Weickmann, K.M.; Ralph, F.M.; Sardeshmukh, P.D. Relative contributions of synoptic and low-frequency eddies to time-mean atmospheric moisture transport, including the role of atmospheric rivers. J. Clim. 2012, 25, 7341–7361. [Google Scholar] [CrossRef]
- Lupo, A.R.; Smith, P.J.; Zwack, P. A diagnosis of the explosive development of two extratropical cyclones. Mon. Weather Rev. 1992, 120, 1490–1523. [Google Scholar] [CrossRef]
- Neiman, P.J.; May, P.T.; Shapiro, M.A. Radio acoustic sounding system (RASS) and wind profiler observations of lower-and midtropospheric weather systems. Mon. Weather Rev. 1992, 120, 2298–2313. [Google Scholar] [CrossRef]
- Yu, J.Y.; Kim, S.T. Identifying the types of major El Niño events since 1870. Int. J. Climatol. 2013, 33, 2105–2112. [Google Scholar] [CrossRef]
- Troup, A.J. The ‘southern oscillation’. Q. J. R. Meteorol. Soc. 1965, 91, 490–506. [Google Scholar] [CrossRef]
- Wolter, K.; Timlin, M.S. Measuring the strength of ENSO events: How does 1997/98 rank? Weather 1998, 53, 315–324. [Google Scholar] [CrossRef]
- Wolter, K.; Timlin, M.S. El Niño/Southern Oscillation behaviour since 1871 as diagnosed in an extended multivariate ENSO index (MEI. ext). Int. J. Climatol. 2011, 31, 1074–1087. [Google Scholar] [CrossRef]
- Kirtman, B.P.; Min, D.; Infanti, J.M.; Kinter, J.L., III; Paolino, D.A.; Zhang, Q.; Van Den Dool, H.; Saha, S.; Mendez, M.P.; Becker, E.; et al. The North American multimodel ensemble: Phase-1 seasonal-to-interannual prediction; phase-2 toward developing intraseasonal prediction. Bull. Am. Meteorol. Soc. 2014, 95, 585–601. [Google Scholar] [CrossRef]
- Huang, B.; Thorne, P.W.; Banzon, V.F.; Boyer, T.; Chepurin, G.; Lawrimore, J.H.; Menne, M.J.; Smith, T.M.; Vose, R.S.; Zhang, H.M. Extended reconstructed sea surface temperature, version 5 (ERSSTv5): Upgrades, validations, and intercomparisons. J. Clim. 2017, 30, 8179–8205. [Google Scholar] [CrossRef]
- Alexander, M.A.; Bladé, I.; Newman, M.; Lanzante, J.R.; Lau, N.C.; Scott, J.D. The atmospheric bridge: The influence of ENSO teleconnections on air–sea interaction over the global oceans. J. Clim. 2002, 15, 2205–2231. [Google Scholar] [CrossRef]
- Ji, X.; Neelin, J.D.; Mechoso, C.R. Baroclinic-to-barotropic pathway in El Niño–Southern Oscillation teleconnections from the viewpoint of a barotropic Rossby wave source. J. Atmos. Sci. 2016, 73, 4989–5002. [Google Scholar] [CrossRef]
- L’Heureux, M.L.; Tippett, M.K.; Barnston, A.G. Reply to “Comment on ‘Characterizing ENSO Coupled Variability and Its Impact on North American Seasonal Precipitation and Temperature’”. J. Clim. 2017, 30, 437–441. [Google Scholar] [CrossRef]
- European Centre for Medium-Range Weather Forecasts. 2009, updated monthly. ERA-Interim Project. Research Data Archive at the National Center for Atmospheric Research, Computational and Information Systems Laboratory. Available online: https://doi.org/10.5065/D6CR5RD9 (accessed on 1 July 2016).
- Kim, H.M.; Alexander, M.A. ENSO’s modulation of water vapor transport over the Pacific–North American region. J. Clim. 2015, 28, 3846–3856. [Google Scholar] [CrossRef]
- Simmons, A. ERA-Interim: New ECMWF reanalysis products from 1989 onwards. ECMWF Newslet. 2006, 110, 25–36. [Google Scholar]
- Reutter, P.; Škerlak, B.; Sprenger, M.; Wernli, H. Stratosphere–troposphere exchange (STE) in the vicinity of North Atlantic cyclones. Atmos. Chem. Phys. 2015, 15, 10939–10953. [Google Scholar] [CrossRef] [Green Version]
- Dessler, A.E.; Schoeberl, M.R.; Wang, T.; Davis, S.M.; Rosenlof, K.H.; Vernier, J.P. Variations of stratospheric water vapor over the past three decades. J. Geophys. Res. Atmos. 2014, 119. [Google Scholar] [CrossRef]
- Trenberth, K.E. Climate diagnostics from global analyses: Conservation of mass in ECMWF analyses. J. Clim. 1991, 4, 707–722. [Google Scholar] [CrossRef]
- Mayer, M.; Haimberger, L. Poleward atmospheric energy transports and their variability as evaluated from ECMWF reanalysis data. J. Clim. 2012, 25, 734–752. [Google Scholar] [CrossRef]
- Zhang, T.; Hoerling, M.P.; Perlwitz, J.; Sun, D.Z.; Murray, D. Physics of US surface temperature response to ENSO. J. Clim. 2011, 24, 4874–4887. [Google Scholar] [CrossRef]
- Capek, R. Which is the best projection for the world map. In Proceedings of the 20th international Cartographic Conference, Beijing, China, 6–10 August 2001; Volume 5, pp. 3084–3093. [Google Scholar]
- Kutta, E.; Hubbart, J.A.; Svoma, B.M.; Eichler, T.; Lupo, A.R. Symmetric and asymmetric components of anomalous tropospheric-mean horizontal fluxes of latent and sensible heat associated with ENSO events of variable magnitude. Atmos. Res. 2017, 198, 173–184. [Google Scholar] [CrossRef]
- Greenland, D.; Goodin, D.G.; Smith, R.C. (Eds.) Climate Variability and Ecosystem Response at Long-Term Ecological Research Sites; Oxford University Press: New York, NY, USA, 2003; p. 9. [Google Scholar]
- Wilks, D. Statistical Methods in the Atmospheric Sciences, 3rd ed.; Elsevier Inc.: Waltham, MA, USA, 2011. [Google Scholar]
- Meehl, G.A.; Teng, H. Multi-model changes in El Niño teleconnections over North America in a future warmer climate. Clim. Dyn. 2007, 29, 779–790. [Google Scholar] [CrossRef]
- Dunstone, N.; Smith, D.; Scaife, A.; Hermanson, L.; Eade, R.; Robinson, N.; Andrews, M.; Knight, J. Skillful predictions of the winter North Atlantic Oscillation one year ahead. Nat. Geosci. 2016, 9, 809–814. [Google Scholar] [CrossRef]
- Zhou, L.T.; Wu, R. Respective impacts of the East Asian winter monsoon and ENSO on winter rainfall in China. J. Geophys. Res. Atmos. 2010, 115. [Google Scholar] [CrossRef]
- Chen, W.; Lan, X.; Wang, L.; Ma, Y. The combined effects of the ENSO and the Arctic Oscillation on the winter climate anomalies in East Asia. Chin. Sci. Bull. 2013, 58, 1355–1362. [Google Scholar] [CrossRef] [Green Version]
- Mokhov, I.I.; Timazhev, A.V. November. Climatic anomalies in Eurasia from El Niño/La Niña effects. Dokl. Earth Sci. 2013, 453, 1141–1144. [Google Scholar] [CrossRef]
- Mujumdar, M.; Preethi, B.; Sabin, T.P.; Ashok, K.; Saeed, S.; Pai, D.S.; Krishnan, R. The Asian summer monsoon response to the La Niña event of 2010. Meteorol. Appl. 2012, 19, 216–225. [Google Scholar] [CrossRef] [Green Version]
- Gaughan, A.E.; Staub, C.G.; Hoell, A.; Weaver, A.; Waylen, P.R. Inter-and Intra-annual precipitation variability and associated relationships to ENSO and the IOD in southern Africa. Int. J. Climatol. 2016, 36, 1643–1656. [Google Scholar] [CrossRef]
- Stott, P. How climate change affects extreme weather events. Science 2016, 352, 1517–1518. [Google Scholar] [CrossRef] [PubMed]
- Wang, C.; Deser, C.; Yu, J.Y.; DiNezio, P.; Clement, A. El Niño and southern oscillation (ENSO): A review. In Coral Reefs of the Eastern Tropical Pacific; Springer Science Publisher: New York, NY, USA, 2017; pp. 85–106. [Google Scholar]
- Guilyardi, E.; Wittenberg, A.; Balmaseda, M.; Cai, W.; Collins, M.; McPhaden, M.J.; Watanabe, M.; Yeh, S.W. Fourth CLIVAR workshop on the evaluation of ENSO processes in climate models: ENSO in a changing climate. Bull. Am. Meteorol. Soc. 2016, 97, 817–820. [Google Scholar] [CrossRef]
- Bellenger, H.; Guilyardi, É.; Leloup, J.; Lengaigne, M.; Vialard, J. ENSO representation in climate models: From CMIP3 to CMIP5. Clim. Dyn. 2014, 42, 1999–2018. [Google Scholar] [CrossRef]
Figure 1.
Tropospheric sensible heat flux divergence anomalies for December, January, February (DJF) during composites of all 13 El Nino events (top) and all 12 La Niña events (bottom) occurring between 1979 and 2016 (Table 1). Color shading represents vector divergence (kJ m−2 s−1).
Figure 1.
Tropospheric sensible heat flux divergence anomalies for December, January, February (DJF) during composites of all 13 El Nino events (top) and all 12 La Niña events (bottom) occurring between 1979 and 2016 (Table 1). Color shading represents vector divergence (kJ m−2 s−1).

Figure 2.
Symmetric (top) and asymmetric (bottom) components of the tropospheric sensible heat flux divergence anomalies for DJF during all El Niño-Southern Oscillation (ENSO) events, occurring between 1979 and 2016 (Table 1). Color shading represents vector divergence (kJ m−2 s−1).
Figure 2.
Symmetric (top) and asymmetric (bottom) components of the tropospheric sensible heat flux divergence anomalies for DJF during all El Niño-Southern Oscillation (ENSO) events, occurring between 1979 and 2016 (Table 1). Color shading represents vector divergence (kJ m−2 s−1).

Figure 3.
Tropospheric latent heat flux divergence anomalies for DJF during composites of all 13 El Nino events (top) and all 12 La Niña events (bottom) occurring between 1979 and 2016 (Table 1). Color shading represents vector divergence (kJ m−2 s−1).
Figure 3.
Tropospheric latent heat flux divergence anomalies for DJF during composites of all 13 El Nino events (top) and all 12 La Niña events (bottom) occurring between 1979 and 2016 (Table 1). Color shading represents vector divergence (kJ m−2 s−1).

Figure 4.
Symmetric (top) and asymmetric (bottom) components of tropospheric latent heat flux divergence anomalies for DJF during all ENSO events occurring between 1979 and 2016 (Table 1). Color shading represents vector divergence (kJ m−2 s−1).
Figure 4.
Symmetric (top) and asymmetric (bottom) components of tropospheric latent heat flux divergence anomalies for DJF during all ENSO events occurring between 1979 and 2016 (Table 1). Color shading represents vector divergence (kJ m−2 s−1).


Table 1.
Summary of 13 El Niño events and 12 La Niña events occurring between 1979 and 2016, including the Oceanic Niño Index (ONI) values recorded during December, January, February (DJF) per event, where, ONI = Oceanic Niño Index.
Table 1.
Summary of 13 El Niño events and 12 La Niña events occurring between 1979 and 2016, including the Oceanic Niño Index (ONI) values recorded during December, January, February (DJF) per event, where, ONI = Oceanic Niño Index.
| El Niño | DJF ONI | La Niña | DJF ONI |
|---|---|---|---|
| 1979–1980 | 0.6 °C | 1983–1984 | −0.6 °C |
| 1982–1983 | 2.2 °C | 1984–1985 | −1.0 °C |
| 1986–1987 | 1.2 °C | 1988–1989 | −1.7 °C |
| 1987–1988 | 0.8 °C | 1995–1996 | −0.9 °C |
| 1991–1992 | 1.7 °C | 1998–1999 | −1.5 °C |
| 1994–1995 | 1.0 °C | 1999–2000 | −1.7 °C |
| 1997–1998 | 2.2 °C | 2000–2001 | −0.7 °C |
| 2002–2003 | 0.9 °C | 2005–2006 | −0.8 °C |
| 2004–2005 | 0.6 °C | 2007–2008 | −1.6 °C |
| 2006–2007 | 0.7 °C | 2008–2009 | −0.8 °C |
| 2009–2010 | 1.5 °C | 2010–2011 | −1.4 °C |
| 2014–2015 | 0.6 °C | 2011–2012 | −0.8 °C |
| 2015–2016 | 2.5 °C |
© 2018 by the authors. Licensee MDPI, Basel, Switzerland. This article is an open access article distributed under the terms and conditions of the Creative Commons Attribution (CC BY) license (http://creativecommons.org/licenses/by/4.0/).
Share and Cite
MDPI and ACS Style
Kutta, E.; Hubbart, J.A.; Eichler, T.P.; Lupo, A.R. Symmetry of Energy Divergence Anomalies Associated with the El Niño-Southern Oscillation. Atmosphere 2018, 9, 342. https://doi.org/10.3390/atmos9090342
AMA Style
Kutta E, Hubbart JA, Eichler TP, Lupo AR. Symmetry of Energy Divergence Anomalies Associated with the El Niño-Southern Oscillation. Atmosphere. 2018; 9(9):342. https://doi.org/10.3390/atmos9090342
Chicago/Turabian StyleKutta, Evan, Jason A. Hubbart, Timothy P. Eichler, and Anthony R. Lupo. 2018. "Symmetry of Energy Divergence Anomalies Associated with the El Niño-Southern Oscillation" Atmosphere 9, no. 9: 342. https://doi.org/10.3390/atmos9090342
Note that from the first issue of 2016, this journal uses article numbers instead of page numbers. See further details here.