Analysis on the Changes of Agro-Meteorological Thermal Indices in Northeast China under RCP4.5 Scenario Using the PRECIS2.1

1
College of Agriculture, Shenyang Agricultural University, Shenyang 110866, China
2
Institute of Environment and Sustainable Development in Agriculture, Chinese Academy of Agricultural Sciences, Beijing 100081, China
3
Met Office Hadley Centre, Exeter EX2 6BS, UK
*
Author to whom correspondence should be addressed.
†
This author has been retired.
Atmosphere 2018, 9(8), 323; https://doi.org/10.3390/atmos9080323
Submission received: 19 June 2018
/
Revised: 14 August 2018
/
Accepted: 17 August 2018
/
Published: 20 August 2018
(This article belongs to the Section Biometeorology)
Abstract
:As a main grain production area in China, Northeast China (NEC) is highly influenced by the higher warming trend than elsewhere in China or even the globe. As the warming trend goes on, scientific understanding of the changes of thermal conditions in NEC will be essential for taking agricultural adaptation measures. In this paper, the high-resolution (25 km) corrected outputs of PRECIS (Providing Regional Climates for Impacts Studies) under the Representative Concentration Pathway 4.5 (RCP4.5) scenario were used to analyze the changes of the agro-climatic thermal resources in NEC. Results showed that accumulated temperature ≥10 °C (AT10) could increase by 300–500 °C·day, 500–900 °C·day, and 750–1000 °C·day in 2011–2040 (2020s), 2041–2070 (2050s), and 2071–2100 (2080s), respectively, relative to the baseline period of 1961–1990. The potential growing season (PGS) would then be prolonged by 11–19 days, 23–35 days, and 25–37 days in 2020s, 2050s and 2080s, respectively, compared to baseline. The spatial features for the changes of thermal indices would show a large increase of AT10 and an extension of PGS and Frost-free period (FFP) in mountainous areas compared to plains; the increment of AT10 would be greater in southern NEC than that in the north, with over 1000 °C·day in the southern parts and 700–800 °C·day in the northern parts in the 2080s. Additionally, the three thermal indices would increase rapidly from 2020s to 2050s compared to the period from 2050s to the 2080s, coincides with the greenhouse gas concentrations peak around the mid-period of the 21st century, and the decline towards the end of the 21st century under RCP4.5 forcing. The results of this paper could act as a guide to taking advantage of increasing thermal resources in NEC, and would be helpful for local practitioners in decision-making.
1. Introduction
Climate change is already incontrovertible in most regions of the world. According to the Intergovernmental Panel on Climate Change (IPCC) Fifth Assessment Report (AR5) [1], the global mean temperature has increased by 0.78 °C on average in 2003–2012, relative to that of 1850–2012. As it is exposed to the natural environment, the great impact of climate change on agriculture is global concern [2,3,4]. The thermal growing season lengthened by 2.9 days per decade during 1980–2011 in the Northern Hemisphere, with regional features of stronger rates of extension of 4.0 days per decade in Eurasia, rather than the 1.2 days per decade reported in North America [5]. It has even been observed that the onset of the growing season has advanced by 7.1 days, while the end date has been extended by 11.4 days, in the Northeast part of Fennoscandia between 1951 and 2012 [6].
According to the Third National Assessment Report on Climate Change, China witnessed an obviously higher warming magnitude of 0.9–1.5 °C from 1909 to 2011; higher than the global mean level. A general feature of climate change in China is that northern regions tend to become warmer than southern parts; for example, the average temperature has increased by 1.7 °C during the past 50 years in Northeast China (NEC) [7,8]. A general trend is shown for the isolines of temperatures ≥0 °C and ≥10 °C to move northwards. Days of temperatures ≥0 °C and ≥10 °C increased by 5.5 days and 4.7 days, respectively, on China’s mainland during 1981–2010 relative to 1961–1980, and then the zone of areas of accumulated temperatures ≥10 °C expanded [9] (details in Table S1), which enables rice planting at a high latitude. The planting structure of the cropping system changed significantly in NEC: the rice planting area increased from about 8 × 10⁵ hm2 in 1980 to 32 × 105 hm2 in 2010, and the concentrated rice planting area expanded from the south to north of NEC [10] (details in Table S1), corresponding with the shift of the belt of accumulated temperatures ≥10 °C. Specifically, the accumulated temperature ≥10 °C increased at the rate of 84 °C·day per decade from 1981–2012 in Heilongjiang province, and rice planting expanded greatly as the accumulated temperature ≥10 °C zone moved to the north and east [11] (details in Table S1).
Climate warming will continue; it is projected to be likely to increase in the range of 1.1–2.6 °C and 2.6–4.8 °C in 2081–2100 relative to 1986–2005 under the Representative Concentration Pathways 4.5 and 8.5 scenarios (RCP4.5 and RCP8.5), respectively [12], from the Climate Model Inter-Comparison Project Phase 5 (CMIP5) [13]. By the end of the 21st century, the increment of the mean temperature would be more than 3.4 °C and 5.7 °C under the RCP4.5 and RCP8.5 scenarios in China, respectively, while the minimum temperature could be 7.0 °C warmer under the RCP8.5 scenario in Northeast China [14]. It is estimated that the crop yield would experience a 3.4–8.0% reduction in 2026–2035 under RCP4.5 in China [15]; the rice growth duration would be shortened by four days in the middle and lower reaches of the Yangtze River [16]; high-temperature-resistant rice varieties would gradually extend to the northern rice planting area; and the early ripening varieties in NEC would be replaced by middle- and late-ripening varieties [17].
Rice yield and growing length depend on the in situ climate conditions and field management, so there are a lot of uncertainties in terms of future impact assessments of climate change. While changes in agro-meteorological thermal resources are directly related to the warming trend, scientific understanding would be helpful for us to adjust the crop varieties and undertake measures to ensure the rice harvest. The 25-km-resolution climate scenario data interpolated from the original 50 km outputs of RegCM3 under SRES A1B were used to analyze the thermal resources in Northeast China during the 21st century. An accumulated temperature ≥10 °C would increase by 800–950 °C·day in most parts of Liaoning province, the center and east of Jilin province, and the south of Heilongjiang province during 2041–2070, and 1300–1500 °C·day in east Jilin province and south Heilongjiang province during 2071–2100 [18]. Aoxue et al. reported their analysis on the trend of accumulated temperatures ≥10 °C using CMIP5 GCMs outputs under RCP2.6, RCP4.5 and RCP8.5 [19]. Chuzheng et al. adopted the outputs of the regional climate model of BCC_CSM1.0, with a horizontal resolution of 50 km in latitude and longitude under the RCP4.5 and RCP8.5 scenarios to analyze the changes of agro-climatic resources during the 21st century in Northeast China. The results showed that by the end of the 21st century, the first day of temperatures ≥10 °C would arrive 3 days and 4 days earlier, while the first frost day would be delayed by 2 days and 6 days under the RCP4.5 and RCP8.5 scenarios, respectively. The growing seasons were lengthened by 4 days and 10 days, and accumulated temperatures ≥10 °C would increase by 400 °C·day and 700 °C·day under the two scenarios, respectively [20].
From the above summary of former works, we can see that the results for the thermal resources already presented were limited, with high-resolution but out-of-date emission scenarios (SRES) or state-of-the-art emission scenarios with coarse resolution (at most up to 50 km). In our analysis, we employ the high-resolution (25 km) climate scenarios generated from PRECIS2.1 under RCP4.5 to analyze the agro-meteorological thermal resources in NEC, with three typical indices selected: accumulated temperature ≥10 °C (AT10), potential growing season (PGS), and frost-free period (FFP). We try to access the most advanced scientific understandings to help determine the appropriate sowing date, choose a suitable variety for the potential growing season, and minimize the risks of cold damage stress. The study region, simulated climate data, observation data, correction data, and the thermal indices are introduced in Section 2; the validation of the simulation capability of PRECIS and effect of correction for the mean and minimum temperatures, as well as the thermal indices and projection of the variations in the thermal indices, are analyzed in Section 3; and finally the conclusions and a discussion of results are provided in Section 4.
2. Study Area, Data, and Methods
2.1. Study Area
China has a wide and diverse panel of climate types with different climate warming trends, while Northeast China is more sensitive to climate change than other parts. A map of the administrative provinces of Northeast China is shown in Figure 1. Northeast China, located in the heart of Northeast Asia, is the region with the highest latitude in China, including the three provinces of Heilongjiang, Jilin, and Liaoning. As the main cropping area lies in the three provinces, especially for rice planting, the target area in this paper focused on the three provinces as shown in Figure 1. The total land area is 787,300 km2, accounting for 8.2% of the total land area of China according to the China Statistic Yearbook. Northeast China is across the warm temperate zone, the mid-temperate zone, and the cold temperate zone from south to north, characterized by hot and rainy weather in summer, while it is cold and dry in winter. Northeast China is one of the most important grain producing areas in China. Agricultural production conditions can support the normal growth of many crops. The cereal production of Northeast China accounts for more than 35% of Chinese total grain production [21]. Climate changes in northeast China have a direct impact on agricultural layout and grain yield, and influence the Chinese food production safety strategy.
2.2. Model Data
PRECIS was introduced to China in 2003 and validated in terms of simulation ability in China [22] (details in Table S1). The latest version of PRECIS (version 2.1) [23] is used for climate simulation with the radiative forcing of the observed greenhouse gases in the period of 1961–2005, and under RCP4.5 in 2006–2100. In this study, the model domain is 300 grids in longitude and 230 grids in latitude, with a resolution of 25 km in latitude and longitude, covering the whole typhoon genesis region. To ensure the climate variables are properly simulated, the RCP4.5 scenario assumes stabilization without any overshoot in the pathway to radiative forcing of 4.5 Wm−2 in 2100. PRECIS is driven with the lateral boundary conditions from HadGEM2-ES GCM [24] simulations of the current and future climate as one-way nesting. HadGEM2-ES is a non-hydrostatic atmospheric model coupled with the ocean and land surface ecosystems, and was designed to provide simulations for CMIP5. The HadGEM2-ES simulations have been run with a horizontal grid length of 1.875° (longitude) × 1.25° (latitude), and 38 vertical levels and an ocean resolution of 1° (increasing to 1/3° at the Equator and 40 vertical levels). HadGEM2-ES includes interactive land and ocean carbon cycles and dynamic vegetation, with an option to either prescribe atmospheric CO2 concentrations or to prescribe anthropogenic CO2 emissions and simulate CO2 concentrations. To simulate the evolution of the atmospheric composition and interactions with atmospheric aerosols, an interactive tropospheric chemistry scheme is also used. Extensive diagnostic outputs from HadGEM2-ES were made available to the CMIP5 multi-model archive, including from the historical simulation (defined as 1860–2005), for which the model state in 2005 was then used as the initial condition for different future RCP simulations. The RCP4.5 scenario is a moderate emission scenario, wherein greenhouse gas concentrations would peak around the mid-period of the 21st century and then decline. This provides a common platform for climate models to explore the climate system response to stabilizing the anthropogenic components of radiative forcing.
A series of climate scenarios with a horizontal resolution of 50 km generated from PRECIS had been used for the analysis of the average climate trend [25], changes of summer days, consecutive frost days and growing season length [26], heat wave frequency and duration [27] under SRES scenarios in the 21st century, as well as the changes of the 95th percentile of the maximum temperature, the 5th percentile of the minimum temperature, high- and low-temperature days [28], and lighting and thermal resources in the potential northward areas of winter wheat [29] (details in Table S1) under the RCP scenarios during the 21st century. In our paper, the latest version (PRECIS2.1) with a horizontal resolution of 25 km will be used to dissect AT10, PGS and FFP changes under the RCP4.5 scenario in the 21st century in Northeast China.
2.3. Observation Data
The gridded observed meteorological data are also applied to test the applicability and the validity of the simulated results. These data were observed daily and strictly quality-controlled by the China Meteorological Administration, ensuring internal long-term consistency and homogeneity of data used in the study region. The datasets with a resolution of 50 km × 50 km generated by Xu et al. [30], based on the observed daily mean temperature data of 751 meteorological stations within mainland China in 1961–2005, were then bilinear interpolated to a new dataset with a resolution of 25 km × 25 km. The resolution of the interpolated observation data is very close to the resolution of PRECIS, so there is not a significant bias for the direct comparison in the statistical analysis.
2.4. Correction Data
The simulation ability for the mean and minimum temperature was validated in 1961–1990, which is taken as the baseline period, via the comparison with the observation data in the spatial distribution. To better represent thermal indices in future, the average method has been taken for the correction of the climate scenarios datasets. Firstly, the monthly mean value of observations and simulations at each grid is calculated; secondly, the bias of the simulation minus observation is extracted as the coefficients to be applied to the original outputs of future climate scenarios, then new datasets of the corrected climate scenarios were generated. Moreover, the timeline in the 21st century is divided into three periods: 2011–2040 (2020s), 2041–2070 (2050s), and 2071–2100 (2080s), corresponding with the early, mid and late period, respectively.
2.5. Thermal Indices
In the field of agronomy, thermophilic crops could grow in air temperatures ≥10 °C, while the growth of chimonophilous crops could be viable if the minimum temperature is ≥0 °C. There could be several indices to represent the thermal resources in Northeast China, and three typical indices were chosen in this paper to understand the trend of the thermal resources in the 21st century: accumulated temperature ≥10 °C (AT10), the potential growing season (PGS) of the corresponding crops (rice, for example, as a kind of typical thermophilic crop, has greatly expanded in the past decades), and the frost-free period (FFP), which is an indicator for chimonophilous crop planting. The definitions of the three indices are listed in Table 1. The occurrence dates of the temperature limits (i.e., 10 °C for AT10 and 2 °C for FFP [31] (details in Table S1) are determined with the method of the 5-day moving average [32]. Before the 30th of June, whenever the moving average is consistently above 10 °C or 2 °C, the first day of the first five consecutive days is taken as the initial date for the calculation of AT10, PGS, and FFP, while the last date of these indices is determined with the last day of the last five consecutive days after the 1st of July.
3. Results
3.1. Validation of the Mean and Minimum Temperature and Thermal Indices
The reasonable projection of the future trend of AT10 and PGS is based on PRECIS’ capacity to simulate the Tmean, while the analysis of FFP is directly related to the Tmin. The observed, simulated, and corrected Tmean and Tmin are shown in Figure 2. The temperatures in NEC are warm in the Songnen Plain, Liaohe Plain, and Sanjiang Plain, with a Tmean of 2–9 °C and Tmin of −3–5 °C, while being cold in the Lesser Khingan Mountain and Changbai Mountain with a Tmean of −2–2 °C and Tmin of −7–2 °C. The overall spatial features of the temperatures in NEC can be represented with PRECIS, but the simulated temperatures are warmer in mountainous areas with biases of 1–2 °C, while being colder in the plains with biases of −1–0 as shown in Figure 2g. Relative to the Tmean, the simulated Tmin is much warmer over the mountainous areas, corresponding with the observations in the plains, and the bias of the simulated Tmin and observed values are less than 0.5 °C (Figure 2i). The distribution features of the corrected Tmean and Tmin are very similar to the observations (Figure 2c,f), and the bias of the simulated Tmean and Tmin and the observations are less than 0.3 °C.
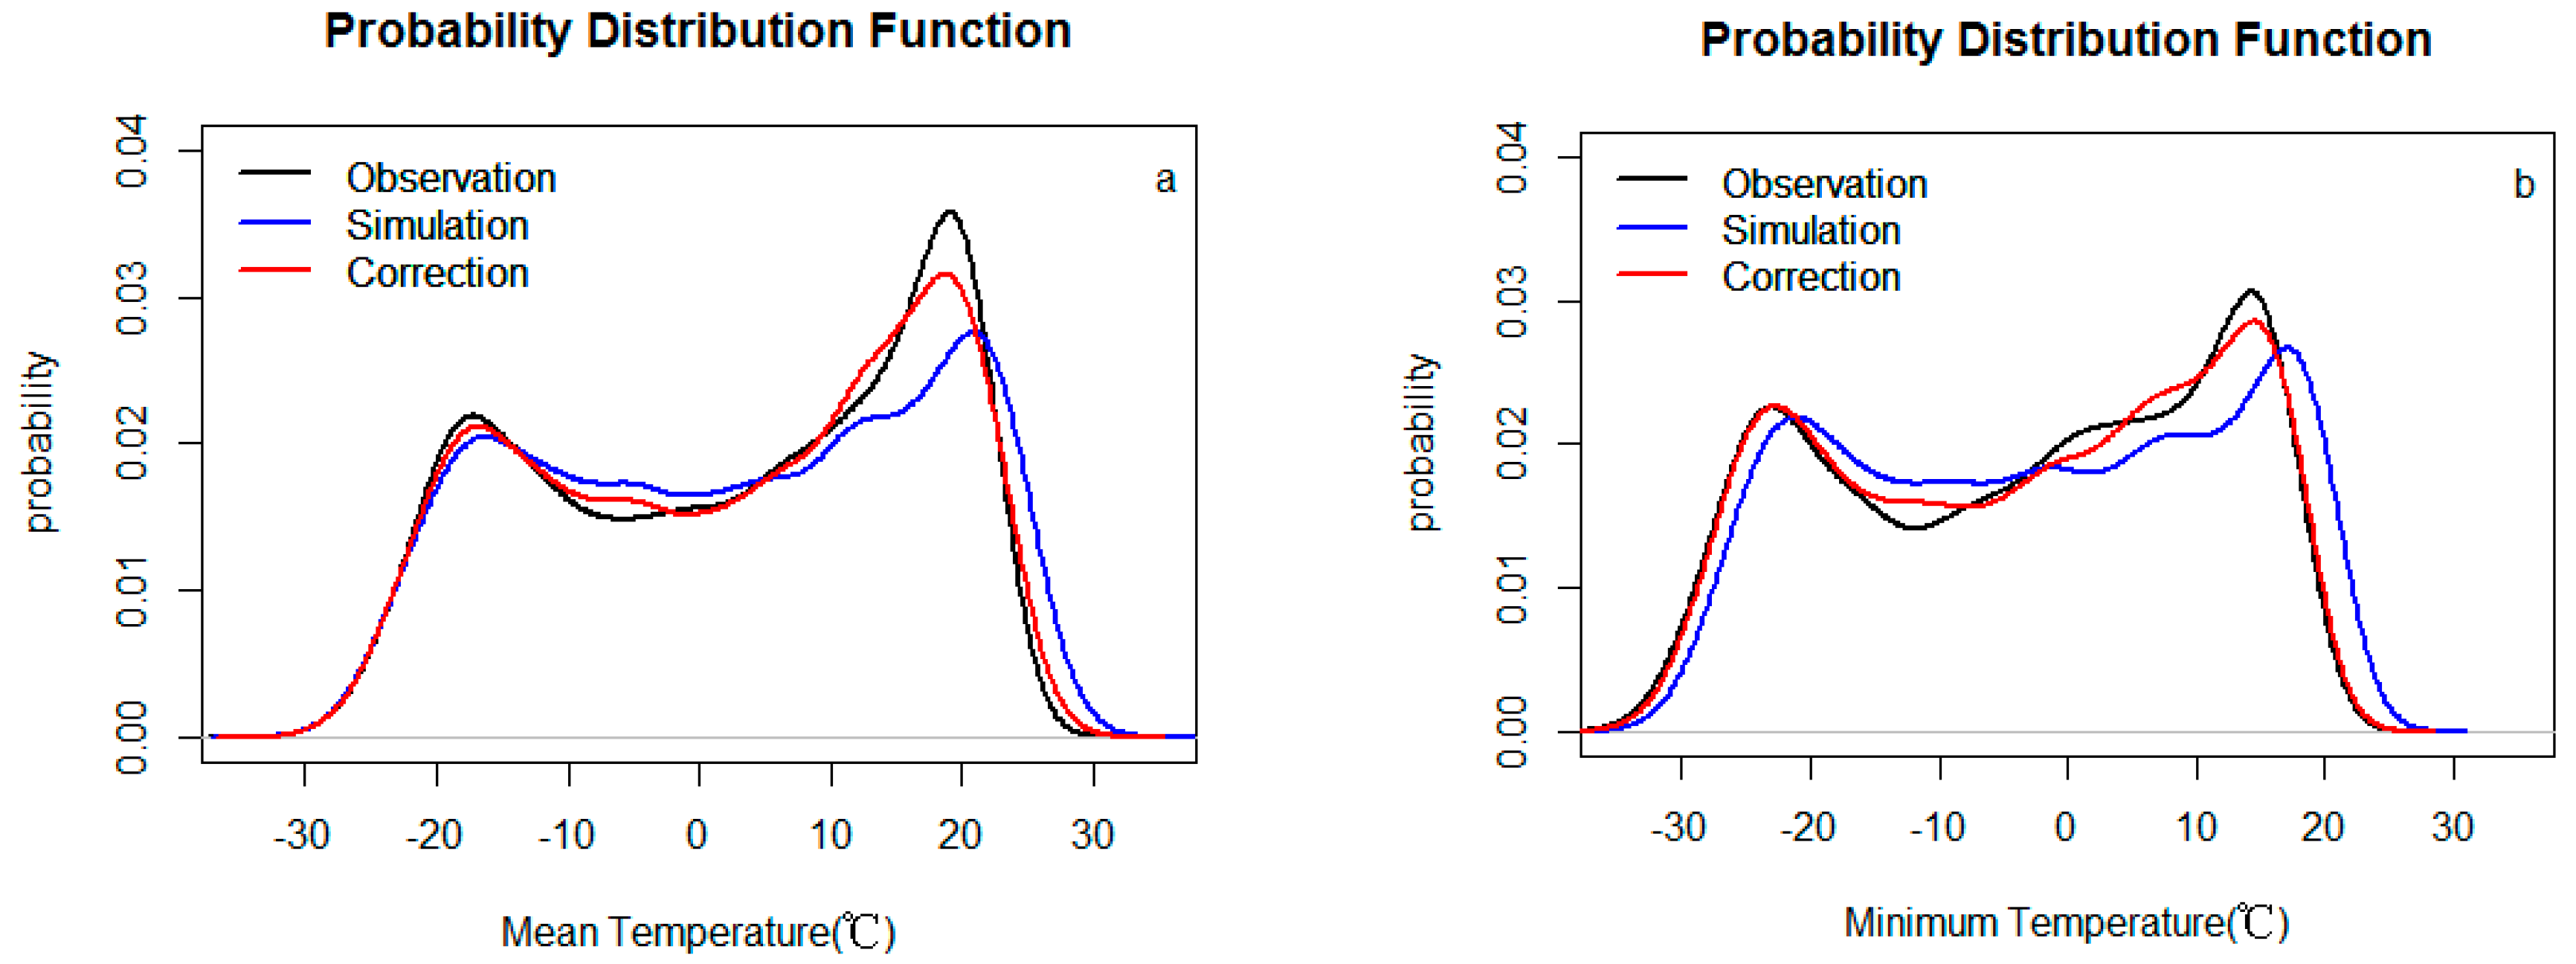
The statistical features of the probability distribution function (PDF) for different temperatures are shown in Figure 3. We can see that the simulated Tmean has a higher probability in the value range of 5–25 °C, while agreement in the simulated Tmean and observation occurred in values below −15 °C and the possibility was over simulated slightly in the area of −15–5 °C. There is a systematic shift to warmer areas for the simulated Tmin compared to the observation, while the corrected PDF for the Tmean and Tmin fits well with the observed values. High-quality corrected scenario datasets enabled the analysis of the agro-meteorological thermal resources to be more reasonable and reliable in this paper.
Figure 4 shows the spatial distribution features of observed, simulated and corrected AT10, PGS and FFP in the baseline period, separately. From the comparison of simulated and observed AT10 in Figure 4a,b, we can conclude that PRECIS can capture the main distribution characteristics of AT10 in most parts of NEC, while overestimating in the Lesser Khingan and Changbai Mountains with the bias value more than 100 °C·day, even up to 400 °C·day. On the other hand, it underestimated, with a bias value in the range of 100–150 °C·day, in the Songnen and Sanjiang Plains, and less than 300 °C·day in Liaohe Plain. It can be seen from Figure 4c that the bias of the corrected AT10 minus observation can be narrowed down below 50 °C·day in the Sanjiang and Songnen Plains, and less than 50–100 °C·day in Liaohe Plain, while in mountainous areas, the bias can be reduced to less than 100 °C·day.
As the calculation of both PGS and AT10 relies on the Tmean, the distribution feature of the observed and simulated PGS in Figure 4d,e resembles that of the AT10, with PGS over 130 days in plain areas, and below 130 days in mountainous areas, which is overestimated in the Lesser Khingan and Changbai Mountains, with a bias value over 5 days and up to 15 days, and is underestimated with a bias value in the range of −20–5 days over the three plains. The bias of the corrected PGS and observation can be greatly reduced, as shown in Figure 4f: the bias values can be reduced to below 2 days in the Sanjiang and Songnen Plains, to the range of 5–7 days in Liaohe Plain, and to below 7 days in the Lesser Khingan and Changbai Mountains.
Since the calculation of FFP depends on the Tmin, which is much more overvalued than the Tmean in mountainous regions and is well simulated in plains regions, as shown in Figure 2g,i, the comparison of FFP in Figure 4g,h clearly presents overvaluing in the Lesser Khingan and Changbai Mountains, with a bias value of more than 10 days, and undervaluing in the Songnen and Liaohe Plains, with a bias value in the range of −10–5 days, and less than 10 days in the Sanjiang Plain. Meanwhile, the bias of the corrected FFP minus observation was greatly decreased to the range of −1–4 days in the three plains, while being below 2 days over most areas of the Lesser Khingan and Changbai mountains.
In conclusion, over estimation appears in mountainous areas and underestimation occurs in plains areas for AT10, PGS and FFP, while the gaps between the simulation and observation have been fixed owing to the applications of correction; therefore, analysis on the future trends in this paper will consequently be based on the corrected AT10, PGS and FFP.
3.2. Changes of AT10, PGS and FFP during the 21st Century
It is clearly shown in Figure 5 that the Tmean and Tmin in the 2020s, 2050s and 2080s would increase gradually, relative to the baseline. A common feature that is indicated is that the warming in the northern part of NEC is more obvious than that in the southern part, and the increment of the Tmin is higher than the Tmean. For the Tmean in Figure 5a–c, greater increments appear in 2041–2070, with values above 3.2 °C in most areas, compared with the Tmean changes in 2020s, with increments over 1.6 °C. During 2071–2100, the changes in the Tmean would experience the most dramatic increase over the whole NEC region, especially for Heilongjiang province, with increments over 3.8 °C, relative to the baseline level. In Figure 5d–f, the changes of the Tmin resemble those of the Tmean; however, the increments are even larger for the Tmin compared with the Tmean in all three future periods, with increments above 4.0 °C in most parts of Heilongjiang province at the end of the 21st century.
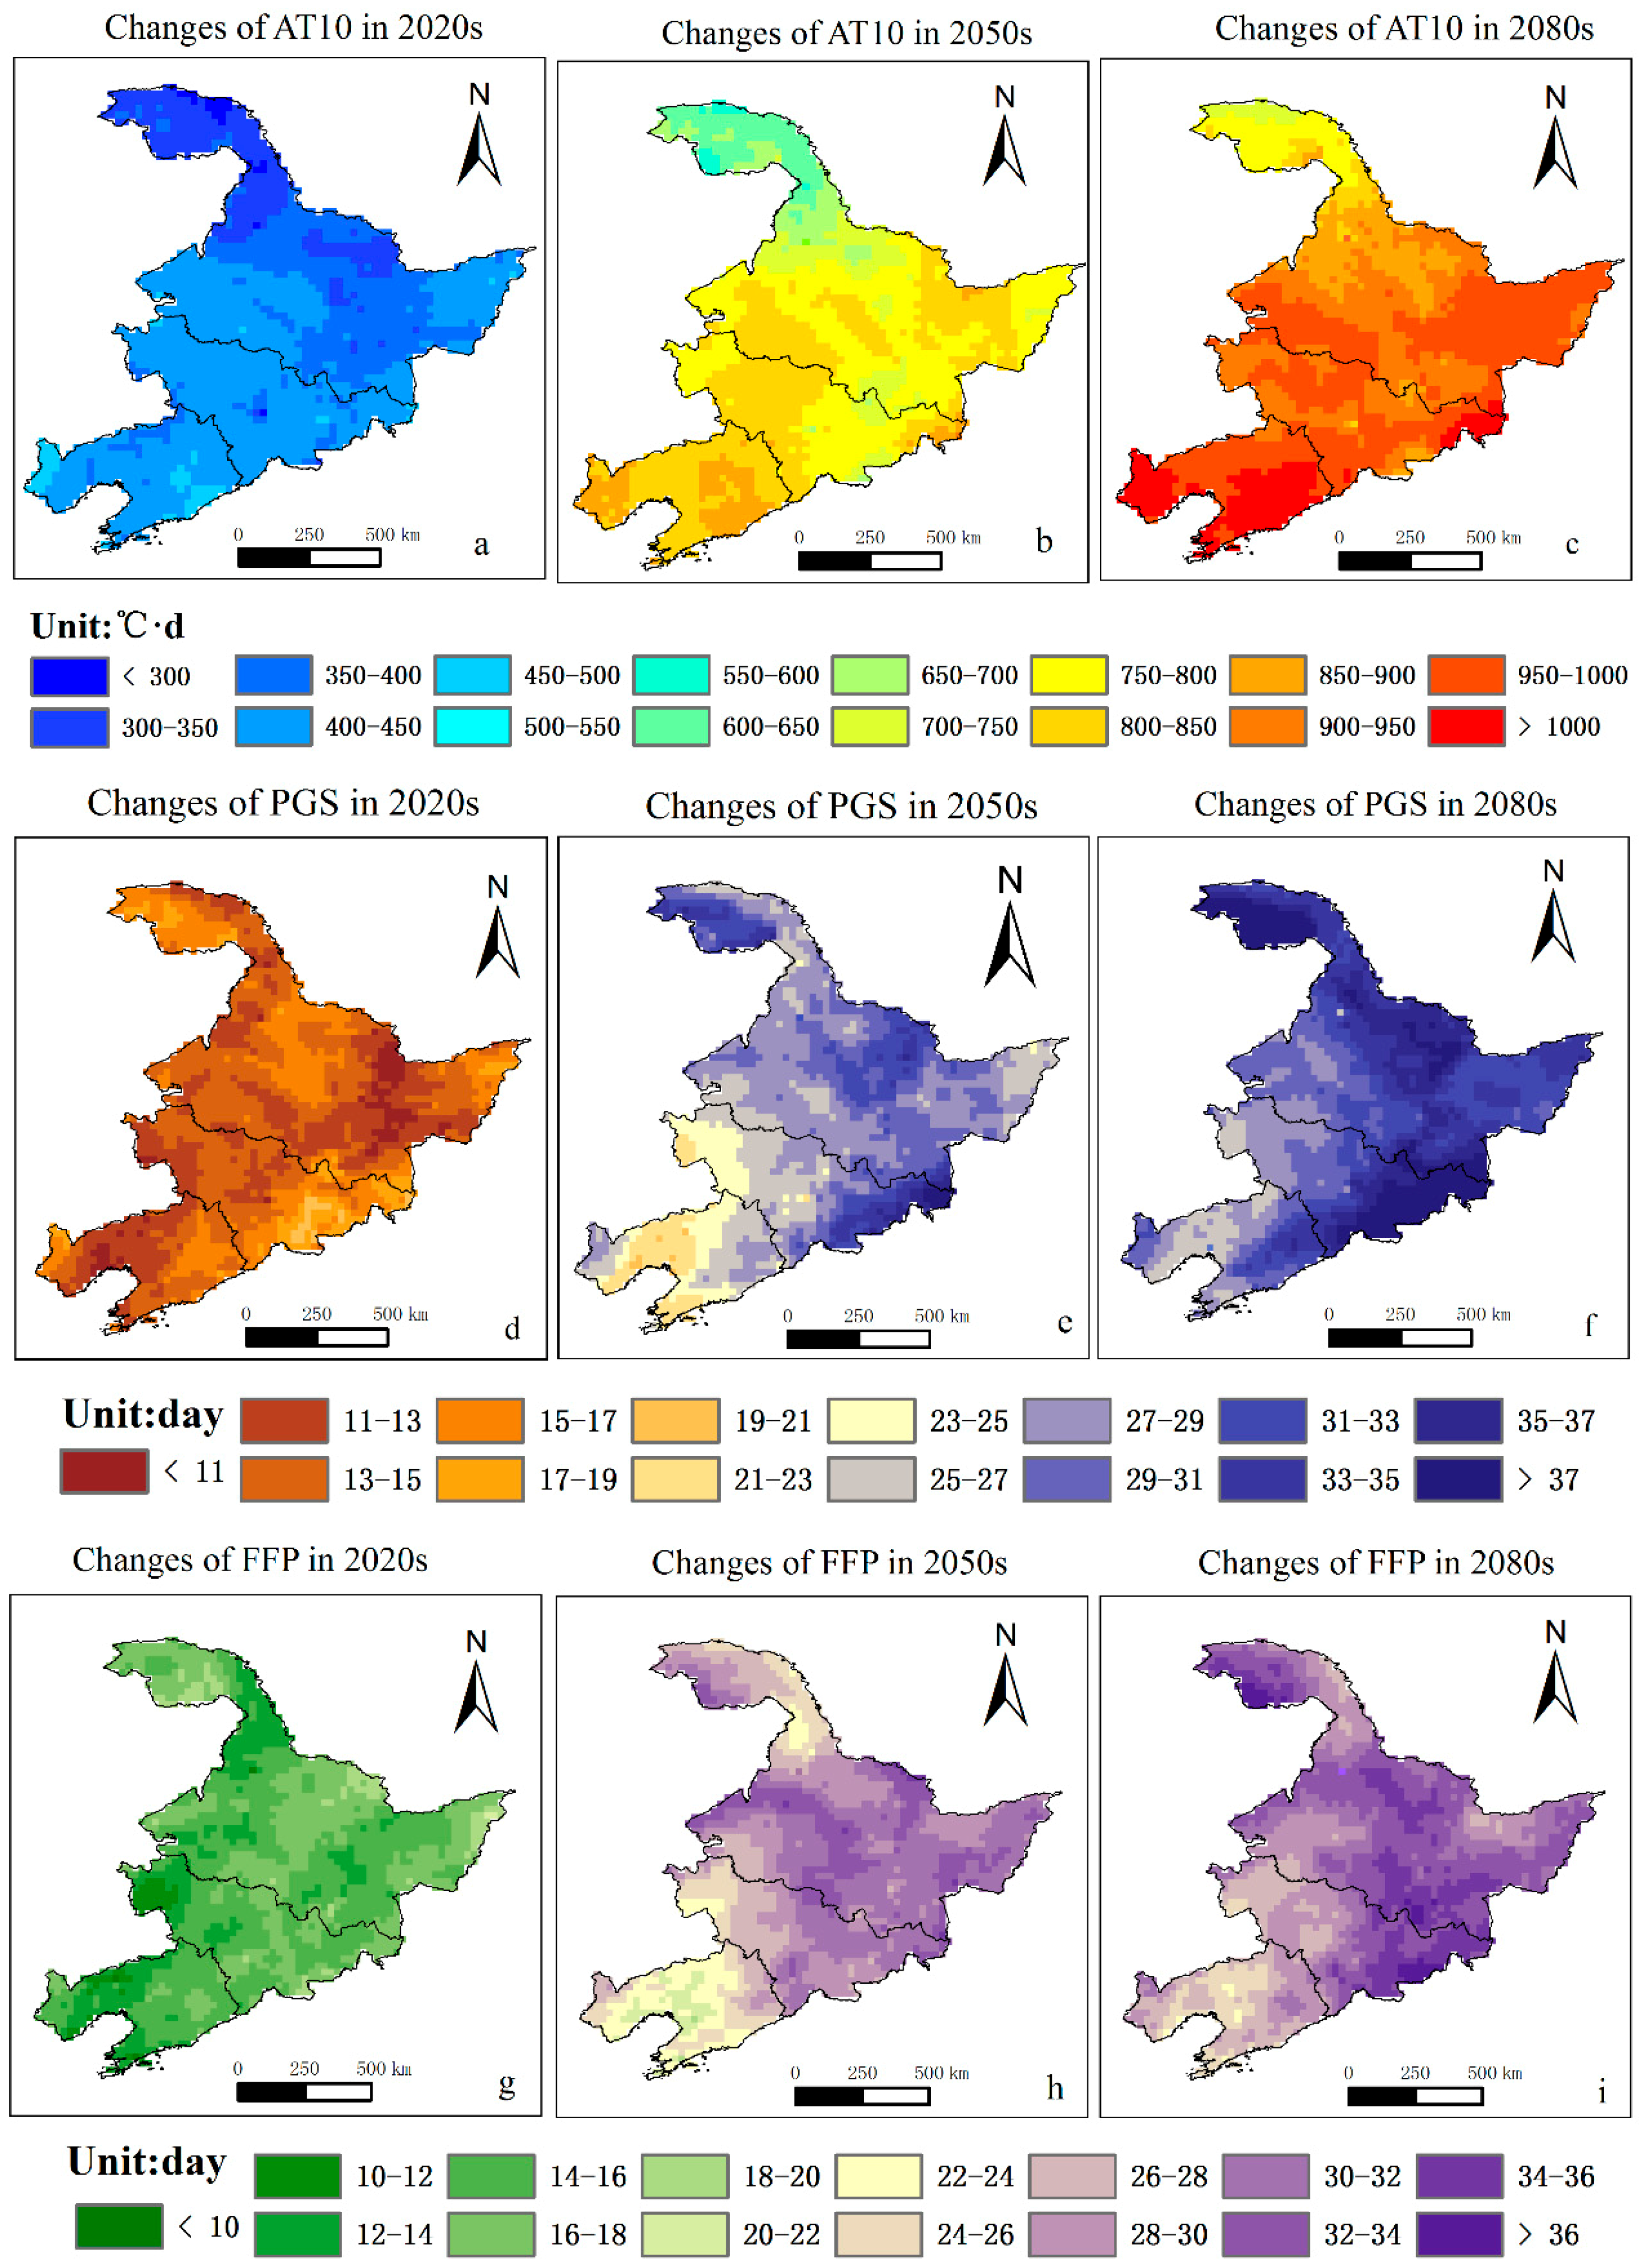
In Figure 6a–c, AT10 would increase by 300–500 °C·day, 500–900 °C·day and 750–1000 °C·day in the 2020s, 2050s and 2080s, respectively, up to over 1000 °C·day in the south parts of NEC at the end of the 21st century. Lower increments of AT10 would appear in the Lesser Khingan Mountains, with values of 750–800 °C·day by the late 21st century, while higher increments would appear in the Sanjiang Plain and Songnen Plain, with values of 950–1000 °C·day. For changes of the PGS relative to the baseline in Figure 6d–f, the days would increase by 11–19 days, 23–35 days and 25–37 days in the 2020s, 2050s and 2080s, respectively, in most of NEC. Relative to the obvious increase of PGS days in the Lesser Khingan and Changbai Mountains of up to 27–35 days in the middle of the 21st century and 29–37 days in the late 21st century, the increase of PGS days in the three plains could also increase to 21–29 days during the mid-21st century and 25–33 days in the late-21st century, which would be very helpful for the expansion of rice planting and adjustments of rice varieties.
Similar features of the changes of FFP are shown in Figure 6g–i, as PGS and FFP days could increase by 10–18 days in the 2020s, 22–32 days in the 2050s, and 24–36 days in the 2080s in most areas of NEC. The increments of FFP in the Lesser Khingan and Changbai mountainous areas would be high, with values of 26–32 days in the 2050s and 30–36 days in the 2080s, and 24–30 days in the 2050s and 26–34 days in the 2080s over the Sanjiang and Songnen Plains. Relatively lesser increments of FFP in the Liaohe Plain could be seen, with values of 20–24 days in the 2050s and 24–28 days in the 2080s. By the end of the 21st century, FFP days would be extended by more than 24 days in most areas of NEC, characterized by more extension days in mountainous areas of 32–36 days, and even more than 36 days.
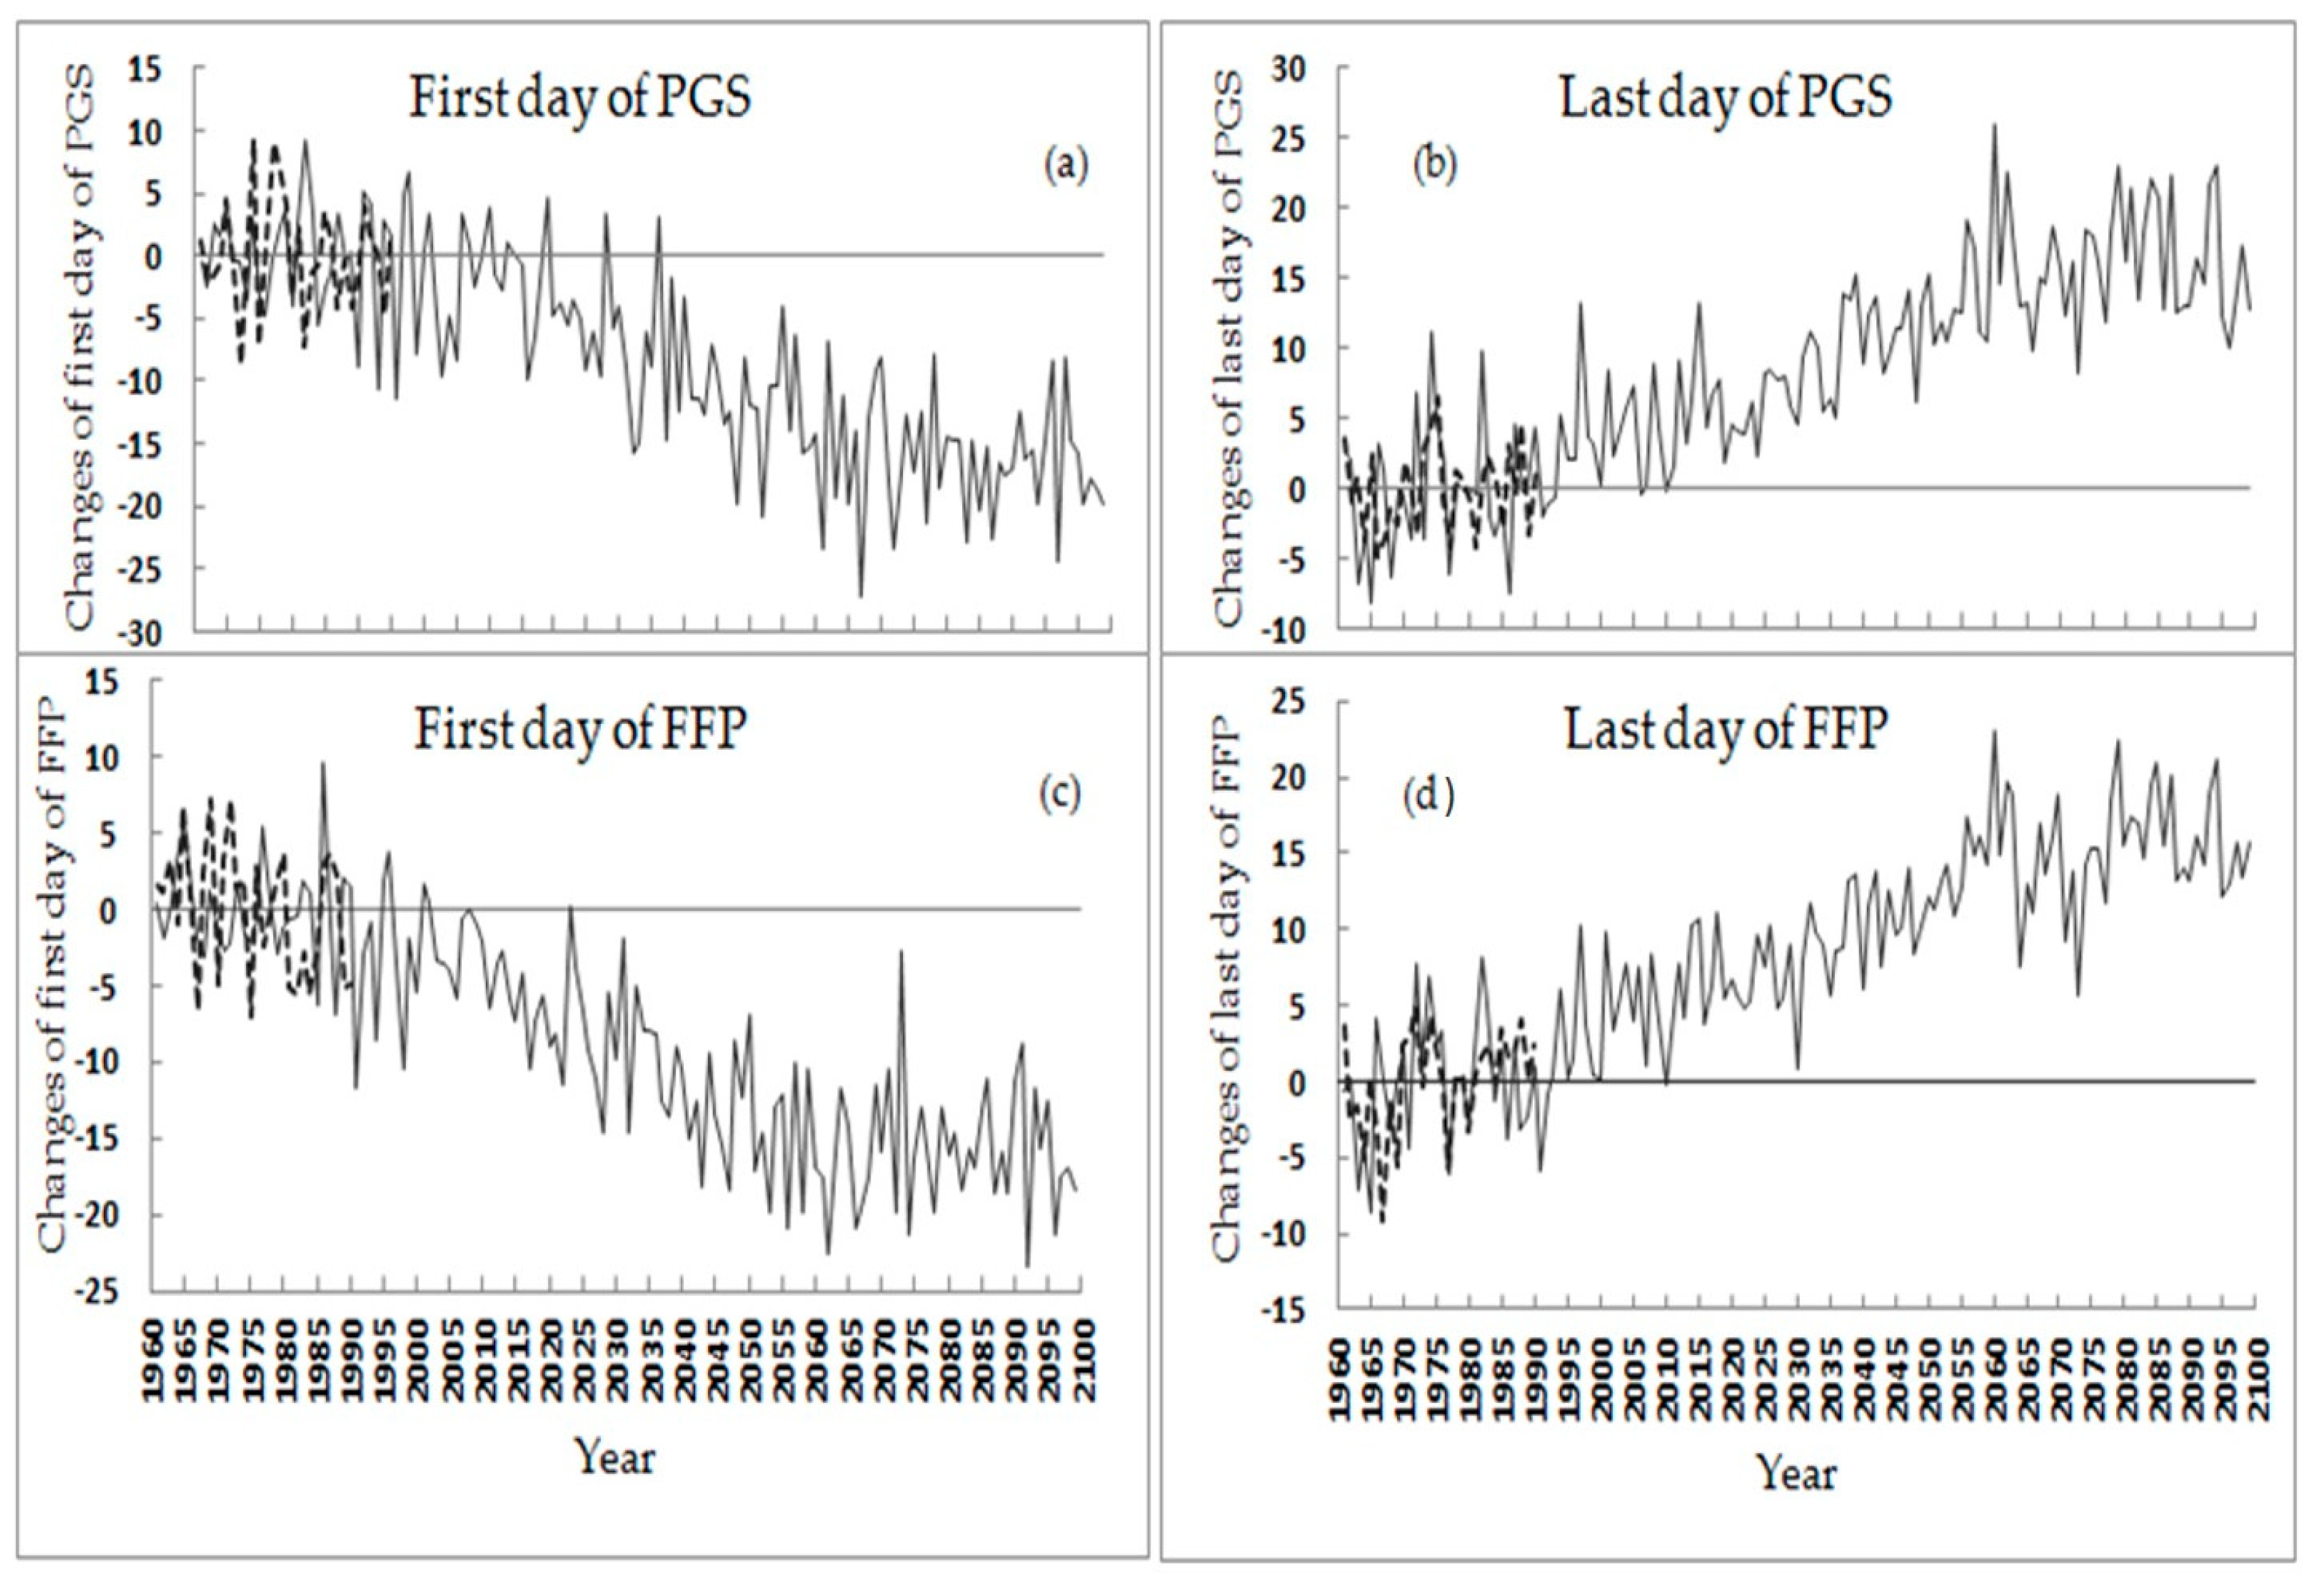
3.3. Changes of the First and Last Days of PGS and FFP
From the above analyses we know that the agro-meteorological thermal resources greatly increased, the growth season either for thermophilic crops represented with PGS or for chimonophilous crops represented with FFP would prolong by more than one month in northern NEC in the mid-21st century and nearly one month in southern NEC in the later 21st century. It could be helpful for the systematic adjustment of agricultural activities to know how the crop phonology would be advanced and delayed, thereby to promote high-efficiency use of increased climatic thermal resources. The average changes of the first and last days of PGS and FFP for the whole of NEC are shown in Figure 7, where we can see that the overall features of potential crop phenology changes include the first occurrence day advancing by 3–15 days, 6–27 days, and 8–24 days for PGS, and 2–14 days, 9–22 days, and 9–23 days for FFP in the 2020s, 2050s and 2080s, respectively, relative to the baseline. Meanwhile, the last occurrence day would be delayed by 2–15 days, 6–22 days, and 3–23 days for PGS, and 3–13 days, 7–23 days, and 6–22 days for FFP during the 2020s, 2050s and 2080s, respectively. Interestingly, the first day of PGS and FFP would advance rapidly from the 2020s to 2050s, while it would slow down from the 2050s to 2080s, and vice versa for the last day of PGS and FFP. This corresponds to the GHGs emission pathway of RCP4.5.
4. Discussion
Northeast China, a main crop production region for Chinese food security, displays more obvious warming than other regions in China. It is meaningful to analyze the changes of agro-climatic resources due to climate change. As produced by PRECIS, changes of the Tmean and Tmin during the 21st century would be in agreement with variability of the radiative forcing trajectories under RCP scenarios [34,35]. In comparison with the Tmean, the Tmin would warm up more obviously, which is consistent with previous findings [34,36]. Relative to observations, overestimation of the simulated Tmean and Tmin were reproduced in the Lesser Khingan and Changbai mountains, which was also commonplace among GCMs [37]. Discrepancy between models and real conditions could be attributed to climate models’ sensitivity to altitude [38]. However, the discrepancy had reduced after correcting the simulation by subtracting observations in the reference period.
Some studies have already shown that the increments of AT10 in NEC would be over 1000 °C·day under the SRES A2 scenario, within in the range of 500–1000 °C·day under the SRES B2 scenario by the end of the 21st century [39], 1300–1500 °C·day in the eastern Jilin province and southern Songnen Plain under the A1B scenario [18], and 400 °C·day and 700 °C·day under the RCP4.5 and RCP8.5 scenarios [20]. Compared with the former results, it is shown from our analyses that the increments of AT10 in most areas in NEC would be around 900 °C·day by the end of the 21st century. While for the former analyses, research has seldom been done for the changes in the length of PGS and FFP as defined in this paper, it is shown that the crop potential growing season for a Tmean ≥5 °C would increase by about 20 days under the SRES A2 scenario from Tang’s analyses [39] (details in Table S1). The maize potential growing season, with the same criteria of a Tmean ≥10 °C as the PGS defined in this paper, would increase by 30–40 days under the SRES A1B scenario by the end of the 21st century [18]; our analyses showed that PGS and FFP would increase by 11–37 days and 6–22 days in NEC under the RCP4.5 scenario by the end of the 21st century. For the analyses on the first and the last days of PGS and FFP, little research has been done; however limited results show that the first day of AT10 would advance 3 days and 4 days, and the first day of frost would be delayed by 3 days and 6 days under the RCP4.5 and RCP8.5 scenarios, respectively, according to Chu’s research [20]. In our paper, the first occurrence day would advance 8–24 days for PGS and 9–23 days for FFP, and the last occurrence day would be delayed by 3–23 days for PGS and 6–22 days for FFP under the RCP4.5 scenario at the end of the 21st century.
An increase in the accumulated temperature and a prolonged potential growing season would be favorable for crop growing and the expansion of arable land, and there would be opportunities for regions where early maturing varieties could be replaced with mid- and late-maturing varieties, while the early maturing varieties and cold-resistant varieties could be expanded northwards, and areas capable of growing late-maturing varieties would expand [18,20]. Moreover, FD-FFP would appear early in spring and LD-FFP would appear late in autumn, which could finally result in a late harvest date to avoid cold damage to crops [40,41] (details in Table S1). Thus, understanding the changes of agro-climatic resources could provide us the scientific information in agriculture management for the adaptation of decision-making for the high-efficiency use of climatic resources, to ensure crop production in response to climate change.
5. Conclusions
In this paper, gridded observed datasets with a horizontal resolution of 25 km and a time period of 1961–1990 were used to validate the modeling system PRECIS’ capacity for simulations of the Tmean and Tmin. Three thermal indices (AT10, PGS, and FFP) were selected to analyze the changes of the agro-meteorological resources in NEC. The spatial distribution feature of temperature could be simulated well, although it was overestimated in two mountainous areas and underestimated in three plains. However, after correction of the original outputs with the average method, the bias of the corrected values minus the observation in baseline could be below 100 °C·day for AT10, less than 5 days for PGS, and under 4 days for FFP in the three plains. Such an analysis, with corrected climate scenario outputs, has never been reported in the published literature, and it can be expected that the projection of the future changes of the thermal indices could be more reliable with correction. Therefore, this is an attempt to apply correction data to analyze agro-meteorological thermal resources under a medium emission scenario (RCP4.5), with a horizontal resolution of 25 km generated from the regional climate modeling system PRECIS.
The changes of the Tmean, Tmin, and three agro-climatic thermal indices during the 21st century were summarized in Table 2. The greatest warming of the Tmean and Tmin would appear in northern Heilongjiang, with an increase of 4 °C and 4.2 °C separately by the end of the 21st century. For AT10, the most rapid growth would appear in the next few decades, which would increase by 750–900 °C·day in the Songnen, Sanjiang and Liaohe plains by the mid-21st century. Correspondingly, the length of PGS would be increasing to 21–29 days and FFP would prolong by 20–30 days in the three plains by the 2050s, while in 2080 the variations of the three thermal indices would show slight changes compared to the 2050s, which could be in response to greenhouse gas concentrations that peak around the mid-period of the 21st century and then decline under the RCP4.5 scenario. The results could provide a scientific basis for us to improve crop variety and adjust the crop planting structure, so that we could make full use of thermal resources to expand the crop planting areas.
From a practical perspective, it is not likely to be possible to grow rice in high mountains; however, thermal resources would increase more obviously in the junction belts of mountains and plains than in other regions, which is helpful for the expansion of the rice planting areas in these regions. Meanwhile, it would provide the possibility to alternate crop variety, raise crop productivity, and produce high-quality rice.
In our paper, PRECIS with a high horizontal resolution of 25 km under RCP4.5 was applied to analyze thermal resources in the 21st century. From our analysis, the regional characteristics could be presented better with high resolution, rather than low resolution. For example, the features in both mountainous and plain areas were described well. Furthermore, it was shown to be more reasonable and scientific. However, only a single dataset under a single RCP scenario was used for the analysis in this paper, and only three thermal indices were chosen to represent the agro-climatic resources. More scenarios and indices should be used to analyze climatic resources in the context of climate change in future studies.
Supplementary Materials
The following are available online at https://www.mdpi.com/2073-4433/9/8/323/s1, Table S1: The main content of Chinese reference.
Author Contributions
Y.X. and X.L. conceived the topic of the work, X.L. drew the figures and drafted the paper, Y.X. revised and finalized the paper, C.M. and L.Z. helped archive the datasets and revise the paper, C.W. provided the technical assistance for generation of the climate scenarios with the PRECIS modelling system and helped revise the paper. All authors read and approved the submitted manuscript and accepted the version for publication.
Funding
This research was funded by the Key Projects of China’s national twelfth 5-year Science & Technology Pillar Program (2013BAC09B04) and the Key 948 Project (2011-G9).
Acknowledgments
We appreciated the anonymous reviewers for their meaningful comments and intelligent suggestions. We are grateful to group members of regional climate modeling in Hadley centre.
Conflicts of Interest
The authors declare no conflict of interest.
References
- Stocker, T.F.; Qin, D.; Plattner, G.K.; Tignor, M.; Allen, S.K.; Boschung, J.; Nauels, A.; Xia, Y.; Bex, V.; Midgley, B.M. Climate Change 2013: The Physical Science Basis; Contribution of Working Group I to the Fifth Assessment Report of the Intergovernmental Panel on Climate Change; Cambridge University Press: Cambridge, UK; New York, NY, USA, 2013. [Google Scholar]
- Smit, B.; Cai, Y. Climate change and agriculture in China. Glob. Environ. Chang. 1996, 6, 205–214. [Google Scholar] [CrossRef]
- Piao, S.; Ciais, P.; Huang, Y.; Shen, Z.; Peng, S.; Li, J.; Zhou, L.; Liu, H.; Ma, Y.; Ding, Y.; et al. The impacts of climate change on water resources and agriculture in China. Nature 2010, 467, 43–51. [Google Scholar] [CrossRef] [PubMed]
- Wang, J.; Mendelsohn, R.; Dinar, A.; Huang, J.; Rozelle, S.; Zhang, L. The impact of climate change on China’s agriculture. Agric. Econ. 2009, 40, 323–337. [Google Scholar] [CrossRef]
- Barichivich, J.; Briffa, K.R.; Osborn, T.J.; Melvin, T.M.; Caesar, J. Thermal growing season and timing of biospheric carbon uptake across the Northern Hemisphere. Glob. Biogeochem. Cycles 2012, 26. [Google Scholar] [CrossRef]
- Blinova, I.; Chmielewski, F.M. Climatic warming above the Arctic Circle: Are there trends in timing and length of the thermal growing season in Murmansk Region (Russia) between 1951 and 2012. Int. J. Biometeorol. 2015, 59, 693–705. [Google Scholar] [CrossRef] [PubMed]
- Chen, C.Q.; Qian, C.R.; Deng, A.X.; Zhang, W.J. Progressive and active adaptations of cropping system to climate change in Northeast China. Eur. J. Agron. 2012, 38, 94–103. [Google Scholar] [CrossRef]
- Li, Z.G.; Tang, H.J.; Yang, P.; Wu, W.B.; Chen, Z.X.; Zhou, Q.B.; Zhang, L.; Zou, J.Q. Spatio-temporal responses of cropland phenophases to climate change in Northeast China. J. Geogr. Sci. 2012, 22, 29–45. [Google Scholar] [CrossRef]
- Hu, Q.; Pan, X.B.; Shao, C.X.; Zhang, D.; Wang, X.X.; Wei, X.Y. Distribution and Variation of China Agricultural Heat Resources in 1961–2010. Chin. Agric. Meteorol. 2014, 35, 119–127. (In Chinese) [Google Scholar]
- Chen, H.; Li, Z.G.; Tang, P.Q.; Hu, Y.N.; Tan, J.Y.; Liu, Z.H.; You, L.Z.; Yang, P. Rice area change in Northeast China and its correlation with climate change. Chin. J. Appl. Ecol. 2016, 27, 2571–2579. (In Chinese) [Google Scholar]
- Cao, M.M.; Li, Q.; Zhang, L.Y.; Gao, J.; Li, W.H.; Ding, W.M.; Sun, Y. Accumulated Temperature Variation and Accumulated Temperature Rezone in Heilongjiang Province. Chin. Agric. Meteorol. 2014, 35, 492–496. (In Chinese) [Google Scholar]
- Moss, R.H.; Edmonds, J.A.; Hibbard, K.A.; Manning, M.R.; Rose, S.K.; Vuuren, D.P.; Carter, T.R.; Emor, S.; Kainuma, M.; Kram, T.; et al. The next generation of scenarios for climate change research and assessment. Nature 2010, 463, 747–756. [Google Scholar] [CrossRef] [PubMed]
- Sperber, K.R.; Annamalai, H.; Kang, I.S.; Kitoh, A.; Moise, A.; Turner, A.; Wang, B.; Zhou, T. The Asian summer monsoon: An intercomparison of CMIP5 vs. CMIP3 simulations of the late 20th century. Clim. Dyn. 2013, 41, 2711–2744. [Google Scholar] [CrossRef]
- Zhu, J.X.; Huang, G.; Wang, X.Q.; Cheng, G.H. Investigation of Changes in Extreme Temperature and Humidity over China through a Dynamical Downscaling Approach. Earth Future 2017, 5. [Google Scholar] [CrossRef]
- Gao, C.C. The Impact of Climate Change on China’s Crop Production: A CMIP5 Ensemble Assessment. In Proceedings of the 2012 First International Conference on Agro-Geoinformatics (Agro-Geoinformatics), Shanghai, China, 2–4 August 2012; pp. 1–5. [Google Scholar]
- Shen, S.H.; Yang, S.B.; Zhao, Y.X.; Xu, Y.L.; Zhao, X.Y.; Wang, Z.Y.; Liu, J.; Zhang, W.W. Simulating the rice yield change in the middle and lower reaches of the Yangtze River under SRES B2 scenario. Acta Ecol. Sin. 2011, 31, 40–48. [Google Scholar] [CrossRef]
- Hui, J.; Xie, L.Y.; Ma, Z.Y. The impacts of climate change on Chinese agriculture. Ann. Arid Zone 2008, 47, 325–342. [Google Scholar]
- Ye, M.Z.; Guo, J.P.; Yuan, B.; Zhao, J.F. Thermal resources and maize temperature suitability in Northeast China under climate change. Appl. Ecol. 2012, 23, 2786–2794. [Google Scholar]
- Ao, X.; Zhai, Q.F.; Cui, Y.; Zhou, X.Y.; Wang, T.; Zhao, C.Y.; Lin, R.; Yi, X. Characteristics and Trend Prediction of Accumulated Temperature in Northeast China. Available online: http://cpfd.cnki.com.cn/Article/CPFDTOTAL-ZGQX201611005004.htm (accessed on 15 July 2018).
- Chu, Z.; Guo, J.P.; Zhao, J.F. Impacts of projected climate change on agricultural climate resources in Northeast China. Acta Geogr. Sin. 2017, 72, 1248–1260. [Google Scholar]
- Wu, S.H.; Zheng, D.; Yin, Y.H.; Lin, E.D.; Xu, Y.L. Northward-shift of temperature zones in China’s eco-geographical study under future climate scenario. J. Geogr. Sci. 2010, 20, 643–651. [Google Scholar] [CrossRef]
- Xu, Y.L.; Pan, J.; Feng, Q. Projection on Future Climate Change in China-Constructing High Resolution SRES Climate Scenarios Using PRECIS; Science Press: Beijing, China, 2016. (In Chinese) [Google Scholar]
- Jones, C.D.; Hughes, J.K.; Bellouin, N.; Hardiman, S.C.; Jones, G.S.; Knight, J.; Liddicoat, S.; O’Connor, F.M.; Andres, R.J.; Bell, C. The HadGEM2-ES implementation of CMIP5 centennial simulations. Geosci. Model. 2011, 4, 543–570. [Google Scholar] [CrossRef] [Green Version]
- Estévez, J.; Gavilán, P.; Giráldez, J.V. Guidelines on validation procedures for meteorological data from automatic weather stations. J. Hydrol. 2011, 402, 144–154. [Google Scholar] [CrossRef] [Green Version]
- Xu, Y.L.; Zhang, Y.; Lin, Y.H.; Lin, E.D.; Lin, W.T.; Dong, W.J.; Richard, J.; David, H.; Simon, W. Using PRECIS to analyze the climate change response of China under the SRES B2 scenario. Chin. Sci. Bull. 2006, 51, 2068–2074. [Google Scholar] [CrossRef]
- Zhang, Y.; Xu, Y.L.; Dong, W.J.; Cao, L.J.; Michael, S. A future climate scenario of regional changes in extreme climate events over China using the PRECIS climate model. Geophys. Res. Lett. 2006, 33. [Google Scholar] [CrossRef] [Green Version]
- Yang, H.L.; Xu, Y.L.; Zhang, L.; Pan, J.; Li, X. Projected change in heat waves over China using the PRECIS climate model. Clim. Res. 2010, 42, 79–88. [Google Scholar] [CrossRef] [Green Version]
- Zhang, Y.J.; Fu, L.; Pan, J.; Xu, Y.L. Projected Changes in Temperature Extremes in China Using PRECIS. Atmosphere 2017, 8, 15. [Google Scholar] [CrossRef]
- Zhang, M.T.; Zhang, Y.J.; Tong, J.H.; Li, K.; Pan, J.; Xu, Y.L. Characteristics of agricultural climate resources in the potential northward migration area of winter wheat under future climate scenarios. Clim. Chang. Res. 2017, 13, 1673–1719. (In Chinese) [Google Scholar]
- Xu, Y.; Gao, X.J.; Shen, Y.; Xu, C.H.; Shi, Y.; Giorgi, F. A daily temperature dataset over China and its application in validating a RCM simulation. Adv. Atmos. Sci. 2009, 26, 763–772. [Google Scholar] [CrossRef] [Green Version]
- Hu, Q.; Pan, X.B.; Zhang, D.; Yang, N.; Li, Q.Y.; Shao, C.X. Variation of Temperature and Frost-free Period in Different Time Scales in Northeast China. Chin. J. Agrometeorol. 2015, 36, 1–8. (In Chinese) [Google Scholar]
- Liu, D.; Zhang, J.H.; Meng, F.C. Effects of different soil moisture and air temperature regimes on the growth characteristics and grain yield of maize in Northeast China. Chin. J. Ecol. 2013, 32, 2904–2910. [Google Scholar]
- Liu, C.B.; Ji, X.X.; Xu, Y.L.; Wang, M.X.; Zhang, L.; Pan, J.; Hu, Y.N.; Tong, J.H. Analysis of Changes in the Maximum and Minimum Temperature and Diurnal Temperature Range from PRECIS Model under the SRES A1B Scenario for China. Clim. Environ. Res. 2015, 20, 89–96. (In Chinese) [Google Scholar]
- You, Q.L.; Min, J.Z.; Fraedrich, K.; Zhang, W.; Kang, S.C.; Zhang, L.; Meng, X.H. Projected trends in mean, maximum, and minimum surface temperature in China from simulations. Glob. Planet. Chang. 2014, 112, 53–63. [Google Scholar] [CrossRef]
- Chen, L.; Frauenfeld, O.W. Surface Air Temperature Changes over the Twentieth and Twenty-First Centuries in China Simulated by 20 CMIP5 Models. J. Clim. 2014, 27, 3920–3937. [Google Scholar] [CrossRef]
- Liu, J.; Du, H.B.; Wu, Z.F.; Hong, S.H.; Wang, L.; Zong, S.W. Recent and future changes in the combination of annual temperature and precipitation throughout China. Int. J. Climatol. 2017, 37, 821–833. [Google Scholar] [CrossRef]
- Guo, D.L.; Wang, H.J. Comparison of a very-fine-resolution GCM with RCM dynamical downscaling in simulating climate in China. Adv. Atmos. Sci. 2016, 33, 559–570. [Google Scholar] [CrossRef] [Green Version]
- Bennett, K.E.; Walsh, J.E. Spatial and temporal changes in indices of extreme precipitation and temperature for Alaska. Int. J. Climatol. 2015, 35, 1434–1452. [Google Scholar] [CrossRef]
- Tang, X.; Yang, X.C.; Tian, Z.; Günter, F.; Sun, L.X.; Pan, J. Impacts of Climate Change on Agro-Climatic Resources in China. Resour. Sci. 2011, 33, 1962–1968. (In Chinese) [Google Scholar]
- Yang, R.Z.; Zhou, G.S. Spatio-temporal distribution of maize chilling damage intensity in the Three Provinces of Northeast China During 1961 to 2013. Acta Ecol. Sin. 2016, 36, 4386–4394. (In Chinese) [Google Scholar]
- Wu, J.D.; Wang, S.L.; Zhang, J.M. A Numerical Simulation of the Impacts of Climate Change on Water and Thermal Resourced in Northeast China. Resour. Sci. 2000, 22, 36–42. (In Chinese) [Google Scholar]
Figure 1.
Position and topography of Northeast China.
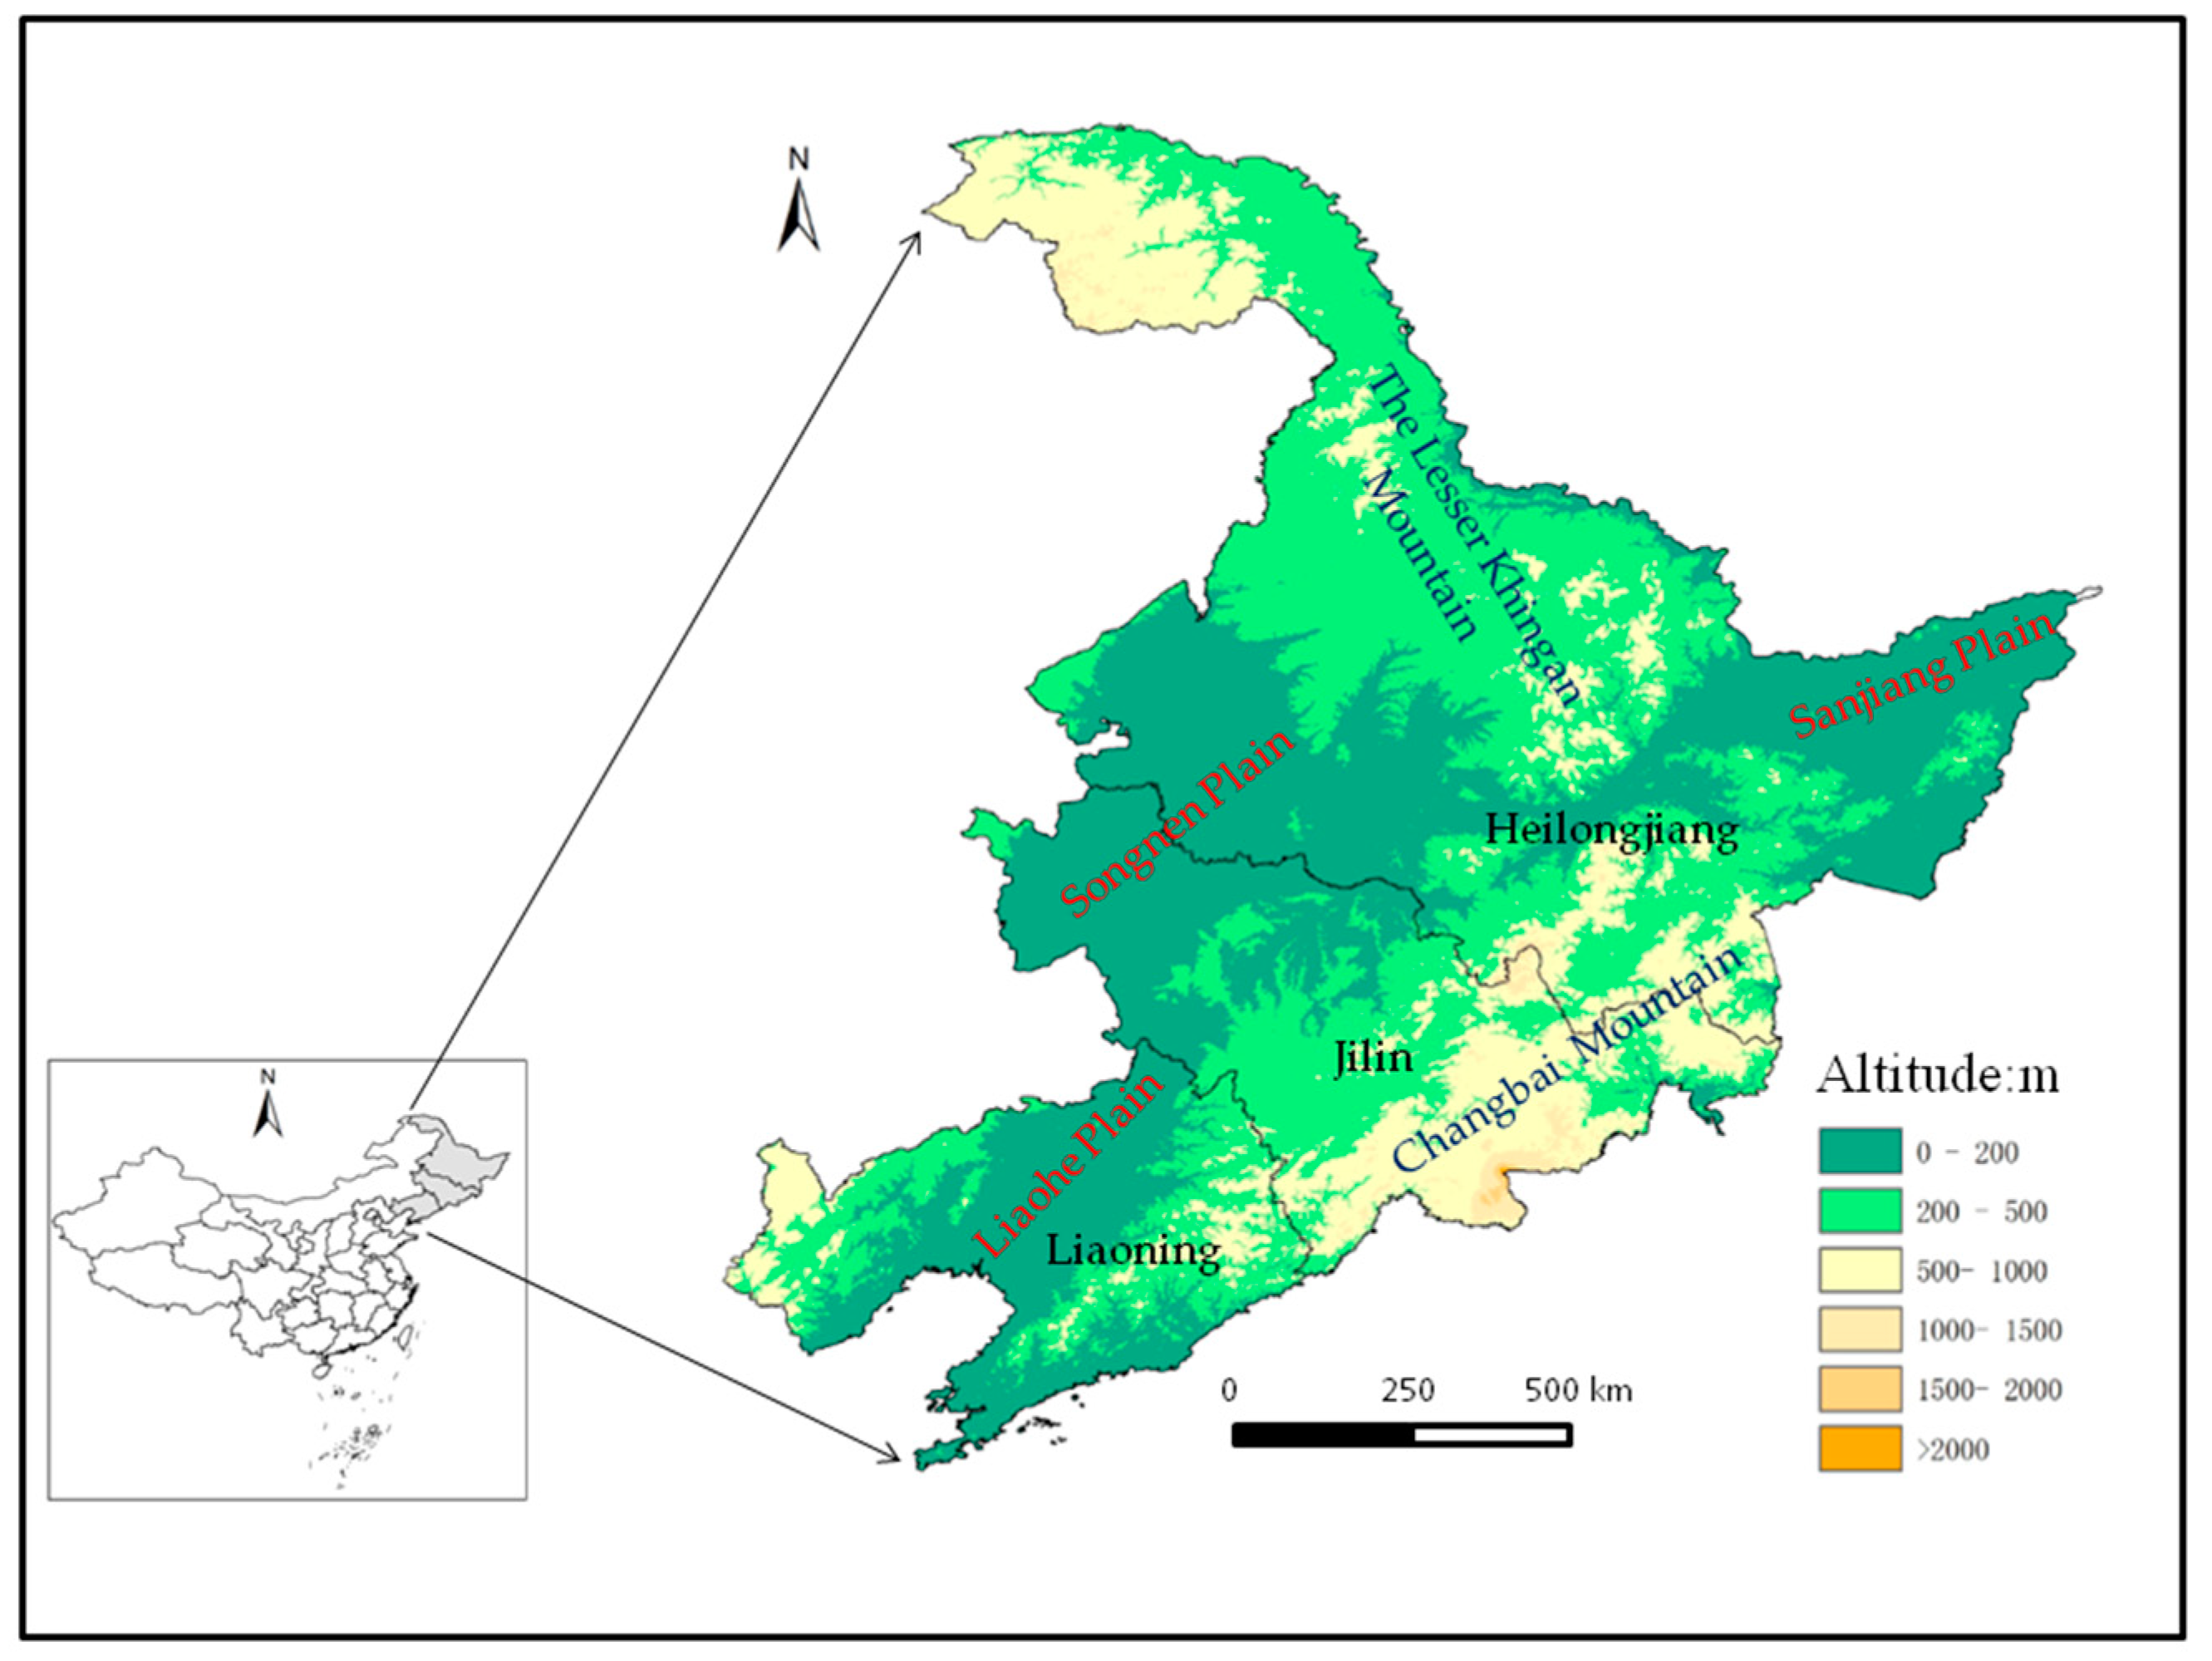
Figure 2.
Spatial distributions of Tmean and Tmin for observation, simulation and correction, as well as the bias of simulated and corrected vs. observed Tmean and Tmin during the baseline period: (a) observed Tmean; (b) simulated Tmean; (c) corrected Tmean; (d) observed Tmin; (e) simulated Tmin; (f) corrected Tmin; (g) bias of simulated and observed Tmean; (h) bias of corrected and observed Tmean; (i) bias of simulated and observed Tmin; (j) bias of corrected and observed Tmin.
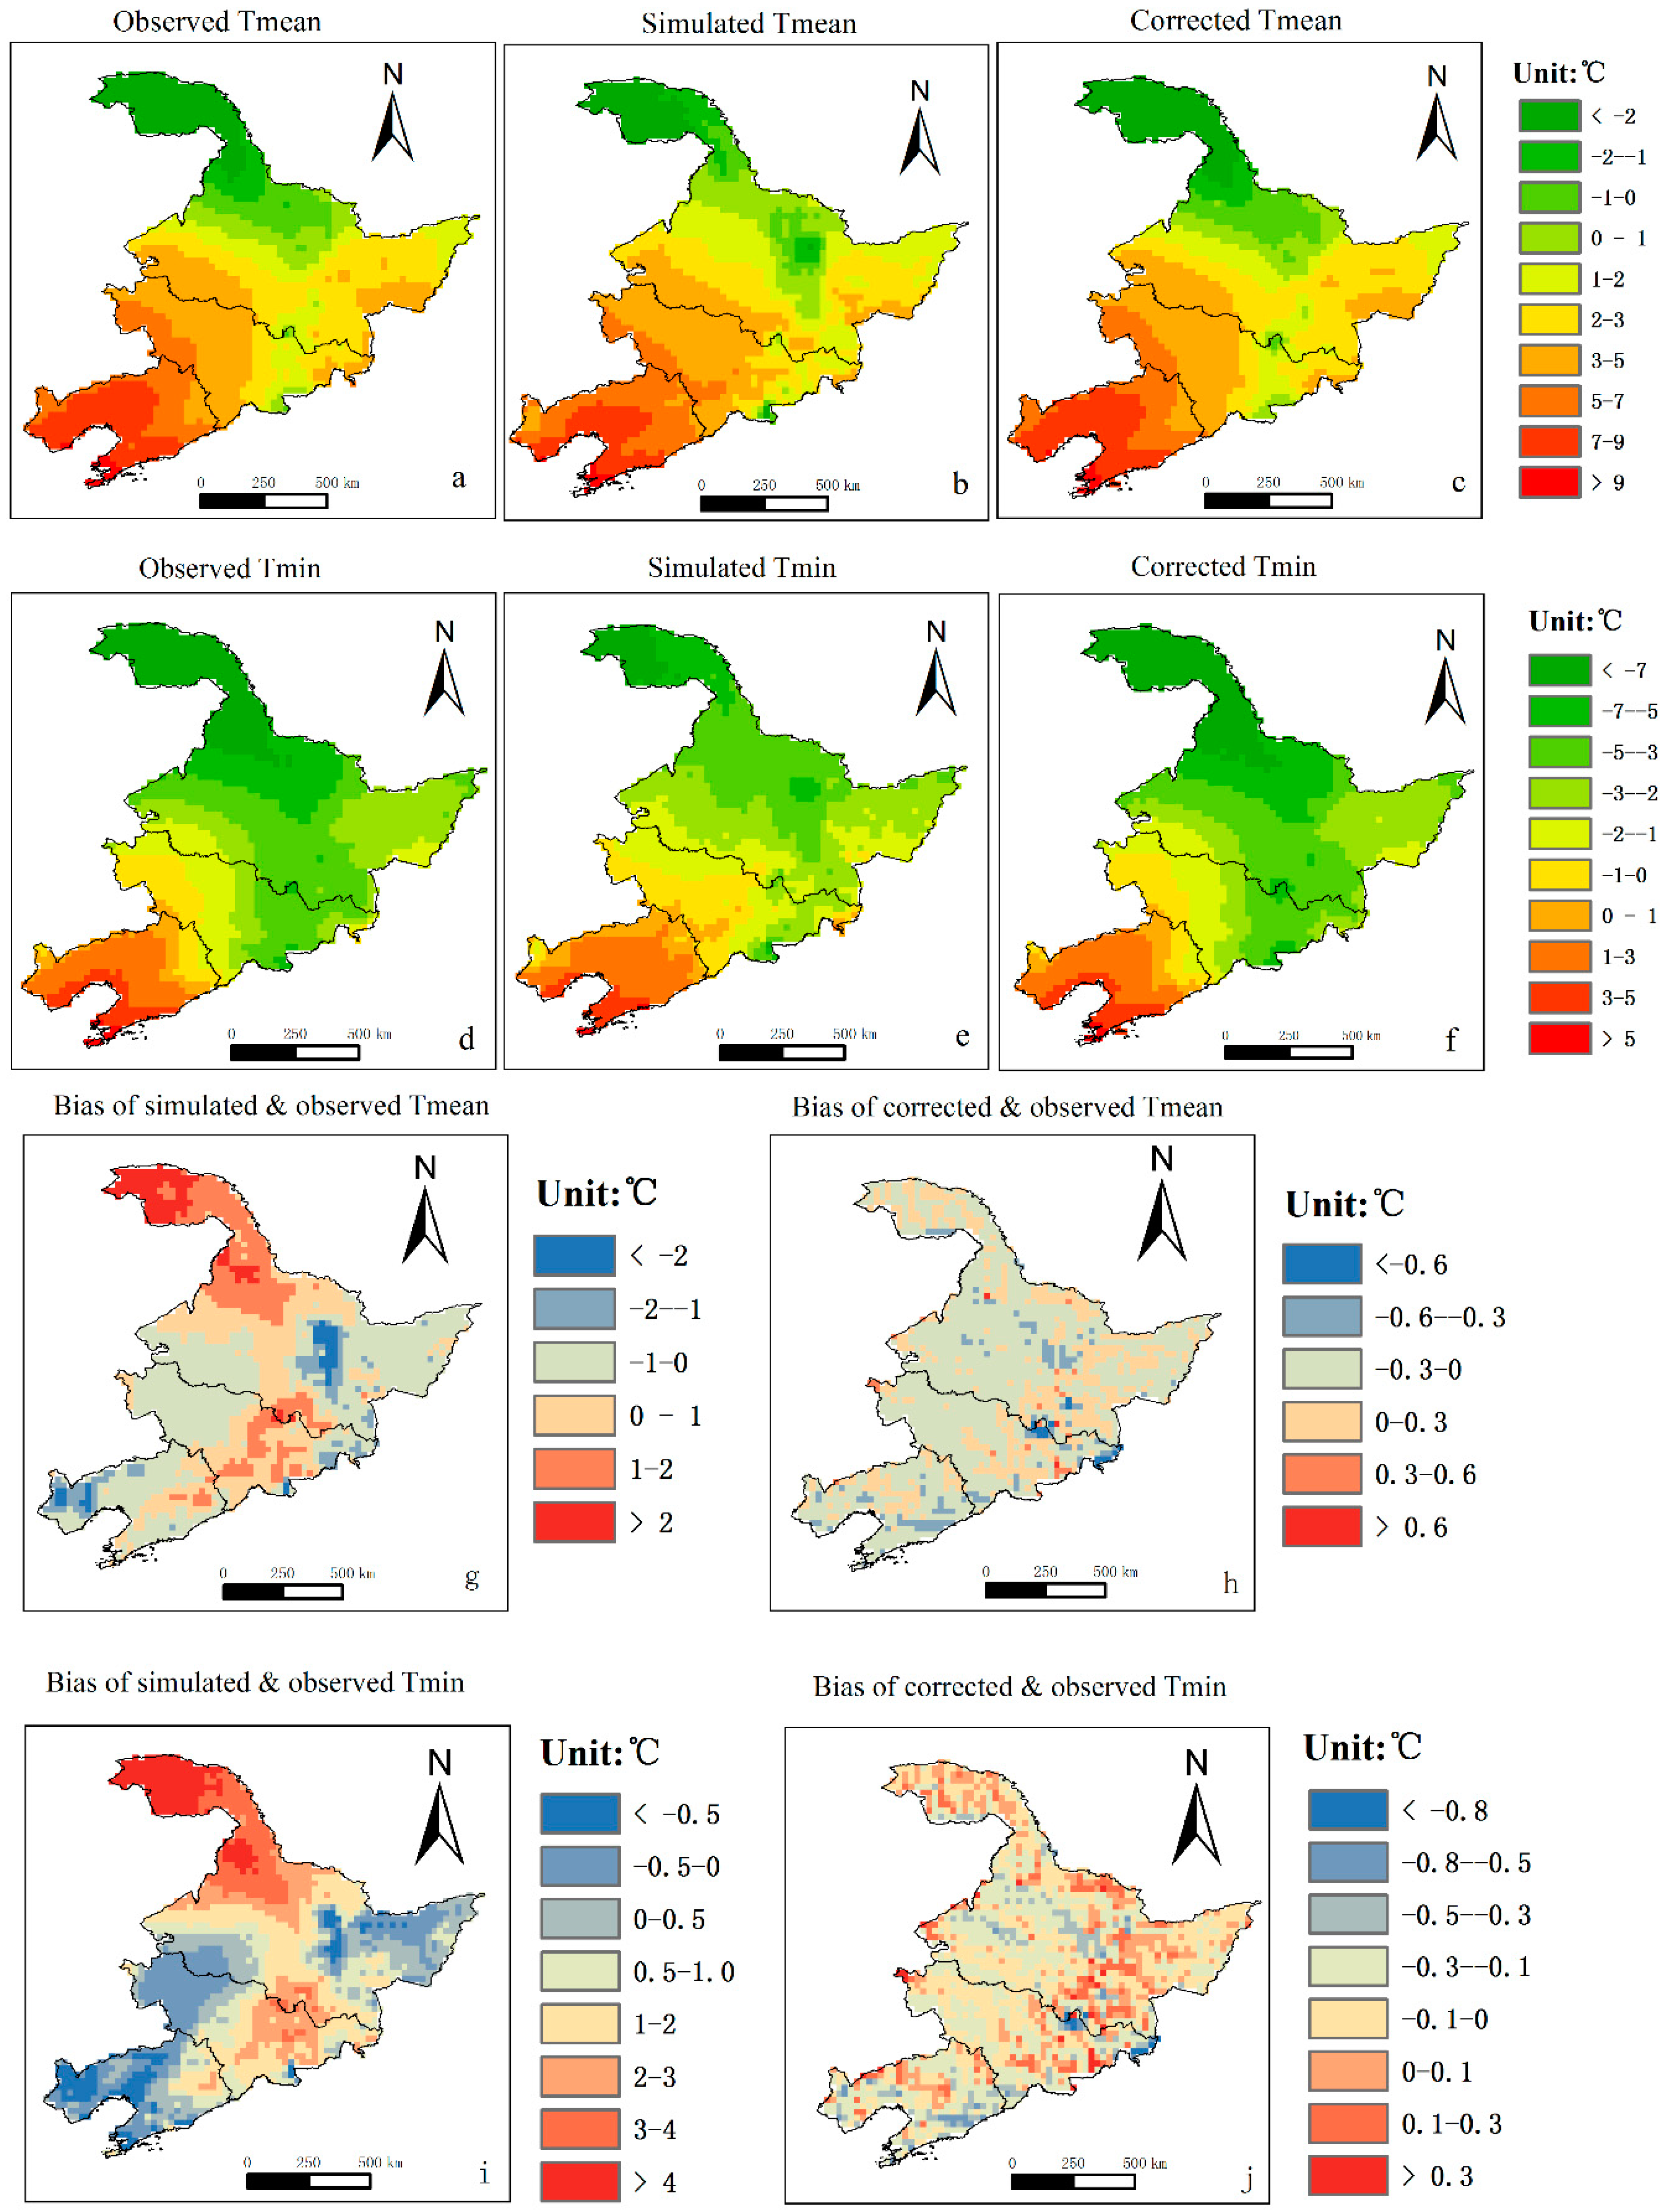
Figure 3.
Probability distribution functions (PDFs) of the Tmean and Tmin for observation, simulation and correction during the baseline period: (a) PDFs of the Tmean for observation (black line), simulation (blue line), and correction (red line); (b) PDFs of the Tmin for observation (black line), simulation (blue line) and correction (red line).

Figure 4.
Spatial distribution of AT10, PGS and FFP for observation, simulation and correction during the baseline period: (a) observed AT10; (b) simulated AT10; (c) corrected AT10; (d) observed PGS; (e) simulated PGS; (f) corrected PGS; (g) observed FFP; (h) simulated FFP; (i) corrected FFP.
Figure 4.
Spatial distribution of AT10, PGS and FFP for observation, simulation and correction during the baseline period: (a) observed AT10; (b) simulated AT10; (c) corrected AT10; (d) observed PGS; (e) simulated PGS; (f) corrected PGS; (g) observed FFP; (h) simulated FFP; (i) corrected FFP.
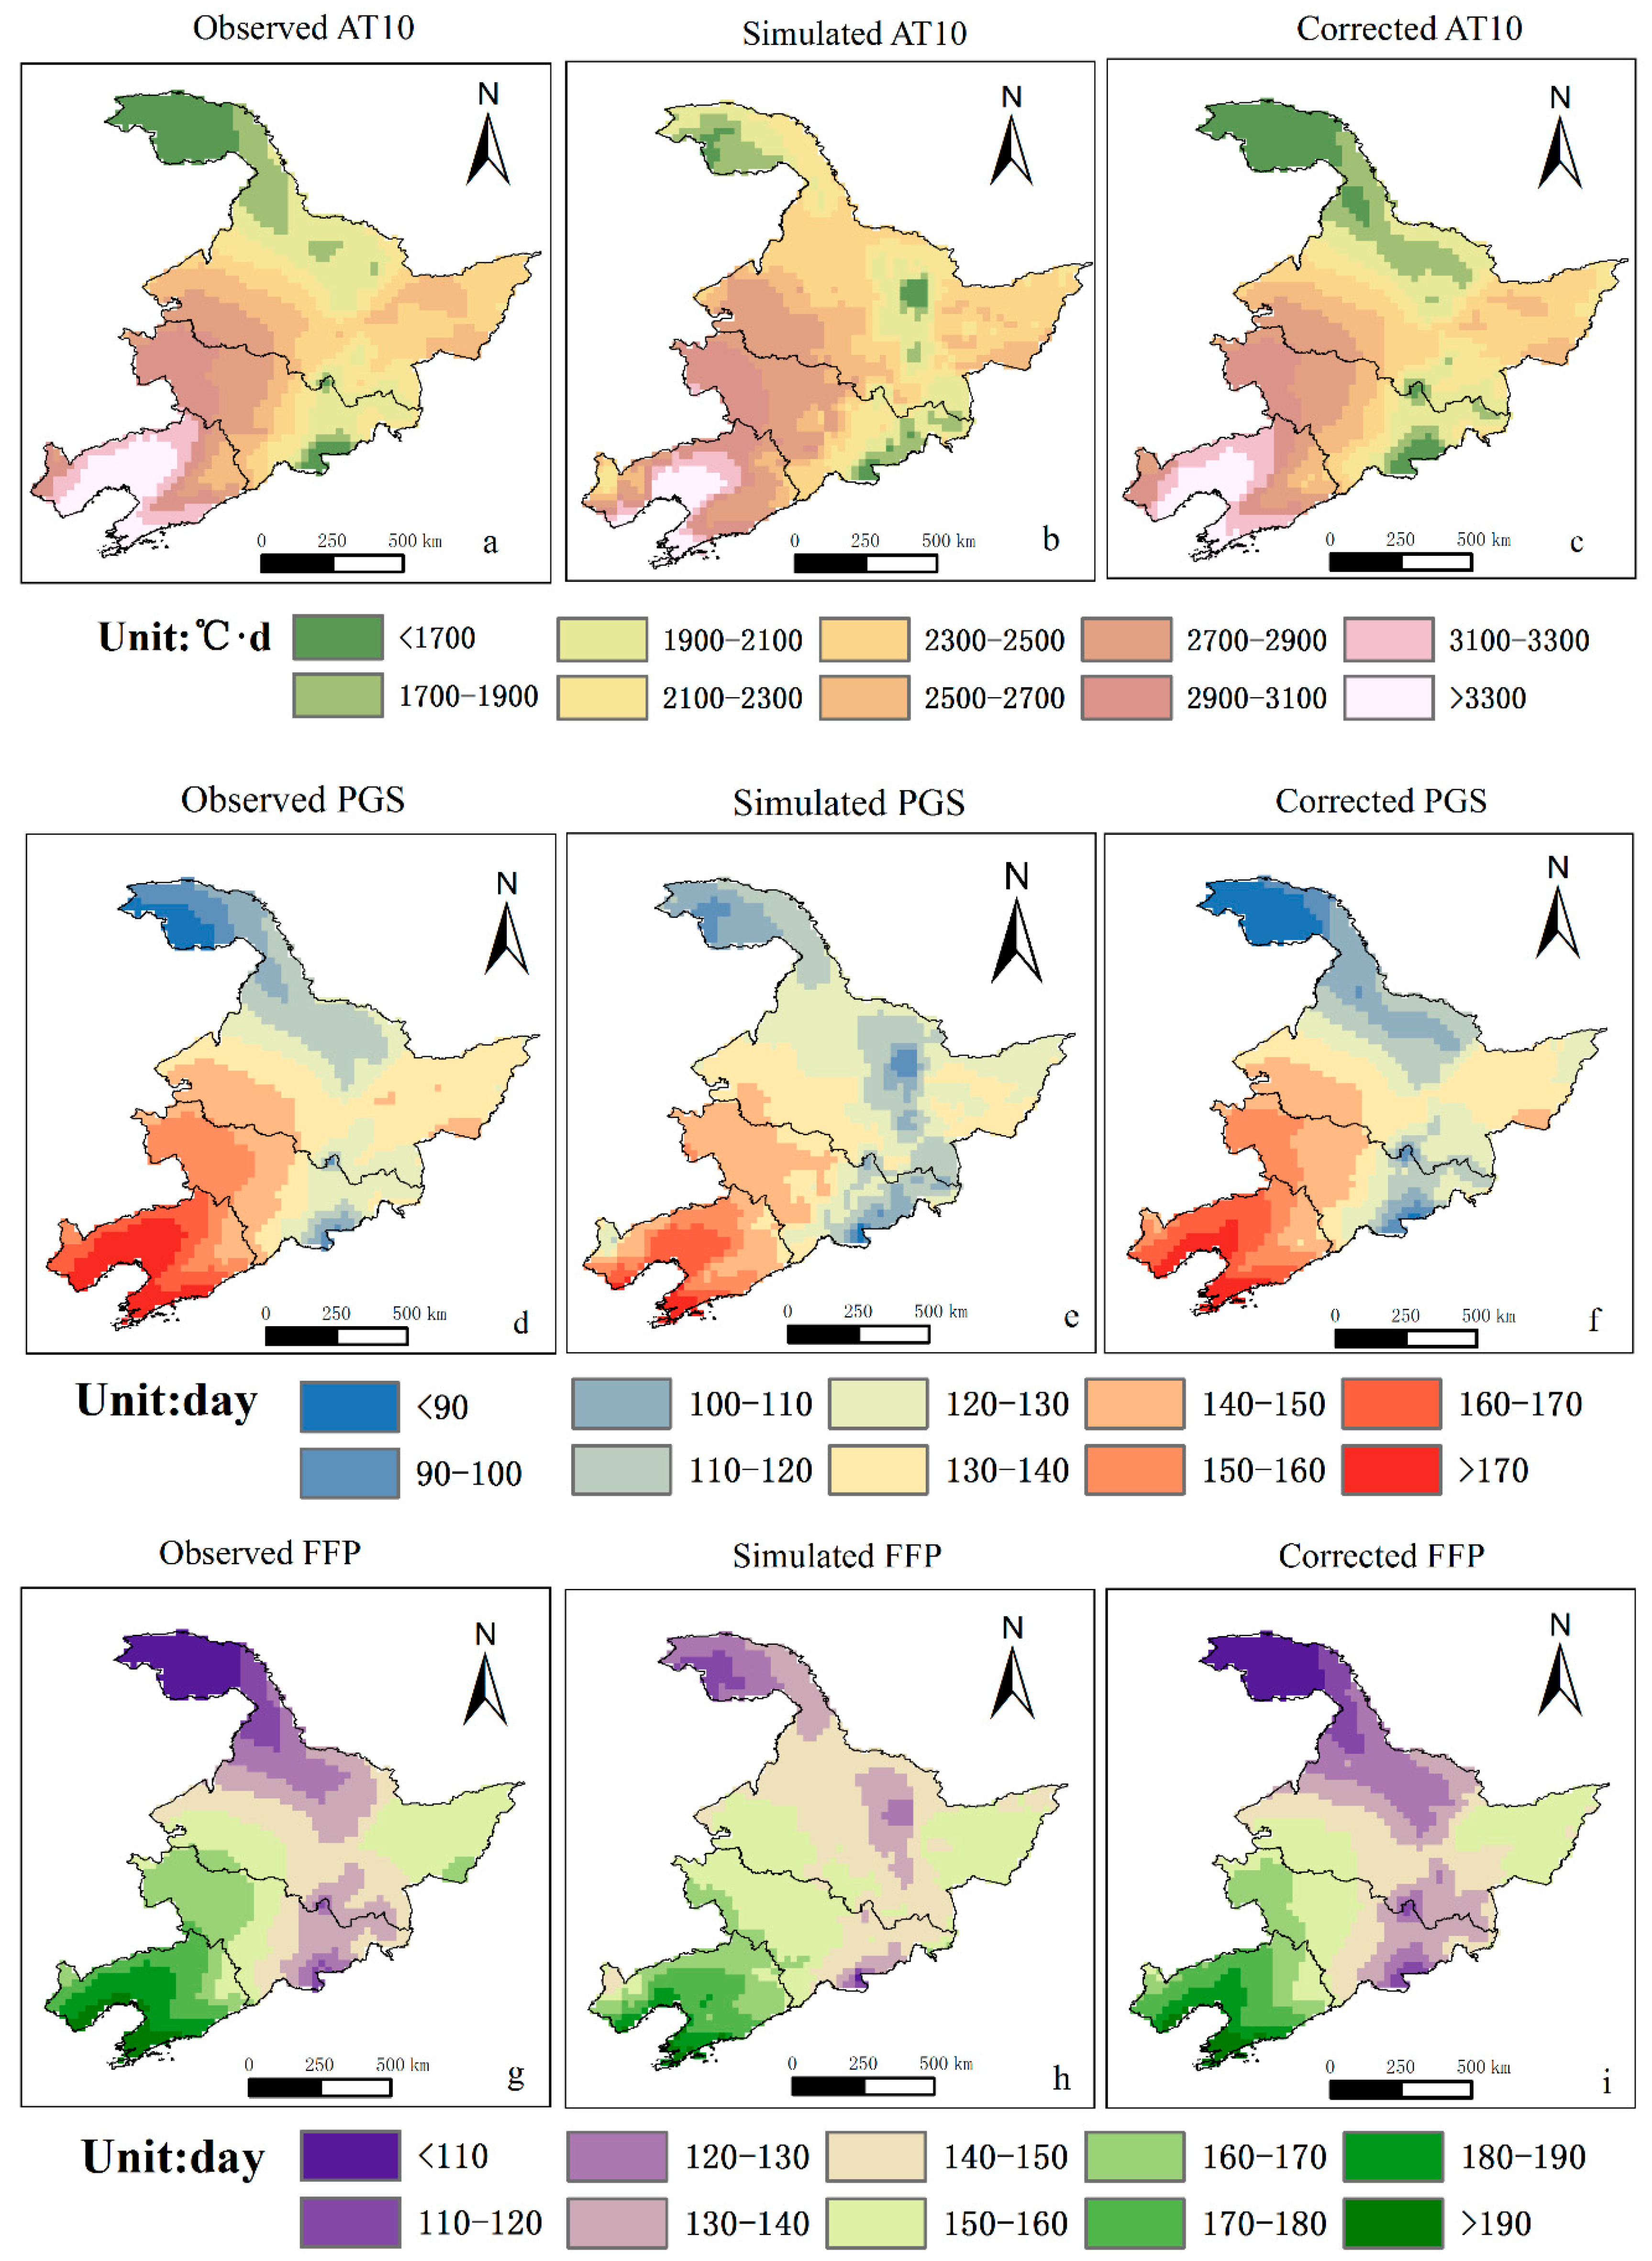
Figure 5.
Changes of Tmean and Tmin compared with the baseline period over the 21st century: (a) changes of Tmean in 2020s; (b) changes of Tmean in 2050s; (c) changes of Tmean in 2080s; (d) changes of Tmin in 2020s; (e) changes of Tmin in 2050s; and (f) changes of Tmin in 2080s.
Figure 5.
Changes of Tmean and Tmin compared with the baseline period over the 21st century: (a) changes of Tmean in 2020s; (b) changes of Tmean in 2050s; (c) changes of Tmean in 2080s; (d) changes of Tmin in 2020s; (e) changes of Tmin in 2050s; and (f) changes of Tmin in 2080s.
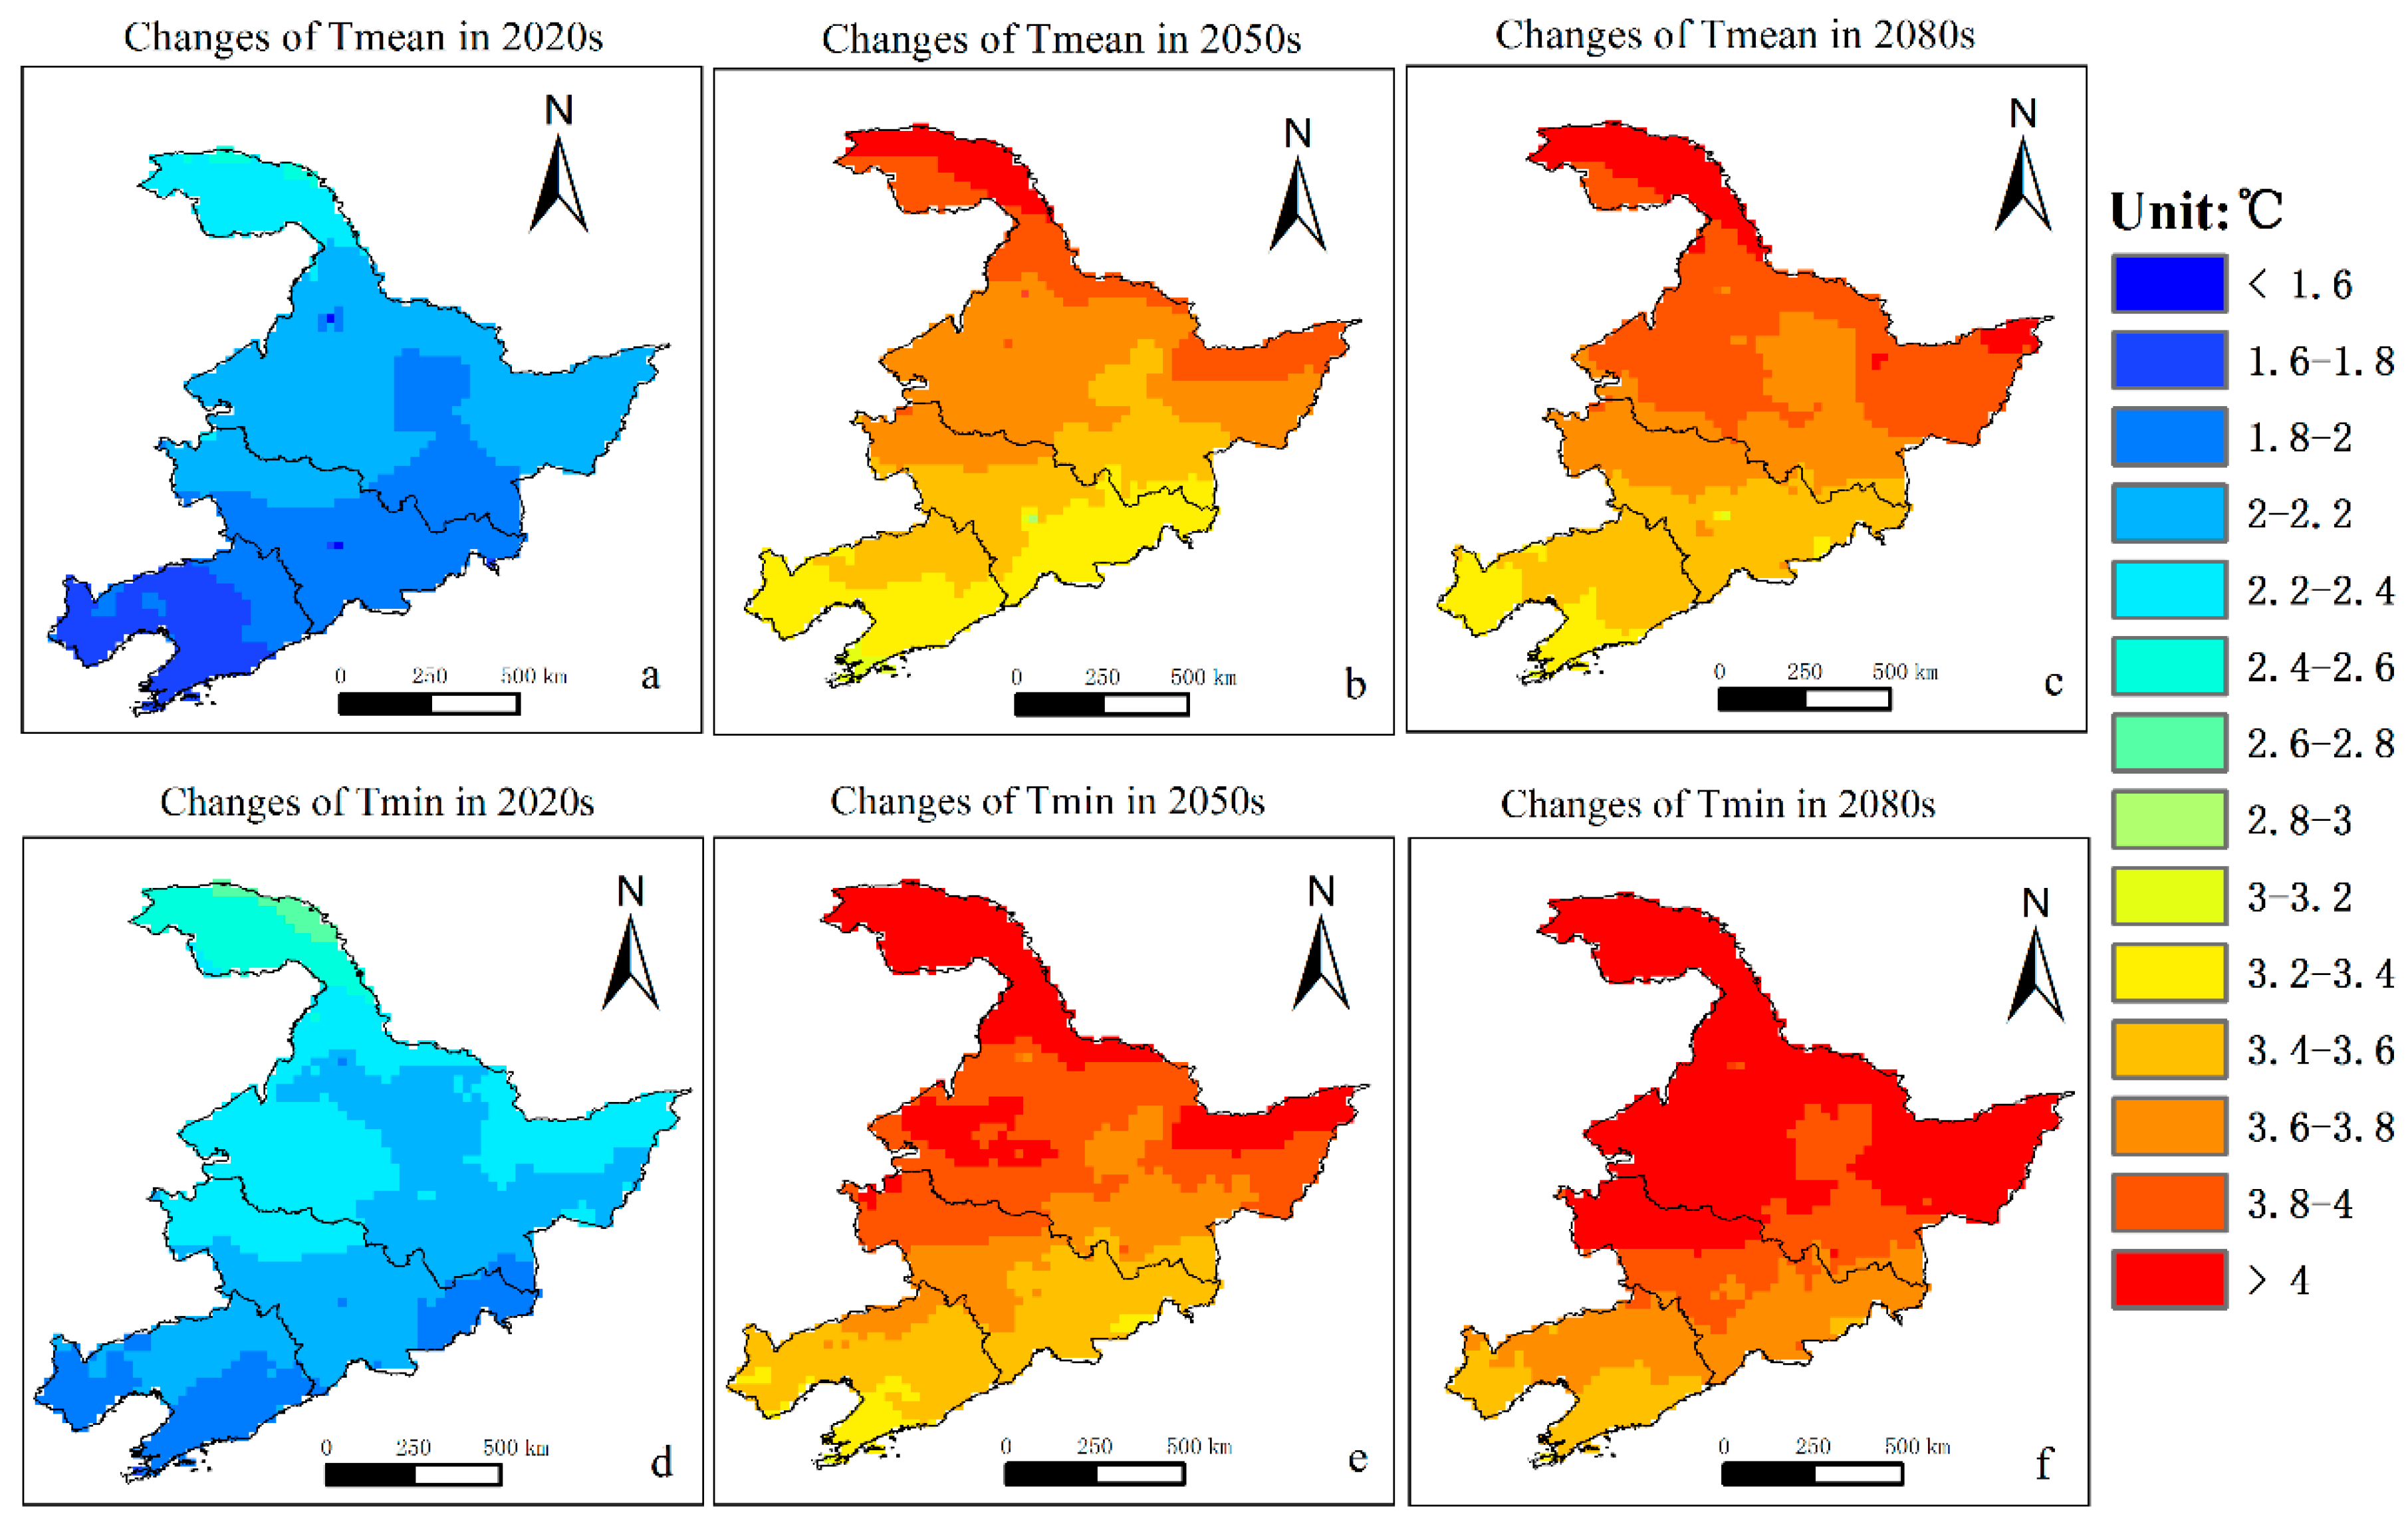
Figure 6.
Changes of the AT10, PGS and FFP compared with the baseline period over the 21st century: (a) changes of AT10 in 2020s; (b) changes of AT10 in 2050s; (c) changes of AT10 in 2080s; (d) changes of PGS in 2020s; (e) changes of PGS in 2050s; (f) changes of PGS in 2080s; (g) changes of FFP in 2020s; (h) changes of FFP in 2050s; (i) changes of FFP in 2080s.

Figure 7.
Changes of first and last days of PGS and FFP over the baseline and the 21st century: (a) first day of PGS; (b) last day of PGS; (c) first day of FFP; (d) last day of FFP. The solid lines represent the dates under the RCP4.5; the break lines represent the dates extracted for observation during the baseline.

Table 1.
Definitions of thermal indices used in this study.
| Code | Index | Description | Unit |
|---|---|---|---|
| AT10 | Accumulated temperature ≥ 10 °C | Accumulated temperature value during daily air mean temperature (Tmean) ≥ 10 °C 1 period. | °C·day |
| PGS | Potential growing season | Annual (1st of January to 31st of December) count days with Tmean ≥ 10 °C. FD-PGS means the first occurrence date of PGS, and LD-PGS means the last occurrence date of PGS. | day |
| FFP | Frost-free period | Annual (1st of January to 31st of December) count days with daily air minimum temperature (Tmin) ≥ 2 °C 2. FD-FFP means the first occurrence date of FFP, and LD-FFP means the last occurrence date of FFP. | day |
Table 2.
Changes of thermal indices during the 21st century.
| Indices (Unit) | 2020s | 2050s | 2080s |
|---|---|---|---|
| Tmean (°C) | 1.6–2.4 | 3.2–4.0 | 3.4–4.0 |
| Tmin (°C) | 1.8–2.6 | 3.4–4.2 | 3.6–4.2 |
| AT10 (°C·day) | 300–450 | 650–850 | 750–1000 |
| PGS (day) | 12–20 | 22–32 | 26–36 |
| FFP (day) | 10–18 | 22–30 | 24–34 |
© 2018 by the authors. Licensee MDPI, Basel, Switzerland. This article is an open access article distributed under the terms and conditions of the Creative Commons Attribution (CC BY) license (http://creativecommons.org/licenses/by/4.0/).
Share and Cite
MDPI and ACS Style
Li, X.; Xu, Y.; Meng, C.; Zhang, L.; Wang, C. Analysis on the Changes of Agro-Meteorological Thermal Indices in Northeast China under RCP4.5 Scenario Using the PRECIS2.1. Atmosphere 2018, 9, 323. https://doi.org/10.3390/atmos9080323
AMA Style
Li X, Xu Y, Meng C, Zhang L, Wang C. Analysis on the Changes of Agro-Meteorological Thermal Indices in Northeast China under RCP4.5 Scenario Using the PRECIS2.1. Atmosphere. 2018; 9(8):323. https://doi.org/10.3390/atmos9080323
Chicago/Turabian StyleLi, Xinhua, Yinlong Xu, Chunchun Meng, Lei Zhang, and Changgui Wang. 2018. "Analysis on the Changes of Agro-Meteorological Thermal Indices in Northeast China under RCP4.5 Scenario Using the PRECIS2.1" Atmosphere 9, no. 8: 323. https://doi.org/10.3390/atmos9080323
Note that from the first issue of 2016, this journal uses article numbers instead of page numbers. See further details here.