Chemical Composition and Sources of Marine Aerosol over the Western North Pacific Ocean in Winter

1
Jiangxi Province Key Laboratory of the Causes and Control of Atmospheric Pollution, East China University of Technology, Nanchang 330013, China
2
School of Water Resources and Environmental Engineering, East China University of Technology, Nanchang 330013, China
3
College of Fisheries, Guangdong Ocean University, Zhanjiang 524088, China
4
State Key Laboratory of Tropical Oceanography, South China Sea Institute of Oceanology, Chinese Academy of Sciences, Guangzhou 510301, China
*
Author to whom correspondence should be addressed.
Atmosphere 2018, 9(8), 298; https://doi.org/10.3390/atmos9080298
Submission received: 24 June 2018
/
Revised: 15 July 2018
/
Accepted: 27 July 2018
/
Published: 30 July 2018
(This article belongs to the Section Aerosols)
Abstract
:Atmospheric deposition of long-range transported continental substances from natural and anthropogenic sources affects biogeochemical processes in marine systems. Emissions of sea spray contribute aerosol particles to the marine atmosphere. Despite the importance of continental dispersion and atmospheric processes involving aerosol particles within remote marine atmosphere, knowledge of the sources of various water-soluble ions is limited because of insufficient observations. Concentrations of Total suspended particulates (TSPs) and major inorganic ions (Cl−, Na+, SO42−, Mg2+, Ca2+, K+, NO3−, NH4+), as well as organic nitrogen (ON-N) values, were measured in marine aerosol collected over the western north Pacific (WNP) during a cruise from 3 December 2014 to 13 March 2015. Aerosol samples were analyzed to determine their chemical characteristics and a source apportionment for this region and the continental influence on the open ocean when air masses are from continent in winter. TSP mass concentrations ranged from 14.1 to 136.0 μg/m3 with an average of 44.8 ± 28.1 μg/m3. Concentrations of TSPs and major ions were higher near the coast (close to Qingdao and Xiamen) and lower over the open ocean. The total mass of inorganic ions and organic nitrogen accounted for 51.1% of the total TSP. Cl− had highest concentrations among the major inorganic ions, followed by SO42−, NO3−, Mg2+, Ca2+, K+, and NH4+, respectively. However, Cl− showed a deficit relative to Na+ in most samples, likely related to heterogeneous reactions within the marine atmosphere. Most SO42−, Mg2+, Ca2+, and K+ were from sea salt, while other major ions were from continental sources. The non-sea-salt (nss) fractions of Ca2+, Mg2+ and K+ were derived from continental crust, while nss-SO42− and NO3− were derived from anthropogenic sources. ON had several sources, including reactions of NOx with volatile organic compounds (anthropogenic sources) or NH3 with gaseous hydrocarbons, as well as crustal and marine biogenic sources.
1. Introduction
The long-distance transport of atmospheric aerosol particles from natural and anthropogenic sources affects ocean ecosystems, climate, and atmospheric chemical processes [1,2,3]. Atmospheric deposition is an important pathway in which nutrients fertilize the open ocean, stimulating phytoplankton growth and influencing the marine biogeochemical cycles [3]. Marine aerosols are comprised of both primary and secondary inorganic and organic components [4]. Primary aerosol particles are emitted directly from natural and anthropogenic sources, while secondary aerosol particles form from condensable atmospheric gases [2]. In the remote marine atmosphere, ions from sea salt make significant contributions to the aerosol mass of Na+, Cl−, SO42−, Mg2+, K+ and Ca2+ [1,2,3]. Both natural and anthropogenic components from continental sources also may affect NO3−, SO42−, Ca2+, K+, and trace metal concentrations over open ocean [1,5,6,7]. Duce et al. [5] suggested that reactive nitrogen from anthropogenic sources accounts for a third of the ocean’s external nitrogen supply. Nitrogen deposition to the open ocean is assumed to be 80–100% from anthropogenic sources [8]. In addition, the atmospheric inputs of sulfur and nitrogen oxides from anthropogenic or natural sources to the ocean may accelerate rates of ocean acidification [9]. Other atmospheric substances may also influence the ocean, such as iron, phosphorus, cadmium, and persistent organic pollutants. However, studies suggest that the effect of anthropogenic substances on oceans may not be as great as previously expected [10,11,12].
During the East Asian winter monsoon, strongly flowing cold air masses bring large amounts of mineral dust and anthropogenic pollutants from the Asian continent out over the western Pacific Ocean [13,14,15]. As a result of ongoing rapid economic and industrial development the western Pacific Ocean has received more anthropogenic substances from the Asian continent via long-range transport [2,13,14,16]. It has been reported that higher concentrations of NO3− and NH4+ were observed within air masses from the Asian continent in winter, compared with air masses from the Pacific Ocean in summer at subtropical Okinawa Island [16]. Both NOx and NHy can absorb onto dust or crust particles from the Asian continent to transport to the western North Pacific Ocean (WNP), producing higher concentrations of non-sea-salt (nss) SO42−, nss-K+, and nss-Ca2+ in winter and spring. Such levels contrast the low levels in summer, when air masses are from the Pacific Ocean [2,13,17]. Thus, it is necessary to study the continental influence on the open ocean when air masses are from continent in winter.
In this study, we measured concentrations of major ions (Cl−, Na+, SO42−, Mg2+, Ca2+, K+, NO3−, NH4+) and organic nitrogen (ON) in total suspended particulates (TSP) sampled over the WNP in winter from 3 December 2014 to 13 March 2015 (winter) to identify the spatial variation and sources of major ions and ON. We used a back-trajectory analysis model to assign source regions to these components, with a particular focus on identifying continental (or nss) sources in this region.
2. Methodology
2.1. Aerosol Collection and Chemical Analysis
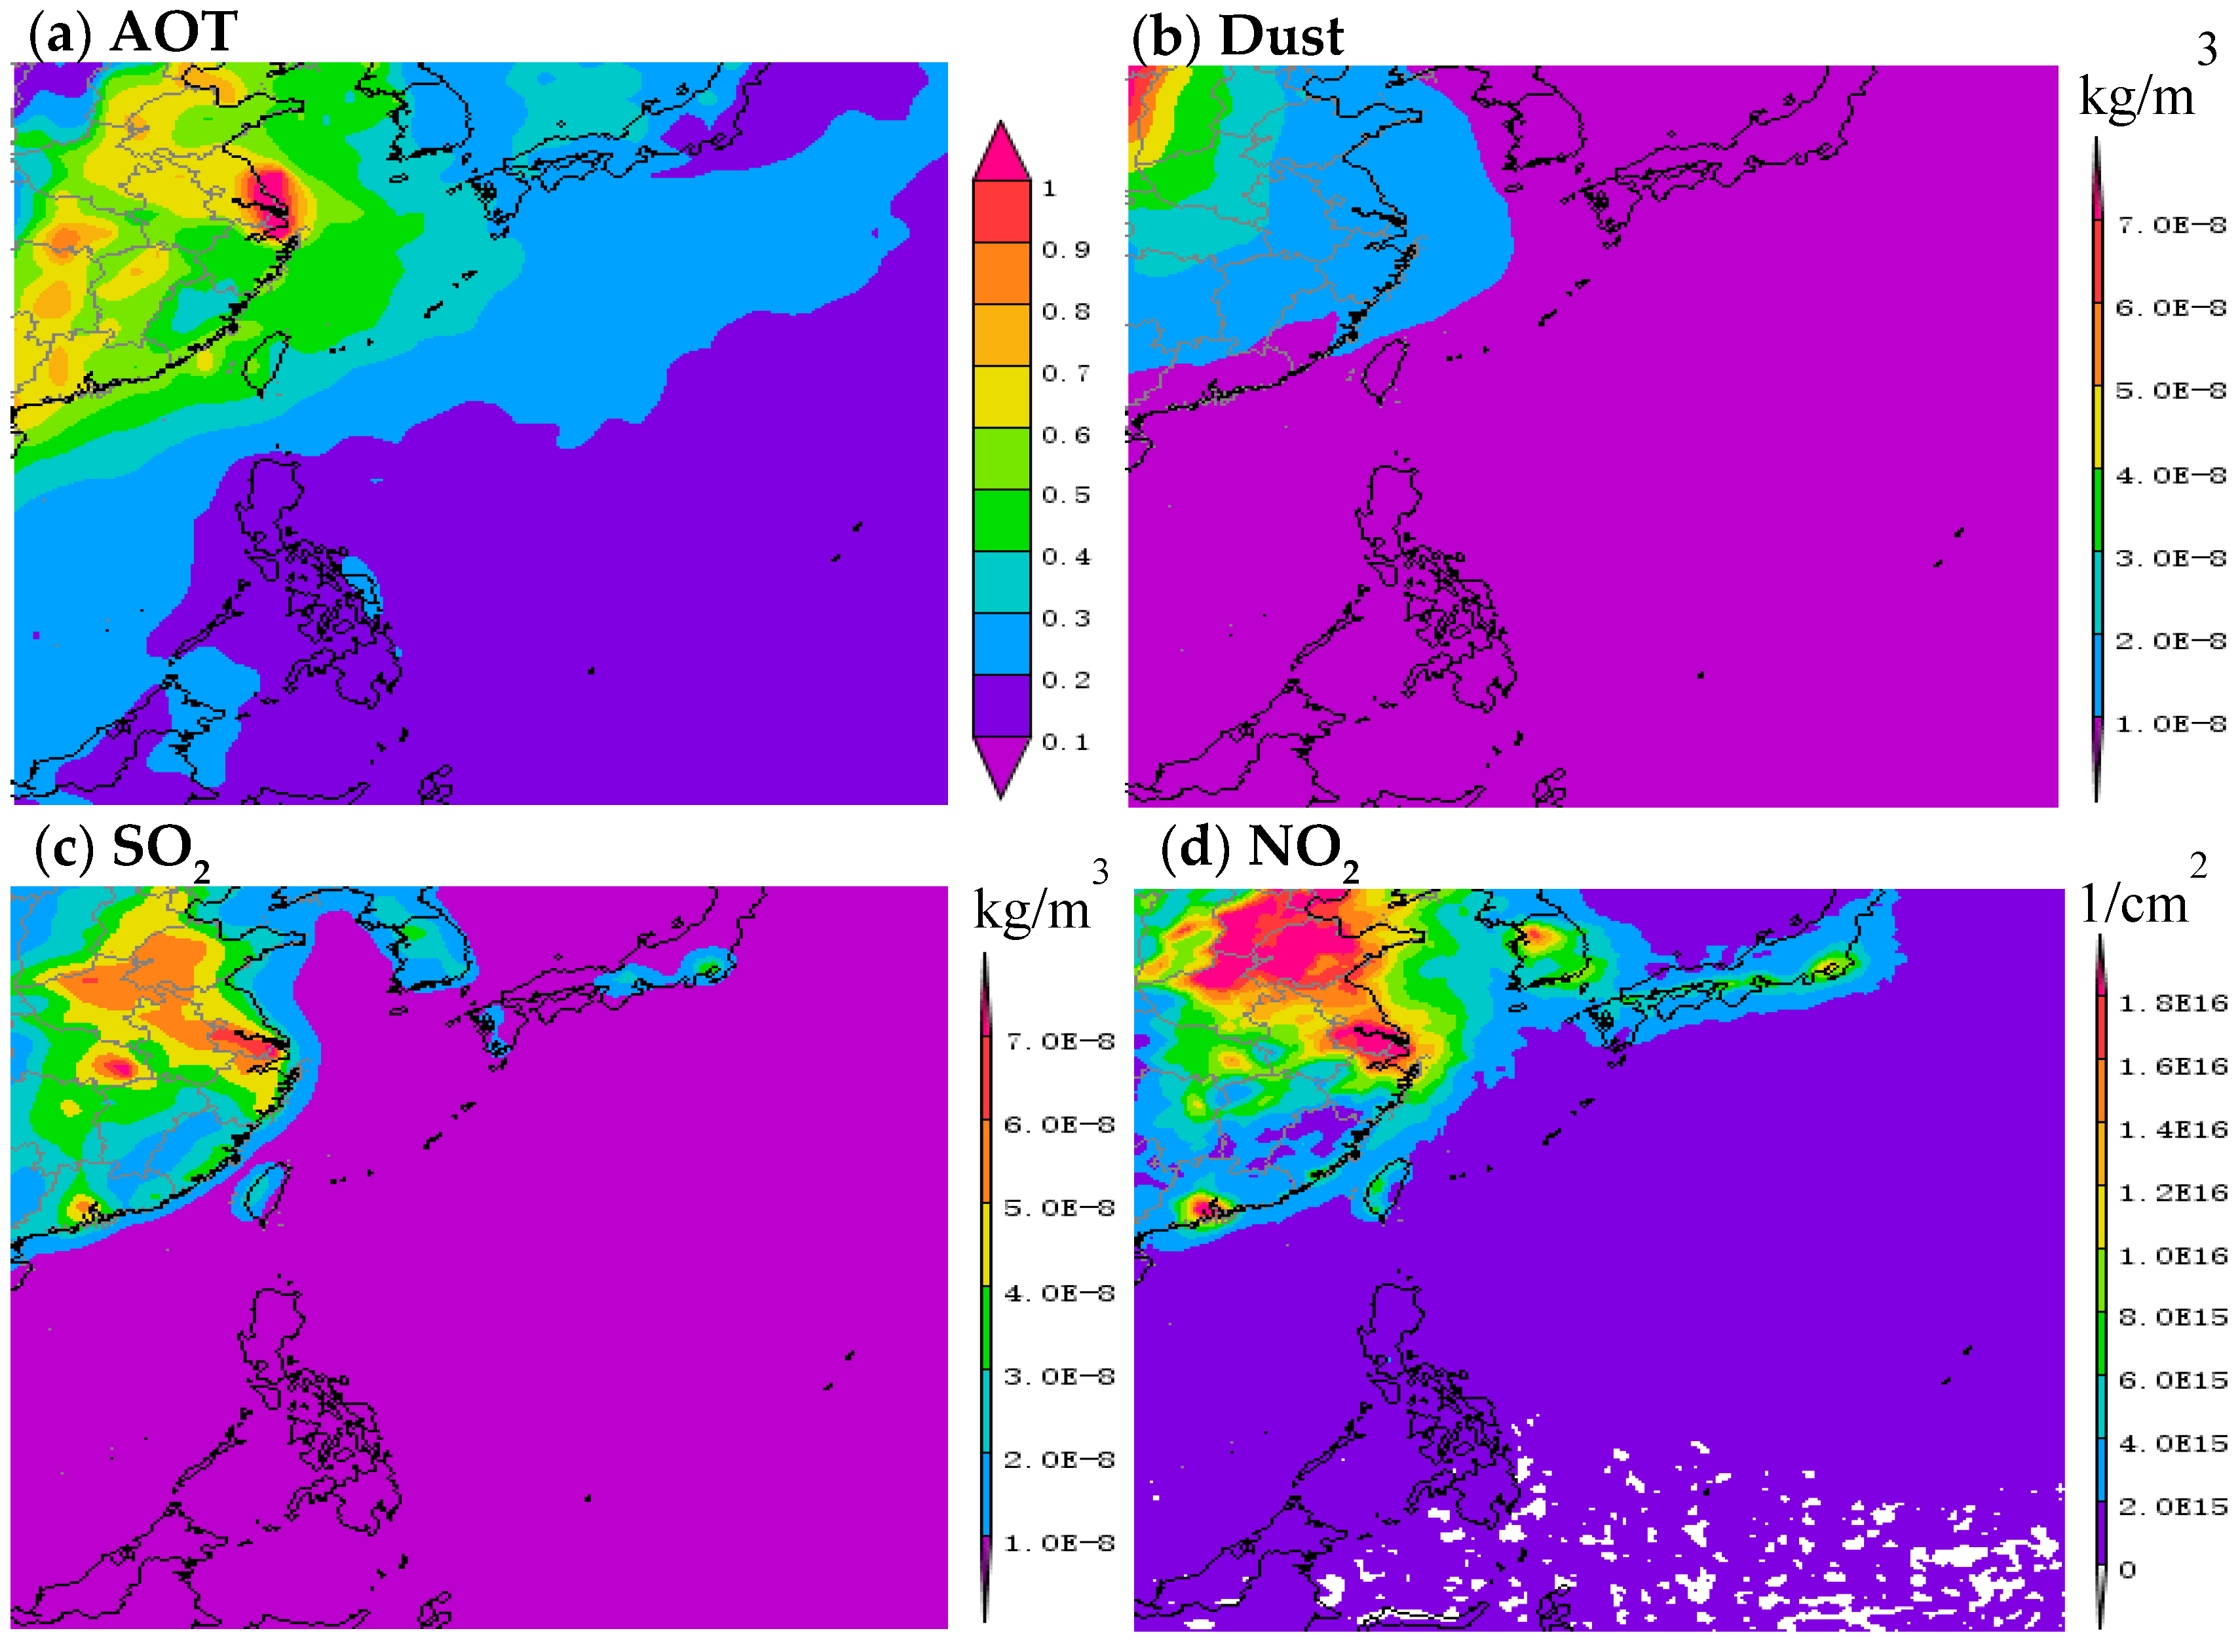
The TSP samples were collected using a special high-volume KC-1000 sampler (1.05 ± 0.03 m3/min; Laoshan Institute for Electronic Equipment, China), which was fixed on the front uppermost observation deck of the Research Vessel Kexue to avoid contamination from the ship exhaust, as described in our previous study [18]. The cruise covered a period of 101 days from 3 December 2014 to 13 March 2015. The cruise occurred during the winter period of the East Asian monsoon. The aerosol optical thickness (AOT), dust, SO2 and NO2 show marked spatial variation during this period (Figure 1), with higher values nearshore to China and lower ones over the Pacific Ocean. The average wind streamlines of 1000 hPa over the western North Pacific Ocean (WNP) indicate a wind speed varying from 4 to 12 m/s. Wind speed increased from about 7 to 12 m/s, as the vessel traveled away from the shore. Sampling sites are shown in Figure 2.
All samples (n = 31) were collected on precombusted Pallflex membrane filters (Type: Tissuquartz™ Filters, 2500 QAT-UP, reorder No. 7204; size: 8 × 10 in; Pall Corp.; Port Washington, NY, USA). Collection time was 48 h (or 2 d/sample). Four blank filters were taken in this cruise. Once a sampling interval was completed, the sample holder and filter were placed in a clean zip-locked plastic bag, folded in two with exposed sides face to face. All samples and blank filters were stored in a refrigerator at −20 °C until analysis in the laboratory. Detailed information about sampling procedures and analysis of all major components are described in Xiao et al. [2].
Briefly, concentrations of major anions (Cl−, SO42−, NO3−), as well as water-soluble metal and nonmetal elements (Ca, K, Mg, Na) were determined using a Dionex™ ICS-90 ion chromatography system (Thermo Fisher Scientific Inc.; Waltham, MA, USA) and a Vista-MPX™ simultaneous inductively coupled plasma optical emission spectrometer (ICP-OES; Varian Inc.; Paolo Alto, CA, USA), respectively. The NH4+ concentrations were analyzed using spectrophotometry, following treatment with Nessler’s reagent. The detection limits of Cl−, NO3−, and SO42− were 0.03, 0.08, and 0.075 mg/L, respectively, and the relative standard deviation of these ions of standard samples were 2.55%, 1.16%, and 1.36%, respectively [19,20]. The detection limits of Ca, K, Mg, and Na were 0.003, 0.06, 0.0005, and 0.02 mg/L, respectively, and the relative standard deviation of these ions of standard samples were less than 1.5% [19,20]. The detection limit of NH4+ was 0.1 mg/L and its relative standard deviation was less than 5.0% [19,20]. A good ionic balance between cations and anions in μeq (y = 1.03x, R2 = 0.92) in our samples suggested that no major ionic components were missed [21]. Detailed information about ON analysis is described in Jickells et al. [22]. The ON-N fraction in the aerosol samples was determined by subtracting the amounts of NO3− and NH4+ from total nitrogen (TN), i.e., ON-N = TN − NH4+ − NO3−. The total nitrogen and carbon (TN and TC) concentrations in aerosols were determined by Elemental Analyzer (EA-IRMS, Flash 2000). Briefly, six circular filters with a diameter of 4.5 mm were weighted and placed in a tin cup, and then combusted subsequently at 980 °C in combustion tube within the EA. During combustion, all the nitrogen- and carbon-containing species were converted to N2 and CO2, respectively. These gaseous components were separated on a packed column of a gas chromatograph installed within the EA. Analytical precision determined from multiple measurements of various standards was and 5% for TN and TC concentrations.
2.2. Concentrations of the Non-Sea-Salt Fraction
To determine the source contributions of major ions within aerosol particles, the concentrations of the nss fractions were calculated, using Na+ as a reference element for a marine origin, as follows [2,19]:
where X represents various ionic components, and (X/Na+) values for seawater are from Keene et al. [23].
2.3. Back Trajectories and Aerosol Optical Thickness
To determine the long-distance transport of atmospheric pollutants, 5-d (120 h) back trajectories of air masses arriving at the location at the start of each sampling period were computed using the open source software TrajStat (Version 1.2.2.6; MeteoInfo), with the top of the model set to 1000 m above sea level, as described in Xiao et al. [2,18,19,24]. The back trajectories of all starting locations are shown in Figure 2. Modeled AOT, dust, SO2 and NO2 data are shown in Figure 1 (data from https://giovanni.gsfc.nasa.gov). Meanwhile, to provide a regional context to this study, Navy Aerosol Analysis and Prediction System Global Aerosol Model data (https://www.nrlmry.navy.mil/aerosol/#aerosolobservations) for SO2, dust, and smoke surface concentrations are shown in Figure S1.
3. Results and Discussion
3.1. Total Suspended Particulate and Major Ion Concentrations of Marine Aerosol Samples
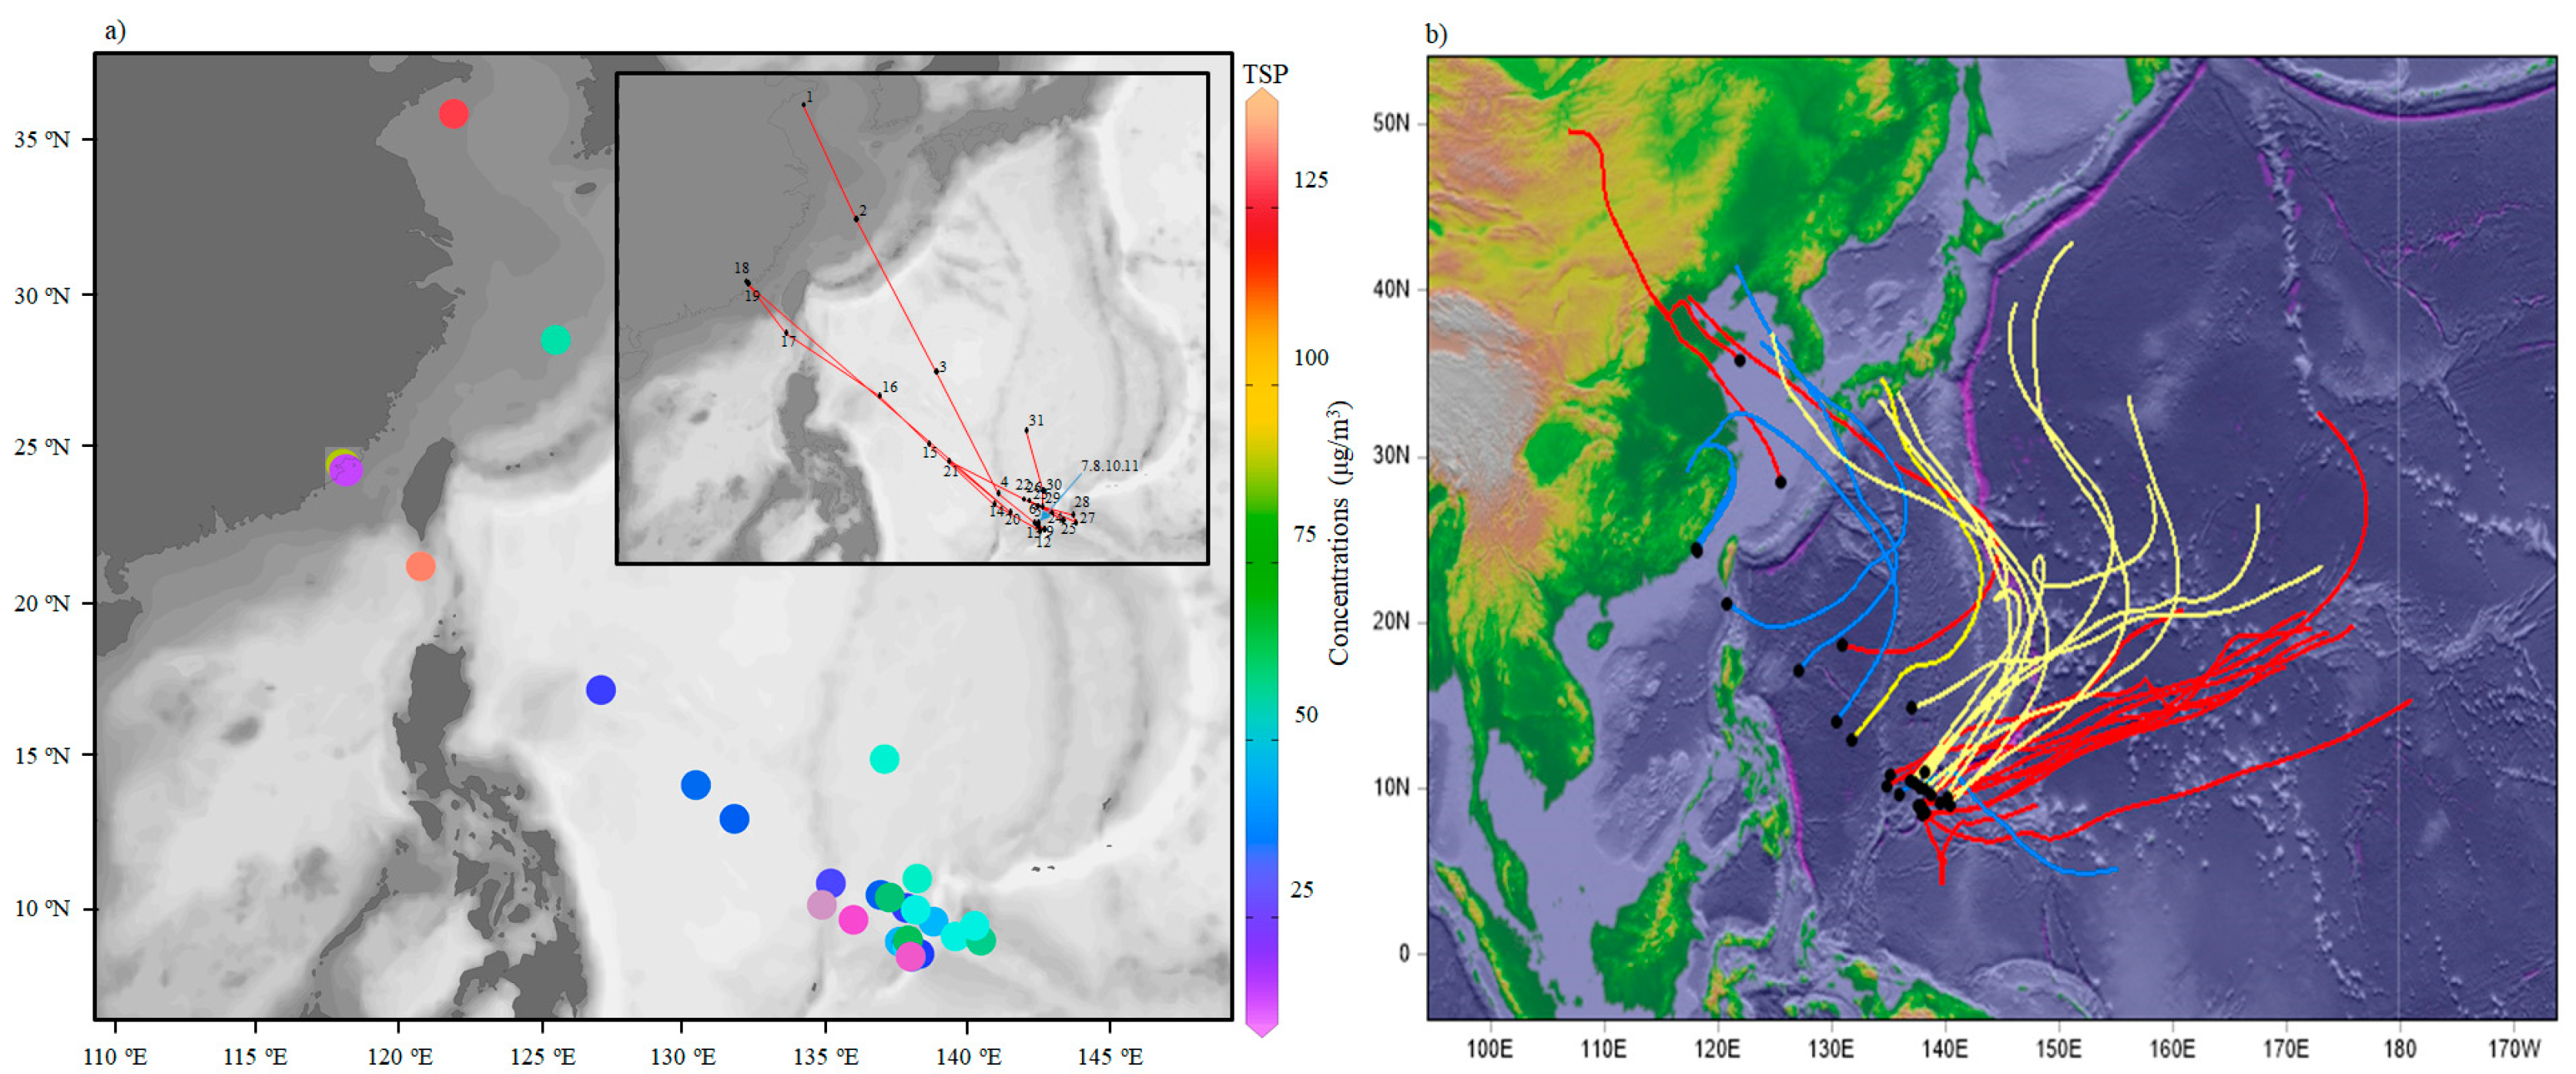
The average TSP concentration in samples was 44.8 ± 28.1 μg/m3, with a range from 14.1 to 136.0 μg/m3. The highest TSP concentration was measured in the Bashi Channel near Xiamen, followed by coastal marine areas near Qingdao (Figure 2). The average TSP concentration over the WNP was much lower than those values in winter at Yongxing Island in the South China Sea (158.9 μg/m3) [2] and over the Northern Yellow Sea (145.2 μg/m3) [1], consistent with their respective AOT distributions (Figure 1), both which are marginal seas of northwestern Pacific Ocean. The average TSP concentration over the WNP was similar to the value obtained in previous study in this region (36.7 μg/m3) [3]. The percentage of total major inorganic ions contributing to the TSP over the WNP was similar to values for the Pacific Oceans [3], but higher than over the South China Sea [2].
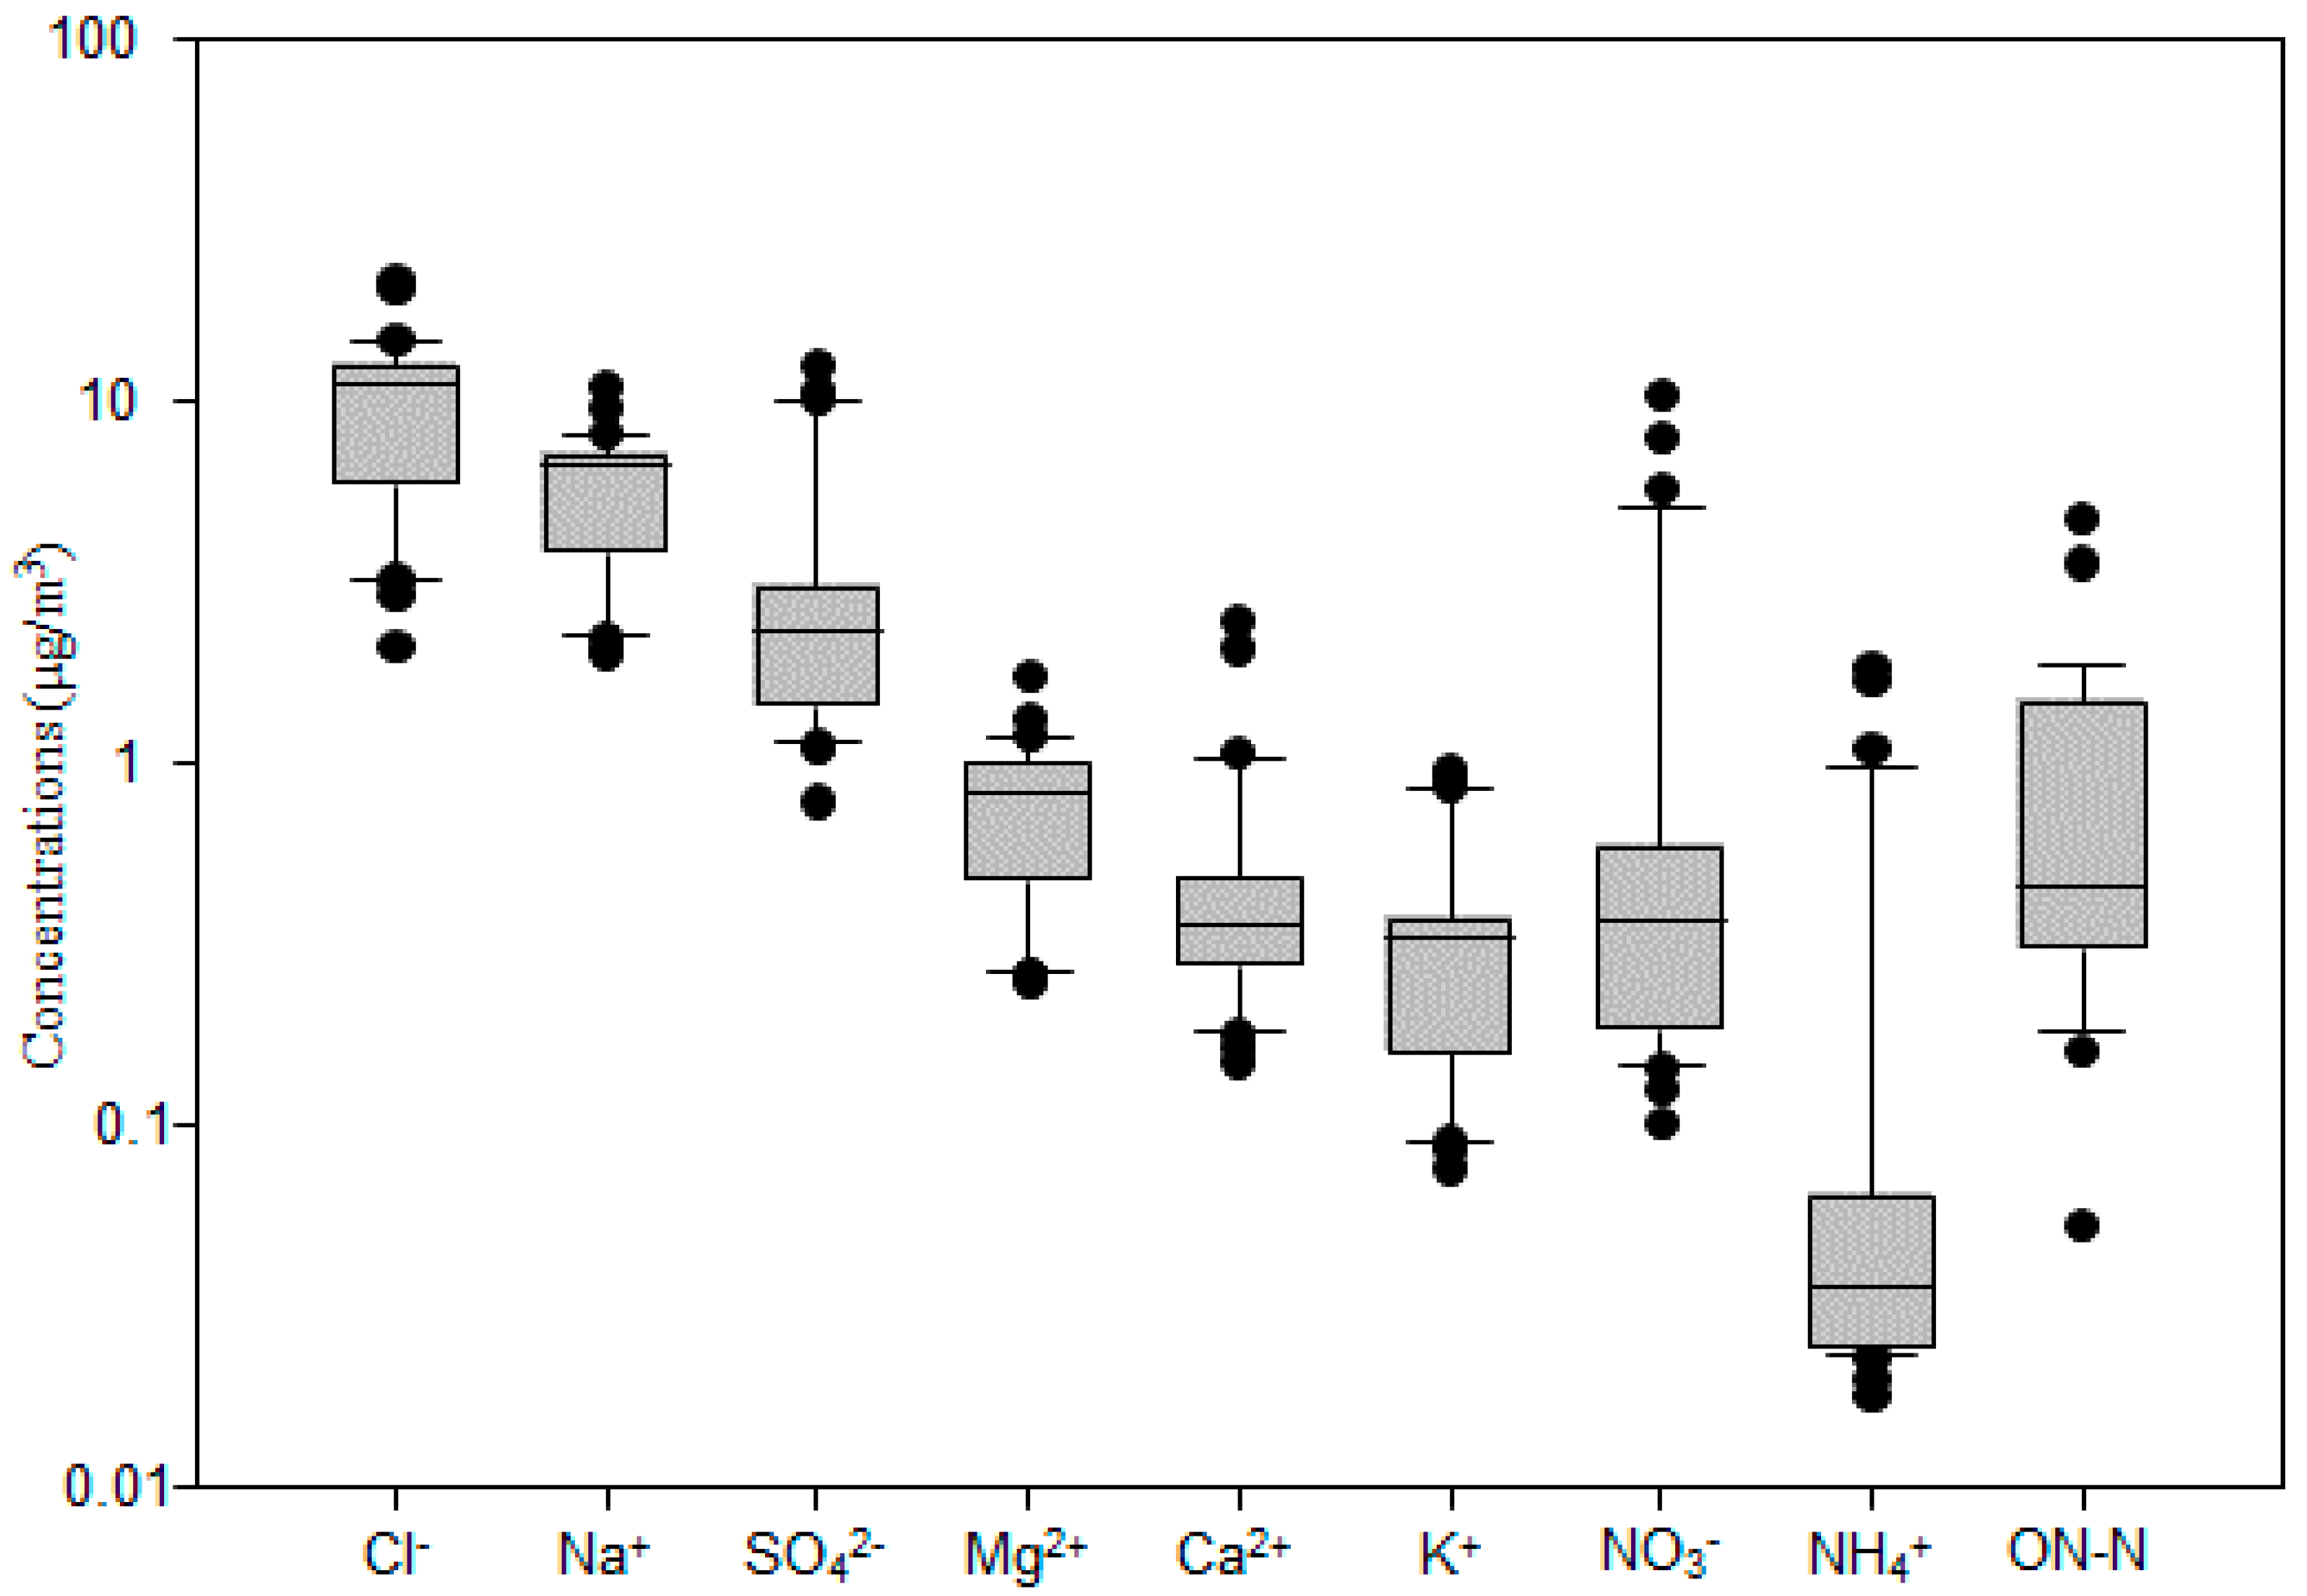
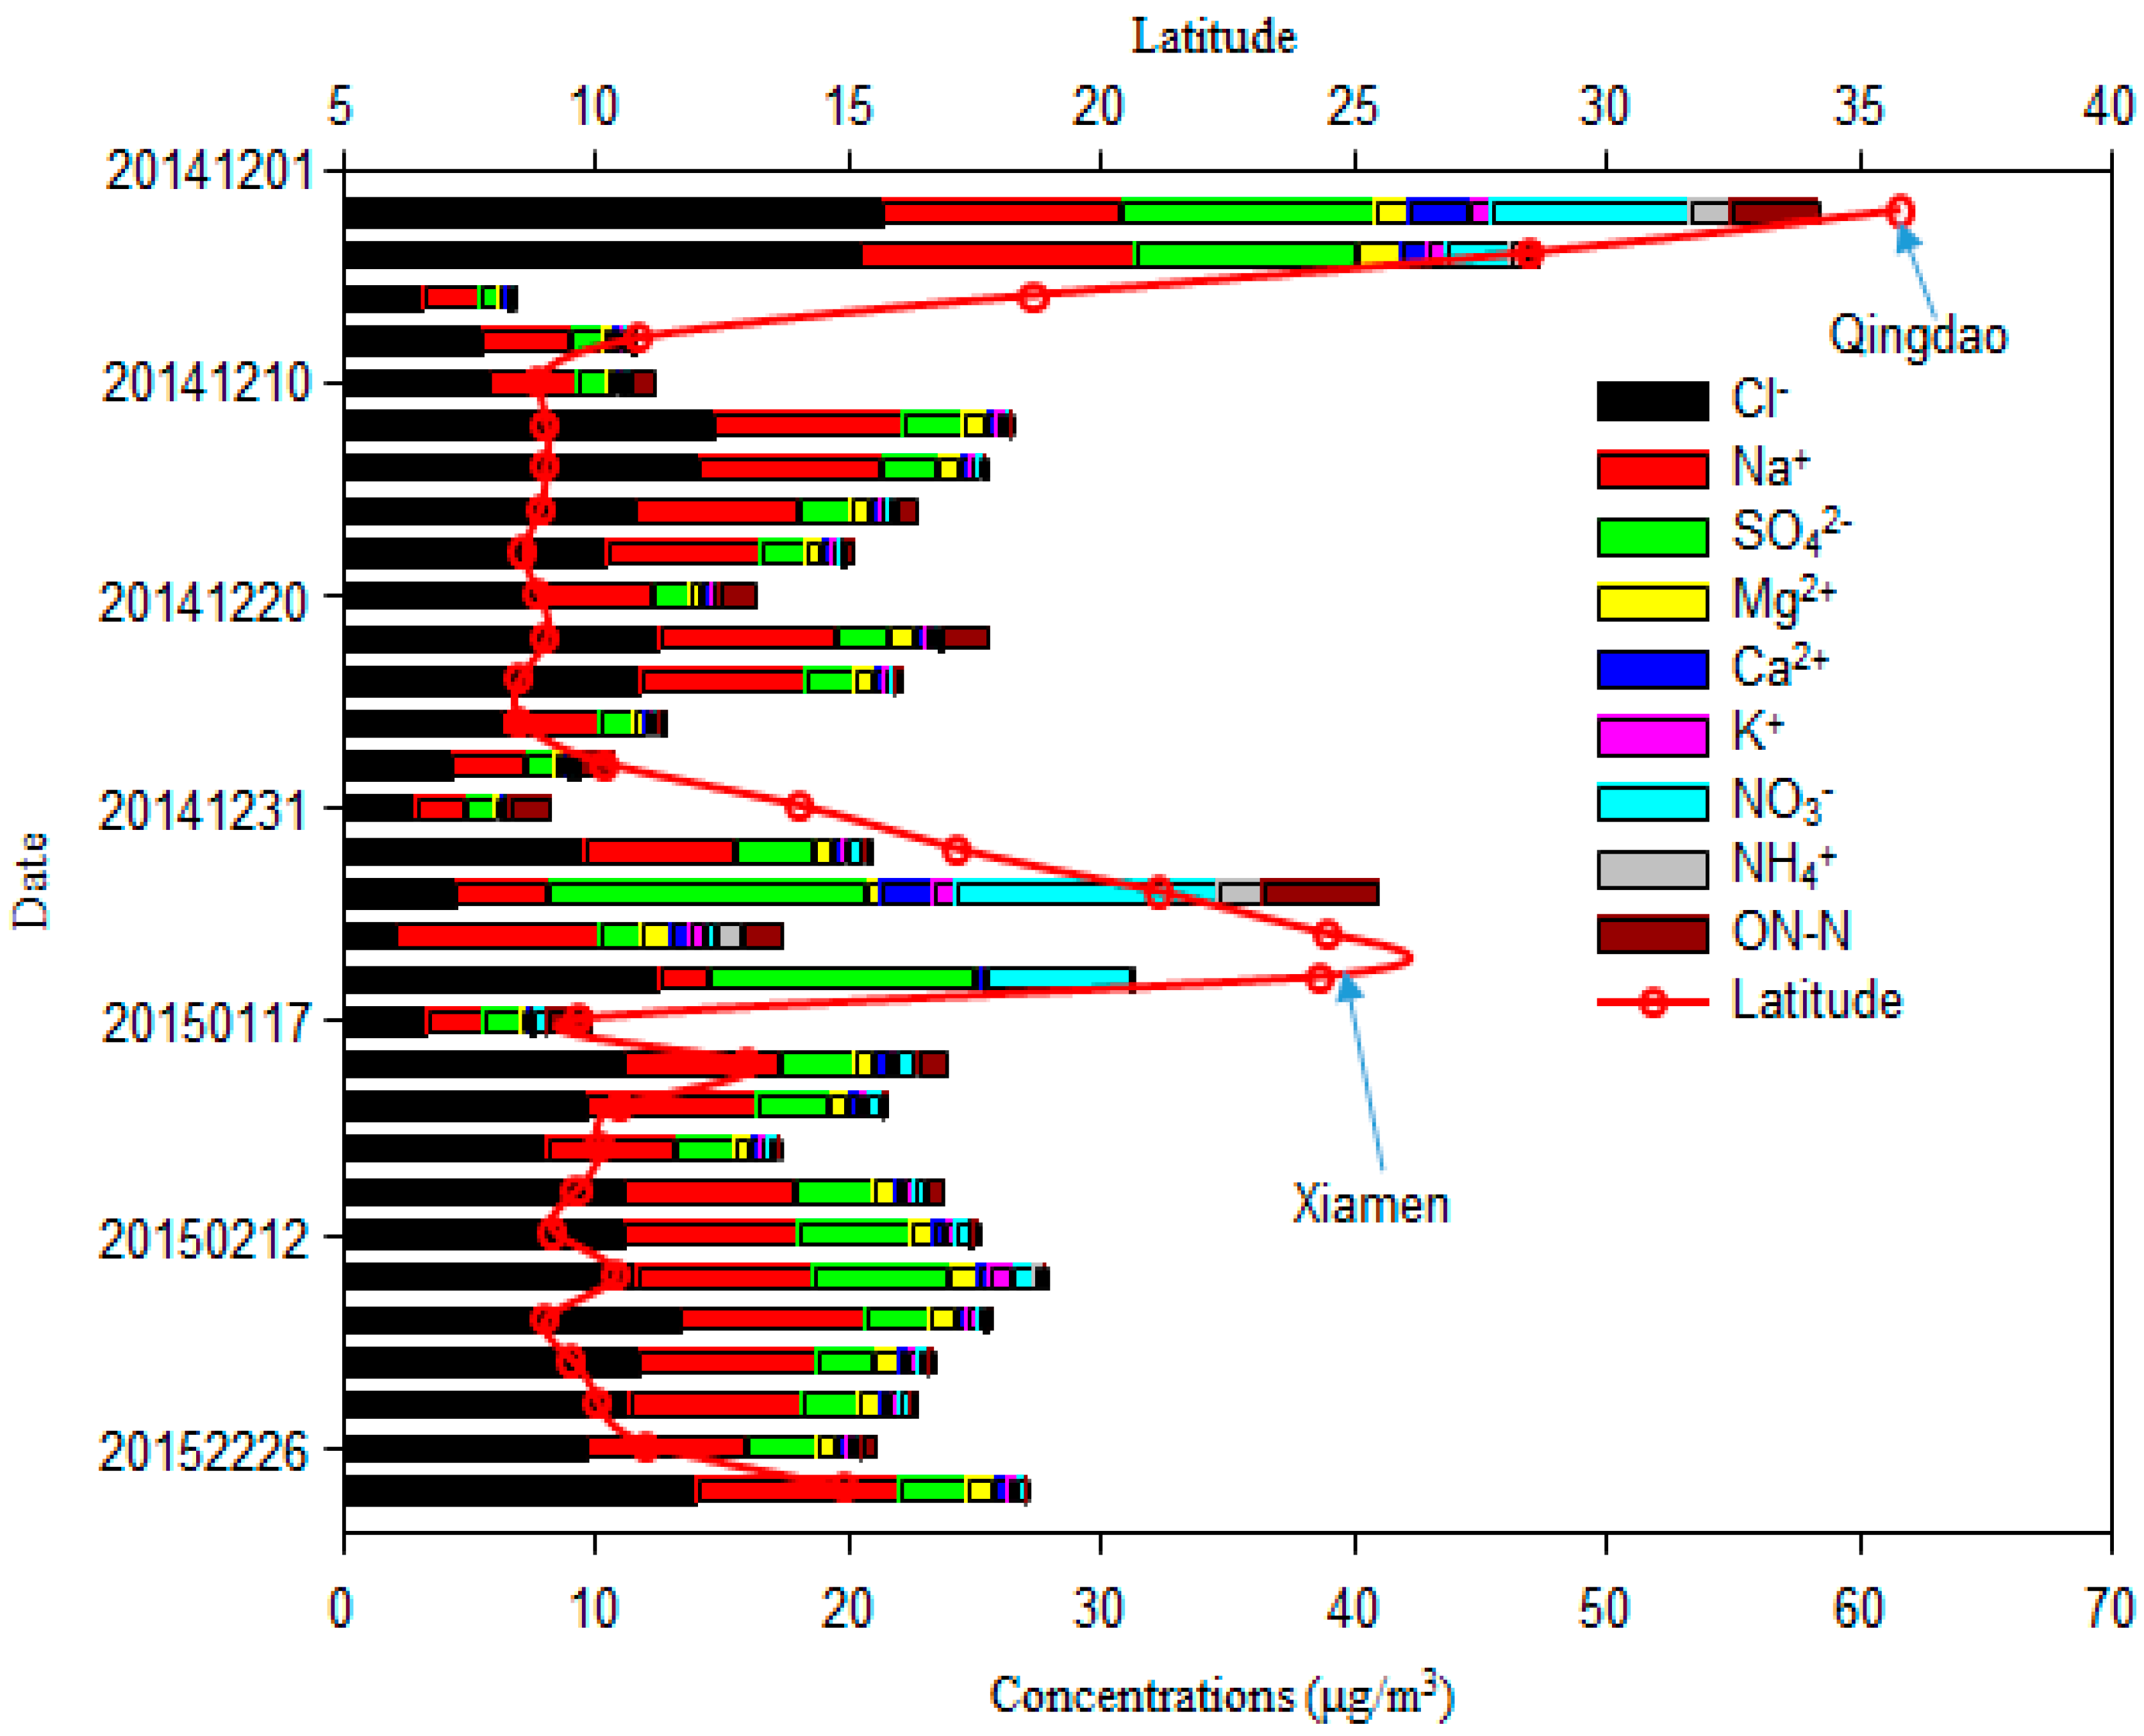
The total mass concentration of major inorganic ions (Cl−, Na+, SO42−, Mg2+, Ca2+, K+, NO3−, NH4+) and ON-N was 22.9 μg/m3; it had a similar spatial variation to TSP (Figure 1). These components accounted for 51.1% of the TSP. Cl− had the highest concentration among these ions (Figure 3 and Figure 4), ranging from 2.1 μg/m3 to 21.3 μg/m3, with an average value of 9.9 ± 4.6 μg/m3. It was followed by Na+ (2.0–10.9 μg/m3; 5.8 ± 2.2 μg/m3), SO42− (0.8–12.5 μg/m3; 3.3 ± 3.0 μg/m3), NO3− (0.1–10.3 μg/m3; 1.2 ± 2.3 μg/m3), Mg2+ (0.24–1.71 μg/m3; 0.78 ± 0.34 μg/m3), Ca2+ (0.15 ± 2.44 μg/m3; 0.49 ± 0.50 μg/m3), K+ (0.08–0.94 μg/m3; 0.36 ± 0.24 μg/m3), and NH4+ (0.02–1.81 μg/m3; 0.21 ± 0.45 μg/m3), as shown in Figure 3. The average value of ON-N was 0.94 ± 1.02 μg/m3, with a range from 0.05 μg/m3 to 4.64 μg/m3.
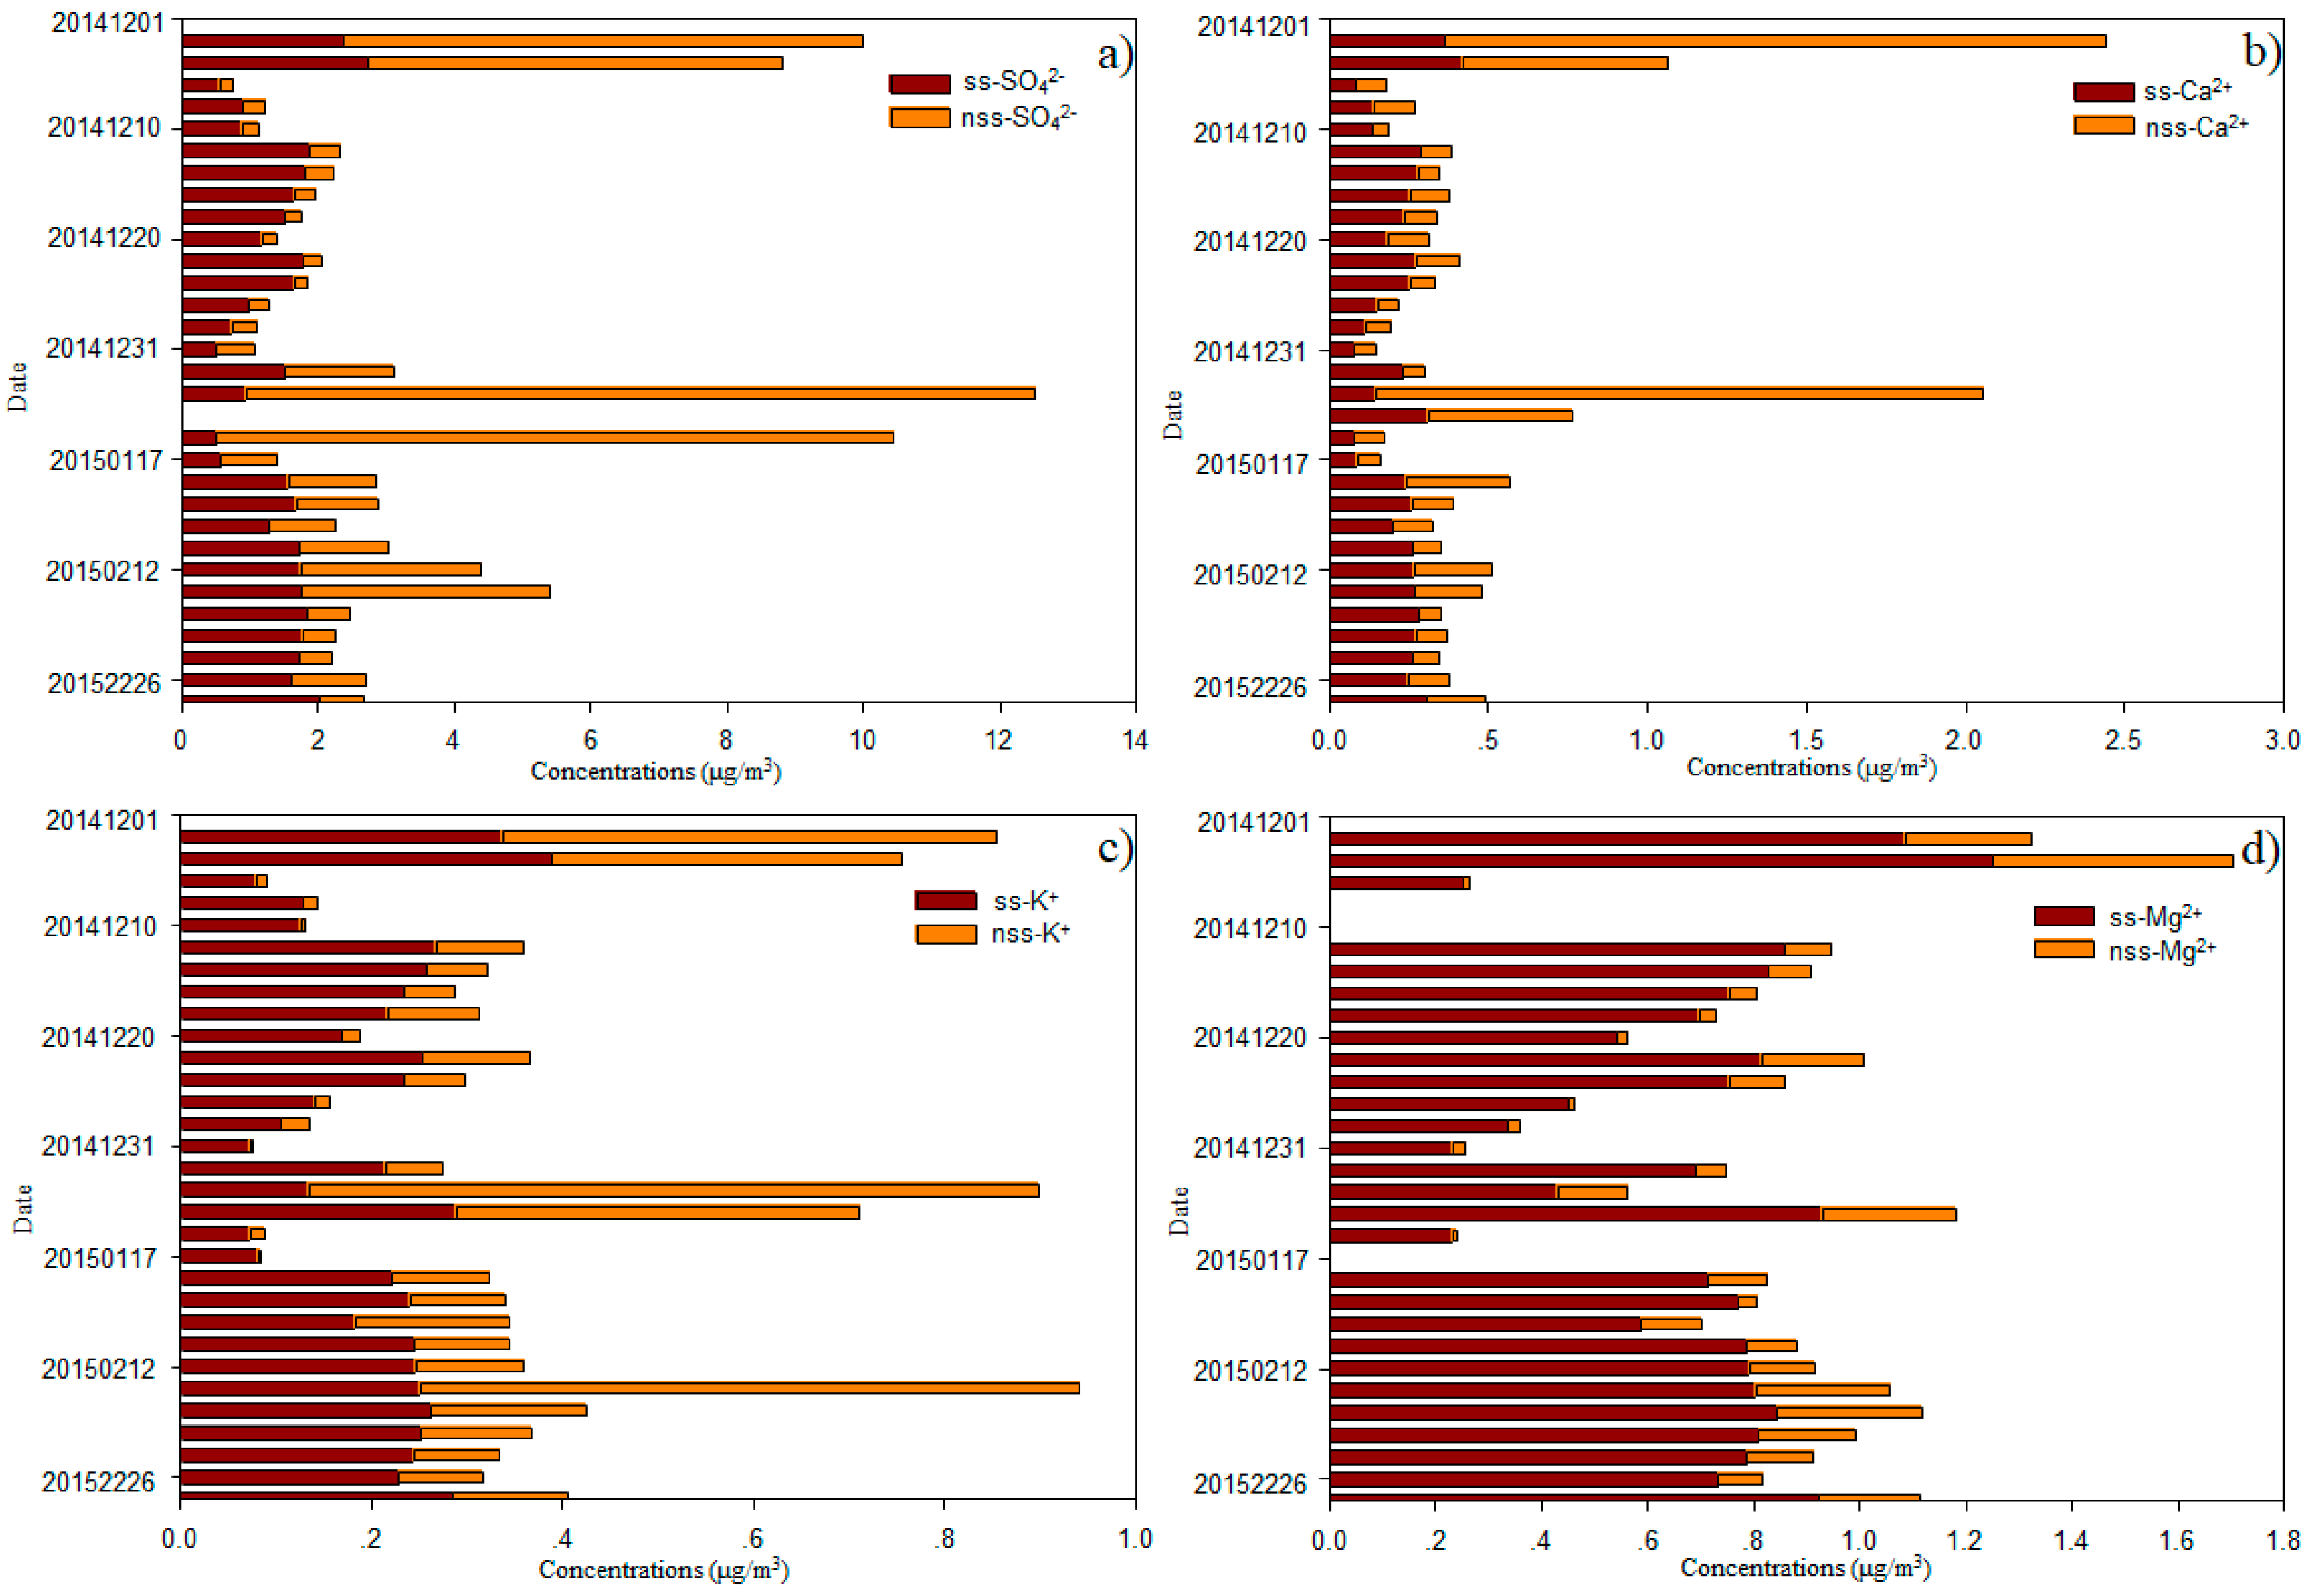
Sea salt (ss) and nss contributions to Cl−, SO42−, Mg2+, K+, and Ca2+ were determined using Na+ as the reference element for sea salt [2,19]. Generally, most of Cl− values were deficit relative to Na+, with an average deficit of 14.8 ± 16.4%, and a range of 0.9–85.9% (Figure 5). On average, fractions of 39.7 ± 12.3%, 41.8 ± 17.0%, 30.0 ± 19.0% and 13.1 ± 6.9% of the total SO42−, Ca2+, K+, and Mg2+ were derived from a non-sea-salt origin (Figure 6), indicating that most of the SO42−, Ca2+, K+, and Mg2+ was derived from sea salt. The concentrations of nss-SO42−, nss-Ca2+, nss-K+ and nss-Mg2+ were 1.89 ± 2.92, 0.27 ± 0.47, 0.15 ± 0.19 and 0.12 ± 0.10 μg/m3, respectively (Figure 6).
3.2. Major Ion Characteristics and Sources of Aerosol over the Western North Pacific
Typical marine ions (Na+ and Cl−) accounted for 71.5% of total inorganic ions over the WNP, which was higher than levels reported over the South China Sea in winter [2]. The concentrations of Na+ and Cl− were close to those of a previous study of the Pacific Ocean (5.8 and 9.0 μg/m3, respectively) [3], but higher than those of other marine areas in winter, such as Northern South China Sea, and Northern Yellow Sea [1,25]. The average molar ratio of Cl− to Na+ was 1.14, which was slightly smaller than the value of 1.17 for seawater, indicating that Cl− was in deficit. This may reflect Cl− evaporation to the atmosphere. In the marine atmosphere, sea salt aerosol can react with inorganic acids, such as HNO3 and H2SO4, as well as NO2 and SO2 in heterogeneous reactions to release gaseous reactive chlorine compounds, including HCl, Cl2, ClNO2, and HOCl to the atmosphere [2,3,13,18,23,26,27]. Such reactions result in a deficit of Cl− relative to Na+, when compared with fresh sea salt aerosol. The value of the Cl− deficit measured on this cruise (Figure 5) was slightly lower than that reported for the Atlantic and Pacific Oceans by Zhang et al. [3], suggesting that the aerosol samples in this study were also influenced by anthropogenic emissions. In this study, Cl− concentrations were correlated with SO42− when air masses were from the open ocean (R = 0.51, p < 0.01; Table 1a) because they both originate from sea salt. However, it was not correlated with nss-SO42− (R = 0.59, p > 0.05; R = 0.18, p > 0.05, respectively, Table 1) or NO3− (R = 0.36, p > 0.05; R = 0.05, p > 0.05, respectively, Table 1), suggesting that the Cl− deficit cannot be fully explained by the formation of inorganic salts, but organic acids, such as oxalic acid, fulvic acid and malonic acid, and atmospheric processes must also contribute to the Cl− deficit [13,18,26,28]. Generally, inorganic acids play a major role in chloride depletion, but in some cases this role may be played by organic acids, especially in the absence of continental anthropogenic emissions [13,28]. Over the open ocean, water-soluble organic acids can be transported from polluted continental regions or formed in situ by photochemical oxidation of precursor biogenic volatile organic compounds (VOCs) and unsaturated fatty acids [28]. We found that in some samples (e.g., 1, 2, 6, 7, 19 and 27) there was enrichment of Cl−, suggesting that a small fraction of Cl− is derived from anthropogenic sources [19]. Another study observed that dry particles were devoid of acetate but enriched in Cl− related to evaporation of acetic acid [26].
Mg2+, another typical ion in the marine atmosphere [2], was well-correlated with Na+ (R = 0.99 and 0.98, p < 0.01, respectively; Table 1). The ratios of Mg2+ to Na+ were close to that of seawater, indicating that Mg2+ was mainly derived from this source. The concentrations of ss-Mg2+ versus nss-Mg2+ are shown in Figure 6d; these ratios further support this view. In this study, ss-Mg2+ and nss-Mg2+ accounted for 86.9% and 13.1% of the total Mg2+ in the TSP, respectively. Thus, the ratio of nss-Mg2+ to total Mg2+ was higher than ratios measured over the Pacific Ocean [3]. The nss-Mg2+ may originate from crustal sources, given that nss-Mg2+ is often treated as a crustal-derived ion and element in continental studies [19,29]. Ca2+ ions are also treated as tracers of crustal material [2,19]. No relationship between Ca2+ and Mg2+ was found when air masses were from continent (p > 0.05; Table 1a) and a strong relationship was found when air masses were from the open ocean (R = 0.80, p < 0.01; Table 1b), although a much larger portion of nss-Ca2+ (41.8 ± 17.0%) than nss-Mg2+ (13.1 ± 6.9%) was observed (Figure 6). Larger contributions of nss-Ca2+ were found over the South China Sea [2]. The average molar ratio of nss-Mg2+ to nss-Ca2+ (0.760) in samples of this cruise was higher than the average ratio for continental crust (0.569) [30], indicating that nss-Mg2+ is enriched relative to nss-Ca2+ within the marine atmosphere. K+ is commonly used as a tracer for biomass and biofuel burning [31]; however, we found that K+ showed little influence from biomass and biofuel burning sources over the remote WNP (Figure 2 and Figure S1). Typically, in remote marine environments, sea salt provides 70% of K+, e.g., in the Pacific marine atmosphere, while nss-K+ accounts for 30% of the total water-soluble K+ (Figure 6). In this study, strong correlations between K+ and Ca2+ (both R = 0.89, p < 0.01; Table 1), as well as nss-K+ and nss-Ca2+ (R = 0.66, p < 0.01; Table 1a) when air masses from continent were observed. These relationships suggest that nss-K+ over the WNP is primarily derived from the crust. In Figure 1 and Figure S1, we show that Asian dust influences the remote WNP, which may provide crustal sources of Ca2+, Mg2+ and K+. We found higher contributions of nss-Ca2+ to total Ca2+, nss-Mg2+ to total Mg2+ and nss-K+ to total K+ in coastal regions (near Qingdao and Xiamen), compared with open ocean environments, suggesting that coastal regions were more affected by dust (Figure 1 and Figure S1). Higher contributions of these nss ions, especially nss-Mg2+ and nss-K+, were also observed when air masses originated from near continent rather than from open ocean regions (Figure 2). Our results indicate that it is more difficult for Ca2+ (compared with Mg2+ and K+) to transport to open ocean environments.
The fraction of nss-SO42− accounted for 39.7% of total SO42− in samples of this cruise. This percentage is close to that observed over the Northern and Southern Atlantic Oceans, but higher than that in a previous study of the Pacific Ocean [3]. However, the average concentration of nss-SO42− was much higher than over the Atlantic Ocean, Pacific Ocean, and Mediterranean Sea [3,15], but lower than over the Yellow Sea, East China Sea, Yongxing Island in the South China Sea [1,2,32], Sea of Okhotsk, and Sea of Japan [15]. The concentrations of nss-SO42− recorded near the coast on this cruise were close to values over the Yellow Sea and East China Sea [32]. Like our results for nss-Mg2+ and nss-K+, we found a higher percentage of nss-SO42− to total SO42− in coastal regions and in air masses originating from near the continent, compared with those from open ocean regions. However, Figure S1 clearly shows that continental SO42− is transported to and affects these open ocean environments. The average concentration of NO3− was 1.2 ± 2.3 μg/m3 in samples from our cruise; these are higher than those observed over the Northern Atlantic and Pacific Oceans [3], but lower than those from the China Sea [3,18,25,32]. Very high concentrations of NO3− were observed near the coast close to Qingdao and Xiamen (Figure 4), whereas much lower values were recorded over the open WNP in December 2014, especially in samples of air masses from the open ocean (Figure 2). Zhang et al. [3] surmised that the background level of NO3− was about 0.12 μg/m3 in this region. The average concentration of NO3− was 0.20 μg/m3 in December between 8.5° N and 14.0° N, which is close to this background level, suggesting that NO3− was not markedly influenced by continental surprising. When air masses were from the continent (in February 2015), the average concentration of NO3− reached 0.49 μg/m3. In this case, continental sources appear to have contributed majorly (76%) to the total NO3−. NO3− was also well correlated with SO42− (R = 0.92 and 0.71, respectively, p < 0.01; Table 1) and nss-SO42− (R = 0.93 and 0.80, respectively, p < 0.01; Table 1), indicating that the relatively high concentrations of NO3− and nss-SO42− were related to continental sources. In contrast, we found low concentrations of NH4+ over the open ocean in samples from our cruise, with average values of 0.04 μg/m3 in December and 0.07 μg/m3 in February. Other studies also reported low values of NH4+ over the WNP [4,33,34], and over the South China Sea [2]. These results indicate that gaseous ammonia or particulate ammonium are difficult to transport long distance, and that NH4+ over the WNP may be from local emissions. Zhao et al. [35] suggested that atmospheric nitrogen deposition to the northwestern Pacific decreased rapidly downwind of the Asian continent. In addition, ON-N (0.94 μg/m3) had much higher concentrations than NO3−-N (0.26 μg/m3) and NH4+-N (0.16 μg/m3), accounting for 74.0% of the total nitrogen (NO3−-N, NH4+-N and ON-N), with a range of 28.0–97.4%. The average concentration of ON-N over the WNP was markedly lower than at other sites, including inland cities (Baoji), coastal cities (Chennai and Rondonia), and marine sites (Gosan, Okinawa Island, Bermuda, Northern South China Sea, Yellow Sea, and North Pacific Ocean) [4,10,36,37,38,39,40,41]. The ON content was correlated with nss-Ca2+ (R = 0.87, p < 0.01; Table 1a) when air masses from continent, indicating that part of this ON was derived from primary crustal material. A good correlation was also found between ON and both NO3− and NH4+ (Table 1a), suggesting that secondary formation was a major source of ON. The most common secondary ONs are organic nitrates, such as hydroxyalkyl nitrates produced by the gas phase reactions of NOx and VOCs or water-insoluble ON produced by the reactions of gaseous hydrocarbons with NH3 [22,38]. Altieri et al. [10] and Pavuluri et al. [38] also suggested that ON may be derived from marine biogenic emissions. A high concentration of protein in western North Pacific Ocean in the winter was found [42]. So, a weak relationship with Na+ when air masses were from the open ocean (Table 1b) was found.
4. Conclusions
Cl− and Na+ made the greatest contributions to total inorganic ions, followed by SO42−, NO3−, Mg2+, Ca2+, K+, and NH4+. ON-N had higher average concentrations than NO3− and NH4+ in all samples. A Cl− deficit in samples was likely caused by formation of acids and/or other atmospheric processes. Relate to most SO42−, Mg2+, Ca2+, and K+ were derived from sea salt, with the remainder from continental sources, including crustal and anthropogenic sources. When air masses were from continental regions, NO3− concentrations were significantly higher, indicating that the WNP was influenced by anthropogenic sources. In contrast, NH4+ may reflect local oceanic emissions. ON had several sources, including reactions of NOx with VOCs, gaseous hydrocarbons with NH3, and both crustal and marine biogenic sources.
Supplementary Materials
The following are available online at https://www.mdpi.com/2073-4433/9/8/298/s1.
Author Contributions
Methodology, Z.-Y.Z.; Software, H.-W.X. and C.-Y.S.; Investigation, H.-W.X. and A.-M.L.; Writing-Original Draft Preparation, H.-W.X.; Writing-Review & Editing, H.-W.X. and H.-Y.X.; Supervision, H.-Y.X.; Project Administration, H.-W.X., H.-Y.X. and A.-M.L.
Funding
This work was supported by the National Natural Science Foundation of China (Grant no. 41663003, 41425014, and 41203015), Strategic Priority Research Program of the Chinese Academy of Sciences (grant nos. XDA11030103 and XDA11020202), Doctoral Scientific Research Foundation of East China University of Technology (Grant no. DHBK2015327), Research Foundation of Key Laboratory of Nuclear Resources and Environment (Grant no. Z1609) and Scientific Research Foundation of East China University of Technology for Science and Technology Innovation Team (Grant no. DHKT2015101).
Acknowledgments
Wei-Hai Xu and Li-Feng Zhong from the South China Sea Institute of Oceanology, Chinese Academy of Science are acknowledged for their help to collected aerosol samples.
Conflicts of Interest
The authors declare that they have no conflict of interest.
References
- Wang, L.; Qi, J.H.; Shi, J.H.; Chen, X.J.; Gao, H.W. Source apportionment of particulate pollutants in the atmosphere over the Northern Yellow Sea. Atmos. Environ. 2013, 70, 425–434. [Google Scholar] [CrossRef]
- Xiao, H.W.; Xiao, H.Y.; Luo, L.; Shen, C.Y.; Long, A.M.; Chen, L.; Long, Z.H.; Li, D.N. Atmospheric aerosol compositions over the South China Sea: temporal variability and source apportionment. Atmos. Chem. Phys. 2017, 17, 3199–3214. [Google Scholar] [CrossRef]
- Zhang, M.; Chen, J.M.; Wang, T.; Cheng, T.T.; Lin, L.; Bhatia, R.S.; Havey, M. Chemical characterization of aerosols over the Atlantic Ocean and the Pacific Ocean during two cruises in 2007 and 2008. J. Geophys. Res. Atmos. 2010, 115, 1842–1851. [Google Scholar] [CrossRef]
- Miyazaki, Y.; Kawamura, K.; Sawano, M. Size distributions of organic nitrogen and carbon in remote marine aerosols: Evidence of marine biological origin based on their isotopic ratios. Geophys. Res. Lett. 2010, 37, 460–472. [Google Scholar] [CrossRef]
- Duce, R.A.; Laroche, J.; Altieri, K.; Arrigo, K.R.; Baker, A.R.; Capone, D.G.; Cornell, S.; Dentener, F.; Galloway, J.; Ganeshram, R.S. Impacts of atmospheric anthropogenic nitrogen on the open ocean. Science 2008, 320, 893–897. [Google Scholar] [PubMed]
- Hsu, S.C.; Liu, S.C.; Kao, S.J.; Jeng, W.L.; Huang, Y.T.; Tseng, C.M.; Tsai, F.; Tu, J.Y.; Yang, Y. Sources, solubility, and acid processing of aerosol iron and phosphorous over the South China Sea: East Asian dust and pollution outflows vs. Southeast Asian biomass burning. Atmos. Chem. Phys. Discuss. 2014, 14, 21433–21472. [Google Scholar] [CrossRef]
- Wen, L.S.; Jiann, K.T.; Santschi, P.H. Physicochemical speciation of bioactive trace metals (Cd, Cu, Fe, Ni) in the oligotrophic South China Sea. Mar. Chem. 2006, 101, 104–129. [Google Scholar] [CrossRef]
- Kim, I.N.; Lee, K.; Gruber, N.; Karl, D.M.; Bullister, J.L.; Yang, S.; Kim, T.W. Increasing anthropogenic nitrogen in the North Pacific Ocean. Science 2014, 346, 1102–1106. [Google Scholar] [CrossRef] [PubMed]
- Doney, S.C.; Mahowald, N.; Lima, I.; Feely, R.A.; Mackenzie, F.T.; Lamarque, J.F.; Rasch, P.J. Impact of anthropogenic atmospheric nitrogen and sulfur deposition on ocean acidification and the inorganic carbon system. Proc. Natl. Acad. Sci. USA 2007, 104, 14580–14585. [Google Scholar] [CrossRef] [PubMed] [Green Version]
- Altieri, K.E.; Fawcett, S.E.; Peters, A.J.; Sigman, D.M.; Hastings, M.G. Marine biogenic source of atmospheric organic nitrogen in the subtropical North Atlantic. Proc. Natl. Acad. Sci. USA 2016, 113, 925–930. [Google Scholar] [CrossRef] [PubMed]
- Altieri, K.E.; Hastings, M.G.; Peters, A.J.; Oleynik, S.; Sigman, D.M. Isotopic evidence for a marine ammonium source in rainwater at Bermuda. Glob. Biogeochem. Cycles 2014, 28, 1066–1080. [Google Scholar] [CrossRef] [Green Version]
- Jickells, T.D.; Kelly, S.D.; Baker, A.R.; Biswas, K.; Dennis, P.F.; Spokes, L.J.; Witt, M.; Yeatman, S.G. Isotopic evidence for a marine ammonia source. Geophys. Res. Lett. 2003, 30, 359–376. [Google Scholar]
- Boreddy, S.K.R.; Kawamura, K. A 12-year observation of water-soluble ions in TSP aerosols collected at a remote marine location in the WNP: An outflow region of Asian dust. Atmos. Chem. Phys. 2015, 15, 6437–6453. [Google Scholar] [CrossRef]
- Jung, J.; Furutani, H.; Uematsu, M. Atmospheric inorganic nitrogen in marine aerosol and precipitation and its deposition to the North and South Pacific Oceans. J. Atmos Chem. 2011, 68, 157–181. [Google Scholar]
- Sasakawa, M.; Uematsu, M. Chemical composition of aerosol, sea fog, and rainwater in the marine boundary layer of the northWNP and its marginal seas. J. Geophys. Res. Atmos. 2002, 107, ACH 17-1–ACH 17-9. [Google Scholar] [CrossRef]
- Kunwar, B.; Kawamura, K. One-year observations of carbonaceous and nitrogenous components and major ions in the aerosols from subtropical Okinawa Island, an outflow region of Asian dusts. Atmos. Chem. Phys. 2014, 14, 1819–1836. [Google Scholar] [CrossRef] [Green Version]
- Yang, Y.Q.; Wang, J.Z.; Niu, T.; Zhou, C.; Chen, M.; Liu, J. The Variability of Spring Sand-Dust Storm Frequency in Northeast Asia from 1980 to 2011. Acta Meteorol. Sin. 2013, 27, 119–127. [Google Scholar] [CrossRef]
- Xiao, H.; Xie, L.; Long, A.; Ye, F.; Pan, Y.; Li, D.; Long, Z.; Chen, L.; Xiao, H.; Liu, C. Use of isotopic compositions of nitrate in TSP to identify sources and chemistry in South China Sea. Atmos. Environ. 2015, 109, 70–78. [Google Scholar] [CrossRef] [Green Version]
- Xiao, H.W.; Xiao, H.Y.; Long, A.M.; Wang, Y.L.; Liu, C.Q. Chemical composition and source apportionment of rainwater at Guiyang, SW China. J. Atmos. Chem. 2013, 70, 269–281. [Google Scholar] [CrossRef] [Green Version]
- Xiao, H.; Xiao, H.; Zhang, Z.; Wang, Y.; Long, A.; Liu, C. Chemical characteristics and source apportionment of atmospheric precipitation in Yongxing Island. China Environ. Sci. 2016, 36, 3237–3244, (Chinese with English Abstract). [Google Scholar]
- Piazzalunga, A.; Bernardoni, V.; Fermo, P.; Vecchi, R. Optimisation of analytical procedures for the quantification of ionic and carbonaceous fractions in the atmospheric aerosol and applications to ambient samples. Anal. Bioanal. Chem. 2013, 405, 1123–1132. [Google Scholar] [CrossRef] [PubMed]
- Jickells, T.; Baker, A.R.; Cape, J.N.; Cornell, S.E.; Nemitz, E. The cycling of organic nitrogen through the atmosphere. Philos. Trans. R. Soc. Lond. B Biol. Sci. 2013, 368, 91–97. [Google Scholar] [CrossRef] [PubMed]
- Keene, W.C.; Pszenny, A.A.; Galloway, J.N.; Hawley, M.E. Sea-salt corrections and interpretation of constituent ratios in marine precipitation. J. Geophys. Res. Atmos. 1986, 91, 6647–6658. [Google Scholar]
- Xiao, H.W.; Xiao, H.Y.; Long, A.M.; Wang, Y.L.; Liu, C.Q. Sources and meteorological factors that control seasonal variation of δ 34 S values in rainwater. Atmos. Res. 2014, 149, 154–165. [Google Scholar] [CrossRef]
- Zhang, X.; Zhuang, G.; Guo, J.; Yin, K.; Zhang, P. Characterization of aerosol over the Northern South China Sea during two cruises in 2003. Atmos. Environ. 2007, 41, 7821–7836. [Google Scholar] [CrossRef]
- Laskin, A.; Moffet, R.C.; Gilles, M.K.; Fast, J.D.; Zaveri, R.A.; Wang, B.; Nigge, P.; Shutthanandan, J. Tropospheric chemistry of internally mixed sea salt and organic particles: Surprising reactivity of NaCl with weak organic acids. J. Geophys. Res. Atmos. 2012, 117, 156–169. [Google Scholar] [CrossRef]
- Thornton, J.A.; Kercher, J.P.; Riedel, T.P.; Wagner, N.L.; Cozic, J.; Holloway, J.S.; Dube´, W.P.; Wolfe, G.M.; Quinn, P.K.; Middlebrook, A.M.; et al. A large atomic chlorine source inferred from mid-continental reactive nitrogen chemistry. Nature 2010, 464, 271–274. [Google Scholar] [CrossRef] [PubMed]
- Boreddy, S.K.R.; Kawamura, K. A review of dicarboxylic acids and related compounds in atmospheric aerosols: Molecular distributions, sources and transformation. Atmos. Res. 2016, 170, 140–160. [Google Scholar]
- Dueñas, C.; Fernández, M.C.; Gordo, E.; Cañete, S.; Pérez, M. Chemical and radioactive composition of bulk deposition in Málaga (Spain). Atmos. Environ. 2012, 62, 1–8. [Google Scholar] [CrossRef]
- Taylor, S.R. Abundance of chemical elements in the continental crust: a new table. Geochim. Cosmochim. Acta 1964, 28, 1273–1285. [Google Scholar] [CrossRef]
- Deng, C.; Zhuang, G.; Huang, K.; Li, J.; Zhang, R.; Wang, Q.; Liu, T.; Sun, Y.; Guo, Z.; Fu, J.S. Chemical characterization of aerosols at the summit of Mountain Tai in Central East China. Atmos. Chem. Phys. 2011, 11, 7319–7332. [Google Scholar] [CrossRef] [Green Version]
- Zhang, H.H.; Yang, G.P.; Liu, C.Y.; Su, L.P. Chemical Characteristics of Aerosol Composition over the Yellow Sea and the East China Sea in Autumn. J. Atmos. Sci. 2013, 70, 1784–1794. [Google Scholar] [CrossRef]
- Choi, Y.; Rhee, T.S.; Collett, J.L., Jr.; Park, T.; Park, S.-M.; Seo, B.-K.; Park, G.; Park, K.; Lee, T. Aerosol concentrations and composition in the North Pacific marine boundary layer. Atmos. Environ. 2017, 171, 165–172. [Google Scholar] [CrossRef]
- Martino, M.; Hamliton, D.; Baker, A.R.; Jickells, T.D.; Bromley, T.; Nojiri, Y.; Quack, B.; Boyd, P.W. Western Pacific atmospheric nutrient deposition fluxes, their impact on surface ocean productivity. Glob. Biogeochem. Cycles 2014, 28, 712–728. [Google Scholar] [Green Version]
- Zhao, Y.; Zhang, L.; Pan, Y.; Wang, Y.; Paulot, F.; Henze, D.K. Atmospheric nitrogen deposition to the northwestern Pacific: Seasonal variation and source attribution. Atmos. Chem. Phys. 2015, 15, 13657–13703. [Google Scholar] [CrossRef]
- Kundu, S.; Kawamura, K.; Lee, M.; Andreae, T.W.; Hoffer, A.; Andreae, M.O. Comparison of Amazonian biomass burning and East Asian marine aerosols: Bulk organics, diacids and related compounds, water-soluble inorganic ions, stable carbon and nitrogen isotope ratios. Low Temp. Sci. 2010, 68, 89–100. [Google Scholar]
- Kunwar, B.; Kawamura, K.; Zhu, C. Stable carbon and nitrogen isotopic compositions of ambient aerosols collected from Okinawa Island in the WNP Rim, an outflow region of Asian dusts and pollutants. Atmos. Environ. 2016, 131, 243–253. [Google Scholar] [CrossRef]
- Pavuluri, C.M.; Kawamura, K.; Swaminathan, T. Time-resolved distributions of bulk parameters, diacids, ketoacids and α-dicarbonyls and stable carbon and nitrogen isotope ratios of TC and TN in tropical Indian aerosols: Influence of land/sea breeze and secondary processes. Atmos. Res. 2015, 153, 188–199. [Google Scholar] [CrossRef]
- Pavuluri, C.M.; Kawamura, K.; Tachibana, E.; Swaminathan, T. Elevated nitrogen isotope ratios of tropical Indian aerosols from Chennai: Implication for the origins of aerosol nitrogen in South and Southeast Asia. Atmos. Environ. 2010, 44, 3597–3604. [Google Scholar] [CrossRef] [Green Version]
- Shi, J.; Gao, H.; Qi, J.; Zhang, J.; Yao, X. Sources, compositions, and distributions of water-soluble organic nitrogen in aerosols over the China Sea. J. Geophys, Res. Atmos. 2010, 115, 1383–1392. [Google Scholar] [CrossRef]
- Wang, G.; Xie, M.; Hu, S.; Gao, S.; Tachibana, E.; Kawamura, K. Dicarboxylic acids, metals and isotopic compositions of C and N in atmospheric aerosols from inland China: implications for dust and coal burning emission and secondary aerosol formation. Atmos. Chem. Phys. 2010, 10, 6087–6096. [Google Scholar] [CrossRef] [Green Version]
- Ogunro, O.O.; Burrows, S.M.; Elliott, S.; Frossard, A.A.; Hoffman, F.; Frossard, A.A.; Hoffman, F.; Letscher, R.T.; Moore, J.K.; Russell, L.M.; et al. Global distribution and surface activity of macromolecules in offline simulations of marine organic chemistry. Biogeochemistry 2015, 126, 25–56. [Google Scholar] [CrossRef] [Green Version]
Figure 1.
Distribution of seasonal average aerosol optical thickness (AOT), dust, SO2 and NO2 over the western North Pacific during the sampling period. Monthly AOT, dust, SO2 products with 1 × 1° (MODIS-Terra MOD08_M3 v6), 0.5 × 0.625° (MERRA-2 Model M2TMNXAER v5.12.4), 0.5 × 0.625° (MERRA-2 Model M2TMNXAER v5.12.4) resolution, daily NO2 products with 0.25 × 0.25° (OMI OMNO2d v003) resolution were downloaded from Giovanni (https://giovanni.gsfc.nasa.gov).

Figure 2.
(a) Geographic distribution of TSP concentrations and start sampling sites over the western North Pacific. (b) Five-day back trajectories of every starting sampling site over the western North Pacific. Red, blue and yellow lines represent the start sampling site in December 2014, January and February 2015, respectively.

Figure 3.
Mass concentrations of aerosol chemical species over the western North Pacific. The boundary of the box indicates the 25th and 75th percentile. The lines within the box mark the mean. Whiskers above and below the box indicate the 90th and 10th percentiles.
Figure 3.
Mass concentrations of aerosol chemical species over the western North Pacific. The boundary of the box indicates the 25th and 75th percentile. The lines within the box mark the mean. Whiskers above and below the box indicate the 90th and 10th percentiles.

Figure 4.
Concentrations of major ions in aerosols over the western North Pacific.

Figure 5.
Percent Cl− deficit at different sites, with the dashed line for the averaged value.
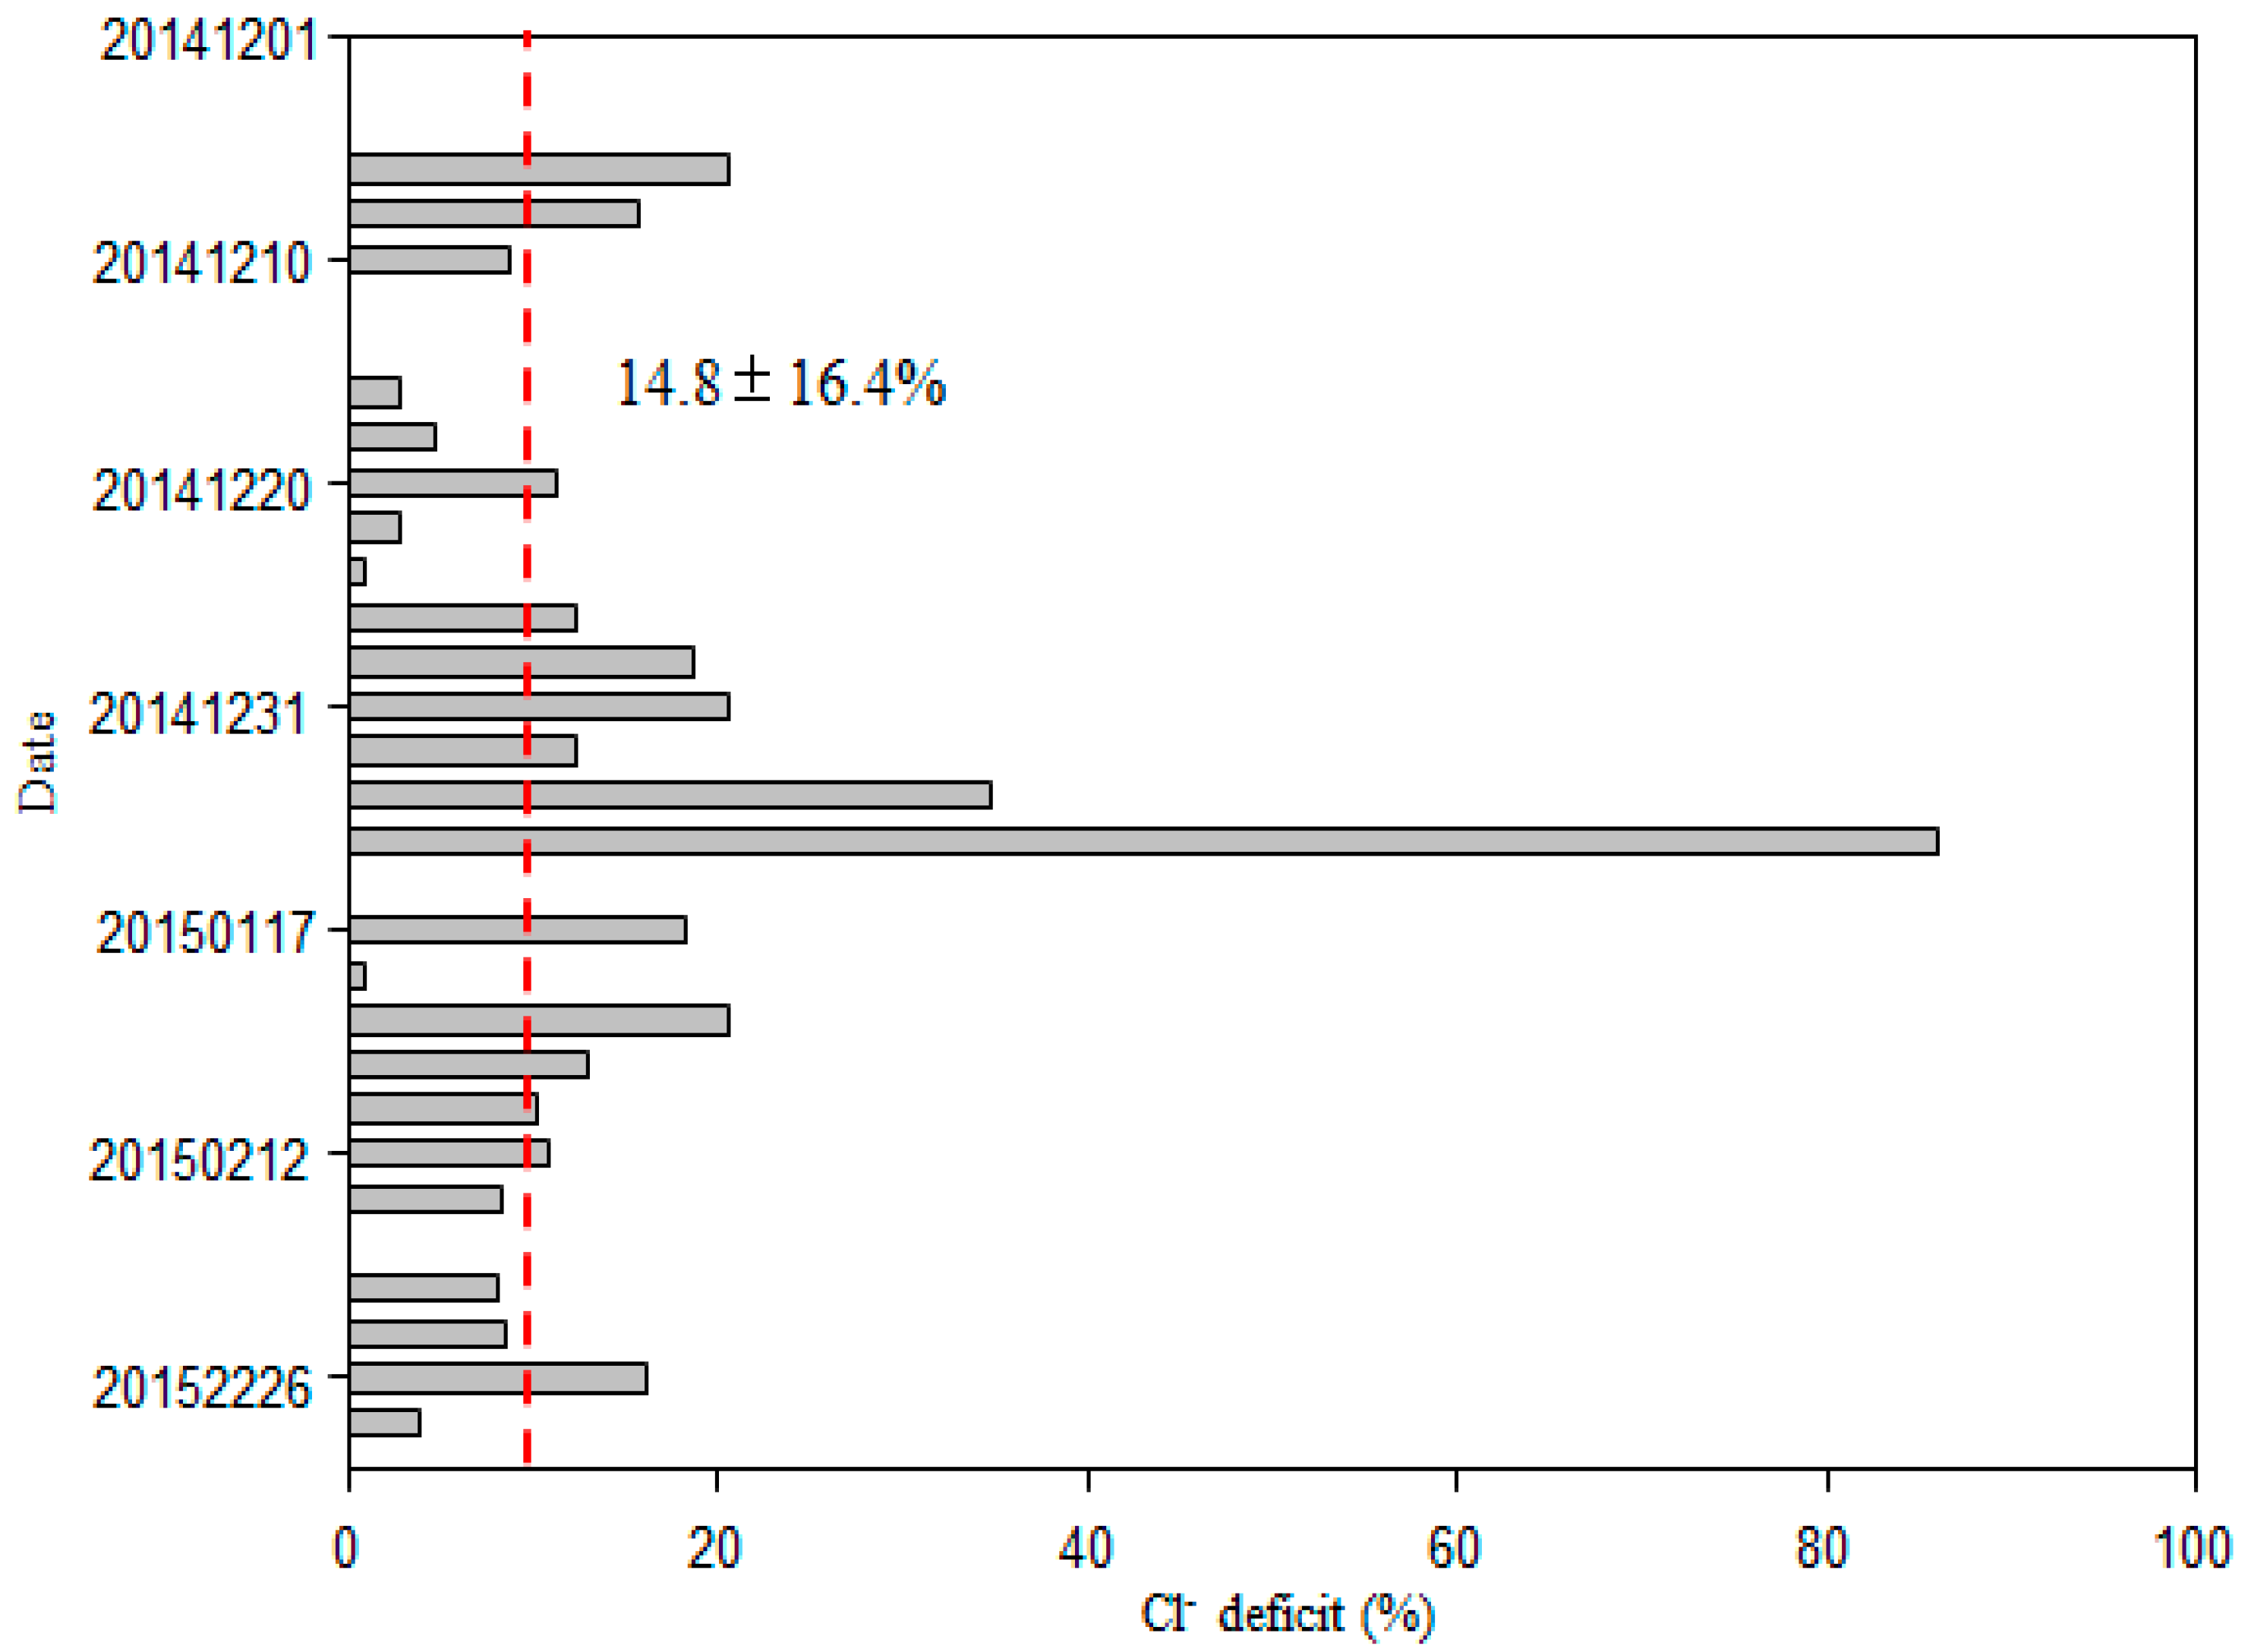
Figure 6.
(a) nss- and ss-SO42−, (b) nss- and ss-Ca2+, (c) nss- and ss-K+, and (d) nss- and ss-Mg2+ at different sites over the western North Pacific.
Figure 6.
(a) nss- and ss-SO42−, (b) nss- and ss-Ca2+, (c) nss- and ss-K+, and (d) nss- and ss-Mg2+ at different sites over the western North Pacific.

Table 1.
Correlation coefficients among major ions in aerosol over the western North Pacific with air masses from continent ((a), n = 8) and open ocean ((b), n = 23).
Table 1.
Correlation coefficients among major ions in aerosol over the western North Pacific with air masses from continent ((a), n = 8) and open ocean ((b), n = 23).
| Na+ | Cl− | SO42− | nss-SO42− | K+ | nss-K+ | Mg2+ | nss-Mg2+ | Ca2+ | nss-Ca2+ | NH4+ | NO3− | ON | |
|---|---|---|---|---|---|---|---|---|---|---|---|---|---|
| (a) | |||||||||||||
| Na+ | 1 | 0.65 | 0.21 | 0.17 | 0.73 * | 0.49 | 0.99 ** | 0.92 ** | 0.52 | 0.40 | 0.44 | 0.05 | −0.26 |
| Cl− | 1 | 0.59 | 0.37 | 0.38 | 0.19 | 0.64 | 0.56 | 0.45 | 0.38 | 0.18 | 0.36 | −0.08 | |
| SO42− | 1 | 0.98 ** | 0.55 | 0.61 | 0.24 | 0.29 | 0.67 | 0.69 | 0.57 | 0.92 ** | 0.66 | ||
| nss-SO42− | 1 | 0.62 | 0.71 | 0.20 | 0.29 | 0.63 | 0.65 | 0.68 | 0.93 ** | 0.78 | |||
| K+ | 1 | 0.95 ** | 0.75 * | 0.77 * | 0.89 ** | 0.83 * | 0.91 ** | 0.57 | 0.56 | ||||
| nss-K+ | 1 | 0.52 | 0.57 | 0.90 ** | 0.89 ** | 0.96 ** | 071 * | 0.77 | |||||
| Mg2+ | 1 | 0.96 ** | 0.52 | 0.40 | 0.45 | 0.07 | −0.24 | ||||||
| nss-Mg2+ | 1 | 0.50 | 0.39 | 0.45 | 0.10 | −0.16 | |||||||
| Ca2+ | 1 | 0.99 ** | 0.94 ** | 0.79 * | 0.80 | ||||||||
| nss-Ca2+ | 1 | 0.94 ** | 0.84 ** | 0.87 * | |||||||||
| NH4+ | 1 | 0.74 * | 0.86 * | ||||||||||
| NO3− | 1 | 0.89 * | |||||||||||
| ON | 1 | ||||||||||||
| (b) | |||||||||||||
| Na+ | 1 | 0.97 ** | 0.61 ** | 0.25 | 0.67 ** | 0.38 | 0.98 ** | 0.60 ** | 0.80 ** | 0.30 | 0.15 | 0.13 | −0.44 * |
| Cl− | 1 | 0.51 ** | 0.18 | 0.61 ** | 0.33 | 0.95 ** | 0.56 * | 0.74 ** | 0.23 | 0.09 | 0.05 | −0.41 * | |
| SO42− | 1 | 0.92 ** | 0.86 ** | 0.80 ** | 0.66 ** | 0.56 * | 0.76 ** | 0.61 ** | 0.75 ** | 0.71 ** | −0.35 | ||
| nss-SO42− | 1 | 0.72 ** | 0.79 ** | 0.33 | 0.42 | 0.53 ** | 0.60 ** | 0.84 ** | 0.80 ** | −0.21 | |||
| K+ | 1 | 0.95 ** | 0.75 ** | 0.72 ** | 0.66 ** | 0.41 | 0.78 ** | 0.50 * | −0.39 | ||||
| nss-K+ | 1 | 0.50 * | 0.62 ** | 0.48 * | 0.38 | 0.91 ** | 0.57 ** | −0.30 | |||||
| Mg2+ | 1 | 0.81 ** | 0.80 ** | 0.31 | 0.25 | 0.21 | −0.41 | ||||||
| nss-Mg2+ | 1 | 0.49 * | 0.22 | 0.45 * | 0.46 * | −0.22 | |||||||
| Ca2+ | 1 | 0.81 ** | 0.34 | 0.50 * | −0.26 | ||||||||
| nss-Ca2+ | 1 | 0.39 | 0.68 ** | 0.02 | |||||||||
| NH4+ | 1 | 0.61 ** | −0.13 | ||||||||||
| NO3− | 1 | −0.10 | |||||||||||
| ON | 1 |
*: p < 0.05; **: p < 0.01.
© 2018 by the authors. Licensee MDPI, Basel, Switzerland. This article is an open access article distributed under the terms and conditions of the Creative Commons Attribution (CC BY) license (http://creativecommons.org/licenses/by/4.0/).
Share and Cite
MDPI and ACS Style
Xiao, H.-W.; Xiao, H.-Y.; Shen, C.-Y.; Zhang, Z.-Y.; Long, A.-M. Chemical Composition and Sources of Marine Aerosol over the Western North Pacific Ocean in Winter. Atmosphere 2018, 9, 298. https://doi.org/10.3390/atmos9080298
AMA Style
Xiao H-W, Xiao H-Y, Shen C-Y, Zhang Z-Y, Long A-M. Chemical Composition and Sources of Marine Aerosol over the Western North Pacific Ocean in Winter. Atmosphere. 2018; 9(8):298. https://doi.org/10.3390/atmos9080298
Chicago/Turabian StyleXiao, Hong-Wei, Hua-Yun Xiao, Chun-Yan Shen, Zhong-Yi Zhang, and Ai-Min Long. 2018. "Chemical Composition and Sources of Marine Aerosol over the Western North Pacific Ocean in Winter" Atmosphere 9, no. 8: 298. https://doi.org/10.3390/atmos9080298
Note that from the first issue of 2016, this journal uses article numbers instead of page numbers. See further details here.