Article

Reconstruction of Atmospheric Lead Pollution During the Roman Period Recorded in Belgian Ombrotrophic Peatlands Cores

1
UR Argiles, Géochimie et Environnements sédimentaires (AGEs), Département de Géologie, Université de Liège, 4000 Liège, Belgique
2
GEOTOP Research Center for the Dynamics of the Earth System, Université du Québec à Montréal, Succ. Centre-Ville CP 8888, Montreal, QC H3C 3P8, Canada
3
Royal Belgian Institute of Natural Sciences (RBINS), Earth and History of Life, Rue Vautier 29, 1000 Brussels, Belgium
4
G-Time, Université Libre de Bruxelles, Avenue Franklin Roosevelt, 1050 Brussels, Belgium
*
Author to whom correspondence should be addressed.
Atmosphere 2018, 9(7), 253; https://doi.org/10.3390/atmos9070253
Submission received: 14 May 2018 / Revised: 28 June 2018 / Accepted: 2 July 2018 / Published: 5 July 2018
(This article belongs to the Special Issue Atmospheric Metal Pollution)

Abstract

:
Two peat cores from two bogs were used to record changes in the atmospheric Pb accumulation rate (Pb AR) in Belgium during the Roman period. The two records were compared to assess the reliability of peat cores as archives of atmospheric Pb deposition and to establish histories of atmospheric emissions from anthropogenic sources. To address these issues we analyzed Pb concentration and its isotopes, using ICP-MS, LA-ICP-MS and MC-ICP-MS in two peat sections, spanning 1000 years each. Lead concentrations in the two cores range from 0.1 to 60 μg g−1, with the maxima between 15 and 60 μg g−1. The average natural background of Pb AR varies between 0.003 and 0.07 mg m−2 yr−1 and the maximum ranges from 0.7 to 1.2 mg m−2 yr−1 between 50 BC and AD 215. The highest Pb AR exceed the pre-Roman period values by a factor of 17–80. Pb isotopic composition indicates that mining and metallurgical activities were the predominant sources of pollution during the Roman period. The Pb AR and chronologies in the Belgian peat cores are consistent with those reported for other continental archives such as lake sediments, peat and ice cores.

1. Introduction

Lead (Pb) is one of the most investigated metals in the environment because of its high potential toxicity [1,2,3,4]. Lead anthropogenic fluxes are derived from human activities such as mining, industry, coal burning and the use of leaded gasoline [5,6,7]. To assess the extent of atmospheric lead contamination, it is necessary to identify the main anthropogenic and natural sources. Lead has four stable isotopes (204Pb, 206Pb, 207Pb and 208Pb). The last three isotopes are the end-products of the natural decay chains of uranium and thorium. The isotopic composition of lead ores is usually different from that of bedrock [8]. Consequently, lead isotopes enable us to discriminate between Pb sources of pollutants and Pb derived from the erosion of the Earth crust. Lead isotopes ratios (206Pb/207Pb and 208Pb/207Pb) have been often used as evidence of anthropogenic heavy metal pollution, particularly in peatlands [2,5,9,10,11,12,13].
The magnitude and timing of changes in atmospheric Pb pollution have been studied in a variety of environmental archives (e.g., lake and marine sediments, ice cores and peat) [1,2,5,14,15,16]. In the recent study of a peat core from La Molina mire (N Spain), Martinez Cortizas et al. [17] showed that the earliest atmospheric Pb pollution in SW Europe dates back to 5000 years ago. Later, during the Roman period (100 BC–AD 400) production of silver and lead was widespread [18] and fall-out of atmospheric emissions caused an increase of Pb atmospheric pollution which was recorded in peat and lake sediments in Europe and in the Greenland ice cores [1,5,14,17]. The Roman period showed an increase in world lead production, up to 80,000 tons/year, which was about the same magnitude than that of the Industrial Revolution (from AD 1850 to the present) [14,18]. Approximately 5% of the 80,000 tons lead production went into the atmosphere [14]. Roman civilization is well known for its large-scale impact on the landscapes and environments of Europe, northern Africa, and the Middle East. Lead emissions coming from mining and metallurgical activities caused an important local and regional air pollution throughout Europe [4,5,19,20]. The most important lead mines were situated in SW Europe (Iberia) and in SE Europe [21]. About 40% of the lead production came from Spain, center Europe, Britain, Greece and Minor Asia [21]. Then, Pb production suddenly decreased after the fall of the Roman civilization and reached its minimum in the Middle Age. In the Roman period, 206Pb/207Pb ratio values of anthropogenic sources ranged between 1.177 and 1.185 [22].
Ombrotrophic peatlands can provide valuable information about the atmospheric inputs of trace metals [2,23,24,25,26] because they are fed with nutrients and pollutants only through atmospheric inputs. Most important, peat is particularly effective at preserving lead atmospheric deposition [5,27,28,29,30]. However, due to numerous factors influencing peat elemental composition, the behavior of metal elements is not always well understood despite the numerous studies carried out. The crucial factor is post-depositional migration of metals. The metal elements mobility may be due to various factors such as adsorption on oxy-hydroxides, water table fluctuation, variations in pH [31,32], or uptake and recycling by plants [33,34]. Among all metals, Pb has been most often targeted for recording its atmospheric deposition history [35]. Numerous studies demonstrated that Pb is an immobile element in ombrotrophic bogs based on stable and radioactive Pb isotopes, Pb profiles in porewaters comparison with rain collectors and herbarium samples and transplant experiments [35,36,37,38]. However, some investigations also demonstrated that Pb can be affected by diagenetic remobilization and redistribution processes in saturated peats [39].
Belgium, as a part of Gallia Belgica (northern France, western Germany, southern Netherlands and Belgium, Figure 1A), was occupied by the Roman Empire from 50 BC to AD 350. The Hautes Fagnes Plateau (SE Belgium) has provided a key site in studies investigating human occupation and environmental impact in the region since the Celtic occupation [40,41,42,43,44]. This area is also situated south of Pb-Zn ore deposits (extracted since Roman period [44,45]) and nearby the German border which is 300 km from the Region of the Ruhr-Eifel industrial area. At the site, several archaeological [40,44,46,47] and historical [42] investigations support Roman occupation and ore mining. Previous studies, at lower resolution, in ombrotrophic bogs from the Hautes Fagnes plateau [43,48,49,50,51] and peaty sediments [52] showed that the atmospheric pollution in Belgium dated back to early Roman times. For example, De Vleeschouwer et al [43], by using an ombrotrophic peat core from Misten, demonstrated an increase in Pb concentrations in samples dating to the Roman period. This was interpreted as a result of increase in Pb-Zn ores mining and agricultures activities. In this work, high-resolution Pb concentrations and stable Pb isotopic compositions in two ombrotrophic peatlands from Hautes Fagnes Plateau (SE Belgium) are used: (1) to track the history of Pb pollution in Belgium during the Roman period; (2) to identify the local and regional Pb sources and; (3) to reconstruct the historical evolution of Pb pollution in comparison with other European archives.

2. Materials and Methods

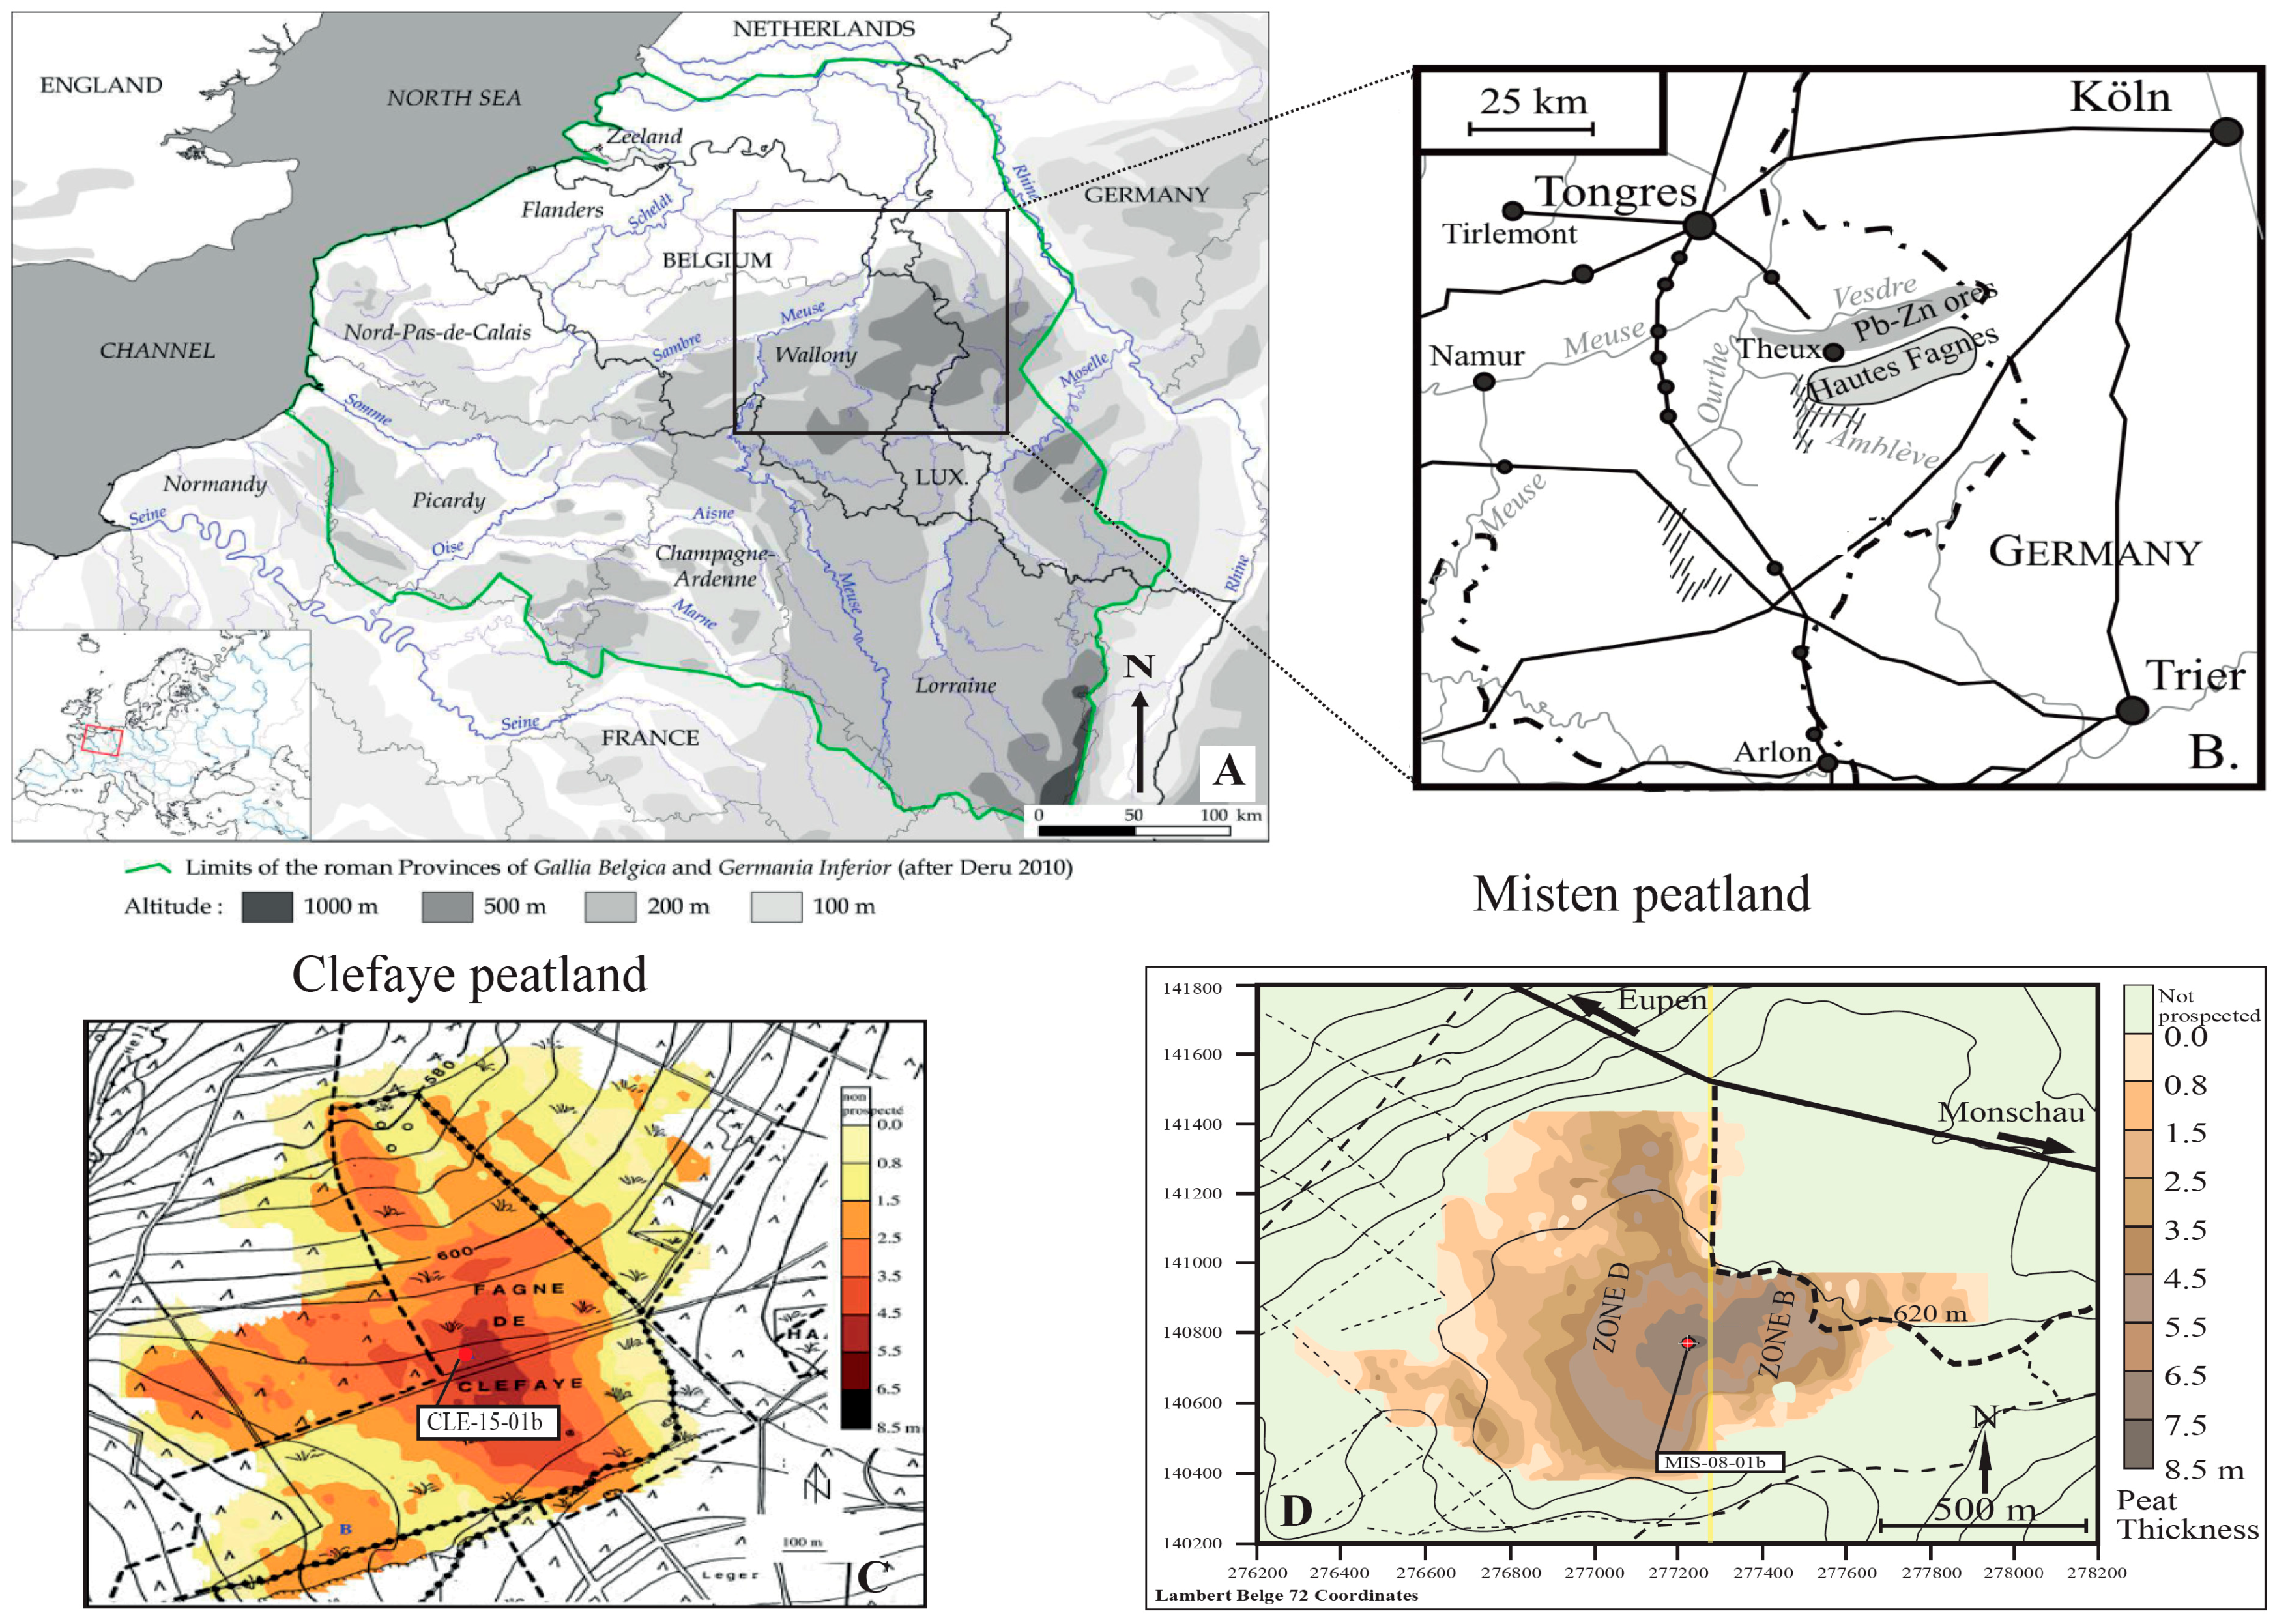
2.1. Sampling and Preparation

The present study is focused on the sections covering the Roman period of two ombrotrophic peatlands located in a nationally protected peatland area, the Hautes-Fagnes Plateau in Eastern Belgium (Figure 1B–D). The Hautes-Fagnes Plateau is part of the Stavelot Massif, mainly composed of Lower Paleozoic quartzites and phyllites [53]. The geological substratum is covered by post-Paleozoic sediments (clays of alteration, continental and marine sands, loess [54]) with some occasional outcrops of Early Cambrian (Revinian) quartzites. Core MIS-08-01b (750 cm) was taken in February 2008 from the Misten bog that is made of an accumulation of 8 m (estimated by a radar surface prospecting [55]) of Holocene peat [43]. Core (CLE-15-01b, 550 cm) was taken in July 2015, from Clefaye bog, which the maximum peat thickness reaches 5.5 m [55] and the complete peat deposit section spans about 7000 years. The two ombrotrophic peatlands studied lie just 8 km apart.
The top 100 cm of the two cores was sampled by using a titanium Wardenaar corer. The lower peat core was cored with a Belorussian corer [57]. Since we mainly focus our study on the Roman period, 60 cm from Clefaye bog (from 165 to 225 cm) and 90 cm from Misten bog (from 90 to 180) which represents ~1000 yrs history (from 500 BC to AD 500) were used. Core sub-samples of 1-cm-thick slices were taken according to the protocol defined by Givelet et al. [58]. In Clefaye bog, the sample slices were sub-sampled into three. The first part was used for geochemical analysis and the remaining core samples were stored for further analyses, including dating used in another study.

2.2. Data from Previous Research

The 14C and 210Pb data and the age model for core Clefaye (CLE) are reported in Allan et al. [59], while the age model of Misten (MIS) is reported in Allan et al. [60]. The age-depth models show that the two cores exhibit very different growth rates, with an average value of 0.6 mm yr−1 for CLE and 1 mm yr−1 for MIS for the studied period (from 500 BC to AD 500). Consequently, the analysis of Pb, Sc, Ti, and Al, in core CLE, each 0.1 cm interval corresponds to a sample of 0.5–1 year. In core MIS, 2 cm interval corresponds to 20 years. For the core MIS, the Pb isotopic data for the Roman period are from Fagel et al. [61].

2.3. Elemental Geochemistry and Pb Isotope Analyses

The samples from each core were analyzed separately using different methods as they were initially part of two different studies.

2.3.1. CLE-15-01b Core (CLE)

The CLE samples were subsampled as 4-cm-long and 0.5-cm-thick slices and were impregnated (De Vleeschouwer et al. [62], Boes and Fagel [63]) in order to consolidate them before analysis of scandium (Sc), Titanium (Ti), Aluminum (Al) and Lead (Pb) concentrations. The concentrations were determined by Laser Ablation Inductively Coupled Plasma-Mass Spectrometer (LA-ICP-MS) connected to an ESI New Wave UP-193FX Fast Excimer ArF laser of 193 nm at the Royal Museum for Central Africa (Tervuren, Belgium). Spots were made of 50-µm diameter (spaced at 1-mm intervals, samples n = 595). Detection limits were calculated from the intensity and standard deviation measurements of the blank. The limits of quantification were 0.01 µg g−1 for Sc and Pb, 1.5 µg g−1 for Al and 0.1 µg g−1 for Ti. Four certified plant standards (NIMT, 1547, NJV941, and NJV942) were used to assess the external analytical reproducibility. Comparison between reference values and measured values were satisfactory within ≥80%.
A second aliquot was used to measure the Pb isotopic composition (Table 1). Radiogenic isotope pretreatments were carried out in a class-100 clean laboratory at ULg. About 100 mg of dried peat was placed 6 h into an oven at 550 °C to remove by combustion all organic matter. After calcination, the samples were dissolved in a mixture of concentrated HNO3 and HF in a proportion of 1:4 and heated at 125 °C for 48 h. The solution was evaporated to dryness and the residue was re-dissolved in 2 mL of 6M HCl to ensure complete digestion and the solutions were evaporated. For separation of Pb isotopes, the samples were dissolved in 0.5 mL of 0.8 M HBr and passed on Teflon column filled with AG1-X8 resin. The Pb isotopic ratios were measured using an MC-ICP-MS (Multi Collector-Inductively Coupled plasma Mass Spectrometry, Nu plasma), at the Department of Earth and Environment Sciences, (ULB, Belgium). The mass fractionation was internally corrected for mass bias using the known 205Tl/203Tl ratio [64]. During the analysis, the Pb NBS981 standard was repeatedly measured in alternation with samples in order to control any daily instrument drift. The isotope ratios of the NBS981 standard were stable during the analysis session (n = 47, 208Pb/204Pb = 36.7052 ± 0.0094 (2s), 207Pb/204Pb = 15.4954 ± 0.003 (2s), 206Pb/204Pb = 16.9394 ± 0.0034 (2s)). These values are consistent with the recommended values and are in agreement with the laboratory long-term values (208Pb/204Pb 36.709 ± 0.021, 207Pb/204Pb 15.4951 ± 0.0066, 206Pb/204Pb 16.9392 ± 0.0006, n = 350).

2.3.2. MIS-08-01b Core (MIS)

The concentrations of lithogenic and conservative elements (Sc, Ti, and Al) and the trace element (Pb) were determined every 2 cm (n = 41) by High Resolution Inductively Coupled Plasma Mass Spectrometry (HR-ICP-MS) Thermo Element XR at the Observatoire Midi-Pyrénées (Toulouse, France) after complete dissolution of the 100 mg of sample with a mixture of HNO3-HF-H202 in Savillex® beakers on a hot plate in a clean room (class 100). The standards (NIMT peat, ICHTJ, CTA-OTL1 oriental tobacco leaves, NIST tomato leaves 1573 and IAEA lichen 336) were used to assess the external analytical reproducibility. The limits of quantification were calculated from the intensity and standard deviation measurements of 6 blanks. Comparisons between reference values and measured values were satisfactory for >90%.

2.4. Density

Bulk density was determined by taking 1-cm-thick plugs with a 2-cm diameter cylinder. The peat was dried until constant weight and the density was calculated as follows:
Density (g cm−3) = dry weight (g)/sample volume (cm3)

2.5. Calculation of Enrichment Factor and Accumulation Rate of Pb

The variation in trace metal concentrations can be explained by changes in supply, changes in their origin (natural or anthropogenic sources), differences in peat mass accumulation and the quantity of mineral material in the peat. One approach to separate the influence of anthropogenic sources from natural mineral material is to calculate an enrichment factor (EFPb) for each metal by using a conservative element (e.g., Ti, Sc, Al) indicative of the mineral material amount. In this study, the Sc values were used to calculate EFPb as follows:
E F P b = ( [ Pb ] [ Sc ] ) peat ( [ Pb ] [ Sc ] ) local
where ([Pb] and ([Sc])Peat are the respective total concentrations of Pb and Sc measured in the peat samples; ([Pb] and [Sc])local represent the abundance measured at the bottom section of the peat, by averaging the value of 45 samples taken from 600 to 750 cm in MIS core and the value of 250 samples taken from 450 to 535 cm in CLE core, representing the natural pre-anthropic elemental background (Allan, unpublished data).
The use of trace element accumulation rates (AR) instead of concentrations or enrichment factors is more appropriate, as variations in net peat accumulation and decomposition are taken into account by the AR. The peat accumulation rate varies within a profile, and differences between cores profiles can be caused by differences in surface growth rates and in decomposition rates because peat compaction increases with decomposition. Based on an age-depth model, density and [Pb], the Pb accumulation rate can be calculated as follows:
Pb   AR   ( mg   m 2 yr 1 ) = [ Pb ] ( µ g   g 1 ) × density   ( g   cm 3 ) × accumulation   rate   ( cm   yr 1 ) × 10

3. Results and Discussion

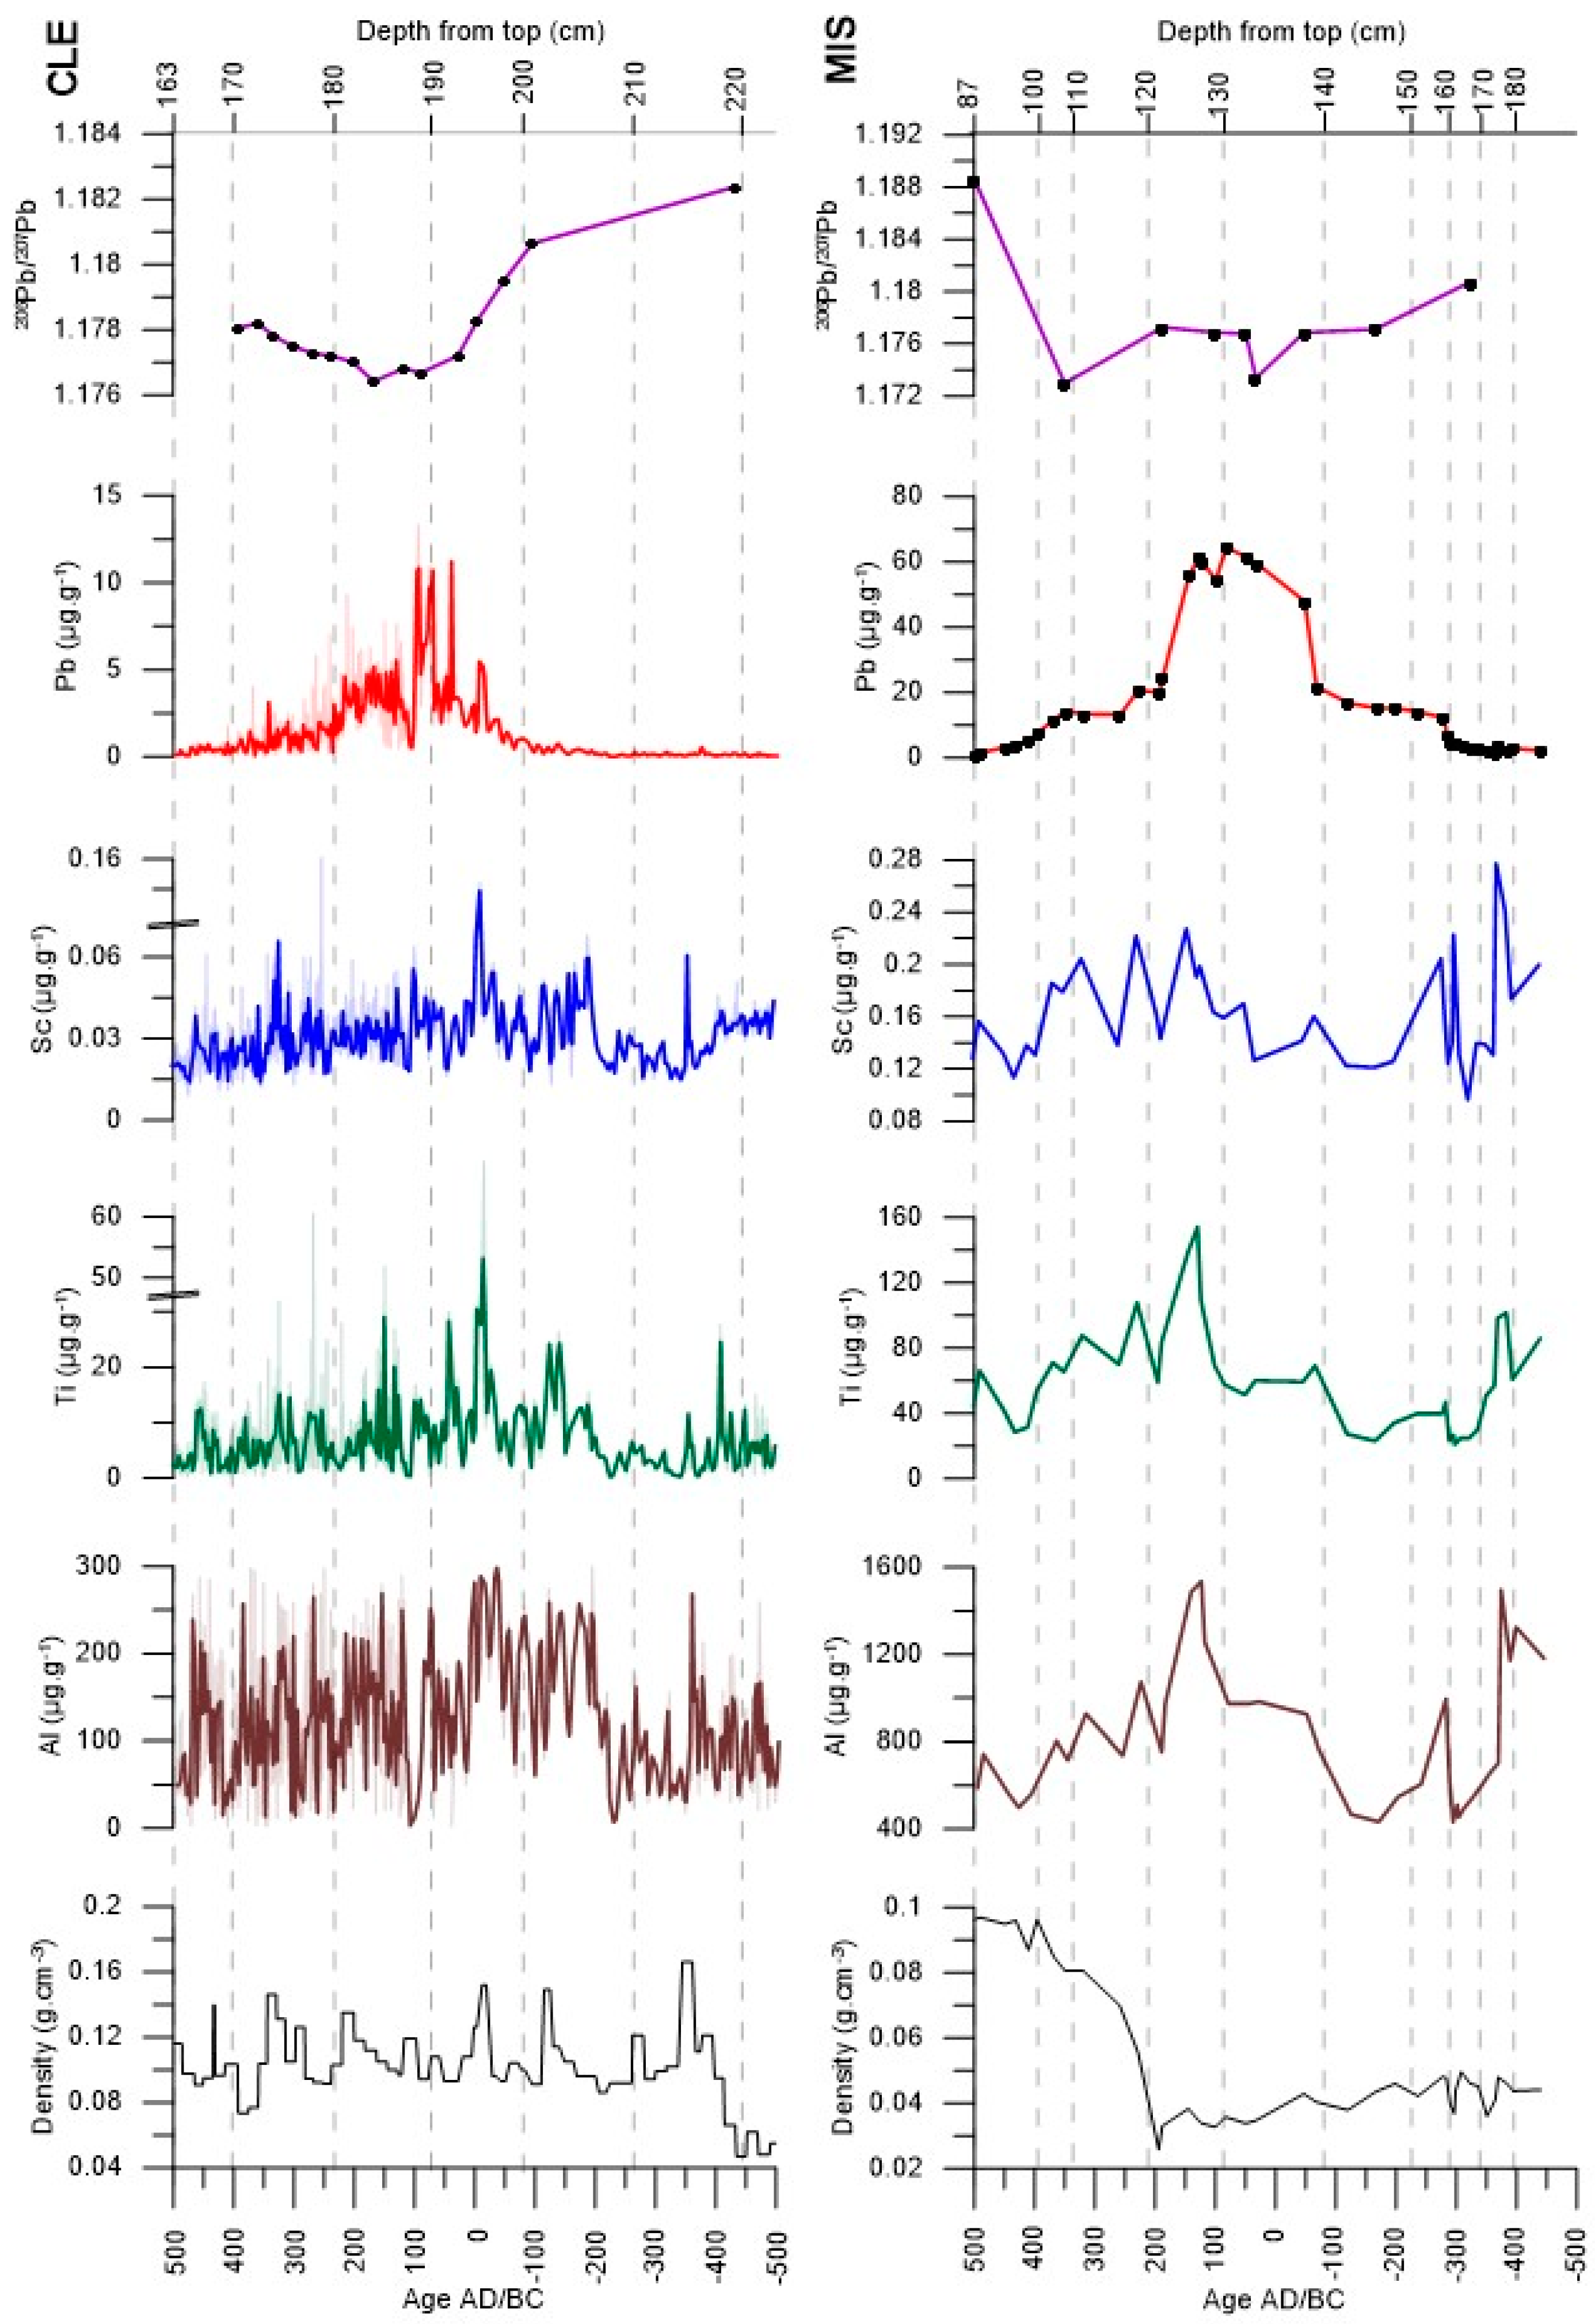
3.1. Density, Elemental Concentrations and Pb Isotope Ratios

In core CLE, dry bulk density ranges from 0.05 to 0.17 g cm−3 with a mean of 0.1 g cm−3. In core MIS, density varies from 0.03 to 0.1 g cm−3 and average of 0.05 g cm−3. These values vary between 0.03 and 0.05 g cm−3 from the lower part of the core at 180–120 cm (from 500 BC to AD 120), and they increase to the upper peat section (Figure 2).
In core CLE, the conservative elements (Al, Sc and Ti) concentrations display similar variations (Figure 2). These three elements measured along the core (from 165–550 cm) are significantly correlated (rAl-Ti = 0.92, rAl-Sc = 0.96, rSc-Ti = 0.89; p-values < 0.0001). Between 165 and 225 cm, the Al values vary between 2 and 300 µg g−1 with a mean of 125 µg g−1, from 0.01 to 0.16 µg g−1 with a an average of 0.03 µg g−1 for Sc, and from 0.15 to 69 µg g−1 with a mean of 7 µg g−1 for Ti. The Pb content can be described in four phases evolution: (i) very low concentrations (mean < 0.2 µg g−1) until c. 220 cm (80 BC); (ii) a first phase of increase with four peaks (of 5–10 µg g−1) until 188 cm (AD 100); (iii) a sharp, brief, decline to very low concentrations followed by a second phase of relatively high concentrations (max [Pb] = 9 µg g−1) between 187 and 181 cm; and (iv) a return to low Pb values after 180 cm-depth (Figure 2).
In core MIS, Al, Sc and Ti concentrations display similar variations (Figure 2). Highly significant correlations (rAl-Ti = 0.92, rAl-Sc = 0.93, rSc-Ti = 0.88; p-values < 0.0001, p-values < 0.0001) were calculated between those three elements measured along the core (from top to 735 cm). In this study (from 90 to 180 cm), the Al values vary between 430 and 1535 µg g−1 with a mean of 770 µg g−1. The Sc values range between 0.10 and 0.23 µg g−1 with an average of 0.16 µg g−1, and Ti values vary from 20 to 155 µg g−1 with a mean of 30 µg g−1. The Pb content shows five phases: (i) low low concentrations until c. 160 cm (280 BC); (ii) a slight increase, but remaining almost constant between c. 160 and c. 140 cm (280–70 BC); (iii) high values between c. 140 and c. 120 cm (from 70 BC to AD 180); (iv) and (v) a gradual return to very low concentrations until 87 cm (Figure 2). The similarity between the Al, Sc and Ti profiles confirms that these elements are not affected by any diagenetic process (immobile) and can be used to calculate the Pb enrichment factor.
Table 1 summarizes results of Pb isotope analyses in both cores CLE and MIS. In core CLE, the 206Pb/207Pb ratio shows two main ranges: from 400 BC to 170 AD, the ratio drops from 1.182 to 1.764 ± 0.00001; and from AD 200 to AD 395, the ratio increases from 1.177 to 1.780 ± 0.00001 (Figure 2). In core MIS, 206Pb/207Pb ratio decreases from 1.180 to 1.173 ± 0.00001 in the interval from 325 BC to AD 30, then it increases to 1.188 ± 0.00001 at AD 500.

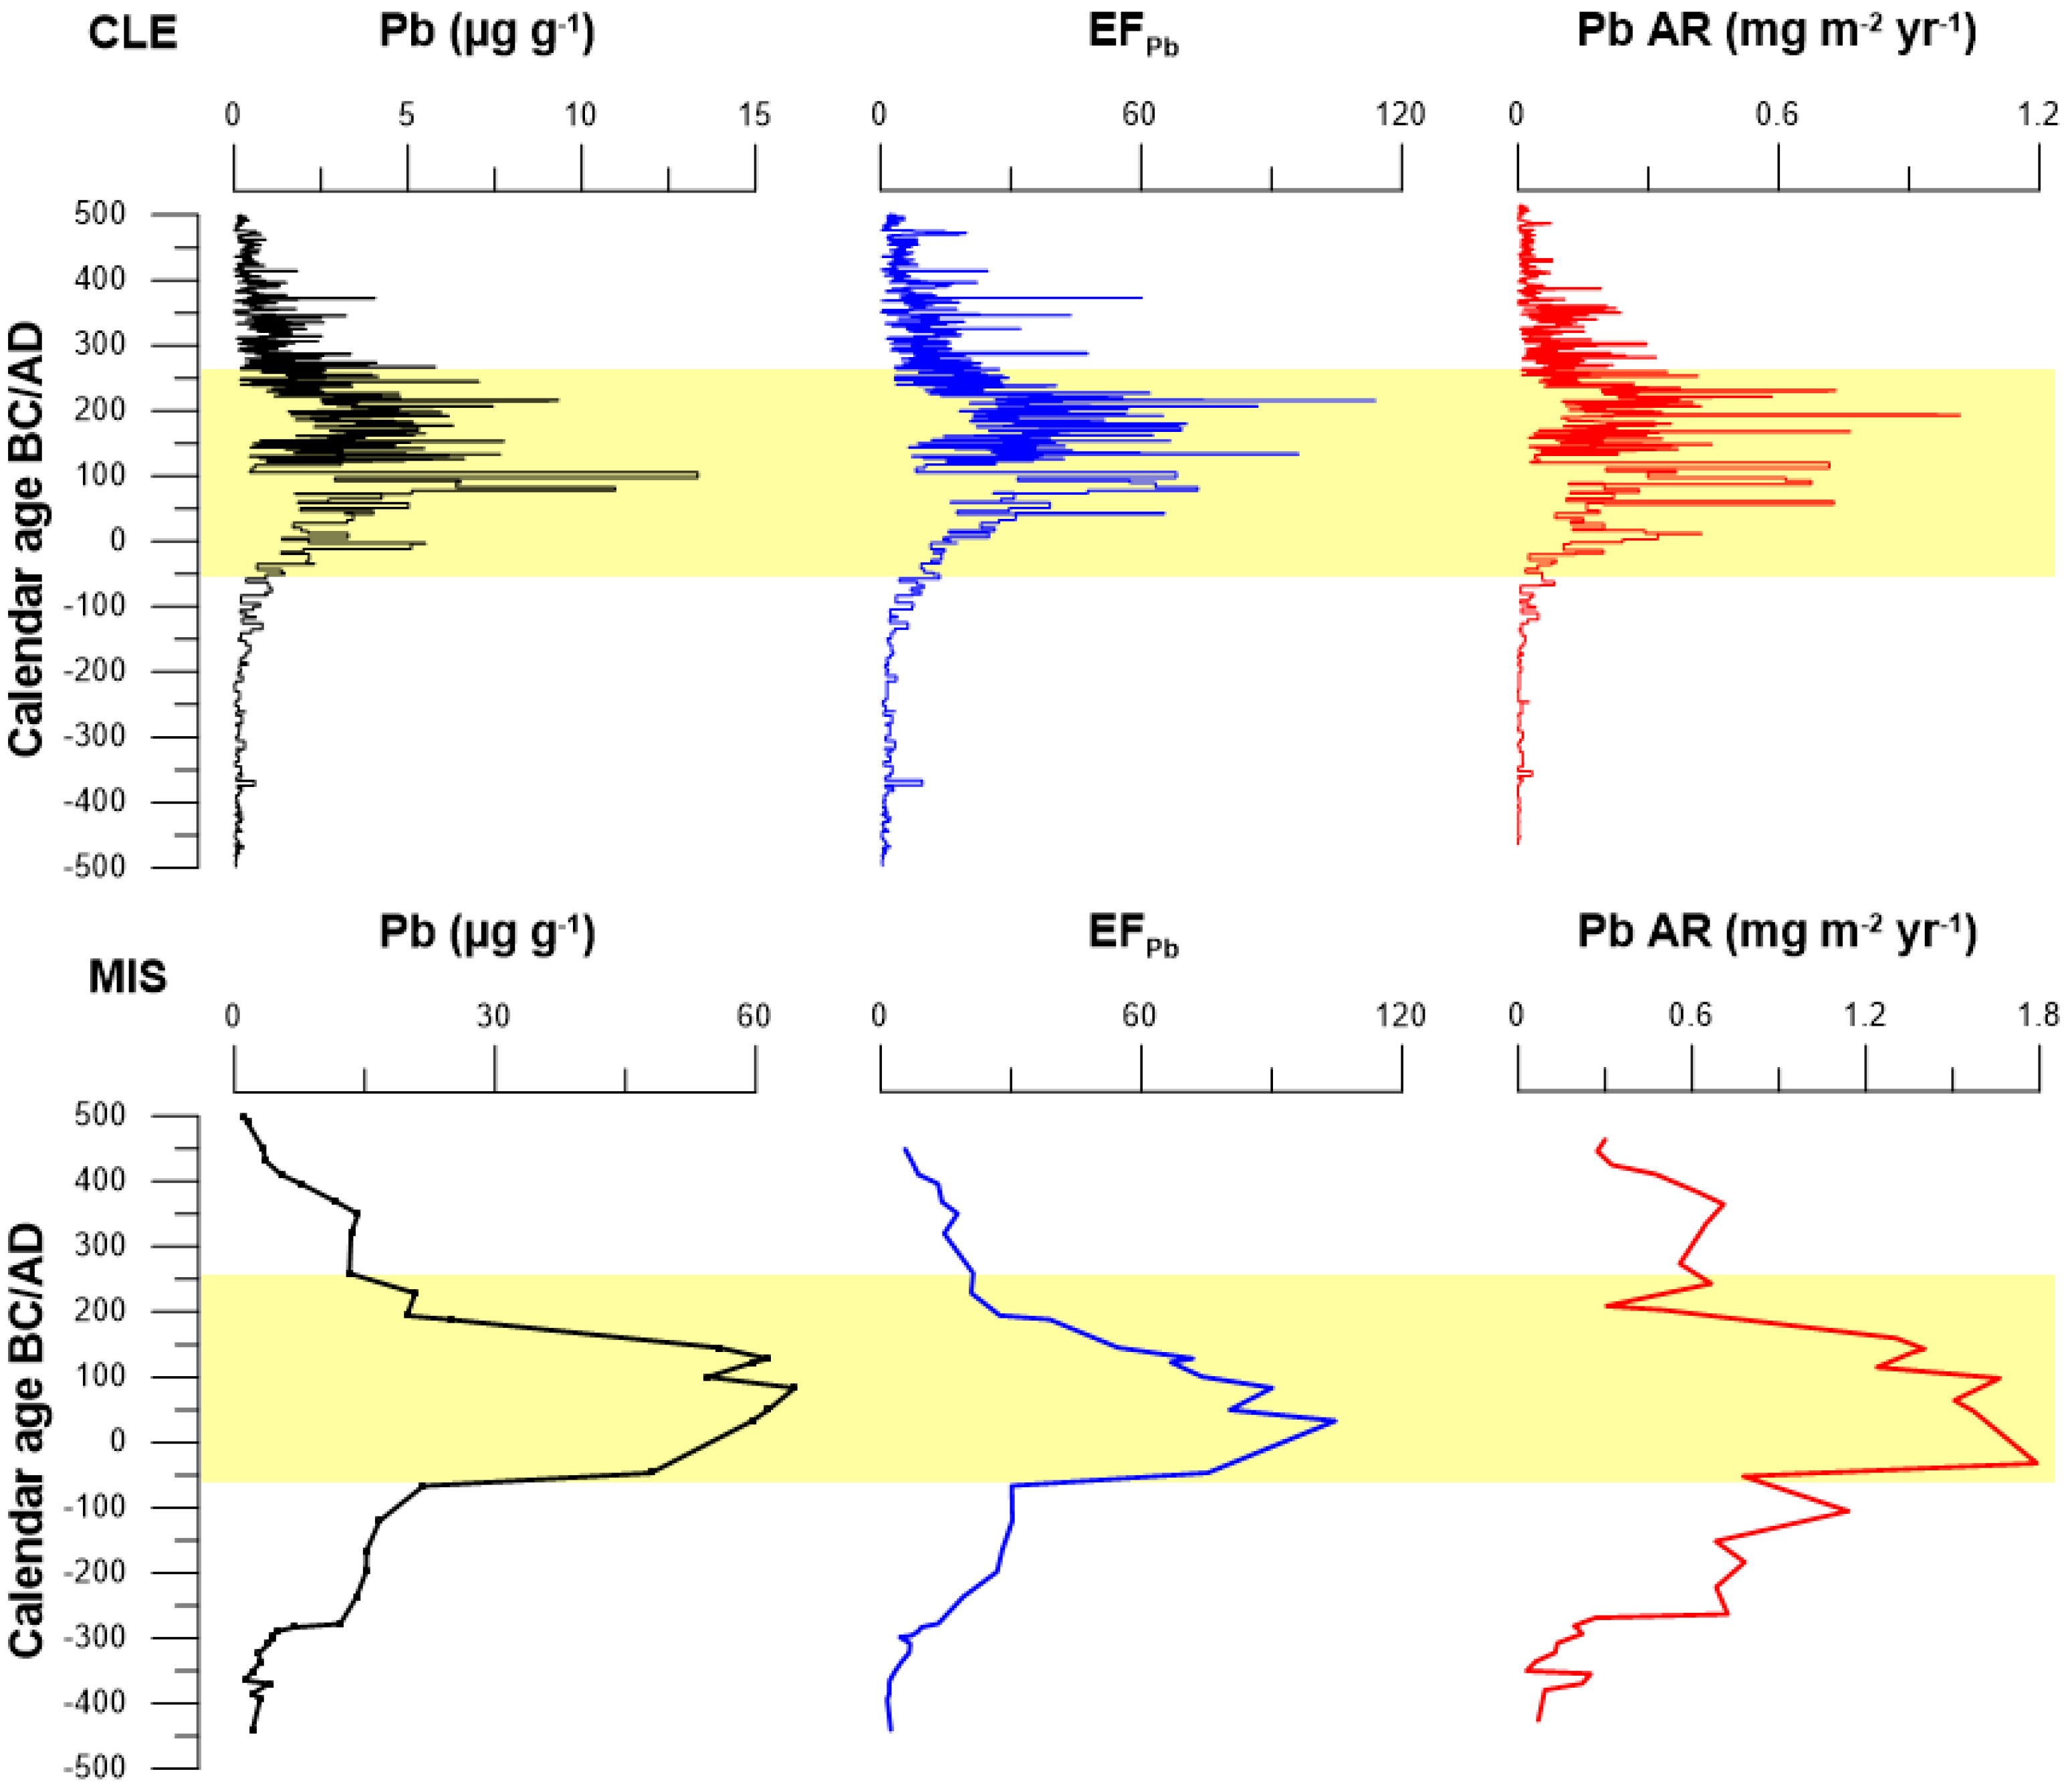
3.2. Enrichment Factor of Pb and Accumulation Rate (Pb AR)

The lithogenic elements (e.g., Al, Sc and Ti) were used as conservative elements because these elements are well above the limit of detection for both cores and resistant to chemical weathering, even in the acid environment of the peatland [65,66]. The calculated EF values are depending from the lithogenic element content used, because the heterogeneity of the deposits and sources of the dust. As the three conservative elements (Al, Sc and Ti) measured in both cores are highly correlated, only the Sc content was used to calculate EFPb. An EF value close/equal to 1 indicates that the relative concentration of a given element is identical to that which is present in the lower peat sections (natural sources). An EF values greater than 1 indicate the influence of anthropogenic sources. In the core CLE, EFPb values vary from 0.5 to 115 and from 2 to 105 for the core MIS (Figure 3). In both cores, EFPb values remain low from the 500 to 200 BC period and increase to reach a maximum between AD 50 and AD 225 for CLE and between 60 BC and AD 200 for MIS. Finally, EFPb values decrease toward the upper section of cores. The location and assigned chronology of the maximum EFPb differ in each core. Nevertheless, the increase in EFPb values in each core is coincident with the period of Roman mining activities. However, the use of EF is more complicated becauce it is depends on the biosphere, hydrosphere and pedospheres and the human interference with element cycles at both local and regional scales.
Samples from the peat sections between 225 and 200 cm in core CLE and between 195 and 150 in core MIS (from 500 to 100 BC) were considered to calculate Pre-Roman Pb AR. The Pre-Roman period Pb AR was 0.1 mg m−2 yr−1 for CLE and Pb AR = 0.4 mg m−2 yr−1 for MIS. In core CLE, the Pb AR remains lower than 0.15 mg m−2 yr−1 from 500 to 80 BC (Figure 3), then it increases from the inception of the Roman period at 50 BC to reach a maximum of more than 0.7 mg m−2 yr−1 between AD 70 and AD 215. Then, Pb AR decreases to less than 0.02 mg m−2 yr−1 at the end of Roman period. In core MIS, the Pb AR remains lower than 0.4 mg m−2 yr−1 from 450 to 80 BC (Figure 3). Then, Pb AR increases to reach a maximum of more than 1.2 mg m−2 yr−1 between 50 BC and AD 150. Since then, the Pb AR decreases to less than 0.3 mg m−2 yr−1 at the end of Roman period (i.e., after AD 350). During the Roman period, the mean Pb AR shows values 17–80 times higher than the natural background (<0.003 mg m−2 yr−1 in CLE and <0.07 mg m−2 yr−1 in MIS).
An intra-site variability in Pb AR values is observed when CLE and MIS cores are compared. During both the pre-Roman and Roman periods Pb AR at MIS is higher than at CLE. However, they both indicate similar chronologies of the Pb AR. As the two bogs are influenced by similar climate regime (nearby bogs located ca. 8 km of distance and similar altitudes), an actual difference in Pb AR values at the two sites is unlikely. Such a difference may be explained by the within-bog spatial heterogeneity and/or the Pb measurement resolution [2,67,68]. The difference between hummocks and hollows is well established, where hummocks are known to have higher interception of atmospheric particles [2]. Indeed, the MIS core was taken from a hummock and CLE was taken between a hummock and a hollow. Therefore, MIS may have better trapped atmospherically deposited Pb than the CLE bog due to a favorable micro-topography. The Pb concentrations were measured in the core CLE by LA-ICP-MS with a resolution of 1 mm and by ICP-MS in the core MIS with a lower resolution of 2 cm. By using nine hummock cores collected on one bog, Bindler el al. [68] suggested that the micro-climate, microtopography and plant community can play an important role in different Pb accumulation rates. Allan et al. [69] showed, by studying Hg accumulation rates in four cores recorded in Misten peatland over 1500 years, that the potential factor that could contribute to the intra-site variation is the inhomogeneous peat accumulation rates across time and space. This suggests that particle deposition recorded in our peat cores could be affected by the micro-topography, heterogeneous peat accumulation rate, and both resolution and the analytical techniques used for Pb measurements in this study.
The mean natural background of Pb AR (before 500 BC, 0.003 ± 0.001 mg m−2 yr −1; unpublished data) for CLE is similar to published values of 0.007 ± 0.002 mg m−2 yr −1 from 2000 BC to 900 BC for an England peatland [1], 0.01 ± 0.003 mg m−2 yr −1 obtained from 5000 to 3000 BC for a Swiss peat [5]. Such comparison suggests that Pb AR values in CLE and MIS cores before 500 BC correspond to deposition of geogenic Pb. The large increase in Pb AR recorded in CLE and MIS cores (from 50 BC to AD 200) is in good agreement with other studies on European peatlands which show a peak due to Roman Pb mining [1,5,13]. The mean Pb AR in the CLE and MIS peat cores is within the range 0.24–1.18 mg m−2 yr −1 (50 BC–AD 200): such values are 17–80 times the natural background values. This is in good agreement with the maximum values recorded in Spanish peat bogs (0.3–0.9 mg m−2 yr −1) which are 10–30 times the background values (0.025–0.031 ± 0.015 mg m−2 yr −1) from 550 BC to AD 500 [13,25]. In a Swiss peat bog core, the maximum Pb AR is 37 times the background value for the Roman period [5]. Le Roux et al. [1] also showed that the maximum Pb AR value (0.22 mg m−2 yr −1) during the Roman period was 34 times higher than that of the pre-Roman period. In peat bogs cores from southern Black forest-SW Germany, Le Roux et al. [38] showed that the Pb AR is more than 40 times the background values (0.02–0.03 ± 0.01 mg m−2 yr −1). We can conclude that the Pb AR and chronologies in the CLE and MIS cores are consistent with those reported for other European peat records.

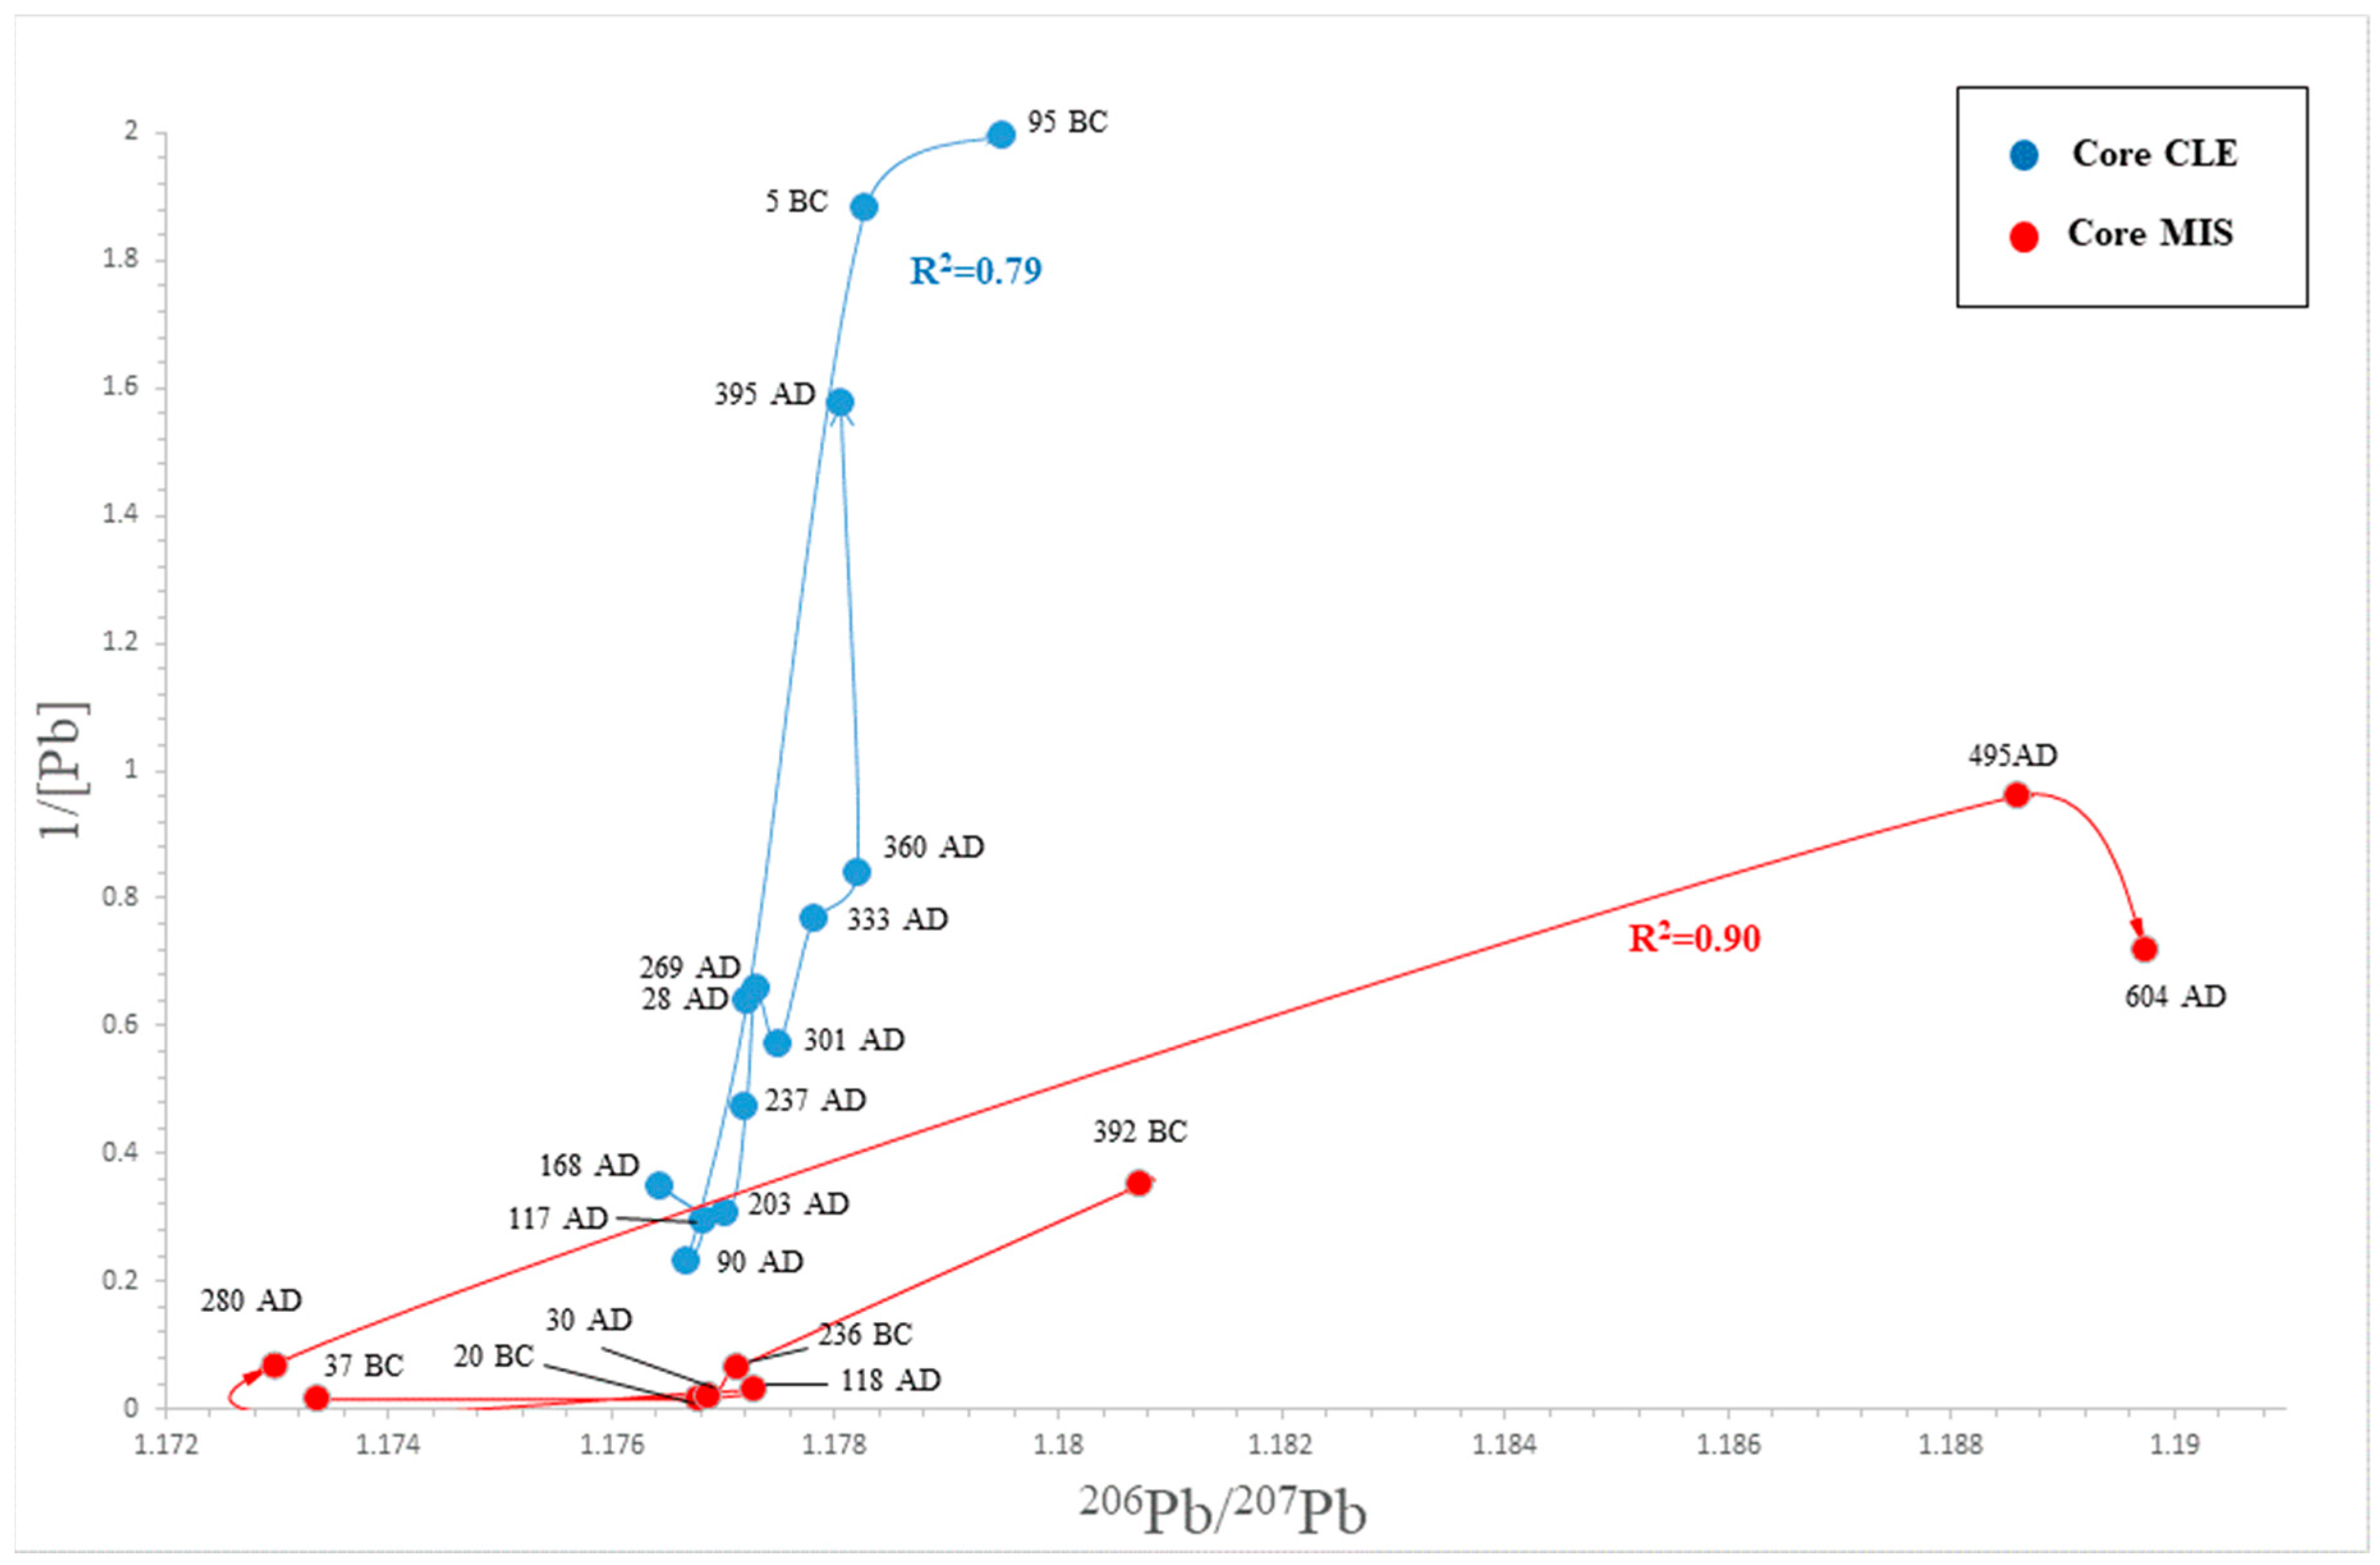
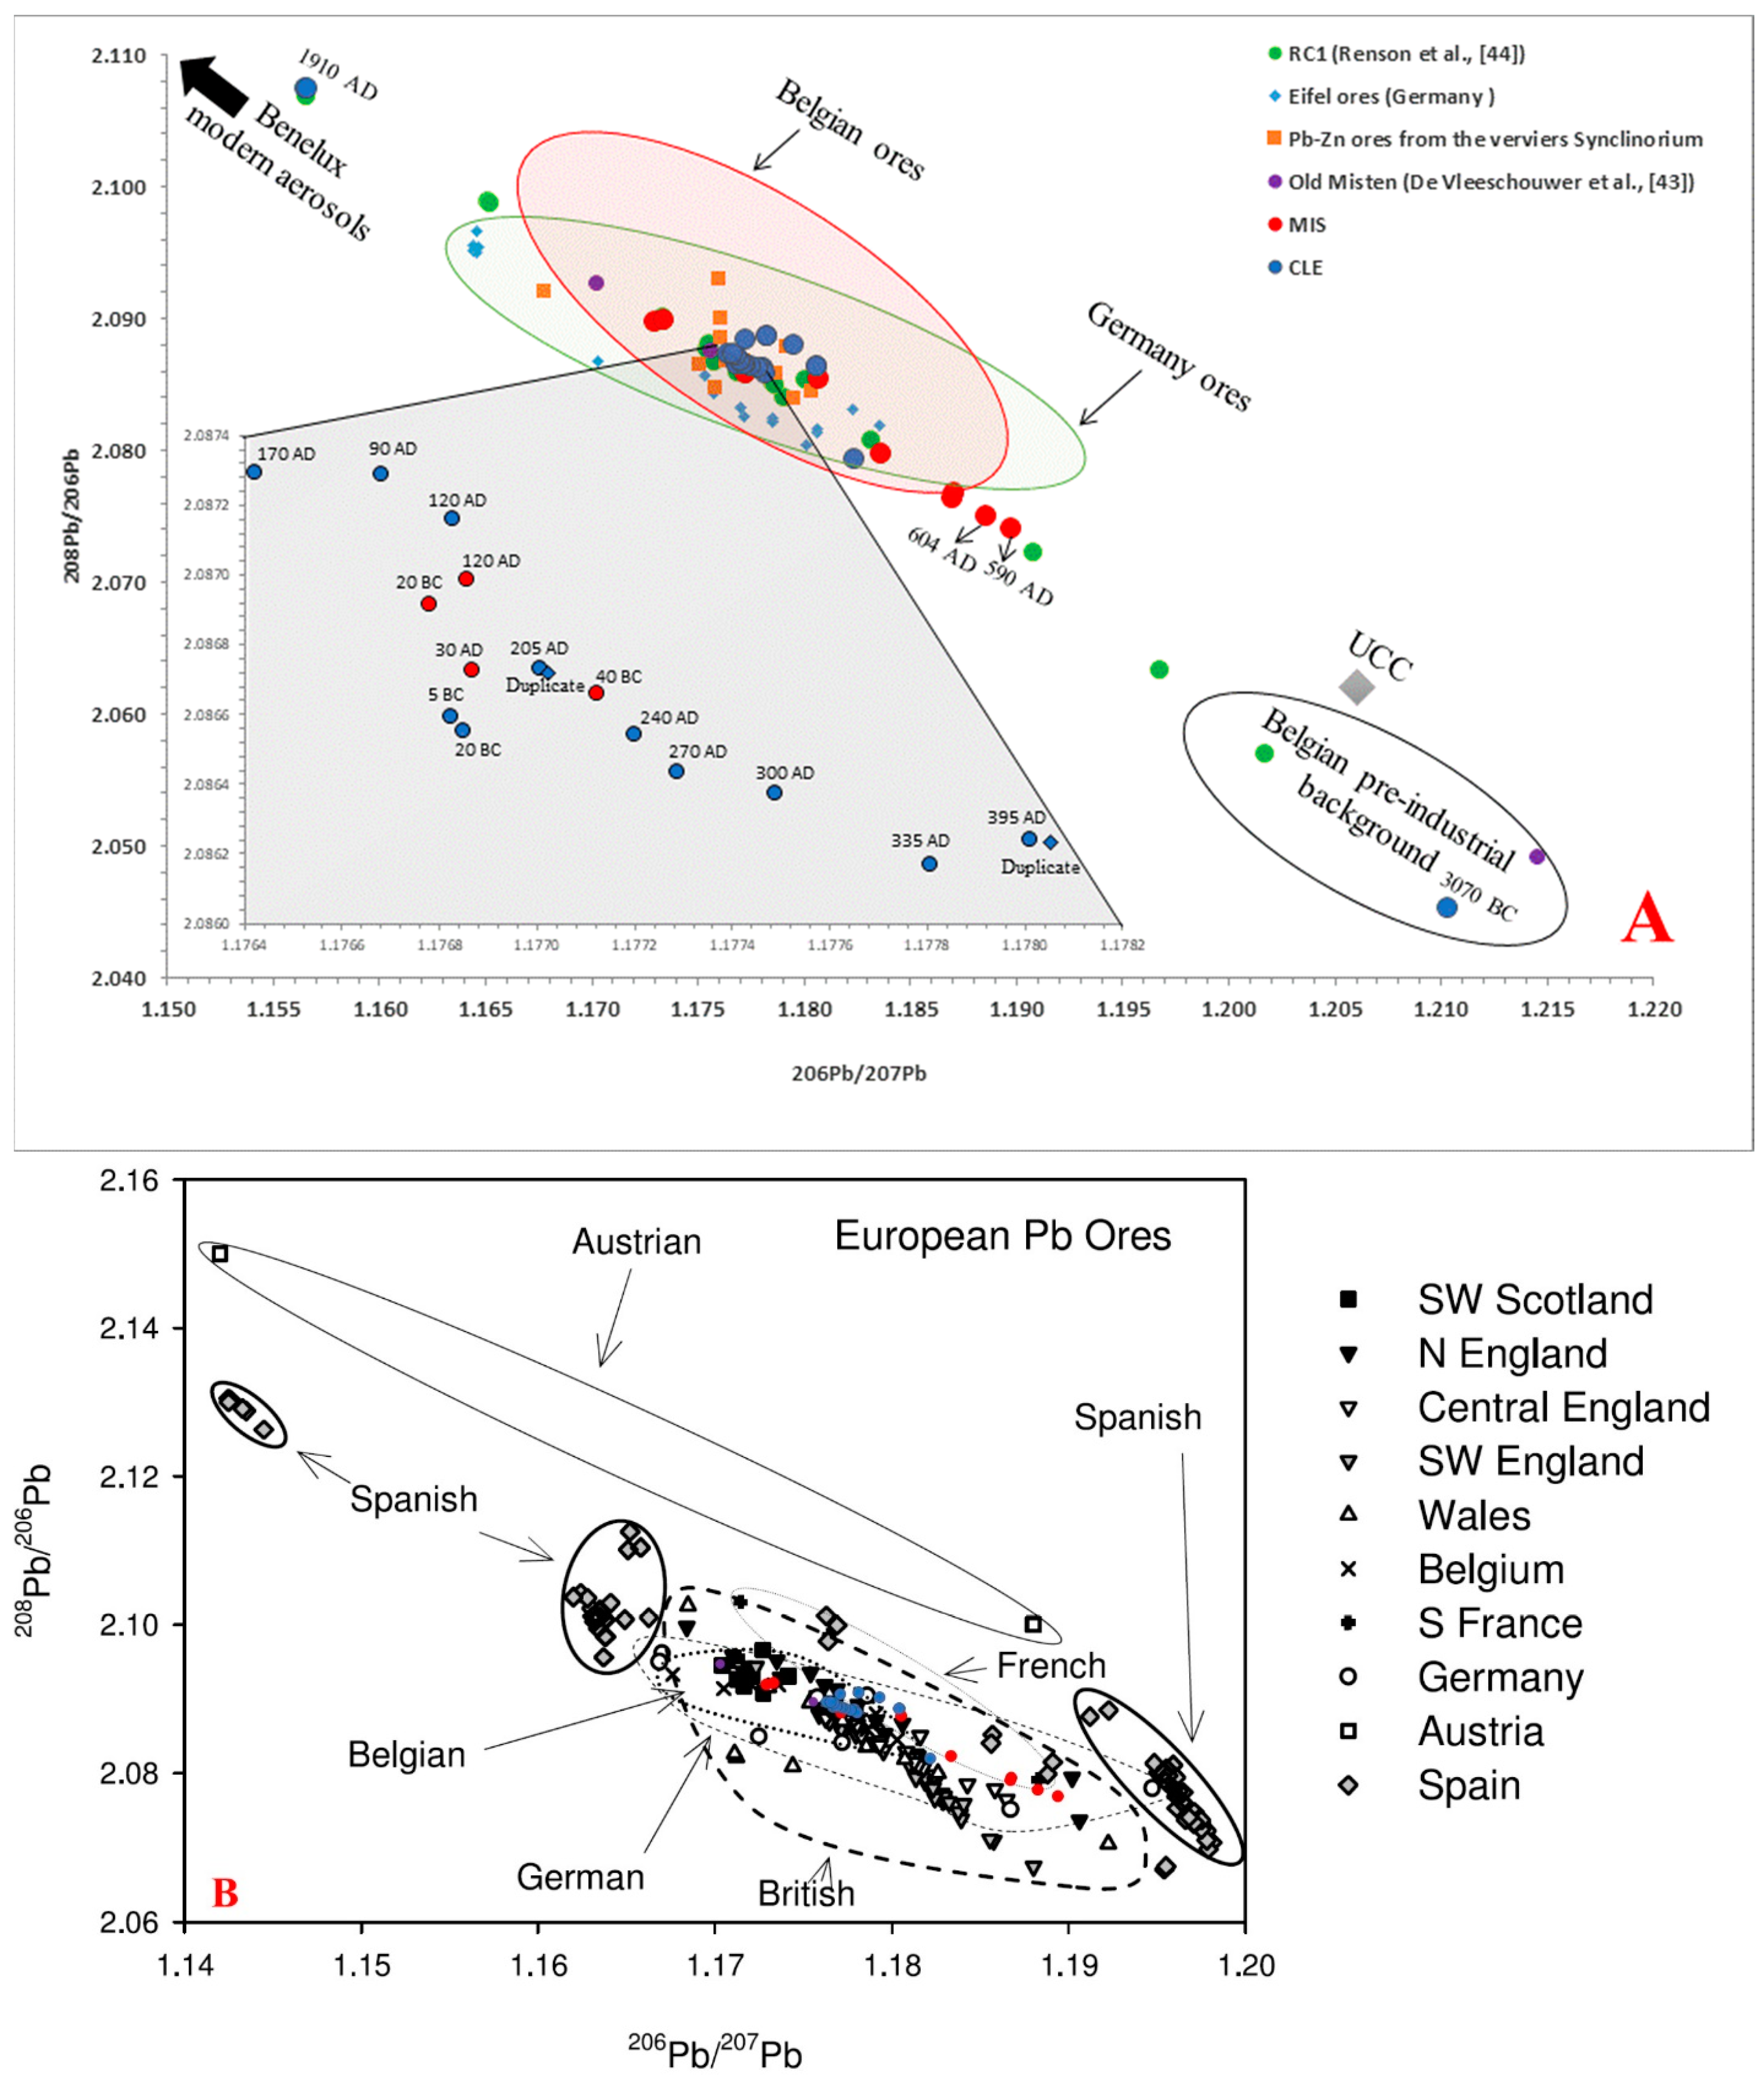
3.3. Identification of Pb Sources

The 206Pb/207Pb ratios are plotted against the reciprocal of the Pb content in Figure 4 in order to document any change in the isotopic Pb composition consistent with a contamination in Pb. The evolution for CLE and MIS core shows a significant relationship between Pb content and isotopic composition. The decrease in the isotopic ratios throughout both cores is associated with an increase in Pb, suggesting a progressive input of Pb from pollution sources (potential sources are described below). The potential sources of Pb contamination are discussed below.
Roman mining and metallurgical activities all over NW-SW Europe and around the Mediterranean Sea increased significantly the amount of atmospheric Pb [5,15,20,61,70]. The Pb isotope ratios deposited in CLE and MIS peat cores vary from 1.729 to 1.178 for 206Pb/207Pb ratios and from 2.086 to 2.089 for 208Pb/206Pb ratios (Figure 5A).
In order to identify the source of lead, Pb isotope data from this study are compared with Belgian ores and Pb-Zn ores from the Verviers syncline exploited during the Roman period [71,72], Germany ores [73], Benelux modern aerosols [74], the Belgian pre-industrial background [43] and the Upper Continental Crust [75]. In the binary diagram 208Pb/206Pb vs. 206Pb/207Pb, most of the CLE and MIS core data plot in the isotope field defined by Belgian ores [71,72], Eifel ores [73], Pb-Zn ores from the Verviers syncline [71,72] (Figure 5A). Most samples from the post/pre-Roman period have mixed Pb isotopic signatures between those of Belgian ores and that of the Belgian pre-industrial background. The lowest sample (412 cm-3070 BC) shows good agreement with upper continental crust values and Belgian pre-industrial background. The Pb isotope ratios measured in CLE and MIS samples for the Roman period between 40 BC and AD 300 correspond to the isotopic fields of the Pb-Zn ores of the Verviers syncline, Belgian ores and the Eifel ores [73]. Following the Roman period, the next phase of change is characterized by an increase in 1/[Pb] and 206Pb/207Pb ratios values reflecting the decline of the Roman mining activities (Figure 4). This drop has already been well documented in other European peat bogs [2,76]. Note our results are consistent with those obtained by De Vleeschouwer et al. [43] in a former core recovered in the Misten bog and by Renson et al. [44] from peat cores (RC1) in the Hautes Fagnes Plateau (Figure 5A). The CLE and MIS peat samples are plotted along with those of various European Pb ores [77], supporting the influence of regional anthropogenic sources (Figure 5B). The Pb isotopic ratios of this study show that the Clefaye and Misten peats are influenced by a mixture of local and regional anthropogenic sources.

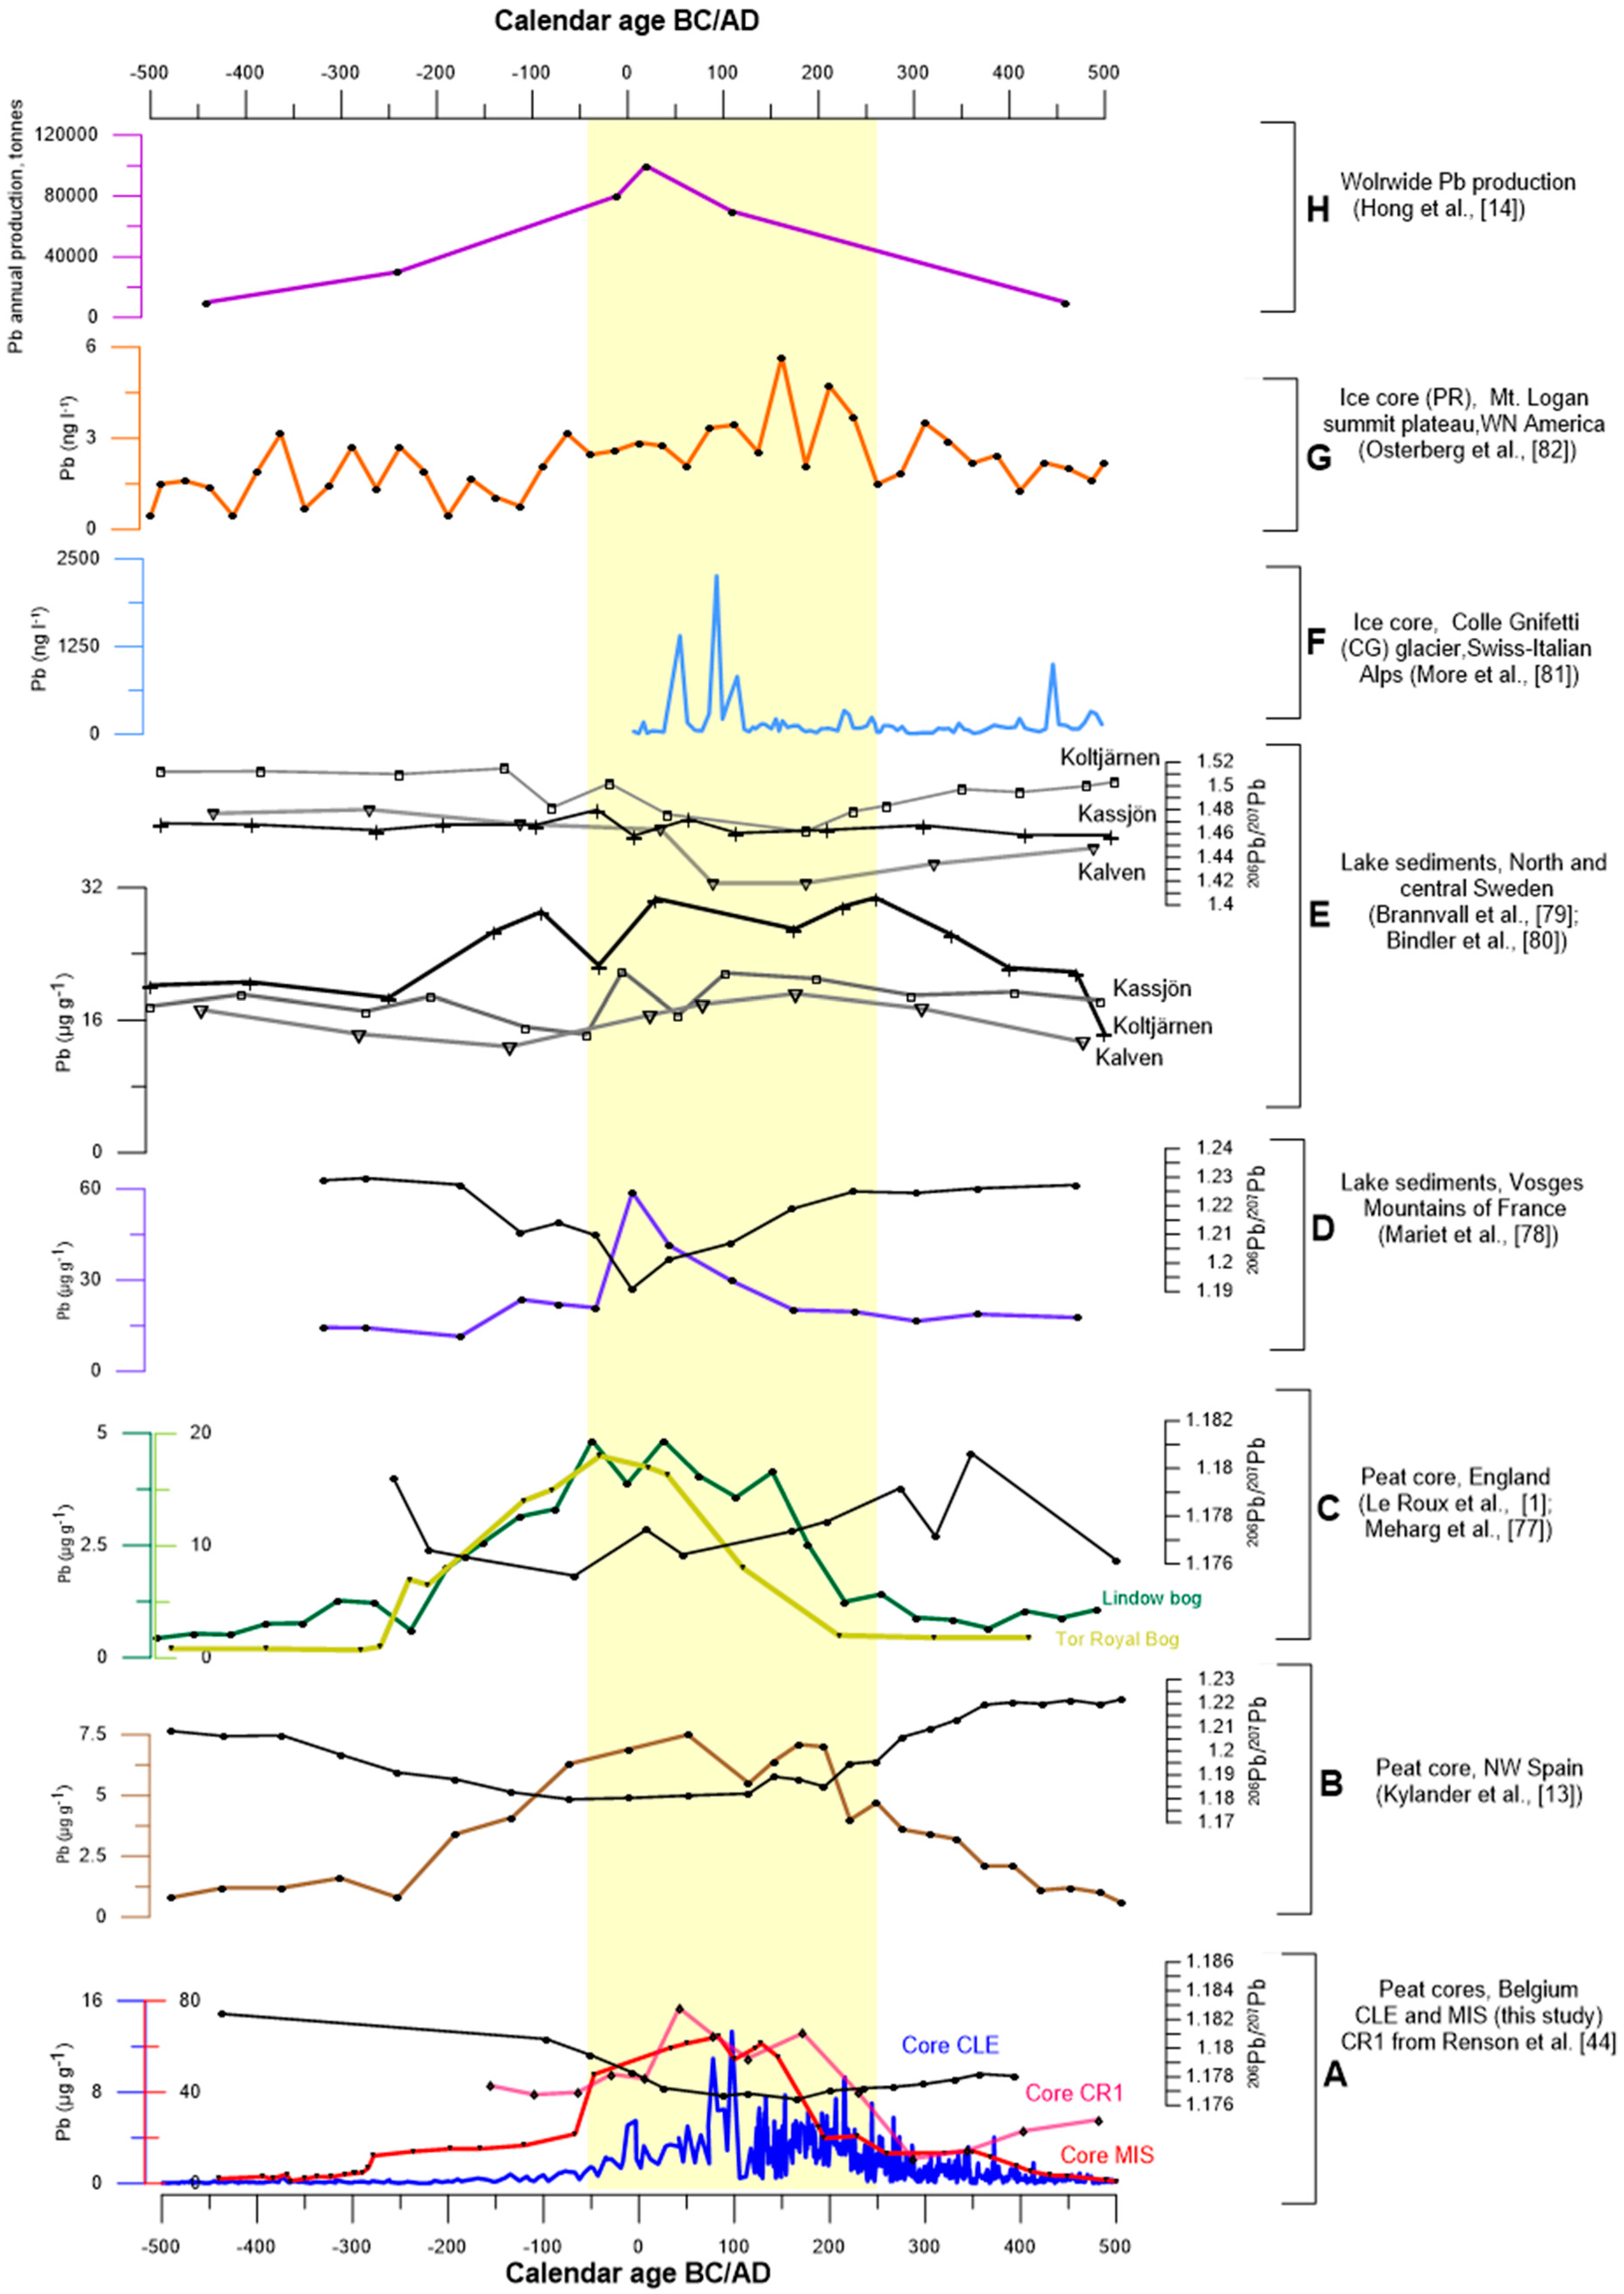
3.4. Temporal Evolution of Pb Contamination

The increased atmospheric lead deposition in the Belgian peatland records displays significant variability during the Roman period, with maxima of Pb concentrations observed between 80 BC and AD 230 (Figure 6). At least six local maxima are identifiable, centered at ~50 BC, AD 5, ~AD 75, ~AD 130, ~AD 180, and ~AD 215, pointing to changes in the intensity of mining and metallurgy activities in the area. This pattern is also followed by higher Pb enrichment factors (Figure 3) in parallel with a decrease in the 206Pb/207Pb ratio (Figure 2). The inception and end of Pb contamination period reflects the rise and subsequent fall of the Roman Empire in Western Europe. The Pb concentrations from Belgian peat records increase since ca. 300 BC for MIS and 100 BC for CLE to reach a maximum at ~ 50 BC (Figure 6), coinciding with the period of Late Iron Age and Early Roman Empire, related to Celtic mining activity [40,42]. The Celtic people established in South Belgium from 480 BC to 27 BC and developed gold extraction from river sediments and arkose mines [40,42,46]. The gold mining activity is attested by more than thousand archeological sites in Southeast Belgium [46]. Between AD 75 and AD 230, corresponding to the zenith of the Roman Empire, the Pb concentrations increase to a maximum >15 µg g−1 for CLE and > 60 µg g−1 for MIS (Figrue 6). During this period, Pb AR and EFPb are higher and 206Pb/207Pb ratios show lower radiogenic values (206Pb/207Pb up to 1.173). The increase of lead pollution detected in the Belgian peatlands is synchronous with intense mining and metallurgical activity that took place all over NW Europe and around the Mediterranean Sea. In addition, a local pollution may have occurred in MIS and CLE sites. The Pb isotopic values of CLE and MIS samples (206Pb/207Pb~1.170–1.180) from 20 BC to AD 400 show good agreement with the isotopic field of the Belgian Pb–Zn ores (206Pb/207Pb~1.167–1.180). In Belgium, there is no historical, archaeological evidence for Roman Pb-Zn mining. However, in previous studies of a peat column taken nearby an archaeological site constituted by a Roman road and peat bog core in the Hautes Fagnes, Renson et al. [44] and De Vleeschouwer el al. [43] found and dated very high Pb concentrations (up to 90–135 µg g−1) that reflect local pollution linked to the Roman road [44]. Additionally, the Pb isotopic composition found by De Vleeschouwer el al. [43] and Renson et al. [44] is in good agreement with isotopic composition of Pb-Zn ores from the Verviers syncline located 15 km northwards to the Hautes Fagnes Plateau.
Many other studies have reported Pb contamination dating from the Roman period, including peat bogs [1,13,77], lake sediments [78,79,80] and ice cores [81,82] (Figure 6). During this interval period, production of Pb in Europe and Asia reached approximately 80,000 tons per year [18]. It has been estimated that as much as 5% of this Pb production might have been emitted to the atmosphere [83] and was registered in most natural archives from both low and high latitudes. By using peat and lake sediments cores recorded from southern Sweden, Brännvall et al. [70] showed an increase in atmospheric Pb deposition during the Roman period with high Pb AR detected around AD 0 with 206Pb/207Pb values = 1.17. Le Roux et al. [1] showed, by using a peat bog core from England, a dramatic increase in Pb AR around 0 AD and AD 140. During both intervals, the 206Pb/207Pb ratio values are around 1.177. Kylander el al. [13] demonstrated that high Pb concentrations (>5 µg g−1) are detected between AD 45 and AD 190 with 206Pb/207Pb ratio values <1.185. In La Molina mire Pb record, Martinez Cortizas et al. [84] demonstrated that the atmospheric metal pollution shows six maxima centred at 20 BC, AD 65, AD 140, AD 180, AD 320 and AD 440, pointing to changes in the intensity of mining and metallurgy in the NW Spain. The maxima of Pb concentrations (~50 BC, AD 5, ~AD 75, ~AD 130, ~AD 180, and ~AD 215) observed in CLE and MIS cores are in good agreement with similar studies in Europe. Our results from CLE and MIS cores are consistent with the timing of documented Roman lead deposition in other lake, peatland and ice archives (Figure 6). Most studies showed a peak of lead concentration somewhere between 50 BC and AD 200. The increase in atmospheric Pb concentration, recorded around 200 BC in England [1,77] and Spain [13], indicates earlier Pb extraction (pre-Roman mining activities) in the British Isles and Spain. Compared to other areas in Europe, there is no evidence of earlier phases of mining/metallurgy in Belgium yet. Our geochemical results yield evidence of local and regional environmental contamination in the Belgian peats due to mining activities that began during the Roman period.

4. Conclusions

The Pb concentrations, EFPb and Pb AR as well as the isotopic composition of the accumulated Pb enabled an annual-decadal reconstruction of the chronology of atmospheric Pb pollution of the Belgian records from 500 BC to AD 500. The highest Pb concentration and EFPb were observed between 50 BC and AD 215 (15–60 µg g−1, 105–115; respectively). Pre-Roman Pb AR averaged 0.1–0.4 mg m−2 yr−1 from 500 BC to 100 BC, the Roman Pb AR reached a maximum from 0.7 to 1.2 mg m−2 yr−1 between 50 BC and AD 215. The amplitude of Pb AR and chronologies in the CLE and MIS cores are consistent with those reported for other European peat records, reflecting the influence of local Belgian ores and regional European pollution. More precisely, Belgian peatland cores recorded specific phases that are in agreement with mining Roman activities in Germany, France, Spain and Sweden. High PbAR values during the Roman period were primarily caused by mining and metallurgical activities. This study contributes to the European datasets for pollution reconstruction during the Roman period.

Author Contributions

M.A. and N.F. designed the experiments, N.M. carried out Pb isotopes data analysis. D.L.P., B.G., and S.V. participated in writing and correcting of this manuscript. M.A. prepared the manuscript with contributions from all co-authors.

Acknowledgments

This study was funded by the FNRS (HOPES project, N 23612574). We thank all the persons who contribute to this work, especially Joel Otten, Ahounta Djidoumalbaye and Hicham El Idrissi for their help during fieldwork; Luc André and Laurence Monin from RMCA in Tervuren (Belgium) for LA-ICP-MS analyses and Gael le Roux from EcoLab in Toulouse (France) for HR- ICP-MS analyses.

Conflicts of Interest

The authors declare no conflict of interest

References

  1. Le Roux, G.; Weiss, D.; Grattan, J.; Givelet, N.; Krachler, M.; Cheburkin, A.; Rausch, N.; Kober, B.; Shotyk, W. Identifying the sources and timing of ancient and medieval atmospheric lead pollution in England using a peat profile from Lindow bog, Manchester. J. Environ. Monit. 2004, 6, 502–510. [Google Scholar] [CrossRef] [PubMed]
  2. Allan, M.; Le Roux, G.; De Vleeschouwer, F.; Bindler, R.; Fagel, N. High-resolution reconstruction of atmospheric deposition of trace metals and metalloids since 300 years in Belgium recorded by ombrotrophic peat cores (Hautes-Fagnes, Belgium). Environ. Pollut. 2013, 178, 1–14. [Google Scholar] [CrossRef] [PubMed] [Green Version]
  3. Pacyna, E.G.; Pacyna, J.M.; Fudala, J.; Strzelecka-Jastrzab, E.; Hlawiczka, S.; Panasiuk, D.; Nitter, S.; Pregger, T.; Pfeiffer, H.; Friedrich, R. Current and future emissions of selected heavy metals to the atmosphere from anthropogenic sources in Europe. Atmos. Environ. 2007, 41, 8557–8566. [Google Scholar] [CrossRef]
  4. De Vleeschouwer, F.; Le Roux, G.; Shotyk, W. Peat as an archive of atmospheric pollution and environmental change : A case study of lead in Europe. PAGES Mag. 2010, 18, 20–22. [Google Scholar] [CrossRef]
  5. Shotyk, W.; Weiss, D.; Appleby, P.G.; Cheburkin, A.K.; Frei, R.; Gloor, M.; Kramers, J.D.; Reese, S.; Van Der Knaap, W.O. History of atmospheric lead deposition since 12,370 14C yr BP recorded in a peat bog profile, Jura Mountains, Switzerland. Science 1998, 281, 1635–1640. [Google Scholar] [CrossRef] [PubMed]
  6. Komárek, M.; Ettler, V.; Chrastny, V.; Mihaljevic, M. Lead isotopes in environmental sciences: A review. Environ. Int. 2008, 34, 562–577. [Google Scholar] [CrossRef] [PubMed]
  7. Nriagu, J.O. Tales Told in Lead. Science 1998, 281, 1622–1623. [Google Scholar] [CrossRef]
  8. Doe, B.R. Lead Isotopes; Springer: New York, NY, USA, 1970; p. 137. [Google Scholar]
  9. Allan, M.; Fagel, N.; Van Rampelbergh, M.; Baldini, J.; Riotte, J.; Cheng, H.; Edwards, R.L.; Gillikin, D.; Quinif, Y.; Verheyden, S. Lead concentrations and isotope ratios in speleothems as proxies for atmospheric metal pollution since the industrial revolution. Chem. Geol. 2015, 401, 140–150. [Google Scholar] [CrossRef] [Green Version]
  10. Klaminder, J.; Renberg, I.; Bindler, R. Isotopic trends and background fluxes of atmospheric lead in northern Europe: Analysis of three ombrotrophic bogs from Sweden. Glob. Biogeochem. Cycles 2003, 17, 1019–1028. [Google Scholar] [CrossRef]
  11. Ferrat, M.; Weiss, D.J.; Dong, S.; Large, D.J.; Spiro, B.; Sun, Y.; Gallagher, K. Lead atmospheric deposition rates and isotopic trends in Asian dust during the last 9.5 kyr recorded in an ombrotrophic peat bog on the eastern Qinghai–Tibetan Plateau. Geochim. Cosmochim. Acta 2012, 82, 4–22. [Google Scholar] [CrossRef]
  12. Dunlap, C.E.; Steinnes, E.; Flegal, A.R. A synthesis of lead isotopes in two millennia of European air. Earth Planet. Sci. Lett. 1999, 167, 81–88. [Google Scholar] [CrossRef]
  13. Kylander, M.E.; Weiss, D.J.; Martinez Cortizas, A.; Spiro, B.; Garcia-Sanchez, R.; Coles, B.J. Refining the preindustrial atmospheric Pb isotope evolution curve in Europe using an 8000 year old peat core from NW Spain. Earth Planet. Sci. Lett. 2005, 240, 467–485. [Google Scholar] [CrossRef]
  14. Hong, S.; Candelone, J.P.; Patterson, C.C.; Bouton, C.F. Greenland Ice Evidence of Hemispheric Lead Pollution Two Millennia Ago by Greek and Roman Civilization. Science 1994, 265, 1841–1843. [Google Scholar] [CrossRef] [PubMed]
  15. Fagel, N.; Lechenault, M.; Fontaine, F.; Pleuger, E.; Otten, J.; Allan, M.; Ghilardi, M.; Mattielli, N.; GoiraN, J.P. Record of human activities in the Pb isotopes signatures of coastal sediments from the Roman archaeological site of Cala Francese, Cape Corsica (France). J. Archaeol. Sci. 2017, 12, 770–781. [Google Scholar] [CrossRef]
  16. Renberg, I.; Brannvall, M.L.; Bindler, R.; Emteryd, O. Atmospheric lead pollution history during four millennia (2000 BC to 2000 AD) in Sweden. Ambio 2000, 29, 150–156. [Google Scholar] [CrossRef]
  17. Martínez, C.A.; López-Merino, L.; Bindler, R.; Mighall, T.; Kylander, M. Early atmospheric metal pollution provides evidence for Chalcolithic/Bronze Age mining and metallurgy in Southwestern Europe. Sci. Total Environ. 2016, 545–546, 398–406. [Google Scholar] [CrossRef] [PubMed] [Green Version]
  18. Settle, D.; Patterson, C.C. Lead in Albacore: Guide to lead pollution in Americans. Science 1980, 207, 1167–1176. [Google Scholar] [CrossRef] [PubMed]
  19. Brännvall, M.L.; Bindler, R.; Emteryd, O.; Renberg, I. Four thousand years of atmospheric lead pollution in northern Europe: A summary from Swedish lake sediments. J. Paleolimnol. 2001, 25, 421–435. [Google Scholar] [CrossRef]
  20. Mighall, T.M.; Timberlake, S.; Foster, I.D.L.; Krupp, E.; Singh, S. Ancient copper and lead pollution records from a raised bog complex in Central Wales. J. Archaeol. Sci. 2009, 36, 1504–1515. [Google Scholar] [CrossRef]
  21. Nriagu, J.O. Occupational exposure to lead in ancient times. Sci. Total Environ. 1983, 31, 105–116. [Google Scholar] [CrossRef]
  22. Véron, A.; Goiran, J.P.; Morhange, C.; Marriner, N.; Empereur, J.Y. Pollutant lead reveals the pre-Hellenistic occupation and ancient growth of Alexandria, Egypt. Geophys. Res. Lett. 2006, 33, 1–4. [Google Scholar] [CrossRef]
  23. Damman, A.W.H. Hydrology, development, and biochemistry of ombrogenous peat bogs with special reference to nutrient relocation in a western Newfoundland bog. Can. J. Bot. 1986, 64, 384–394. [Google Scholar] [CrossRef]
  24. Shotyk, W.; Cheburkin, K.; Appleby, P.G.; Fankhauser, A.; Kramers, J.D. Two thousand years of atmospheric arsenic, antimony, and lead deposition recorded in an ombrotrophic peat bog profile, Jura Mountains, Switzerland. Earth Planet. Sci. Lett. 1996, 145, E1–E7. [Google Scholar] [CrossRef]
  25. Martinez-Cortizas, A.; Pontevedra-Pombal, X.; Novoa-Munoz, J.C.; Garcia-Rodeja, E. Four thousand years of atmospheric Pb, Cd and Zn deposition recorded by the ombrotrophic peat bog of Penido Vello (Northwestern Spain). Water Air Soil Pollut. 1997, 100, 387–403. [Google Scholar] [CrossRef]
  26. Farmer, J.G.; Anderson, P.; Cloy, J.M.; Graham, M.C.; MacKenzie, A.B.; Cook, G.T. Historical accumulation rates of mercury in four Scottish ombrotrophic peat bogs over the past 2000 years. Sci. Total Environ. 2009, 407, 5578–5588. [Google Scholar] [CrossRef] [PubMed]
  27. Shotyk, W. The chronology of anthropogenic, atmospheric Pb deposition recorded by peat cores in three minerogenic peat deposits from Switzerland. Sci Total Environ. 2002, 292, 19–31. [Google Scholar] [CrossRef]
  28. Shotyk, W.; Goodsite, M.E.; Roos-Barraclough, F.; Frei, R.; Heinemeier, J.; Asmund, G.; Lohse, C.; Hansen, T.S. Anthropogenic contributions to atmospheric Hg, Pb and As accumulation recorded by peat cores from southern Greenland and Denmark dated using the 14C “bomb pulse curve”. Geochim. Cosmochim. Acta 2003, 67, 3991–4011. [Google Scholar]
  29. Vile, M.A.; Wieder, R.K.; Novak, M. Mobility of Pb in Sphagnum-derived peat. Biogeochemistry 1999, 45, 35–52. [Google Scholar] [CrossRef]
  30. Weiss, D.; Shotyk, W.; Kramers, J.D.; Gloor, M. Sphagnum mosses as archives of recent and past atmospheric lead deposition in Switzerland. Atmos. Environ. 1999, 33, 3751–3763. [Google Scholar]
  31. Rausch, N.; Ukonmaanaho, L.; Nieminen, T.; Krachler, M.; Shotyk, W. Porewater evidence of metal (Cu, Ni, Co, Zn, Cd) mobilization in an acidic, ombrotrophic bog impacted by a smelter, Harjavalta, Finland and comparison with reference sites. Environ. Sci. Technol. 2005, 39, 8207–8213. [Google Scholar] [CrossRef] [PubMed]
  32. Rausch, N.; Nieminen, T.; Ukonmaanaho, L.; Le Roux, G.; Krachler, M.; Cheburkin, A.K.; Bonani, G.; Shotyk, W. Comparison of atmospheric deposition of copper, nickel, cobalt, zinc and cadmium recorded by Finnish peat cores with monitoring data and emission records. Environ. Sci. Technol. 2005, 39, 5989–5998. [Google Scholar] [CrossRef] [PubMed]
  33. Damman, A.W.H. Distribution and movement of elements in ombrotrophic peat bogs. Oikos 1978, 30, 480–495. [Google Scholar] [CrossRef]
  34. Shotyk, W.; Kempter, H.; Krachler, M.; Zaccone, C. Stable (206Pb, 207Pb, 208Pb) and radioactive (210Pb) lead isotopes in 1 year of growth of Sphagnum moss from four ombrotrophic bogs in southern Germany: Geochemical significance and environmental implications. Geochim. Cosmochim. Acta 2015, 163, 101–125. [Google Scholar] [CrossRef]
  35. Shotyk, W.; Weiss, D.; Kramers, J.D.; Frei, R.; Cheburkin, A.K.; Gloor, M.; Reese, S. Geochemistry of the peat bog at Etang de la Gruère, Jura Mountains, Switzerland, and its record of atmospheric Pb and lithogenic trace metals (Sc, Ti, Y, Zr, and REE) since 12,370 14C yr BP. Geochim. Cosmochim. Acta 2001, 65, 2337–2360. [Google Scholar] [CrossRef]
  36. Weiss, D.; Shotyk, W.; Boyle, A.E.; Kramers, D.J.; Appleby, P.G.; Cheburkin, A.K. Comparative study of the temporal evolution of atmospheric lead deposition in Scotland and eastern Canada using blanket peat bog. Sci. Total Environ. 2002, 292, 7–18. [Google Scholar] [CrossRef]
  37. Farmer, J.G.; Eades, L.J.; Atkins, H.; Chamberlain, D.F. Historical trends in the lead isotopic composition of archival Sphagnum mosses from Scotland (1838–2000). Environ. Sci. Technol. 2002, 36, 152–157. [Google Scholar] [CrossRef] [PubMed]
  38. Le Roux, G.; Aubert, D.; Stille, P.; Krachler, M.; Kober, B.; Cheburkin, A.; Bonani, G.; Shotyk, W. Recent atmospheric Pb deposition at a rural site in southern Germany assessed using a peat core and snowpack, and comparison with other archives. Atmos. Environ. 2005, 39, 6790–6801. [Google Scholar] [CrossRef] [Green Version]
  39. Olid, C.; Garcia-Orellana, J.; Martínez-Cortizas, A.; Masqué, P.; Peiteado-Varela, E.; Sanchez-Cabeza, J.A. Multiple site study of recent atmospheric metal (Pb, Zn and Cu) deposition in the NW Iberian Peninsula using peat cores. Sci. Total Environ. 2010, 408, 5540–5549. [Google Scholar] [CrossRef] [PubMed]
  40. Remy, H. Monographie archéologique Commune de Vielsalm. In Glain et Salm Haute Ardenne-Vielsalm; Haute Ardenne: Vielsalm, Belgique, 1981; pp. 44–69. (In French) [Google Scholar]
  41. Damblon, F. Les dépôts tourbeux et l’histoire de la végétation sur le plateau des Hautes Fagnes (Belgique). Ann. Soc. Géol. Belg. 1994, 117, 259–276. [Google Scholar]
  42. De l’or en Ardenne; L. Grailet: Tongres, Belgique, 1998; 112p. (In French)
  43. De Vleeschouwer, F.; Gerard, L.; Goormaghtigh, C.; Mattielli, N.; Le Roux, G.; Fagel, N. Atmospheric lead and heavy metal pollution records from a Belgian peat bog spanning the last two millennia: Human impact on a regional to global scale. Sci. Total Environ. 2007, 377, 282–295. [Google Scholar] [CrossRef] [PubMed] [Green Version]
  44. Renson, V.; Fagel, N.; Mattielli, N.; Nekrassoff, S.; Streel, M.; De Vleeschouwer, F. Roman road pollution assessed by elemental and lead isotope geochemistry in East Belgium. Appl. Geochem. 2008, 23, 3253–3266. [Google Scholar] [CrossRef] [Green Version]
  45. Streel, M.; Renson, V.; Fagel, N.; Nekrassoff, S.; De Vleeschouwer, F. La route pavée au travers des tourbières de la fagne des Wez (via Mansuerisca?) est-elle romaine ou mérovingienne? La vérité est-elle ...à mi-chemin? Hautes Fagnes 2005, 259, 20–25. (In French) [Google Scholar]
  46. Cauuet, B. Les mines d’or antiques d'Europe hors péninsule Ibérique. État des connaissances et travaux récents, Mines et métallurgies dans l'Antiquité. Etat des recherches-Dossier thématique. Pallas 2005, 67, 241–291. (In French) [Google Scholar]
  47. Renson, V. Apport de la géochimie élémentaire et des isotopes du plomb à l'étude d'un site d'intérêt archéologique situé dans une tourbière des Hautes Fagnes. Master’s Thesis, University of Liège, Wallonia, Belgium, July 2005. (In French). [Google Scholar]
  48. Streel, M.; Renson, V.; De Vleeschouwer, F. Palynological and geochemical data in peat sediments alongside an old (Roman or Merovingian) paved road in the Hautes-Fagnes. In Recent Advances in Palynology; Carnets de Géologie: Brest, France, 2007; pp. 53–58. [Google Scholar]
  49. Kempter, H. Der Verlauf des anthropogenen elementeintrags in Regenwassermoore des westlichen Mitteleuropas während des jüngeren Holozäns. Paläoklimaforschung 1996, 26, 309. (In German) [Google Scholar]
  50. Gérard, L. Suivi des apports atmosphériques en plomb au cours de l’Holocène. Bachelor’s Thesis, University of Liège, Wallonia, Belgium, July 2004. (In French). [Google Scholar]
  51. Goormaghtigh, C. Suivi des apports atmosphériques en métaux lourds durant la période Subatlantique (depuis 850 ans), dans un milieu continental pollué: enregistrement de deux tourboères des Hautes Fagnes (Belgique). Bachelor’s Thesis, University of Liège, Wallonia, Belgium, July 2005. (In French). [Google Scholar]
  52. Sonk, J.E.; Hoogewerff, J.A.; Van, D.L.; Sieger, R.; Vangronsveld, J. A chemical and mineralogical reconstruction of Zn-smelter emissions in the Kempen region (Belgium), based on organic pool sediment cores. Sci. Total Environ. 2002, 292, 101–109. [Google Scholar] [CrossRef]
  53. Verniers, J.; Herbosch, A.; Vanguestaine, M.; Geukens, F.; Delcambre, B.; Pingot, J.L.; Belanger, I.; Hennebert, M.; Debacker, T.N.; Sintubin, M.; et al. Cambrian-Ordovician- Silurian lithostratigraphic units (Belgium). Geolog. Belg. 2001, 4, 5–38. [Google Scholar]
  54. Bourgignon, P. Associations mine´ralogiques des limons et argiles des hautes-Fagnes. Ann. Soc. Geol. Belg. 1953, 77B, 39–59. [Google Scholar]
  55. Wastiaux, C.; Schumacker, R. Topographie de surface et de subsurface des zones tourbeuses des réserves naturelles domaniales des Hautes-Fagnes. Convention C60 entre le Ministère de la Région Wallonne; Direction générale des Ressources naturelles et de l’Environnement, et l’Université de Lièg: Liège, Belgique, 2003. (In French) [Google Scholar]
  56. Deru, X. Die Römer an Maas und Mosel; Mainz am Rhein, Verlag Philipp von Zabern: Darmstadt, Germany, 2010; p. 136. (In German) [Google Scholar]
  57. Belokopytov, I.E.; Veresnevich, V.V. Giktorf’s peat borers. Torf. Prom. 1955, 8, 9–10. [Google Scholar]
  58. Givelet, N.; Le Roux, G.; Cheburkin, A.; Chen, B.; Frank, J.; Goodsite, M.; Kempter, H.; Krachler, M.; Noernberg, T.; Rausch, N.; et al. Suggested protocol for collecting, handling and preparing peat cores and peat samples for physical, chemical, mineralogical and isotopic analyses. J. Environ. Monit. 2004, 6, 481–492. [Google Scholar] [CrossRef] [PubMed]
  59. Allan, M.; Loader, N.J.; Gillikin, D.P.; Lenoir, G.; Verheyden, S.; Crucifix, M.; Piotrowska, N.; Sikorski, J.; Fagel, N. Reconstruction of mid-late Holocene climate in NW Europe from high-resolution peat cellulose stable isotope records. J. Quat. Sci. 2018. submitted for publication. [Google Scholar]
  60. Allan, M.; Le Roux, G.; Piotrowska, N.; Beghin, J.; Javaux, E.; Court- Picon, M.; Mattielli, N.; Verheyden, S.; Fagel, N. Mid and late Holocene dust deposition in western Europe: The Misten peat bog (Hautes Fagnes–Belgium). Clim. Past 2013, 9, 2889–2928. [Google Scholar] [CrossRef]
  61. Fagel, N.; Allan, M.; Le Roux, G.; Mattielli, N.; Piotrowska, N.; Sikorski, J. Deciphering human-climate interactions in an ombrotrophic peat record: REE, Nd and Pb isotope signatures of dust supplies over the last 2500 years (Misten bog, Belgium). Geochim. Cosmochim. Acta 2014, 135, 288–306. [Google Scholar] [CrossRef] [Green Version]
  62. De Vleeschouwer, F.; van Vliët-Lanoé, B.; Fagel, N.; Richter, T.; Boës, X. Development and application of high-resolution petrography on resin-impregnated Holocene peat columns to detect and analyse tephras, cryptotephras, and other materials. Quat. Int. 2008, 178, 54–67. [Google Scholar] [CrossRef] [Green Version]
  63. Boës, X.; Piotrowska, N.; Fagel, N. Highresolution diatom/clay record in Lake Baikal from grey scale, and magnetic susceptibility over Holocene and Termination I. Glob. Planet. Chang. 2005, 46, 299–313. [Google Scholar] [CrossRef]
  64. Thirlwall, M.F. Multicollector ICP-MS analysis of Pb isotopes using a 207Pb-204Pb double spike demonstrates up to 400 ppm/amu systematic errors in Tlnormalization. Chem. Geol. 2002, 184, 255–279. [Google Scholar] [CrossRef]
  65. Kempter, H.; Gorres, M.; Frenzel, B. Ti and Pb concentrations in rainwater-fed bogs in Europe as indicators of past anthropogenic activities. Water Air Soil Pollut. 1997, 100, 367–377. [Google Scholar] [CrossRef]
  66. Shotyk, W.; Blaser, P.; Grünig, A.; Cheburkin, A.K. A new approach for quantifying cumulative, anthropogenic, atmospheric lead deposition using peat cores from bogs: Pb in eight Swiss peat bog profiles. Sci. Total Environ. 2000, 249, 281–295. [Google Scholar] [CrossRef]
  67. Martinez, C.A.; Peiteado, V.E.; Bindler, R.; Biester, H.; Cheburkin, A. Reconstructing historical Pb and Hg pollution in NW Spain using multiple cores from the Chao de Lamoso bog (Xistral Mountains). Geochim. Cosmochim. Acta 2012, 82, 68–78. [Google Scholar] [CrossRef]
  68. Bindler, R.; Klarqvist, M.; Klaminder, J.; Förster, J. Does within-bog spatial variability of mercury and lead constrain reconstructions of absolute deposition rates from single peat records? The example of Store Moss, Sweden. Glob. Biogeochem. Cycles 2004, 18, GB3020. [Google Scholar] [CrossRef]
  69. Allan, M.; Le Roux, G.; Sonke, J.E.; De Vleeschouwer, F.; Piotrowska, N.; Sikorski, J.; Streel, M.; Fagel, N. Historical record of atmospheric mercury deposition in Western Europe: The Misten peat bog (Hautes Fagnes–Belgium). Sci. Total Environ. 2013, 442, 290–301. [Google Scholar] [CrossRef] [PubMed] [Green Version]
  70. Brannvall, M.L.; Bindler, R.; Emteryd, O.; Nilsson, M.; Renberg, I. Stable lead isotopes and concentration records of atmospheric lead pollution in peat and lake sediments in Sweden. Water Air Soil Pollut. 1997, 100, 243–252. [Google Scholar] [CrossRef]
  71. Cauet, S.W.D.; Herbosh, A. Genetic study of Belgian lead zinc mineralizations in carbonate environments through lead isotope geochemistry. Bull. BRGM 1982, 3, 29–41. [Google Scholar]
  72. Dejonghe, L. Zinc-lead deposits of Belgium. Ore Geol. Rev. 1998, 12, 329–354. [Google Scholar] [CrossRef]
  73. Durali-Mueller, S.; Brey, G.P.; Wigg-Wolf, D.; Lahaye, Y. Roman lead mining in Germany: Its origin and development through time deduced from lead isotope provenance studies. J. Archaeol. Sci. 2007, 34, 1555–1567. [Google Scholar] [CrossRef]
  74. Bollhöfer, A.; Rosman, K.J.R. Lead isotopic ratios in European atmospheric aerosols. Phys. Chem. Earth. Part B Hydrol. Oceans Atmos. 2001, 26, 835–838. [Google Scholar] [CrossRef]
  75. Millot, R.; Allègre, C.-J.; Gaillardet, J.; Roy, S. Lead isotopic systematics of major river sediments: A new estimate of the Pb isotopic composition of the Upper Continental Crust. Chem. Geol. 2004, 203, 75–90. [Google Scholar] [CrossRef]
  76. Cloy, J.M.; Farmer, J.G.; Graham, M.C.; MacKenzie, A.B.; Cook, G.T. Historical records of atmospheric Pb deposition in four Scottish ombrotrophic peat bogs: An isotopic comparison with other records from western Europe and Greenland, Global Biogeochem. Cycles 2008, 22, GB2016. [Google Scholar] [CrossRef]
  77. Meharg, A.A.; Edwards, K.J.; Schofield, J.E.; Raab, A.; Feldmann, J.; Moran, A.; Bryant, C.L.; Thornton, B.; Dawson, J.J.C. First comprehensive peat depositional records for tin, lead and copper associated with the antiquity of Europe’s largest cassiterite deposits. J. Archaeol. Sci. 2012, 39, 717–727. [Google Scholar] [CrossRef]
  78. Mariet, A.L.; Monna, F.; Gimbert, F.; Bégeot, C.; Cloquet, C.; Belle, S.; Millet, L.; Rius, D.; Water-Simonnet, A.V. Tracking past mining activity using trace metals, lead isotopes and compositional data analysis of a sediment core from Longemer Lake, Vosges Mountains, France. J. Paleolimnol. 2018, 1–14. [Google Scholar] [CrossRef]
  79. Bindler, R.; Renberg, I.; Rydberg, J.; Andrén, T. Widespread waterborne pollution in central Swedish lakes and the Baltic Sea from pre-industrial mining and metallurgy. Environ. Pollut. 2009, 157, 2132–2141. [Google Scholar] [CrossRef] [PubMed]
  80. Brännvall, M.-L.; Bindler, R.; Renberg, I.; Emteryd, O.; Bartnicki, J.; Billström, K. The medieval metal industry was the cradle of modern large-scale atmospheric lead pollution in northern Europe. Environ. Sci. Technol. 1999, 33, 4391–4395. [Google Scholar]
  81. More, A.F.; Spauling, N.E.; Bohleber, P.; Handley, M.J.; Hoffman, H.; Korotkikh, E.V.; Kurbatov, A.V.; Loveluck, C.P.; Sneed, S.B.; McCormick, M.; Mayewski, P.A. Next-generation ice core technology reveals true minimum natural levels of lead (Pb) in the atmosphere: Insights from the Black Death. GEO Health 2017, 1, 211–219. [Google Scholar] [CrossRef] [Green Version]
  82. Osterberg, E.; Mayewski, P.; Kreutz, K.; Fisher, D.; Handley, M.; Sneed, S.; Zdanowicz, C.; Zheng, J.; Demuth, M.; Waskiewicz, M.; et al. Ice core record of rising lead pollution in the North Pacific atmosphere. Geophys. Res. Lett. 2008, 35, L05810. [Google Scholar] [CrossRef]
  83. Shirahata, H.; Elias, R.W.; Patterson, C.C. Chronological variations in concentrations and isotopic compositions of anthropogenic atmospheric lead in sediments of a remote alpine pond. Geochim. Cosmochim. Acta 1980, 44, 149–162. [Google Scholar] [CrossRef]
  84. Martinez, C.A.; López-Merino, L.; Bindler, R.; Mighall, T.; Kylander, M. Atmospheric Pb pollution in N Iberia during the late Iron Age/Roman times reconstructed using the high-resolution record of La Molina (Asturias, Spain). J. Paleolimnol. 2013, 50, 71–86. [Google Scholar] [CrossRef]
Figure 1. (A) Localisation of Belgium as a part of Gallia Belgica (northern France, western Germany, southern Netherlands and Belgium) (after Deru [56]), (B) Location map of the Hautes Fagnes Plateau and the Pb-Zn ores of E-Belgium (modified from De Vleeschouwer et al. [43]), (C,D) Radar derived peat thickness of the Clefaye and Misten bogs (modified after Wastiaux and Schumacker [55]). Coring location is reported by the red circle.
Atmosphere 09 00253 g001
Figure 2. Evolution of density, elemental concentrations (Al, Ti, Sc and Pb), and radiogenic isotope 207Pb/206Pb ratios versus age and depth in CLE and MIS cores. Light lines indicate elemental concentrations and dark lines represent mean concentrations values.
Atmosphere 09 00253 g002
Figure 3. Summary of Pb concentration, EFPb, and calculated Pb AR (in mg m−2 yr−1) for CLE and MIS cores. The yellow zone corresponds to the zenith Roman Empire.
Atmosphere 09 00253 g003
Figure 4. Evolution of 206Pb/207Pb ratios in CLE and MIS core samples versus 1/[Pb].
Atmosphere 09 00253 g004
Figure 5. (A) Binary diagram 206Pb/207Pb vs 208Pb/206Pb. Benelux modern from Bollhöfer and Rosman [74]. Belgian ores and Pb-Zn ores from the Verviers Synclinorium from Cauet and Herbosh [71] and Dejonghe [72]. German ores from Durali-Mueller et al. [73]. Belgian pre-industrial background from this study and De Vleeschouwer et al. [43] and upper continental crust from Millot et al. [75]. (B) Plot of 206Pb/207Pb vs 208Pb/206Pb ratios for Roman samples recorded from CLE and MIS cores and European Pb ores [76].
Atmosphere 09 00253 g005
Figure 6. Pb concentrations and 206Pb/207Pb ratio record from: A. Belgian peat cores for the period from 500 BC to AD 500 [44], B. NW Spain peat core [13], C. England peat cores [1,77], D. French lake sediments [78], E. Swedish lake sediments [79,80], F. Suiss ice core [81], G. Canadian ice core [82]. The historical production of lead (H) during Roman period [14].Yellow zone corresponds to zenith Roman Empire.
Atmosphere 09 00253 g006
Table 1. Pb isotope data of the CLE and MIS cores measured MC-ICP-MS. * correspond to duplicate analyses.
CoreDepth (cm)208/204±2se207/204±2se206/204±2se208/206±2se206/207±2se
CLE3838.02800.002115.60240.000818.04470.00082.10740.000041.15650.00001
38 *38.02810.002015.60230.000718.04510.00092.10740.000031.15660.00001
9238.35930.002315.62180.000918.38440.00092.08660.000041.17680.00001
92 *38.36380.001815.62320.000618.38630.00072.08650.000041.17680.00001
17038.40820.001915.62780.000718.41040.00072.08620.000041.17810.00001
170 *38.40660.001815.62770.000618.40960.00072.08620.000051.17800.00001
17238.40150.002615.62630.001018.41100.00102.08580.000051.17820.00002
17438.39740.002015.62700.000718.40550.00092.08620.000041.17780.00001
17638.38660.002415.62550.000918.39910.00102.08640.000051.17750.00001
17838.37620.001915.62330.000818.39300.00092.08640.000041.17730.00001
18038.37020.001415.62160.000618.38990.00072.08650.000041.17720.00001
18238.37190.002215.62310.001018.38840.00102.08670.000041.17700.00001
182 *38.37290.001715.62350.000718.38910.00072.08670.000041.17700.00001
18438.36240.002115.62280.000818.37900.00082.08730.000041.17640.00001
18738.37480.002215.62340.000818.38630.00092.08720.000041.17680.00001
18938.37480.002415.62470.000818.38550.00102.08730.000041.17670.00001
19338.43290.002315.63250.000818.40320.00092.08840.000041.17720.00001
19538.48580.001515.63850.000518.42690.00072.08860.000041.17830.00001
195 *38.48400.001715.63810.000618.42590.00062.08860.000041.17830.00001
19738.52940.001615.64500.000618.45330.00062.08790.000041.17950.00001
200 *38.53060.001915.64250.000718.46810.00072.08630.000041.18060.00001
20038.53270.001615.64320.000618.46860.00062.08640.000041.18060.00001
22038.44920.001915.63840.000718.49080.00082.07940.000041.18240.00001
41238.80490.002515.67620.000918.97300.00112.04530.000051.21030.00002
MIS69.938.486630.0018615.635280.0008318.505780.000922.079720.000041.183590.00001
76.538.565190.0018415.644180.0008218.570750.000882.076690.000051.187080.00001
78.738.547590.0033215.639860.0014118.565030.001582.076360.000041.187030.00001
83.138.611250.0022815.647270.0009118.616420.000972.074070.000041.189740.00001
8838.57530.002415.64110.000918.59090.00112.07500.000051.18860.00002
11038.26570.002415.61090.000818.31120.00102.08970.000041.17300.00001
12038.34710.001815.61680.000818.38520.00092.08580.000041.17730.00001
13138.36940.001915.62390.000718.38730.00072.08670.000041.17690.00001
13438.36840.002615.62360.000918.38510.00102.08690.000041.17680.00001
13538.29480.002115.61650.000818.32410.00082.08990.000041.17340.00001
13838.37190.002315.62320.000918.38650.00092.08700.000041.17690.00001
14638.37160.002015.62190.000818.38860.00092.08670.000041.17710.00001
17038.50860.001915.63940.000818.46580.00092.08540.000051.18070.00001

