Article

From Tropospheric Folding to Khamsin and Foehn Winds: How Atmospheric Dynamics Advanced a Record-Breaking Dust Episode in Crete

1
IAASARS, National Observatory of Athens, 15236 Athens, Greece
2
Chemistry Department, University of Crete, Crete, 71003 Heraklion, Greece
3
IERSD, National Observatory of Athens, 15236 Athens, Greece
4
Physikalisch-Meteorologisches Observatorium Davos, World Radiation Center, Dorfstrasse 33, CH-7260 Davos Dorf, Switzerland
5
Met Office, FitzRoy Road, Exeter EX1 3PB, UK
6
Laboratory of Climatology and Atmospheric Environment, National and Kapodistrian University of Athens, 15784 Athens, Greece
7
National Institute of R&D for Optoelectronics, 409 Atomiştilor Str., Magurele RO-77125, România
*
Author to whom correspondence should be addressed.
Atmosphere 2018, 9(7), 240; https://doi.org/10.3390/atmos9070240
Submission received: 21 May 2018 / Revised: 18 June 2018 / Accepted: 20 June 2018 / Published: 24 June 2018
(This article belongs to the Special Issue Mineral Dust: Sources, Atmospheric Processing and Impacts)

Abstract

:
A record-breaking dust episode took place in Crete on 22 March 2018. The event was characterized by surface concentrations exceeding 1 mg m−3 for a period of 4–7 h, reaching record values higher than 6 mg m−3 at the background station of Finokalia. We present here a detailed analysis of the atmospheric dynamical processes during this period, to identify the main reasons for such extreme dust advection over Crete. At the synoptic scale, the weakening of the polar vortex and the meridional transport of polar air masses at upper tropospheric layers resulted in a strong jet streak over north Africa and Central Mediterranean and corresponding tropospheric folding that brought cold stratospheric air in mid and upper troposphere. Cyclogenesis occurred at the Gulf of Sirte in Libya, resulting in strong winds over the north-east parts of Libya, enhancing particle emissions. The dust plume traveled at low altitude (0.5–3 km) along the warm conveyor belt preceding the depression cold front. This type of dusty southerly wind is commonly known as “Khamsin”. As the flow approached Crete, Foehn winds at the lee side of the island favored the downward mixing of dust towards the surface, resulting in local maxima of PM10 in Heraklion and Finokalia. The analysis is based on the combination of high-resolution WRF-Chem simulations reaching up to 1 × 1 km grid space over Crete, ground-based and satellite remote sensing of the dust plumes (PollyXT LiDAR, MSG-SEVIRI, MODIS) and detailed surface aerosol in situ measurements at urban (Heraklion, Chania, Greece) and background (Finokalia) stations in Crete.

1. Introduction

Mineral dust particles that are emitted from the desert areas in the Sahara and the Middle East travel long distances in the atmosphere and affect air quality, weather, climate and local ecosystems at the Mediterranean basin [1,2,3,4]. Dust affects the radiative transfer in the area [5,6,7], and cloud processes due to the activation of dust particles as cloud condensation nuclei (CCN) and ice nuclei (IN) [8,9]. Moreover, the ocean depositions of dust affect biogeochemical processes and phytoplankton blooming [10,11]. In terms of health impacts, increased concentrations of fine dust aerosols may cause respiratory diseases and other related health issues [12,13,14,15]. The island of Crete is very often affected by windblown dust originating from the Sahara, due to its proximity to the Africa coastline. Regarding health effects, the severity of the dust events is mainly dictated by the amounts of dust aerosol near the surface. Such conditions with increased surface PM10 of Saharan origin are more often found in Crete when the air masses originate from the nearby dust sources of Libya [16].
In general, the most crucial parameter for the emission of dust is the near-surface wind. Increased wind speeds may occur due to synoptic wind forcing, topographic effects (e.g., valley channeling), low-level jets (LLJ) [17] or squall lines and storm downdrafts [18,19]. However, most of the above processes result in detached elevated dust plumes over the Mediterranean. Most dust layers in the area are observed at heights of 4–5 km in the troposphere and are associated either with Mediterranean low-pressure systems or with the summer anticyclonic circulation over north Africa [20,21,22,23]. For the surface PM10 concentration in Crete to reach significant levels, the mesoscale circulation needs to favor transport directly from the coastal dust sources of Libya towards Crete. This type of flow is commonly known as “Khamsin” winds in Libya and Egypt and is mostly frequent during spring months [24]. Such conditions result in the generation of dense and low altitude dust clouds that travel inside the lower troposphere and can reach the south parts of Crete in less than 12 h after emission. In such cases Crete’s mountain range acts as a perpendicular barrier to the southerly winds and Foehn downslope winds may develop on the lee side of the island causing a significant downward flux. These conditions have significant implications for human health as they produce high near-surface concentrations of dust, raise surface temperatures and reduce relative humidity [25,26,27].
Such meso-γ weather phenomena are not accurately represented in global and limited area atmospheric models mainly due to the poor description of topography at meso-β and meso-α grid increment where most topographic elements are sub-grid features. Even at a grid-space of e.g., 5–10 km which is common for weather forecasting purposes, the actual resolved topography is at a scale of 4Δx [28], implying that the explicit resolving of Foehn winds would require a grid increment of 1 × 1 km or finer. In this work we investigate the weather processes from synoptic down to meso and local atmospheric scales during a record-breaking dust event that took place in March 2018 in Crete based on synergistic analysis of high-resolution modeling, remote sensing and in situ data. The study is divided in 3 sections. Section 2 includes the description of methodological and analysis tools. In Section 3 we present the main findings regarding the multi-scale atmospheric dynamics and the dust measurements during the event. Section 4 is a summary and discussion of the main findings.

2. Methodology

The methodology consists of combined observational and modeling approach, using the resources of the Greek National Research Infrastructure (RI) PANACEA (PANACEA-PANhellenic infrastructure for Atmospheric Composition and climate change), operating the national facilities of the ACTRIS RI (Aerosols, Clouds, and Trace gases Research Infrastructure: https://www.actris.eu/).

2.1. Modeling

We use the limited area model WRF-Chem in a two-way nesting configuration in order to describe the physical processes at various atmospheric scales. The grid-space for the external domain is set at 12 × 12 km. An intermediate domain at 3 × 3 km is used over Crete and the surrounding region and the inner grid is set at 1 × 1 km covering the entire island of Crete. An additional sensitivity run is also performed with a 24 × 24 km domain covering the same region as the 12 × 12 km domain. We initialize the main run at 21 March 2018, 0000 UTC and run it until 23 March 0000 UTC (T + 60). The internal 3 × 3 km and 1 × 1 km domains are activated for the period 21 March 1800 UTC–22 March 1800 UTC and 22 March 1200–1800 UTC respectively. The model is driven by initial and boundary conditions from the NCEP final analysis (FNL) dataset at 1° × 1° grid space and the sea surface temperature is also the NCEP SST at 1° × 1°. The planetary boundary layer scheme is the Mellor-Yamada-Janjic and the land properties are parameterized by the Noah Land Surface Model [29,30]. Surface heat and moisture fluxes are computed by the Monin-Obukhov-Janjic scheme [31,32]. Cloud convection is parameterized with the Grell and Devenyi [33] scheme for the two outer model grids and convective parameterization is switched off for the finest 1 × 1 km grid. The Lin et al., 1983 [34] scheme is used for the calculation of cloud microphysical properties. Radiative transfer is computed by the Rapid Radiative Transfer Model [35] for both short-wave and long-wave radiation taking also into account the effects of dust particles in radiative transfer.
The emission of dust is computed with the Air Force Weather Agency (AFWA) scheme [36,37] that follows Marticorena and Bergametti 1995 (MB95) [38] for the computation of vertical dust fluxes based on wind friction velocity, soil type and surface moisture. The MB95 dust emission scheme has been widely used and evaluated in global and limited area dust models e.g., DEAD: [39]; GEOS-Chem: [40]; SKIRON: [41,42]; RAMS: [8,18,19]. WRF-Chem includes five dust size bins with effective radii of 0.73, 1.4, 2.4, 4.5 and 8 μm. The modeled dust Aerosol Optical Depth (AOD) at 550 nm ( τ 550 ) is calculated using the corresponding column mass load of dust ( M ) and the extinction efficiencies at 550 nm ( Q e x t 550 ) of the five WRF sub-bins, as in Equation (1):
τ 550 = 1 50 3 4 ρ n r e f f n M n Q e x t 550 n
where ρ is the particle mass density, r e f f is the effective radius and n denotes the corresponding WRF sub-bin. The extinction efficiencies at 550 nm (Table 1) are calculated with Mie theory [43,44], using a refractive index of 1.55 + i0.005 for dust [45]. We consider lognormal size distributions for the sub-bins with minimum-maximum radius, effective radius and geometric standard deviations as shown in Table 1. Gravitational settling and surface deposition of dust is based on the parameterization of Wesely, 1989 [46]. Wet deposition of dust is not parameterized in these simulations; however, it is not considered important since there was no significant rainfall along the major transport path. We performed a 3 day spin up run that is considered sufficient for establishing a regional dust background and for providing the initial dust conditions for the subsequent simulations, taking also into account that the main dust event has a relatively limited geographical and temporal extent.

2.2. Remote Sensing

2.2.1. PollyXT LiDAR

The PollyXT LiDAR [47] is located in Finokalia (35°20′15.4″ N, 25°40′09.8″ E, 238 m ASL). The LiDAR is equipped with three elastic channels at 355 nm, 532 nm and 1064 nm, two rotational-vibrational Raman channels at 387 nm and 607 nm, two linear depolarization channels at 355 nm and 532 nm, and one water vapor channel at 407 nm. The combined use of its near field and far field telescopes provides reliable vertical profiles of aerosol optical properties from 0.25 km to 10 km in height.

2.2.2. MSG-SEVIRI-Dust RGB
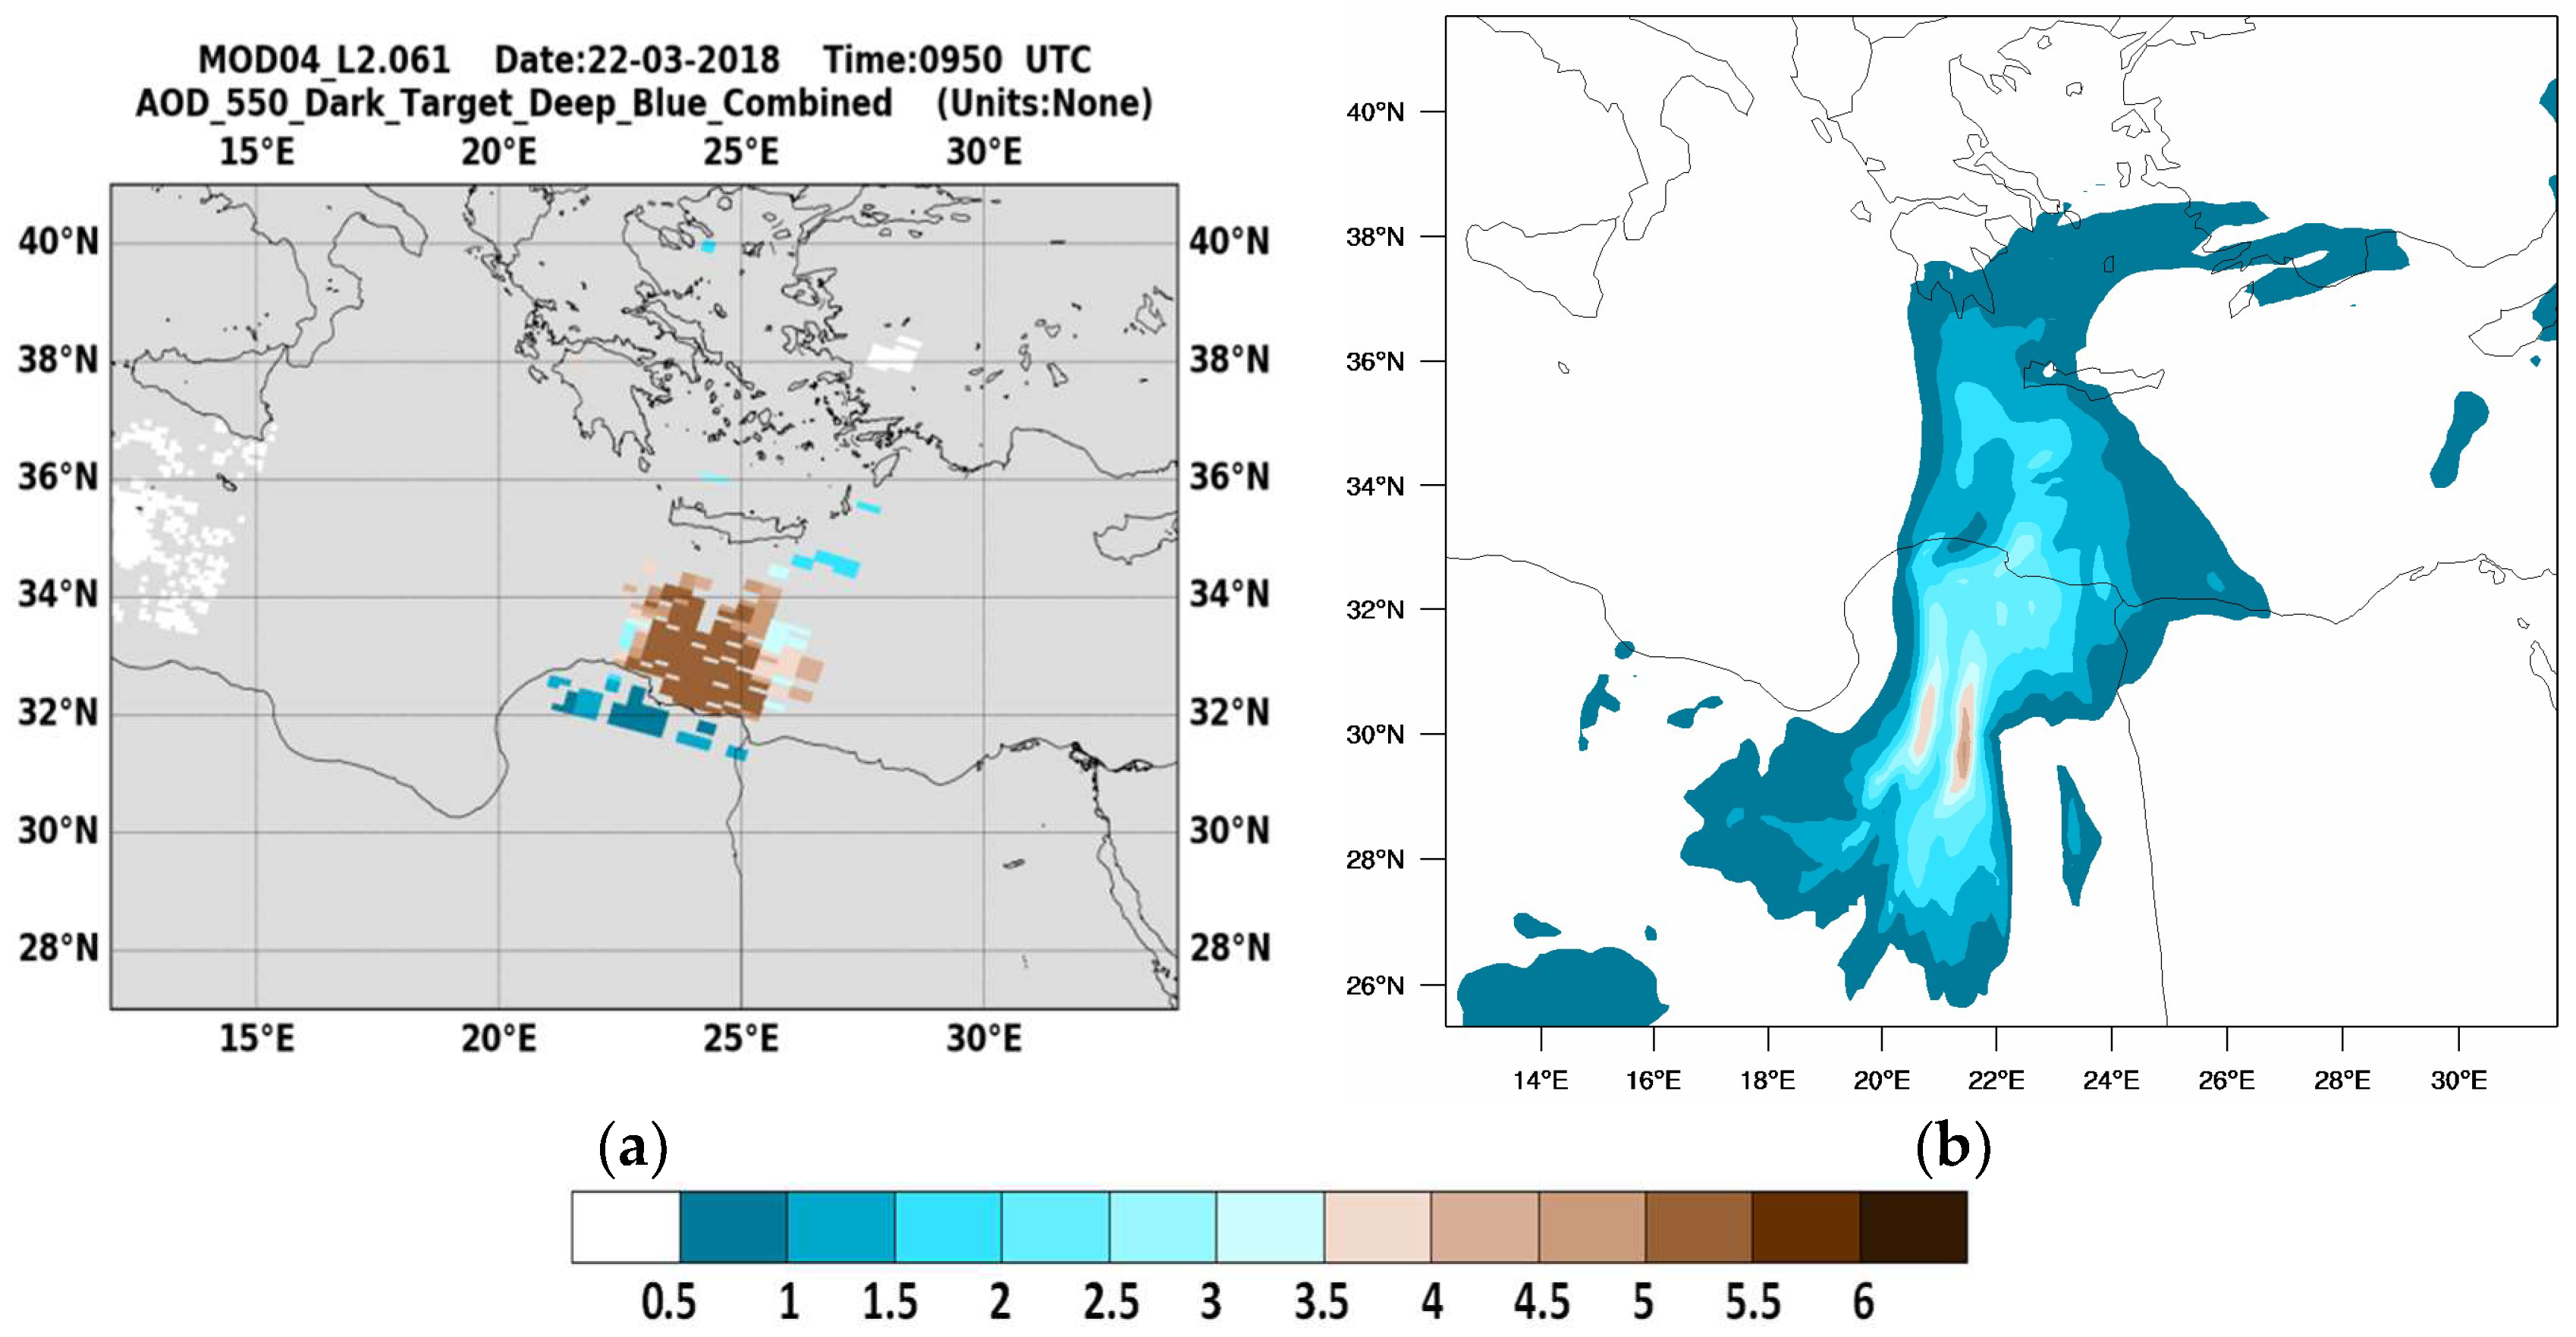
The Meteosat Second Generation (MSG) Spinning Enhanced Infrared and Visible Imager (SEVIRI) false color dust red-green-blue (RGB) imagery uses channels 7, 9 and 10 (at 8.7 µm, 10.8 µm and 12.0 µm respectively). The 12 µm and 10.8 µm channels are able to discriminate between land surface temperatures and cloud temperatures. The addition of 8.7 µm channel provides information about trace gases and aerosols. The values assigned to the Red, Green and Blue components for generating Dust RGB composite images are given in Table 2. Each of the components is scaled using the following equation:
C i s c a l e d = min ( X ) + δ X × ( C i min ( C i ) δ C i ) 1 γ i
where C i is the value for red, green and blue components; δ C i = max ( C i ) min ( C i ) for each component; X = [ 4 ,   254 ] is the color range; δ X = max ( X ) min ( X ) is the number of colors; and γ i is the respective gamma factor.
Dust RGBs have been successfully used to monitor dust and volcanic ash plumes over land and sea both during day and night. The infrared channels used in the RGB composites are sensitive to various surface and atmospheric properties—the Red and the Blue components in this case determine the presence of dust (i.e., warm with large negative BT difference between 10.8 and 12 micron channels) and therefore depicted as bright magenta (during day) or purple (during night) color over land. A dusty atmosphere can also be tracked over water as a magenta color. The SEVIRI Dust RGB imageries are commonly used as a proxy measure of dust presence in various applications; however, it is worth mentioning that interpretation of the dust signals (dark magenta) can be challenging for different meteorological situations. For example, the RGB signal can be severely suppressed by the presence of high atmospheric column water vapor [48]. Further, the RGB signal can actually be reversed, such that it appears less pink with increasing dust, in the presence of a surface/lower tropospheric temperature inversion. Additionally, dust mineralogy and dust layer height can also modulate the RGB signal to some extent. The strengths and the shortcomings of SEVIRI dust RGB images are highlighted by [48] in detail.

2.2.3. MODIS

Columnar AOD observations are obtained from the MODerate resolution Imaging Spectroradiometer (MODIS) on-board the NASA’s polar satellites Terra and Aqua since 2000 and 2002, respectively [49,50] (https://ladsweb.modaps.eosdis.nasa.gov/). In the present analysis we use the Level 2 (L2) data of the aerosol optical depth at 550 nm (AOD550nm), acquired from the latest version (Collection 6.1, C061) of the MODIS retrieval algorithm, corresponding to satellite overpasses (swaths) of five minutes time interval and their nominal spatial resolution is 10 km × 10 km at nadir. For our purposes, we have used the “combined” AOD produced via the implementation of the Dark Target (DT) algorithm applied based on different assumptions over maritime areas [51,52] and vegetated land [52,53] while above bright surfaces (i.e., deserts) and transition zones situated between arid and vegetated land areas the Deep Blue (DB; enhanced Deep Blue) approach is followed [54,55]. The merging procedure of the DT-Land, DT-Ocean and DB AOD products is described in [56]. Global evaluation studies have shown that the expected error of MODIS DT AOD550nm above sea lies between +(0.04 + 0.1τA) and −(0.02 + 0.1τA) [52] while above land the corresponding range is ±(0.05 + 0.15τA) [52,57], where τA stands for AERONET AOD. For the DB AOD, an absolute uncertainty of approximately (0.086 + 0.56τM)/AMF, where AMF is the geometric air mass factor and τM is the MODIS AOD550nm, has been reported by [58]. In contrast to SEVIRI, the frequency sampling of the MODIS spectroradiometer is lower since it flies onboard polar orbit satellites (i.e., Terra and Aqua). More specifically, AOD retrievals are available only during early morning hours (Terra satellite overpass) and late noon (Aqua satellite overpass). In addition, AOD observations are not possible over areas where clouds exist as well as in oceanic regions where the boundary reflectance is maximized (i.e., sun-glint).

2.3. In-Situ Measurements

Measurements were performed on the island of Crete at the environmental research station of the University of Crete at Finokalia (35°20′ N, 25°40′ E). Finokalia environmental research station was established in 1993 and it has been characterized as representative of the background regional conditions for the eastern Mediterranean basin [59]. The long-range transport of mineral dust from north Africa is the main reason for exceedance of the EU limit value of 50 μg m−3 (Directive 2008/50/EU) at the Finokalia station, when the air mass back trajectories originate from northern Africa [3]. Such events have taken place for around 5% of the days since 2004. Additional measurements were available at the atmospheric quality measurement station of the Region of Crete at the cities of Heraklion (35°19′ N, 25°7′ E) and Chania (32°5′ N, 20°16′ E). The PM10 measurements were performed with two identical Thermo ESM Andersen FH 62 I-R beta attenuation particulate monitors with a time resolution of 5 min [14]. Both instruments have been compared to gravimetric techniques in the past with good results [60].

3. Results

From 1993 to March 2018, the maximum surface concentration of PM10 ever observed at Finokalia was 2793 μg m−3 (recorded on 24 February 2006 with a time step of 5 min). Between 2004 and 2017, only six days with 5 min PM10 concentrations larger than 1 mg m−3 have been recorded. The mean AERosol Robotic network (AERONET), [61] aerosol optical depth (AOD) in Crete at 500 nm, was 0.19 ± 0.10 (1σ) with maximum values during April and May (0.24 ± 0.15). For the particular months the minimum Angstrom exponents are observed, with averaged value equal to 0.86.
On 22 March, Crete was affected by a particularly severe North African dust event. The advected dust plume is evident at the region between Africa coast and Crete in the daily composites of MODIS visible channel (Figure 1a,b). In the geostationary Dust RGB images of MSG-SEVIRI (Figure 1c,d) the dust plume is indicated by dark magenta colors at 1200 UTC and 1500 UTC 22 March 2018. The presence of dust was initially detected in the western parts of the island (Chania, Greece), where the phenomenon peaked at noon, with maximum recorded PM10 of 0.5 mg m−3. In the central and eastern areas (Heraklion and Finokalia), the dust concentrations also begun to increase during the morning hours of 22 March 2018. At these areas, the dust concentration increased rapidly so that at 1500 UTC in the afternoon it reached a record value of 4730 μg m−3 in Heraklion. The concentration of dust at the easternmost station (Finokalia), increased sharply in the afternoon, and at 1720 UTC a new record value for Greece was again recorded at 6340 μg m−3, exceeding the 5000 μg m−3 upper limit of the tested range reported by the instrument’s manufacturer. The average daily values recorded at Chania, Heraklion and Finokalia were 206 μg m−3, 1125 μg m−3 and 850 μg m−3 respectively.

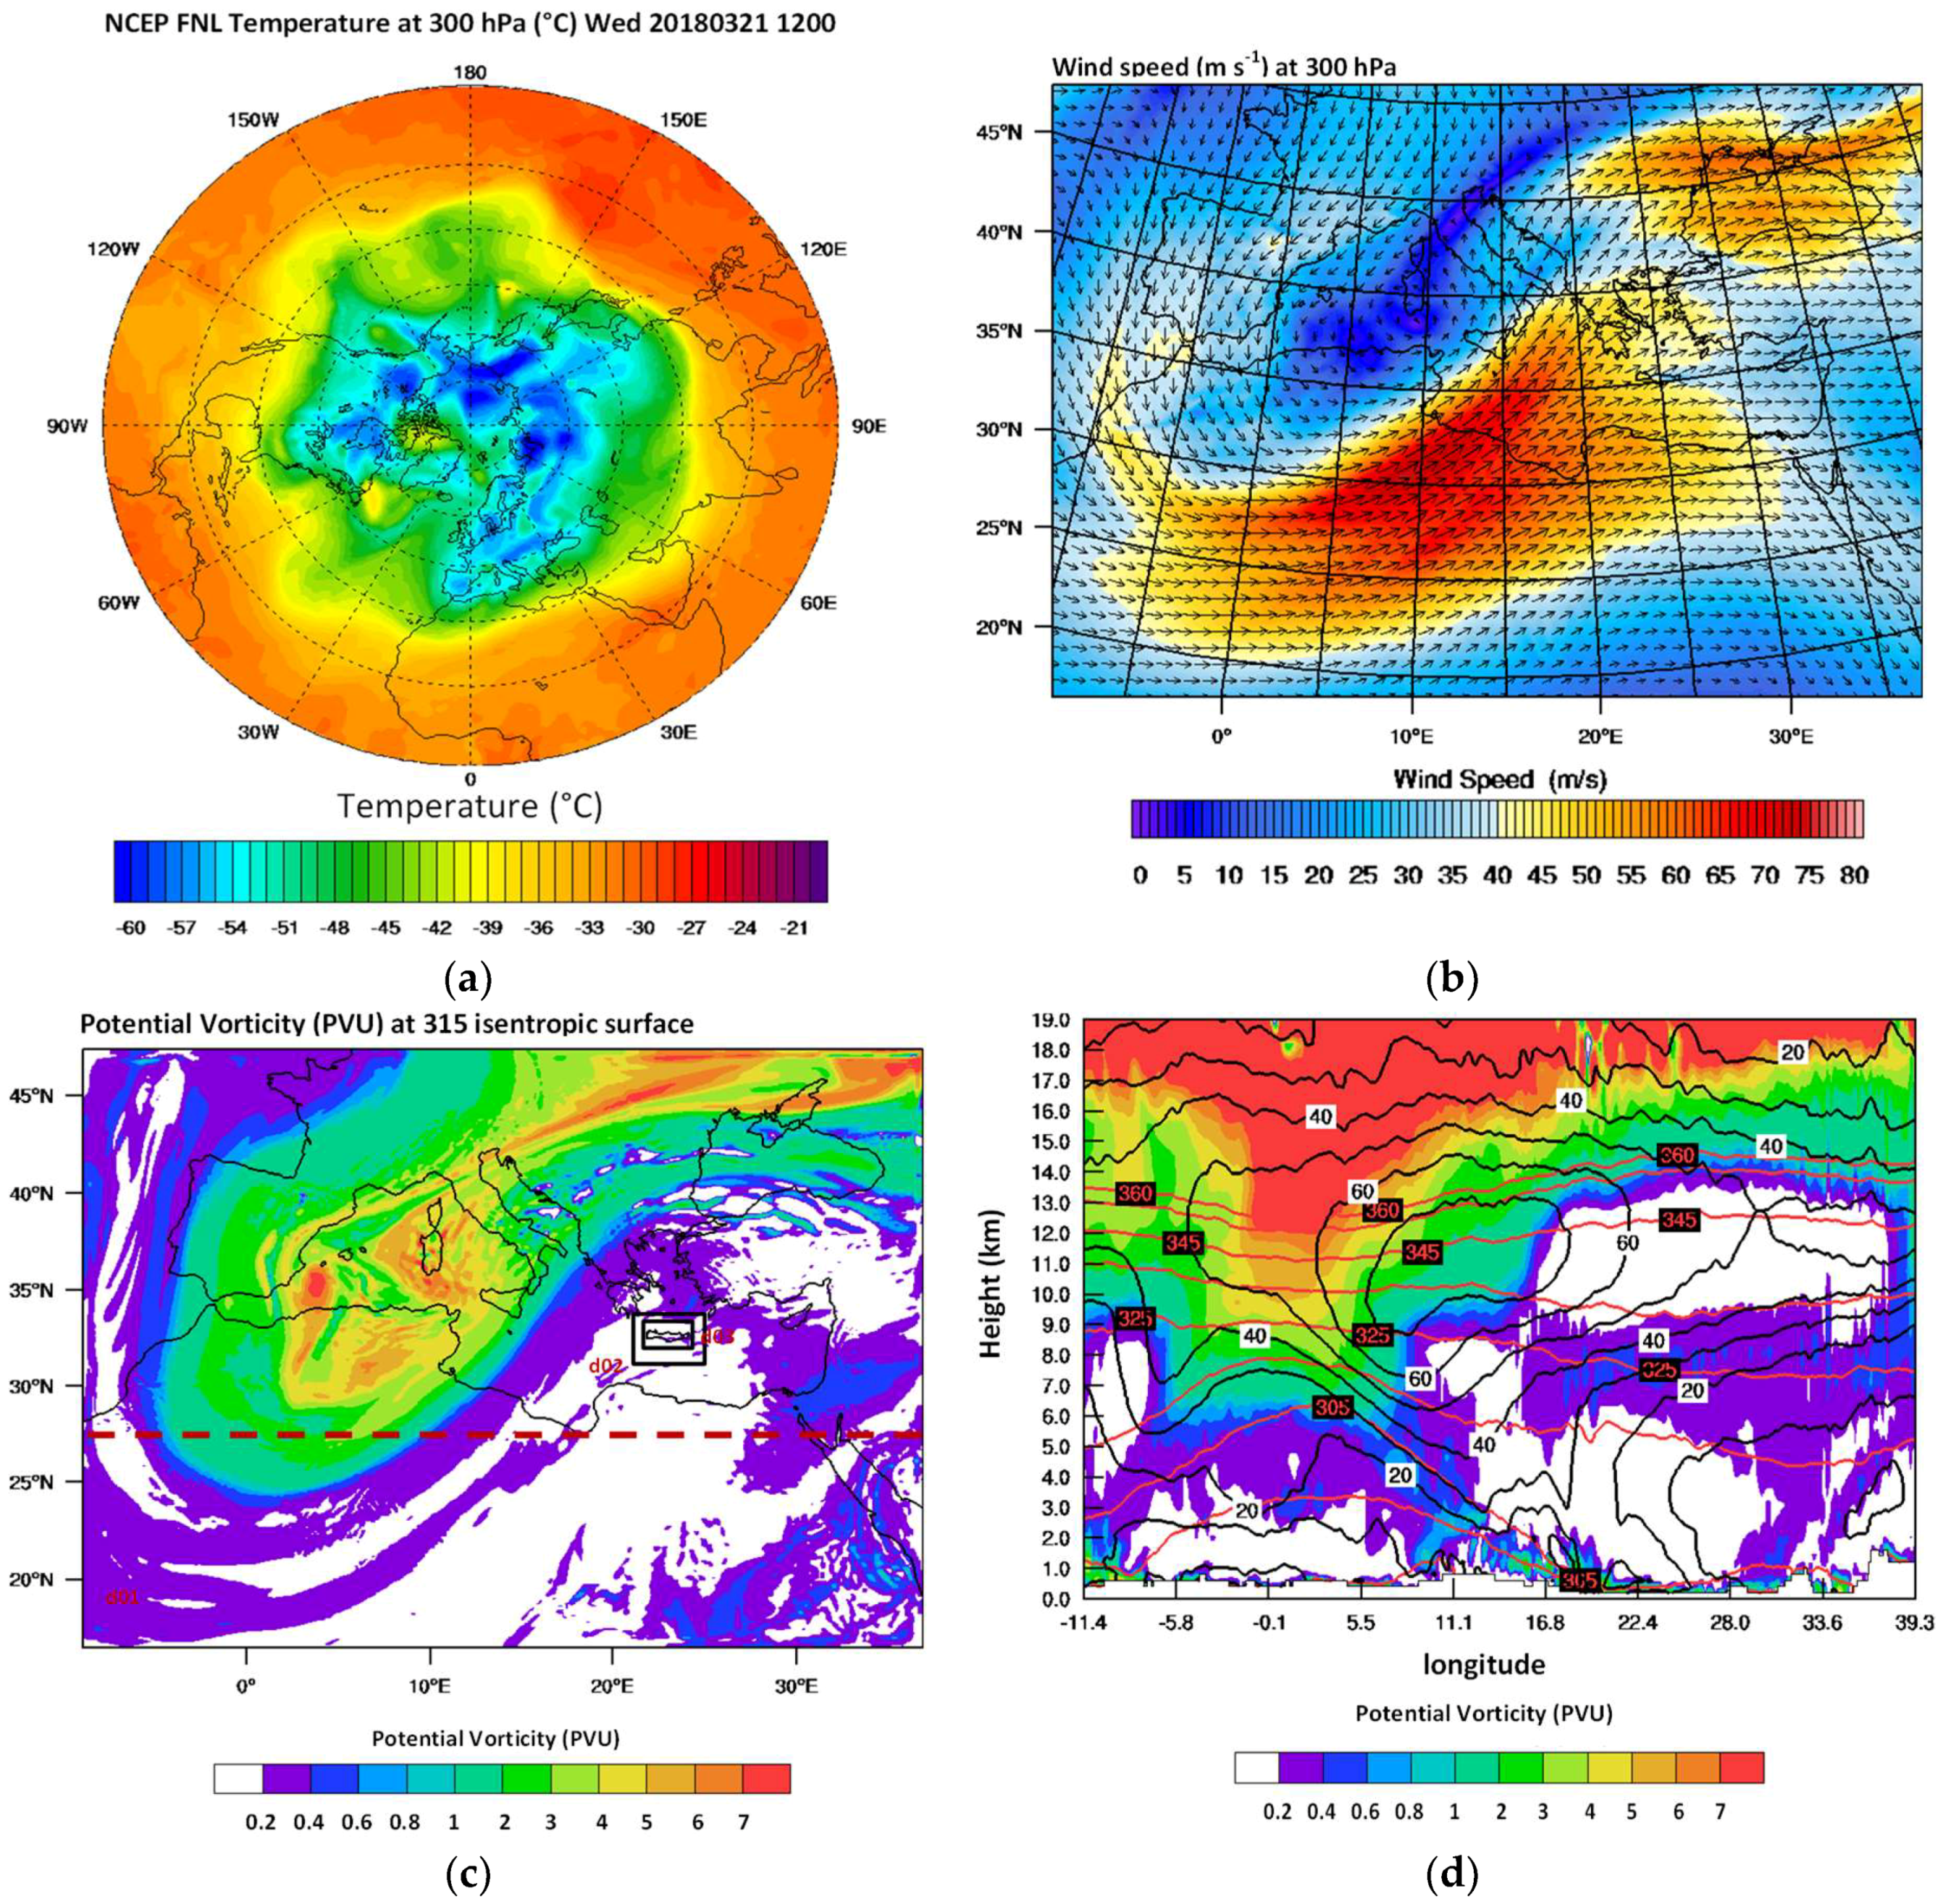
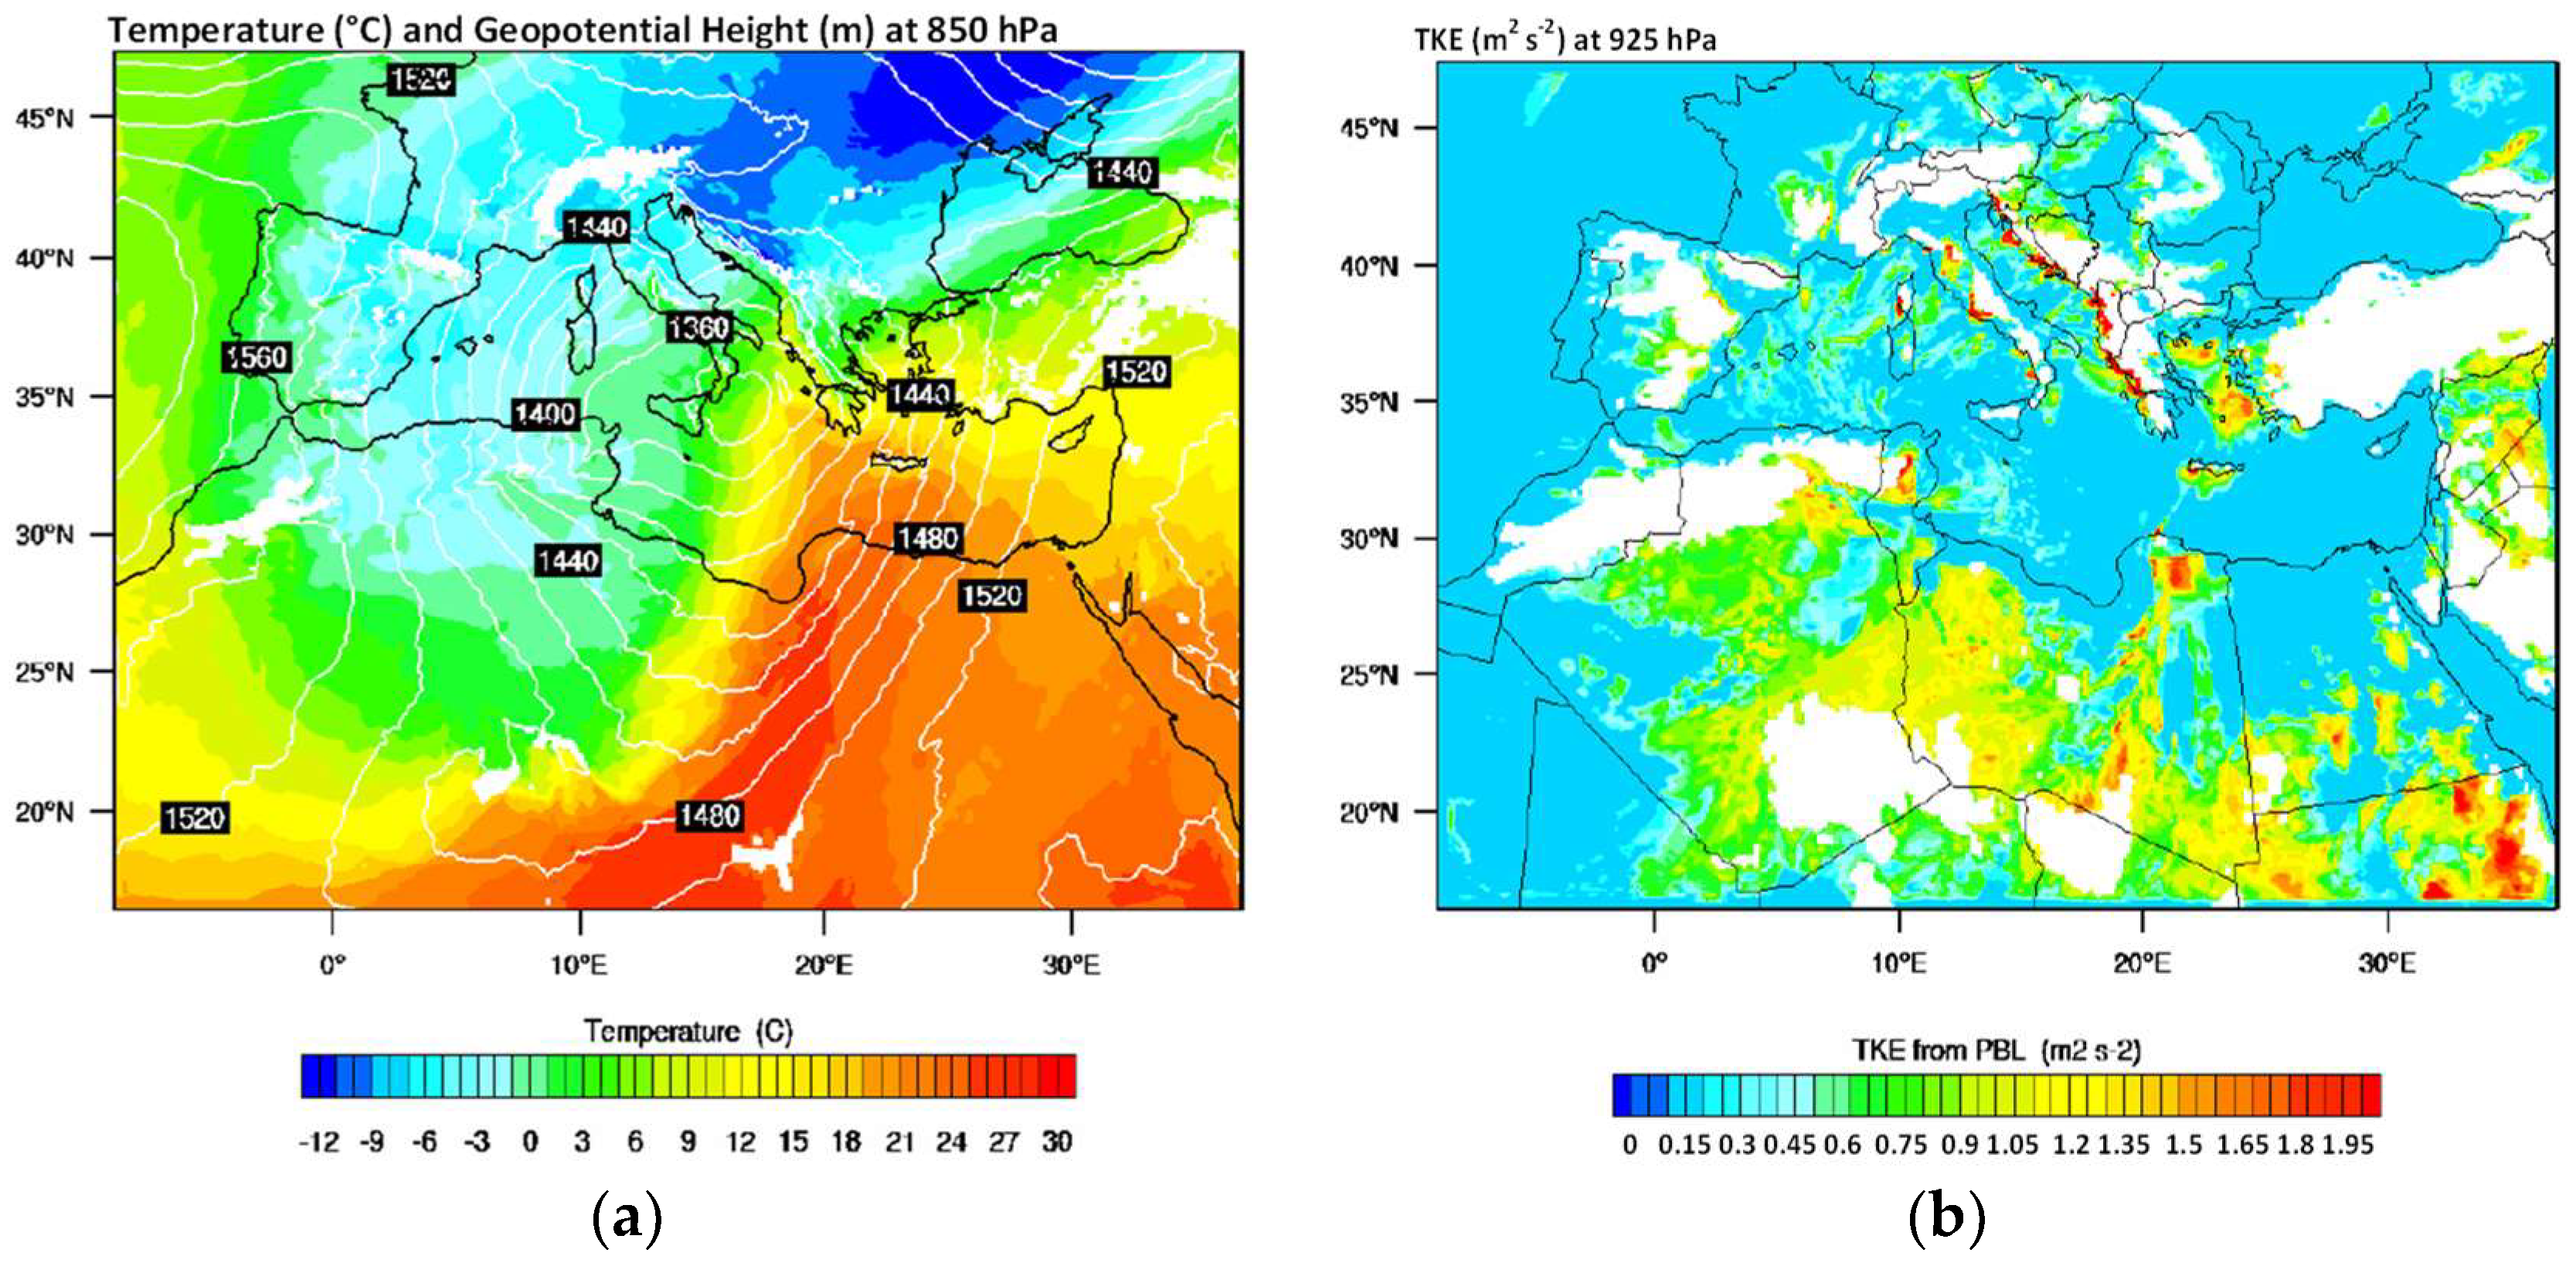
3.1. Atmospheric Dynamics
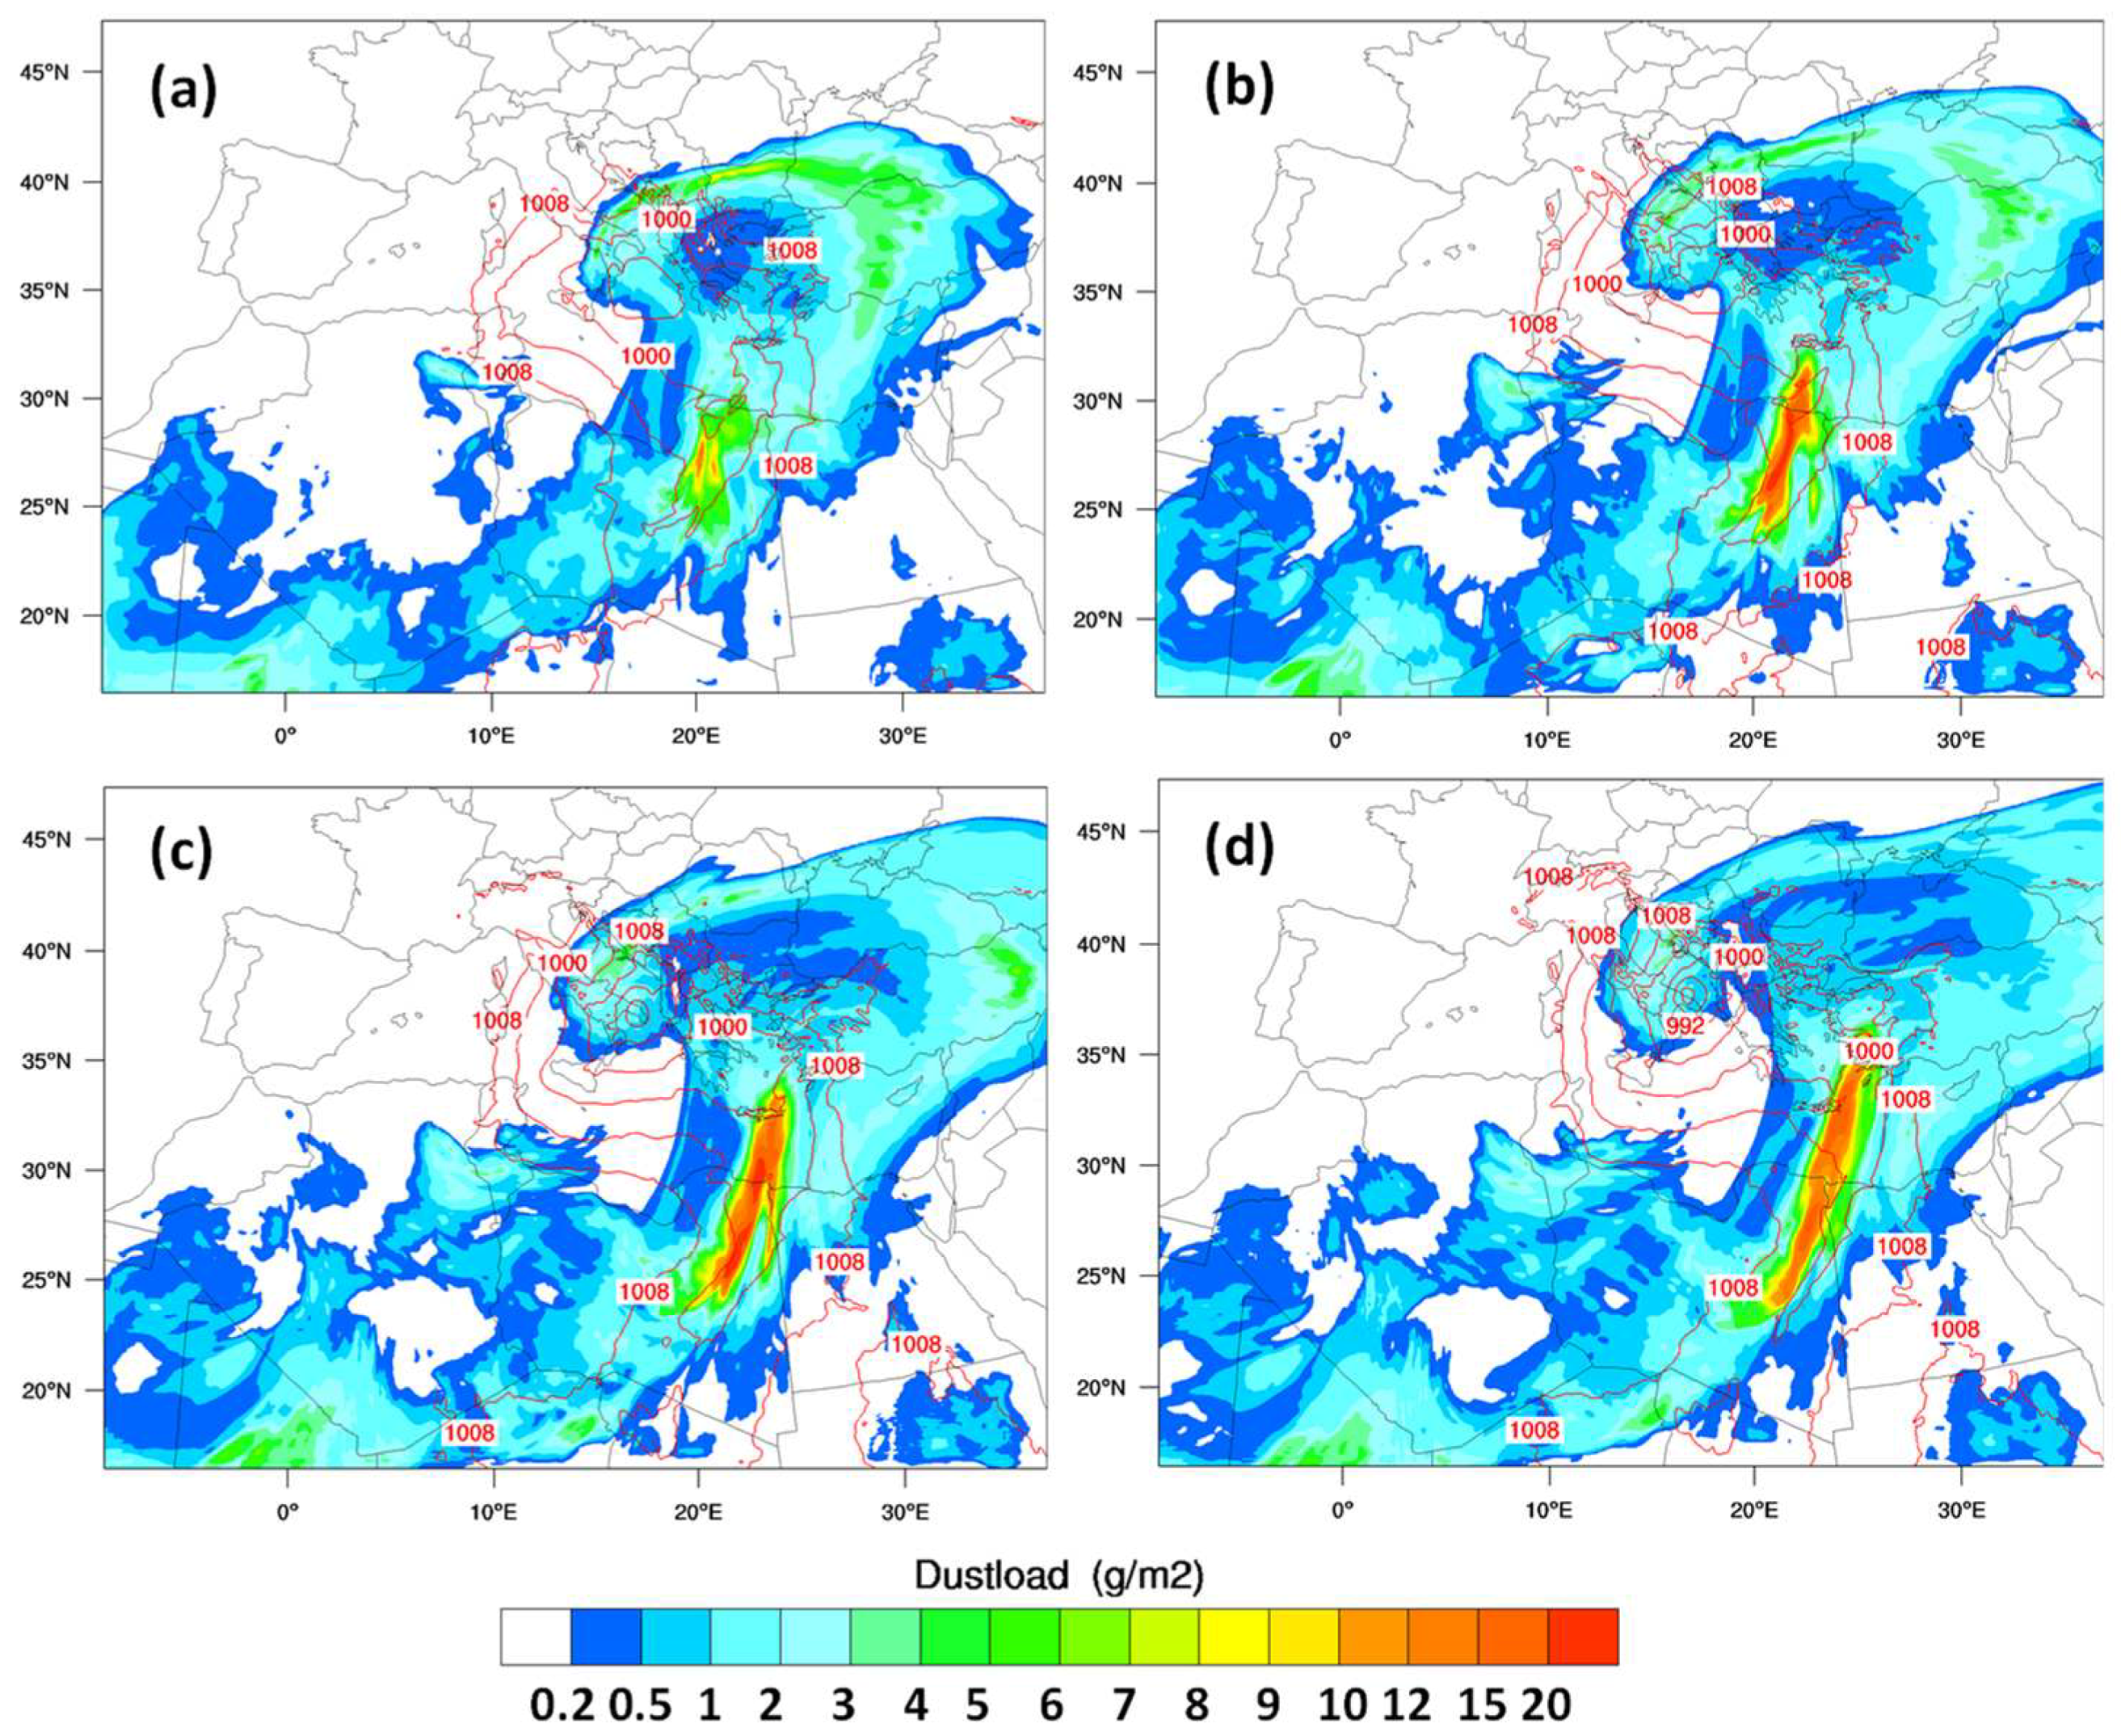
To understand the main mechanisms leading to this unusual event, we examine the major atmospheric processes taking place in the area starting from synoptic scale dynamics and moving to mesoscale and local dynamics as resolved by WRF-Chem model. At first, the weakening of the Arctic polar vortex allows the meridional transport of cold polar air towards Europe on 21 March 2018. This process is evident in the FNL analysis of 300 hPa temperature in Figure 2a. A streak of very low temperatures (lower than −50 °C) is advected across Europe and the upper level polar air mass reaches 30° N in the West Mediterranean by 1200 UTC, 21 March 2018. WRF-Chem fields from the outer 12 × 12 km grid are used in the following sections to analyze the impacts of this intrusion in atmospheric circulation. Associated with the thermal gradient there is a southwesterly 300 hPa jet streak present at 0600 UTC, 22 March 2018 with maximum wind speeds over 70 ms−1 (Figure 2b). The left exit region of the jet streak is found over the Gulf of Sirte and Central Mediterranean, denoting upper level divergence at this area. Tropospheric folding and the intrusion of stratospheric air at Mediterranean and North Africa latitudes is clearly shown by the potential vorticity (PV) and potential temperature (θ) plots in Figure 2c,d. Such PV anomalies have long been recognized as diagnostic quantities for identifying tropospheric folding in the atmosphere e.g., [62,63]. In Figure 2c the stratospheric air mass is spread southwestwards along the isentropic (iso-θ) surface of 315 K characterized by PV up to 10 PVU (1 PVU= 10−6 m2 s−1 K kg−1). Stratospheric PV (higher than 2 PVU) is evident at the poleward side of the polar jet and tropospheric PV (less than 2 PVU) is found at the equatorward side. The downward transport of momentum towards the surface is facilitated by the further equatorward penetration of the PV anomaly over north Africa interacting with the developing dry convective boundary layer during the morning hours. As shown by the West-East cross section in Figure 2d, at 0600 UTC the core of the polar jet is at around 11–12 km above 11° E (black contours higher than 70 ms−1). The upward bowing of the 305 K isentropic line west of 11° E shows the cold core structure and the low static stability at this area that allows mixing of the winds from the top of the boundary layer towards the surface. This downward mixing of high momentum and cold air mass enforces the eastward advection of the surface cold front. The structure of the eastward propagating trough is shown in Figure 3a at 850 hPa on 22 March 0600 UTC. The minimum temperatures and geopotential heights at this stage of development are −34 °C, 5400 m at 500 hPa (not shown) and −3 °C, 1340 m at 850 hPa respectively (Figure 3a). Moreover, as seen at the 850 hPa map (Figure 3a), a strong baroclinic zone extends from about 20° N, 12° E over the Sahara Desert up to the west coastline of Greece with a horizontal West-East temperature gradient of more than 15 °C between 15°–20° E. This combination of atmospheric dynamics (i.e., tropospheric folding, upper level PV-θ anomaly, baroclinic trough propagation, lower troposphere baroclinicity) is responsible for the formation and intensification of East Mediterranean cyclones and for the generation of dust storms [64,65,66,67].
Regarding dust emissions, the key factor is the enforcement of the boundary layer turbulent kinetic energy (TKE) [68]. This is evident at the 925 hPa map at 0900 UTC (Figure 3b) where the highest TKE values (up to 2 m2 s−2) are found at northeast Libya coinciding with the generation area of the dust storm in the model as shown in the following paragraphs.
The location of cyclogenesis is found on 21 March 2018, 1800 UTC over the east part of the Gulf of Sirte, as seen by the sea level pressure (slp) minimum of 1000 hPa at this area (Figure 4a). Tropospheric folding is also identified in Figure 4 by the eastward propagation of the stratospheric intrusion and the minimum tropopause heights (geopotential at 2 PVU iso-surface) over north Africa and Central Mediterranean. The depression intensifies as it moves northwards towards the Ionian Sea and reaches minimum slp of 990 hPa at the Gulf of Taranto at 1200 UTC, 22 March 2018 (Figure 4b). The location of the cold front is identified by the abrupt change in wind direction and the temperature gradient along the 15° E meridian in Figure 5a at 0600 UTC, 22 March 2018. The warm conveyor belt ahead of the cold front is actually the main driving pathway for the mobilization and transport of dust from Libya towards Crete. As seen in Figure 5b, the near-surface dust concentration exceeds 15 mg m−3 at certain frontal areas and the low-level convergence inside the warm sector actually traps the dust particles ahead of the cold front.

3.2. Dust Transport

The low-pressure system is slow moving on 22 March 2018 and the location of the conveyor belt preceding the cold front forms a high-speed pathway connecting the Sahara with Crete. This transport path is shown in Figure 6a–d at 0900, 1200, 1500 and 1800 UTC respectively, on 22 March 2018. The dust plume is constrained inside the warm sector of the depression with dust loads up to 20 g m−2 inside the core of the system (i.e., Figure 6b). The dusty Khamsin flow affects Crete between 1200–1800 UTC, 22 March 2018.

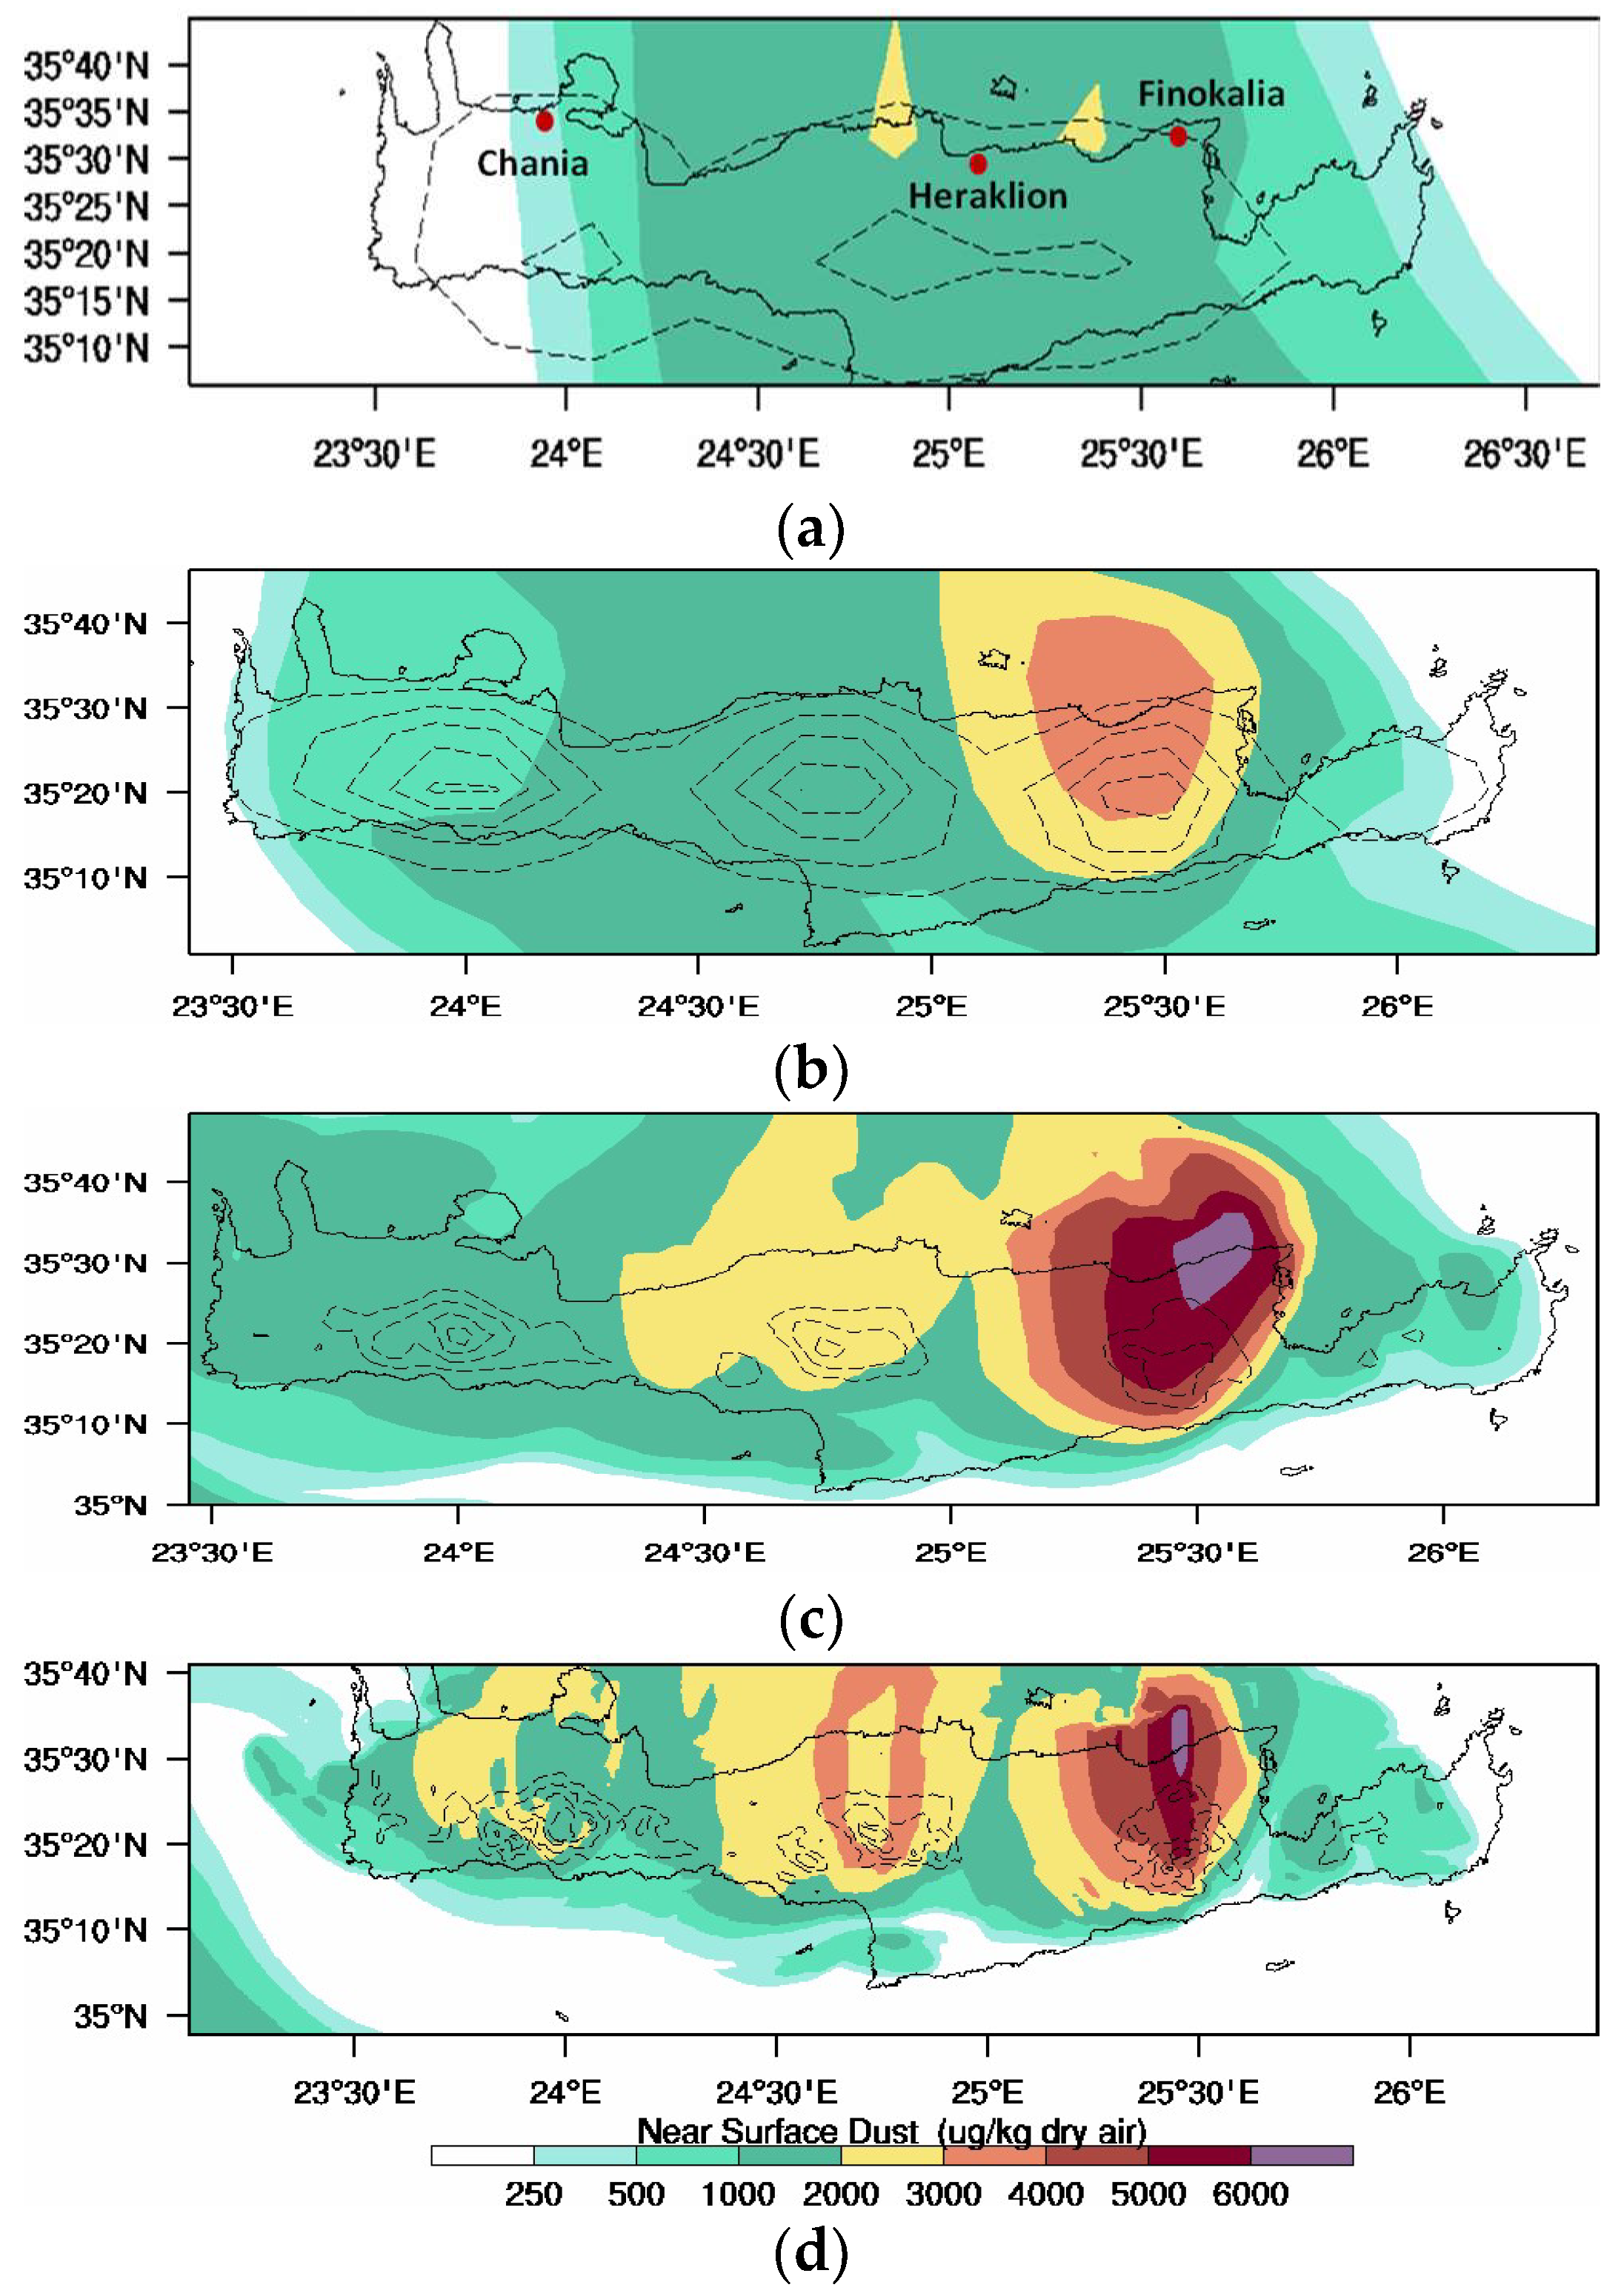
3.2.1. Dust Concentrations

The severity of the event is shown by satellite and model results in Figure 7. MODIS-Terra overpass at 0950 UTC captures an area of AOD up to 5, extending from the coast of Libya towards the cloud-covered region north of 34° N (Figure 7a). Furthermore, AOD of 5 is the maximum value in MODIS classification [69] implying that greater values could be actually present at the area. The corresponding model AOD map in Figure 7b exhibits a good spatial agreement with MODIS in dust dispersion but the maximum AOD over the sea does not exceed 3.5 implying an underestimation of the modeled optical depth with respect to MODIS. This can be attributed to an underestimation of dust emissions or to latency in dust transport since inland model values exceed 5 and during the following hours the modeled AOD over the sea exceeds 6 (not shown).
At the time when the dust plume approaches Crete, the cold front has already moved eastwards so that only the central and east parts of the island are affected by the advected dust particles (see also Figure 6). Surface concentrations in the model exceed 6000 μg m−3 especially towards the east parts of Crete and near Finokalia station (Figure 8). As seen in Figure 8d the maximum concentrations are found at the leeward side of the highest mountain ridges in Crete, suggesting a downward mixing mechanism i.e., Foehn downslope winds at these areas. This hypothesis is confirmed by the vertical model cross sections over Finokalia in Figure 9. The presence of a Foehn mechanism is identified in Figure 9a by the descending of the isentropes at the lee side of the mountain range. The low-level flow blocking produces a barrier jet and the subsequent isentropic draw down of free tropospheric air on the lee side results in downward mixing of the dusty layers increasing the near-surface concentrations up to 6000 μg m−3. The wind speeds reach up to 30 m s−1 near the surface and the adiabatic warming of the descending air mass leads to air temperatures exceeding 30 °C at the lee side and to horizontal temperature gradients of more than 10 °C between the windward and leeward ridge sides (Figure 9b).

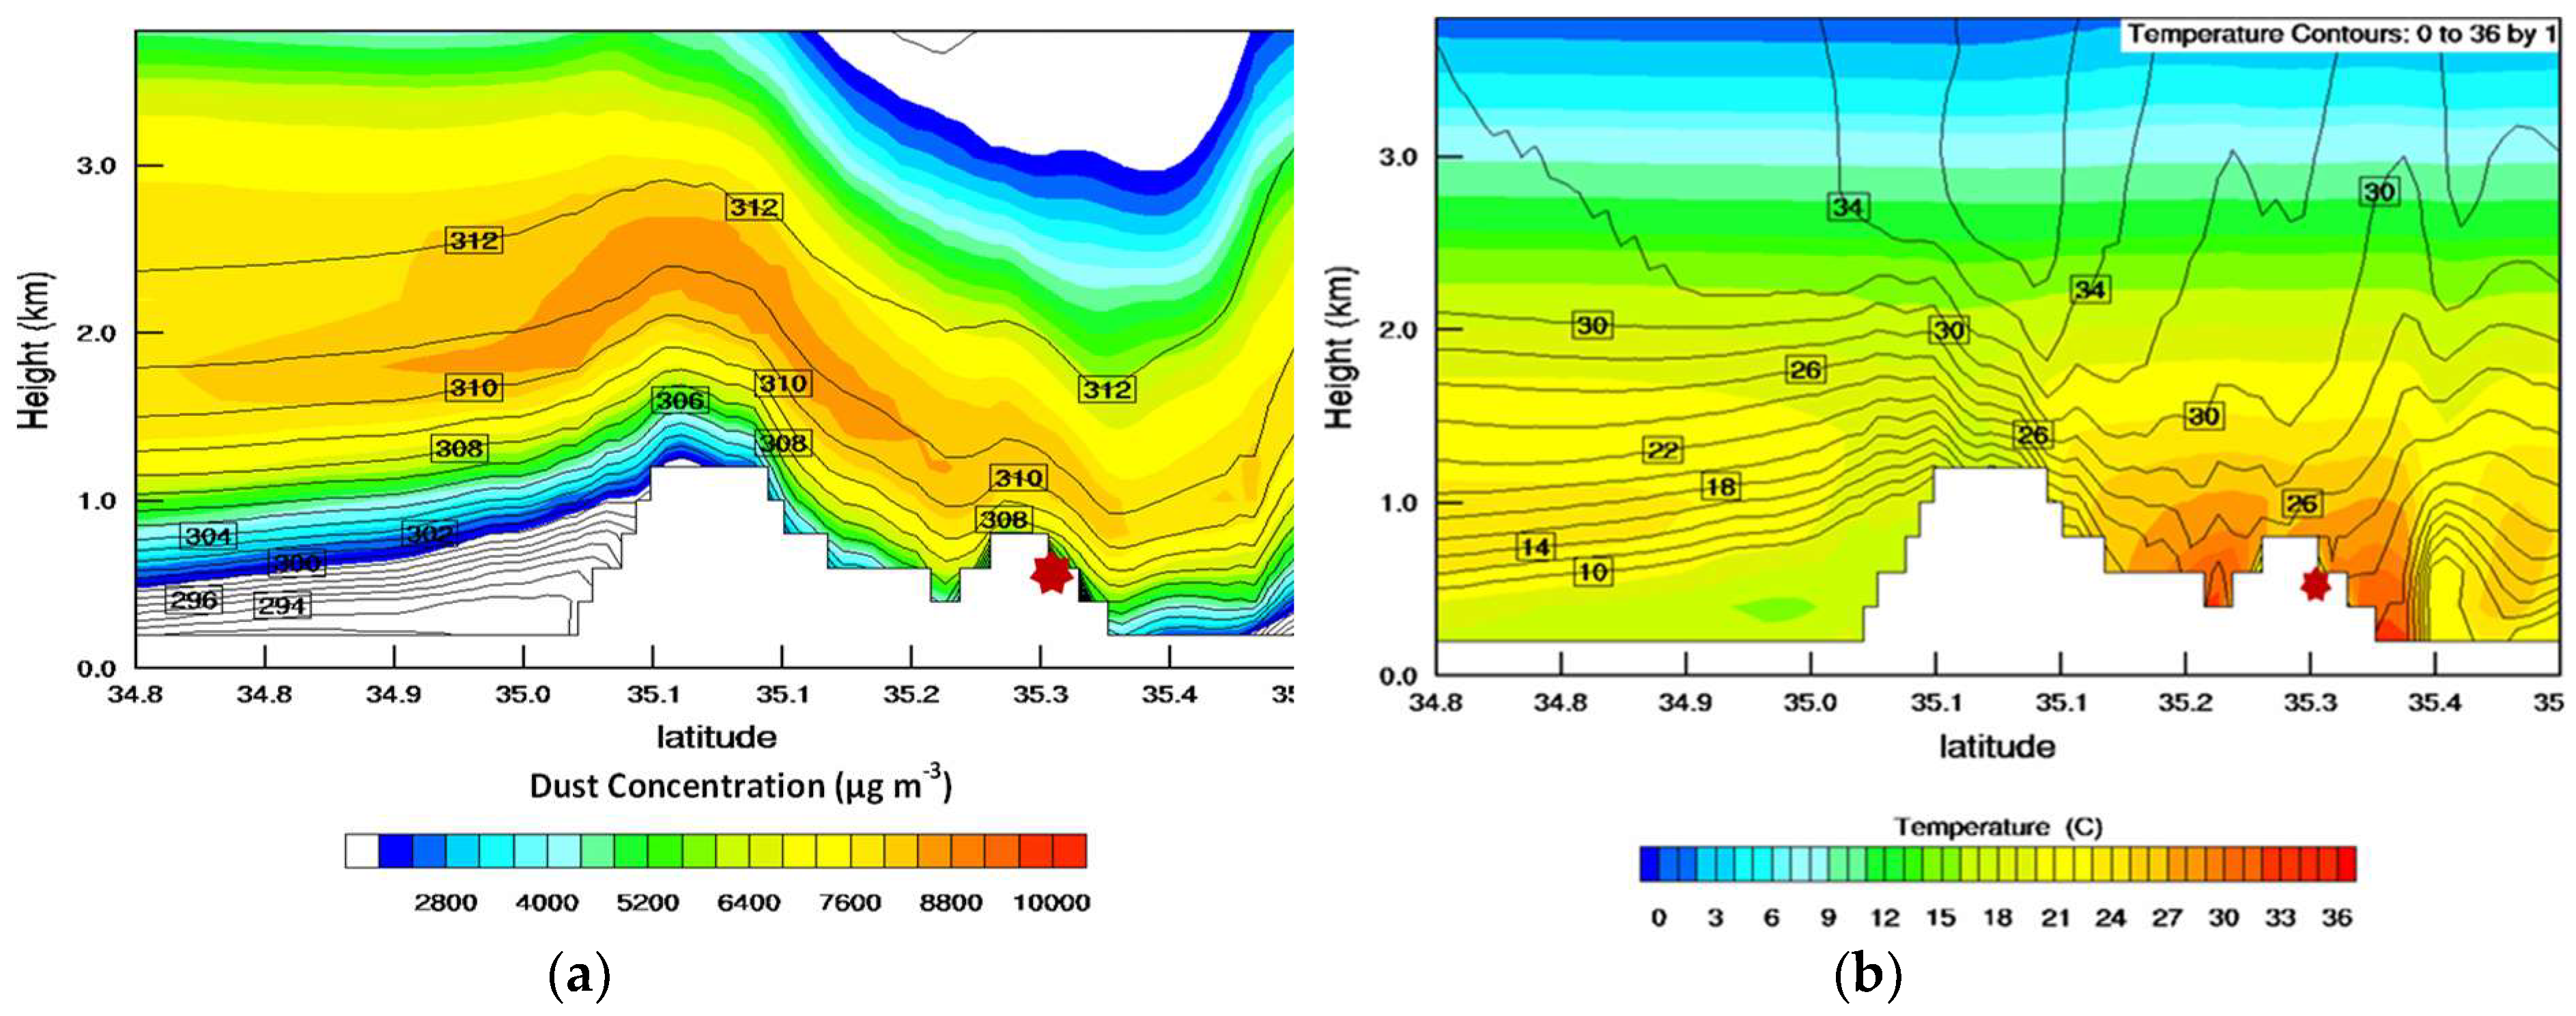
3.2.2. Effects of Model Grid Space on Resolved Dynamics

This local-scale phenomenon partially explains the poor representation of this event in operational dust models. A sensitivity experiment, shown in Figure 8, clearly displays the effects of resolved topography in modeled surface dust concentrations. Four different model runs are compared in Figure 8 with identical configuration either than model grid-space. At 24 × 24 km space (Figure 8a), the model hardly captures Crete topography with a maximum height of 400 m (when the actual highest top is at 2400 m). In this run the dust pattern is literally uninterrupted by the island and the maximum concentration hardly exceeds 2000 μg m−3. At 12 × 12 km grid space (Figure 8b), the maximum top is at 1000 m, a slight transformation of the flow is evident due to the orographic barrier and an area of maximum dust concentration exceeding 3000 μg m−3 appears at the lee side towards the eastern part of Crete. The 3 × 3 km and 1 × 1 km runs (Figure 8c,d) both resolve the Foehn mechanism and clearly present maximum concentrations at the lee sides of the mountain ridges (notice also the different topographic contours in these plots). However, the dust concentrations in the finest run are even higher than the 3 × 3 km run. These results justify the need for high-resolution simulations in order to resolve similar events over complex topography, but also raise an interesting consideration on how much more could the model improve by further increasing the grid resolution.

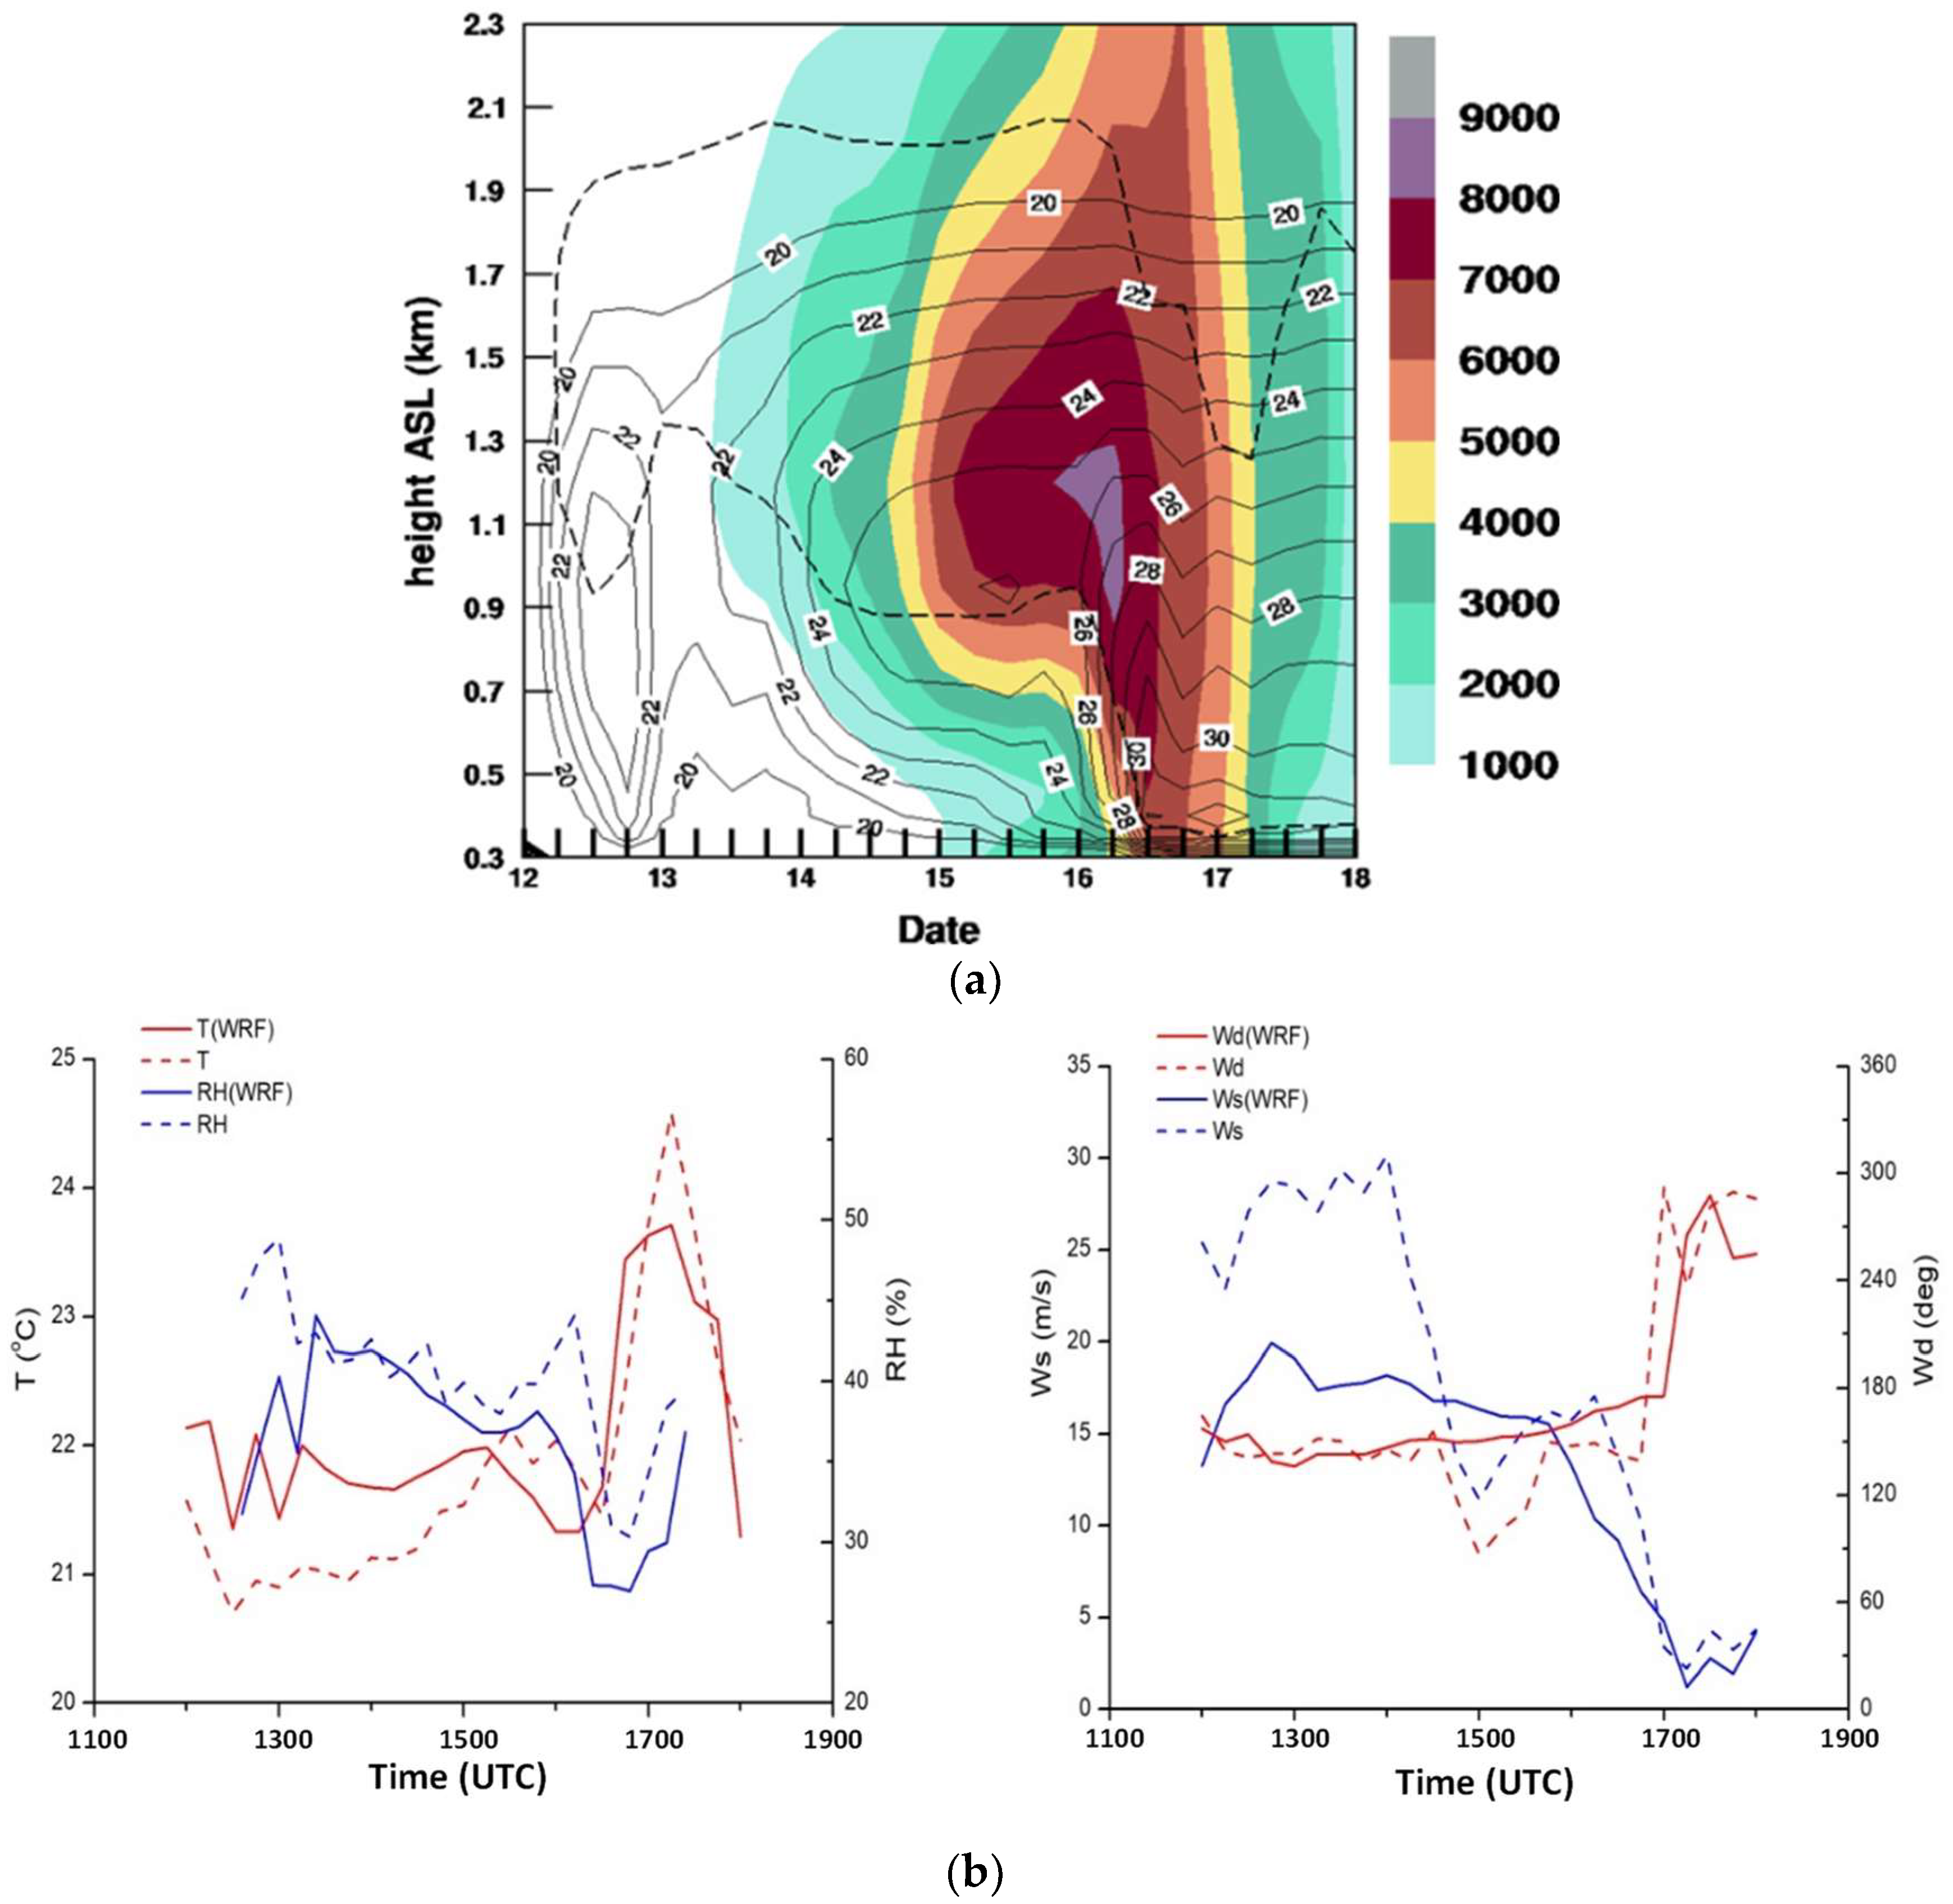
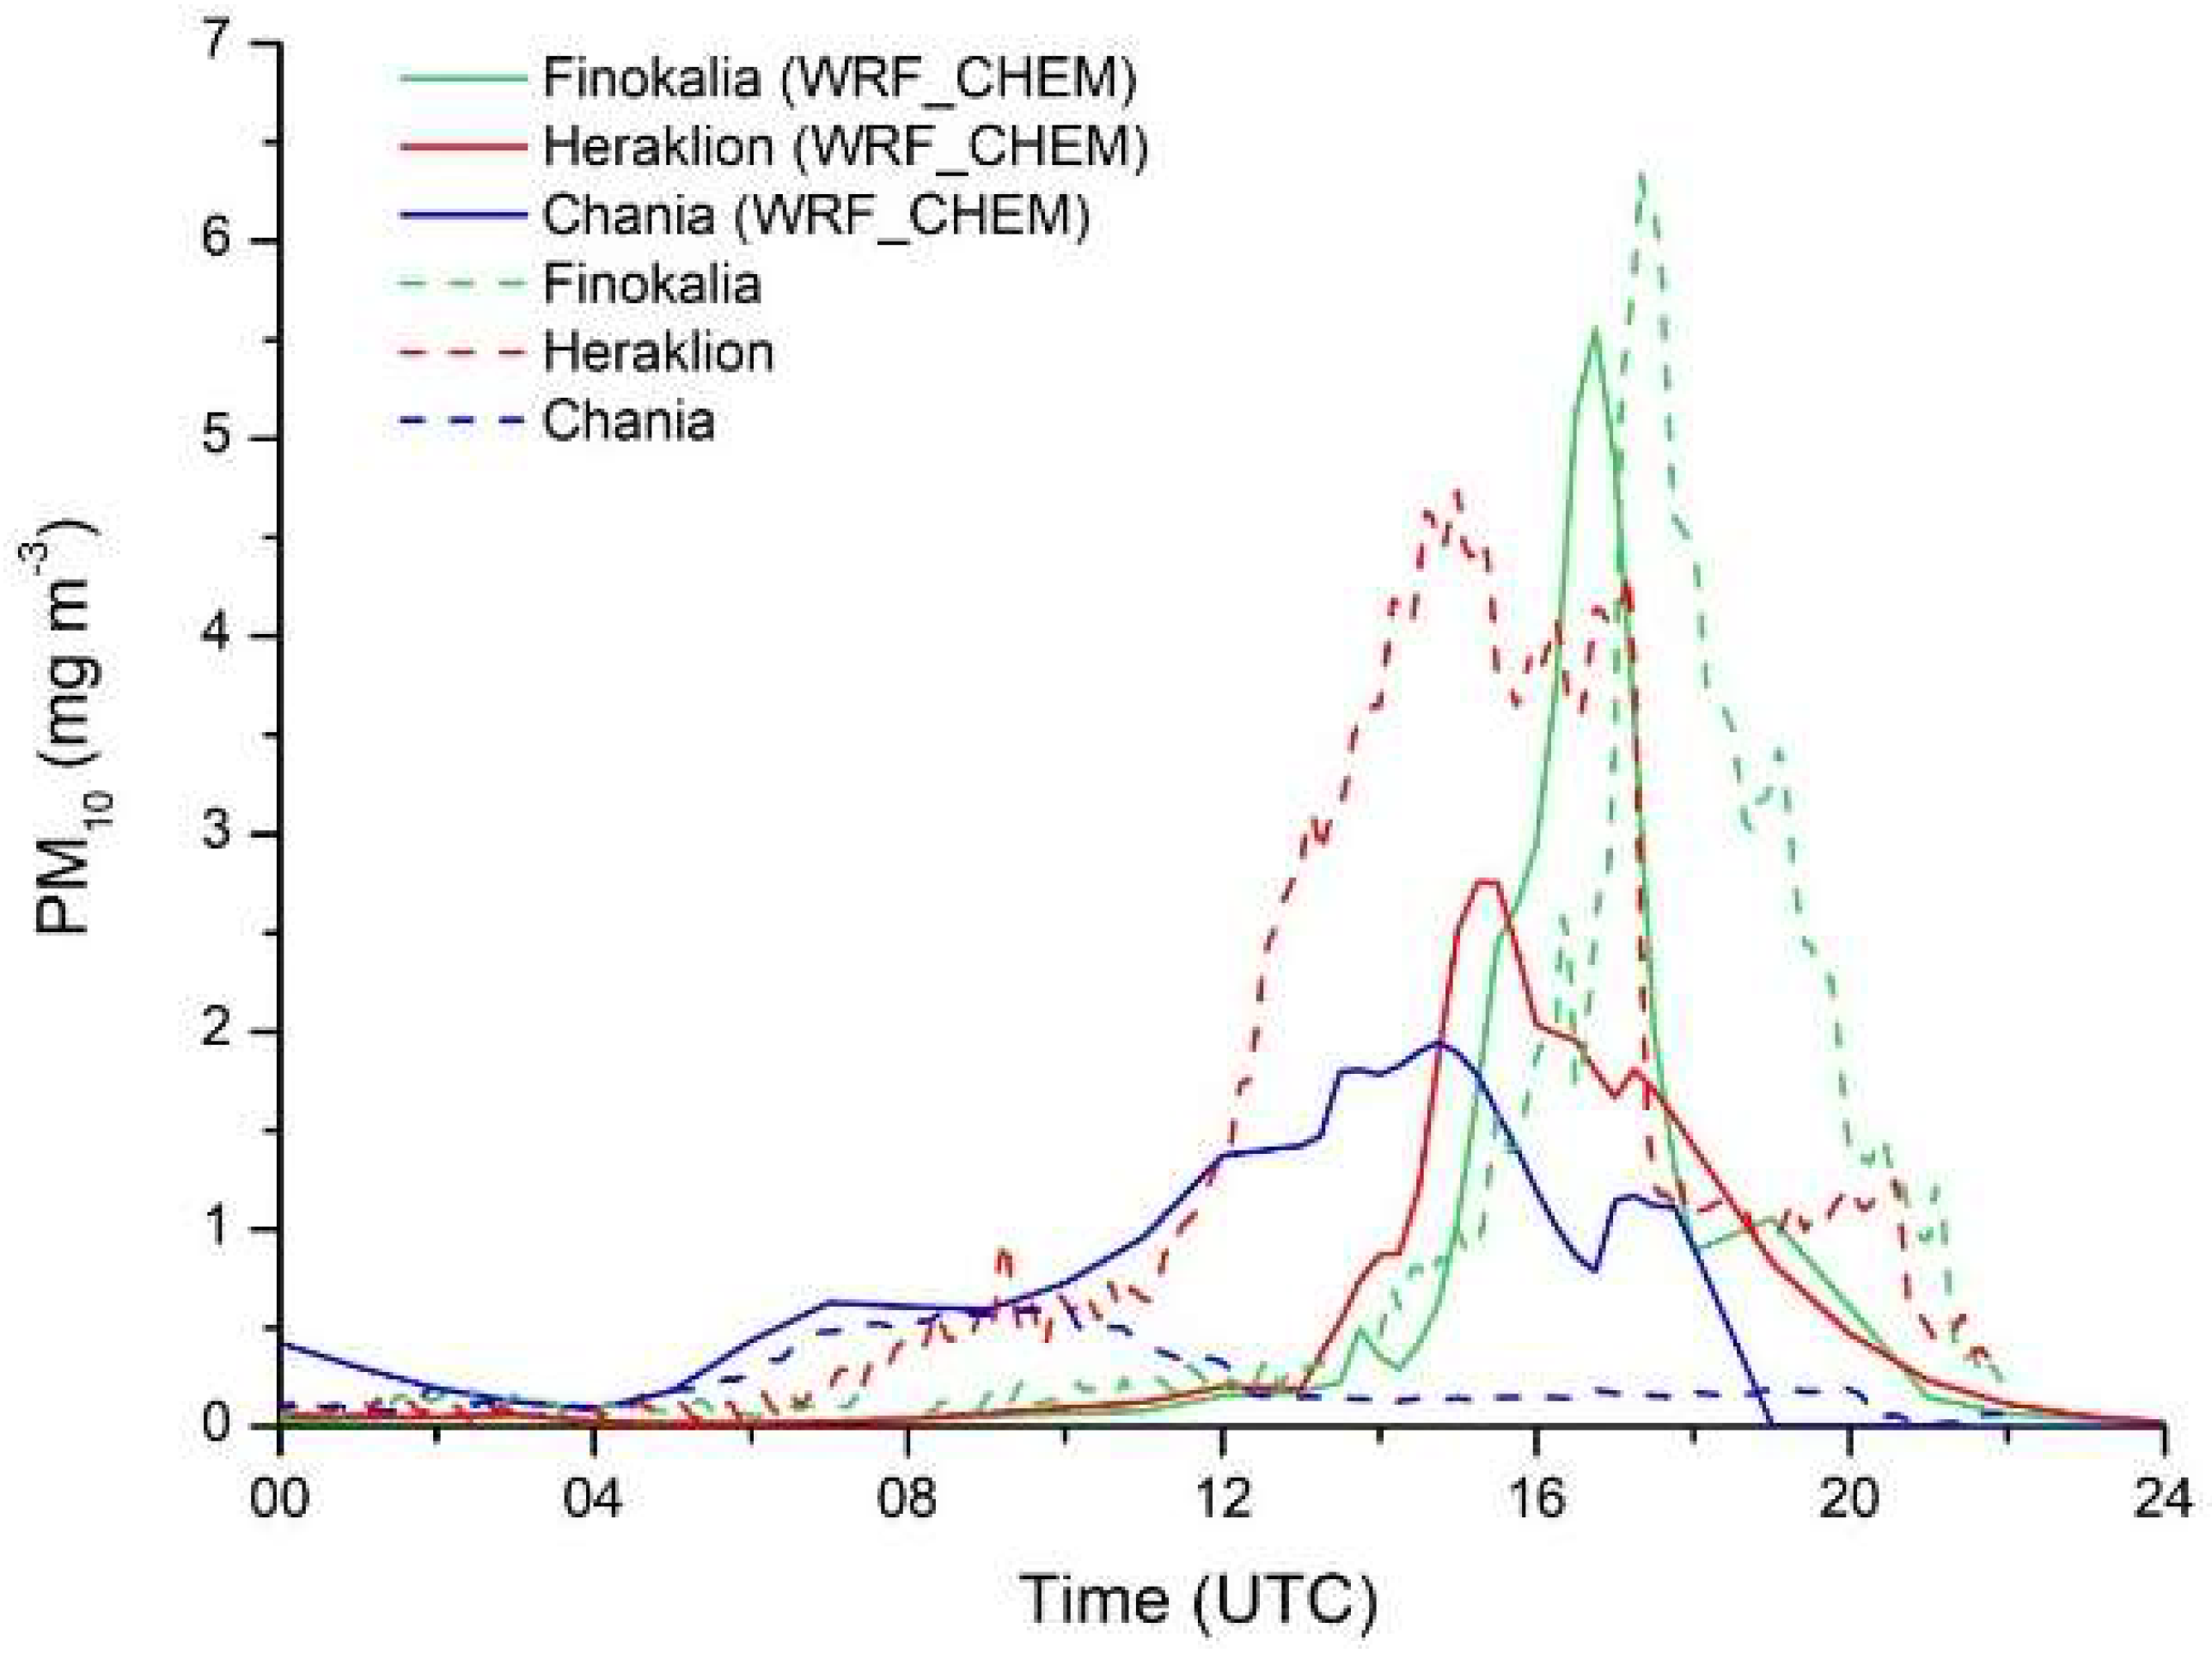
3.2.3. Comparison with Observations

To examine the spatiotemporal evolution of the extreme dust episode at the station of Finokalia, we analyze the modeled vertical time-height properties of dust concentration, temperature and relative humidity from the finest 1 × 1 km run over the station (Figure 10a). The peak of the event is between 1615–1715 UTC when the modeled surface concentration exceeds 6000 μg m−3. At this time the core of the plume is located at 0.9–1.3 km a.s.l. where dust concentration is higher than 8000 μg m−3. The downward mixing of the dry and warm Saharan air mass is evident in Figure 10 by the abrupt increase in ambient temperature reaching up to 32 °C at 1700 UTC and by the 10% relative humidity line that actually constraints the downslope air mass. Comparison of the modeled against measured meteorological values at Finokalia shows that the simulated surface values of temperature and relative humidity are in good agreement and in general following the time-evolution of the in situ measurements (Figure 10b). An interesting finding arises from the comparison between modeled and measured wind properties. The model reproduces correctly the passage of the cold front. In agreement with the observations the wind is veering from SSE (150°) to WNW (300°) and is also reduced to calm conditions (1.2 m s−2) behind the front (after 1700 UTC). However, the downslope winds are underestimated by almost 10 m s−1 at the station location (Figure 10b before 1500 UTC). This comparison emphasizes on the very local nature of the event and on the large gradients in wind speed induced by the complex topography. For example, values greater than 30 m s−1 are only simulated at about 0.5 km above Finokalia station, implying that in reality the station was inside the Saharan layer and even the 1 × 1 km grid space is not sufficient for accurately reproducing all atmospheric processes near the surface. Additional limitations may be related to the improper reproduction of wind gusts or to assumptions made by the boundary layer parameterization of the model.
Unfortunately, the signal of the PollyXT LiDAR is most probably attenuated during the specific event. A time window with reliable LiDAR profiles is only found at 0300 and 0400 UTC on 22 March (Figure 11a). This timeframe corresponds to a different air mass, also carrying Saharan dust that arrives at layers 1.5–6 km over the station. The Klett-Fernald-Sasano method was utilized for the derivation of the extinction coefficient profiles at 532 nm, using a LiDAR ratio of S = 55. The resulting AODs are 2.93 and 1.07 at 0300 and 0400 UTC respectively. The dust particle mass concentration profiles of the model (solid line) and PollyXT LiDAR (dashed line) for 0300 and 0400 UTC (green and blue line respectively) are also calculated from these profiles. The dust plume was assumed to be coarse-mode dominated, thus the mass-specific extinction coefficient value of k e x t = 0.52   m 2 g 1 was utilized for the LiDAR mass concentration profiles [70]. Comparison of modeled dust profiles with these LiDAR retrievals (Figure 11b) indicates a satisfactory agreement between modeled and observed concentrations in terms of the event scale. The model seems to follow also the modification in maximum concentrations between this 2-h period. However the depth of the layer is not accurately reproduced especially at 0300 UTC when the LiDAR backscatter signal shows a uniform layer of 1000–1600 μg m−3 while the modeled profile quickly declines to values less than 1000 μg m−3 above 2 km. Overall, this comparison may not be representative of the main event, but it generally increases our confidence on the model simulation suggesting also an under-prediction of the actual dust concentrations in the model.
The surface concentrations of PM10 in the model are compared with the in situ measurements at the stations of Finokalia, Heraklion and Chania (Figure 12). Dust is the only aerosol considered in these simulations and the modeled PM10 is calculated from the five dust bins as: PM10 = bin1 + bin2 + bin3 + 0.87∙bin4. The local nature of the event is clearly illustrated by the in situ measurements (dashed lines) in this plot. Finokalia and Heraklion stations, which are located towards the east part of Crete, recorded remarkably increased PM10 concentrations exceeding 6 mg m−3 during 1400–1800 UTC. At the same time, PM10 at Chania station that is located 140 km to the west was below 0.2 mg m−3. Taking into account the complexity of the event the model reproduces these record-breaking values in a satisfactory manner, but with several biases. The time evolution of the dust-storm is accurately described and the maximum modeled PM10 are also found during 1400–1800 UTC in Heraklion and Finokalia. The coevolution of measured and modeled values at these two stations is also evident in Figure 12 and the R 2 correlation coefficient is 0.43 for Finokalia and 0.56 for Heraklion. The narrow maximum spike of modeled PM10 in Finokalia reaches 5.5 mg m−3 one hour earlier than the actual recorded peak of 6.34 mg m−3. However the model clearly underestimates PM10 in Heraklion since although the simulation produces very high values exceeding 2.5 mg m−3 at this station, the actual concentrations were actually two times higher exceeding 4 mg m−3. In Chania station, the model fails to predict the very low recorded PM10 and thus implies a more spatially extended episode than what actually occurred. This is probably explained due to the underprediction of Lefka Ori topography in the model. This mountain range extends south of Chania and acts as a perpendicular barrier to the flow from Africa. It consists of 58 tops exceeding 2 km and even at this high 1 × 1 km grid space this pattern is not accurately reproduced. As a result, the core of the dust plumes arriving in the model at 1–2 km, instead of being deflected by the mountain range, they actually cross the ridge resulting in downslope winds at the lee side that affect the west parts of Crete. Actually the coarse 24 × 24 km model run (Figure 8a) predicts very well the PM10 values in Chania but for the wrong reasons. In this run the model hardly sees the Crete Mountains and as a result the dust clouds continue travelling detached towards the north without increasing the surface dust concentration.

4. Summary and Conclusions

We analyzed the most intense Saharan dust episode ever recorded at Finokalia station in Crete during its 14 years operational period (2004–2018). Analysis of the atmospheric processes during this episode suggests that the unique PM10 concentrations recorded in Crete on 22 March 2018 were produced by a combination of meteorological processes taking place at various atmospheric scales. In general, the main driver for strong dust events in Mediterranean is atmospheric dynamics and this particular event is a typical example that combines several of the dynamical processes commonly involved in dust episodes:
At synoptic scale, the weakening of the polar vortex allows descending of cold stratospheric air of high potential vorticity towards lower latitudes at Mediterranean and north Africa.
At mesoscale, the tropospheric folding favors cyclogenesis and intensifies the low-pressure systems along the surface baroclinic zones. The formation of mid-latitude cyclones at this area results in mobilization of dust particles from the Sahara and the scale and movement of these Mediterranean depressions determines also the dust pathways towards Europe.
At local scale, the vertical stability of the dusty air mass is disturbed when the plumes reach the orographic barriers of Mediterranean islands (e.g., Crete, Cyprus, Sicily) or the inland continental mountain ranges. Depending on the relevant heights between the mountain ridge and the elevated plumes, topography may act either as a stopping barrier that leads to increased dust concentrations at the windward ridge [22] or as a primary reason for the generation of downslope Foehn winds and downward mixing of dust over the leeward side, which was the case for the current event.
From a modeling point of view, resolving of such complex atmospheric patterns is a very challenging task since a high-resolution nested grid may often be required at both the origin areas of dust and at the arrival areas, several hundred kilometers away. Our WRF-Chem simulations clearly identify the importance of local scale dynamics on the surface PM10. As expected, the 1 × 1 km simulation outperforms the coarser 3 × 3 km, 12 × 12 km and 24 × 24 km runs in terms of surface dust concentrations. The major spatiotemporal and quantitative properties of the event are reproduced in satisfactory agreement with the observations, considering the complexity of the event. For example the maximum modeled and in situ PM10 in Finokalia is 5.5 mg m−3 and 6.34 mg m−3 respectively. However, even at the fine grid scale of 1 × 1 km, certain limitations are evident regarding the model performance, mostly related to sub-grid unresolved topographic features and to the associated dynamics induced by terrain variability at the low-level tropospheric flow. In general, the event was even more spatially limited than shown in the model and affected only the eastern parts of Crete, leaving the west parts (Chania) practically unaffected.
In this work we explain the physical processes related to atmospheric dynamics during this particular event. Further analysis of the in situ measurements and of the specific properties of the aerosol particles will follow. Moreover, future work is needed to investigate the impact of climatic forcing to the atmospheric patterns generating such events. Following the consideration that stratospheric intrusions are the primary force for dust-storm generation, any possible future changes in polar vortex properties due to climate change may be relevant to changes in the frequency and strength of dust events in the Mediterranean.

Author Contributions

Conceptualization, S.S., N.K., A.G., I.B. and S.K.; Data curation, N.K., G.K., M.K. and Y.P.; Formal analysis, S.S. and N.K.; Funding acquisition, N.M. and V.A.; Investigation, S.S., N.K., A.G., I.B. and Y.P.; Methodology, S.S., N.K., A.T., S.K., Y.P. and E.P.; Project administration, N.M. and V.A.; Resources, S.S., N.K., V.A., G.K. and M.K.; Software, S.S., A.G., A.T., M.K. and Y.P.; Supervision, S.S., N.M. and V.A.; Validation, S.S.; Visualization, S.S., N.K., A.G., M.K., Y.P. and E.P.; Writing—original draft, S.S.; Writing—review & editing, S.S., N.K., N.M., V.A., A.G., I.B., A.T., S.K., M.K., Y.P., E.P., P.N. and F.M.

Funding

This research was funded by The European Research Council (ERC) Consolidator Grant 2016, D-TECT: Does dust Tribo-electrification affect our Climate? H2020-EU.1.1., Excellent Science, Project ID: 725698; The LIFE Climate Change Adaptation project MEDEA (LIFE16 CCA/CY/000041); The EU COST Action CA16202 “International Network to Encourage the Use of Monitoring and Forecasting Dust Products (inDust)”; The DUST-GLASS project (European Union’s Horizon 2020 research and Innovation programme under the Marie Skłodowska-Curie grant agreement No 749461); The H2020 GEO-CRADLE project under grant agreement no. 690133; The Stavros Niarchos Foundation.

Acknowledgments

The authors acknowledge support from the European Research Council (ERC) Consolidator Grant 2016, D-TECT: Does dust Tribo-electrification affect our Climate? H2020-EU.1.1., Excellent Science, Project ID: 725698; the LIFE Climate Change Adaptation project MEDEA (LIFE16 CCA/CY/000041); the EU COST Action CA16202 “International Network to Encourage the Use of Monitoring and Forecasting Dust Products (inDust)”. The authors gratefully acknowledge Mihalis Lazaridis from the Technical University of Crete for the provision of PM10 data for Chania. The authors thank the Group of Atmospheric Optics, Valladolid University, for the provision of the CÆLIS tool (www.caelis.uva.es) used for AERONET data in this publication. Antonis Gkikas acknowledges funding from the DUST-GLASS project (European Union’s Horizon 2020 research and Innovation programme under the Marie Skłodowska-Curie grant agreement No. 749461). Emmanouil Proestakis and Michael Kottas acknowledge funding from the Stavros Niarchos Foundation.

Conflicts of Interest

The authors declare no conflict of interest.

References

  1. Gerasopoulos, E.; Kouvarakis, G.; Babasakalis, P.; Vrekoussis, M.; Putaud, J.; Mihalopoulos, N. Origin and variability of particulate matter (PM10) mass concentrations over the Eastern Mediterranean. Atmos. Environ. 2006, 40, 4679–4690. [Google Scholar] [CrossRef]
  2. Balis, D.; Amiridis, V.; Kazadzis, S.; Papayannis, A.; Tsaknakis, G.; Tzortzakis, S.; Kalivitis, N.; Vrekoussis, M.; Kanakidou, M.; Mihalopoulos, N.; et al. Optical characteristics of desert dust over the East Mediterranean during summer: A case study. Ann. Geophys. 2006, 24, 807–821. [Google Scholar] [CrossRef]
  3. Kalivitis, N.; Gerasopoulos, E.; Vrekoussis, M.; Kouvarakis, G.; Kubilay, N.; Hatzianastassiou, N.; Vardavas, I.; Mihalopoulos, N. Dust transport over the eastern Mediterranean derived from Total Ozone Mapping Spectrometer, Aerosol Robotic Network, and surface measurements. J. Geophys. Res. 2007, 112. [Google Scholar] [CrossRef]
  4. Amiridis, V.; Kafatos, M.; Perez, C.; Kazadzis, S.; Gerasopoulos, E.; Mamouri, R.E.; Papayannis, A.; Kokkalis, P.; Giannakaki, E.; Basart, S.; et al. The potential of the synergistic use of passive and active remote sensing measurements for the validation of a regional dust model. Ann. Geophys. 2009, 27, 3155–3164. [Google Scholar] [CrossRef] [Green Version]
  5. Kushta, J.; Kallos, G.; Astitha, M.; Solomos, S.; Spyrou, C.; Mitsakou, C.; Lelieveld, J. Impact of natural aerosols on atmospheric radiation and consequent feedbacks with the meteorological and photochemical state of the atmosphere. J. Geophys. Res. Atmos. 2013, 119, 1463–1491. [Google Scholar] [CrossRef]
  6. Gkikas, A.; Obiso, V.; Pérez García-Pando, C.; Jorba, O.; Hatzianastassiou, N.; Vendrell, L.; Basart, S.; Solomos, S.; Gassó, S.; Baldasano, J.M. Direct radiative effects during intense Mediterranean desert dust outbreaks. Atmos. Chem. Phys. 2018, 18, 8757–8787. [Google Scholar] [CrossRef]
  7. Kosmopoulos, P.G.; Kazadzis, S.; Taylor, M.; Athanasopoulou, E.; Speyer, O.; Raptis, P.I.; Marinou, E.; Proestakis, E.; Solomos, S.; Gerasopoulos, E.; et al. Dust impact on surface solar irradiance assessed with model simulations, satellite observations and ground-based measurements. Atmos. Meas. Tech. 2017, 10, 2435–2453. [Google Scholar] [CrossRef] [Green Version]
  8. Solomos, S.; Kallos, G.; Kushta, J.; Astitha, M.; Tremback, C.; Nenes, A.; Levin, Z. An integrated modeling study on the effects of mineral dust and sea salt particles on clouds and precipitation. Atmos. Chem. Phys. 2011, 11, 873–892. [Google Scholar] [CrossRef] [Green Version]
  9. Kallos, G.; Solomos, S.; Kushta, J.; Mitsakou, C.; Spyrou, C.; Bartsotas, N.; Kalogeri, C. Natural and Anthropogenic Aerosols in the Mediterranean region and Middle East: Patterns and Impacts. Sci. Total Environ. 2014. [Google Scholar] [CrossRef]
  10. Jickells, T.D.; An, Z.S.; Andersen, K.K.; Baker, A.R.; Bergametti, G.; Brooks, N.; Cao, J.J.; Boyd, P.W.; Duce, R.A.; Hunter, K.A.; et al. Global iron connections between desert dust, ocean biogeochemistry, and climate. Science 2005, 308, 67–71. [Google Scholar] [CrossRef] [PubMed]
  11. Okin, G.; Parsons, A.; Wainwright, J.; Herrick, J.; Bestelmeyer, B.; Peters, D.; Fredrickson, E. Do Changes in Connectivity Explain Desertification? Bioscience 2009, 59, 237–244. [Google Scholar] [CrossRef] [Green Version]
  12. Derbyshire, E. Natural Minerogenic Dust and Human Health. AMBIO J. Hum. Environ. 2007, 36, 73–77. [Google Scholar] [CrossRef]
  13. Mitsakou, C.; Kallos, G.; Papantoniou, N.; Spyrou, C.; Solomos, S.; Astitha, M.; Housiadas, C. Saharan dust levels in Greece and received inhalation doses. Atmos. Chem. Phys. 2008, 8, 7181–7192. [Google Scholar] [CrossRef] [Green Version]
  14. Nastos, P.T.; Paliatsos, A.G.; Anthracopoulos, M.B.; Roma, E.S.; Priftis, K.N. Outdoor particulate matter and childhood asthma admissions in Athens, Greece: A time-series study. Environ. Health 2010, 9, 45. [Google Scholar] [CrossRef] [PubMed]
  15. Samoli, E.; Nastos, P.T.; Paliatsos, A.G.; Katsouyanni, K.; Priftis, K.N. Acute effects of air pollution on pediatric asthma exacerbation: Evidence of association and effect modification. Environ. Res. 2011, 111, 418–424. [Google Scholar] [CrossRef] [PubMed]
  16. Nastos, P.T. Meteorological Patterns Associated with Intense Saharan Dust Outbreaks over Greece in Winter. Adv. Meteorol. 2012. [Google Scholar] [CrossRef]
  17. Schepanski, K.; Knippertz, P.; Fiedler, S.; Timouk, F.; Demarty, J. The sensitivity of nocturnal low-level jets and near-surface winds over the Sahel to model resolution, initial conditions and boundary-layer set-up. Q. J. R. Meteorol. Soc. 2014, 141, 1442–1456. [Google Scholar] [CrossRef]
  18. Solomos, S.; Kallos, G.; Mavromatidis, E.; Kushta, J. Density currents as a desert dust mobilization mechanism. Atmos. Chem. Phys. 2012, 12, 11199–11211. [Google Scholar] [CrossRef] [Green Version]
  19. Solomos, S.; Ansmann, A.; Mamouri, R.-E.; Binietoglou, I.; Patlakas, P.; Marinou, E.; Amiridis, V. Remote sensing and modelling analysis of the extreme dust storm hitting the Middle East and eastern Mediterranean in September 2015. Atmos. Chem. Phys. 2017, 17, 4063–4079. [Google Scholar] [CrossRef]
  20. Papayannis, A.; Mamouri, R.E.; Amiridis, V.; Kazadzis, S.; Pérez, C.; Tsaknakis, G.; Kokkalis, P.; Baldasano, J.M. Systematic lidar observations of Saharan dust layers over Athens, Greece in the frame of EARLINET project (2004–2006). Ann. Geophys. 2009, 27, 3611–3620. [Google Scholar] [CrossRef] [Green Version]
  21. Gkikas, A.; Houssos, E.E.; Lolis, C.J.; Bartzokas, A.; Mihalopoulos, N.; Hatzianastassiou, N. Atmospheric circulation evolution related to desert-dust episodes over the Mediterranean. Q. J. R. Meteorol. Soc. 2014, 141, 1634–1645. [Google Scholar] [CrossRef]
  22. Marinou, E.; Amiridis, V.; Binietoglou, I.; Tsikerdekis, A.; Solomos, S.; Proestakis, E.; Konsta, D.; Papagiannopoulos, N.; Tsekeri, A.; Vlastou, G.; et al. Three-dimensional evolution of Saharan dust transport towards Europe based on a 9-year EARLINET-optimized CALIPSO dataset. Atmos. Chem. Phys. 2017, 17, 5893–5919. [Google Scholar] [CrossRef] [Green Version]
  23. Kabatas, B.; Pierce, R.B.; Unal, A.; Rogal, M.J.; Lenzen, A. April 2008 Saharan dust event: Its contribution to PM10 concentrations over the Anatolian Peninsula and relation with synoptic conditions. Sci. Total Environ. 2018, 633, 317–328. [Google Scholar] [CrossRef] [PubMed]
  24. Edgell, H.S. Arabian Deserts: Nature, Origin and Evolution; Springer: Dordrecht, The Netherlands, 2006; Available online: https://www.springer.com/gp/book/9781402039690 (accessed on 18 May 2018).
  25. Nastos, P.T.; Kampanis, N.A.; Giaouzaki, K.N.; Matzarakis, A. Environmental impacts on human health during a Saharan dust episode at Crete Island, Greece. Meteorol. Z. 2011, 517–529. [Google Scholar] [CrossRef]
  26. Nastos, P.T.; Bleta, A.G.; Matsangouras, I.T. Human thermal perception related to Föhn winds due to Saharan dust outbreaks in Crete Island, Greece. Theor. Appl. Climatol. 2017, 128, 635–647. [Google Scholar] [CrossRef]
  27. Bleta, A.; Nastos, P.T.; Matzarakis, A. Assessment of bioclimatic conditions on Crete Island, Greece. Reg. Environ. Chang. 2014, 14, 1967–1981. [Google Scholar] [CrossRef]
  28. Pielke, R.A.S. Mesoscale Meteorological Modeling, 2nd ed.; International Geophysics Series; Academic Press: Cambridge, MA, USA, 2002; Volume 78, 676p. [Google Scholar]
  29. Chen, F.; Dudhia, J. Coupling an Advanced Land Surface-Hydrology Model with the Penn State-NCAR MM5 Modeling System. Part I: Model Implementation and Sensitivity. Mon. Weather Rev. 2001, 129, 569–585. [Google Scholar] [CrossRef]
  30. Chen, F.; Dudhia, J. Coupling an Advanced Land Surface-Hydrology Model with the Penn State-NCAR MM5 Modeling System. Part II: Preliminary Model Validation. Mon. Weather Rev. 2001, 129, 587–604. [Google Scholar] [CrossRef]
  31. Janjić, Z.I. The surface layer in the NCEP Eta model. In Preprints, Proceedings of the 11th Conference on Numerical Weather Prediction; American Meteorological Society: Norfolk, VA, USA, 1996; pp. 354–355. [Google Scholar]
  32. Janjić, Z.I. Nonsingular Implementation of the Mellor-Yamada Level 2.5 Scheme in the NCEP Meso Model; NCEP Off. Note 437; National Centers for Environmental Prediction: College Park, MD, USA, 2001; p. 61. [Google Scholar]
  33. Grell, G.A.; Devenyi, D. A generalized approach to parameterizing convection combining ensemble and data assimilation techniques. Geophys. Res. Lett. 2002, 29, 1693–1696. [Google Scholar] [CrossRef]
  34. Lin, Y.-L.; Farley, R.D.; Orville, H.D. Bulk parameterization of the snow field in a cloud model. J. Clim. Appl. Meteorol. 1983, 22, 1065–1092. [Google Scholar] [CrossRef]
  35. Iacono, M.J.; Delamere, J.S.; Mlawer, E.J.; Shephard, M.W.; Clough, S.A.; Collins, W.D. Radiative forcing by long-lived greenhouse gases: Calculations with the AER radiative transfer models. J. Geophys. Res. Atmos. 2008, 113. [Google Scholar] [CrossRef] [Green Version]
  36. Jones, S.L.; Adams-Selin, R.; Hunt, E.D.; Creighton, G.A.; Cetola, J.D. Update on modifications to WRF-CHEM GOCART for fine-scale dust forecasting at AFWA. In Proceedings of the AGU Fall Meeting, New Orleans, LA, USA, 11–15 December 2012. [Google Scholar]
  37. Su, L.; Fung, J.C. Sensitivities of WRF-Chem to dust emission schemes and land surface properties in simulating dust cycles during springtime over East Asia. J. Geophys. Res. Atmos. 2015, 120, 11215–11230. [Google Scholar] [CrossRef]
  38. Marticorena, B.; Bergametti, G. Modeling the atmospheric dust cycle: 1. Design of a soil derived dust emission scheme. J. Geophys. Res. Atmos. 1995, 100, 16415–16430. [Google Scholar] [CrossRef]
  39. Zender, C.S.; Bian, H.S.; Newman, D. Mineral Dust Entrainment and Deposition (DEAD) model: Description and 1990s dust climatology. J. Geophys. Res. Atmos. 2003, 108, 4416. [Google Scholar] [CrossRef]
  40. Fairlie D., T.; Jacob, D.J.; Park, R.J. The impact of transpacific transport of mineral dust in the United States. Atmos. Environ. 2007, 41, 1251–1266. [Google Scholar] [CrossRef] [Green Version]
  41. Spyrou, C.; Mitsakou, C.; Kallos, G.; Louka, P.; Vlastou, G. An improved limited area model for describing the dust cycle in the atmosphere. J. Geophys. Res. 2010, 115, D17211. [Google Scholar] [CrossRef]
  42. Spyrou, C. Direct radiative impacts of desert dust on atmospheric water content. Aerosol Sci. Technol. 2018, 52, 693–701. [Google Scholar] [CrossRef]
  43. Mie, G. Beiträge zur Optik trüber Medien, speziell kolloidaler Metallösungen. Ann. Phys. 1908, 25, 77–445. [Google Scholar] [CrossRef]
  44. Bohren, C.F.; Huffman, D.R. Absorption and Scattering of Light by Small Particles; John Wiley & Sons, Inc.: New York, NY, USA, 1983; ISBN-13: 9780471057727. [Google Scholar]
  45. Kandler, K.; Benker, N.; Bundke, U.; Cuevas, E.; Ebert, M.; Knippertz, P.; Rodriguez, S.; Schuetz, L.; Weinbruch, S. Chemical composition and complex refractive index of Saharan Mineral Dust at Izana, Tenerife (Spain) derived by electron microscopy. Atmos. Environ. 2007, 41, 8058–8074. [Google Scholar] [CrossRef]
  46. Wesely, M. Parameterization of Surface Resistances to Gaseous Dry Deposition in Regional-Scale Numerical-Models. Atmos. Environ. 1989, 23, 1293–1304. [Google Scholar] [CrossRef]
  47. Engelmann, R.; Kanitz, T.; Baars, H.; Heese, B.; Althausen, D.; Skupin, A.; Wandinger, U.; Komppula, M.; Stachlewska, I.S.; Amiridis, V.; et al. The automated multiwavelength Raman polarization and water-vapor lidar PollyXT: The neXT generation. Atmos. Meas. Tech. 2016, 9, 1767–1784. [Google Scholar] [CrossRef]
  48. Brindley, H.; Knippertz, P.; Ryder, C.; Ashpole, I. A critical evaluation of the ability of the Spinning Enhanced Visible and Infrared Imager (SEVIRI) thermal infrared red-green-blue rendering to identify dust events: Theoretical analysis. J. Geophys. Res. 2012, 117, D07201. [Google Scholar] [CrossRef]
  49. Remer, L.A.; Kaufman, Y.J.; Tanré, D.; Mattoo, S.; Chu, D.A.; Martins, J.V.; Li, R.-R.; Ichoku, C.; Levy, R.C.; Kleidman, R.G.; et al. The MODIS Aerosol Algorithm, Products, and Validation. J. Atmos. Sci. 2005, 62, 947–973. [Google Scholar] [CrossRef] [Green Version]
  50. Remer, L.A.; Kleidman, R.G.; Levy, R.C.; Kaufman, Y.J.; Tanre, D.; Mattoo, S.; Martins, J.V.; Ichoku, C.; Koren, I.; Yu, H.; et al. Global aerosol climatology from the MODIS satellite sensors. J. Geophys. Res. Atmos. 2008, 113, D14S07. [Google Scholar] [CrossRef]
  51. Tanre, D.; Kaufman, Y.J.; Herman, M.; Mattoo, S. Remote sensing of aerosol properties over oceans using the MODIS/EOS spectral radiances. J. Geophys. Res.-Atmos. 1997, 102, 16971–16988. [Google Scholar] [CrossRef] [Green Version]
  52. Levy, R.C.; Mattoo, S.; Munchak, L.A.; Remer, L.A.; Sayer, A.M.; Patadia, F.; Hsu, N.C. The Collection 6 MODIS aerosol products over land and ocean. Atmos. Meas. Tech. 2013, 6, 2989–3034. [Google Scholar] [CrossRef] [Green Version]
  53. Kaufman, Y.J.; Tanrfi, D.; Gordon, H.R.; Nakajima, T.; Lenoble, J.; Frouin, R.; Grassl, H.; Herman, B.M.; King, M.D.; Teillet, P.M. Passive remote sensing of tropospheric aerosol and atmospheric correction for the aerosol effect. J. Geophys. Res. Atmos. 1997, 102, 16815–16830. [Google Scholar] [CrossRef] [Green Version]
  54. Hsu, N.C.; Tsay, S.-C.; King, M.D.; Herman, J.R. Aerosol properties over bright-reflecting source regions. IEEE Trans. Geosci. Remote Sens. 2004, 42, 557–569. [Google Scholar] [CrossRef]
  55. Hsu, N.C.; Jeong, M.-J.; Bettenhausen, C.; Sayer, A.M.; Hansell, R.; Seftor, C.S.; Huang, J.; Tsay, S.-C. Enhanced Deep Blue aerosol retrieval algorithm: The second generation. J. Geophys. Res. Atmos. 2013, 118, 9296–9315. [Google Scholar] [CrossRef] [Green Version]
  56. Sayer, A.M.; Munchak, L.A.; Hsu, N.C.; Levy, R.C.; Bettenhausen, C.; Jeong, M.-J. MODIS Collection 6 aerosol products: Comparison between Aqua’s e-Deep Blue, Dark Target, and “merged” data sets, and usage recommendations. J. Geophys. Res. Atmos. 2014, 119, 13965–13989. [Google Scholar] [CrossRef]
  57. Levy, R.C.; Remer, L.A.; Kleidman, R.G.; Mattoo, S.; Ichoku, C.; Kahn, R.; Eck, T.F. Global evaluation of the Collection 5 MODIS dark-target aerosol products over land. Atmos. Chem. Phys. 2010, 10, 10399–10420. [Google Scholar] [CrossRef] [Green Version]
  58. Sayer, A.M.; Hsu, N.C.; Bettenhausen, C.; Jeong, M.-J. Validation and uncertainty estimates for MODIS Collection 6 “Deep Blue” aerosol data. J. Geophys. Res. Atmos. 2013, 118, 7864–7872. [Google Scholar] [CrossRef] [Green Version]
  59. Lelieveld, J.; Berresheim, H.; Borrmann, S.; Crutzen, P.J.; Dentener, F.J.; Fischer, H.; Feichter, J.; Flatau, P.J.; Heland, J.; Holzinger, R.; et al. Global air pollution crossroads over the Mediterranean. Science 2002, 298, 794–799. [Google Scholar] [CrossRef] [PubMed]
  60. Koulouri, E.; Saarikoski, S.; Theodosi, C.; Markaki, Z.; Gerasopoulos, E.; Kouvarakis, G.; Mäkelä, T.; Hillamo, R.; Mihalopoulos, N. Chemical composition and sources of fine and coarse aerosol particles in the Eastern Mediterranean. Atmos. Environ. 2008, 42, 6542–6550. [Google Scholar] [CrossRef]
  61. Holben, B.N.; Eck, T.F.; Slutsker, I.; Tanré, D.; Buis, J.P.; Setzer, A.; Vermote, E.; Reagan, J.A.; Kaufman, Y.J.; Nakajima, T.; et al. AERONET—A federated instrument network and data archive for aerosol characterization. Remote Sens. Environ. 1998, 66, 1–16. [Google Scholar] [CrossRef]
  62. Danielsen, E.F. Stratospheric-tropospheric exchange of radioactivity, ozone, and potential vorticity. J. Atmos. Sci. 1968, 25, 502–518. [Google Scholar] [CrossRef]
  63. Hoskins, B.J.; McIntyre, M.E.; Robertson, A.W. On the use and significance of isentropic potential vorticity maps. Q. J. R. Meteorol. Soc. 1985, 111, 877–947. [Google Scholar] [CrossRef]
  64. Thorncroft, C.D.; Flocas, H.A. A case study of Saharan cyclogenesis. Mon. Weather Rev. 1997, 125, 1147–1165. [Google Scholar] [CrossRef]
  65. Kaplan, M.L.; Vellore, R.K.; Lewis, J.M.; Underwood, S.J.; Pauley, P.M.; Martin, J.E.; Rabin, R.M.; Krishnan, R. Subtropical-polar jet interactions in Southern Plains dust storms. J. Geophys. Res. Atmos. 2013, 118, 12893–12914. [Google Scholar] [CrossRef]
  66. Kouroutzoglou, J.; Flocas, H.A.; Hatzaki, M.; Keay, K.; Simmonds, I.; Mavroudis, A. On the dynamics of a case study of explosive cyclogenesis in the Mediterranean. Meteorol. Atmos. Phys. 2015, 127, 49–73. [Google Scholar] [CrossRef]
  67. Pytharoulis, I. Analysis of a Mediterranean tropical-like cyclone and its sensitivity to the sea surface temperatures. Atmos. Res. 2017. [Google Scholar] [CrossRef]
  68. Pokharel, A.K.; Kaplan, M.L.; Fiedler, S. The role of jet adjustment processes in subtropical dust storms. J. Geophys. Res. Atmos. 2017, 122, 12122–12139. [Google Scholar] [CrossRef]
  69. Mamouri, R.-E.; Ansmann, A.; Nisantzi, A.; Solomos, S.; Kallos, G.; Hadjimitsis, D.G. Extreme dust storm over the eastern Mediterranean in September 2015: Satellite, lidar, and surface observations in the Cyprus region. Atmos. Chem. Phys. 2016, 16, 13711–13724. [Google Scholar] [CrossRef]
  70. Ansmann, A.; Seifert, P.; Tesche, M.; Wandinger, U. Profiling of fine and coarse particle mass: Case studies of Saharan dust and Eyjafjallajökull/Grimsvötn volcanic plumes. Atmos. Chem. Phys. 2012, 12, 9399–9415. [Google Scholar] [CrossRef] [Green Version]
Figure 1. Up (a,b) True color images from MODIS-Terra (left) and MODIS-Aqua (right) on 22 March 2018. The arrows indicate the location of Crete; Down (c,d) MSG-SEVIRI dust RGB images on 1200 UTC (left) and 1500 UTC (right), 22 March 2018.
Atmosphere 09 00240 g001
Figure 2. (a) Temperature at 300 hPa, 21 March 2018, 1200 UTC (b) Wind speed and vectors at 300 hPa, 22 March 0600 UTC (c) Potential Vorticity (PVU) at the 315 K isentropic surface, 22 March 0600 UTC and the three-domain structure (d01,d02,d03). The horizontal dashed line indicates the location of the vertical cross-section shown in (d); (d) Potential temperature (red contours every 15 K), wind speed (black contours every 10 m s−1) and Potential Vorticity (color scale in PVU), 22 March 0600 UTC.
Atmosphere 09 00240 g002
Figure 3. (a) Temperature (°C) and geopotential height (white contours every 20 m) at 850 hPa, 22 March 2018, 0600 UTC and (b) TKE (m2 s −2) at 925 hPa, 0900 UTC on 22 March 2018; the shaded areas are mountain tops above 925 hPa.
Atmosphere 09 00240 g003
Figure 4. Geopotential height (km) at the dynamical tropopause (iso-PV = 2 PVU) and sea level pressure (white contours every 2 hPa) at: (a) 21 March 2018, 1800 UTC and (b) 22 March 2018, 1200 UTC.
Atmosphere 09 00240 g004
Figure 5. (a) Frontal activity, temperature (°C) and wind vectors at 925 hPa and (b) Near-surface dust concentration (μg m−3) and wind vectors at 10 m (zoom from the external 12 × 12 km domain), on 22 March 2018 0600 UTC.
Atmosphere 09 00240 g005
Figure 6. Dustload (mg m−2) and slp (red contours every 4 hPa) on 22 March 2018: (a) 0900 UTC; (b) 1200 UTC; (c) 1500 UTC; (d) 1800 UTC (dust transport along the warm conveyor belt).
Atmosphere 09 00240 g006
Figure 7. (a) MODIS AOD (unitless) at 0950 UTC; (b) WRF-Chem AOD (unitless) at 1000 UTC, 22 March 2018.
Atmosphere 09 00240 g007
Figure 8. Surface dust concentration (μg m−3) and topographic contours on 22 March 2018, 1500 UTC (a) 24 × 24 km grid-space, topography from 200 m to 1000 m by 200 m; (b) 12 × 12 km grid-space, topography from 200 m to 1000 m by 200 m; (c) 3 × 3 km grid-space, topography from 750 m to 2000 m by 500 m; (d) 1 × 1 km grid-space, topography from 750 m to 2000 m by 500 m.
Atmosphere 09 00240 g008
Figure 9. Model cross-section over Finokalia from the inner 1 × 1 km grid at 1600 UTC, 22 March 2018: (a) Dust concentration (color scale in μg m−3) and potential temperature (line contours) and (b) temperature (color scale in °C) and wind speed (line contours every 2 m s−1) at 1700 UTC, 22 March 2018. The red start roughly depicts the location of Finokalia station.
Atmosphere 09 00240 g009
Figure 10. (a) Time-height cross section over Finokalia every 15 min from the 1 × 1 km domain, during 1200–1800 UTC, 22 March 2018. The color scale represents dust concentration (μg m−3), black line contours is the ambient temperature (°C) and the dashed line represents 10% relative humidity; (b) Measured and modeled temperature (°C), wind speed (m s−1), wind direction (degrees) and relative humidity (%) at the station of Finokalia, 1200–1800 UTC, 22 March 2018.
Atmosphere 09 00240 g010
Figure 11. (a) PollyXT LiDAR particle extinction coefficient profiles (\alpha_{p}^{532 nm}) at 532 nm and (b) mass concentration (μg m-3), for 0300 and 0400 UTC on 22 March 2018 (green and blue line respectively). The colored dots represent the corresponding in situ PM10 measurements.
Atmosphere 09 00240 g011
Figure 12. Timeseries of observed (dashed lines) and modeled (solid lines) PM10 at Finokalia, Heraklion and Chania on 22 March 2018.
Atmosphere 09 00240 g012
Table 1. Extinction efficiencies at 550 nm ( Q e x t 550 ) for the dust sub-bins of WRF-CHEM. The sub-bin characteristics are also provided, in terms of the minimum ( r m i n ) and maximum ( r m a x ) radius, the effective radius ( r e f f ) and the geometric standard deviation ( σ g ) of the sub-bin lognormal size distributions.
r m i n r m a x   ( μ m ) r e f f   ( μ m ) σ g ρ (kg m−3) Q e x t 550
0–0.10.73225002.79851
1.0–1.81.4226502.26168
1.8–3.02.4226502.24124
3.6–6.04.5226502.14511
6.0–10.08.0226502.09845
Table 2. Dust RGB channel enhancement. The “night-mode” flag is raised when solar zenith angle exceeds 85°.
ComponentScaling RangeGama Factor
Red { 1 K   ( d a y ) 2 K    ( n i g h t ) ( B T 12 B T 10.8 ) 4 K 1.0
Green { 15 K    ( d a y )    9 K    ( n i g h t ) ( B T 10.8 B T 8.7 ) 0 K { 3          ( d a y ) 2.25    ( n i g h t )
Blue { 289 K    ( d a y ) 293 K    ( n i g h t ) B T 10.8 { 261 K    ( d a y ) 243 K    ( n i g h t ) 1.0

