Assessment of Air Thermal Conditions in the Lowland Part of South-Western Poland for Agriculture Development Purposes


1
Institute of Landscape Architecture, Wrocław University of Environmental and Life Sciences, Grunwaldzka 55, 50-357 Wrocław, Poland
2
Institute of Socio-Economic Geography and Spatial Management, Adam Mickiewicz University in Poznań, Krygowskiego 10, 61-680 Poznań, Poland
3
Department of Spatial Management, Wrocław University of Environmental and Life Sciences, Grunwaldzka 55, 50-357 Wrocław, Poland
*
Author to whom correspondence should be addressed.
Atmosphere 2018, 9(6), 215; https://doi.org/10.3390/atmos9060215
Submission received: 24 April 2018
/
Revised: 30 May 2018
/
Accepted: 1 June 2018
/
Published: 3 June 2018
(This article belongs to the Section Biometeorology)
Abstract
:The recognition of changes in the course of agricultural thermal periods is vital when it comes to determining appropriate measures for adapting agriculture to climate change. The present study examined changes in air temperature between 1951 and 2014 in the area of south-western Poland. A statistically significant, positive linear trend was confirmed for the annual average temperature, seasonal averages, and monthly averages in the periods spanning February–May and July–August. From the beginning of the 21st century, the period of winter dormancy of plants started increasingly later; farming and plant vegetation periods started increasingly earlier, and the period of active plant growth was prolonged. Among the considered agricultural periods, the growing season was the most prolonged. The duration of the farming period was also significantly longer, but the winter dormancy period was shortened. The negative linear trend of days when the temperature stood at <0 °C was statistically confirmed for temperature in the entire region and most of the stations. In terms of predicting the consequences of the changes that were observed today over the next decades, this is not an easy task. However, the nature of these changes suggests that further cultivation of winter crops may require far-reaching adaptation measures.
1. Introduction
One of the more difficult challenges that farmers will have to face in the changing world is adapting their activities to the climate change [1,2,3,4,5]. Climate change scenarios are usually developed for areas with a national, continental, and even global range, and in this form, are used for further research [4,6,7,8,9,10]. There are far fewer studies concerning climate change prediction on a regional scale [11,12,13,14,15]. Similarly, recommendations for agricultural adaptation to climate change usually cover the entire area of the country, as they are needed at local and even individual farm level [16,17,18,19,20]. The impact of climate change on the phenology of crops is still of interest to many researchers [6,21,22,23]. The recognition of changes in the dates of plant growth and development, as well as the duration of development periods, is essential with regard to the activities of adapting agriculture to climate change, among others. This, in turn, makes it possible to work out a proper field work schedule, but also, for instance, to prevent pathogen development effectively [1,24,25,26,27]. It was also proved that changes in phenological periods that are caused by climate changes could affect crop yields [28,29,30]. In most countries, the implementation of adopted strategies for adapting agriculture to climate change is still not well advanced [3,31]. However, there is an increasingly notable need to take into account regional climate changes in economic forecasts for many sectors, including agriculture, and in preparation of recommendations for adapting farms to climate change [12,32,33,34]. The research conducted so far in Poland concerned various aspects of climate change [35,36,37,38,39] and its impact, among others, on the shaping of agro-climatic conditions on a national scale [21,23,40], on the development of pests [25], as well as on a regional scale, which includes works describing crop-weather relationship studies [41]. A separate group is the research that is related to the development and use of climate change scenarios [33]. This article is part of the study on monitoring temperature changes on a regional scale, and because of the significance of the Lower Silesia region in crop production, it is important from the point of view of future adaptation of agriculture to climate change. The purpose of the article is to qualitatively determine the changes that took place between 1951 and 2014 in air temperature and agricultural thermal seasons in the south-western part of Poland.
2. Materials and Methods
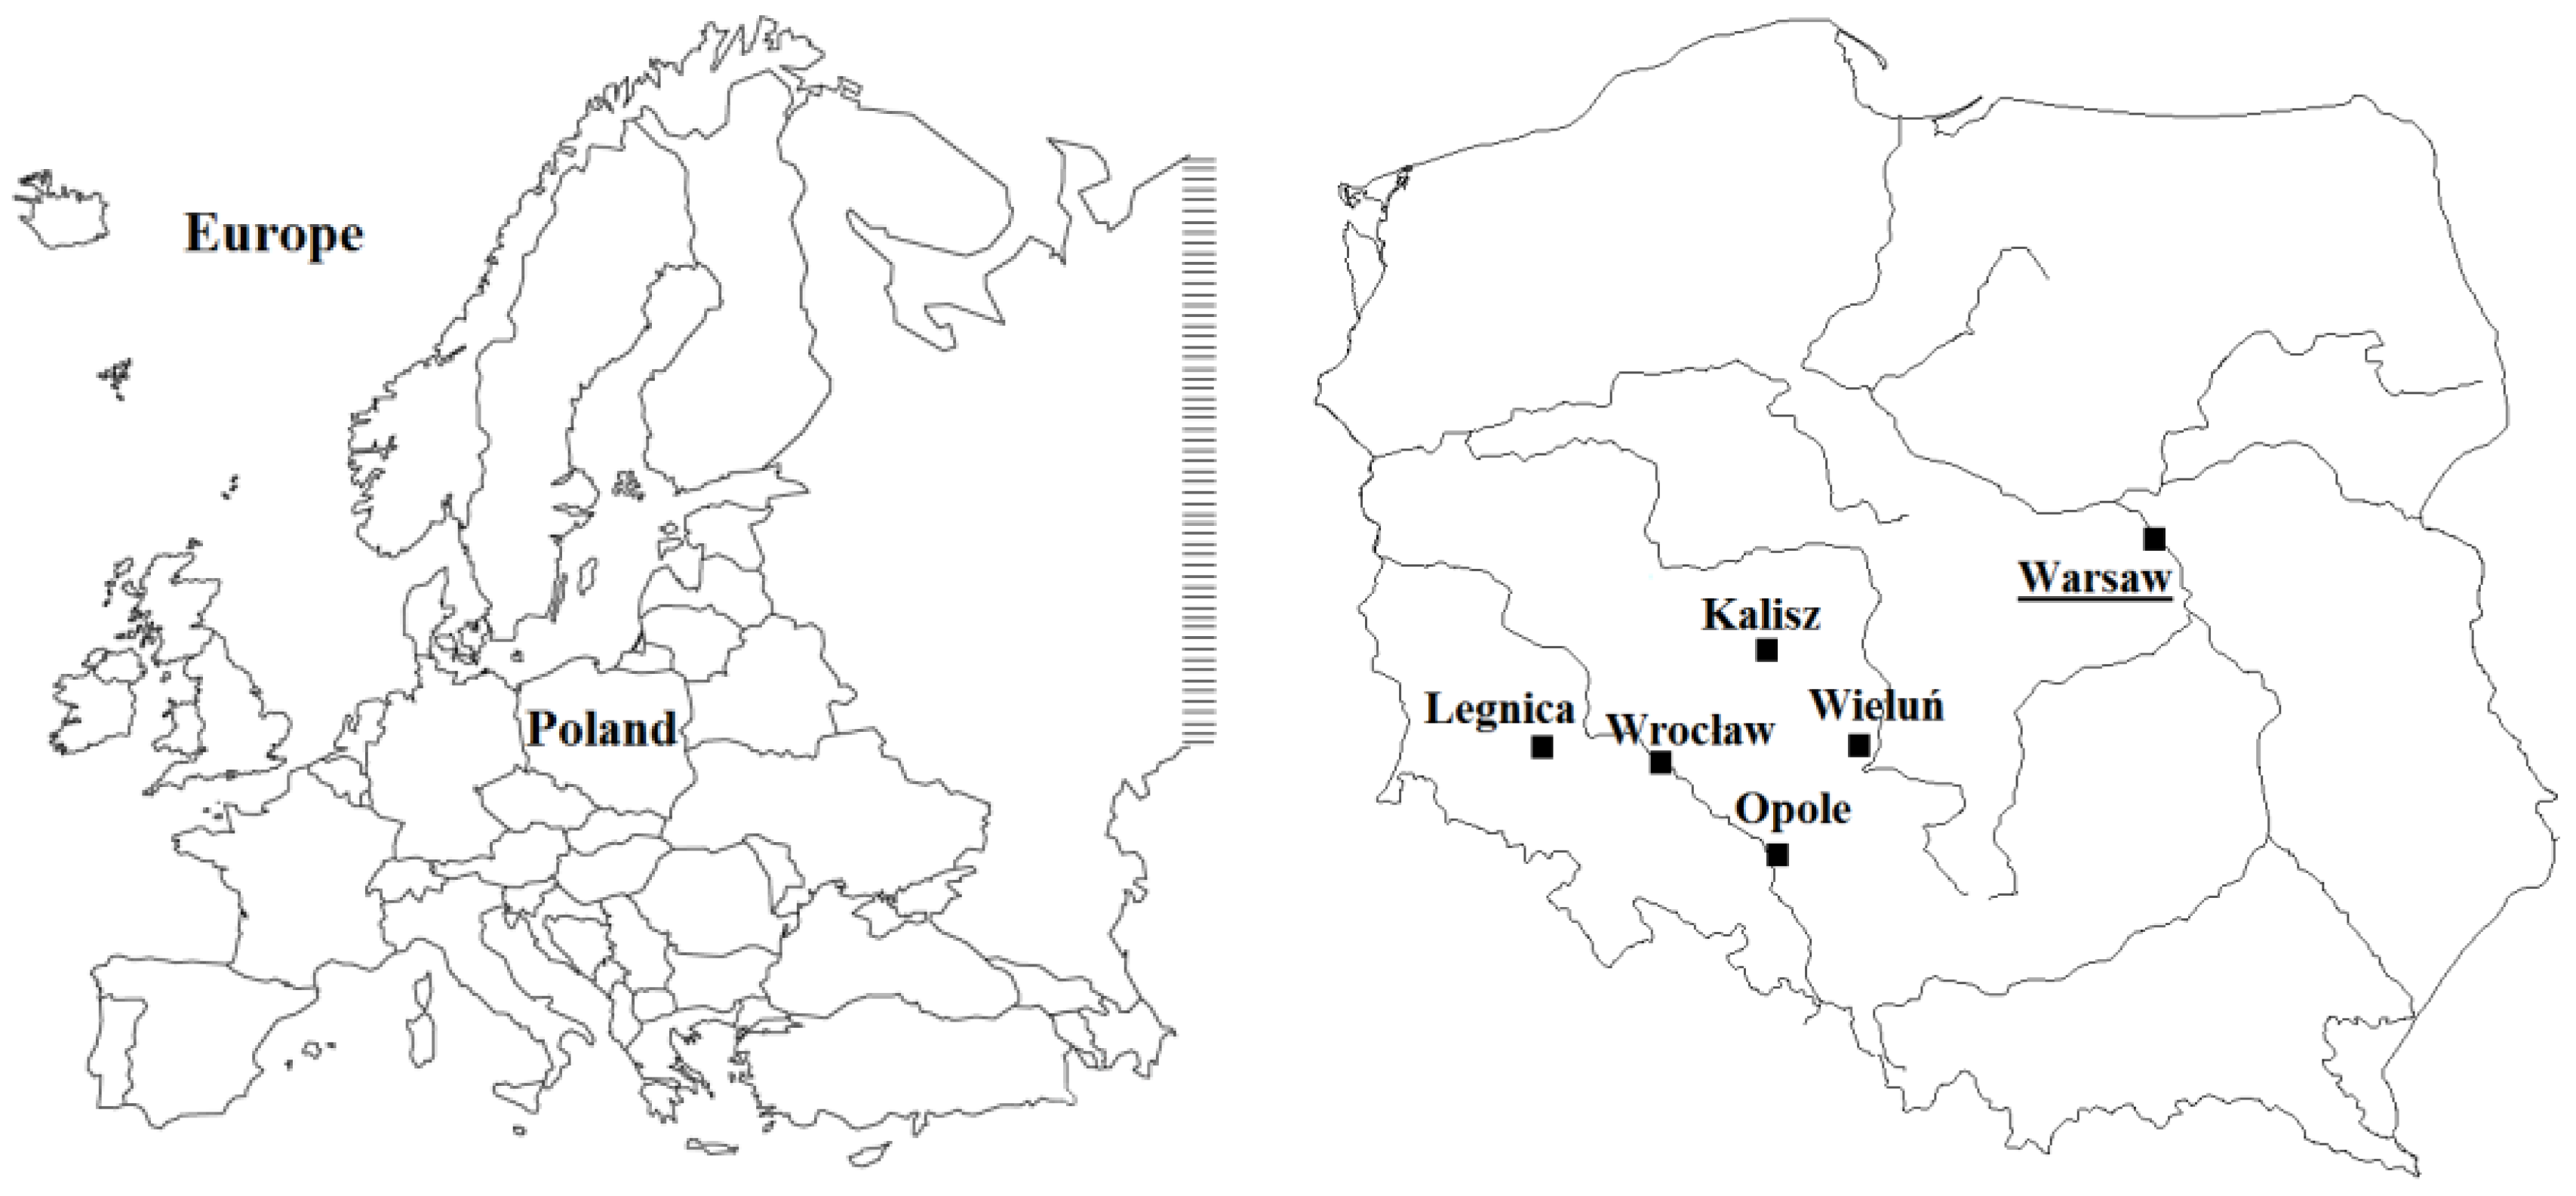
To achieve its goals, this paper examined the monthly and daily values of air temperature (Ta, °C) from five meteorological stations that were included in the state monitoring of the ground level atmosphere, located in the lowland part of south-western Poland (Figure 1, Table 1). This area is characterised by the most favourable conditions for the development of agriculture in the country [35,42]. The highest assessment of soil and climatic suitability for agriculture in this region was confirmed in the production space valuation conducted by the State Institute of Soil Science and Plant Cultivation in Puławy [43]. The cropping pattern in the region is dominated by cereals (approx. 70% of agricultural area). Wheat had the largest share in the cereal cropping pattern, (>50% of the total cereal cultivation area), among other cereal crops, there were maize, barley, and triticale [44]. A significant share in the cropping pattern of Lower Silesian Voivodship was made up of industrial plants, including mainly rape and turnip rape, as well as sugar beets. Cereal yields that were obtained in the region are among the highest in the country, and Lower Silesian Voivodship is the largest producer of wheat, rape, and turnip rape in Poland. The production of ground vegetables (including growing in home gardens) in Lower Silesian Voivodship was underdeveloped; similarly, the region’s share in the production of fruit from shrubs and berry plantations was small when compared to the whole of Poland.
The meteorological data used in the research, i.e., the average daily temperature for five stations, were made available by the Institute of Meteorology and Water Management-National Research Institute, which also verified them. The air temperature, between 1951 and 2014, was read each time at 2 m above ground level according to the recommendations of the World Meteorological Organization. Single cases of missing data were complemented based on constancy of differences method. Data homogeneity was assessed by the reviewing time series and by the correlation method. Thermal conditions were characterised separately for individual meteorological stations—namely Kalisz, Legnica, Opole, Wieluń, and Wrocław—and for the whole region, as the average of all analysed stations in a given time frame.
The time variability of air temperature by month, season (spring: March–May, summer: June–August, autumn: September–November, winter: December–February) and on a yearly scale was described on the basis of the arithmetic mean (, °C), standard deviation (sd, °C), as well as the lowest (min, °C) and highest (max, °C) value recorded. Ta course in the subsequent years of 1951–2014 was also evaluated based on the correlation coefficient of the linear trend and regression function, from which 10-year changes of the described indicator were read with a significance level of P < 0.01, P < 0.05 and P < 0.1. The adjustment of the regression function to the empirical data was determined based on Student’s t-Test and Snedecor’s F-distribution.
The thermal quantile classification of air for individual stations and the region was carried out on the basis of the criteria of Miętus et al. [45], which are illustrated in Table 2. Classifications that are based on scale intervals determined by specific quantile values have been gaining increasing recognition in recent years. Such classifications, among others, are used by the Intergovernmental Panel on Climate Change (IPCC) to assess climate change at specific time intervals [46].
Daily Ta values, which were considered in seasons and on an annual basis, were used to determine the frequency in adopted, in 2 °C intervals, from −22 to 28 °C, and to assess the course of variation in the subsequent years of the analysed 1951–2014 multi-year period.
This article also characterised agricultural thermal seasons: plants’ winter dormancy, farming and vegetative periods, and active plant growth and maturing periods, determined on the basis of threshold and daily values of air temperature. The following criteria were adopted [47]:
- -
- period of thermal winter: Ta ≤ 0 °C,
- -
- farming period: Ta ≥ 3 °C,
- -
- vegetation period: Ta ≥ 5 °C,
- -
- period of intense vegetation: Ta ≥ 10 °C, and
- -
- plant maturation (thermal summer): Ta ≥ 15 °C.
In the next stage of the study, the average duration of individual agricultural thermal periods for the selected decades and the entire multi-year period was calculated. This was undertaken throughout the whole analysed multi-year period and in two of its extreme decades—1951–1960 and 2005–2014. In both cases, the number of days of a given farming period was determined on the basis of daily air temperature data from particular years of the analysed multi-year periods. All the days that meet the temperature criterion in a given year were included in the calculations. Farming periods were described by a linear trend using correlation and regression analysis. In the analysis, the authors used the software: Statistica 12.0 and Excel 2007.
3. Results
3.1. Average Air Temperature in the Years 1951–2014
During the 1951–2014 multi-year period, in the area of south-western Poland, average annual air temperature was 8.3 °C in the east of the region, in Wieluń, while it was 8.9 °C in its western part, in Legnica (Table 3). In the east of the region, the average seasonal air temperature was lower than the temperature in the rest of the study area in each of the seasons in question. In the western part of the region, the average seasonal air temperatures were clearly higher than in the rest of the area only in winter, while in spring and summer, the warmest town in the region was the southernmost Opole.
The thermal privilege of the western part of the region was mainly due to its higher temperature in the cool season, when compared to the rest of the region (Table 3). The warmest month of the year was July (18.7 °C) in Opole. The largest differences in the average monthly temperature between towns in the region occurred in winter, in January and February. The coldest month of the year in the region was January (−2.0 °C) in Wieluń. The most even average monthly temperatures in the region were in spring and summer, especially in April and May, when the largest differences were up to 0.4 °C. The standard deviation of the mean annual temperature was 0.9 °C, among the seasons, the highest variation characterized winter (sd = 2.2 °C) and the lowest characterized autumn (0.9 °C < sd < 1.0 °C) and summer (0.9 °C < sd < 1.1 °C). The most variable month in this respect was February (sd = 3.4 °C), while the least variable was June (sd = 1.2 °C).
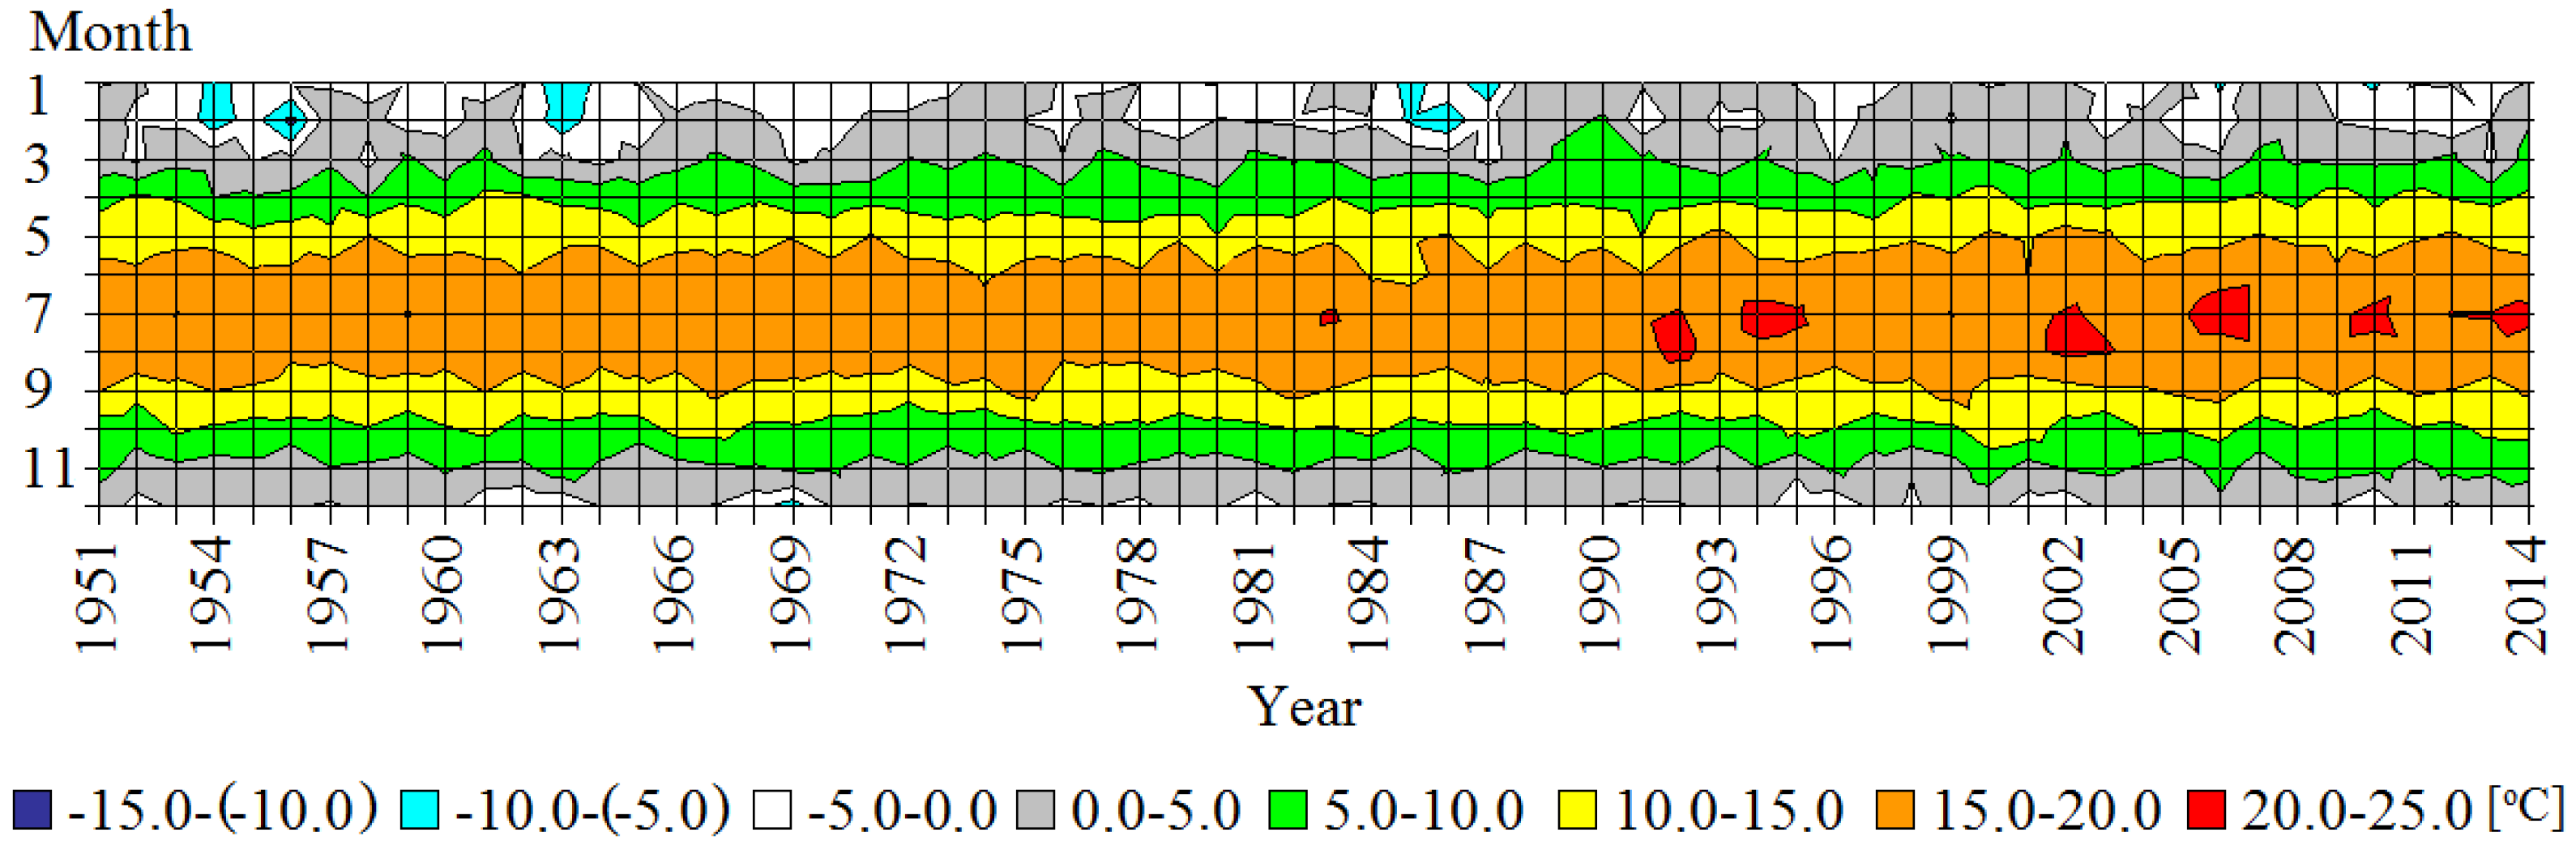
The time distribution of the average monthly temperature of the region in the research years showed clear regularities (Figure 2). The most visible was the increase in average temperature in the summer months. From the beginning of the 1990s, the July and August mean temperatures more often exceeded 20 °C. During the first 30 years of the period under study, such temperatures did not occur even once. At the same time, in the winter months, in January and February, the frequency of the occurrence of an average monthly temperature below −5.0 °C dropped.
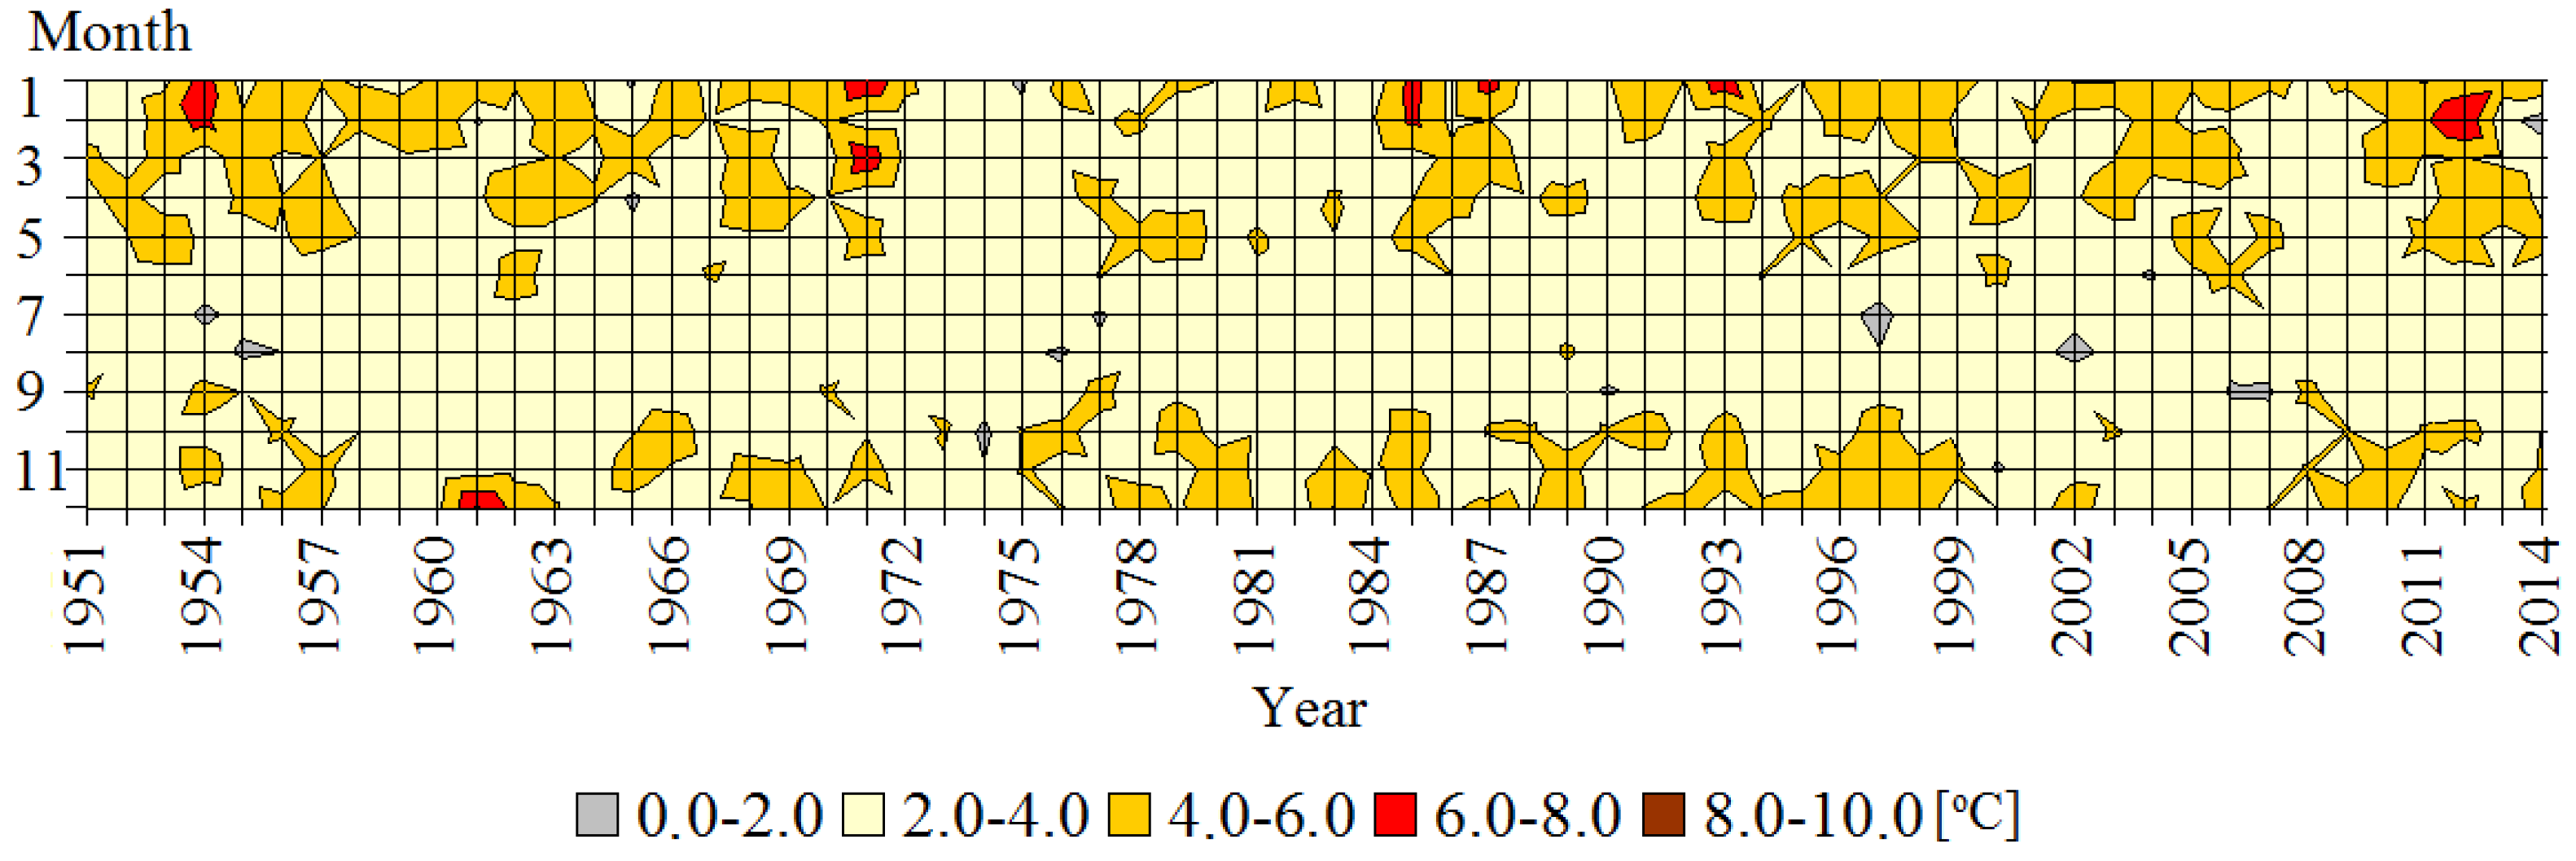
During the analysed period, the regularities in the variation of the standard deviation of daily mean temperature were much more difficult to confirm (Figure 3). It can be noticed that, during the period spanning 1951–2014, variation in average monthly temperature, which is expressed in standard deviation, was clearly lower (sd < 4.0 °C) in the warm season (June–September) than in the cold season (October–April).
The analysis of average air temperature differences between the two extreme decades of the analysed period showed that the last decade (2005–2014) was much warmer than the first, i.e., 1951–1960 (see Table S1). The differences between the average temperatures in the compared decades were positive in all of the analysed cities of the region in the year, in all seasons, and almost all months. December was an exceptional month, with its average temperature in the decade 1951–1960 warmer than in the decade 2005–2014. It was also a month whose average temperature in the period 2005–2014 was the closest to that of 1951–1960.
The range of air temperature variation in the studied region for the period spanning 1951–2014 is well illustrated by the list of the highest and lowest temperatures (Table 4). The highest average annual temperature for the whole region occurred in 2014, and it was as much as 4.0 °C higher than the lowest temperature that was recorded in 1956. Similarly, 1956 was the coldest and 2014 the warmest year at all five measuring stations. The coldest winter occurred in 1963. The average winter temperature in the whole region was −7.4 °C, and at individual stations this ranged from −7.1 °C in Legnica and Wrocław to −7.9 °C in Kalisz.
The highest winter temperatures were recorded in 2007; the average temperature in the region was 3.6 °C, and at stations it ranged from 2.9 °C in Wieluń to 4.3 °C in Legnica (Table 4). In the remaining seasons in the region and at all of the stations, spring was the coldest in 1955, when temperatures ranged from 5.1–5.9 °C; the coolest summer occurred in 1978, with a temperature of 15.6–16.1 °C. Autumn was the coldest in the region and at most stations in 1952; in Legnica and Wieluń, however, the lowest autumn temperatures were recorded in 1993. In turn, the highest temperatures in the remaining seasons were recorded in the spring of 2000 for the whole region and at almost all of the stations, except for Wrocław (here it was the warmest in 2007). The summer was the warmest in the region and at all stations in 1992, as well as autumn of 2006 in the region and at nearly all stations. The exception was Wrocław, for which the warmest autumn was in 2014.
3.2. Air Temperature Trends
Such a time distribution of the highest and lowest temperatures in the region is an indication of a warming trend. A statistically significant, positive linear trend was confirmed for the annual average temperature, seasonal averages, and monthly averages during the periods spanning February–May and July–August in the whole region and at all of the stations under consideration (Table 5).
The highest value of the correlation coefficient was calculated for the average annual temperature in the north of the region, in Kalisz (Table 6). High values of the correlation coefficient were also confirmed for the annual average temperature and in spring in the whole region, in Kalisz and in Wrocław. On average, throughout the region, the positive annual air temperature trend in the study years was 0.26 °C/10-year. The highest temperature increase was confirmed in spring (0.37 °C/10-year) and in winter (0.30 °C/10-year). In the case of the average monthly temperature, the largest changes were observed in February (0.44 °C/10-year), and then in March and April (in both months 0.38 °C/10-year). In Wrocław, there was a higher temperature increase in summer than at other stations (0.28 °C/10-year); in the remaining seasons, the highest values of the increase in temperature were observed in the north of the region, in Kalisz (0.19 °C/10-year in autumn and 0.42 °C/10-year in spring). In the case of average monthly temperature, the largest changes in the multi-year period were observed in the north, in Kalisz, at the turn of winter and spring (0.49 °C/10-year in February, 0.44 °C/10-year in April) and in Wrocław in spring and summer (0.36 °C/10-year in May, 0.35 °C/10-year in July and 0.36 °C/10-year in August). In none of the considered cases was a negative temperature trend observed. Despite changes in the average temperature, its standard deviation was not subject to clear trends. A significant positive trend was statistically confirmed only in the case of the standard deviation of the average summer air temperature in Kalisz and the monthly average in October across the whole region, in Kalisz and Wieluń. However, in September, a statistically significant decrease in the standard deviation was observed at all of the stations.
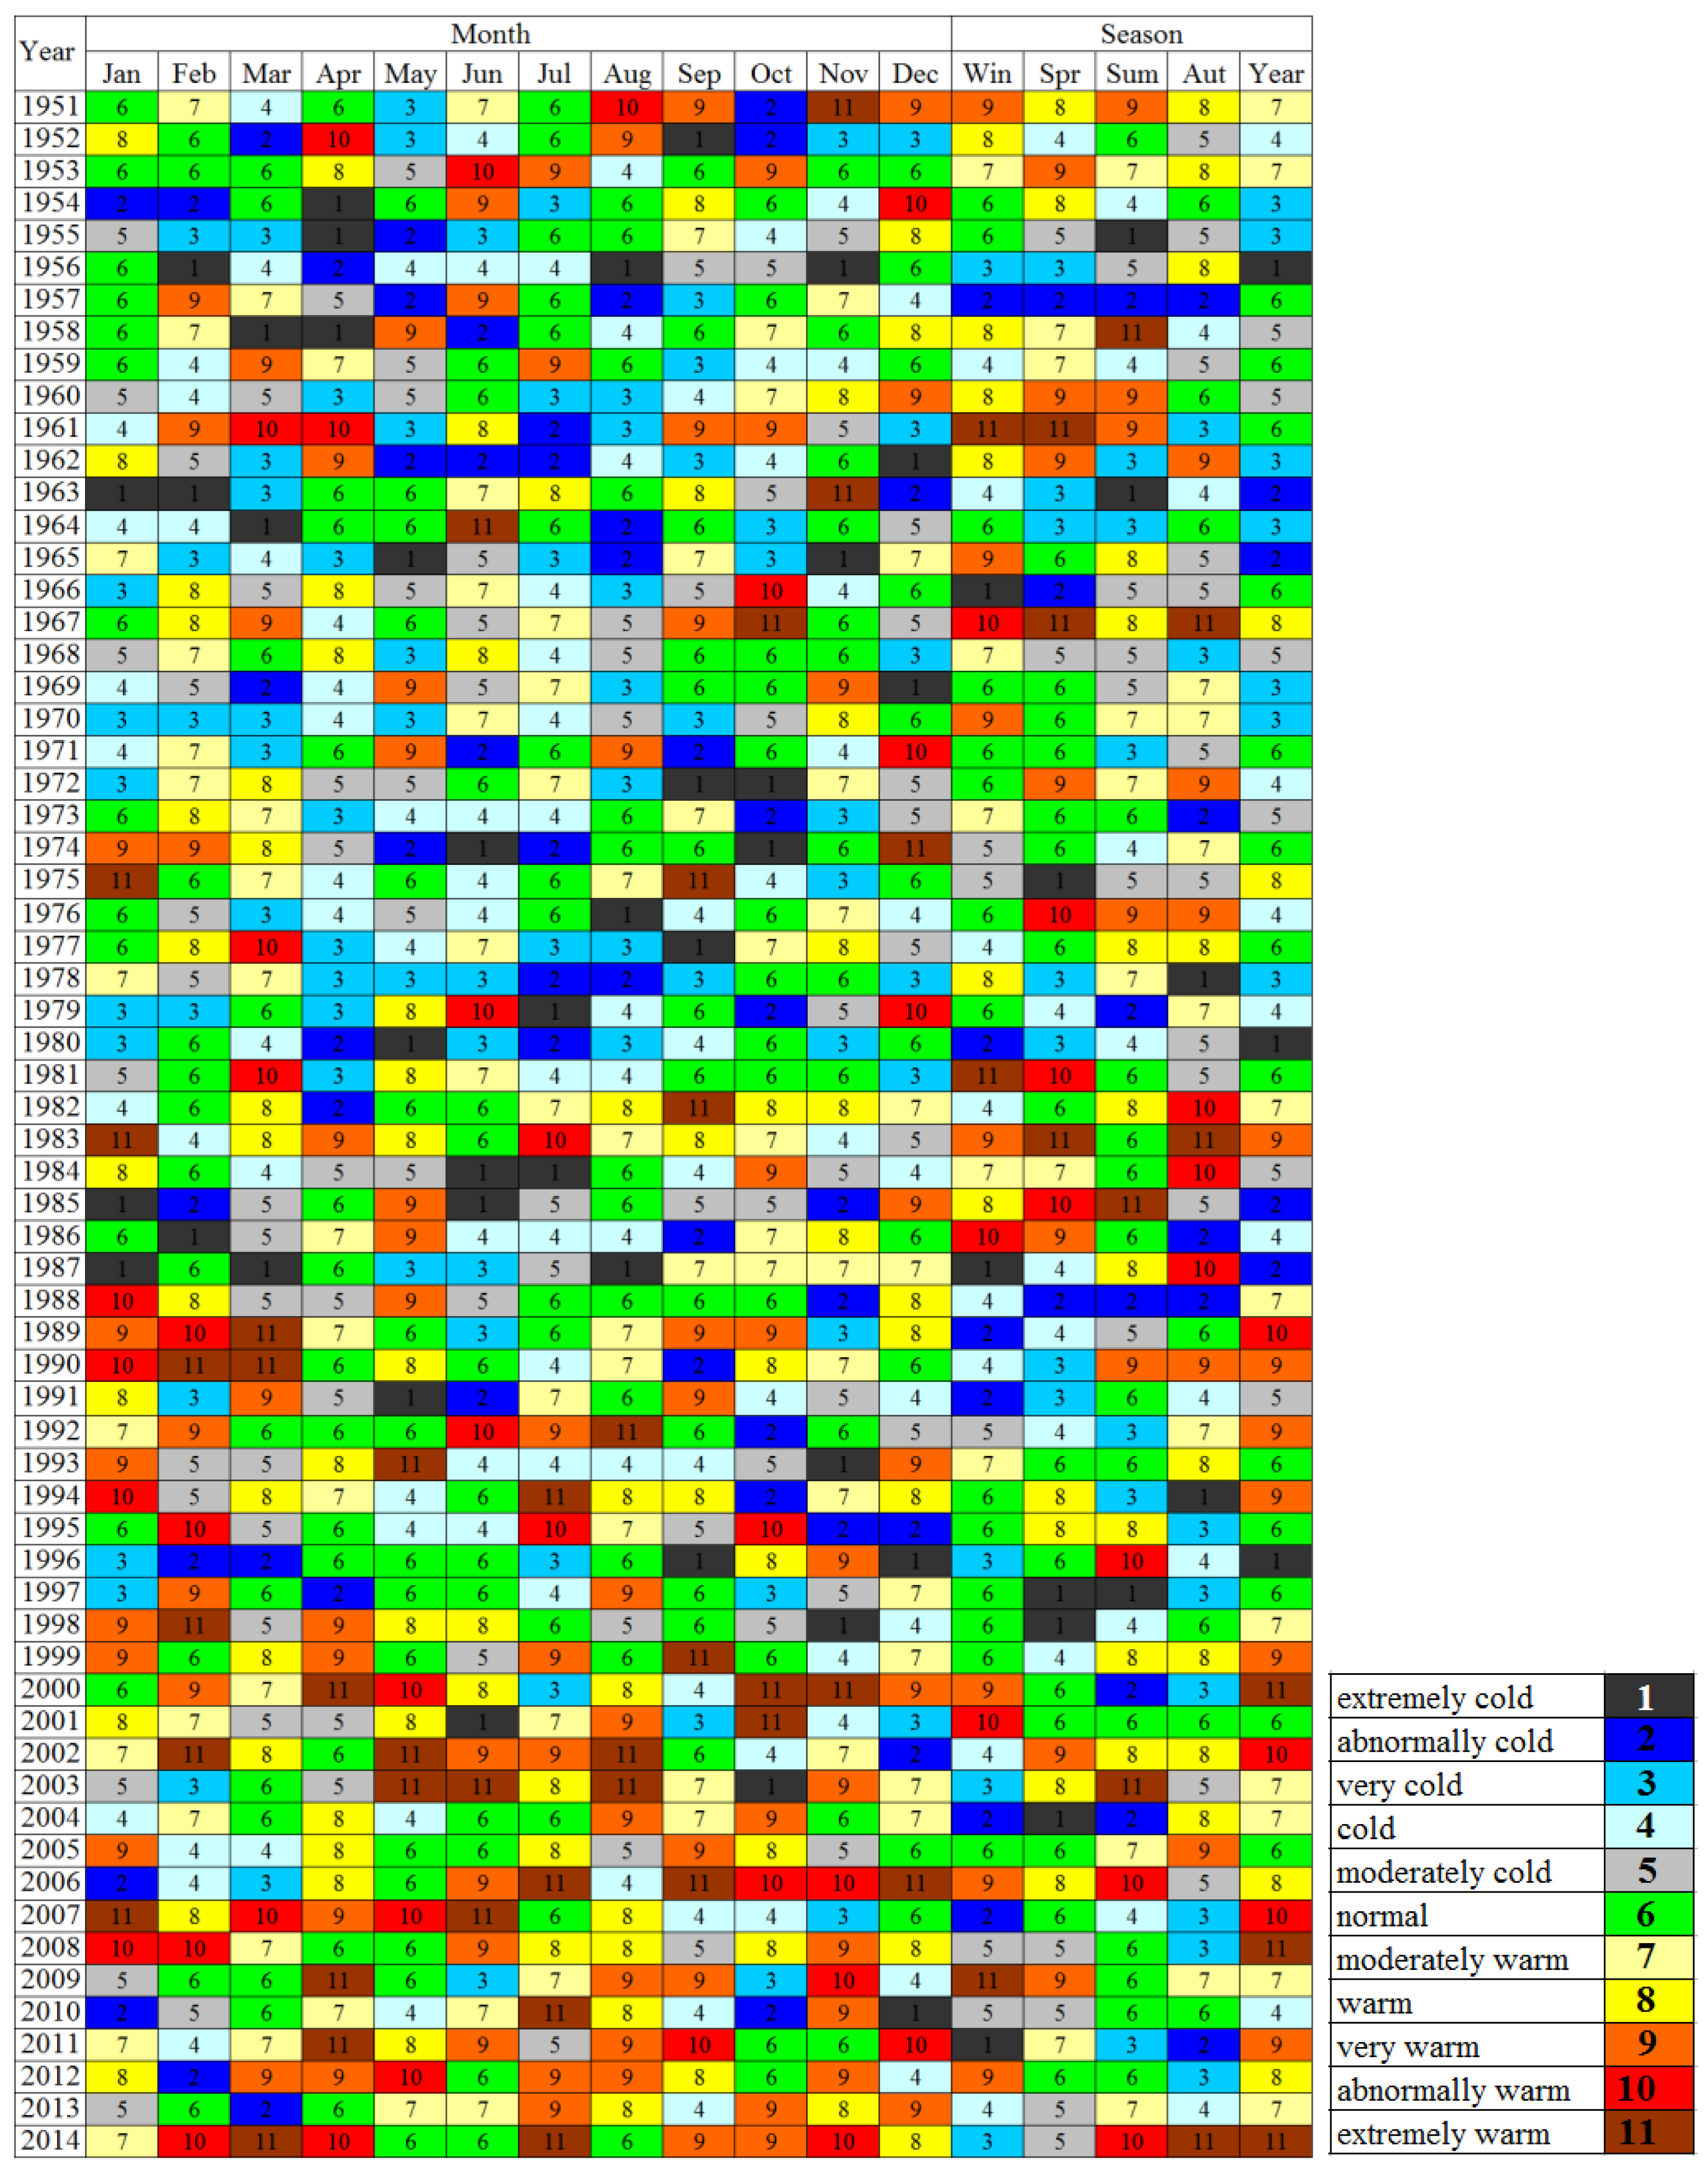
The thermal quantile classification of air illustrates the changes pf the average monthly, seasonal and annual air temperatures in the entire studied region (Figure 4) underwent. While the number of extremely cold months in the first half of the analysed period was slightly higher than in the second half (23 cases as compared to 16), the number of extremely hot months was almost four times smaller compared to the second half of the analysed period (7 compared to 26). According to the thermal classification of individual years, before 1988, there were 23 years when a temperature below the norm was experienced; after 1988, there were only three such years: 1991, 1996, and 2010. In contrast, cases of extremely hot years occurred only after 1999–in 2000, 2008, and 2014.
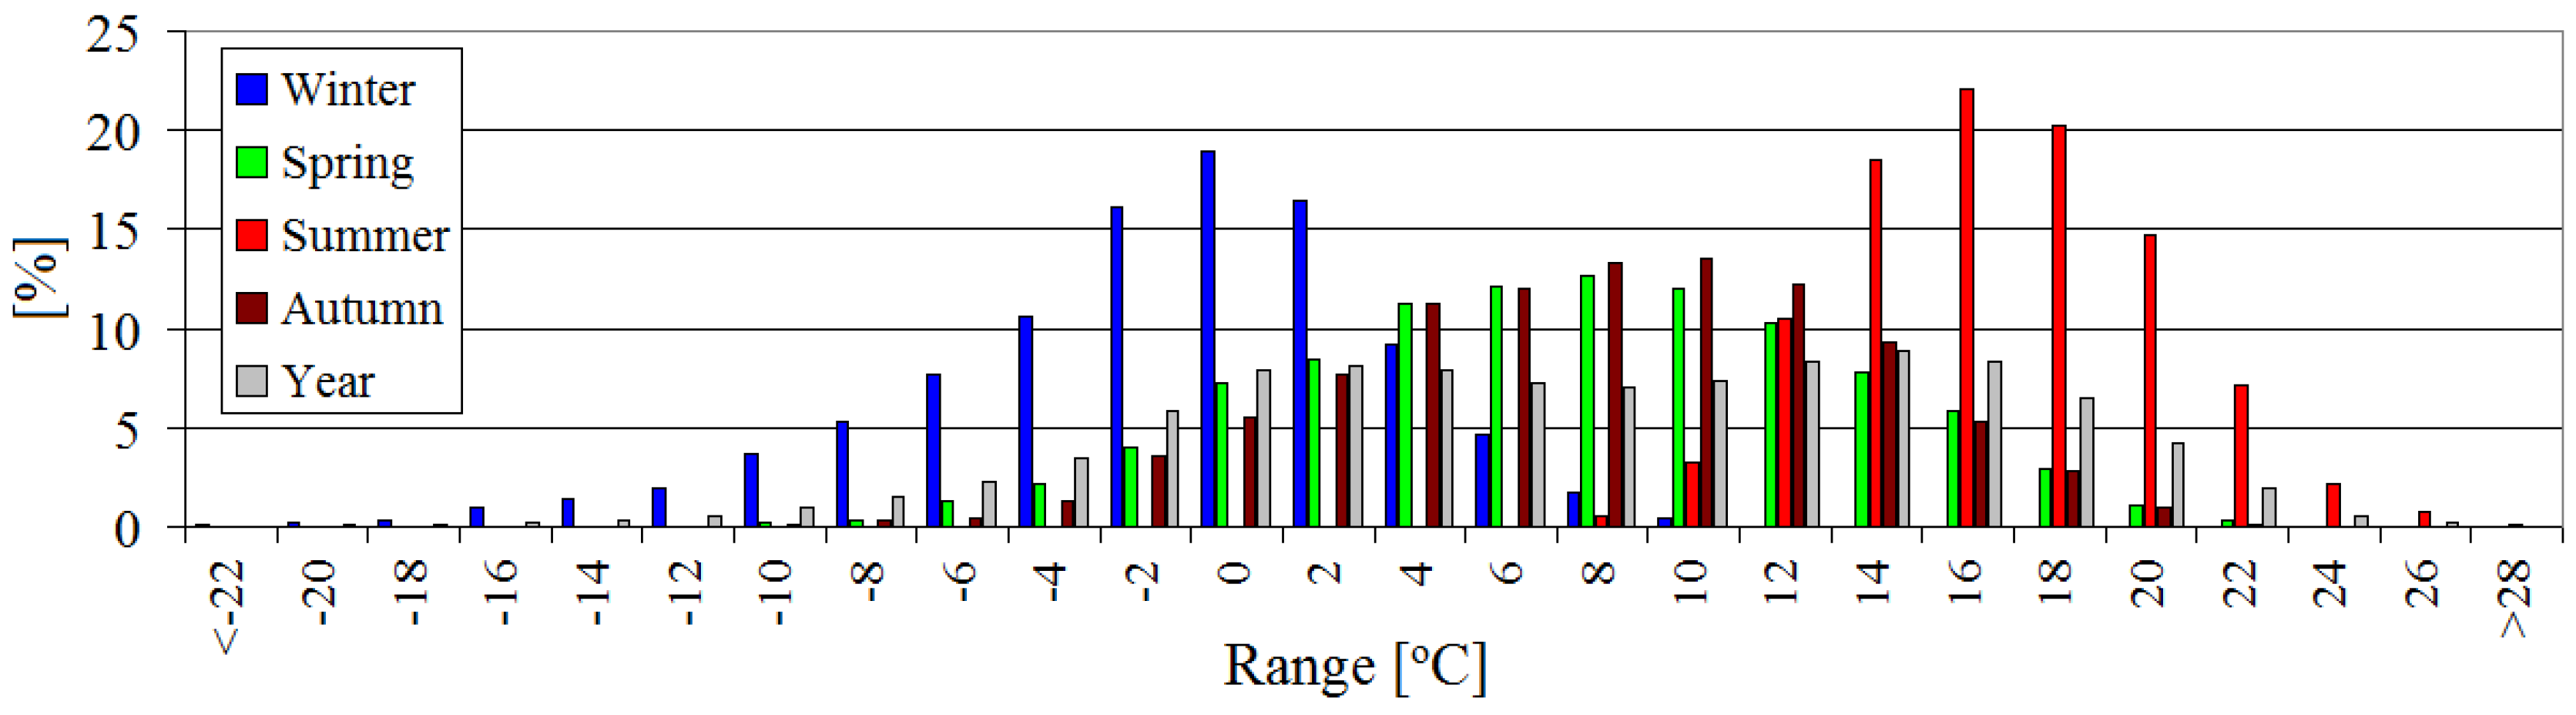
Average daily temperatures of <−20 °C were rare (Figure 5). In winter, the most frequent class of air temperature was −2 to 0 °C, in spring 6–8 °C, in summer 14–16 °C, in autumn 8–10 °C, and for the whole year 12–14 °C.
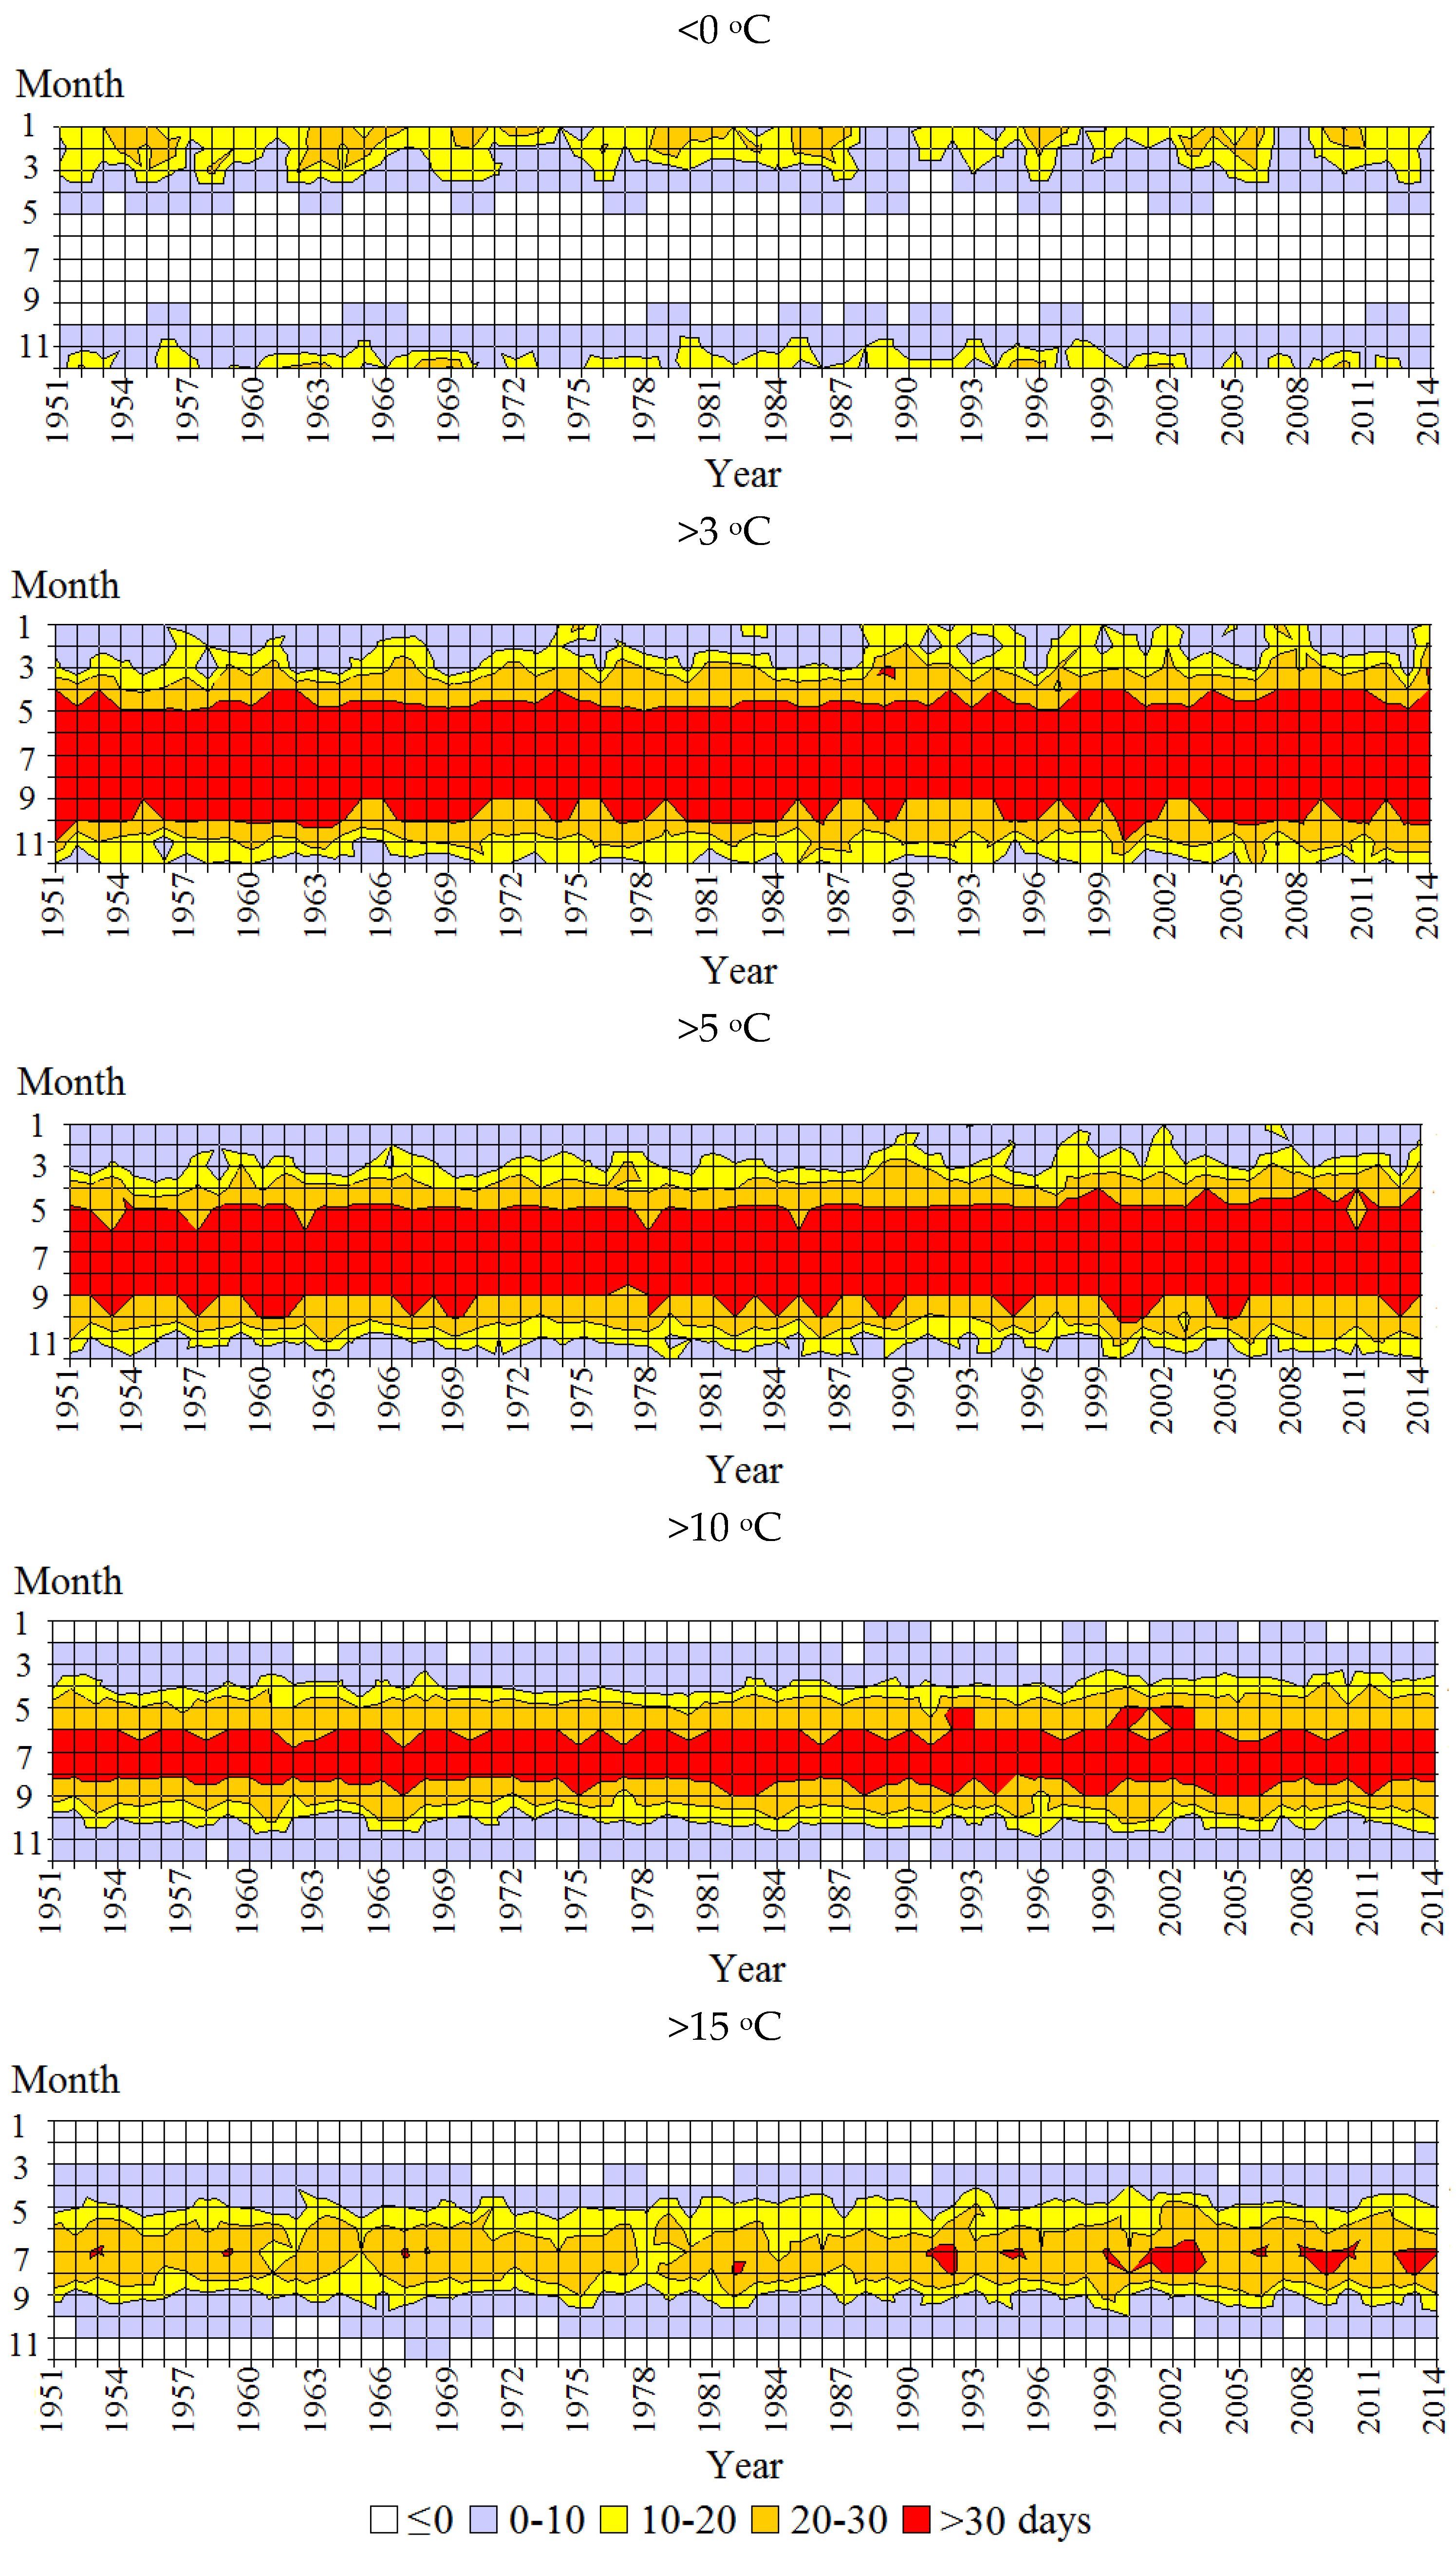
The changes taking place in the years of the study were particularly pronounced in the period spanning January–March. In the first quarter of the year, average daily temperatures within the −20 to −10 °C range occurred frequently until the mid-1970s, when they even appeared in early March. In the April–June quarter from the early 1980s, average daily temperatures in the range of 0–10 °C were less frequent. In July–September the frequency of average daily temperatures in the range of 20–30 °C increased at the same time (from the early 1980s). In the last quarter of the year, from the end of the 1980s, temperatures ranging from 0–10 °C were occurring increasingly late.
3.3. Agricultural Thermal Periods
In the next stage of the study, the air temperatures characterising the agricultural thermal seasons were analysed. Between 1951 and 2014, the length of winter dormancy for plants was, on average, 50 days in the west of the region (in Legnica) and 62 days in the east (in Wieluń); moreover, the farming period lasted for 257 days in Wieluń and 273 days in Legnica (Table 7). The spatial variation of the length of the growing season in the region was almost two weeks; the duration of this period ranged from 229 days in Wieluń to 242 days in Legnica (Table 8). The period of active plant growth lasted 165 days in Wieluń and Kalisz and 172 days in Opole and Legnica; moreover, the length of the plant maturing period was 93 days in Wieluń and 100 days in Opole. We analysed the time distribution of the number of days with the air temperature characterising the selected agricultural thermal periods. This analysis showed that, from the beginning of the 21st century in the region, the period of winter dormancy of plants started increasingly later; moreover, the farming period and the plant vegetation periods started increasingly earlier, and the period of active plant growth was prolonged. The changes associated with the prolongation of the period of plant maturation have been visible since the early 1990s (Figure 6). The changes that took place between 1951 and 2014 in the length of agricultural periods are even more clearly illustrated in Figure 7.
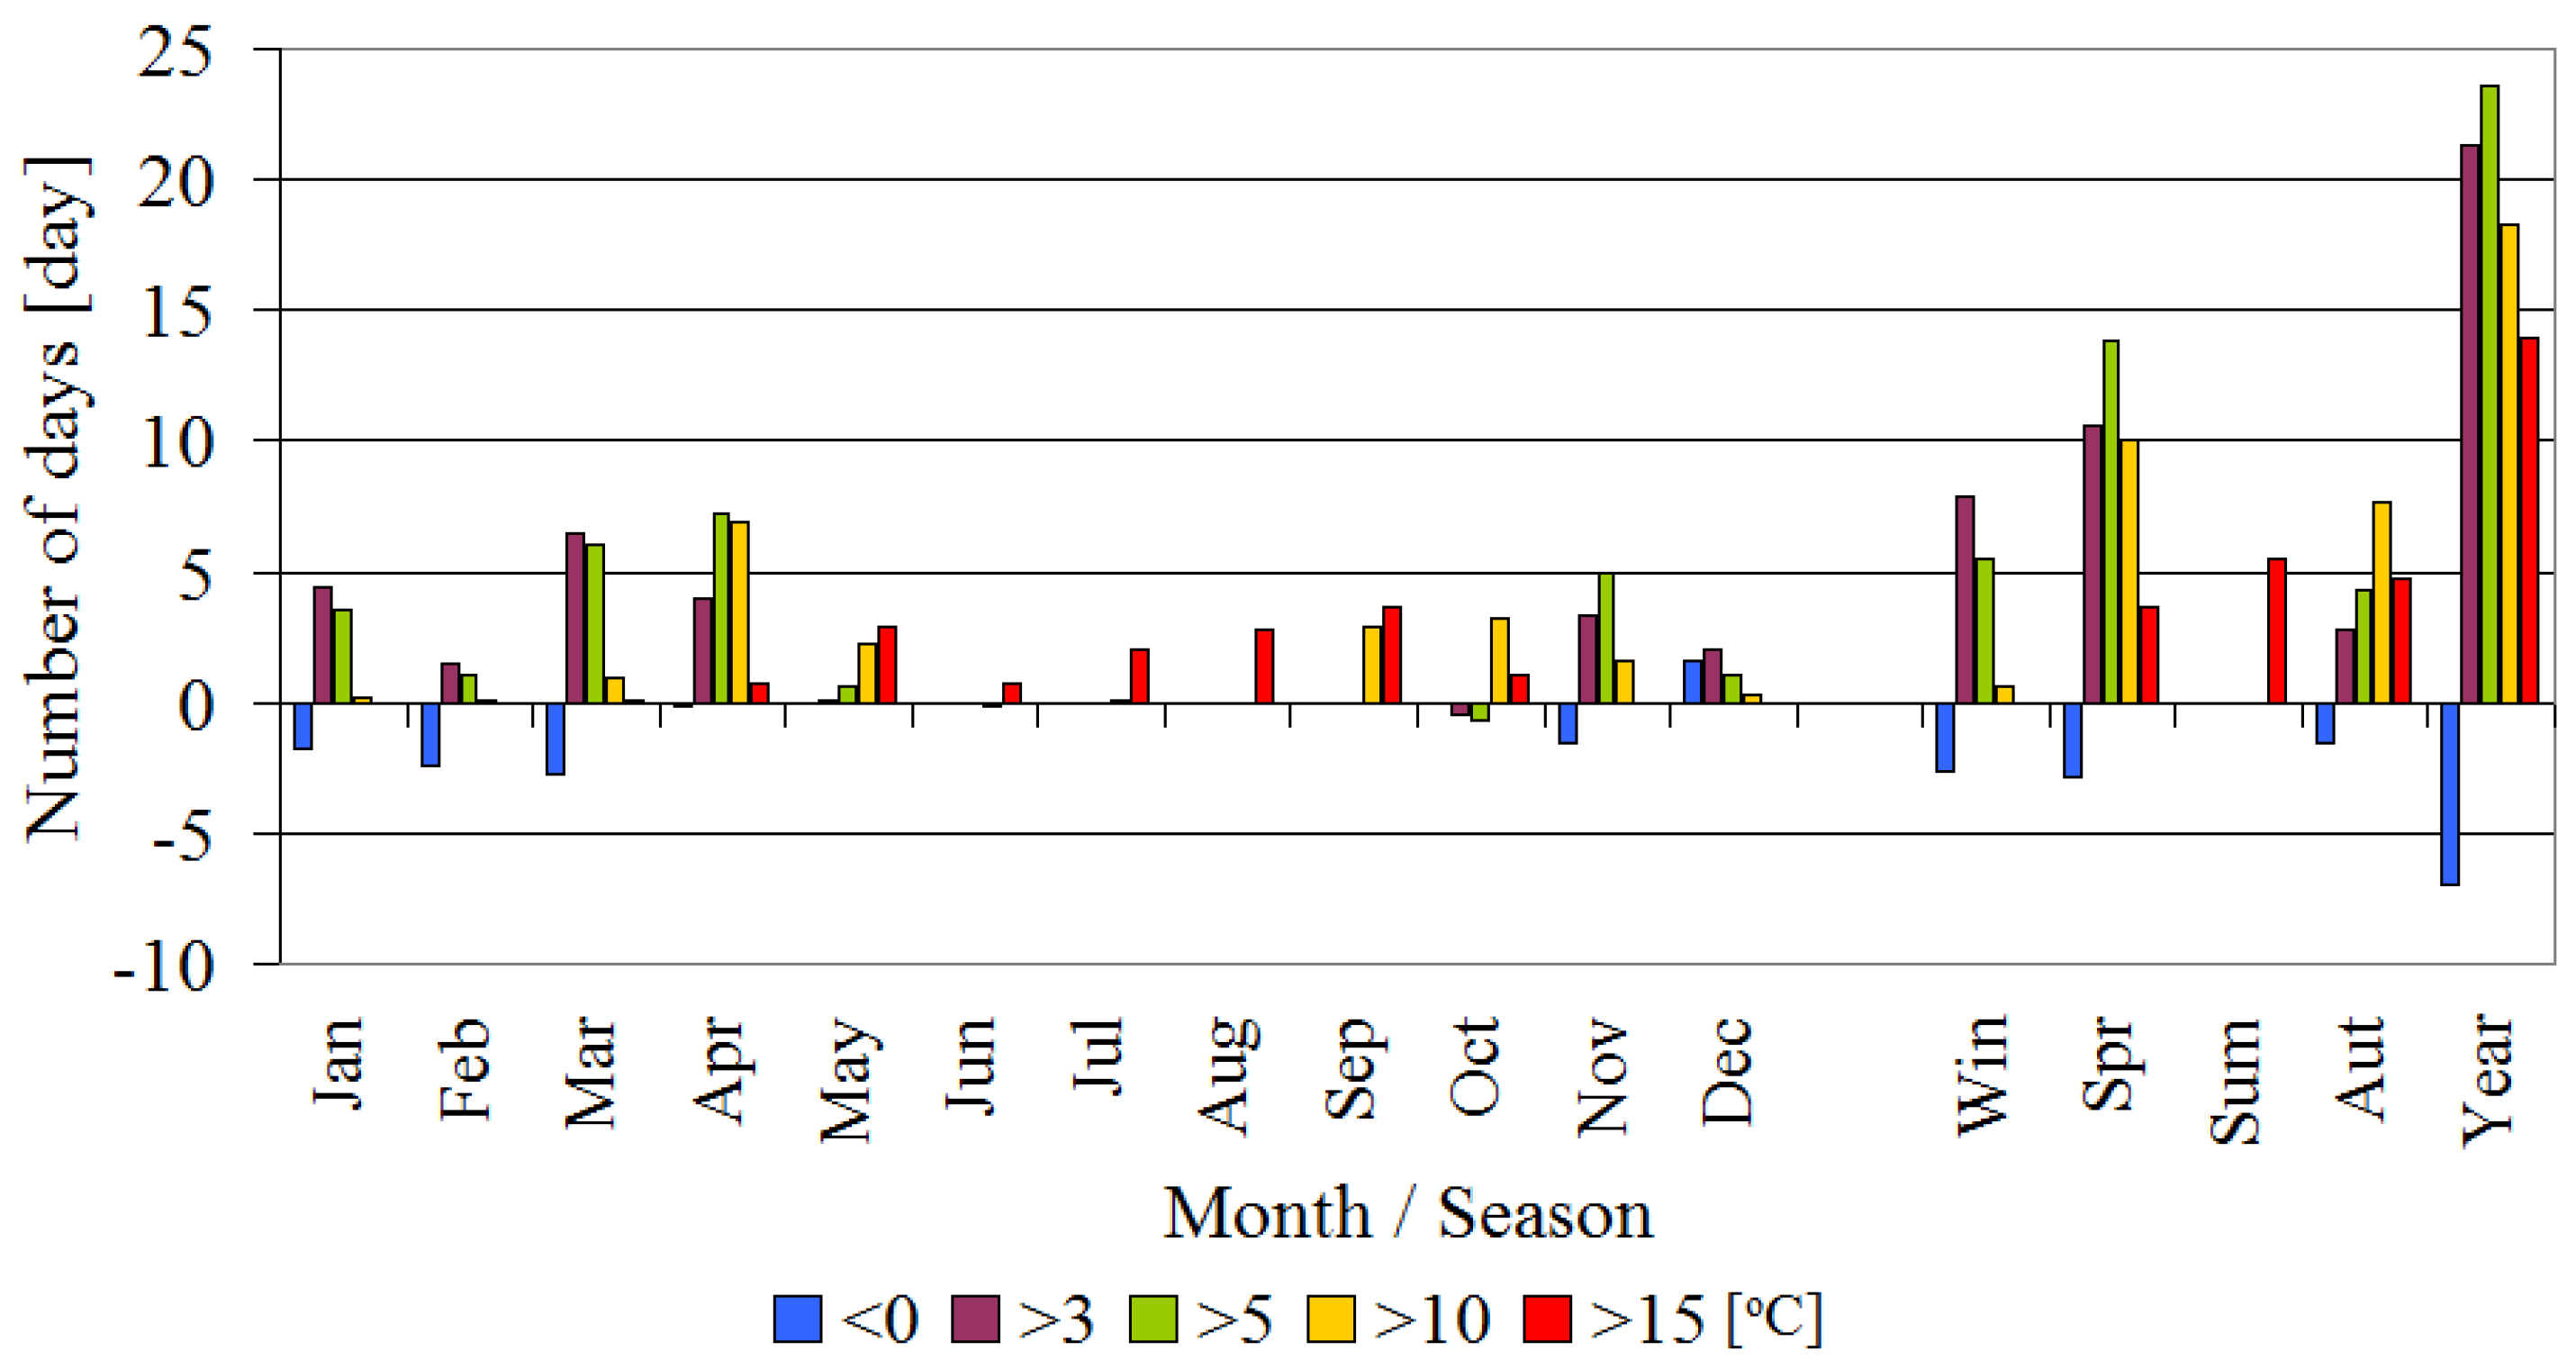
The comparison between the length of these periods between the first and the last decade of the study period showed that the number of days with a temperature of <0 °C was reduced, by seven days a year (refer to Figure 7). This was primarily a result of a reduction in the number of days with such a temperature in March, February, but also in January and November. Among the considered agricultural periods, the period with a temperature of >5 °C was the most prolonged, by approximately 24 days a year. The prolongation of plant vegetation period was due to the increase in the number of days with a temperature of >5 °C in March, April, and November. The duration of the farming period was also significantly longer, by approximately 21 days; this was mainly due to the higher number of days with a temperature of >3 °C in March, as well as in January and April. The negative linear trend of the number of days with a temperature of <0 °C was confirmed statistically for the temperature in the whole region and at most stations (except Wieluń) throughout the year and in March; in spring, this was the case for the whole region and all stations (see Table S2).
The extension of the farming period was statistically significant for the whole region for the whole year; in winter, spring and in January and March; in April, this was the case for everywhere except Legnica. A positive, statistically-significant trend in the number of days with a temperature of >3 °C was also confirmed in February and May for Kalisz and Opole. In the entire region and for all of the stations, a statistically-positive trend in the number of days with a temperature characterising the growing season, active plant growth, and the maturation of plants throughout the year, in spring and in May was confirmed (see Table S3). In the entire region and at individual stations, the trend correlation coefficients were the highest for the number of days of active plant growth.
In the years 1951–2014, for the south-western Poland, a positive trend of the average annual air temperature was confirmed and it was 0.26 °C/10-year. The highest temperature increase was confirmed in spring (0.37 °C/10-year) and in winter (0.30 °C/10-year). In the case of average monthly temperature, the largest changes were observed in February (0.44 °C/10-year), and then in March and April (in both months 0.38 °C/10-year). In studies that were carried out in the border region of Poland and Saxony (the western part of the area analyzed in the study), the annual average air temperature increased from 1.0 to 1.2 °C in the years 1971–2010, i.e., at a level that is similar to that is shown in the present study [48]. The positive trend of the average annual air temperature at the turn of the 21st century was also confirmed in other regions of Poland. The size of the observed changes is of course different, depending on the region and the period of research [46]. For example, on the Słowiński Coast, there was an increase in the average annual temperature in 1966–2009 by 0.32 °C/10-year [49], similarly in the Baltic Sea Coastal Regions in the years 1951–2008 by 0.27 °C/10-year [39]. On the other hand, in the vicinity of Bydgoszcz (central Poland) in the years 1931–2013, the trend of the average annual air temperature was 0.19 °C/10-year, with greater warming being observed in the cold half-year [37]. According to Ziernicka-Wojtaszek and Krużel [36] throughout Poland, the average annual temperature in the years 1981–2010 increased at a rate of 0.33 °C/10-year, which was mainly due to a strong increase in the average temperature in spring and summer. Similarly, in the border region of Poland and Saxony, the highest temperature increase was confirmed for spring and summer (from 1.5 to 1.9 °C in 1971–2010), and the lowest for winter (from 0.1 to 0.7 °C in 1971–2010) [48].
These results are slightly different from those obtained for the area of south-western Poland. However, as in this study, the highest increase in the average seasonal temperature in spring and then in winter was found in south-eastern Poland [38], while in Slovakia, bordering on Poland in the south, the highest increase in average temperatures was observed in January and June–August [50].
4. Discussion
Scenarios regarding the impact of climate change on agriculture in Poland indicate a high probability of reducing the average yield of arable crops by 5–15% of the multi-year averages in almost the entire territory of the country. One exception may be the submontane areas that are located in the central part of the south of the country, where a slight increase in yield is predicted. In the Lower Silesian Voivodship, according to the scenario that was developed in the PESETA project, assuming an average increase in the surface temperature of the Earth by 3 °C (HadCM3/HIRHAM A2 scenario), there may be a 5% reduction in yields; in contrast, when there is a 7 °C increase in this temperature (scenario ECHAM4/RCA3 A2), the reduction in yield can reach 5–15%. According to the forecasts that were developed for Poland using the Geophysical Fluid Dynamics Laboratory (GFDL) and the Goddard Institute for Space Sciences (GISS) scenarios, the yield reduction may be much higher for plants with relatively small thermal requirements, such as: potatoes, sugar beets, but also wheat [51].
The significant changes in air temperature in winter and spring that were observed in Lower Silesia may be of great importance for agriculture. Winter temperatures shape the wintering conditions of plants; they are important from the point of view of the plant conditions after winter. In southwestern Poland, including Lower Silesian Voivodeship, which is the largest producer of wheat in the country [44], the variability of weather conditions in winter is particularly important. It is worth noting that in Poland the share of spring cereals in crops is relatively small, as winter cereals constitute nearly 80% of total cereal area [52]. The temperature and dates of agricultural periods are important for the field work schedule; they have an impact on the effectiveness of agrotechnical operations. The increase in temperature causes the necessity of changes in the selection of cultivated plant varieties, but also gives the possibility of introducing new species to common cultivation. Thermophilic crops, including maize, may profit from climate change [24], which was not confirmed by research conducted in Central and Eastern Poland—in the study of Rosa et al. [41], maize yielded the lowest in the years with the highest temperature in July and August and the shortened growing season. In the studies concerning the borderlands of Poland and Saxony, a gradual improvement of thermal conditions for viticulture was found [48]. On the other hand, in the research of Walczak et al. [40], it was found that the spring temperature increase observed in Poland could have contributed to the development of some diseases of crops, while simultaneously limiting the intensity of fungal diseases. The impact of the air temperature increase on yields of plants is not clearly defined and it may vary depending on the phase in which the growth occurred, the species, and even the plant varieties, as well as the growing region [6,7,24,26,32,53,54].
The results that were obtained in this study indicate that the largest problem of agriculture in Lower Silesia may be a significant increase in temperatures in spring and summer, and an increase in the number of days with relatively high temperatures.
5. Conclusions
A statistically significant, positive linear trend was confirmed for annual average temperature, seasonal averages of temperature and monthly averages in the periods spanning February–May and July–August in the whole region of the lowland part of south-western Poland and at all stations considered. In none of the considered cases, a negative temperature trend was observed. The number of extremely cold months in the first half of the period under study was only slightly larger than the number of extremely cold months in the second half of the period; in contrast, the number of extremely hot months was almost four times smaller when compared to the second half of the period considered.
The statistically-confirmed increase in average monthly temperature in early spring (at the end of February and the beginning of March), in spring and summer had an effect on the variations in the course of crop vegetation in Lower Silesia. In the entire region, and for all stations, it was possible to confirm a statistically-positive trend in the number of days with the temperature characterizing the growing season, active plant growth, and the maturation of plants. Since the beginning of the 21st century, the period of winter dormancy of plants started increasingly later, while the farming and plant vegetation periods have started increasingly earlier and the period of active plant growth was prolonged. The changes that are associated with the prolongation of the period of plant maturation were visible even earlier, from the early 1990s. Among the considered agricultural periods, the growing season was the most prolonged, which can be related to the increase in the number of days with a temperature of >5 °C in March and April, and in November. The duration of the farming period was also significantly longer, which is mainly due to the higher number of days with a temperature of >3 °C in March, as well as in January and April. As a result, the winter dormancy period was shortened. The negative linear trend of days with a temperature of <0 °C was confirmed statistically for the entire region and most stations.
It can be assumed that the observed changes, both the shortening of the winter dormancy of plants and the prolongation of the growing season and other periods studied, have already today changed the cultivation conditions in the region. In terms of predicting the consequences of the currently-observed changes over the next decades, this is not an easy task. The impact of temperature changes on agriculture cannot be assessed without taking into account changes in moisture conditions. However, the nature of these changes may suggest that further cultivation of winter crops, such as wheat, oilseed rape, but also rye, may require far-reaching adaptation measures.
The development and implementation of these activities should be preceded by a good recognition of the weather-yield relationship in the conditions of a changing climate at the regional level. The research will therefore be continued in the future, and it will take into account current variability of climate elements and the reactions of selected crops to changes in the environment of south-western Poland.
Supplementary Materials
The following are available online at https://www.mdpi.com/2073-4433/9/6/215/s1, Table S1: Differences in the mean and standard deviation of temperature between the decades 2005–2014 and 1951–1960, Table S2: Correlation coefficients for relationship between the number of days with the air temperature characterizing the thermal periods of agriculture—winter plant dormancy (Ta < 0 °C, a) and farming periods (Ta > 3 °C, b) and the years 1951–2014; and the linear trend (in days/10 years), Table S3: Correlation coefficients for relationship between the number of days with the air temperature characterizing the thermal periods of agriculture: vegetation (Ta > 5 °C), active plant growth (Ta > 10 °C) and plant maturation (Ta > 15 °C) and the years 1951-2014; and the linear trend (in days/10 years).
Author Contributions
R.K. conceived of the presented idea and verified the methods. E.K. wrote this paper. All authors discussed the results and contributed to the manuscript. The study has been performed in collaboration between all the authors.
Conflicts of Interest
The authors declare no conflict of interest.
References
- Roos, J.; Hopkins, R.; Kvarnheden, A.; Dixelius, C. The impact of global warming on plant diseases and insect vectors in Sweden. Eur. J. Plant. Pathol. 2011, 129, 9–19. [Google Scholar] [CrossRef]
- Bregaglio, S.; Donatelli, M.; Confalonieri, R. Fungal infections of rice, wheat, and grape in Europe in 2030–2050. Agron. Sustain. Dev. 2013, 33, 767–776. [Google Scholar] [CrossRef]
- Carvalho, A.; Schmidt, L.; Santos, F.D.; Delicado, A. Climate change research and policy in Portugal. WIREs Clim. Change 2014, 5, 199–217. [Google Scholar] [CrossRef]
- Fukalova, P.; Středova, H.; Vejtasova, K. Development and prediction of selected temperature and precipitation characteristics in southern Moravia. Acta Univ. Agric. Silvic. Mendel. Brun. 2014, 62, 91–98. [Google Scholar] [CrossRef]
- Barančok, P.; Barančokowá, M. Historical changes in dispersed kopanitse land type and changes in use of agricultural land on Kysuce region ex ample. Ekologia (Bratislava) 2016, 35, 371–391. [Google Scholar] [CrossRef]
- Veriankaite, L.; Sauliene, I.; Bukantis, A. The modelling of climate change influence on plant flowering shift in Lithuania. Zemdirbyste 2010, 97, 41–48. [Google Scholar]
- Ozdŏgan, M. Modeling the impacts of climate change on wheat yields in Northwestern Turkey. Agric. Ecosyst. Environ. 2011, 141, 1–12. [Google Scholar] [CrossRef]
- Miao, Ch.; Duan, Q.; Sun, Q.; Li, J. Evaluation and application of Bayesian multi-model estimation in temperature simulations. Prog. Phys. Geogr. 2013, 37, 727–744. [Google Scholar] [CrossRef]
- Ozolinčius, R.; Lekevičius, E.; Stakènas, V.; Galvonaitè, A.; Samas, A.; Valiukas, D. Lithuanian forests and climate change: Possible effects on tree species composition. Eur. J. For. Res. 2014, 133, 51–60. [Google Scholar] [CrossRef]
- Zhang, Y.; Gao, Z.; Pan, Z.; Li, D.; Huang, X. Spatiotemporal variability of extreme temperature frequency and amplitude in China. Atmos. Res. 2017, 185, 131–141. [Google Scholar] [CrossRef]
- Dragańska, E.; Szwejkowski, Z.; Panfil, M. Yield of corn cultivated for grain in Wielkopolska Region predicted in regard to expected climate changes. Acta Agrophys. 2008, 12, 654–655. (In Polish) [Google Scholar]
- Kirchner, M.; Schonhart, M.; Schmid, E. The impacts of CAP post-2013 and regional climate change on agricultural land use intensity and the environment in Austria. In Proceedings of the International Conference of Agricultural Economists, Milan, Italy, 9–14 August 2015. [Google Scholar]
- Ciabatta, L.; Camici, S.; Brocca, L.; Ponziani, F.; Stelluti, M.; Berni, N.; Moramarco, T. Assessing the impact of climate-change scenarios on landslide occurrence in Umbria Region, Italy. J. Hydrol. 2016, 541, 285–295. [Google Scholar] [CrossRef]
- Keuler, K.; Radtke, K.; Kotlarski, S.; Lüthi, D. Regional climate change over Europe in COSMO-CLM: Influence of emission scenario and driving global model. Meteorol. Z. 2016, 25, 121–136. [Google Scholar] [CrossRef]
- Cheval, S.; Dumitrescu, A.; Birsan, M.V. Variability of the aridity in the South-Eastern Europe over 1961–2050. Catena 2017, 151, 74–86. [Google Scholar] [CrossRef]
- Trnka, M.; Olesen, J.E.; Kersebaum, K.C.; Skjelvåg, A.O.; Eitzinger, J.; Seguin, B.; Peltonen-Sainio, P.; Rötter, R.; Iglesias, A.; Orlandini, S.; et al. Agroclimatic conditions in Europe under climate change. Glob. Chang. Biol. 2011, 17, 2298–2318. [Google Scholar] [CrossRef] [Green Version]
- Truelove, H.B.; Carrico, A.R.; Thabrew, L. A socio-psychological model for analyzing climate change adaptation: A case study of Sri Lankan paddy farmers. Glob. Environ. Chang. 2015, 31, 85–97. [Google Scholar] [CrossRef]
- Warner, B.P.; Kuzdas, C.; Yglesias, M.G.; Childers, D.L. Limits to adaptation to interacting global change risks among smallholder rice farmers in Northwest Costa Rica. Glob. Environ. Chang. 2015, 30, 101–112. [Google Scholar] [CrossRef] [Green Version]
- Donmez, C.; Berberoglu, S.; Cilek, A.; Evrendilek, F. Spatiotemporal Modeling of Net Primary Productivity of Eastern Mediterranean Biomes Under Different Regional Climate Change Scenarios. Int. J. Environ. Res. 2016, 10, 341–356. [Google Scholar]
- Schönhart, M.; Schauppenlehner, T.; Kuttner, M.; Kirchner, M.; Schmid, E. Climate change impacts on farm production, landscape appearance, and the environment: Policy scenario results from an integrated field-farm-landscape model in Austria. Agric. Syst. 2016, 145, 39–50. [Google Scholar] [CrossRef]
- Kalbarczyk, R.; Kalbarczyk, E.; Ziemiańska, M.; Sobolewski, R.; Machowska, A. Multi-year variability of phenological phases and periods of oat (Avena sativa L.) in Poland. Rom. Agric. Res. 2015, 32, 75–84. [Google Scholar]
- Rezaei, E.E.; Sieberta, S.; Ewerta, F. Climate and management interaction cause diverse crop phenology trends. Agric. For. Meteorol. 2017, 233, 55–70. [Google Scholar] [CrossRef]
- Wypych, A.; Sulikowska, A.; Ustrnul, Z.; Czekierda, D. ; Variability of growing degree days in Poland in response to ongoing climate changes in Europe. Int. J. Biometeorol. 2017, 61, 49–59. [Google Scholar] [CrossRef] [PubMed]
- Keatinge, J.D.H.; Ledesma, D.R.; Keatinge, F.J.D.; Hughes, J. D’A. Projecting annual air temperature changes to 2025 and beyond: Implications for vegetable production worldwide. J. Agric. Sci. 2012, 1–20. [Google Scholar] [CrossRef]
- Juszczak, R.; Kuchar, L.; Leśny, J.; Olejnik, J. Climate Change Impact on Development Rates of the Codling Moth (Cydia pomonella L.) in the Wielkopolska Region, Poland. Int. J. Biometeorol. 2013, 57, 31–41. [Google Scholar] [CrossRef] [PubMed]
- Xu, H.; Twine, T.E.; Girvetz, E. Climate Change and Maize Yield in Iowa. PLoS ONE 2016, 11, e0156083. [Google Scholar] [CrossRef] [PubMed]
- Merrill, S.C.; Peairs, F.B. Temperature variability is a key component in accurately forecasting the effects of climate change on pest phenology. Pest. Manag. Sci. 2017, 73, 380–388. [Google Scholar] [CrossRef] [PubMed]
- Thaler, S.; Eitzinger, J.; Trnka, M.; Dubravsky, M. Impacts of climate change and alternative adaptation options on winter wheat yield and water productivity in a dry climate in Central Europe. J. Agric. Sci. 2012, 150, 537–555. [Google Scholar] [CrossRef]
- Mitrică, B.; Mateescu, E.; Dragotă, C.S.; Grigorescu, I.; Dumitraşcu, M.; Popovici, E.A. Climate change impacts on agricultural crops in in Timiș Plain, Romania. Rom. Agric. Res. 2015, 32, 93–101. [Google Scholar]
- Tao, S.; Shen, S.; Li, Y.; Wang, Q.; Gao, P.; Mugume, I. Projected Crop Production under Regional Climate Change Using Scenario Data and Modeling: Sensitivity to Chosen Sowing Date and Cultivar. Sustainability 2016, 8, 214. [Google Scholar] [CrossRef]
- Raev, I.; Alexandrov, V.; Tinchev, G. Assessment of drought related climate change impacts on forests in Bulgaria. Silva Balc. 2015, 16, 1–24. [Google Scholar]
- Ferrise, R.; Moriondo, M.; Bindi, M. Probabilistic assessments of climate change impacts on durum wheat in the Mediterranean region. Nat. Hazards Earth Syst. Sci. 2011, 11, 1293–1302. [Google Scholar] [CrossRef] [Green Version]
- Jaczewski, A.; Brzoska, B.; Wibig, J. Comparison of temperature indices for three IPCC SRES scenarios based on RegCM simulations for Poland in 2011–2030 period. Meteorol. Z. 2014, 24, 99–106. [Google Scholar] [CrossRef]
- Wiebe, K.; Lotze-Campen, H.; Sands, R.; Tabeau, A.; van der Mensbrugghe, D.; Biewald, A.; Bodirsky, B.; Islam, S.; Kavallari, A.; Mason-D’Croz, D.; et al. Climate Change Impacts on Agriculture in 2050 under a Range of Plausible Socioeconomic and Emissions Scenarios. Environ. Res. Lett. 2015, 10, 1–15. [Google Scholar] [CrossRef]
- Kossowska-Cezak, U. Changes of the thermic seasons in Warsaw in the period 1933–2004. Misc. Geogr. 2006, 12, 87–94. [Google Scholar]
- Ziernicka-Wojtaszek, A.; Krużel, J. The diversification of air temperature trends in Poland (1981–2010). Pol. J. Environ. Stud. 2016, 25, 2205–2209. [Google Scholar] [CrossRef]
- Kasperska-Wołowicz, W.; Bolewski, T. Variability of air temperature in Bydgoszcz in the years 1931–2013. Water-Envion.-Rural Areas 2015, 15, 25–43, (In Polish; Tables, Figures and Summary in English). [Google Scholar]
- Filipiuk, E. Thermal classifi cation of months, seasons and years in Lublin (1951–2010). Prace Stud. Geogr. 2011, 47, 129–138, (In Polish; Tables, Figures and Summary in English). [Google Scholar]
- Limanówka, D.; Biernacik, D.; Czernecki, B.; Farat, R.; Filipiak, J.; Kasprowicz, T.; Pyrc, R.; Urban, G.; Wojcik, R. Zmiany i zmienność klimatu od połow. In Warunki Klimatyczne i Oceanograficzne w Polsce i na Bałtyku Południowym. Spodziewane Zmiany i Wytyczne do Opracowania Strategii Adaptacyjnych w Gospodarce Krajowej; Wibig, J., Jakusik, E., Eds.; Instytut Meteorologii i Gospodarki Wodnej—Państwowy Instytut Badawczy (IMGW-PIB): Warszawa, Poland, 2012; pp. 7–33. ISBN 978-83-61102-65-6. [Google Scholar]
- Walczak, F.; Tratwal, A.; Bocianowski, J. Effects of Changes in Precipitation and Temperature on Select Agrophage Risk in Poland, 1965–2009. Pol. J. Environ. Stud. 2015, 24, 325–332. [Google Scholar] [CrossRef]
- Rosa, R.; Kosterna-Kelle, E.; Franczuk, J.; Zaniewicz-Bajkowska, A. The influence of weather conditions of eastern Poland on sweet corn yields aand length of growing season. J. Ecol. Eng. 2016, 17, 273–279. [Google Scholar] [CrossRef]
- Kalbarczyk, R. Climatic Risk of Field Cultivation of Cucumber (Cucumis sativus L.) in Poland. Not. Bot. Hort. Agrobot. Cluj. 2010, 8, 157–168. [Google Scholar]
- Koźmiński, C.; Górski, T.; Michalska, B. Climatic Atlas of Elements and Phenomena Hazardous to Agriculture in Poland; Institute of Soil Science and Plant Cultivation: Puławy, Poland, 1990; p. 78. [Google Scholar]
- Urząd Statystyczny we Wrocławiu (US). Agriculture in Dolnośląskie Voivodship in 2014–2015. Statistical Information and Elaborations 2016. Available online: http://wroclaw.stat.gov.pl/ (accessed on 9 May 2018).
- Miętus, M.; Owczarek, M.; Filipiak, J. Warunki Termiczne na Obszarze Wybrzeża i Pomorza w świetle Wybranych Klasyfikacji; Wydawnictwo Instytut Meteorologii i Gospodarki Wodnej: Warszawa, Poland, 2002; p. 56. (In Polish) [Google Scholar]
- IPCC. Climate Change 2013: The Physical Science Basis. Contribution of Working Group I to the Fifth Assessment Report of the Intergovernmental Panel on Climate Change; Stocker, T.F., Qin, D., Plattner, G.K., Tignor, M., Allen, S.K., Boschung, J., Nauels, A., Xia, Y., Bex, V., Midgley, P.M., Eds.; Cambridge University Press: Cambridge, UK; New York, NY, USA, 2013. [Google Scholar]
- Koźmiński, Cz.; Michalska, B. Atlas of Climatic Risk to Crop Cultivation in Poland; University of Agriculture in Szczecin, University of Szczecin: Szczecin, Poland, 2001; p. 81. [Google Scholar]
- Mehler, S.; Völlings, A.; Flügel, I.; Szymanowski, M.; Błaś, M.; Sobik, M.; Migała, K.; Werner, M.; Kryza, M.; Miszuk, B.; et al. Zmiany klimatu w regionie granicznym Polski i Saksonii; Sächsisches Landesamt für Umwelt, Landwirtschaft und Geologie (LfULG): Dresden, Germany, 2014; p. 80. [Google Scholar]
- Tylkowski, J. Spatial and time variability of the thermal and precipitation conditions on Słowińskie Coast. Geologia i geomorfologia. 2013, 10, 195–213. (In Polish) [Google Scholar]
- Labudová, L.; Faško, P.; Ivanakova, G. Changes in climate and changing climate regions in Slovakia. Morav. Geogr. Rep. 2015, 23, 71–82. [Google Scholar] [CrossRef] [Green Version]
- Górski, T.; Górska, K. The effects of scale on crop yield variability. Agr. Syst. 2003, 78, 425–434. [Google Scholar] [CrossRef]
- Główny Urząd Statystyczny (GUS). Rocznik Statystyczny Rolnictwa 2017. Available online: http://stat.gov.pl/obszary-tematyczne/roczniki-statystyczne/roczniki-statystyczne/rocznik-statystyczny-rolnictwa-2017,6.html (accessed on 9 May 2018).
- Sharif, B.; Makowski, D.; Plauborg, F.; Olesen, J.E. Comparison of regression techniques to predict response of oilseed rape yield to variation in climatic conditions in Denmark. Eur. J. Agron. 2017, 82, 11–20. [Google Scholar] [CrossRef]
- Stupak, N. Adaptation of Russian agriculture to climatic variability: The role of federal and provincial policies. Environ. Sci. Policy 2017, 68, 10–19. [Google Scholar] [CrossRef]
Figure 1.
Location of meteorological stations in south-western Poland.

Figure 2.
Monthly time distribution of air temperature (Ta) in the studied region, 1951–2014.

Figure 3.
Monthly variation in the standard deviation of daily mean temperature (Ta) in the studied region, 1951–2014.
Figure 3.
Monthly variation in the standard deviation of daily mean temperature (Ta) in the studied region, 1951–2014.

Figure 4.
Quantile-based classification of monthly, seasonal and annual mean temperature in the studied region, 1951–2014.
Figure 4.
Quantile-based classification of monthly, seasonal and annual mean temperature in the studied region, 1951–2014.

Figure 5.
Frequency of occurrence of daily air temperature values (Ta) in 2 °C intervals by seasons and annually for the studied region (n = 23344), 1951–2014; n-sample size.
Figure 5.
Frequency of occurrence of daily air temperature values (Ta) in 2 °C intervals by seasons and annually for the studied region (n = 23344), 1951–2014; n-sample size.

Figure 6.
Time distribution of the number of days with air temperature (Ta) characterizing thermal agricultural periods: winter dormancy of plants (<0 °C), farming (>3 °C), vegetation (>5 °C), active plant growth (>10 °C), and maturation of plants (>15 °C) in the studied region, 1951–2014.
Figure 6.
Time distribution of the number of days with air temperature (Ta) characterizing thermal agricultural periods: winter dormancy of plants (<0 °C), farming (>3 °C), vegetation (>5 °C), active plant growth (>10 °C), and maturation of plants (>15 °C) in the studied region, 1951–2014.

Figure 7.
Difference in the number of days with air temperature in different agricultural classes between the decades 2005–2014 and 1951–1960.
Figure 7.
Difference in the number of days with air temperature in different agricultural classes between the decades 2005–2014 and 1951–1960.


Table 1.
Characteristics of the location of meteorological stations used in the study.
| No. | Station Name | Station Code | Elevation (masl) | Geographic Coordinates | |
|---|---|---|---|---|---|
| Latitude (N) | Longitude (E) | ||||
| 1 | Kalisz | 12435 | 140 | 51°44′ | 18°05′ |
| 2 | Legnica | 12415 | 121 | 51°13′ | 16°10′ |
| 3 | Opole | 12530 | 176 | 50°40′ | 17°58′ |
| 4 | Wieluń | 12455 | 195 | 51°13′ | 18°35′ |
| 5 | Wrocław | 12424 | 120 | 51°06′ | 16°53′ |
Table 2.
Monthly and seasonal criteria for quantile thermal air classification according to Miętus et al. [45].
Table 2.
Monthly and seasonal criteria for quantile thermal air classification according to Miętus et al. [45].
| No. | Class Name | Percentiles Range (%) |
|---|---|---|
| 1 | extremely cold | <5 |
| 2 | abnormally cold | 5.00–10.00 |
| 3 | very cold | 10.01–20.00 |
| 4 | cold | 20.01–30.00 |
| 5 | moderately cold | 30.01–40.00 |
| 6 | normal | 40.01–60.00 |
| 7 | moderately warm | 60.01–70.00 |
| 8 | warm | 70.01–80.00 |
| 9 | very warm | 80.01–90.00 |
| 10 | abnormally warm | 90.01–95.00 |
| 11 | extremely warm | >95.00 |
Table 3.
Basic statistical characteristics ( ± sd, in °C) calculated for air temperature (Ta), 1951–2014.
Table 3.
Basic statistical characteristics ( ± sd, in °C) calculated for air temperature (Ta), 1951–2014.
| Month/Season | Region | Station | ||||
|---|---|---|---|---|---|---|
| Kalisz | Legnica | Opole | Wieluń | Wrocław | ||
| ± sd, in °C | ||||||
| Jan | −1.4± 3.1 | −1.8 ± 3.2 | −0.8 ± 3.2 | −1.4 ± 3.1 | −2.0 ± 3.1 | −1.2 ± 3.2 |
| Feb | −0.5 ± 3.4 | −1.0 ± 3.4 | 0.0 ± 3.6 | −0.4 ± 3.4 | −1.1 ± 3.4 | −0.3 ± 3.4 |
| Mar | 3.2 ± 2.4 | 2.8 ± 2.5 | 3.7 ± 2.4 | 3.4 ± 2.4 | 2.7 ± 2.5 | 3.4 ± 2.3 |
| Apr | 8.4 ± 1.6 | 8.2 ± 1.7 | 8.5 ± 1.6 | 8.6 ± 1.7 | 8.2 ± 1.7 | 8.5 ± 1.7 |
| May | 13.4 ± 1.5 | 13.3 ± 1.6 | 13.3 ± 1.4 | 13.7 ± 1.5 | 13.3 ± 1.5 | 13.5 ± 1.5 |
| Jun | 16.7 ± 1.2 | 16.6 ± 1.3 | 16.6 ± 1.2 | 17.0 ± 1.2 | 16.5 ± 1.2 | 16.8 ± 1.3 |
| Jul | 18.5 ± 1.7 | 18.4 ± 1.8 | 18.5 ± 1.6 | 18.7 ± 1.6 | 18.2 ± 1.7 | 18.5 ± 1.7 |
| Aug | 17.9 ± 1.3 | 18.0 ± 1.4 | 17.9 ± 1.3 | 18.2 ± 1.2 | 17.7 ± 1.4 | 17.9 ± 1.3 |
| Sep | 13.8 ± 1.4 | 13.7 ± 1.5 | 14.0 ± 1.4 | 14.0 ± 1.4 | 13.5 ± 1.5 | 13.8 ± 1.4 |
| Oct | 9.0 ± 1.6 | 8.8 ± 1.6 | 9.3 ± 1.6 | 9.3 ± 1.6 | 8.8 ± 1.6 | 9.1 ± 1.6 |
| Nov | 4.0 ± 1.8 | 3.7 ± 1.8 | 4.4 ± 1.8 | 4.3 ± 1.9 | 3.7 ± 1.9 | 4.2 ± 1.8 |
| Dec | 0.2 ± 2.4 | −0.1 ± 2.5 | 0.8 ± 2.5 | 0.2 ± 2.3 | −0.2 ± 2.4 | 0.5 ± 2.4 |
| Winter | −0.6 ± 2.2 | −1.0 ± 2.2 | 0.0 ± 2.2 | −0.6 ± 2.2 | −1.1 ± 2.2 | −0.4 ± 2.2 |
| Spring | 8.3 ± 1.2 | 8.1 ± 1.3 | 8.5 ± 1.2 | 8.6 ± 1.2 | 8.1 ± 1.2 | 8.5 ± 1.2 |
| Summer | 17.7 ± 1.0 | 17.7 ± 1.1 | 17.7 ± 0.9 | 17.9 ± 0.9 | 17.5 ± 1.0 | 17.7 ± 1.0 |
| Autumn | 9.0 ± 1.0 | 8.7 ± 1.0 | 9.2 ± 0.9 | 9.2 ± 1.0 | 8.7 ± 1.0 | 9.0 ± 1.0 |
| Year | 8.6 ± 0.9 | 8.4 ± 0.9 | 8.9 ± 0.9 | 8.8 ± 0.9 | 8.3 ± 0.9 | 8.8 ± 0.9 |
Table 4.
The lowest and highest air temperatures (Ta) (min, max–in °C) determined in the years 1951–2014.
Table 4.
The lowest and highest air temperatures (Ta) (min, max–in °C) determined in the years 1951–2014.
| Month/Season | Region | Station | ||||||||||
|---|---|---|---|---|---|---|---|---|---|---|---|---|
| Kalisz | Legnica | Opole | Wieluń | Wrocław | ||||||||
| Min (Year), Max (Year)–in °C | ||||||||||||
| Jan | −10.2 (1963) | 4.3 (2007) | −10.9 (1963) | 3.9 (2007) | −9.5 (1963) | 5.0 (2007) | −10.3 (1963) | 4.1 (2007) | −10.9 (1987) | 3.5 (2007) | −9.7 (1963) | 4.8 (2007) |
| Feb | −11.7 (1956) | 5.5 (1990) | −11.2 (1956) | 5.2 (1990) | −11.9 (1956) | 6.0 (1990) | −11.8 (1956) | 5.6 (1990) | −11.6 (1956) | 5.0 (1990) | −12.1 (1956) | 5.5 (1990) |
| Mar | −1.6 (1964) | 7.4 (1990) | −2.5 (1964) | 7.2 (2014) | −0.9 (2013) | 7.7 (1990) | −1.7 (1958) | 7.7 (1990) | −2.4 (1964) | 7.0 (1990) | −1.3 (1958) | 7.6 (2014) |
| Apr | 5.0 (1958) | 12.2 (2000) | 4.8 (1958) | 12.6 (2000) | 5.0 (1958) | 11.8 (2000) | 5.0 (1954) | 12.3 (2000) | 4.7 (1958) | 12.2 (2000) | 5.2 (1958) | 12.2 (2009) |
| May | 10.0 (1991) | 17.1 (2002) | 9.9 (1991) | 17.1 (2002) | 9.9 (1980) | 16.5 (2002) | 10.1 (1991) | 17.4 (2002) | 9.8 (1991) | 17.2 (2002) | 10.2 (1991) | 17.0 (2002) |
| Jun | 14.1 (1985) | 19.3 (2003) | 14.3 (1985) | 19.1 (2007) | 14.0 (1985) | 19.5 (2003) | 14.4 (1985) | 19.7 (2003) | 13.7 (1985) | 18.9 (2003) | 14.1 (1985) | 19.5 (2003) |
| Jul | 15.3 (1979) | 23.3 (2006) | 15.1 (1979) | 23.3 (2006) | 15.5 (1979) | 23.0 (2006) | 15.5 (1979) | 23.0 (2006) | 14.9 (1979) | 22.8 (2006) | 15.3 (1979) | 23.2 (2006) |
| Aug | 15.6 (1976) | 21.9 (1992) | 15.0 (1956) | 21.9 (1992) | 15.7 (1976) | 21.8 (1992) | 15.7 (1976) | 22.3 (1992) | 15.3 (1987) | 21.9 (1992) | 15.3 (1976) | 21.7 (1992) |
| Sep | 10.7 (1996) | 17.1 (1999) | 10.6 (1996) | 17.1 (1999) | 10.7 (1996) | 17.1 (1999) | 10.8 (1996) | 17.2 (1999) | 10.4 (1996) | 16.8 (1999) | 10.8 (1996) | 17.2 (1999) |
| Oct | 5.9 (2003) | 12.6 (2000) | 5.6 (2003) | 12.4 (2000) | 6.2 (2003) | 13.1 (2001) | 6.1 (1974) | 13.2 (2000) | 5.7 (2003) | 12.6 (2000) | 5.9 (2003) | 12.7 (2001) |
| Nov | −0.3 (1993) | 7.6 (1963) | −0.7 (1965) | 6.9 (1963) | −0.8 (1993) | 8.2 (1963) | −0.5 (1956) | 8.0 (2000) | −0.6 (1993) | 7.2 (1963) | −0.3 (1993) | 7.8 (1963) |
| Dec | −7.0 (1969) | 4.2 (2006) | −7.9 (1969) | 4.2 (2006) | −6.5 (1969) | 4.6 (2006) | −6.5 (1969) | 4.0 (2006) | −7.8 (1969) | 3.9 (2006) | −6.5 (1969) | 4.1 (2006) |
| Winter | −7.4 (1963) | 3.6 (2007) | −7.9 (1963) | 3.1 (2007) | −7.1 (1963) | 4.3 (2007) | −7.4 (1963) | 3.7 (2007) | −7.8 (1963) | 2.9 (2007) | −7.1 (1963) | 3.9 (2007) |
| Spring | 5.6 (1955) | 10.8 (2000) | 5.1 (1955) | 10.8 (2000) | 5.9 (1955) | 10.8 (2000) | 5.7 (1955) | 10.9 (2000) | 5.2 (1955) | 10.6 (2000) | 5.8 (1955) | 11.0 (2007) |
| Summer | 15.8 (1978) | 20.3 (1992) | 15.7 (1978) | 20.4 (1992) | 15.8 (1978) | 20.1 (1992) | 16.1 (1978) | 20.5 (1992) | 15.6 (1978) | 20.1 (1992) | 15.7 (1978) | 20.3 (1992) |
| Autumn | 7.0 (1952) | 11.5 (2006) | 6.6 (1952) | 11.6 (2006) | 7.1 (1993) | 11.7 (2006) | 7.1 (1952) | 11.7 (2006) | 6.9 (1993) | 11.4 (2006) | 7.2 (1952) | 11.5 (2014) |
| Year | 6.6 (1956) | 10.6 (2014) | 6.4 (1956) | 10.3 (2014) | 6.9 (1956) | 10.7 (2014) | 6.8 (1956) | 10.8 (2014) | 6.3 (1956) | 10.2 (2014) | 6.8 (1956) | 11.2 (2014) |
Notes: min: the lowest value, max: the highest value.
Table 5.
Correlation coefficients for relationship between air temperature and the years 1951–2014, and the linear trend (in °C/10 years).
Table 5.
Correlation coefficients for relationship between air temperature and the years 1951–2014, and the linear trend (in °C/10 years).
| Month/Season | Region | Station | ||||
|---|---|---|---|---|---|---|
| Kalisz | Legnica | Opole | Wieluń | Wrocław | ||
| Jan | n.s./0.32 | n.s./0.34 | n.s./0.28 | n.s./0.32 | n.s./0.31 | n.s./0.33 |
| Feb | 0.24 3/0.44 | 0.27 2/0.49 | 0.24 3/0.46 | 0.23 3/0.42 | 0.22 3/0.41 | 0.25 2/0.47 |
| Mar | 0.30 2/0.38 | 0.32 2/0.43 | 0.28 2/0.35 | 0.29 2/0.38 | 0.28 2/0.38 | 0.31 2/0.38 |
| Apr | 0.43 1/0.38 | 0.49 1/0.44 | 0.40 1/0.36 | 0.40 1/0.37 | 0.41 1/0.37 | 0.41 1/0.37 |
| May | 0.44 1/0.35 | 0.45 1/0.38 | 0.40 1/0.29 | 0.42 1/0.35 | 0.40 1/0.33 | 0.47 1/0.36 |
| Jun | n.s./0.07 | n.s./0.05 | n.s./0.06 | n.s./0.10 | n.s./0.05 | n.s./0.11 |
| Jul | 0.38 1/0.33 | 0.38 1/0.37 | 0.36 1/0.30 | 0.39 1/0.33 | 0.37 1/0.33 | 0.39 1/0.35 |
| Aug | 0.47 1/0.33 | 0.47 1/0.36 | 0.47 1/0.32 | 0.44 1/0.29 | 0.44 1/0.32 | 0.50 1/0.36 |
| Sep | n.s./0.13 | n.s./0.18 | n.s./0.12 | n.s./0.10 | n.s./0.12 | n.s./0.15 |
| Oct | n.s./0.14 | n.s./0.18 | n.s./0.14 | n.s./0.15 | n.s./0.11 | n.s./0.15 |
| Nov | n.s./0.16 | n.s./0.19 | n.s./0.11 | n.s./0.21 | n.s./0.16 | n.s./0.13 |
| Dec | n.s./0.08 | n.s./0.12 | n.s./0.09 | n.s./0.06 | n.s./0.05 | n.s./0.09 |
| Winter | 0.25 2/0.30 | 0.27 2/0.33 | 0.24 3/0.30 | 0.25 2/0.29 | 0.23 3/0.27 | 0.26 2/0.31 |
| Spring | 0.55 1/0.37 | 0.58 1/0.42 | 0.51 1/0.32 | 0.54 1/0.36 | 0.54 1/0.36 | 0.56 1/0.37 |
| Summer | 0.47 1/0.25 | 0.46 1/0.26 | 0.45 1 0.23 | 0.48 1/0.25 | 0.44 1/0.24 | 0.49 1/0.28 |
| Autumn | 0.28 2/0.15 | 0.35 2/0.19 | 0.25 2/0.12 | 0.29 2/0.16 | 0.24 3/0.13 | 0.28 2/0.15 |
| Year | 0.55 1/0.26 | 0.59 1/0.29 | 0.51 1/0.24 | 0.54 1/0.26 | 0.52 1/0.25 | 0.55 1/0.27 |
Notes: 1 at P < 0.01, 2 at P < 0.05, 3 at P < 0.1, n.s. -non-significant.
Table 6.
Correlation coefficients for relationship between standard deviation of air temperature and the years 1951–2014, and the linear trend (in °C/10 years).
Table 6.
Correlation coefficients for relationship between standard deviation of air temperature and the years 1951–2014, and the linear trend (in °C/10 years).
| Month/Season | Region | Station | ||||
|---|---|---|---|---|---|---|
| Kalisz | Legnica | Opole | Wieluń | Wrocław | ||
| Jan | n.s./0.07 | n.s./0.09 | n.s./0.07 | n.s./0.08 | n.s./0.05 | n.s./0.06 |
| Feb | n.s./−0.05 | n.s./−0.04 | n.s./−0.08 | n.s./−0.05 | n.s./−0.07 | n.s./−0.06 |
| Mar | n.s./−0.03 | n.s./0.00 | n.s./−0.05 | n.s./−0.04 | n.s./−0.03 | n.s./−0.04 |
| Apr | n.s./0.02 | n.s./0.05 | n.s./0.02 | n.s./0.01 | n.s./0.03 | n.s./0.00 |
| May | n.s./−0.02 | n.s./0.02 | n.s./−0.02 | n.s./−0.03 | n.s./−0.02 | n.s./−0.04 |
| Jun | n.s./−0.00 | n.s./0.01 | n.s./−0.01 | n.s./−0.02 | n.s./−0.01 | n.s./−0.01 |
| Jul | n.s./−0.01 | n.s./0.03 | n.s./−0.01 | n.s./−0.03 | n.s./−0.01 | n.s./−0.01 |
| Aug | n.s./0.02 | n.s./0.03 | n.s./0.02 | n.s./0.01 | n.s./0.04 | n.s./0.00 |
| Sep | −0.35 1/−0.13 | −0.32 1/−0.12 | −0.32 1/−0.12 | −0.32 1/−0.12 | −0.32 1/−0.12 | −0.42 1/−0.11 |
| Oct | 0.21 3/0.10 | 0.22 3/0.12 | n.s./0.09 | n.s./0.09 | 0.21 3/0.12 | n.s./0.08 |
| Nov | n.s./0.03 | n.s./0.02 | n.s./0.03 | n.s./0.04 | n.s./0.06 | n.s./0.01 |
| Dec | n.s./0.05 | n.s./0.05 | n.s./0.01 | n.s./0.09 | n.s./0.05 | n.s./0.06 |
| Winter | n.s./−0.01 | n.s./0.00 | n.s./−0.04 | n.s./−0.01 | n.s./−0.02 | n.s./−0.02 |
| Spring | n.s./−0.02 | n.s./−0.00 | n.s./−0.04 | n.s./−0.03 | n.s./−0.03 | n.s./−0.04 |
| Summer | n.s./0.03 | 0.27 2/0.12 | n.s./0.04 | n.s./0.00 | n.s./0.04 | n.s./0.01 |
| Autumn | n.s./0.01 | n.s./0.01 | n.s./0.01 | n.s./0.00 | n.s./0.02 | n.s./0.00 |
| Year | n.s./−0.01 | n.s./−0.00 | n.s./−0.02 | n.s./−0.01 | n.s./−0.01 | n.s./−0.01 |
Notes: 1 at P < 0.01, 2 at P < 0.05, 3 at P < 0.1, n.s. -non-significant.
Table 7.
Number of days with air temperature (Ta) charaterizing agricultural thermal periods: winter plant dormancy (<0 °C, a) and farming period (>3 °C, b) in the analysed stations, 1951–2014.
Table 7.
Number of days with air temperature (Ta) charaterizing agricultural thermal periods: winter plant dormancy (<0 °C, a) and farming period (>3 °C, b) in the analysed stations, 1951–2014.
| Month/Season | Station | |||||||||
|---|---|---|---|---|---|---|---|---|---|---|
| Kalisz | Legnica | Opole | Wieluń | Wrocław | ||||||
| a | b | a | b | a | b | a | b | a | b | |
| Jan | 17.6 | 5.2 | 14.9 | 8.0 | 16.7 | 6.0 | 17.9 | 4.8 | 15.7 | 6.8 |
| Feb | 14.6 | 5.6 | 12.7 | 8.4 | 13.5 | 7.3 | 14.9 | 5.5 | 13.2 | 7.6 |
| Mar | 7.9 | 14.5 | 6.0 | 17.2 | 6.6 | 16.3 | 8.2 | 14.3 | 6.3 | 16.6 |
| Apr | 0.4 | 26.8 | 0.2 | 27.8 | 0.3 | 27.1 | 0.4 | 26.5 | 0.3 | 27.4 |
| May | 0.0 | 30.9 | 0.0 | 31.0 | 0.0 | 30.9 | 0.0 | 30.9 | 0.0 | 30.9 |
| Jun | 0.0 | 30.0 | 0.0 | 30.0 | 0.0 | 30.0 | 0.0 | 30.0 | 0.0 | 30.0 |
| Jul | 0.0 | 31.0 | 0.0 | 31.0 | 0.0 | 31.0 | 0.0 | 31.0 | 0.0 | 31.0 |
| Aug | 0.0 | 31.0 | 0.0 | 31.0 | 0.0 | 31.0 | 0.0 | 31.0 | 0.0 | 31.0 |
| Sep | 0.0 | 30.0 | 0.0 | 30.0 | 0.0 | 30.0 | 0.0 | 30.0 | 0.0 | 30.0 |
| Oct | 0.3 | 29.2 | 0.2 | 29.4 | 0.3 | 29.3 | 0.5 | 29.0 | 0.2 | 29.3 |
| Nov | 5.5 | 17.3 | 4.3 | 19.0 | 4.7 | 18.4 | 5.7 | 17.2 | 4.6 | 18.5 |
| Dec | 14.0 | 7.4 | 11.7 | 10.3 | 13.1 | 8.7 | 14.4 | 7.2 | 12.5 | 9.0 |
| Winter | 46.2 | 18.2 | 39.3 | 26.7 | 43.3 | 22.0 | 47.2 | 17.5 | 41.4 | 23.4 |
| Spring | 8.3 | 72.2 | 6.2 | 76.0 | 6.9 | 74.3 | 8.6 | 71.7 | 6.6 | 74.9 |
| Summer | 0.0 | 92.0 | 0.0 | 92.0 | 0.0 | 92.0 | 0.0 | 92.0 | 0.0 | 92.0 |
| Autumn | 5.8 | 76.5 | 4.5 | 78.4 | 5.0 | 77.7 | 6.2 | 76.2 | 4.8 | 77.8 |
| Year | 60.3 | 258.9 | 50.0 | 273.1 | 55.2 | 266.0 | 62.0 | 257.4 | 52.8 | 268.1 |
Table 8.
Number of days with air temperature (Ta) charaterizing agricultural thermal periods: vegetation (> 5 °C, a), active plant growth (>10 °C, b), and plant maturation (> 15 °C, c) in the analysed stations, 1951–2014.
Table 8.
Number of days with air temperature (Ta) charaterizing agricultural thermal periods: vegetation (> 5 °C, a), active plant growth (>10 °C, b), and plant maturation (> 15 °C, c) in the analysed stations, 1951–2014.
| Month/Season | Station | ||||||||||||||
|---|---|---|---|---|---|---|---|---|---|---|---|---|---|---|---|
| Kalisz | Legnica | Opole | Wieluń | Wrocław | |||||||||||
| a | b | c | a | b | c | a | b | c | a | b | c | a | b | c | |
| Jan | 2.0 | 0.0 | 0.0 | 4.0 | 0.2 | 0.0 | 2.6 | 0.0 | 0.0 | 1.8 | 0.0 | 0.0 | 2.8 | 0.2 | 0.0 |
| Feb | 2.7 | 0.1 | 0.0 | 4.2 | 0.4 | 0.0 | 3.6 | 0.2 | 0.0 | 2.6 | 0.1 | 0.0 | 3.5 | 0.2 | 0.0 |
| Mar | 9.5 | 1.3 | 0.0 | 12.2 | 2.0 | 0.0 | 11.4 | 2.2 | 0.1 | 9.5 | 1.4 | 0.0 | 11.4 | 1.7 | 0.0 |
| Apr | 22.6 | 9.5 | 1.8 | 23.7 | 10.4 | 1.6 | 23.5 | 10.6 | 2.2 | 22.5 | 9.7 | 1.9 | 23.7 | 10.4 | 1.8 |
| May | 30.4 | 24.4 | 10.9 | 30.7 | 25.0 | 10.3 | 30.6 | 25.5 | 11.6 | 30.4 | 24.4 | 10.7 | 30.7 | 25.4 | 11.0 |
| Jun | 30.0 | 29.4 | 19.7 | 30.0 | 29.5 | 20.2 | 30.0 | 29.5 | 20.7 | 30.0 | 29.3 | 19.4 | 30.0 | 29.5 | 20.4 |
| Jul | 31.0 | 31.0 | 25.5 | 31.0 | 31.0 | 26.4 | 31.0 | 31.0 | 26.4 | 31.0 | 31.0 | 25.1 | 31.0 | 31.0 | 26.2 |
| Aug | 31.0 | 30.9 | 24.8 | 31.0 | 31.0 | 25.4 | 31.0 | 31.0 | 25.5 | 31.0 | 30.9 | 24.0 | 31.0 | 31.0 | 25.1 |
| Sep | 30.0 | 25.6 | 10.2 | 30.0 | 26.6 | 10.8 | 30.0 | 26.4 | 11.1 | 29.9 | 25.2 | 10.0 | 30.0 | 26.2 | 10.5 |
| Oct | 25.5 | 11.5 | 1.6 | 26.8 | 13.2 | 2.1 | 26.4 | 12.9 | 2.7 | 25.4 | 11.5 | 1.9 | 26.2 | 12.5 | 1.8 |
| Nov | 11.5 | 1.3 | 0.0 | 13.4 | 2.4 | 0.0 | 13.3 | 2.5 | 0.1 | 11.8 | 1.4 | 0.0 | 12.8 | 2.0 | 0.0 |
| Dec | 3.2 | 0.2 | 0.0 | 5.2 | 0.4 | 0.0 | 3.8 | 0.3 | 0.0 | 2.9 | 0.1 | 0.0 | 4.5 | 0.3 | 0.0 |
| Winter | 7.9 | 0.3 | 0.0 | 13.4 | 1.0 | 0.0 | 10.0 | 0.5 | 0.0 | 7.3 | 0.3 | 0.0 | 10.8 | 0.7 | 0.0 |
| Spring | 62.5 | 35.2 | 12.7 | 66.6 | 37.4 | 11.9 | 65.5 | 38.3 | 13.9 | 62.4 | 35.5 | 12.6 | 65.8 | 37.5 | 12.8 |
| Summer | 92.0 | 91.3 | 70.0 | 92.0 | 91.5 | 72.0 | 92.0 | 91.5 | 72.6 | 92.0 | 91.2 | 68.5 | 92.0 | 91.5 | 71.7 |
| Autumn | 67.0 | 38.4 | 11.8 | 70.2 | 42.2 | 12.9 | 69.7 | 41.8 | 13.9 | 67.1 | 38.1 | 11.9 | 69.0 | 40.7 | 12.3 |
| Year | 229.4 | 165.2 | 94.5 | 242.2 | 172.1 | 96.8 | 237.2 | 172.1 | 100.4 | 228.8 | 165.0 | 93.0 | 237.6 | 170.4 | 96.8 |
© 2018 by the authors. Licensee MDPI, Basel, Switzerland. This article is an open access article distributed under the terms and conditions of the Creative Commons Attribution (CC BY) license (http://creativecommons.org/licenses/by/4.0/).
Share and Cite
MDPI and ACS Style
Kalbarczyk, R.; Kalbarczyk, E.; Ziemiańska, M.; Raszka, B. Assessment of Air Thermal Conditions in the Lowland Part of South-Western Poland for Agriculture Development Purposes. Atmosphere 2018, 9, 215. https://doi.org/10.3390/atmos9060215
AMA Style
Kalbarczyk R, Kalbarczyk E, Ziemiańska M, Raszka B. Assessment of Air Thermal Conditions in the Lowland Part of South-Western Poland for Agriculture Development Purposes. Atmosphere. 2018; 9(6):215. https://doi.org/10.3390/atmos9060215
Chicago/Turabian StyleKalbarczyk, Robert, Eliza Kalbarczyk, Monika Ziemiańska, and Beata Raszka. 2018. "Assessment of Air Thermal Conditions in the Lowland Part of South-Western Poland for Agriculture Development Purposes" Atmosphere 9, no. 6: 215. https://doi.org/10.3390/atmos9060215
Note that from the first issue of 2016, this journal uses article numbers instead of page numbers. See further details here.