The Impact of Cumulative Negative Air Temperature Degree-Days on the Appearance of Ice Cover on a River in Relation to Atmospheric Circulation


1
Department of Hydrology and Water Management, Institute of Physical Geography and Environmental Planning, Adam Mickiewicz University in Poznan, Bogumiła Krygowskiego 10 Str., 61-680 Poznan, Poland
2
Department of Climatology, Institute of Physical Geography and Environmental Planning, Adam Mickiewicz University in Poznan, Bogumiła Krygowskiego 10 Str., 61-680 Poznan, Poland
*
Author to whom correspondence should be addressed.
Atmosphere 2018, 9(6), 204; https://doi.org/10.3390/atmos9060204
Submission received: 4 April 2018
/
Revised: 18 May 2018
/
Accepted: 21 May 2018
/
Published: 23 May 2018
(This article belongs to the Section Biosphere/Hydrosphere/Land–Atmosphere Interactions)
Abstract
:The article presents the results of an analysis of the impact of cumulative negative air temperature degree-days (CDD) on formation of ice cover on the typical lowland river in the moderate climate zone (River Noteć, western Poland). During the period 1987–2013 the occurrence of a series of 306 consecutive days of negative air temperatures was identified in relation to atmospheric circulation in the winter seasons, with a duration of 1–53 days. The longest CDD series occurred in 2010, while low air temperatures were particularly frequent in the year 1996 (−600 °C·d). The analysis showed that this phenomenon was most identifiable in December. Research made it possible to distinguish two types of circulation, which were conducive to the cumulation of CDD. Using the logistic regression model it was determined that the probability of ice cover occurrence increased most rapidly in the lower course (−70 °C·d), while the weakest interdependence was observed along the other sections. On average, a one-degree-day increase of CDD was connected with an increase in the probability of a permanent ice cover appearing of approximately 1.2–5.7%. The results obtained are of particular significance for identifying the thermal and circulatory factors determining the appearance of ice cover on the rivers of the Polish Lowlands.
1. Introduction
In the moderate climate zone, river freezing is a common phenomenon in the winter season, and it intensifies in periods that are at least very cool. The formation of ice cover is facilitated on days that are very frosty (t < −10 °C) or with a strong frost (t < −20 °C), the occurrence of which is connected first and foremost with high-pressure weather, which ensures the advection of dry and cool continental air masses from the eastern sector [1,2,3]. Under conducive circulatory conditions, cumulation in successive negative air temperature days contributes to the lowering of water temperature and the commencement of the river freezing process, i.e., the formation and longer-term persistence of ice cover.
The impact of climatic factors, mainly air temperature, is evident in the course of ice phenomena, and this data concerning changes in the duration thereof may be used as an indicator of climate change [4,5,6,7]. The thermal and ice regime of a river is also shaped by the method and intensity of supply (primarily with subterranean waters) and the influx of pollutants, and it is strongly modified by changes in the development of the river valley, any regulation of the river bed, and the operation of hydrotechnical facilities [8,9,10,11,12,13].
During the past 40 years, the frequency of occurrence and duration of ice phenomena on European rivers has diminished as the result of climate change [6,14]. Present-day climate warming has been confirmed by multi-year observation series [15] and data concerning environmental change [16]. Similar tendencies in the course of ice phenomena have also been disclosed by the research of [17,18,19,20]. Research into changes in the thermal conditions of the main European rivers has shown an increase in water temperature of approximately 1–3 °C over the past century [21]. Changes in water thermal conditions and ice regimes are the consequence of warmer winters, which correspond well with the positive air temperature trend noted in the cool half-year period [22,23]. Climate changes in Poland find expression not only in the positive trend of air temperatures in the winter months, but also in those of autumn and summer [24,25]. The percentage increase in the positive phase of the North Atlantic Oscillation (NAO) that occurred in the years 1987–1989 has led to a considerable decrease in the severity of winters in Poland after 1989 [26]. Climate changes have brought about an increase in the frequency of occurrence of winters with a mild course, small levels of snowfall and frequent mid-winter thaws. The impact of the positive air temperature trend in the first decade of the 21st century on warming in the spring, has been confirmed [27,28,29]. This may have far-reaching consequences for the functioning of the hydrological system, and also may impact features of the thermal and ice regime of rivers in the moderate climate zones [14,30,31]. We are observing the increasingly later appearance of ice cover and its steadily earlier disappearance, while on some rivers no ice cover has been observed since the second half of the 20th century. Statistically significant trends concerning the shortening of the duration of ice cover on rivers are typical of the majority of rivers in the northern hemisphere [4,32,33].
Monitoring of the course and structure of ice phenomena on rivers makes it easier to forecast climate changes, and allows us to determine whether any given climatic tendency is permanent [34,35,36,37]. The ice cover occurs less frequently than the remaining phases of the icing cycle, while factors conducive to its formation are frosty winters and the longer-term persistence of negative air temperatures. In the ice regime of the river, the ice cover constitutes the second phase of the cycle, i.e., the icing of the river. The appearance of the ice cover is preceded by the freezing phase, usually represented by stranded ice and frazil ice, whereas the disappearance of ice phenomena occurs during the last phase of the cycle, i.e., the thawing of the river (floating ice). These dependences may be used to indicate climate changes [4,6,38]. In this regard, use is made of various indices, for example cumulative freezing degree-days, also known as the freezing index, negative degree-days (NDD), and the freezing degree-days (FDD) [39]; this is a good indicator for the conditions under which ice phenomena—and, in particular, ice cover—form. The freezing (and melting) index is defined as the number of cumulative degree-days within a certain time interval. It refers to the cumulative negative air temperature degree-days that combine the temperature and time in a single measurement in order to quantitatively determine the rate of appearance or disappearance of ice phenomena [40]. The freezing index is given by the summation of the degree-days for a freezing season with daily mean temperature below zero [39], or is simply defined as departures of air temperature from 0 °C. This index was used to describe the weather models and cooling over time, and also as an index of the freezing condition of Arctic sea ice (source: Polar Science Center). The cumulative series of negative daily air temperatures were used, among others, for reconstructing the dates of disappearance of ice phenomena from the rivers and lakes of Northern Europe [41,42,43], for assessing the frequency of occurrence of periods of frost, and for analyzing the dependence between the NDD index and the thickness of the ice cover and the appearance of embacles on rivers [44,45,46]. In Poland, the negative degree-days index was used, among others, in research into the conditions of formation of ice phenomena and the thickness of ice on the Vistula [47,48]. In all instances authors have confirmed the high effectiveness of the method employed.
The objective of research was to determine the impact of cumulative series of negative air temperatures (the so-called cumulative degree-days, CDD) on the conditions of formation and persistence of ice cover on a lowland river (the River Noteć, western Poland). The freezing degree-day was used to relate climatic effects to frost action. Circulatory determinants were analyzed, as were the distribution properties of uninterrupted series of negative air temperature in terms of their duration, development and distribution over time (years and months) during the period 1987–2013. The appearance of ice cover along the river’s course, taking into consideration the year of appearance and the beginning and end dates of its duration in relation to CDD length, was examined simultaneously. Research was focused on determining: the time-frame in which relations occur between series of negative air temperatures and the appearance of ice cover on the River Noteć, the threshold values of air temperature at which a permanent ice cover appears, and—finally—the conditions under which this phenomenon is accelerated.
The conducted analyses are of particular significance for identifying the thermal and circulatory factors that determine the appearance of ice cover on the rivers of the Polish Lowlands, while their results may also be used to give an indication of currently occurring climate changes. Furthermore, they may constitute a database for the management of river systems, which obviously play an important economic and ecological role.
2. Research Area, Data and Methods
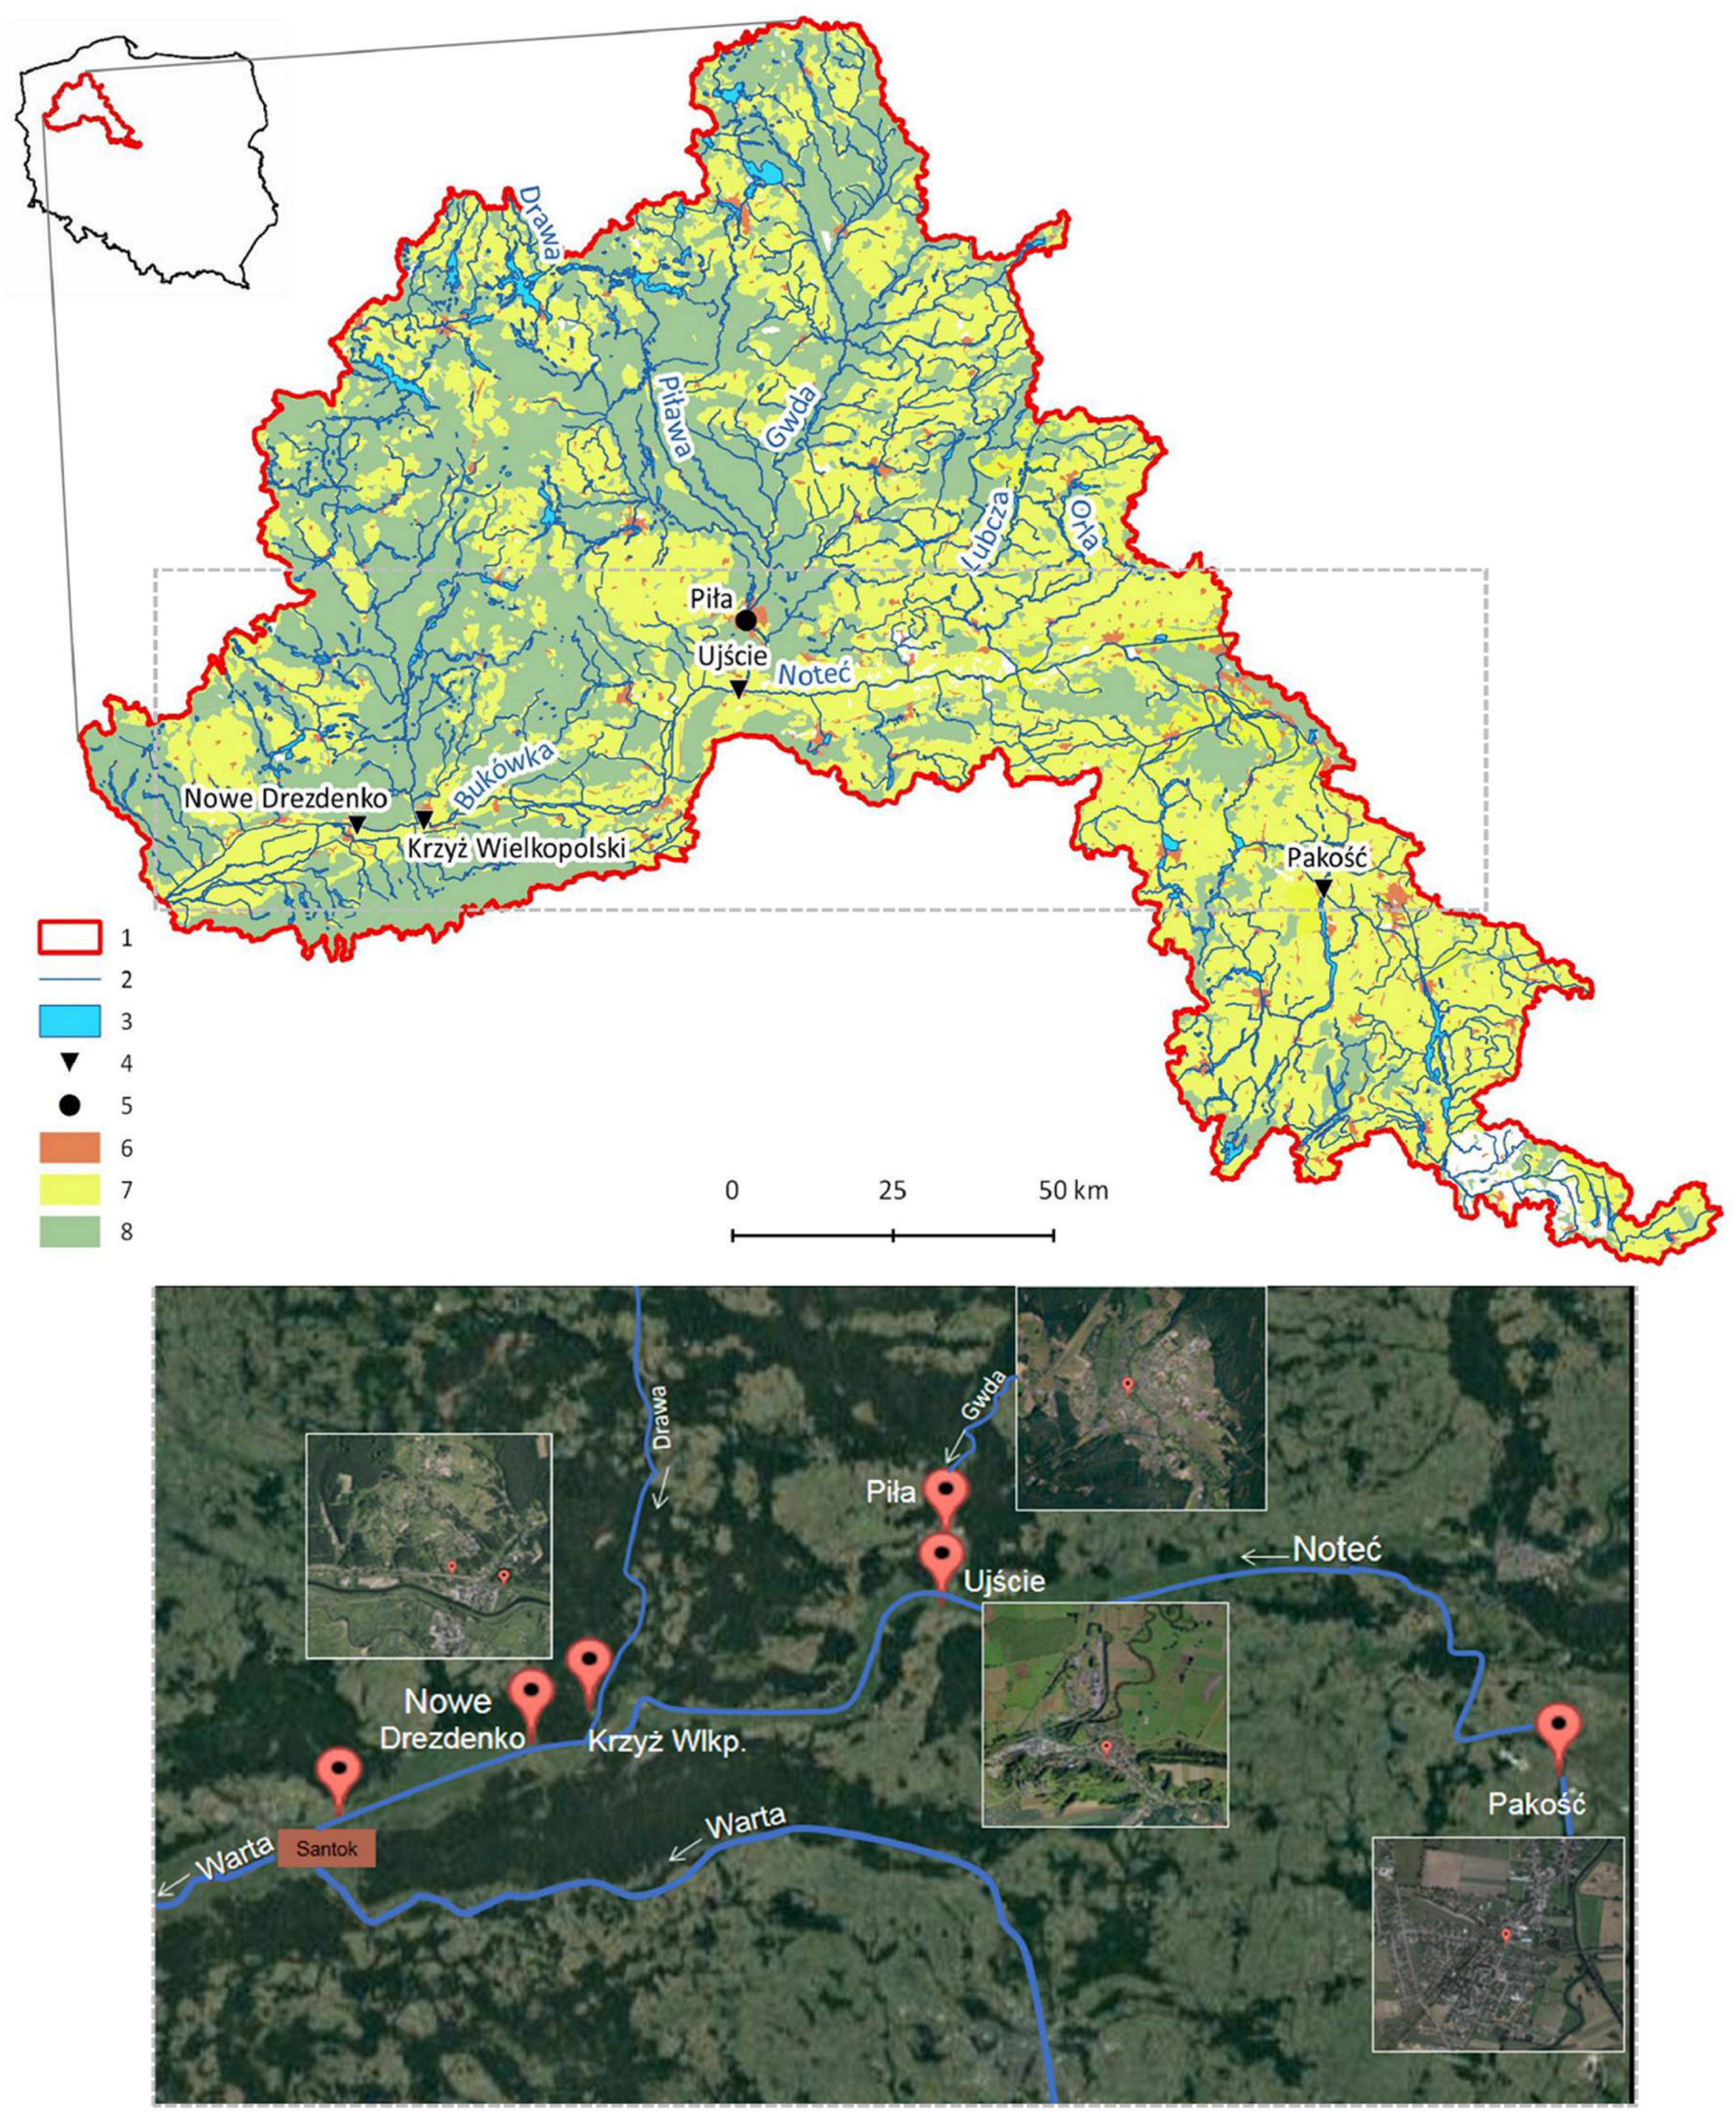
The River Noteć (western Poland) is the largest tributary of the River Warta (Figure 1), the catchment area of which forms part of the drainage area of the River Oder that flows into the Baltic Sea through the Szczecin Lagoon on the territory of Poland. According to the physical and geographical division of Poland, the catchment area of the River Noteć is located within the following macroregions: the Wielkopolski (Greater Poland) Lake District, the Toruń-Eberswalde Glacial Valley, through which flows the main bed of the river, and the South Pomeranian Lake District, through which there flow the right-bank influents of the River Noteć [49].
According to the climatic regionalization of Poland, the catchment area of the River Noteć is located primarily within the reach of two climatic regions: the Western Greater Poland and Eastern Greater Poland, whereas its northern fragment lies in the Western Pomeranian and Eastern Pomeranian regions [50]. During the winter season, the average air temperature in the regions is similar, ranging from −0.7 °C to −1.2 °C. In the South Pomeranian and Greater Poland lake districts there are on average 72 days with slight frost, and 35 with frost (with a temperature of under 0 °C during the day), with the exception of the Eastern Greater Poland region, where the number of days with frost rises to 40. On average, the first days with frost occur in these regions around 28–29 November, and the last towards the end of February (Greater Poland regions) or in March (Pomeranian regions). Days with very frosty weather are sporadic and do not occur every year [50].
The River Noteć and its influents are characterized by a snow-rain supply regime, of which two low water periods and two freshet periods are typical. Spring thaw freshets are characteristic of the river, and during their course—usually in March and April—flows are largest. Low water periods usually occur on the river in two seasons: the winter and the summer-autumn. The lowest flow values occur in the months from July to September, with summer-autumn low waters predominant amongst the low water phases of the river regime. Apart from the estuary, the catchment area of the River Noteć is characterized by very low values of total run-off. The average annual unitary run-off for the catchment area of the River Noteć during the period 1971–2010 [51] was 3.5 cu dm·s−1·km−2 at Pakość (upper course of the river), and 4.6 cu dm·s−1·km−2 at Nowe Drezdenko (lower course of the river). A characteristic feature of the River Noteć and its influents is the considerable number of lakes along their course (these occupy approximately 4% of the catchment area), while the middle course of the river has been partially channeled and regulated by means of a system of flood-gates. The average daily temperature of the waters of the River Noteć in the winter hydrological half-year period (November–April) changes from 3.6 °C in Pakość to 3.0 °C in Ujście and 4.0 °C in Nowe Drezdenko, at a minimum temperature of 0–0.1 °C [51]. The temperature of flowing waters may rise due to the inflow of pollutants into the river, particularly in its upper and middle stretches, in connection with the industrialization and urbanization of this part of the catchment area.
In accordance with the abiotic classification of river water types, the River Noteć has been included in the category of so-called “great lowland rivers” [52]. From the estuary of the River Gwda (Figure 1), the river’s sections constitute a water-course particularly significant for maintaining morphological continuity, which is indispensable for achieving and maintaining the proper condition and ecological potential of uniform parts of surface waters. Furthermore, the sections mentioned above are the most important migration corridors for fish.
The basic meteorological material and database of ice phenomena occurring on the River Noteć were taken from the Central Base of Historical Data of the Institute of Meteorology and Water Management—National Research Institute in Warsaw (IMGW-PIB Warsaw, Poland). These data have been verified and subjected to a quality control analysis. Their homogeneity was assessed using the Alexandersson test. Daily air temperature data for the period 1987–2013 were obtained from the synoptic station in Piła (IMGW-PIB), which is located in the catchment area of the River Noteć and for which the index of cumulative negative air temperature degree-days (CDD °C·d) was calculated. The CDD index is given by the summation of degree-days for a winter season with a daily mean temperature below zero. As postulated by [39], the cumulative sum of uninterrupted negative air temperature series registered in each hydrological year (the hydrological year November–October) was adopted for cumulative degree-days (CDD).
In order to analyze the circulatory factors determining the occurrence of negative degree-days, use was made of daily values of atmospheric pressure at sea level (SLP), height of the 500 hPa (z500 hPa) isobaric surface, and air temperature at an isobaric surface of 850 hPa (T850). The data were gathered from the collection of the National Center for Environmental Prediction/National Center for Atmospheric Research (NCEP/NCAR) Reanalysis, which are available in the archives of the NOAA ESRL PSD (Earth System Research Laboratory Physical Science Division).
The degree of impact of CDD on the appearance and persistence of ice cover on the River Noteć was determined at water-level indication points of the IMGW-PIB located along its course: Pakość (upper course), Ujście (middle course), and Krzyż Wielkopolski and Nowe Drezdenko (lower course), for which uniform daily observation series concerning ice phenomena were available for the analyzed period (Figure 1). The points on the River Noteć are situated in zones with a varied degree of development of the river valley: sections with quasi-unconstrained conditions for the flow of water and sections along which run-off is modified by anthropogenic factors (built-up areas, land used for agricultural purposes, hydrotechnical facilities)—Figure 1.
Research into the impact of air temperature, which determines the formation and persistence of ice cover on the river, was conducted using the index of cumulative negative air temperature degree-days (CDD), augmented by the determination of their circulatory determinants. The distribution of air temperature series in individual years and months of the cool half-year period (November–April) was taken into consideration. Additionally, periods with negative air temperatures in the last month of the warm half-year period were distinguished (October). The distributions of lengths of temperature series, the average daily increase in CDD, and their distribution over time were described. For ice cover on the river, the following were interpreted: the year of its occurrence and the beginning and end date of its appearance in relation to the length of the CDD series.
On the basis of daily values of atmospheric pressure at sea level (SLP), the height of the 500 hPa (z500 hPa) isobaric surface, and air temperature at the 850 hPa (T850) isobaric surface, averaged maps of pressure at sea level, maps of the height of the 500 hPa isobaric surface and of air temperatures at the 850 hPa isobaric surface, and also anomaly maps were drawn up for all negative degree-days. Anomalies were calculated as the difference between average values of individual parameters and averages for the period of November–March from the analyzed multiannual period. In addition to a description of general conditions, circulation types were distinguished by grouping negative degree-days on the basis of the pressure value at sea level using the minimal variance method, known as Ward’s method [53]. This method, which is based on Euclidean distances, consists in essence in conjoining two clusters, A and B, which once conjoined into a single cluster ensure the minimum sum of squares of deviations of all objects from the center of gravity of the newly formed cluster [53]. To this end, use was made of standardized SLP values. Standardization was performed in order to even out seasonal variability while simultaneously maintaining the intensity of the pressure field [54]. In addition, similar maps were drawn for negative degree-days noted in October. In this case anomalies were calculated as the difference between average values of individual parameters and averages for October from the analyzed multiannual period.
When determining the strength of the relationship between cumulative negative air temperature degree-days and the probability of appearance of ice cover, use was made of the logistic regression model (generalized linear model, GLM). The model was intended to help specify the threshold values of CDD at which a permanent ice cover started to appear on the river, and the conditions under which this phenomenon was accelerated. The logistic regression model, as an instance of a generalized linear model, is used when, among others, the assumption that the expected value y is expressed by the linear combination of variables x is satisfied [55], and this was confirmed in the conducted analysis. The model applied makes it possible to interpret results as odds, which are a function of probability. The model is used to calculate the ratio of probability of success to the probability of failure, instead of calculating classic probability, that is the ratio of the number of successes to the number of trials. The general logistic model is described by the following formula:
where:
y = b0/{1 + b1*exp(b2*x)}
- y—expected value of the dependent variable
- x—value of the independent variable
- exp—the exponential function, that is the exponential function with a basis equal to e, that is to the basis of the natural logarithm (exponent)
- b—regression coefficient
Irrespective of the regression coefficients and the value of x, the model provides a result in the form of predicted y values in the range from 0 to 1. For estimating the model, use was made only of those measurements performed along the River Noteć that corresponded to days without ice cover or days in which it appeared for the first time. Days that were successive days in a row with a permanent ice cover were therefore excluded from the analyses, and this contributed to a more precise examination of interconnections. The Durbin-Watson test [56] was used to assess the correlation between residues (errors, residuals). The parameters of the logistic regression model used in the assessment of the relationship between the cumulative negative air temperature and the probability of appearance of ice cover on the River Noteć in the years 1987–2013 have been presented in Table 1.
The calculations and the elaboration of the results of analyses were performed using the R calculational environment, version 3.3.2, R Foundation for Statistical Computing: Vienna, Austria (31 October 2016). The R suite (GNU R) is a software suite for analyzing data and also a programming platform [56,57].
3. Results
3.1. Frequency of Negative Air Temperature Series
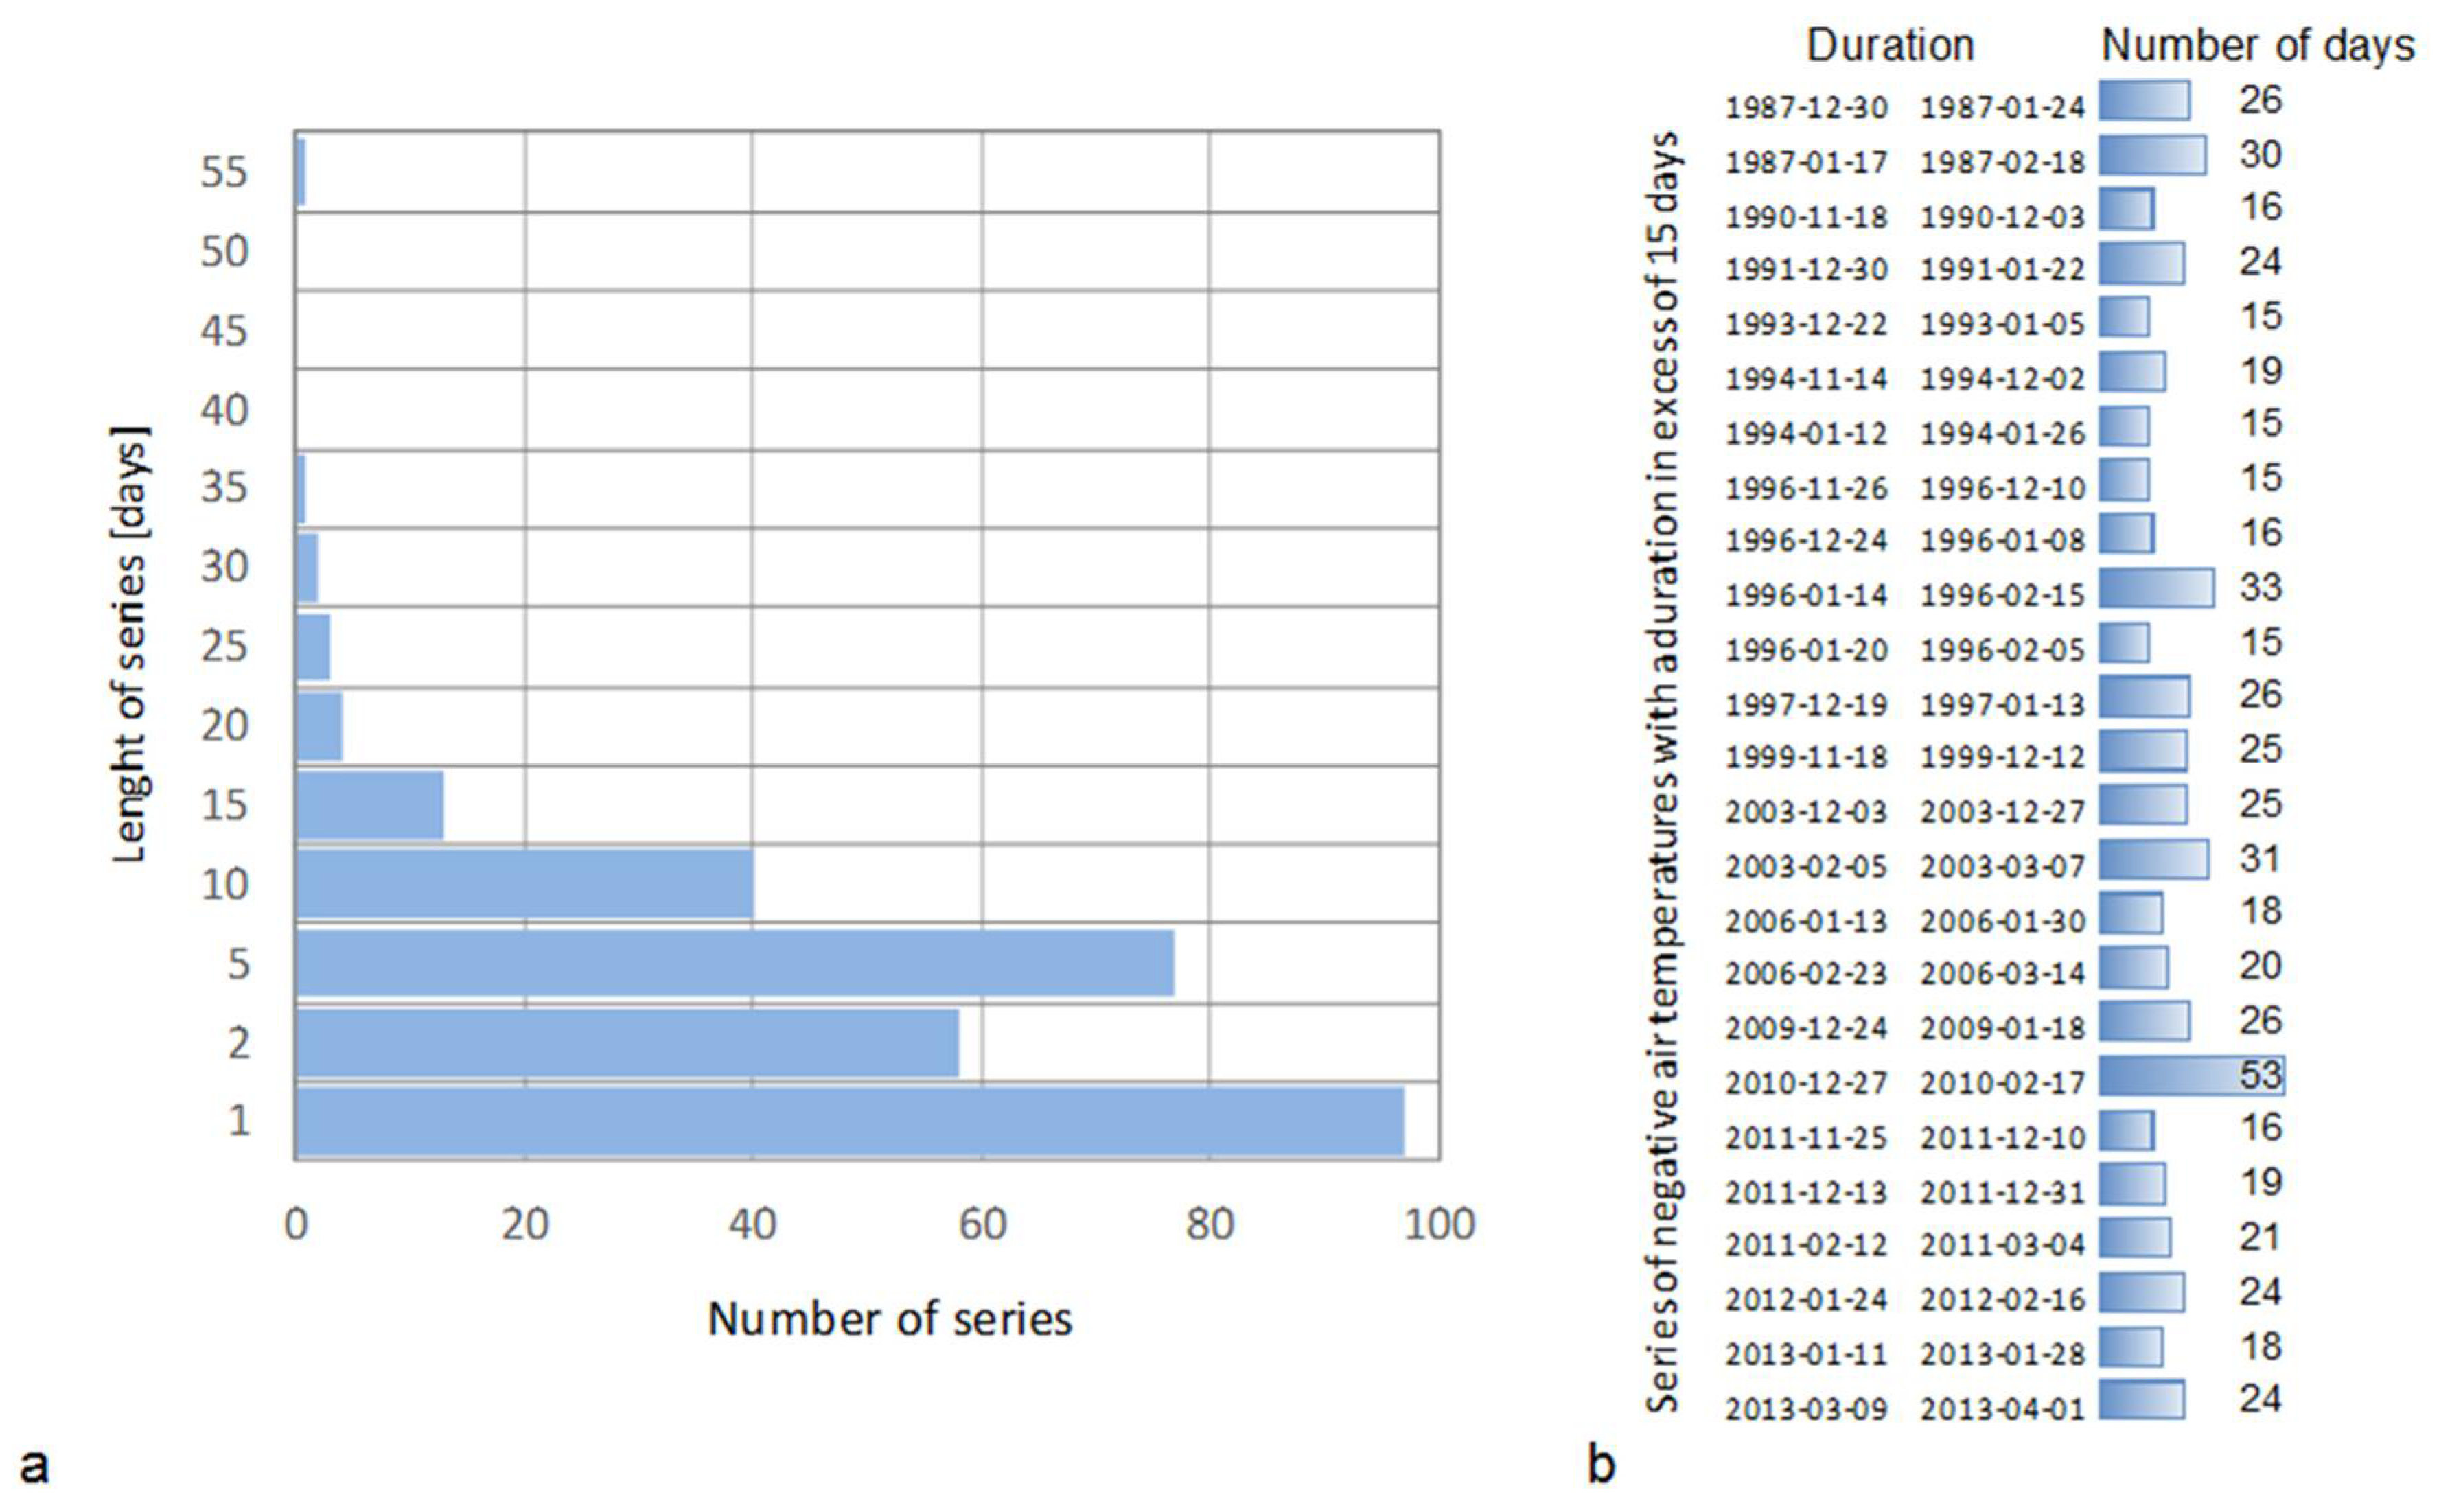
The analysis of daily air temperatures registered at the station in Piła in the years 1987–2013 identified 306 negative temperature series that occurred in the winter season. In individual years the number of uninterrupted series varied, as did their duration, which ranged from 1 to 53 days. The greatest frequency of occurrence was demonstrated by 1-day situations with negative air temperature (Figure 2a). Amongst the 306 negative air temperature series, 25 were observed with a duration in excess of 15 days (Figure 2b). The longest CDD series, which lasted for 53 days, occurred in 2010, between 27th December and 17th February.
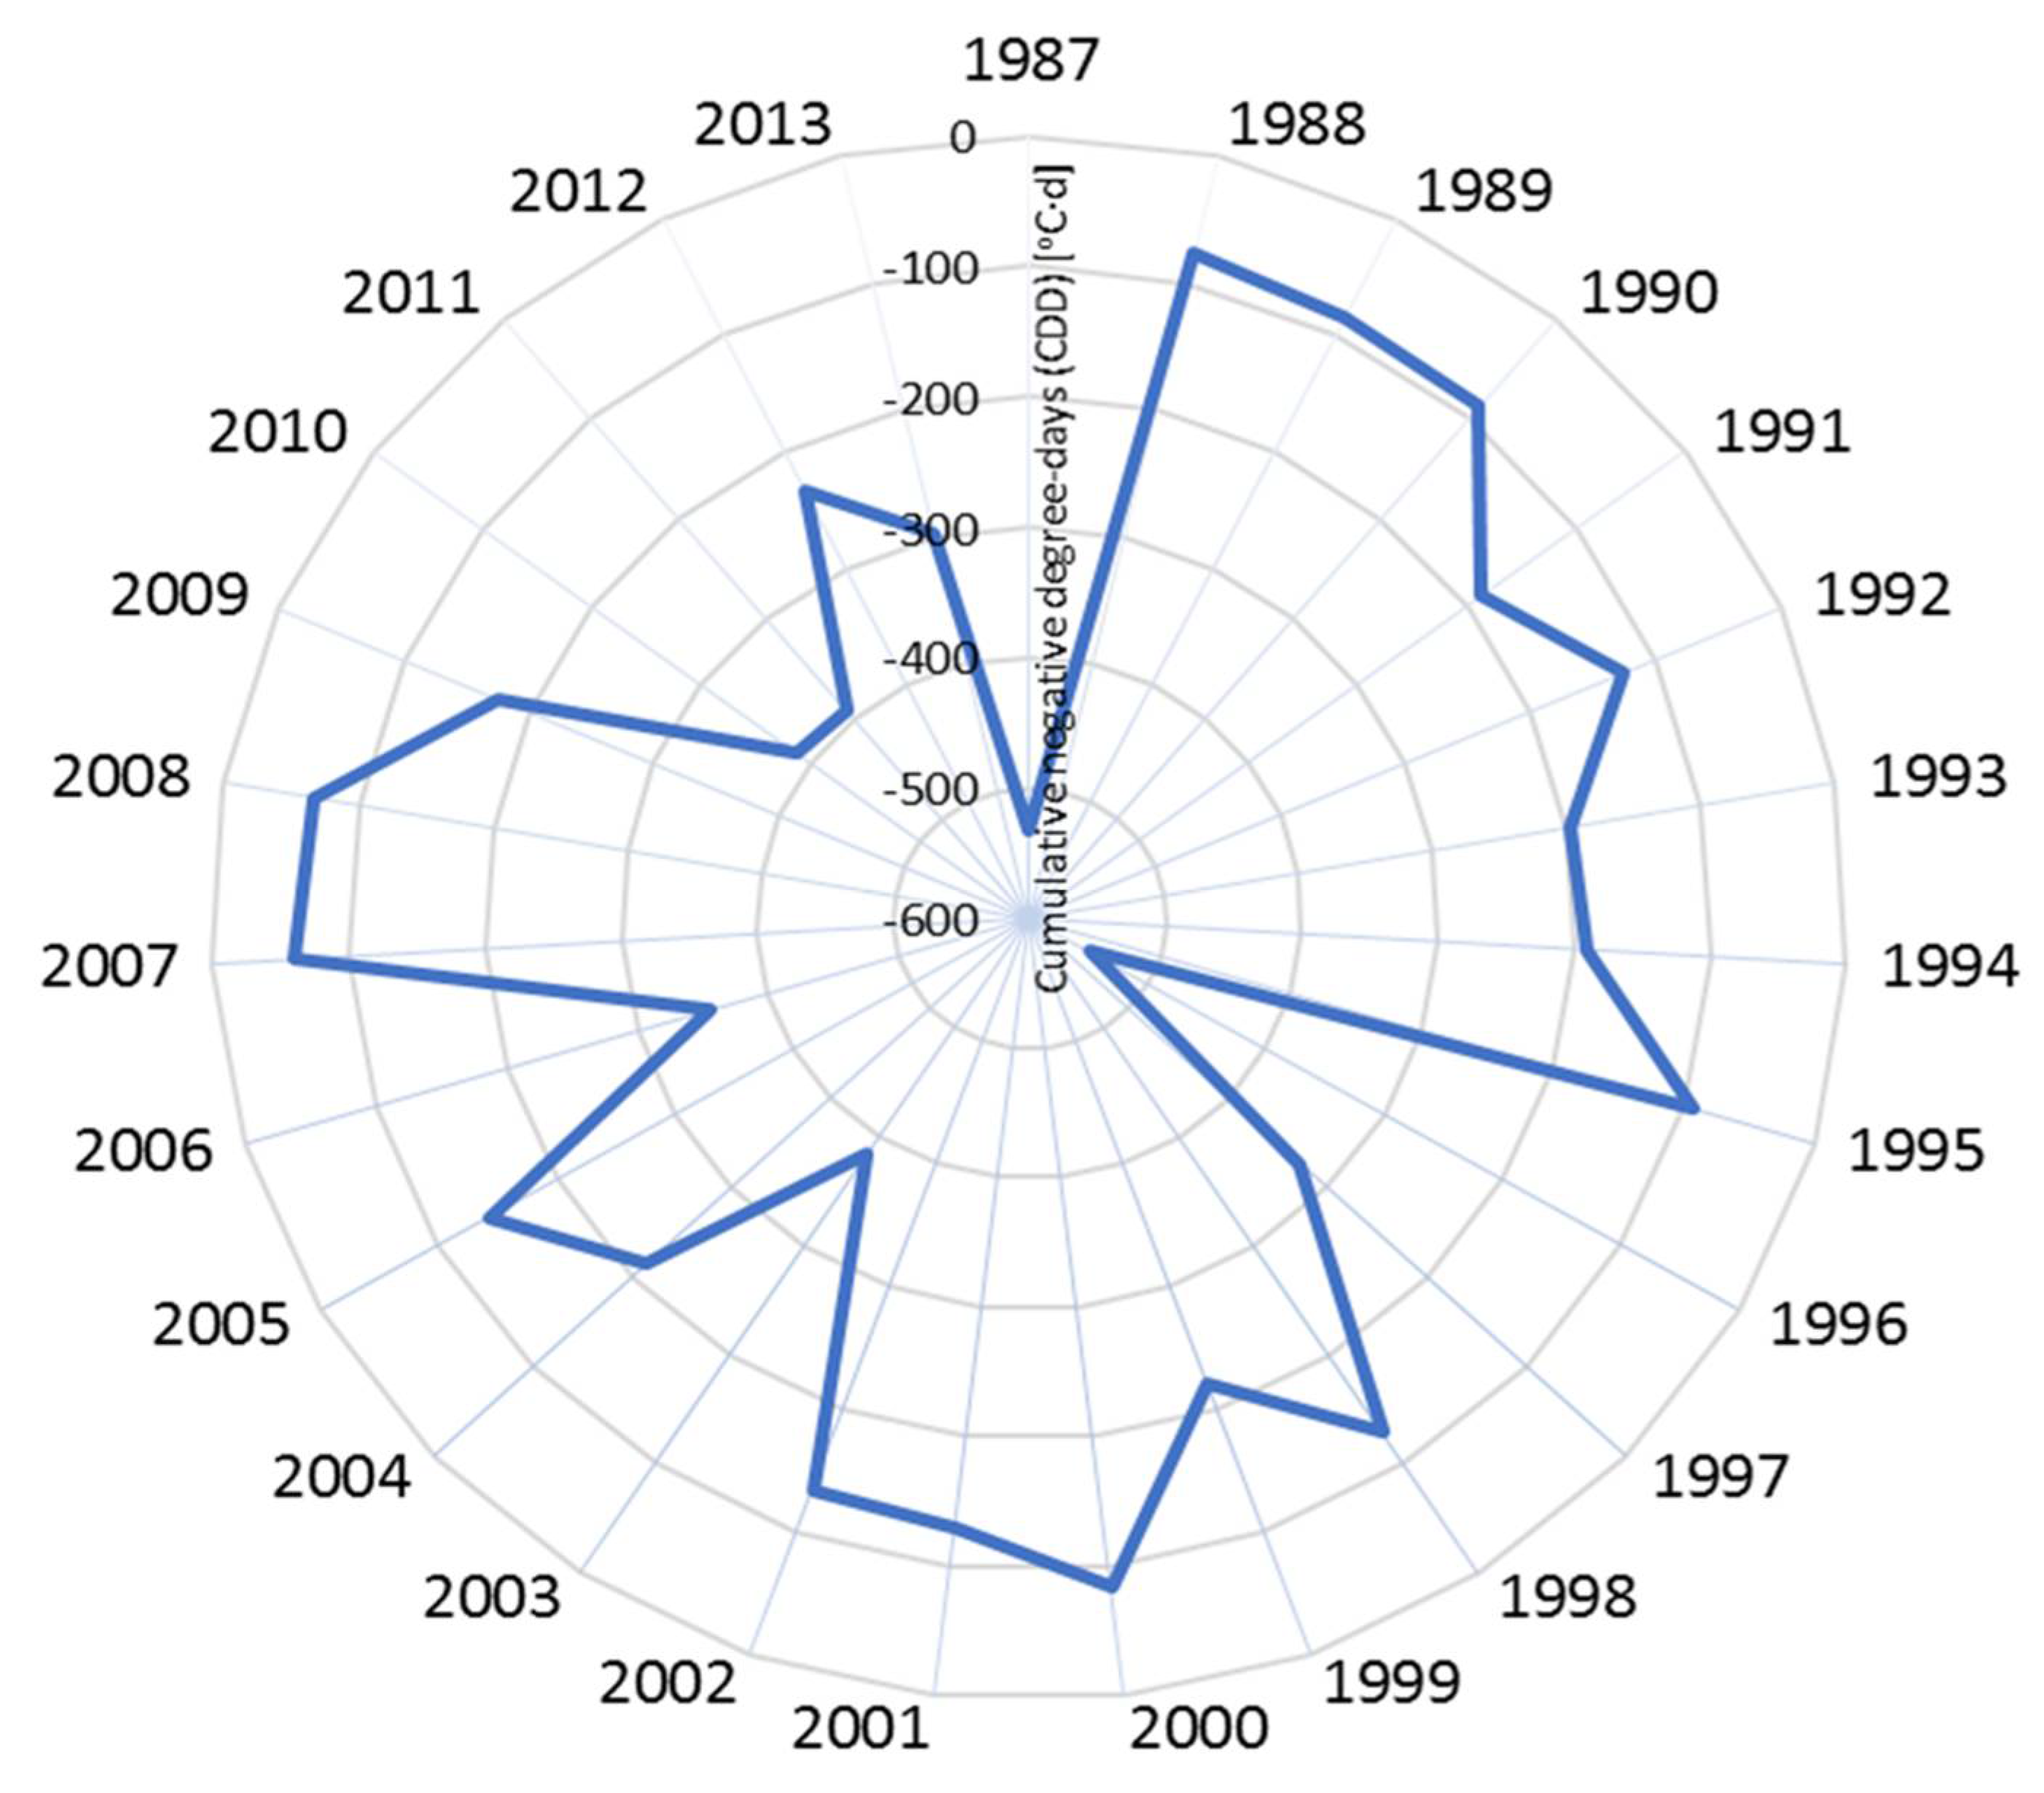
The chart of annual cumulative negative degree-days CDD (Figure 3) shows that low air temperatures were particularly frequent in the year 1996, for which annual CDD (for the hydrological year November–October) equaled nearly −600 °C·d. Another year with a high CDD value was 1987 (approximately −500 °C·d).
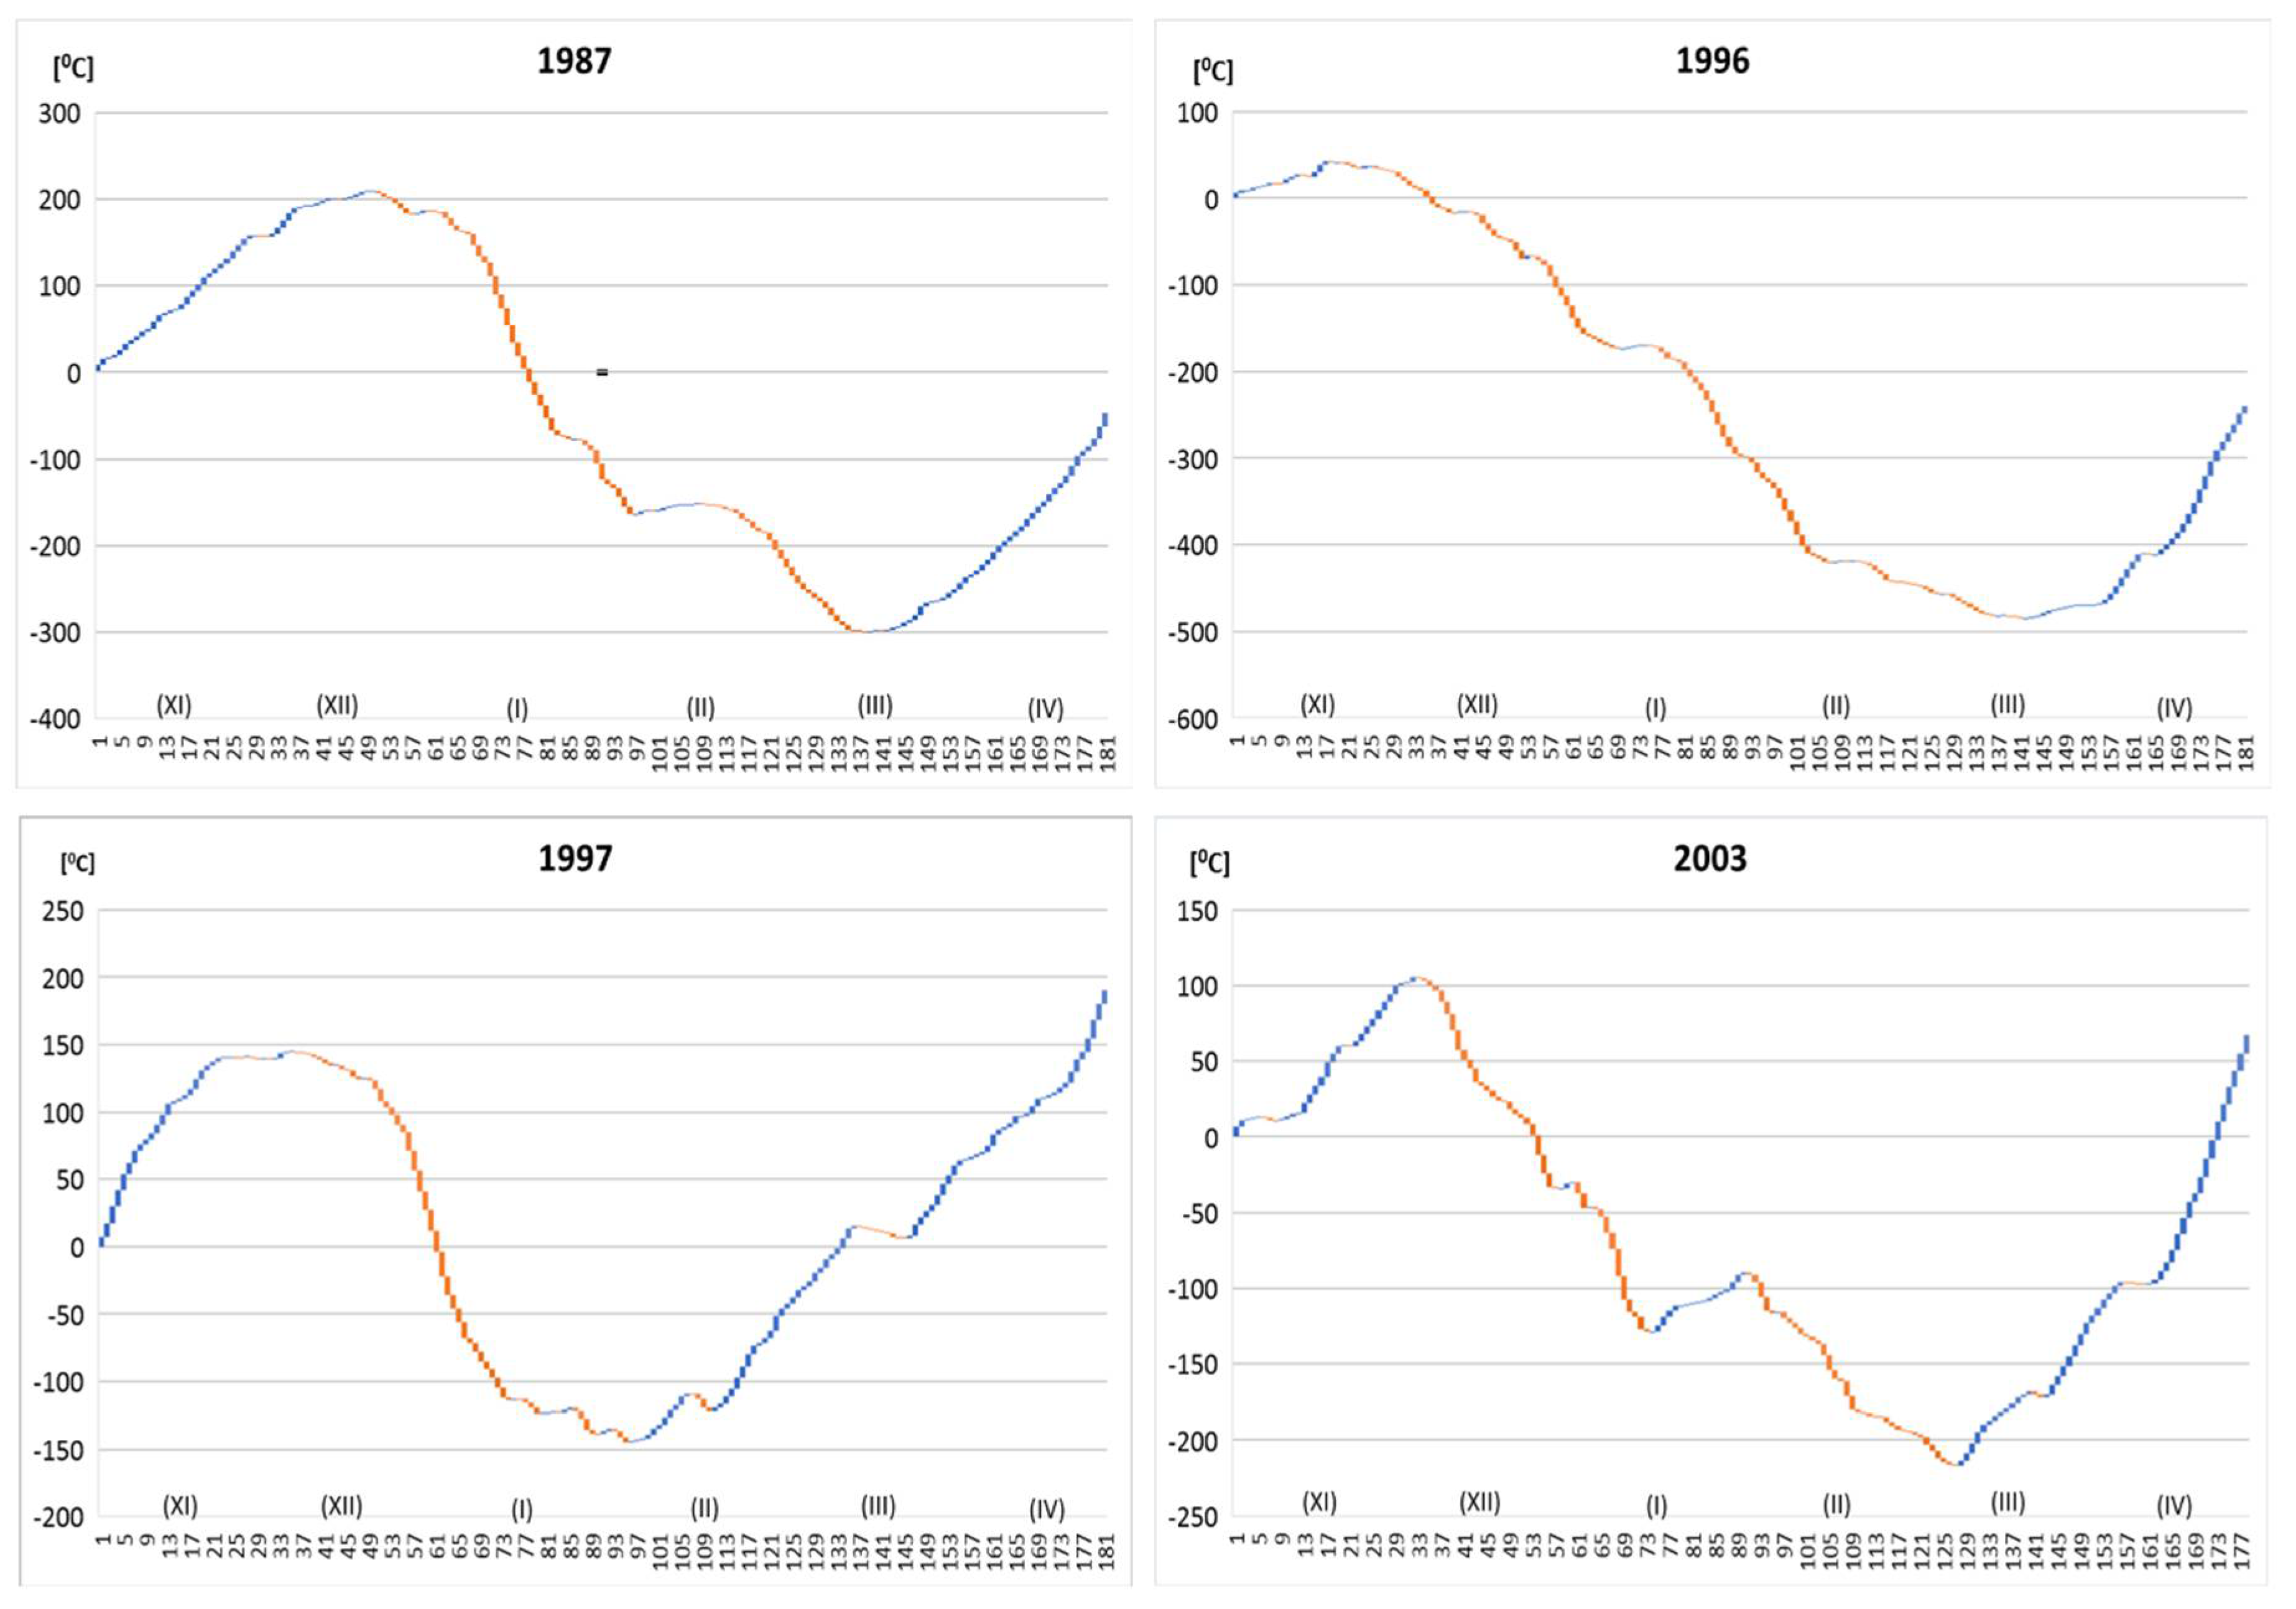
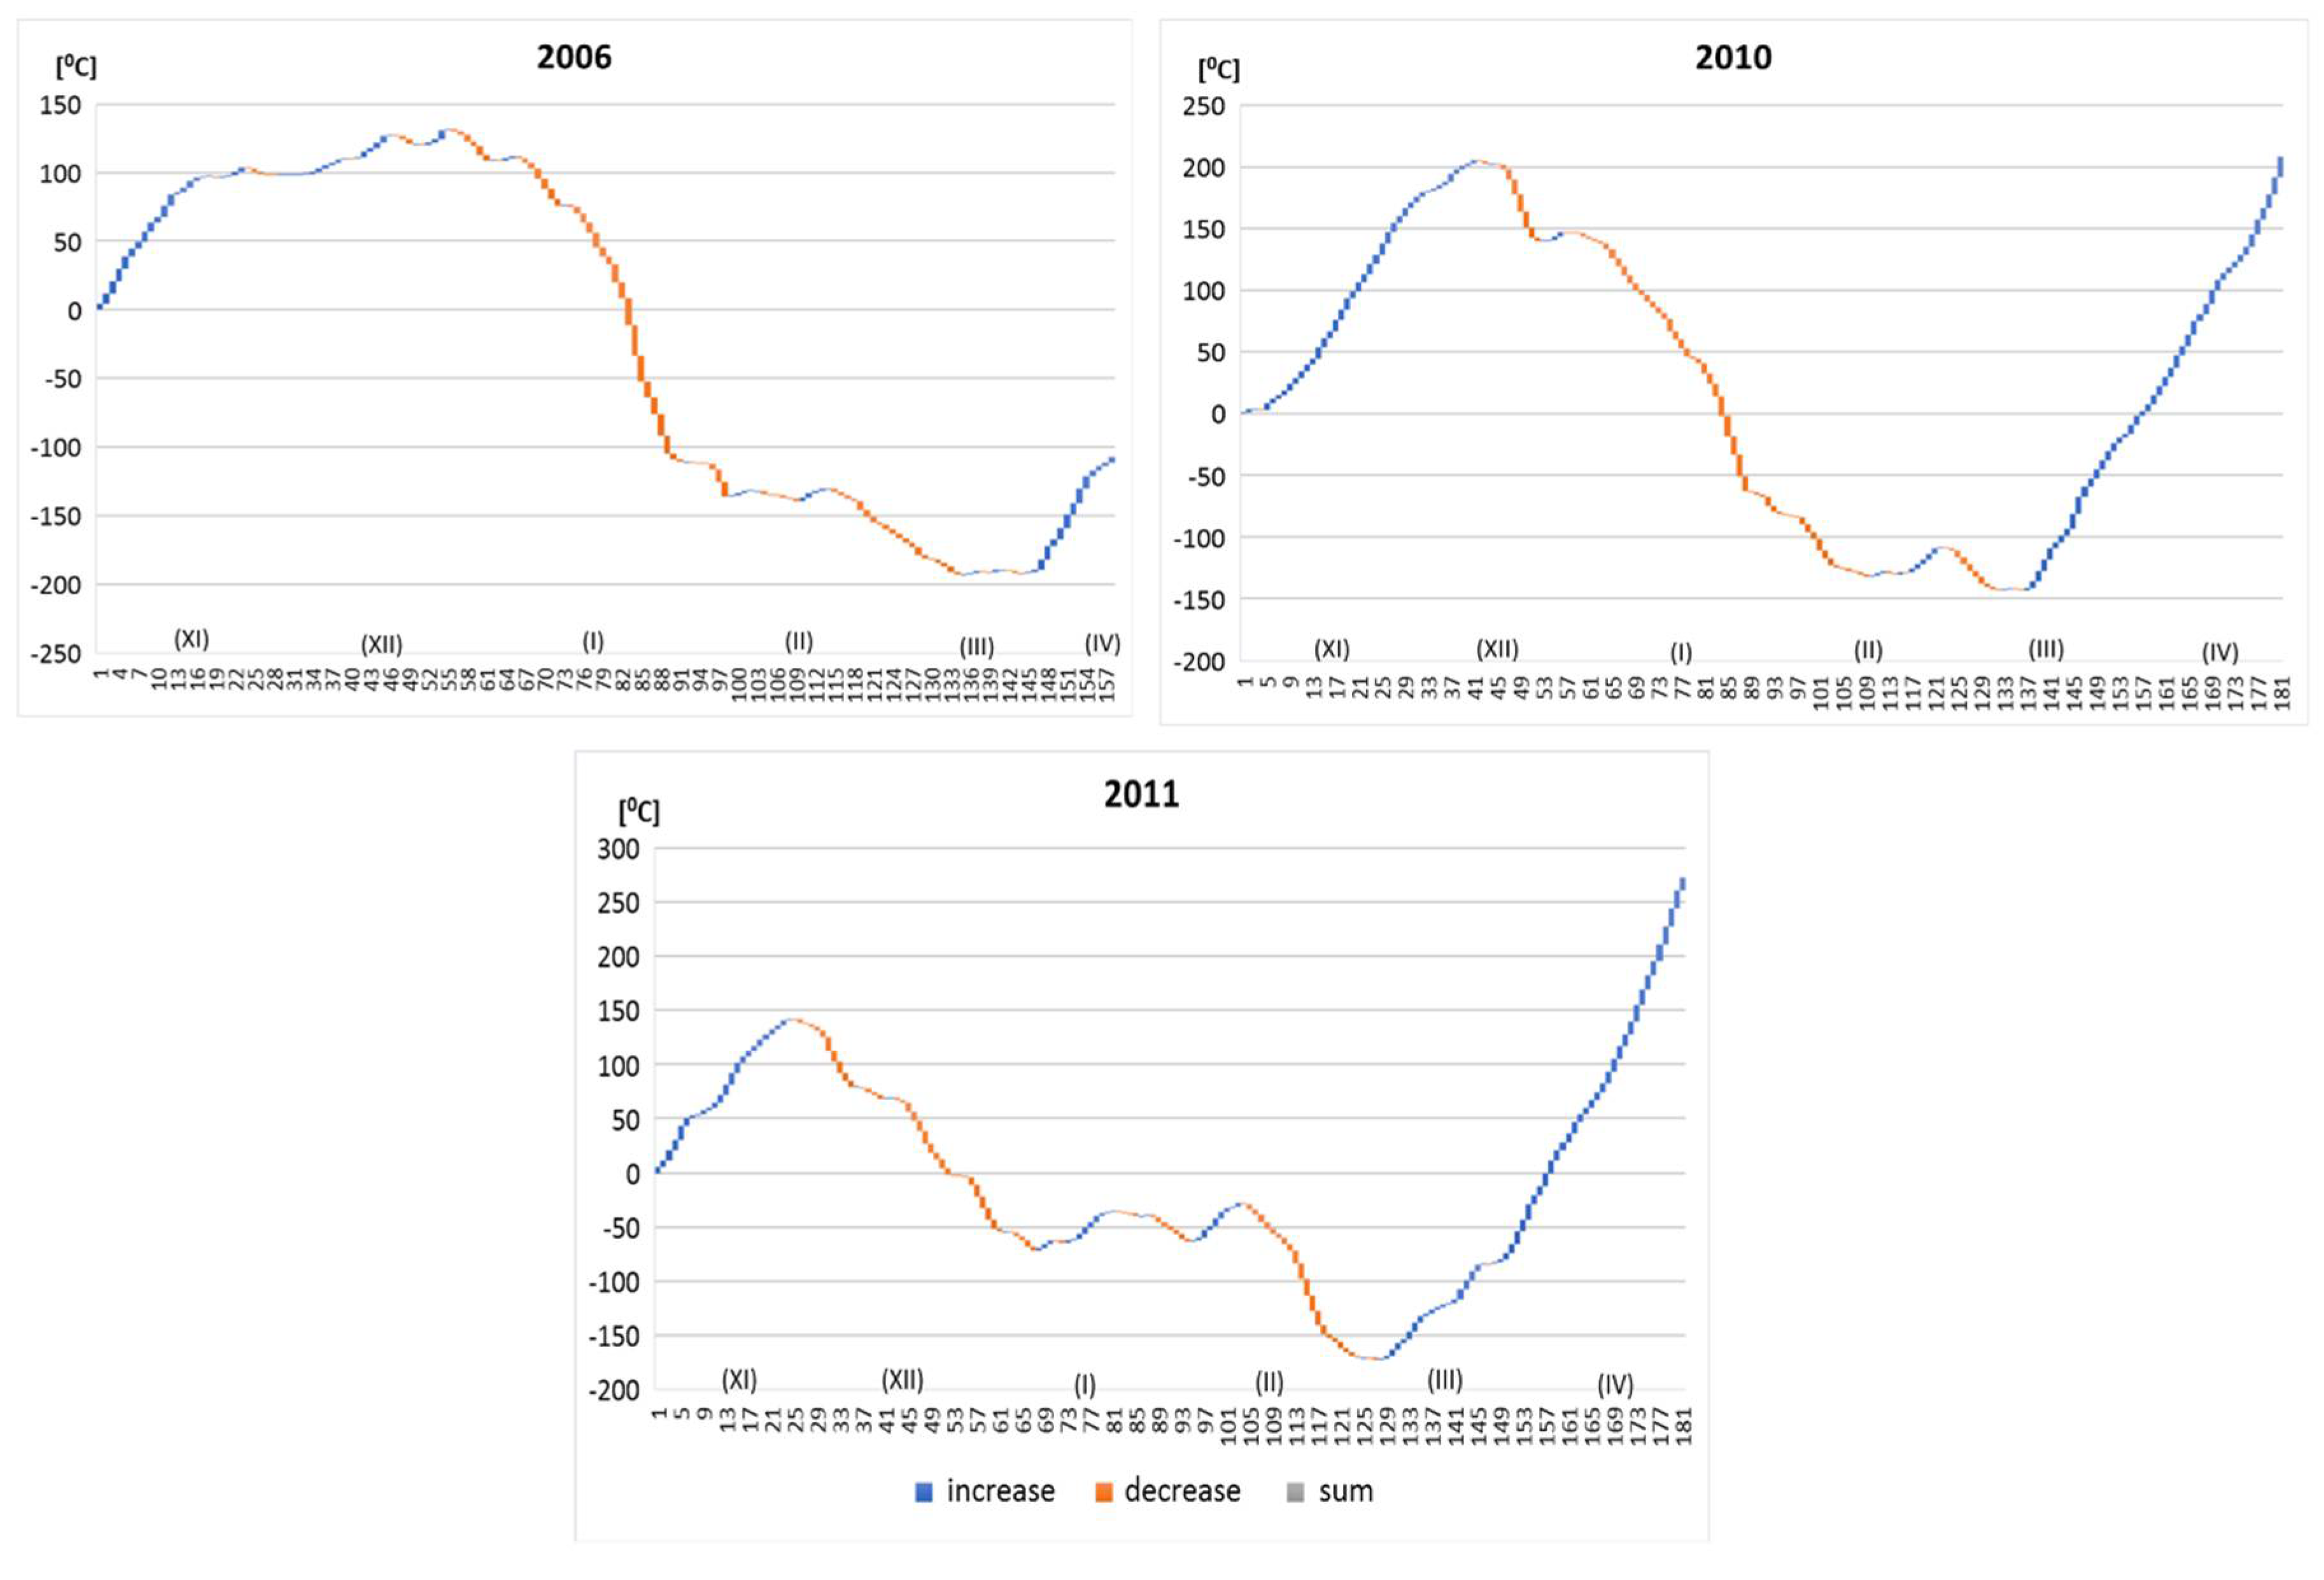
Daily increases and decreases in air temperature in the winter season (in relation to values from the preceding day) in years with the highest CDD values have been presented in cascade charts (Figure 4). In 1996, the cumulation of negative air temperatures commenced earliest, already in November, i.e., at the beginning of the hydrological year, and persisted until February. A similar situation occurred in 2003, when the cumulation of negative air temperatures also started in November and lasted until March. In years with high CDD values occurring after 2000 (with the exception of 2003), negative air temperatures were registered at later times in comparison with previous years, while the cumulation of negative air temperatures was interrupted by short-lived episodes of mid-winter thaws (Figure 4).
In years with the lowest CDD indices (1988–1989, 2007–2006), air temperature increased successively during the winter season. During the year there occurred a few short-lived episodes of negative temperatures, however their cumulative degree-days were at a low level (Figure 5).
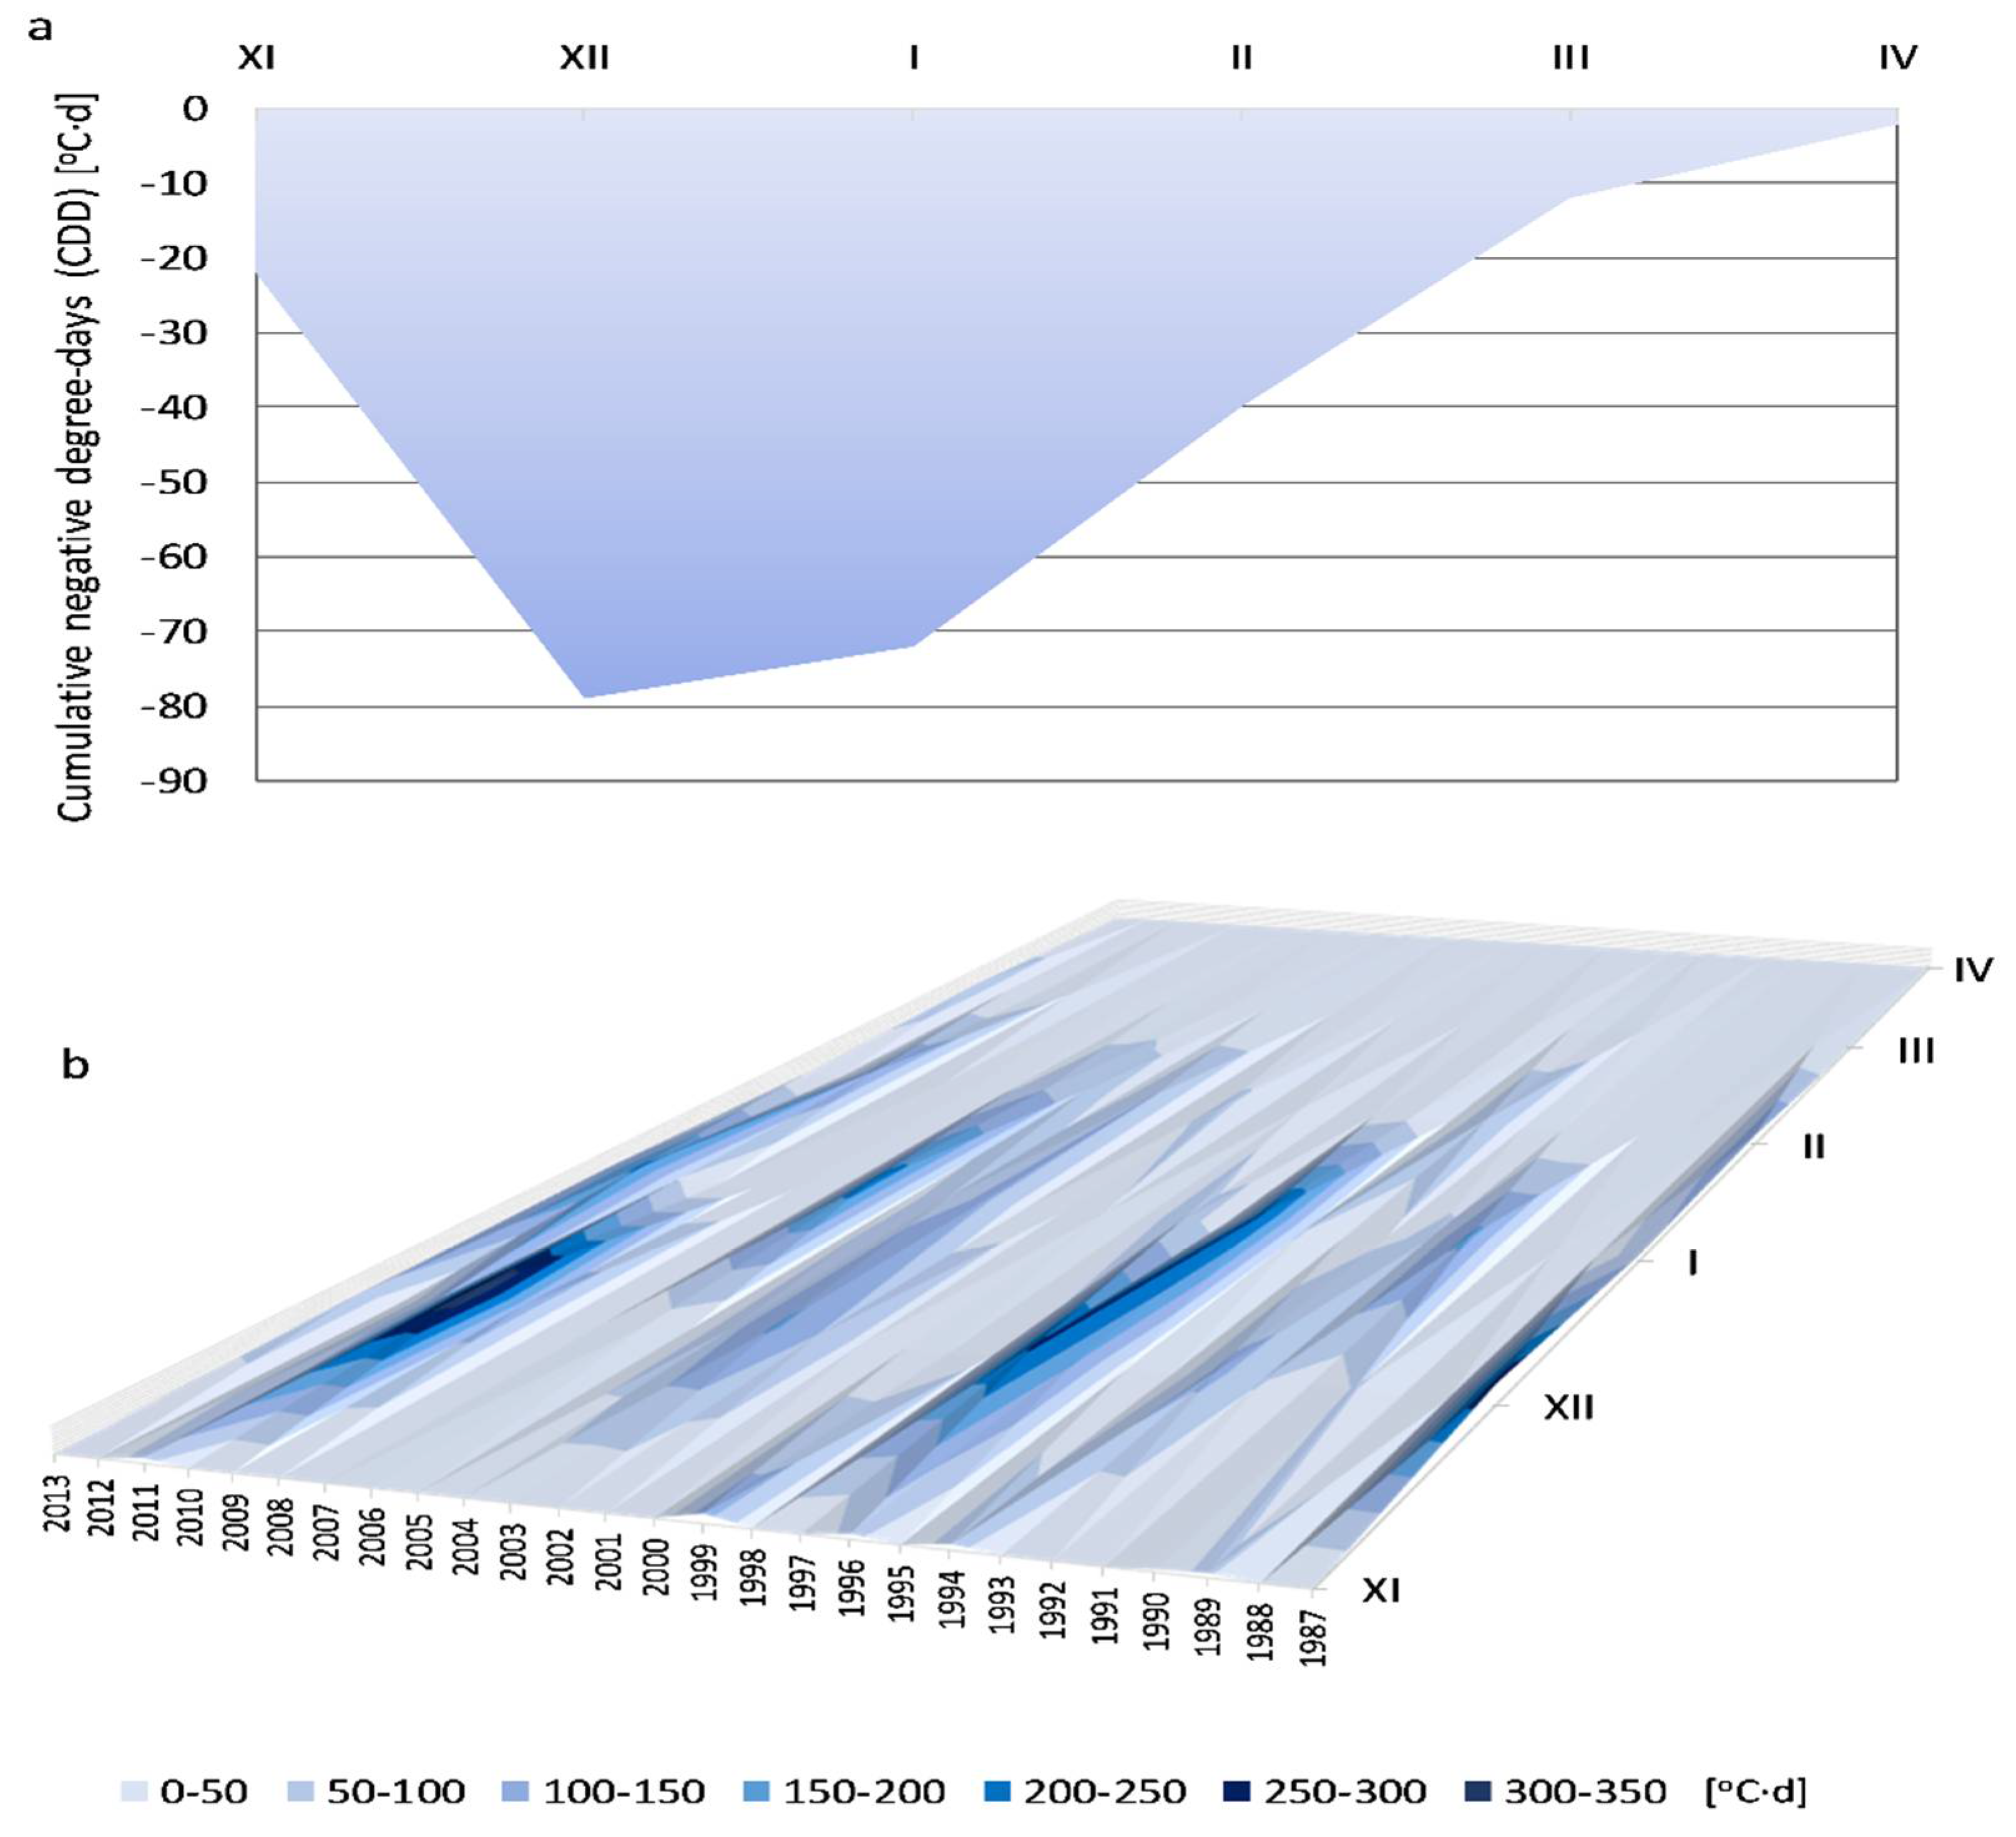
An analysis of average monthly CDD values showed that this phenomenon was most identifiable in December and January (Figure 6). For December, the monthly CDD value equaled approximately −80 °C·d, while for January it equaled −72 °C·d. The smallest CDD values were determined for April, when practically the last phase of existence of ice phenomena occurs, connected mainly with the disappearance of ice cover and the flow of ice floats.
3.2. Circulatory Factors and Types of Atmospheric Circulation
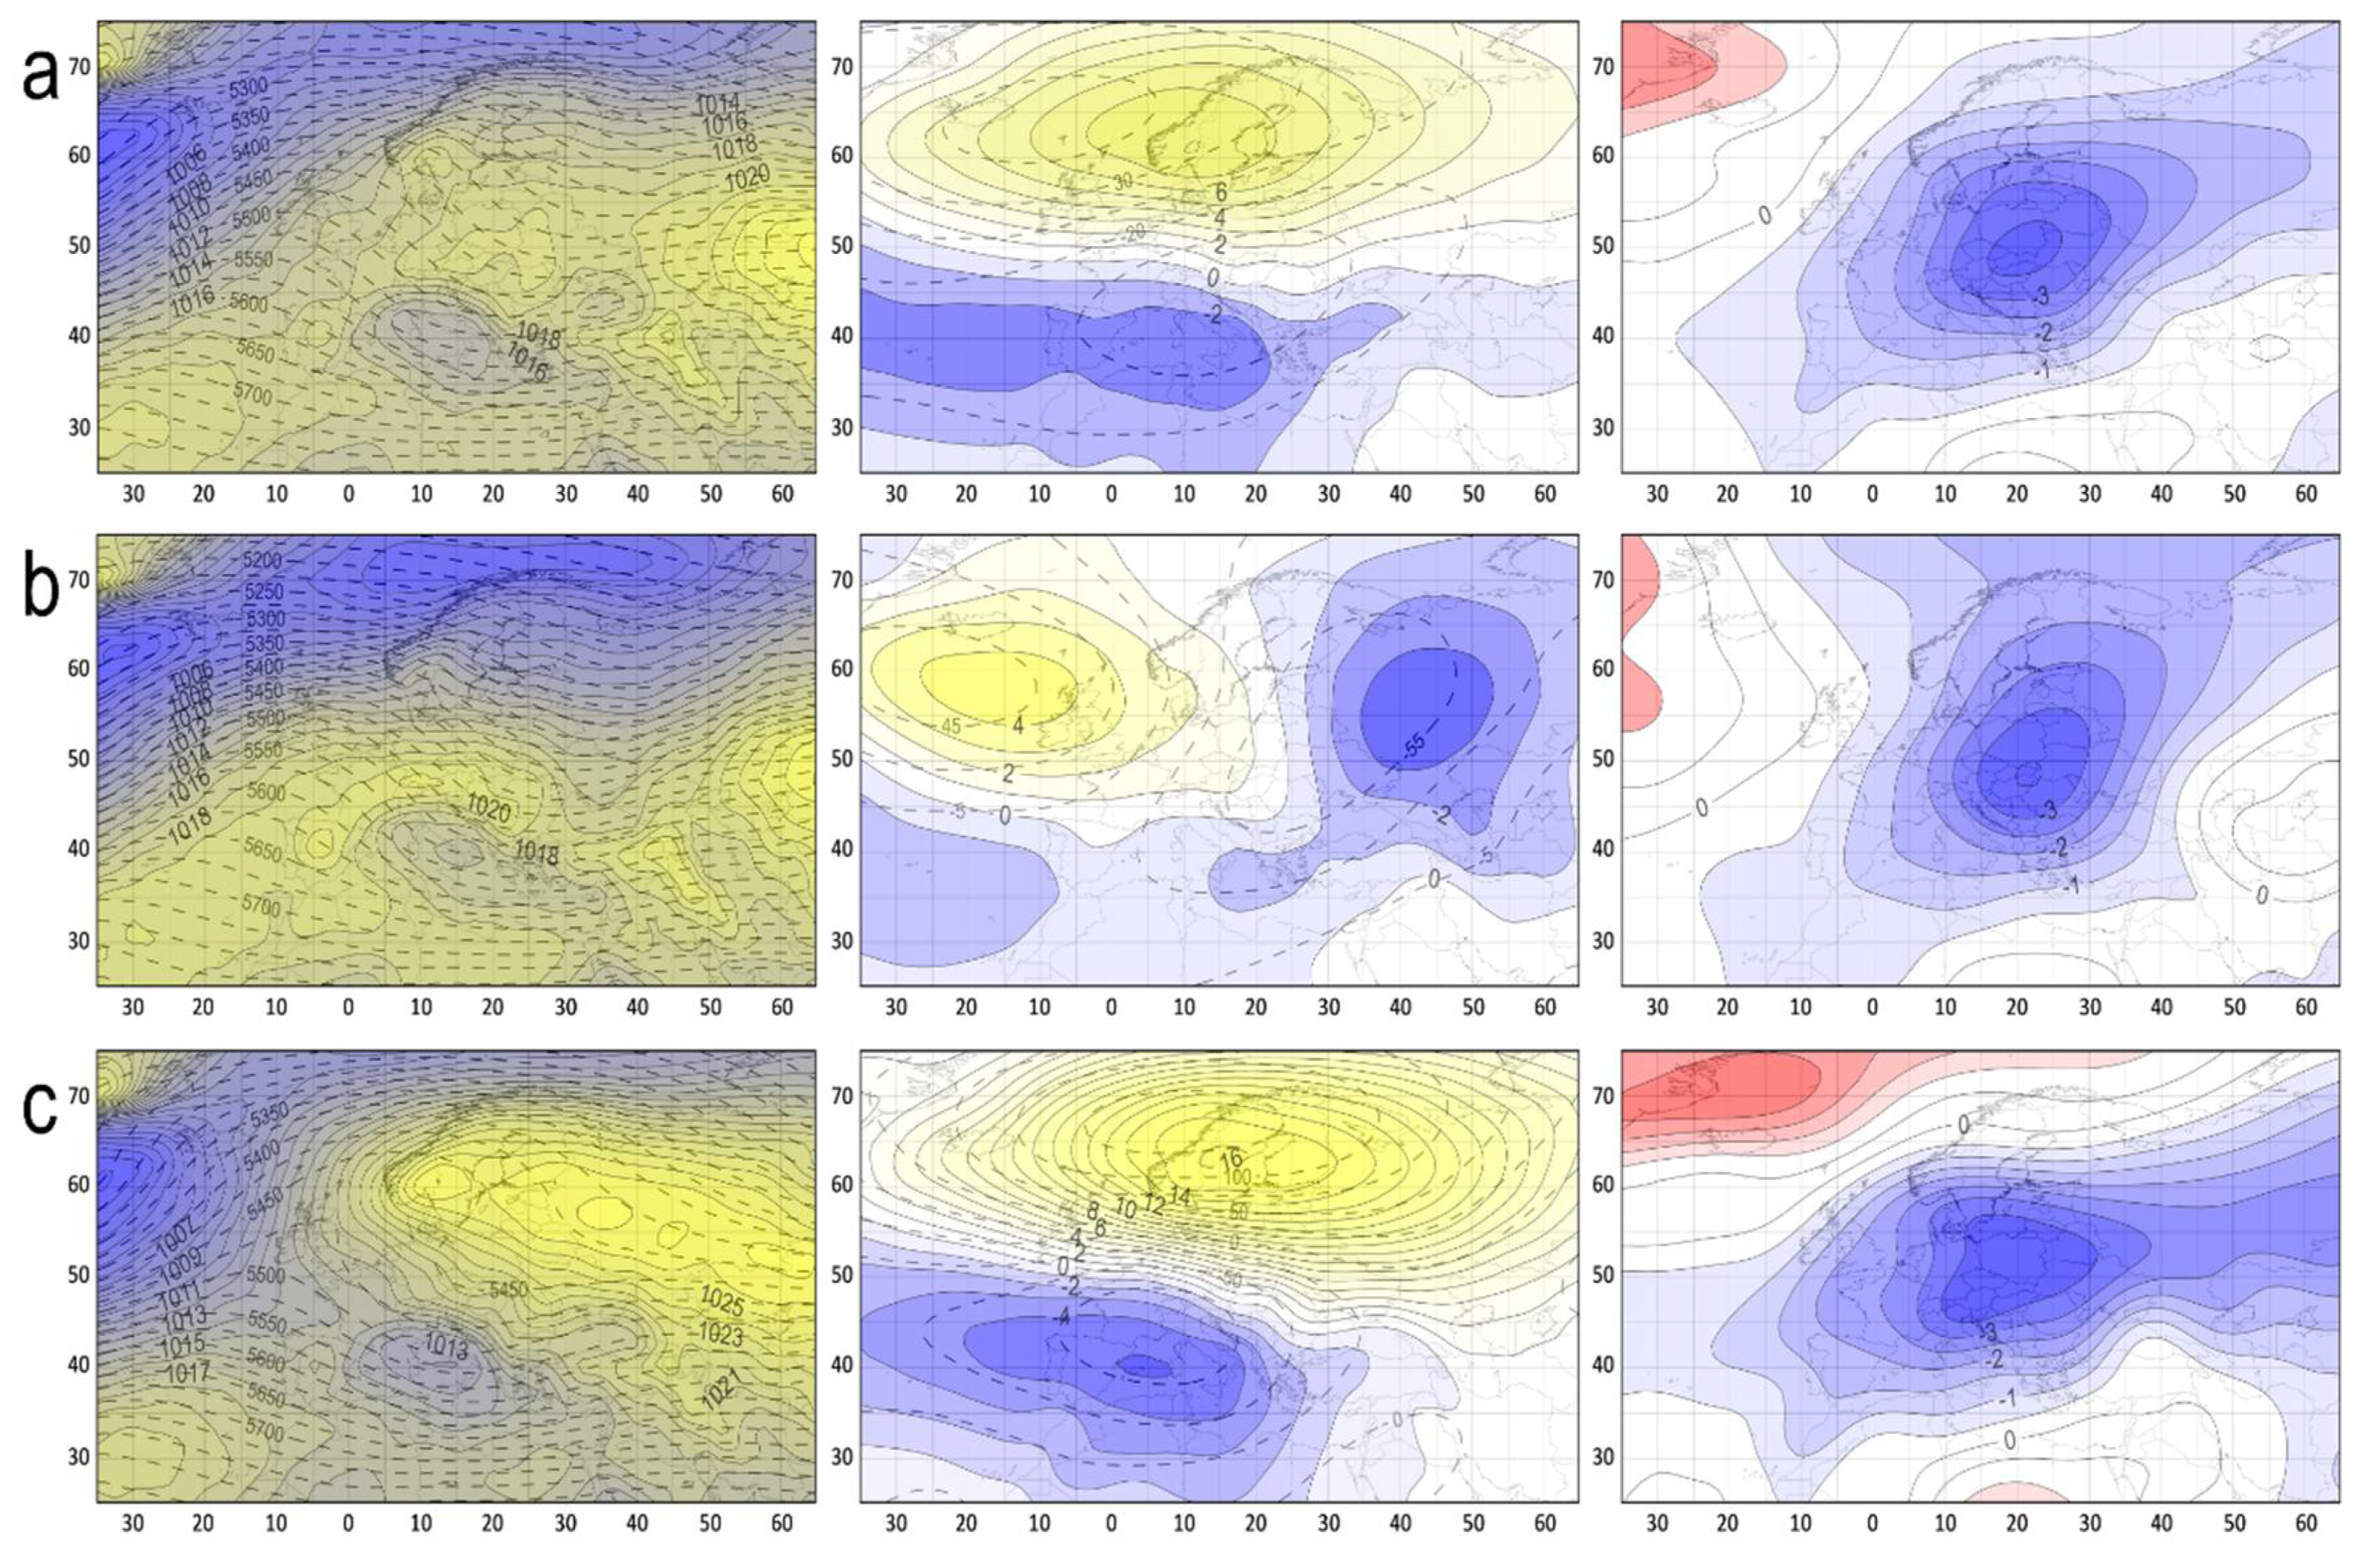
The occurrence of negative degree-days in the analyzed multiannual period was on average connected with the presence of increased pressure over the continent (Figure 7a). A local high developed above Poland within the ridge of high atmospheric pressure from Eastern Europe (>1020 hPa). At the same time, a low pressure center was present over the North Atlantic (<1001 hPa) and the Mediterranean Sea (<1015 hPa).
During the period from November to March, SLP was higher than average over the majority of the continent. The center of the anomaly—>8 hPa—was observed to be located above Scandinavia, whereas over western Poland it totaled around 4 hPa. Isohypses of the 500 hPa isobaric surface over Central Europe were bent southwards, creating a clear depression, which testifies to the presence of cool air masses on the analyzed days. The arrangement of isolines for 500 hPa points to the north-westerly flow of air in the central layer of the troposphere. The isobaric surface occurred at a lower height than usual, approximately 30 m, above western Poland. The presence of cool air masses is also suggested by the negative T850 anomalies. Above Central Europe, these were <−3 °C, and locally even <−3.5 °C. The baric situation described caused the advection of continental air masses from the north-western sector in the lower troposphere. This direction of advection is also indicated by the course of the T850 anomalies (from the north east to the south west of the continent).
The description of baric conditions given above presents only average baric conditions, which lead to the occurrence of negative degree-days. Individual instances may be brought about by various baric situations, and for this reason in the next step we grouped degree-days in terms of SLP in order to distinguish circulation types. On this basis 2 types of circulation conducive to the occurrence of negative degree-days in the studied area were distinguished. 835 days were classified as belonging to the first type. On these days, a ridge of high atmospheric pressure was present over Western and Eastern Europe (Figure 7b). These systems were divided by a low-pressure embayment. During the analyzed days, SLP over the eastern part of the continent was lower than average in the November-March season (<−3 hPa in the centre of the system), and higher over the western part (>4 hPa in the center of the system). The studied area was located within the range of positive anomalies (approximately 1.5 hPa). A similar course typified the z500 hPa anomalies, with a slight westerly shift. Such a baric system caused the advection of air masses from the northern sector—and this is supported by the course of the T850 anomalies—from north to south. Air temperature at the 850 hPa isobaric level over Central Europe was lower than average by approximately 3 °C. 680 days were classified under type 2. A ridge of high atmospheric pressure from Eastern Europe was present over the majority of the continent, with a few local highs (Figure 7c). In the center of the system SLP was higher than average by as much as >16 hPa, while over the studied area—by approximately 6 hPa. A similar longitudinal distribution of anomalies was observed for z500 hPa. The baric system described above ensured the influx of air masses from the eastern sector. The T850 anomalies proceeded from east to west, and equalled <−3.5 °C over the studied area.
At the station in Piła in the years 1987–2013, negative air temperatures also occurred in the last month of the warm half-year period, i.e., October (Table 2). These were individual days or series lasting no more than a few days (3–4 days) with negative temperatures, which were registered in a few years. The longest of these occurred in 1988, 1997 and 2003. The CDD value was greatest in October in two of the years: 2003 (−6.5 °C·d) and 1988 (−5.1 °C·d). However, the number of series with negative temperatures that lasted a few days in the warm half-year period of the hydrological year was small in comparison with situations registered in the winter half-year period.
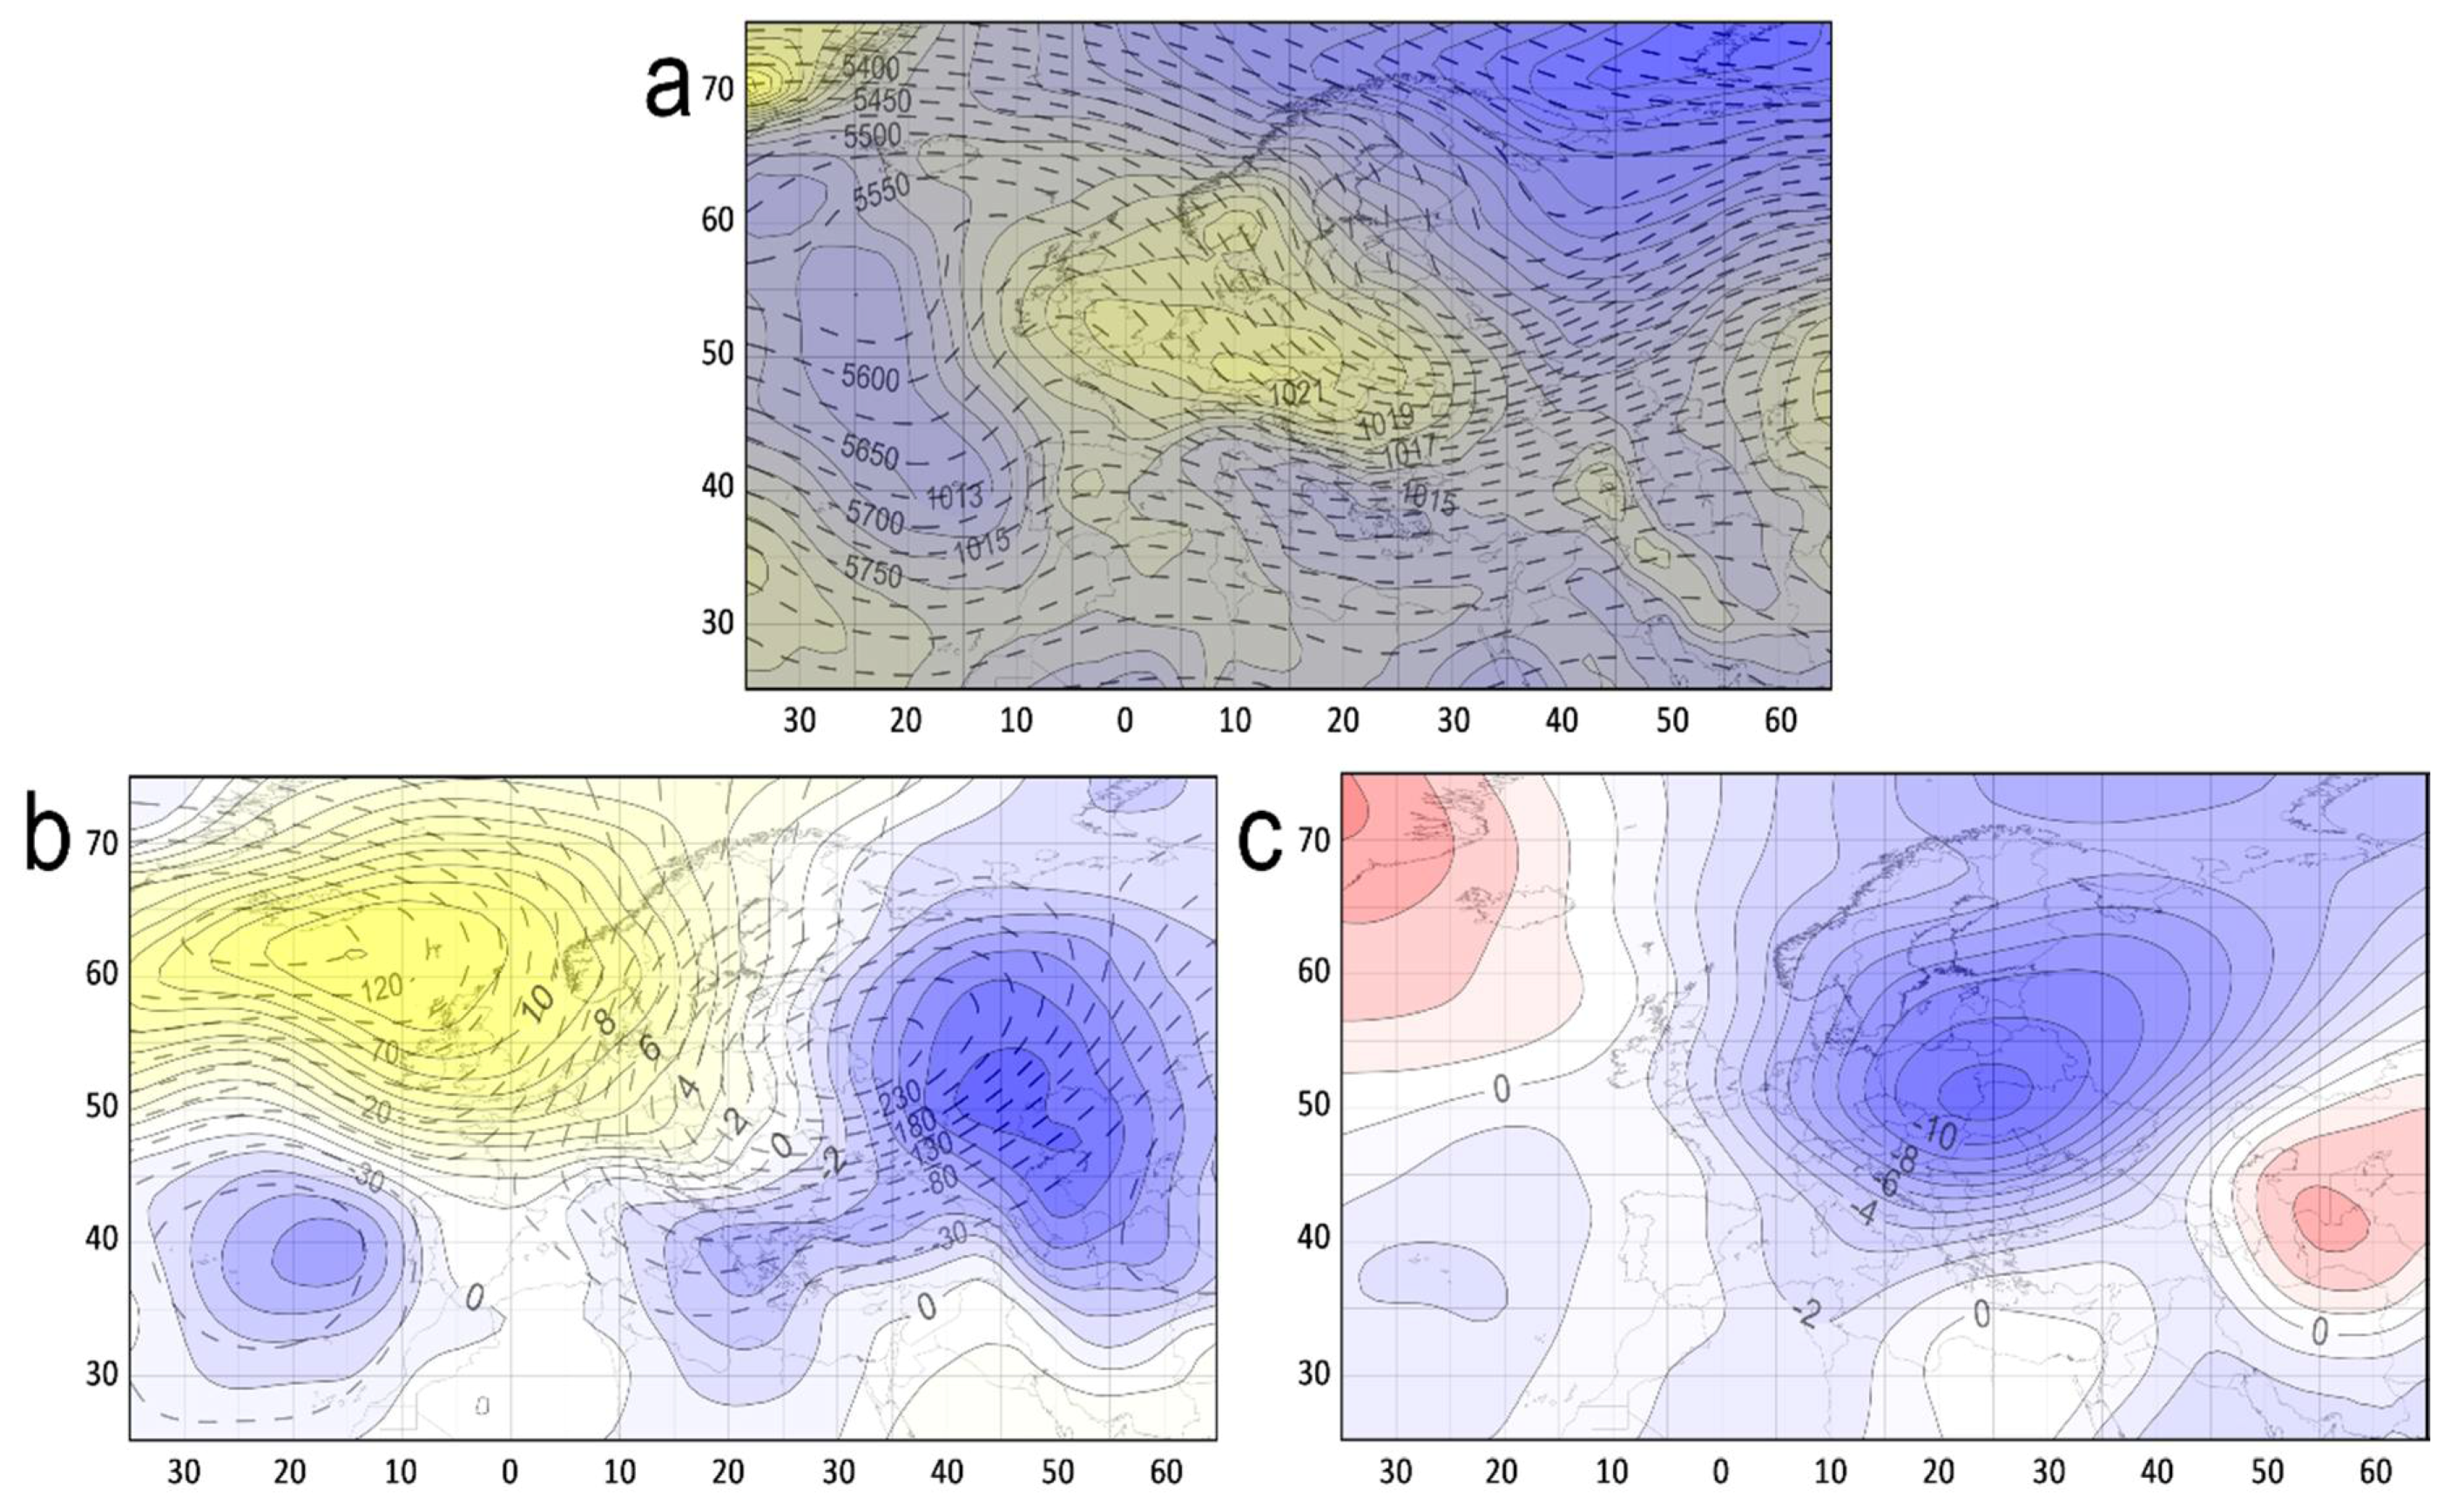
The occurrence of negative degree-days in October was connected with the presence of a high pressure system over Europe (1022 hPa) (Figure 8). In turn, Eastern Europe was impacted by a low-pressure embayment. During the analyzed days, SLP over the eastern part of the continent was lower than average in October (<−7 hPa in the center), whereas there were positive anomalies over the north-west (>11 hPa). Such a system guaranteed advection from the north and north-east, and this is indicated by the course of the T850 anomalies, locally amounting to <−11 °C. The presence of cool air masses is also supported by the negative z500 hPa anomalies, which over Belorussia and western Russia totaled <−255 m.
3.3. Frequency of Days with Ice Cover on the River
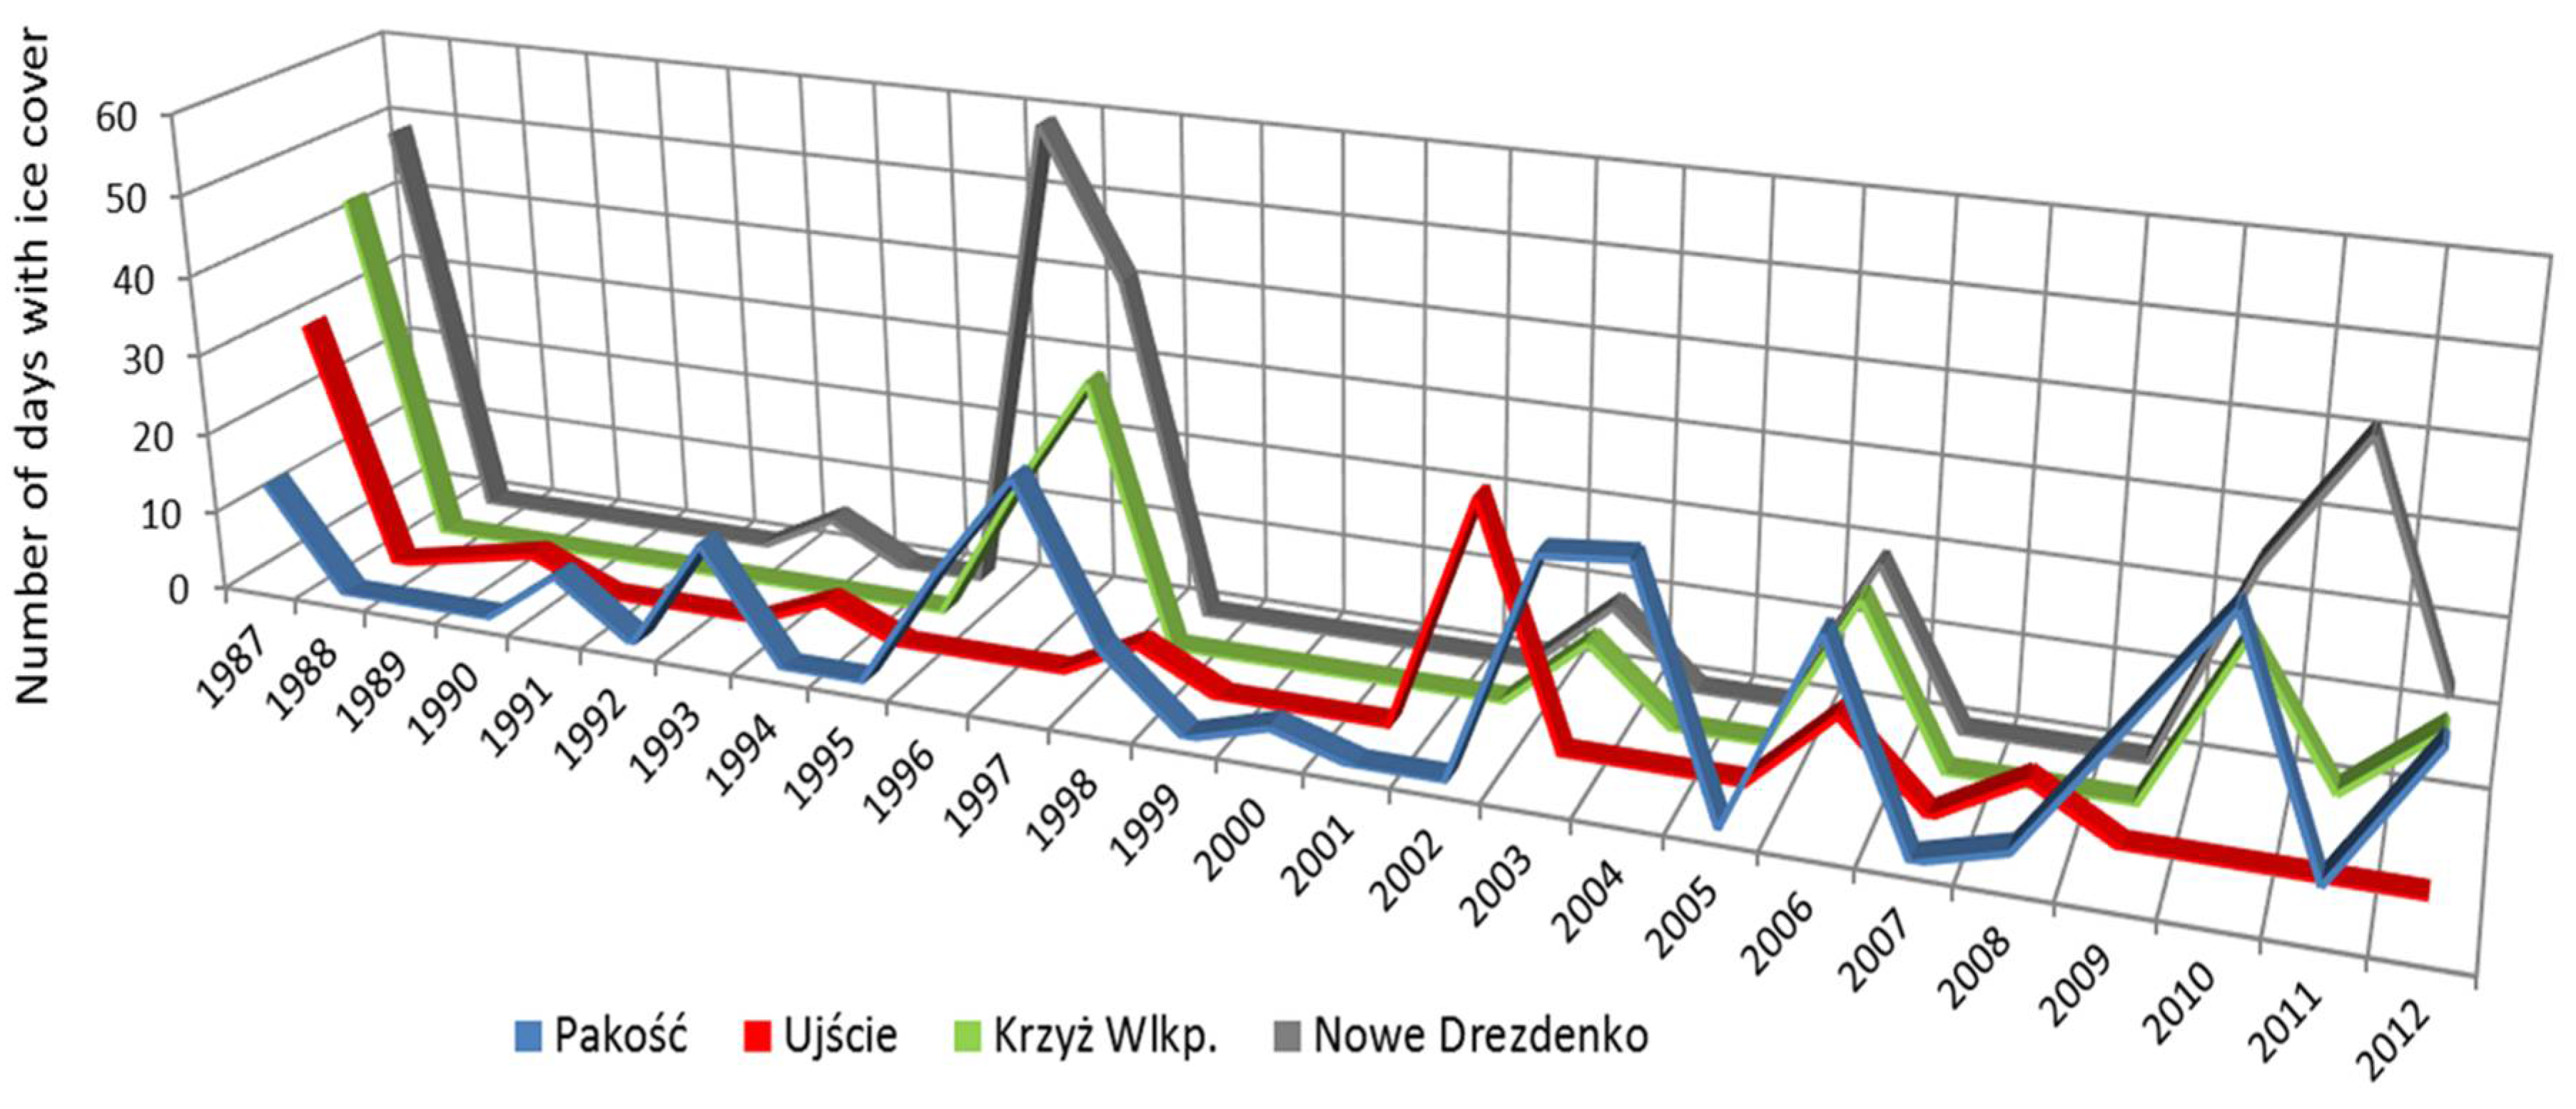
An analysis of the frequency of days with ice cover on the River Noteć pointed to a variety of times of its occurrence and duration in individual years (Figure 9). In the years 1988, 1992, 1995, 1999, 2005 and 2007 its occurrence was not observed on the river. The ice cover persisted the longest in the lower course of the River Noteć in Nowe Drezdenko (261 days) and in its upper course near Pakość (251 days).
During the researched period, there were 21 series with a permanent ice cover on the River Noteć at Pakość (upper course), which coincided with 25 negative air temperature series. In the majority of instances, ice cover appeared at a CDD in excess of −16 °C·d (max. CDD = −135 °C·d) (Table 3). In the middle course of the river (Ujście indicator point), the number of series of days with ice cover decreased to 9, and these coincided the occurrence of a series of 14 consecutive days of negative air temperatures. The ice cover on the river was registered there already at a CDD in excess of −21 °C·d (max. CDD = −198 °C·d). On the River Noteć in Krzyż Wielkopolski there were registered, similarly to Ujście, 9 series of days with ice cover, which coincided with the occurrence of a series of 17 consecutive days of negative air temperatures. On the River Noteć at Nowe Drezdenko the number of series of days with a permanent ice cover increased to 13, and these coincided with the occurrence of a series of 26 consecutive days of negative air temperatures. This means that the series could sometimes last a few days with a zero CDD. Instances of occurrence of ice cover at a CDD equal to 0 °C·d could be connected with the incorrect reading of the phenomenon in thermal condition values. On average, one series of days with permanent ice cover coincided with two or three (Nowe Drezdenko) series of negative air temperatures. In the lower course of the River Noteć, permanent ice cover formed in the main at a CDD greater than −92 °C·d (Krzyż Wielkopolski) and −73 °C·d (Nowe Drezdenko) (Table 3).
The dates of the first and final series of days with a permanent ice cover on the River Noteć in a given year have been presented in Table 4.
Usually, the ice cover formed in December and January, when cumulation of negative air temperatures intensified. Following its formation, the ice cover persisted on average for 11–20 days, whereas the shortest time of its existence was 1 day, and the longest 44 days (Nowe Drezdenko) (Table 5).
3.4. Probability of Occurrence of Ice Cover
An analysis of changes in the probability of occurrence of ice cover with an increase in CDD, showed that in the upper course of the River Noteć at Pakość the probability of its occurrence starts to increase once the threshold of CDD, equal to approximately −150 °C·d, is exceeded (Figure 10). A weaker interconnection was determined in turn at the River Noteć in Ujście. In Krzyż Wielkopolski, the probability of its formation increases once the CDD threshold of −100 °C·d is exceeded, whereas in Nowe Drezdenko at around −75 °C·d.
In the case of the River Noteć in Pakość, the logistic regression model used for analysis has confirmed that on average the increase in CDD by one degree is connected with an increase in the odds of ice cover appearing by approximately 2.10%, while by approximately 1.17% (Ujście) in the middle course of the River Noteć, and by approximately 2.72% in Krzyż Wielkopolski and 5.70% in Nowe Drezdenko. A relatively good match of the model to the data has been achieved for the water-level indicator point in Nowe Drezdenko (confirmed Pseudo-R2 = 0.46), whereas a moderate match (R2 = 0.29) was obtained for the model developed for the station in Krzyż Wielkopolski. At the remaining stations, the match of the model to the data has been very weak (R2 = 0.07).
4. Discussion
In the Northern Hemisphere, the effects of ice phenomena (icing of rivers, freezing and thawing) are observed in more than 60% of rivers, whereas the course and duration thereof are dependent on air temperature and water temperature [14]. The analysis of the impact of cumulative negative air temperature degree-days, conditioned by circulation, on the appearance of ice cover on the River Noteć in the years 1987–2013 has shown differences as regards its formation and persistence on the river. The impact of CDD on the River Noteć freezing in the years 1987–2013 was varied: the probability of its occurrence increased most rapidly for the lower course, while a weaker influence was observed in the middle course of the River Noteć. At all stations, with the exception of Nowe Drezdenko (lower course), the formation of ice cover was preceded by a rather long period of freezing, this comprising in the analyzed period: 60% (upper section—Pakość), 80% (Ujście) and 65% (Krzyż Wielkopolski) of the days with ice phenomena. On the River Noteć in Nowe Drezdenko, the ice cover persisted the longest, frequently for one half of the time during which ice phenomena were present on the river (for example the years 2006 and 2011). This may be explained by the increase in the probability of its occurrence, together with an increase in CDD from approximately −70 °C·d, whereas at the remaining stations such a situation was noted when CDD rose to in excess of −100 °C·d (Figure 10). Once the specific CDD threshold was exceeded, the probability of appearance of ice cover started to increase ever more rapidly.
The following were the years in which the largest number of days with ice formation on the river were observed at the majority of stations: 1987, 1996–1997, 2003, 2006 and 2010–2011, which were characterized by a considerable intensity of occurrence of low air temperatures. This situation was connected with changes in atmospheric pressure, which significantly influences the shaping of air temperature variability in Europe. The impact of pressure changes on air temperature is visible in all months of the year, creating a characteristic cycle with a maximum impact in winter [58]. The presence of specific baric systems guarantees the advection of cool air masses, the existence of which is also testified to by negative anomalies (Figure 7). It is stressed in numerous works that amongst the numerous factors that through their change impact the variability of air temperature in Europe, the foremost is atmospheric circulation [59,60,61,62]. Research carried out hitherto has shown that the occurrence of periods of a few days with frost (so-called frost waves) in Poland may be connected with 3 types of circulation [1,3,58]. When type 1 was prevalent, Poland found itself under the influence of a high from the center, which was located on the borders of Estonia, Latvia and Russia. When type 2 was prevalent, the center of the high was situated above Poland, while as regards the prevalence of type 3, Poland found itself under the influence of a ridge of high pressure from over Eastern Europe. The abovementioned baric conditions led to the advection of cool continental air masses from the “eastern sector”, in the broadest meaning of the term. An additional important factor impacting the fall in air temperature was the cloudless or only slightly cloudy weather, which resulted in strong heat emission from the surface of the earth. The probability of occurrence of ice cover will depend on the length of time with the advection of cool air masses, and thus on the duration of the period during which a given type of atmospheric circulation occurs in winter.
The decomposition of the series of daily air temperatures in Piła (1987–2013) into additive components showed the dominant role of the periodic component (77% of variance), which constitutes the effect of the action of circulatory factors. Random fluctuations were of moderate strength (22.1% of variance), while the trend component may be practically omitted (1% of variance). An analysis of the distribution of daily air temperature in the whole multiannual period confirmed that this was close to normal, and was characterized by only a slight negative skewness (a small overrepresentation of lower temperatures) (Figure 11).
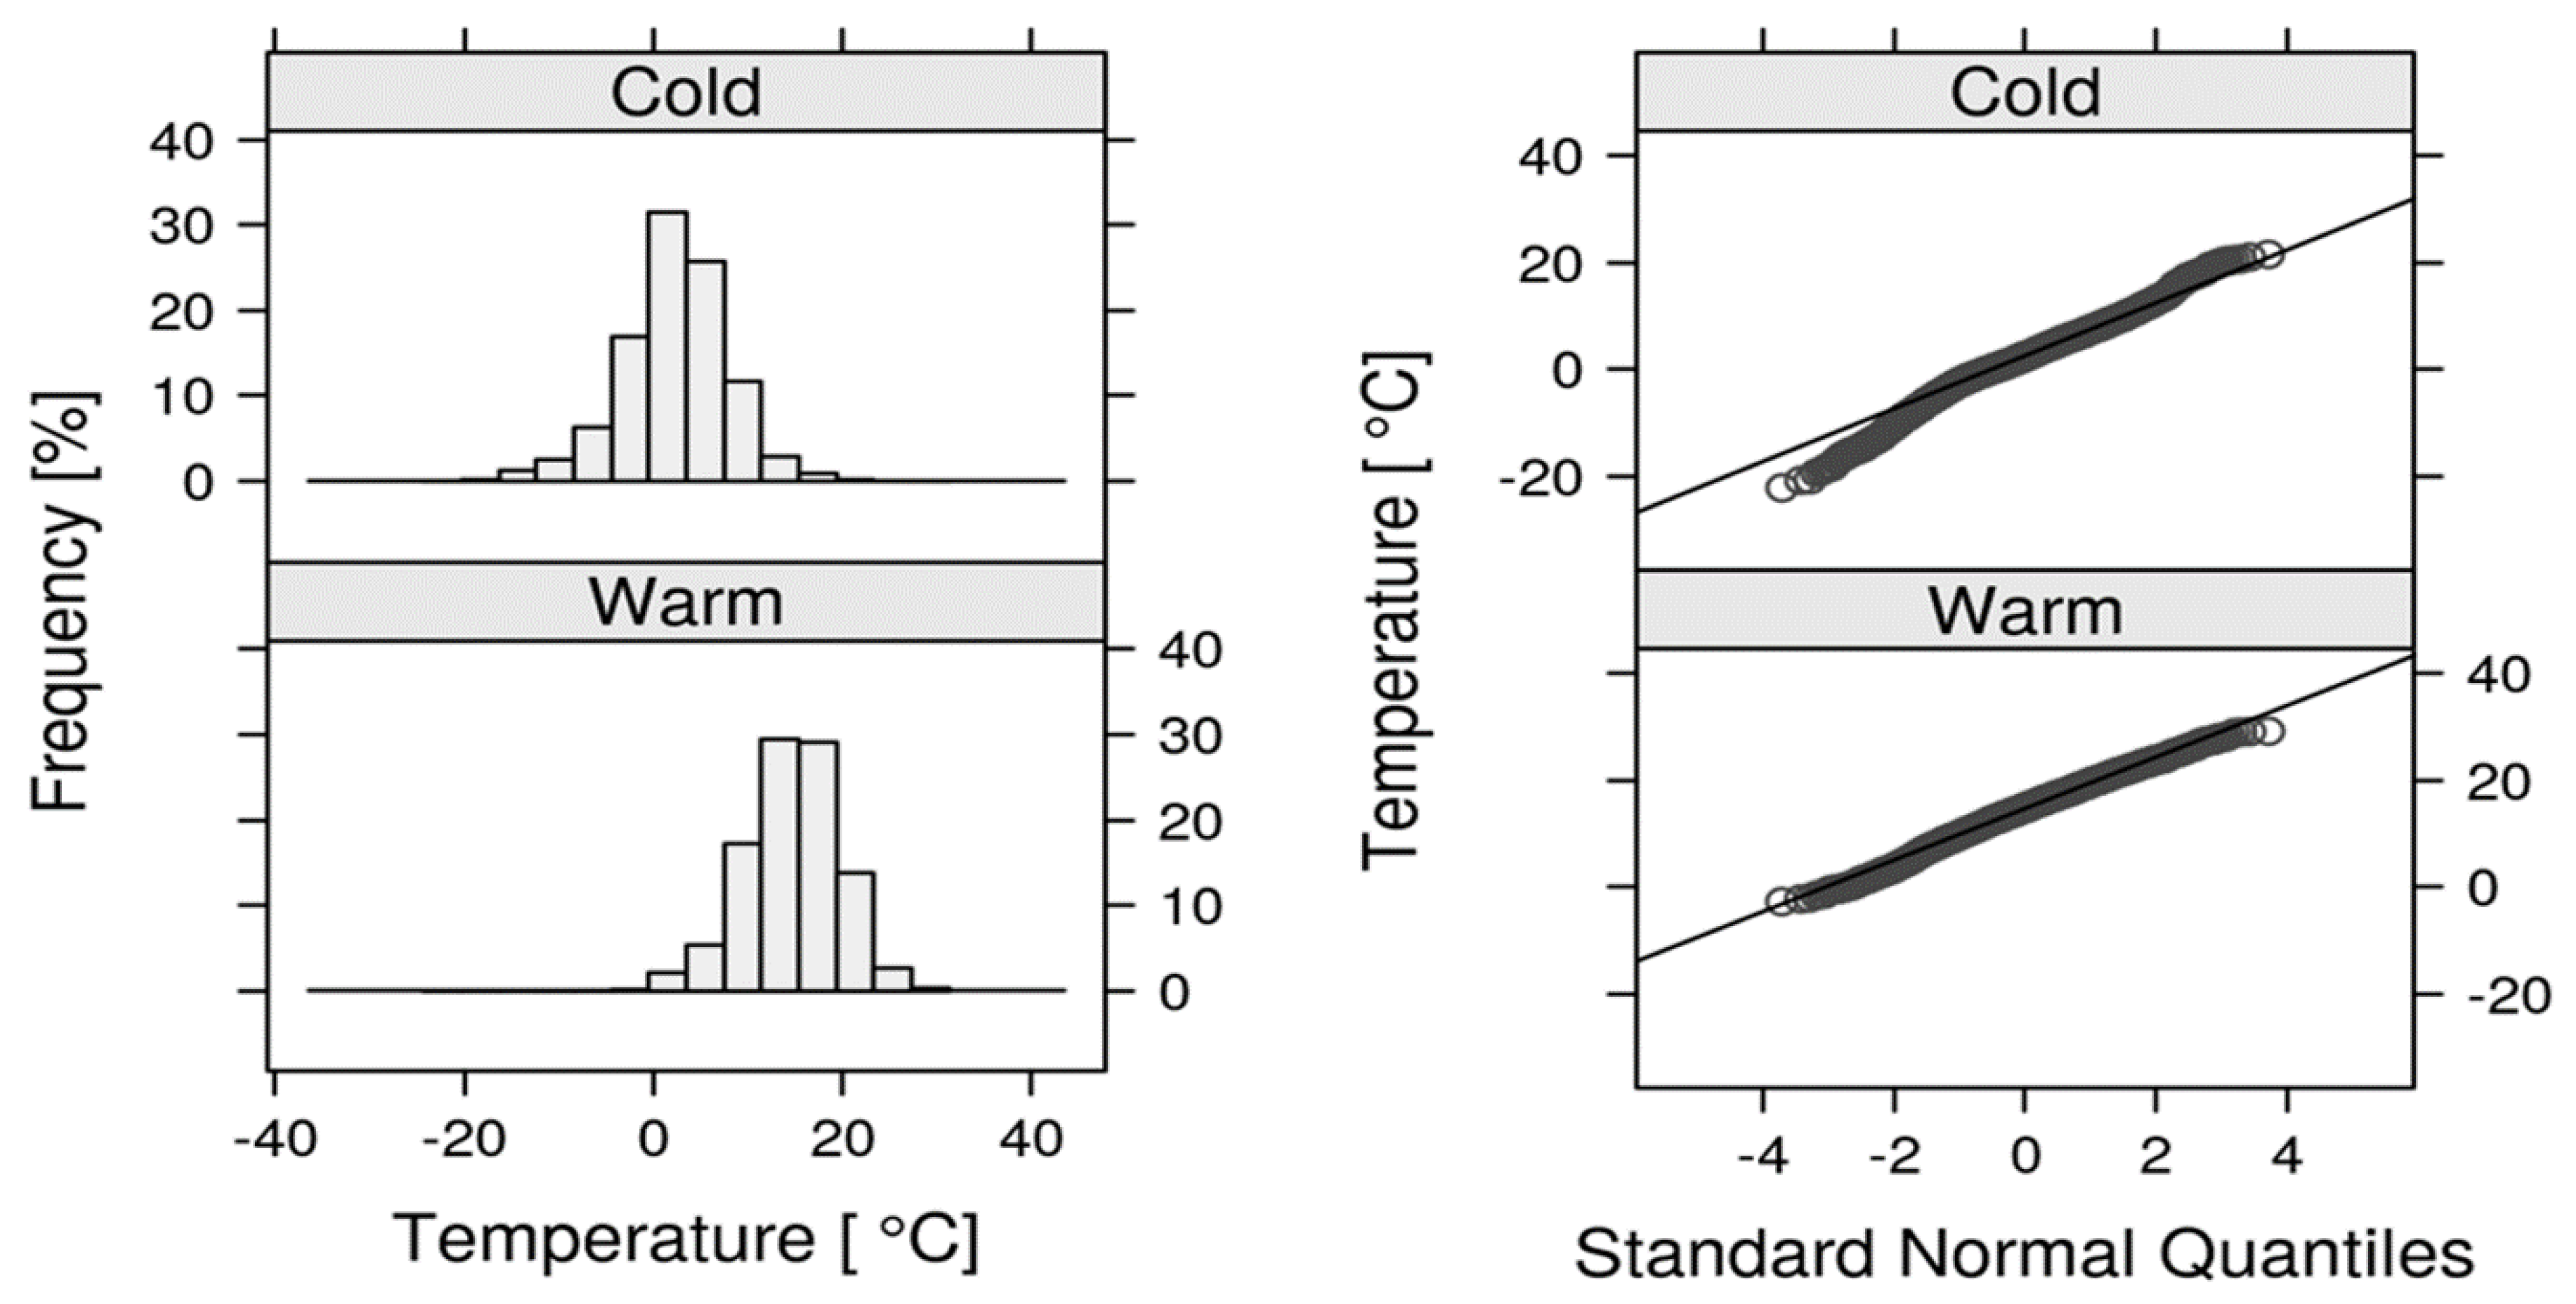
The analysis broken down into hydrological half-year periods showed that the distribution of air temperatures for the cool half-year period is also characterized by a slight negative skewness, whereas the distribution for the warm half-year period is approximately normal (Figure 12).
As regards monthly distributions of air temperature, the distributions for December, January and February were distinguished as slightly negatively skewed, whereas for the remaining months as approximately normal. An analysis of average monthly cumulative negative air temperatures (CDD) showed that this phenomenon was identified primarily in December and January. The extended duration of uninterrupted negative air temperature series generally translated itself into the intensity of their growth and an increase in CDD.
In Poland, the average times of appearance of ice phenomena on rivers, and also the times of their disappearance, vary considerably [47,63,64]. On the majority of rivers in western Poland, the commencement of ice phenomena is observed in the third decade of December and this is confirmed by observations of ice phenomena conducted on the River Noteć in the years 1987–2013. The ice cover appeared most frequently in December and January, and this was connected with the occurrence of high values of the CDD index (Figure 6). For December and January in the multiannual period, the average monthly cumulative negative air temperature degree-days at the station in Piła totaled −80 °C·d and 72 °C·d, respectively, which guaranteed the formation and persistence of ice cover on the River Noteć.
In certain years of the analyzed multiannual period there was observed the earlier appearance of negative air temperatures (Table 2), however their number in relation to phenomena typical of the winter half-year period was small. The atmospheric circulation systems appearing in October contributed in all probability to the creation of specific baric conditions that resulted in the occurrence of thermal anomalies. Thermal conditions registered in October did not, however, contribute to the appearance of ice phenomena on the river; these were initiated only under conditions of water over-cooling, which usually occur following a few or a dozen or so frosty days [64]. The first days with frost in the catchment area of the River Noteć occur only towards the end of November [50].
In the years 2003, 2006, 2010 and 2011, in which the intensity of low air temperatures in the winter season increased, various durations of river freezing were registered at individual water-level indication points. On the River Noteć in Pakość in the years 2006 and 2010 there were noted from 54 to 60 days with river icing, in 2003 ice phenomena occurred for just over a month, while in 2011 there were only a dozen or so days with river icing. In all these years the dependence between air and water temperature was high or very high. At the time, ice cover accounted for 40 to 80% of all ice phenomena. In 2011, despite conducive thermal conditions, there were not many days with river icing, while the ice cover accounted for only some 1/3 of all ice phenomena, which could have been the effect of the increase in the temperature of the waters of the River Noteć. The persisting increase in the temperature of river waters in the cooler seasons of the year is usually the effect of the inflow of warmer subterranean waters [65,66] or the influx of pollutants—also thermal—into the river [67]. The modifying influence of subterranean waters on the thermal regime of rivers has also been confirmed by [68,69,70]. Changes in river water temperature are in the main the consequence of changes in air temperature, and to a lesser degree of the instability of heat in the river bed [67,71]. M. Ćmielewski and M. Grześ [71] in their research into the time of formation and disappearance of ice cover on the rivers Vistula and Niemen have shown that the correlation of air temperature with data concerning the formation and disappearance of ice cover explains approximately 35–40% of the variability of these phenomena.
In the winter half-year period, when in Poland the average temperature values of flowing waters equal approximately 2.0 °C, the average temperature of the waters of the River Noteć for the multiannual period 1987–2013 equaled 4.4 °C in Pakość and Nowe Drezdenko, and was slightly higher than the temperature of water measured at Ujście and Krzyż Wielkopolski. Higher temperatures of river waters in the winter season (in excess of 2.0 °C) usually point to the presence of pollutants in the river [72,73,74]. Pollutants have been channeled to the River Noteć for many years, among others water from coal mines, which contains considerable quantities of suspended matter from the strip mine in Konin, and municipal wastewater from various towns and cities.
The thermal and ice regime of the River Noteć is also strongly modified due to the anthropogenic transformation of the bed and valley of the water-course. This may impact changes in average time and variations in measurement series of river water temperatures, which brings about their instability. In the case of lowland rivers such as the Noteć, these are most frequently regulatory activities and dams, which lead to changes in bed morphology and the artificial control of water flow. The transformed morphology of channeled sections of the river and canals is one of the more important causes of undesirable changes in the temperature of flowing water [68]. In rivers with transformed hydromorphological conditions, changes may concern the physical, chemical and biological elements of waters, which constitute a reference for designating their ecological state [75]. The conditions under which ice phenomena form on a river and under which it freezes up are further dependent on individual features of the water-course and environmental factors [16,17,20]. In order to determine the cause of the multidirectional dependences between CDD and the occurrence of ice cover on individual sections of the River Noteć, one should carefully study the impact of local factors influencing the thermal regime of its waters, and in consequence the duration of ice phenomena.
5. Conclusions
The formation of ice cover on rivers depends on thermal conditions, which in turn are to a considerable extent dependent on atmospheric circulation. The results of the conducted analysis have shown the significant impact of cumulative series of negative air temperatures (so-called cumulative degree-days CDD) on the formation and persistence of ice cover on the River Noteć. Increases in negative air temperatures were facilitated by the occurrence in the research area of periods of frost (lasting a few days), connected with 2 types of circulation which were determined by specific baric conditions that cause the advection of cool continental air masses from the eastern and north-eastern sector, in the broadest meaning of the term. The more rapid the increase in cumulative series of negative air temperatures, the greater the probability of an ice cover appearing and persisting on the River Noteć. The longer the duration (indicated in the research) of specific types of atmospheric circulation in winter, the greater the probability of occurrence of ice cover on the River Noteć and its tributaries. The probability of occurrence of ice cover is dependent on the length of time with the advection of cool air masses, and thus on the duration of the period during which a given type of atmospheric circulation occurs in winter.
It was determined that the ice cover on the river formed at specified CDD threshold values, which were different for the individual water-level indicator points, ranging from −16 °C·d (upper course) −92.6 °C·d (lower course); this testifies to the existence of differences in features of the river’s thermal and ice regime at its individual courses. On average, an increase in CDD by one degree was connected with an increase of the odds of ice cover appearing by approximately 1–6%, and this was confirmed by the results of the logistic regression model.
The conducted analysis of thermal conditions of the formation of ice cover on the River Noteć pointed to the considerable usefulness of the CDD index for predicting the times of its appearance on the river. Under different climatic and thermal conditions, the index of cumulative negative degree-days CDD may satisfactorily reflect the nature of the formation and persistence of ice phenomena on a river. The results obtained are of potential significance for indicating climate change. They are also important for maintaining the economic and ecological functions of the River Noteć, including the assessment of the risk of occurrence of extreme thermal and river icing conditions. In order to supplement information about local river icing determinants at individual sections of its course, it is recommended to identify zones of impact of anthropogenic factors, e.g., the discharge of pollutants into the river, which contribute to increases in the temperature of its waters in the winter season, thereby limiting the formation of ice phenomena, and in particular, ice cover.
Author Contributions
R.G. inspired and carried out the research as well as prepared the manuscript; conducted the analysis of the impact of air temperatures on the conditions of formation and persistence of ice cover on a river. A.M.T. conducted the analysis of circulatory factors and types of atmospheric circulation and complemented the description of the results.
Funding
This work was partly supported by the Polish National Science Centre under grant number UMO-2017/24/C/ST10/00109 and by statutory research at the Department of Hydrology and Water Management of the Faculty of Geographical and Geological Sciences of the Adam Mickiewicz University in Poznań.
Acknowledgments
The present paper is the result of research on thermal river water statistical methods, carried out as part of statutory research at the Department of Hydrology and Water Management of the Adam Mickiewicz University in Poznań, Poland. The authors would like to thank Szymon Talaga for his help in performing and discussion the statistical analyses.
Conflicts of Interest
The authors declare no conflict of interest.
References
- Ustrnul, Z.; Czekierda, D.; Wypych, A. Extreme values of air temperature in Poland according to different atmospheric circulation classifications. Phys. Chem. Earth 2010, 35, 429–436. [Google Scholar] [CrossRef]
- Porębska, M.; Zdunek, M. Analysis of extreme temperature events in Central Europe related to high pressure blocking situations in 2001–2011. Meteorol. Z. 2013, 22, 533–540. [Google Scholar] [CrossRef]
- Tomczyk, A.M.; Bednorz, E. Heat and cold waves on the southern coast of the Baltic Sea. Baltica 2014, 27, 45–54. [Google Scholar] [CrossRef]
- Magnuson, J.J.; Robertson, D.M.; Benson, B.J.; Wynne, R.H.; Livingstone, D.M.; Arai, T.; Assel, R.A.; Barry, R.G.; Card, V.; Kuusisto, E.; et al. Historical trends in lake and river ice cover in the Northern Hemisphere. Science 2000, 289, 1743–1746. [Google Scholar] [CrossRef] [PubMed]
- Borsch, S.; Ginzburg, B.; Soldatova, I. Modeling the development of ice phenomena in rivers as applied to the assessment of probable changes in ice conditions at various scenarious of the future climate. Water Resour. 2001, 28, 194–200. [Google Scholar] [CrossRef]
- Prowse, T.D.; Bonsal, B.; Duguay, C.R.; Hessen, D.O.; Vuglinsky, V.S. River and Lake Ice. In Global Outlook for Ice & Snow; DEW/0924/NA; United Nations Environment Programme: Nairobi, Kenya, 2007; pp. 201–214. [Google Scholar]
- Takács, K.; Nagy, B.; Kern, Z. Human impacts on river ice regime in the Carpathian Basin. In Proceedings of the EGU General Assembly 2014, Vienna, Austria, 27 April–2 May 2014. [Google Scholar]
- Langan, S.J.; Johnston, L.; Donaghy, M.J.; Youngson, A.F.; Hay, D.W.; Soulsby, C. Variation in river water temperatures in an upland stream over a 30-year period. Sci. Total Environ. 2001, 265, 195–207. [Google Scholar] [CrossRef]
- Caissie, D.; St-Hilaire, A.; El-Jabi, N. Prediction of water temperatures using regression and stochastic models. In Proceedings of the 57th Canadian Water Resources Association Annual Congress, Montreal, QC, Canada, 16–18 June 2004; Canadian Water Resources Association: Ottawa, ON, Canada, 2004. [Google Scholar]
- Wiejaczka, Ł. Relationship between water temperature in the river and air temperature (on the Ropa River as an example). Folia Geogr. Geogr. Phys. 2007, 37–38, 95–105. (In Polish) [Google Scholar]
- Łaszewski, M.; Jeleński, P. A comparison of thermal conditions of the Raba River and the Świder River. Sci. Rev. Eng. Environ. Sci. 2013, 22, 239–248. [Google Scholar]
- Gorączko, M.; Pawłowski, B. Changing of ice phenomena on Warta River in vicinity of Uniejów. Biul. Uniejowski 2014, 3, 23–33. (In Polish) [Google Scholar]
- Graf, R. Variations of the thermal conditions of the Warta in the profile connecting the Urstromal and gorge sections of the valley (Nowa Wieś Podgórna–Śrem–Poznań). In Novel Methods and Solutions in Hydrology and Water Management; Absalon, D., Matysik, M., Ruman, M., Eds.; Hydrological Committee PTG, PTG Department Katowice: Katowice, Poland, 2015; pp. 177–194. (In Polish) [Google Scholar]
- Beltaos, S.; Prowse, T. River-ice hydrology in a shrinking cryosphere. Hydrol. Process. 2009, 23, 122–144. [Google Scholar] [CrossRef]
- Intergovernmental Panel on Climate Change (IPCC). Climate Change 2014: Synthesis Report; Contribution of Working Groups I, II and III to the Fifth Assessment Report of the Intergovernmental Panel on Climate Change; Intergovernmental Panel on Climate Change (IPCC): Geneva, Switzerland, 2014; Available online: https://www.ipcc.ch/pdf/assessment-report/ar5/syr/AR5_SYR_FINAL_SPM.pdf (accessed on 12 February 2018).
- United Nations Environment Programme (UNEP). United Nations Environment Programme, Annual Report. 2008. Available online: http://www.unep.org/PDF/AnnualReport/2008 (accessed on 20 January 2018).
- Slaymaker, O.; Kelly, R.E.J. The Cryosphere and Global Environmental Change; Wiley-Blackwell: Oxford, UK, 2006. [Google Scholar]
- Myglan, V.; Vaganow, E. Ice phenomena of the Middle Siberia Rivers for the period of the last 300 years (according to historical data) as a reflection of the climate change. J. Sib. Fed. Univ. Humanit. Soc. Sci. 2008, 1, 361–372. [Google Scholar]
- Šarauskiené, D.; Jurgelénaité, A. Impact of climate change on river ice phenology in Lithuania. Environ. Res. Eng. Manag. 2008, 4, 13–22. [Google Scholar]
- Richard, M.; Morse, B.; Daly, S.F. Modelling frazil ice growth in the St. Lawrence River. Can. J. Civ. Eng. 2015, 42, 592–608. [Google Scholar] [CrossRef]
- European Economic Area (EEA). Report No. 12/2012, Climate Change, Impacts and Vulnerability in Europe 2012. 2012. Available online: http://www.eea.europa.eu/pl/themes (accessed on 20 January 2018).
- Agafonova, S.А.; Frolova, N.L. Features of ice regime of Northern Dvina rivers’ basin. Water Resour. J. 2007, 34, 123–131. [Google Scholar] [CrossRef]
- Klavins, M.; Briede, A.; Rodinovs, V. Ice regime of rivers in Latvia in relation to climatic variability and North Atlantic oscillation. In Climate Change in Latvia; Klavins, M., Ed.; University of Latvia: Riga, Latvia, 2007; pp. 58–72. [Google Scholar]
- Choiński, A.; Kolendowicz, L.; Pociask-Karteczka, J. Ice cover on Lake Morskie Oko response to the air temperature and air circulation patterns in 1971–2010. Nauka a Zarządzanie Obszarem Tatr i Ich Otoczeniem 2010, 1, 41–46. (In Polish) [Google Scholar]
- Kędziora, A.; Kępińska-Kasprzak, M.; Kowalczak, P.; Kundzewicz, Z.W.; Miler, A.T.; Pierzgalski, E.; Tokarczyk, T. Water shortage-related threats. Gospod. Wodna 2014, 10, 373–376. (In Polish) [Google Scholar]
- Styszyńska, A.; Marsz, A. Mechanisms of atmospheric climate change—The problem of modern warming. In Energy of the Future, Energy Saving Installations and Systems; Kwiatkowski, Z.R., Ed.; INFOTECH: Gdańsk, Poland, 2015; p. 17. (In Polish) [Google Scholar]
- Boryczka, J.; Stopa-Boryczka, M. Cyclic temperature and precipitation fluctuations in Poland in 19th–2st century. Acta Agrophys. 2004, 3, 21–33. (In Polish) [Google Scholar]
- Kożuchowski, K.; Żmudzka, E. Warming in Poland: Scale and seasonal distribution in changes of air temperature in the second half of 20th century. Przegląd Geofizyczny 2001, 46, 81–90. (In Polish) [Google Scholar]
- Michalska, B. Tendencies of air temperature changes in Poland. Prace i Studia Geograficzne 2011, 47, 67–75. (In Polish) [Google Scholar]
- Kundzewicz, Z.W. Climate changes, their reasons and effects—Observations and projections. Landf. Anal. 2011, 15, 39–49. [Google Scholar]
- Przybylak, R. Changes in Poland’s climate over the last millenium. Czas. Geogr. 2011, 82, 23–48. (In Polish) [Google Scholar]
- Yoo, J.; D’Odorico, P. Trends and fluctuations in the dates of ice break-up of lakes and rivers in Northern Europe: The effect of the North Atlantic. J. Hydrol. 2002, 268, 100–112. [Google Scholar] [CrossRef]
- Ćmielewski, M. The freezing variability of the northern hemisphere rivers in the XX century. In Abstracts of Lectures; II Workshops: Ice problems of the rivers “Congestion and high water jam”; Nicolaus Copernicus University: Toruń, Poland, 2010; pp. 16–17. (In Polish) [Google Scholar]
- Jania, J. Consequences of global warming for the cryosphere. Nauka 2008, 3, 35–58. (In Polish) [Google Scholar]
- Prowse, T.D.; Alfredsen, K.; Beltaos, S.; Bonsal, B.R.; Bowden, W.B.; Duguay, C.R.; Korhola, A.; McNamara, J.; Vincent, W.F.; Vuglinsky, V.; et al. Effects of changes in arctic lake and river ice. Ambio 2011, 40, 63–74. [Google Scholar] [CrossRef]
- Hattermann, F.F.; Kundzewicz, Z.W.; Huang, S.; Vetter, T.; Gerstengarbe, F.-W.; Werner, P.C. Climatological drivers of changes in flood hazard in Germany. Acta Geophys. 2013, 61, 463–477. [Google Scholar] [CrossRef]
- Chu, T.; Das, A.; Lindenschmidt, K.E. Monitoring the variation in ice-cover characteristics of the Slave River, Canada using RADARSAT-2 data. Remote Sens. 2015, 7, 13664–13691. [Google Scholar] [CrossRef]
- Kuusisto, E.; Elo, A.R. Lake and river ice variables as climate indicators in Northern Europe. Int. Ver. Theor. Angew. Limnol. Verh. 1998, 27, 2761–2764. [Google Scholar] [CrossRef]
- Cheng, B.; Vihma, T.; Launiainen, J. Modelling of the superimposed ice formation and sub-surface melting in the Baltic Sea. Geophysica 2003, 39, 31–50. [Google Scholar]
- Frauenfeld, O.W.; Zhang, T.; McCreight, J.L. Northern hemisphere freezing/thawing index variations over the twentieth century. Int. J. Climatol. 2007, 27, 47–63. [Google Scholar] [CrossRef]
- Ruosteenoja, K. The date of break-up of lake ice as a climatic index. Geophysica 1986, 22, 89–99. [Google Scholar]
- Livingstone, D.M. Break-up dates of alpine lakes as proxy data for local and regional mean surface air temperatures. Clim. Chang. 1997, 37, 407–439. [Google Scholar] [CrossRef]
- Dibike, Y.; Prowse, T.; Saloranta, T.; Ahmed, R. Response of Northern hemisphere lake-ice cover and lake-water thermal structure patterns to a changing climate. Hydrol. Process. 2011, 25, 2942–2953. [Google Scholar] [CrossRef]
- Lindenschmidt, K.E.; Sydor, M.; Carson, R.W.; Harrison, R. Ice jam modelling of the Lower Red River. J. Water Resour. 2012, 4, 16739. [Google Scholar] [CrossRef]
- Das, A.; Sagin, J.; Van der Sanden, J.; Evans, E.; McKay, K.; Lindenschmidt, K.E. Monitoring the freeze-up and ice cover progression of the Slave River. Can. J. Civ. Eng. 2015, 42, 609–621. [Google Scholar] [CrossRef]
- Zhang, F.; Mosaffa, M.; Chu, T.; Lindenschmidt, K.E. Using Remote Sensing Data to Parameterize Ice Jam Modeling for a Northern Inland Delta. Water 2017, 9, 306. [Google Scholar] [CrossRef]
- Mroziński, Ł. Perennial variability of the Lower Vistula freezing. Gaz. Obs. IMGW 2006, 2, 28–31. (In Polish) [Google Scholar]
- Majewski, W.; Mroziński, Ł. Ice phenomena on the Lower Vistula. Gospod. Wodna 2010, 1, 18–22. (In Polish) [Google Scholar]
- Kondracki, J. Regional Geography of Poland; Scientific Publishing House PWN: Warsaw, Poland, 2008. (In Polish) [Google Scholar]
- Woś, A. The Climate of Poland in the Second Half of the 20th Century; Scientific Publishing House UAM: Poznan, Poland, 2010. (In Polish) [Google Scholar]
- Borowicz, J. An Analysis of River Ice Formation in the Noteć and Its Right-Bank Tributaries in the Years 1982–2011. Master’s Thesis, Adam Mickiewicz University, Poznan, Poland, 2016. (In Polish). [Google Scholar]
- ETC/ICM. European Freshwater Ecosystem Assessment: Cross Walk between the Water Framework Directive and Habitats Directive Types, Status and Pressures, Technical Report 2/2015, Magdeburg: European Topic Centre on Inland, Coastal and Marine Waters. 2015. Available online: http://icm.eionet.europa.eu (accessed on 20 January 2018).
- Ward, J.H. Hierarchical grouping to optimize an objective function. J. Am. Stat. Assoc. 1963, 58, 236–244. [Google Scholar] [CrossRef]
- Esteban, P.; Jones, P.D.; Martin-Vide, J.; Mases, M. Atmospheric circulation patterns related to heavy snowfall days in Andorra, Pyrenees. Int. J. Climatol. 2005, 25, 319–329. [Google Scholar] [CrossRef]
- Faraway, J.J. Extending the Linear Model with R: Generalized Linear, Mixed Effects and Nonparametric Regression Models, Texts in Statistical Science; Chapman & Hall/CRC: London, UK, 2006; Available online: http://www.taylorandfrancis.com (accessed on 12 February 2018).
- R Core Team. R: A Language and Environment for Statistical Computing; R Foundation for Statistical Computing: Vienna, Austria, 2015; Available online: http://www.R-project.org (accessed on 12 February 2018).
- Biecek, P. A Guide to the R Package; GIS Publishing House: Wrocław, Poland, 2008; Available online: http://www.gis.wroc.pl (accessed on 20 January 2018). (In Polish)
- Marsz, A.A. Thermal Status of the North Atlantic and Thermal Regime of Winters on the Polish Coast of the Baltic Sea; WSM: Gdynia, Poland, 2001. (In Polish) [Google Scholar]
- Thompson, D.W.J.; Wallace, J.M. Annular modes in the extratropical circulation. Part I: Month-to-month variability. J. Clim. 2000, 13, 1000–1016. [Google Scholar] [CrossRef]
- Degirmendžić, J.; Kożuchowski, K.; Żmudzka, E. Circulation requirements of the air temperature variations in Poland in the period 1951–2000. Prz. Geof. 2002, 47, 293–298. (In Polish) [Google Scholar]
- Kryjov, V.N. Searching for circulation patterns affecting North Europe annual temperature. Atmos. Sci. Lett. 2004, 5, 23–34. [Google Scholar] [CrossRef]
- Marsz, A.A. On the Oceanic Conditions of the Circular and Thermal Nature of Winter in Poland and Central Europe; Publishing House of the Maritime Academy: Gdynia, Poland, 2005. (In Polish) [Google Scholar]
- Bączyk, A.; Suchożebrski, J. Variability of ice phenomena on the Bug River (1903–2012). Inżynieria Ekologiczna 2016, 49, 136–142. (In Polish) [Google Scholar] [CrossRef]
- Pawłowski, B.; Gorączko, M.; Szczerbińska, A. Ice phenomena on the rivers of Poland. In Hydrology of the Poland; Jokiel, P., Marszelewski, W., Pociask-Karteczka, J., Eds.; Scientific Publishing House PWN: Warsaw, Poland, 2017; pp. 195–200. (In Polish) [Google Scholar]
- Cowx, I. Innovations in Fish Passage Technology. Fish. Manag. Ecol. 2000, 7, 471–472. [Google Scholar] [CrossRef]
- Westhoff, J.T.; Paukert, C.P. Climate change simulations predict altered biotic response in a thermally heterogeneous stream system. PLoS ONE 2014, 9, e111438. [Google Scholar] [CrossRef] [PubMed]
- Caissie, D. The thermal regime of rivers: A review. Freshw. Biol. 2006, 51, 1389–1406. [Google Scholar] [CrossRef]
- Poole, C.; Berman, C.H. An Ecological Perspective on In-Stream Temperature: Natural Heat Dynamics and Mechanisms of Human-Caused Thermal Degradation. Environ. Manag. 2001, 27, 787–802. [Google Scholar] [CrossRef]
- Kanno, Y.; Vokoun, J.C.; Letcher, B.H. Paired stream–air temperature measurements reveal fine-scale thermal heterogeneity within headwater brook trout stream networks. River Res. Appl. 2014, 30, 745–755. [Google Scholar] [CrossRef]
- Snyder, C.; Hitt, N.; Young, J. Accounting for groundwater in stream fish thermal habitat responses to climate change. Ecol. Appl. 2015, 25, 1397–1419. [Google Scholar] [CrossRef] [PubMed]
- Ćmielewski, M.; Grześ, M. Perennial variability of the Vistula freezing process in Toruń and Niemen in Smolniki in the 19th and 20th centuries. Gospod. Wodna 2010, 3, 112–115. (In Polish) [Google Scholar]
- Johnson, S.L.; Jones, J.A. Stream temperature response to forest harvest and debris flows in western Cascades, Oregon. Can. J. Fish. Aquat. Sci. 2000, 57, 30–39. [Google Scholar] [CrossRef]
- Lowney, C.L. Stream temperature variation in regulated rivers: Evidence for a spatial pattern in daily minimum and maximum magnitudes. Water Resour. Res. 2000, 36, 2947–2955. [Google Scholar] [CrossRef]
- Younus, M.; Hondzo, M.; Engel, B.A. Stream temperature dynamics in upland agricultural watersheds. J. Environ. Eng. 2000, 126, 518–526. [Google Scholar] [CrossRef]
- Water Framework Directive (WFD). Directive 2000/60/EC of the European Parliament and of the Council Establishing a Framework for the Community Action in the Field of Water Policy. 2000. Available online: http://ec.europa.eu/environment/water/water-framework (accessed on 20 January 2018).
Figure 1.
Location of the studied area and the distribution of observation stations of the Institute of Meteorology and Water Management—National Research Institute (IMGW-PIB Warsaw, Poland) in the catchment area: 1—drainage divide of the catchment area, 2—rivers, 3—lakes, 4—observations points of the IMGW-PIB on the River Noteć, 5—meteorological station of the IMGW-PIB, 6—built-up areas, 7—land utilized for agricultural purposes, 8—forest complexes.

Figure 2.
Frequency of occurrence of cumulative negative air temperature series (a) and series with a duration in excess of 15 days (b) at the station in Piła in the years 1987–2013.
Figure 2.
Frequency of occurrence of cumulative negative air temperature series (a) and series with a duration in excess of 15 days (b) at the station in Piła in the years 1987–2013.

Figure 3.
Annual cumulative negative degree-days (CDD) at the station in Piła (1987–2013).

Figure 4.
Daily increases and decreases in air temperature in the winter season (in relation to previous day) in years with the highest CDD values at the station in Piła during the period 1987–2013.
Figure 4.
Daily increases and decreases in air temperature in the winter season (in relation to previous day) in years with the highest CDD values at the station in Piła during the period 1987–2013.


Figure 5.
Daily increases and decreases in air temperature in the winter season (in relation to previous day) in years with the lowest CDD values at the station in Piła during the period 1987–2013.
Figure 5.
Daily increases and decreases in air temperature in the winter season (in relation to previous day) in years with the lowest CDD values at the station in Piła during the period 1987–2013.
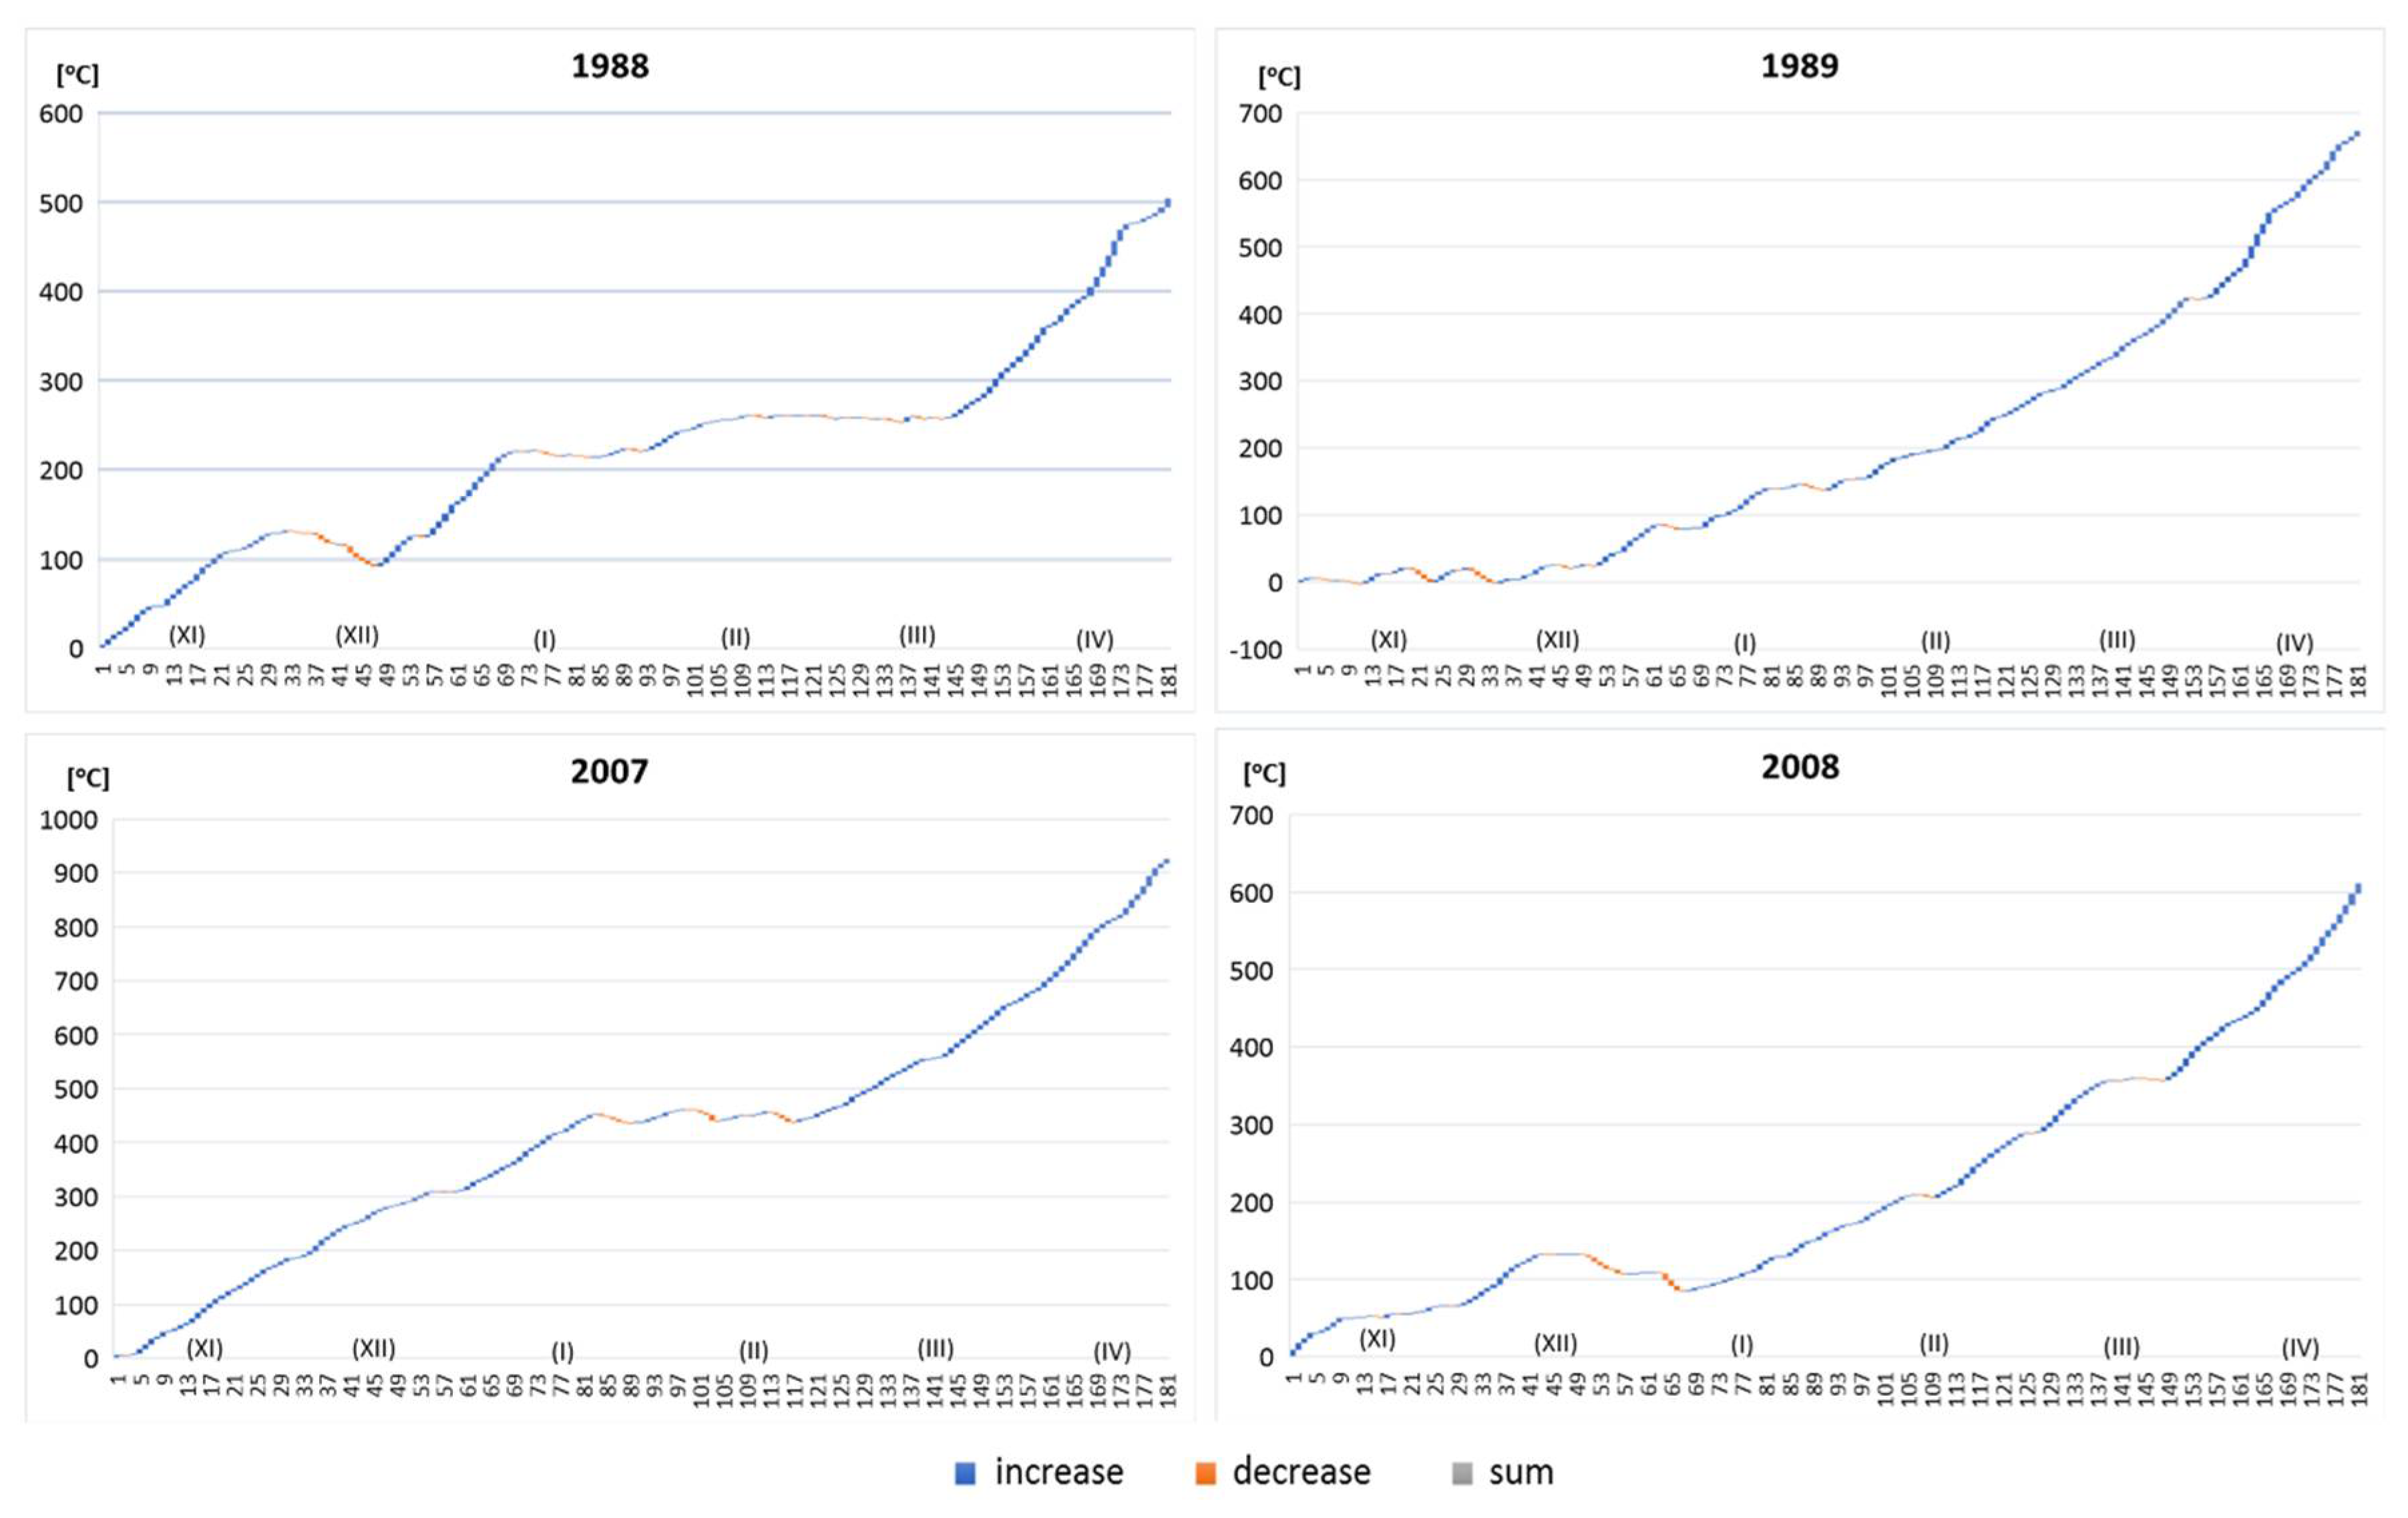
Figure 6.
Average monthly (a) and monthly sums (b) cumulative negative degree-days (CDD) in the hydrological winter season during the period 1987–2013 at the station in Piła.
Figure 6.
Average monthly (a) and monthly sums (b) cumulative negative degree-days (CDD) in the hydrological winter season during the period 1987–2013 at the station in Piła.

Figure 7.
Average atmospheric pressure at sea level (SLP) and z500 hPa (left column) and SLP anomalies, z500 hPa (middle column) and T850 (right column) during all negative degree-days (a), and in circulation type 1 (b) and 2 (c).
Figure 7.
Average atmospheric pressure at sea level (SLP) and z500 hPa (left column) and SLP anomalies, z500 hPa (middle column) and T850 (right column) during all negative degree-days (a), and in circulation type 1 (b) and 2 (c).

Figure 8.
Average SLP and z500 hPa (a) and SLP, z500 hPa (b) and T850 (c) anomalies during negative degree-days in October.
Figure 8.
Average SLP and z500 hPa (a) and SLP, z500 hPa (b) and T850 (c) anomalies during negative degree-days in October.

Figure 9.
Number of days with ice cover on the River Noteć at water-level indication points of the IMGW-PIB located along its course in the years 1987–2013.
Figure 9.
Number of days with ice cover on the River Noteć at water-level indication points of the IMGW-PIB located along its course in the years 1987–2013.

Figure 10.
Probability of occurrence of ice cover on the River Noteć during the period 1987–2013 as cumulative negative air temperature degree-days (CDD) increase.
Figure 10.
Probability of occurrence of ice cover on the River Noteć during the period 1987–2013 as cumulative negative air temperature degree-days (CDD) increase.
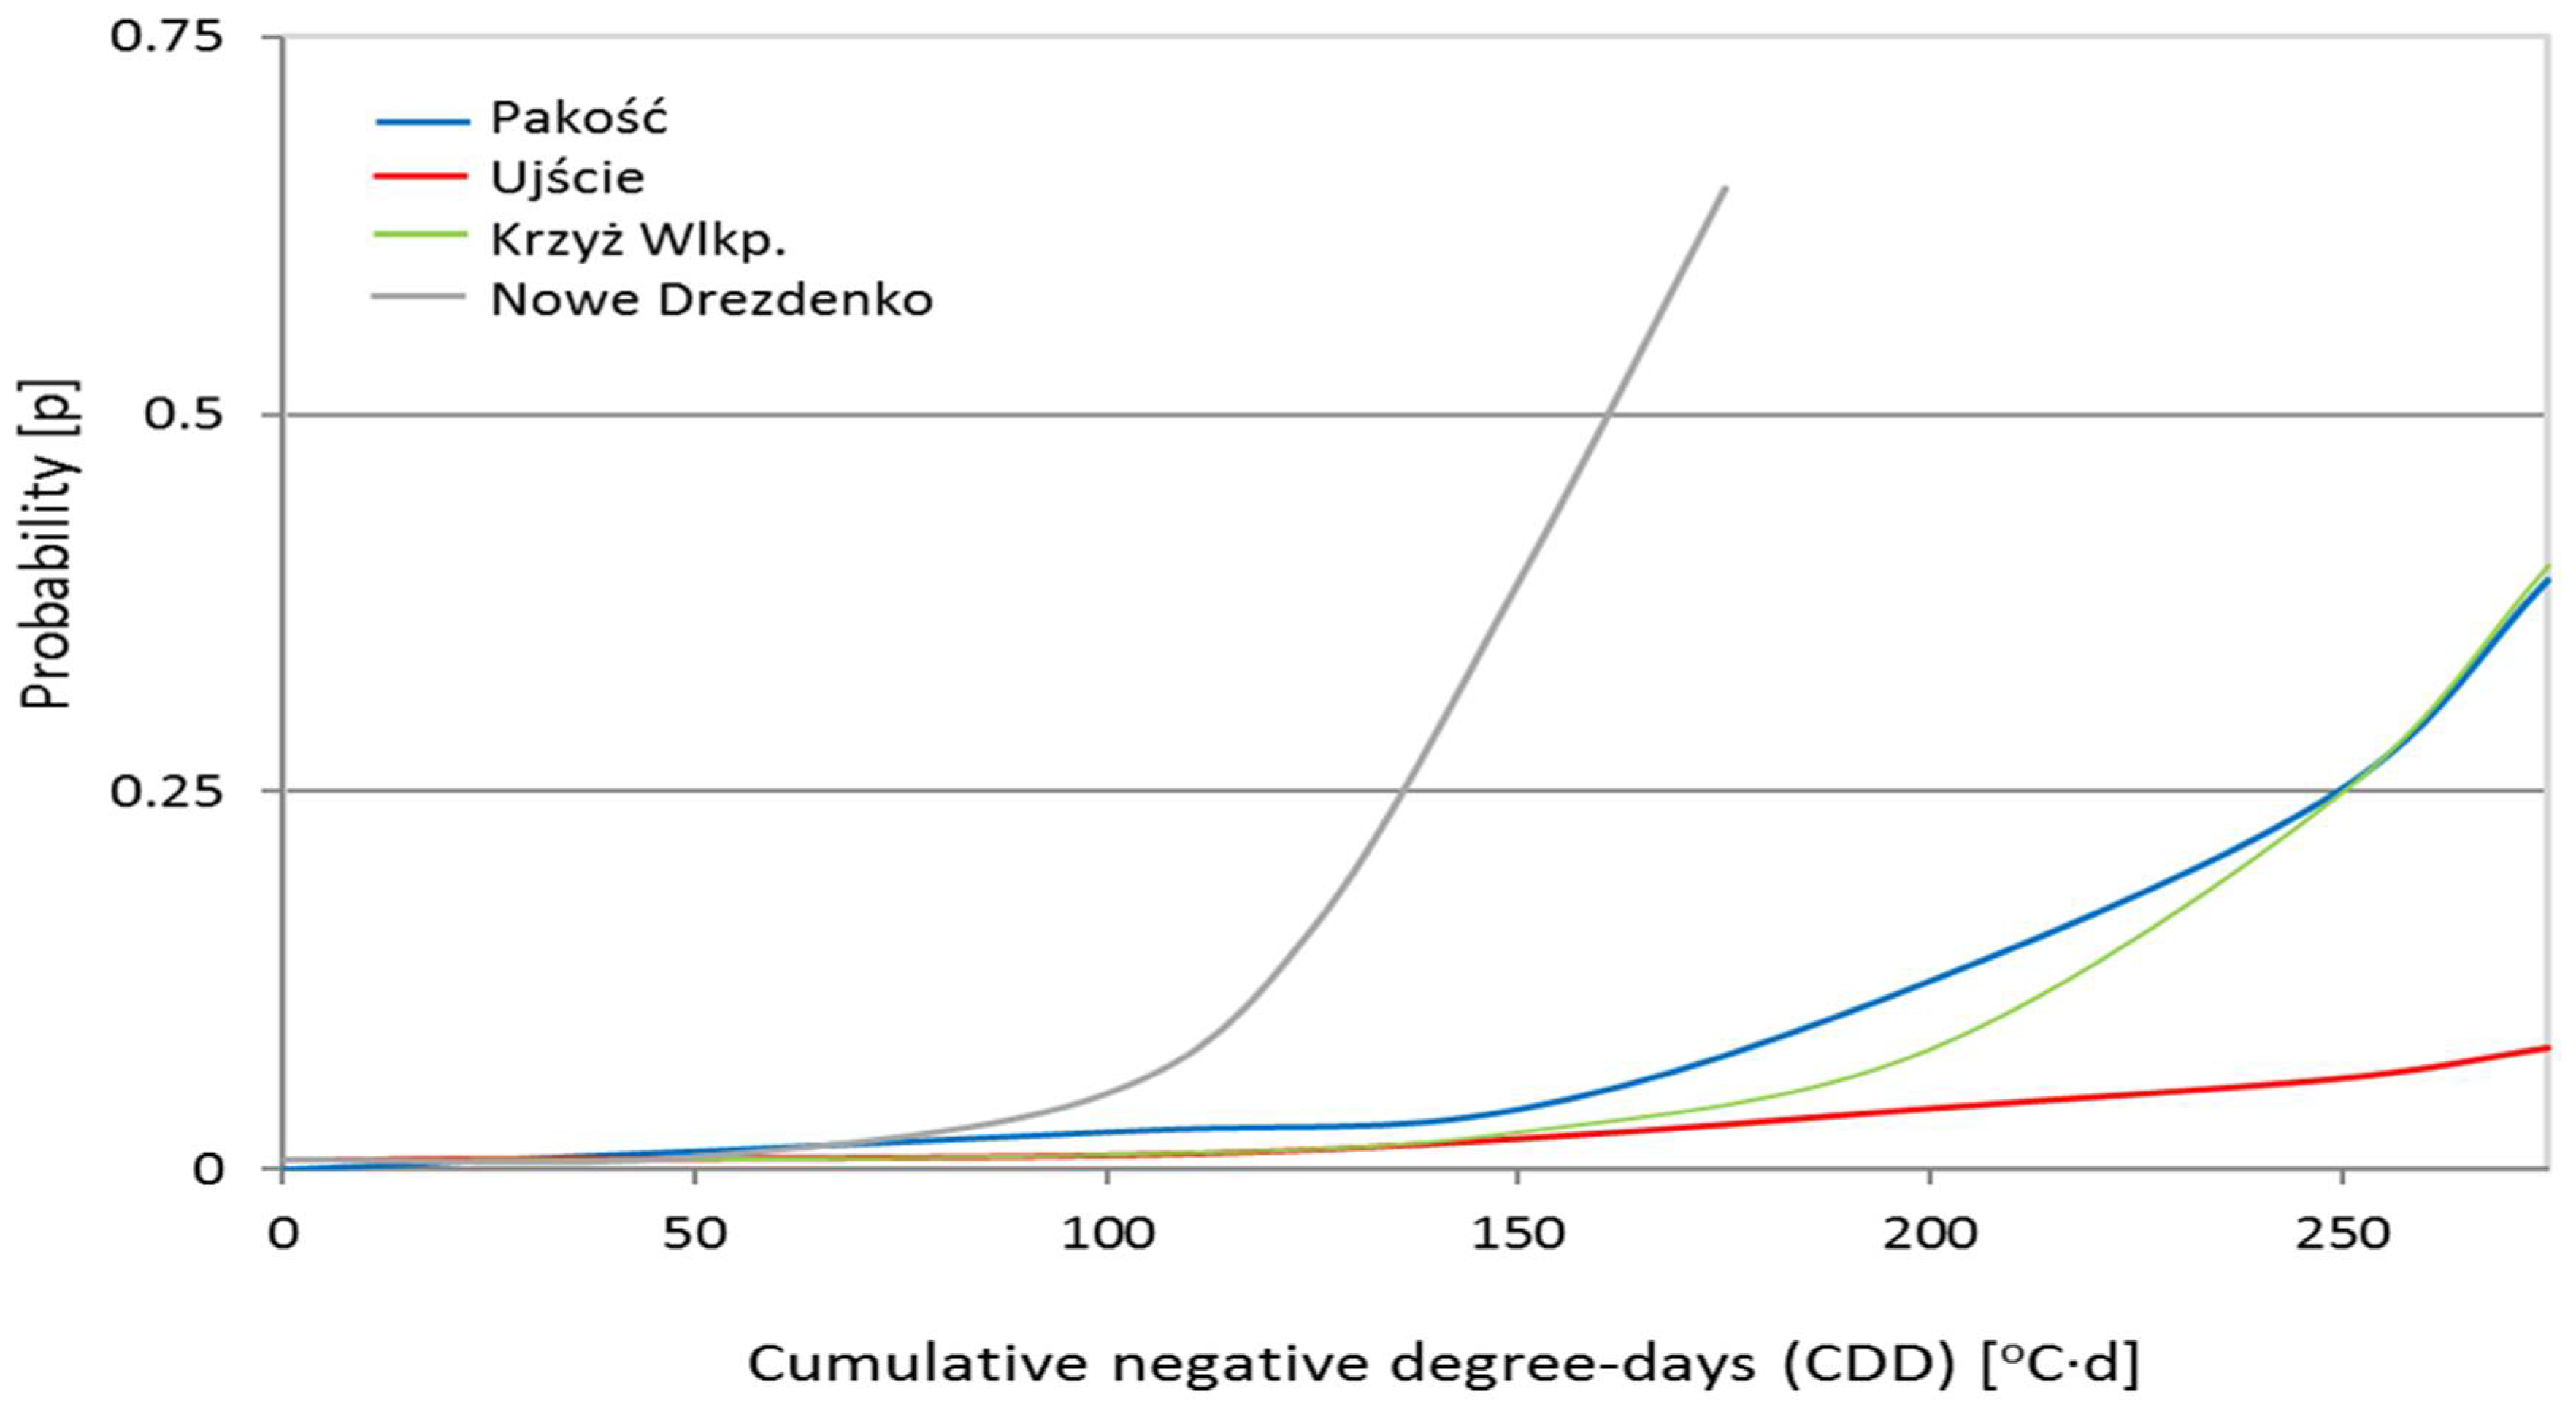
Figure 11.
Distribution of daily air temperatures at the station in Piła in the period 1987–2013.

Figure 12.
Distribution of daily air temperatures broken down into hydrological half-year periods at the station in Piła in the period 1987–2013.
Figure 12.
Distribution of daily air temperatures broken down into hydrological half-year periods at the station in Piła in the period 1987–2013.

Table 1.
Parameters of the logistic regression model (River Noteć, period 1987–2013).
| Station | Coefficients | b* | LL | UL | p |
|---|---|---|---|---|---|
| Pakość | Intercept | −6.367 | −6.878 | −5.928 | 5.5 × 10−154 |
| CDD—explanatory variable | 0.0207 | 0.0140 | 0.0266 | 2.13 × 10⁻¹¹ | |
| Ujście | Intercept | −7.328 | −8.196 | −6.649 | 3.93 × 10−79 |
| CDD—explanatory variable | 0.0167 | 0.0082 | 0.0232 | 3.92 × 10⁻⁶ | |
| Krzyż | Intercept | −7.862 | −8.984 | −7.030 | 2.31 × 10−58 |
| CDD—explanatory variable | 0.0267 | 0.0203 | 0.0332 | 6.71 × 10⁻¹⁷ | |
| Nowe Drezdenko | Intercept CDD—explanatory variable | −8.436 0.0545 | −9.892 0.0438 | −7.406 0.0676 | 2.21 × 10−42 3.58 × 10⁻²⁰ |
b*—regression coefficient, LL—lower limit of the 95% confidence interval for the regression coefficient, UL—upper limit of the 95% confidence interval for the regression coefficient, p—level of significance of the regression coefficient, CDD: cumulative degree-days.
Table 2.
Characteristic of cumulative negative degree-days (CDD) registered in the warm half-year hydrological period (month of October) at the station in Piła in the years 1987–2013.
Table 2.
Characteristic of cumulative negative degree-days (CDD) registered in the warm half-year hydrological period (month of October) at the station in Piła in the years 1987–2013.
| Year | Total Sum of CDD | Total Duration | Mean Degree of Increase in CDD | Maximum CDD | Maximum Duration | Maximum Degree |
|---|---|---|---|---|---|---|
| 1988 | 5.1 | 4 | 1.275 | 3.7 | 2 | 1.85 |
| 1991 | 0.4 | 1 | 0.400 | 0.4 | 1 | 0.40 |
| 1992 | 0.3 | 1 | 0.300 | 0.3 | 1 | 0.30 |
| 1997 | 1.3 | 3 | 0.425 | 0.9 | 2 | 0.45 |
| 2003 | 6.5 | 4 | 1.550 | 5.1 | 3 | 1.70 |
| 2009 | 0.1 | 1 | 0.100 | 0.1 | 1 | 0.10 |
| 2012 | 0.5 | 1 | 0.500 | 0.5 | 1 | 0.50 |
Table 3.
Distribution of cumulative negative degree-days (CDD) on days when an ice cover appeared on the River Noteć (1987–2013).
Table 3.
Distribution of cumulative negative degree-days (CDD) on days when an ice cover appeared on the River Noteć (1987–2013).
| Statistics | Pakość | Ujście | Krzyż Wlkp. | Nowe Drezdenko |
|---|---|---|---|---|
| Min | 0.0 | 0.0 | 0.0 | −42.9 |
| Q1 * | −16.6 | −21.5 | −92.6 | −73.5 |
| Median | −37.6 | −27.4 | −129.0 | −96.0 |
| Mean | −37.8 | −56.0 | −122.0 | −99.5 |
| Q3 | −48.1 | −37.8 | −153.0 | −129.0 |
| Max | −135.0 | −198.0 | −246.0 | −166.0 |
* Q1, Q3—first and third quartile.
Table 4.
Dates of the beginning and end of the final series of days with ice cover on the River Noteć in a given year (1987–2013).
Table 4.
Dates of the beginning and end of the final series of days with ice cover on the River Noteć in a given year (1987–2013).
| Pakość | Ujście | Krzyż Wlkp. | Nowe Drezdenko | ||||
|---|---|---|---|---|---|---|---|
| First | Last | First | Last | First | Last | First | Last |
| 1987-01-10 | 1987-01-22 | 1987-01-17 | 1987-02-15 | 1987-01-12 | 1987-03-15 | 1987-01-11 | 1987-03-16 |
| 1991-02-05 | 1991-02-11 | 1989-12-03 | 1989-12-04 | 1996-02-13 | 1996-02-29 | 1993-01-04 | 1993-01-08 |
| 1993-12-26 | 1993-01-08 | 1990-01-05 | 1990-01-08 | 1997-11-30 | 1997-12-31 | 1996-01-03 | 1996-03-08 |
| 1996-02-01 | 1996-02-15 | 1994-02-15 | 1994-02-18 | 2003-01-08 | 2003-01-16 | 1997-12-31 | 1997-02-09 |
| 1997-12-24 | 1997-01-20 | 1998-12-18 | 1998-12-22 | 2006-01-24 | 2006-02-11 | 2003-01-08 | 2003-01-16 |
| 1998-12-18 | 1998-12-26 | 2002-12-23 | 2002-01-20 | 2010-01-24 | 2010-02-13 | 2006-01-24 | 2006-02-11 |
| 2000-01-23 | 2000-01-25 | 2006-01-01 | 2006-02-02 | 2011-03-01 | 2011-03-05 | 2010-01-24 | 2010-02-17 |
| 2003-12-10 | 2003-01-12 | 2008-01-05 | 2008-01-10 | 2012-02-08 | 2012-02-21 | 2011-12-04 | 2011-03-06 |
| 2004-12-26 | 2004-02-25 | 2012-02-08 | 2012-02-20 | ||||
| 2006-01-08 | 2006-01-31 | ||||||
| 2008-01-05 | 2008-01-07 | ||||||
| 2009-01-01 | 2009-01-18 | ||||||
| 2010-12-21 | 2010-02-13 | ||||||
| 2011-12-18 | 2011-12-22 | ||||||
| 2012-01-28 | 2012-02-22 | ||||||
Table 5.
Distribution of the duration of series of days with ice cover on the River Noteć (1987–2013).
Table 5.
Distribution of the duration of series of days with ice cover on the River Noteć (1987–2013).
| Statistics | Pakość | Ujście | Krzyż Wlkp. | Nowe Drezdenko |
|---|---|---|---|---|
| Min | 1 | 1 | 5 | 5 |
| Q1 * | 5 | 4 | 10 | 10 |
| Median | 11 | 5 | 17 | 15 |
| Mean | 12 | 10 | 17 | 20 |
| Q3 | 16 | 9 | 21 | 25 |
| Max | 31 | 30 | 33 | 44 |
* Q1, Q3—first and third quartile.
© 2018 by the authors. Licensee MDPI, Basel, Switzerland. This article is an open access article distributed under the terms and conditions of the Creative Commons Attribution (CC BY) license (http://creativecommons.org/licenses/by/4.0/).
Share and Cite
MDPI and ACS Style
Graf, R.; Tomczyk, A.M. The Impact of Cumulative Negative Air Temperature Degree-Days on the Appearance of Ice Cover on a River in Relation to Atmospheric Circulation. Atmosphere 2018, 9, 204. https://doi.org/10.3390/atmos9060204
AMA Style
Graf R, Tomczyk AM. The Impact of Cumulative Negative Air Temperature Degree-Days on the Appearance of Ice Cover on a River in Relation to Atmospheric Circulation. Atmosphere. 2018; 9(6):204. https://doi.org/10.3390/atmos9060204
Chicago/Turabian StyleGraf, Renata, and Arkadiusz Marek Tomczyk. 2018. "The Impact of Cumulative Negative Air Temperature Degree-Days on the Appearance of Ice Cover on a River in Relation to Atmospheric Circulation" Atmosphere 9, no. 6: 204. https://doi.org/10.3390/atmos9060204
Note that from the first issue of 2016, this journal uses article numbers instead of page numbers. See further details here.