Article

Multi-Year Continuous PM2.5 Measurements with the Federal Equivalent Method SHARP 5030 and Comparisons to Filter-Based and TEOM Measurements in Ontario, Canada

1
Environmental Monitoring and Reporting Branch, Ontario Ministry of the Environment and Climate Change, 125 Resources Road, Toronto, ON M9P 3V6, Canada
2
Air Quality Research Division, Environment and Climate Change Canada, 335 River Road, Ottawa, ON K1A 0H3, Canada
*
Author to whom correspondence should be addressed.
Atmosphere 2018, 9(5), 191; https://doi.org/10.3390/atmos9050191
Submission received: 14 March 2018 / Revised: 13 May 2018 / Accepted: 15 May 2018 / Published: 17 May 2018
(This article belongs to the Special Issue Urban Particulate Matters: Composition, Sources, and Exposure)

Abstract

:
Continuous monitoring of fine particulate matter (PM2.5) is important to provide near-real-time air quality information for public health protection, especially when ambient levels are elevated. The Tapered Element Oscillating Microbalance (TEOM), operated at 30 °C with a sample equilibration system (SES), was used to measure PM2.5 hourly concentrations from 2002 to 2012 in Ontario, Canada. In January 2013, the Federal Equivalent Method (FEM) Synchronized Hybrid Ambient Real-time Particulate (SHARP) model 5030 monitors replaced the TEOM devices at all monitoring stations across the province to improve measurements in cold months. Continuous PM2.5 measurements from 2013 to 2016 showed good reliability of the SHARP 5030 with an average 98% valid hourly data reported to the public. Collocated measurements indicated that 24 h averages of the SHARP 5030 were comparable to those by the filter-based integrated samplers including the Federal Reference Method (FRM), and the FEM dichotomous (Dichot) and Speciation samplers. The slope and intercept of the linear regression between the SHARP 5030 and the FRM results generally met the acceptance limits for PM2.5 Class III FEM designation, and the ratio of FEM/FRM was 1.0 or 1.1. Twenty-four-hour averages of the SHARP 5030 also correlated well with the collocated 24 h Dichot and Speciation results. The difference percentages between SHARP 5030 and 24 h integrated results were found to be larger at low rather than at high PM2.5 levels, but not dependent on seasons. Absolute differences ranged from 0 to 16 µg/m3 and root mean square differences ranged from 2.0 to 2.3 µg/m3 when the SHARP 5030 was compared with the FRM, Dichot, and Speciation samplers. A simplified approach was further developed to correct historical TEOM data for cold months to continue long-term trend analyses based on collocated measurements at eight stations where PM2.5 emission sources varied.

1. Introduction

Airborne particulate matter is a general term used to describe a mixture of microscopic solid particles and liquid droplets suspended in air. Fine particulate matter (PM2.5) refers to particles with aerodynamic diameter less than 2.5 micrometers. PM2.5 can penetrate deep into the respiratory system due to its small size. Exposure to PM2.5 is associated with several serious health effects, including asthma, cardiovascular and lung disease, and premature death [1,2,3,4,5]. Children and elderly people are particularly sensitive to the effects of PM2.5. The International Agency for Research on Cancer classified outdoor air pollution and particulate matter (PM) as carcinogenic to humans based on evidence of carcinogenicity in humans and experimental animals [6].
PM2.5 originates from many different industrial and transportation sources, as well as from natural sources. PM2.5 includes aerosols, smoke, fumes, dust, fly ash, and pollen. Its composition varies with origin, residence time in the atmosphere, time of year, and environmental conditions [7]. PM2.5 is emitted directly to the atmosphere as a by-product of fuel combustion or road dust [8]. Major sources of PM2.5 include motor vehicles, smelters, power plants, industrial facilities, residential fireplaces and wood stoves, agricultural burning, and forest fires [7,9,10,11,12]. It is also formed indirectly in the atmosphere through a series of complex chemical reactions of gaseous precursors [7,13,14]. Major components of PM2.5 in Ontario are typically nitrate, sulphate, organic matter, and particle-bound water. Higher nitrate levels are common in cold months whereas sulphate is more elevated during warm months [15].
Continuous PM monitoring is valuable for providing short-term information on ambient concentrations. Prior to the introduction of real-time monitoring, Ontario relied on a Federal Equivalent Method (FEM), which is manually operated with filters for 24 h from midnight to midnight and has a time lag between sample collection and data reporting. The Tapered Element Oscillating Microbalance (TEOM) technology was developed for continuous real-time PM monitoring [16] and received United States Environmental Protection Agency (U.S. EPA) Class III FEM designation in 1990 for PM10 reporting [17]. The PM2.5 Class III FEM is a designation for measuring ambient concentrations of specified air pollutants in accordance with Title 40, Part 53 of the code of Federal Regulations (40 CFR Part 53). Ontario started to report near-real-time PM2.5 concentrations in 2002 under the Air Quality Index (AQI) program when continuous measurements of PM2.5 became a priority for provincial government (www.airqualityontario.com). The TEOM was the most innovative method at the time for continuous PM2.5 monitoring, and continues to be used by some agencies across Canada. However, PM2.5 concentrations measured by the TEOM were found to be lower than measurements by the FEM or Federal Reference Method (FRM) during cold months due to loss of particle-bound semi-volatile compounds [18,19,20,21,22]. Semi-volatile ammonium nitrate was found to compose approximately 20–30% of the PM2.5 mass at select sites in Ontario during cold months (i.e., from October to March) [15]. The TEOM in Ontario was operated at 30 °C with a sample equilibration system (SES); therefore, ammonium nitrate and some other semi-volatile species on particles could be volatilized due to heating, leading to underestimation of PM2.5 concentrations [18,20,23,24]. Continuous PM2.5 monitoring technologies evolved dramatically to address the technical issues associated with the efficiency of sampling collection. To ensure consistency and comparability in PM2.5 monitoring and reporting, the U.S. EPA published criteria designating a continuous PM2.5 monitor as Class III FEM in 2006 [25]. To receive the Class III FEM PM2.5 designation, manufacturers are required to collocate their PM2.5 monitors with FRM measurements and pass rigorous tests following the U.S. EPA guidelines [25]. After extensive evaluation of four designated Class III FEM PM2.5 monitors in Ontario, the Thermo Scientific Synchronized Hybrid Ambient Real-time Particulate (SHARP) model 5030 was selected to replace the TEOM monitors across the ambient air quality monitoring network. As part of a national initiative, Ontario upgraded its PM2.5 monitoring network to the U.S. EPA Class III FEM to standardize monitoring methods and ensure consistency of data quality across Canada. The SHARP 5030 monitors commenced reporting to the public in January 2013 to improve PM2.5 measurements in cold months and to reduce long-term operation costs (www.airqualityontario.com).
Ambient monitoring data are used to derive long-term trends and determine whether levels of air pollutants go up or down over time. Replacing the TEOM with the SHARP 5030 monitors inevitably introduces discrepancies in annual averages due to improved PM2.5 measurements by the SHARP 5030 in cold months. TEOM monitors were collocated with the SHARP 5030 at eight stations where PM2.5 emission sources varied. The collocated data were used to assess how comparable the measurements were between the two types of monitors. Sofowote et al. [26] applied multiple linear regression analyses (MLRA) to correct historical TEOM data and to make them agreeable to FRM measurements by using parameters of physicochemical relevance, which included β-attenuation-derived PM2.5 concentrations and nephelometer readings and relative humidity for the SHARP 5030, ambient temperatures, shelter temperatures, and TEOM tape loadings. The corrected TEOM data were found to be better comparable to the FRM measurements than the original TEOM measurements [26]. However, historical input parameters of the MLRA were not readily available at all stations in Ontario (e.g., parameters associated with the SHARP 5030).
The objectives of this study are (1) to assess the field operation performance of the SHARP 5030 from 2013 to 2016 by examining annual valid data percentages at individual stations; (2) to compare continuous SHARP 5030 measurements with collocated 24 h integrated PM2.5 measurements at six collocated stations; and (3) to compare continuous SHARP 5030 to TEOM data at eight collocated stations and to develop a simplified approach to correct historical TEOM data in cold months for reporting long-term PM2.5 trends at all stations across the province.

2. Methods

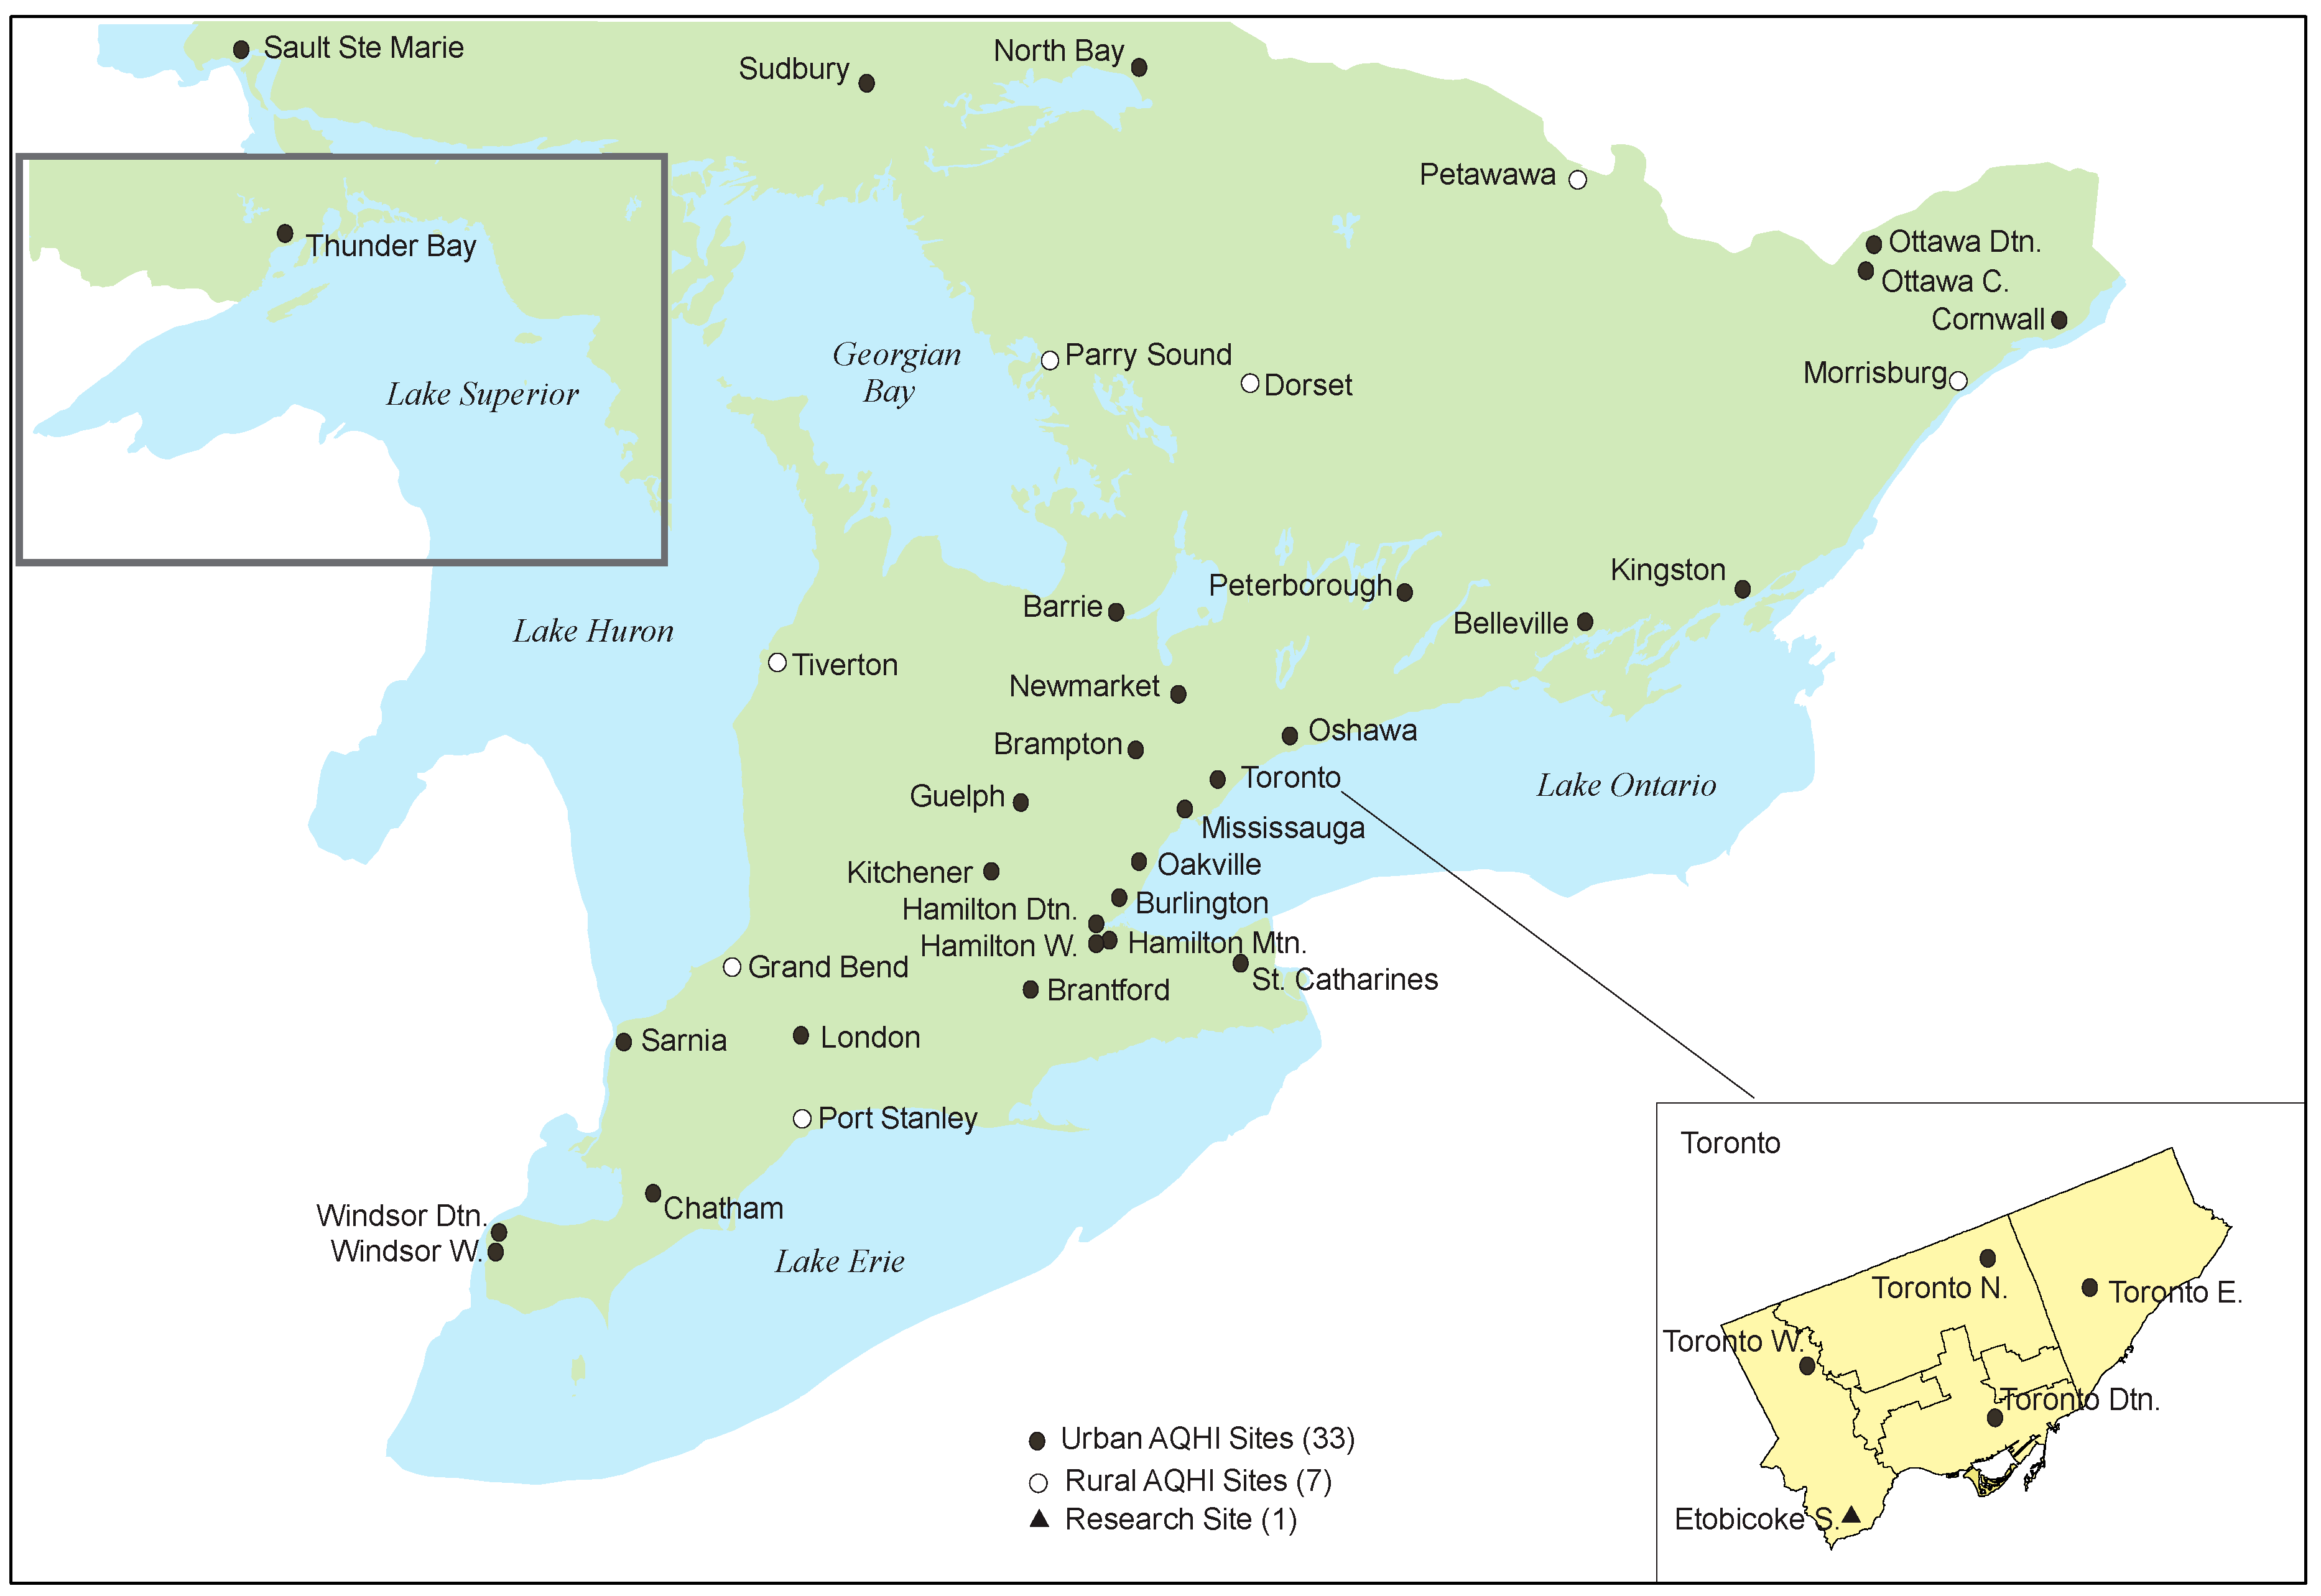
2.1. Ambient Air Monitoring Network in Ontario, Canada

Figure 1 shows locations of the ambient monitoring stations in Ontario in 2013. Each station monitors up to six common air criteria air pollutants, including PM2.5, ozone, nitrogen dioxide, carbon monoxide, sulphur dioxide, and total reduced sulphur compounds [7]. The air quality information is communicated to the public in near-real-time through the Air Quality Health Index (AQHI) and as hourly concentrations for individual pollutants.

2.2. The SHARP 5030

The SHARP 5030 measures PM2.5 mass concentrations based on the principles of particle light scattering (nephelometer) and beta attenuation. The SHARP monitors were operated inside sheltered environments and sampled ambient air through a sample tube. Ambient air was drawn through a PM10 size selective inlet and a PM2.5 Very Sharp Cut Cyclone (VSCC) particle size separator at the flow rate of 16.7 L per minute. The SHARP 5030 heater was set at the relative humidity threshold of 35% and the tape was set to advance once every eight hours. The SHARP 5030 measured PM2.5 mass concentrations every minute and hourly averages were reported to the public.

2.3. Integrated Measurements

At six select stations, integrated samplers were collocated with the SHARP 5030, including FRM Thermo Partisol 2000, FEM Thermo Partisol 2025, and Speciation Sampler Met One Speciation Air Sampling System (SASS) or Partisol 2300 (Table 1). Twenty-four-hour integrated samples were collected on a 6-day or 3-day schedule at those stations by Environment and Climate Change Canada (ECCC). The air samples collected on Teflon® filters were weighed on a microbalance before and after sampling under controlled humidity and temperature to measure PM2.5 mass in air. Details on the PM2.5 integrated sampling and analysis were reported elsewhere [15]. Integrated PM2.5 data were downloaded from ECCC’s website (http://maps-cartes.ec.gc.ca/rnspa-naps/data.aspx).

2.4. The TEOM

The TEOM with a SES directly measured PM2.5 mass concentrations by passing air through a hollowed tapered channel where the particles were deposited on a filter. The tapered inlet tube oscillated at a frequency that is inversely proportional to the amount of sample particles deposited on the filter. The sample area was heated at 30 °C to maintain the oscillation frequency and to reduce the water amount in the particles. The TEOM measured PM2.5 concentrations every minute and reported hourly average concentrations. Similar to the SHARP 5030, each of the TEOM monitors was installed inside an environmentally controlled shelter and equipped with a PM10 inlet and a PM2.5 VSCC.

2.5. Data Treatment

Hourly data of the SHARP 5030 and the TEOM were subject to strict quality control and quality assurance. Data below the detection limit (DL) were replaced with ½ DL (i.e., 0.5 µg/m3) prior to data analyses, which included 9% TEOM data and 1% SHARP 5030 data. Twenty-four-hour averages (from midnight to midnight) of the SHARP 5030 concentrations were calculated from validated hourly measurements, and then aligned with the 24 h integrated data obtained from the same time periods. The paired data were used to compare 24 h SHARP 5030 averages to integrated measurements when concentrations were equal to or greater than 3 µg/m3 since acceptable concentrations of 3–200 µg/m3 are required for the SHARP 5030 to receive the U.S. EPA Class III FEM designation [25]. However, the comparison between the SHARP 5030 and TEOM used all data, including measurements below 3 µg/m3.

3. Results and Discussion

3.1. Field Performance of the SHARP 5030

Four years of hourly PM2.5 data were collected with the SHARP 5030 from 2013 to 2016. Annual valid data percentages were calculated using total valid hourly data points in a given year divided by theoretical hours in that year (i.e., 8760 h in a regular year and 8784 h in a leap year). Table 2 summarizes annual valid data percentages at the 40 monitoring stations from 2013 to 2016, which ranged from 92 to 100% except for 84% at one station due to an installation issue. On average, the SHARP 5030 reported 98% valid hourly data to the public during the four-year time period. Long-term field operation indicated that the SHARP 5030 was reliable to report hourly PM2.5 concentrations in various environments across Ontario.

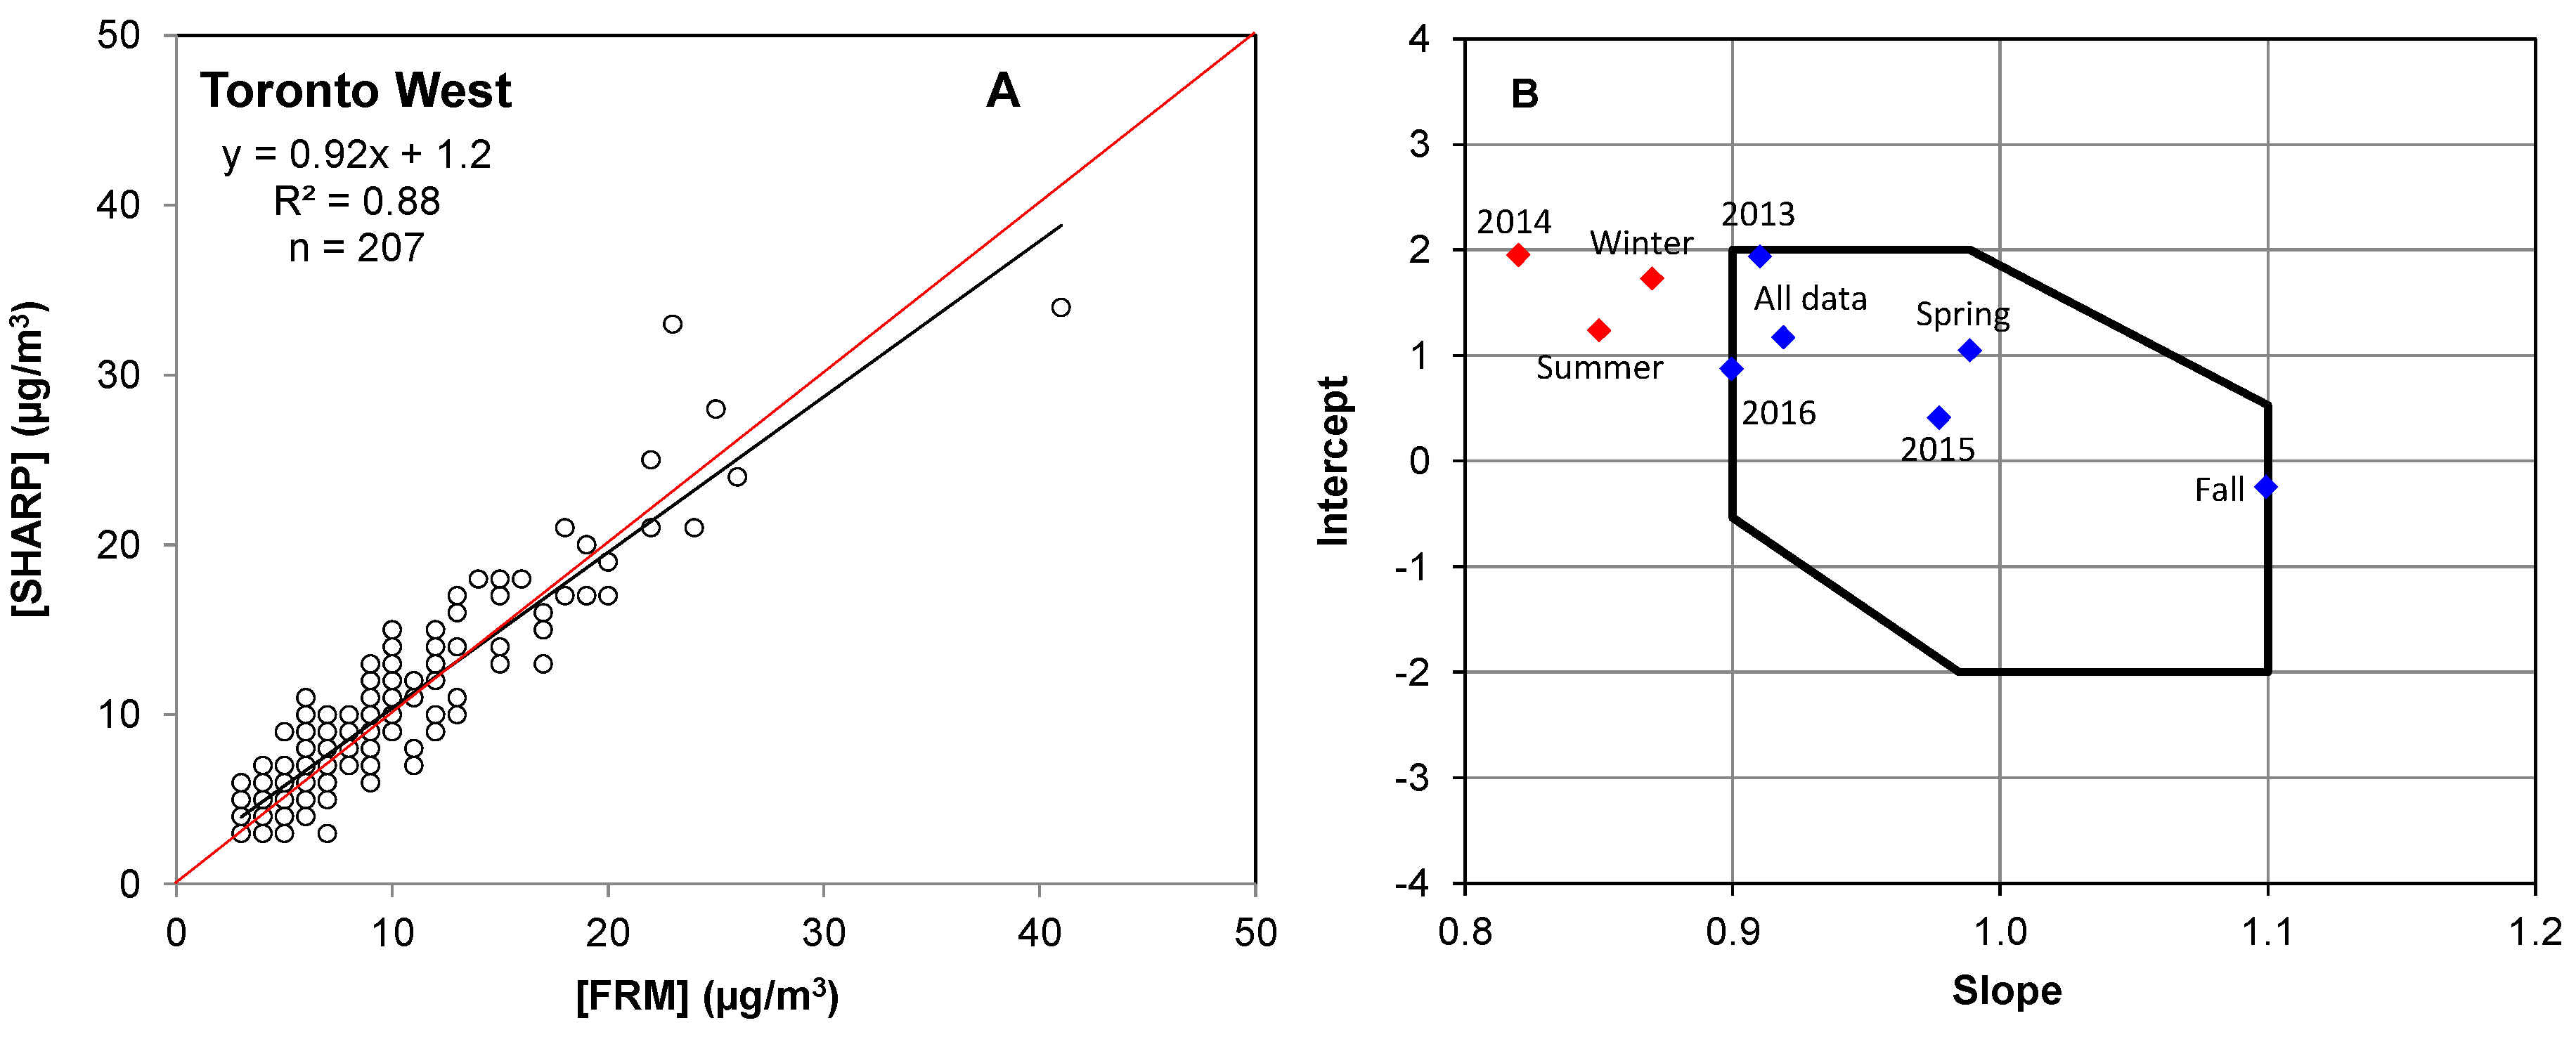
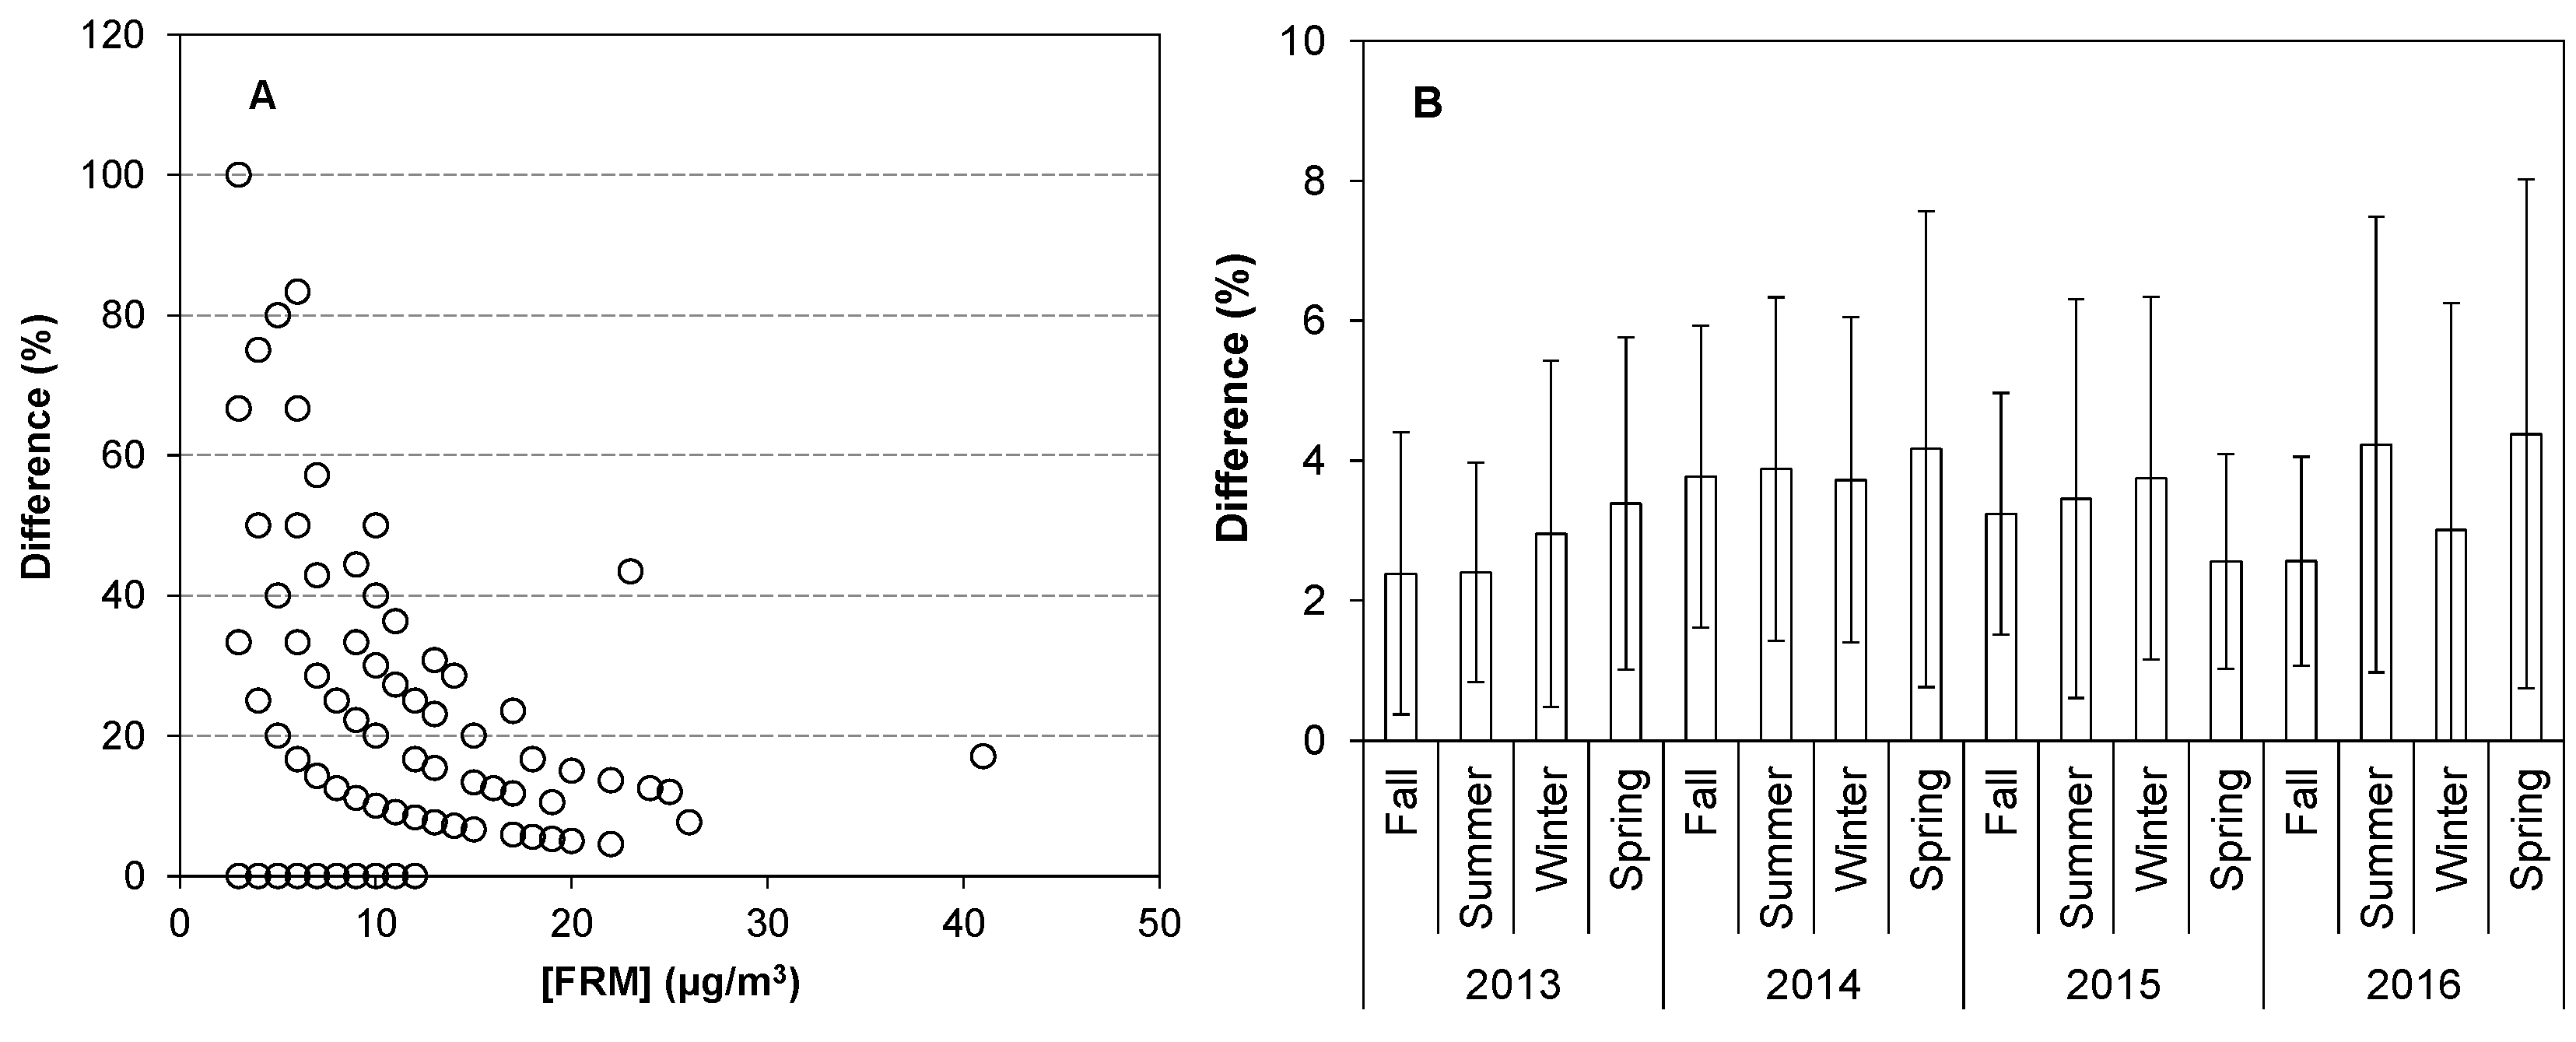
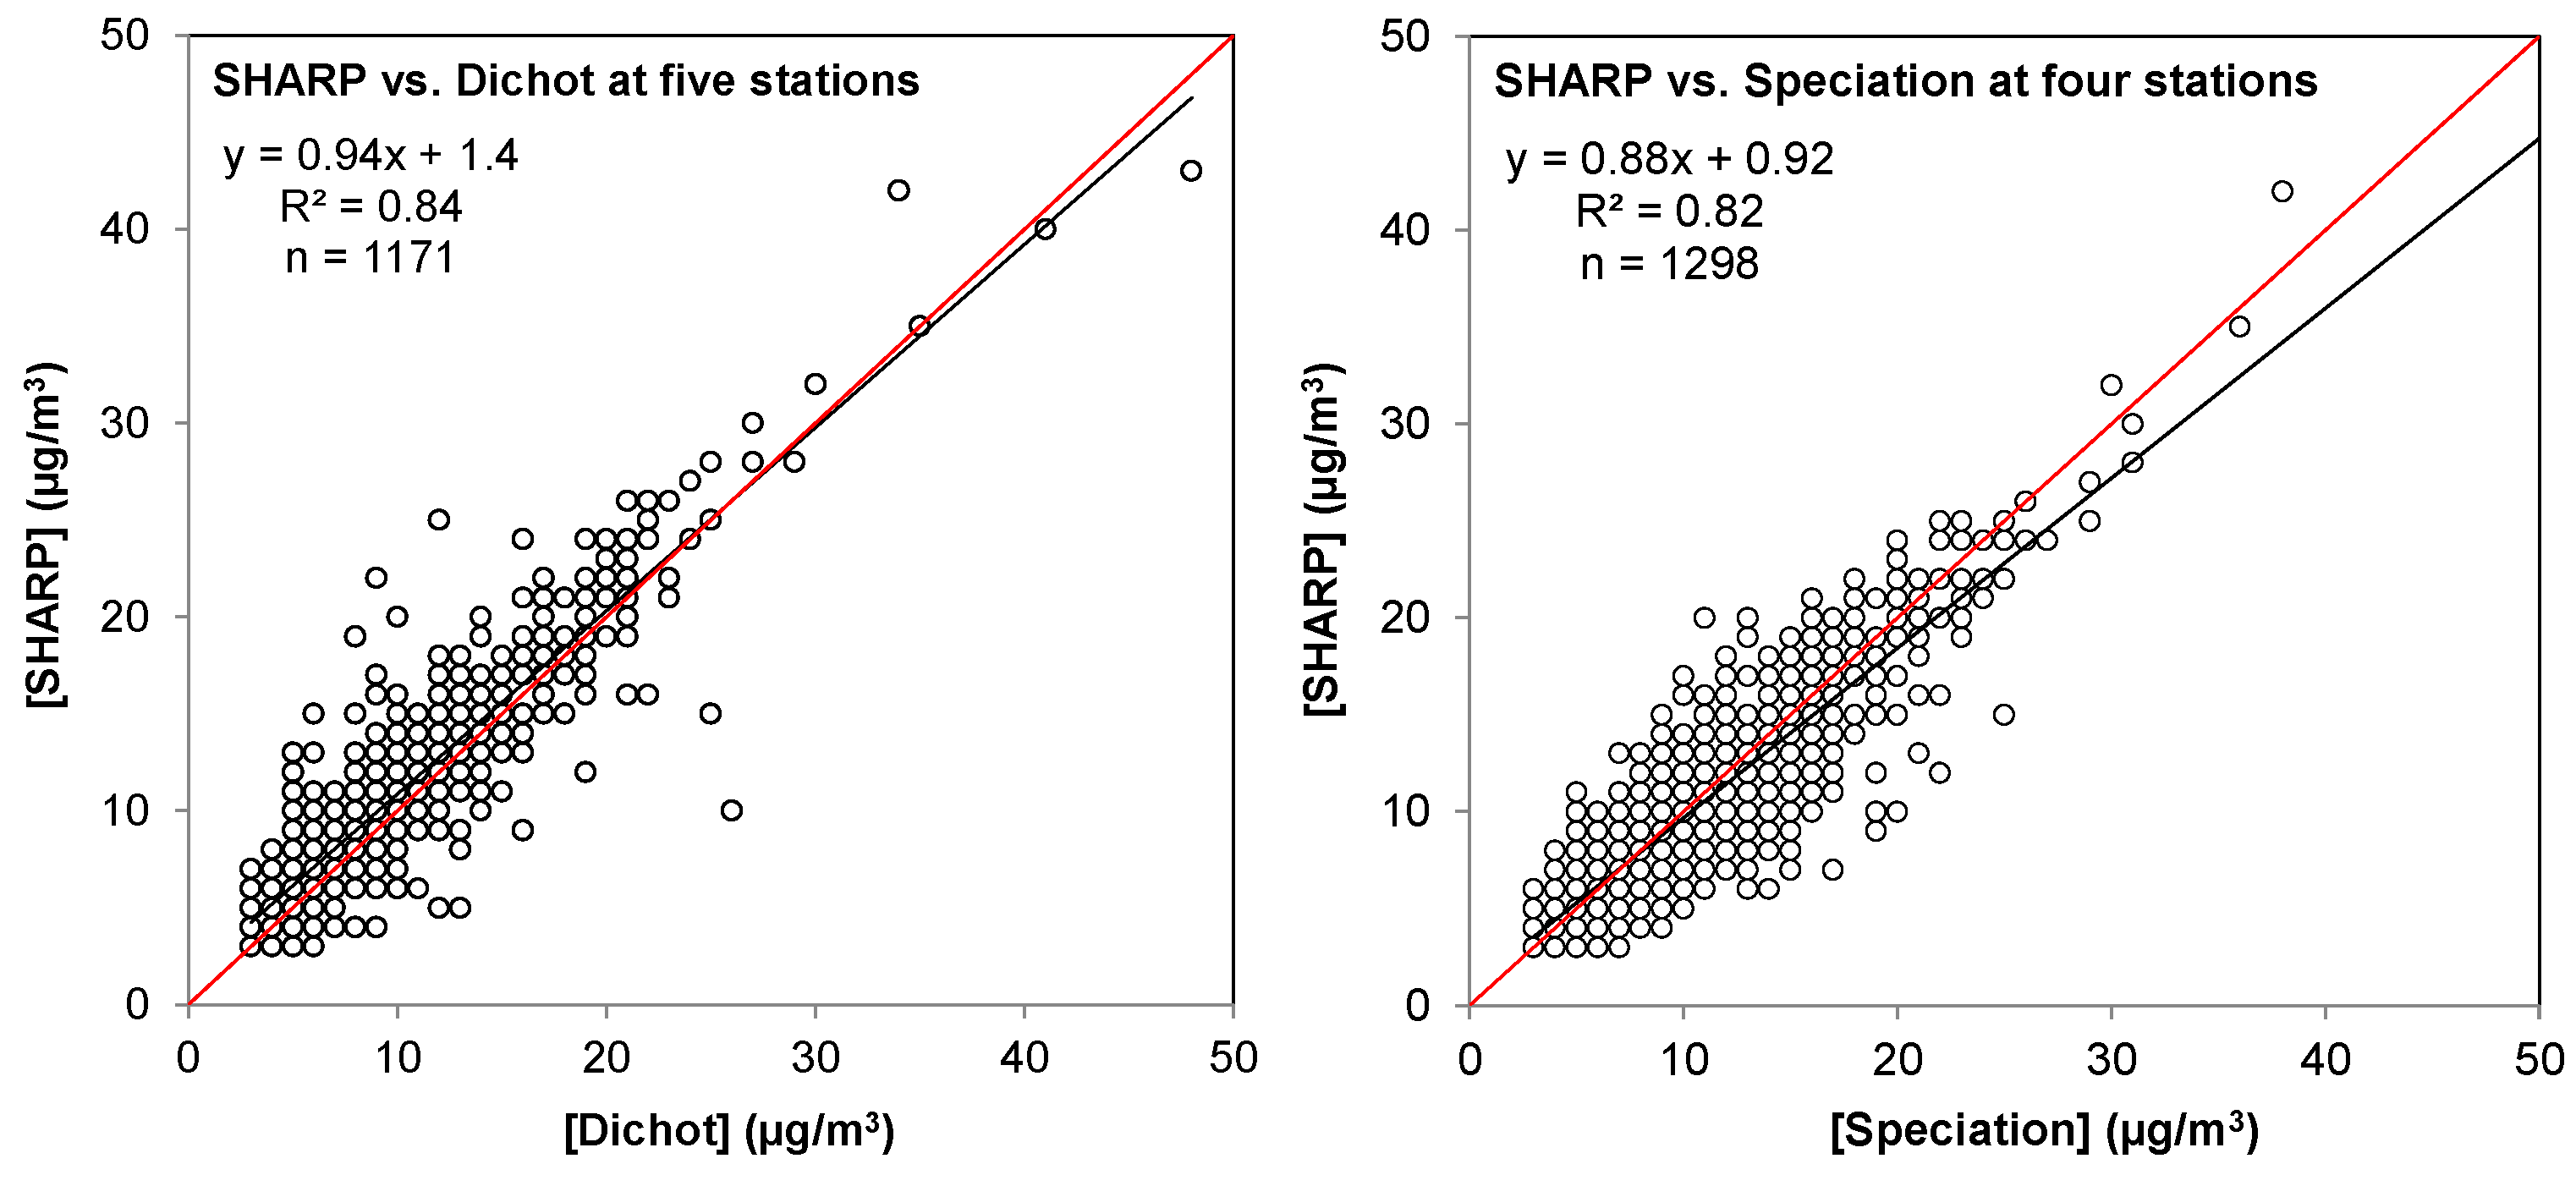
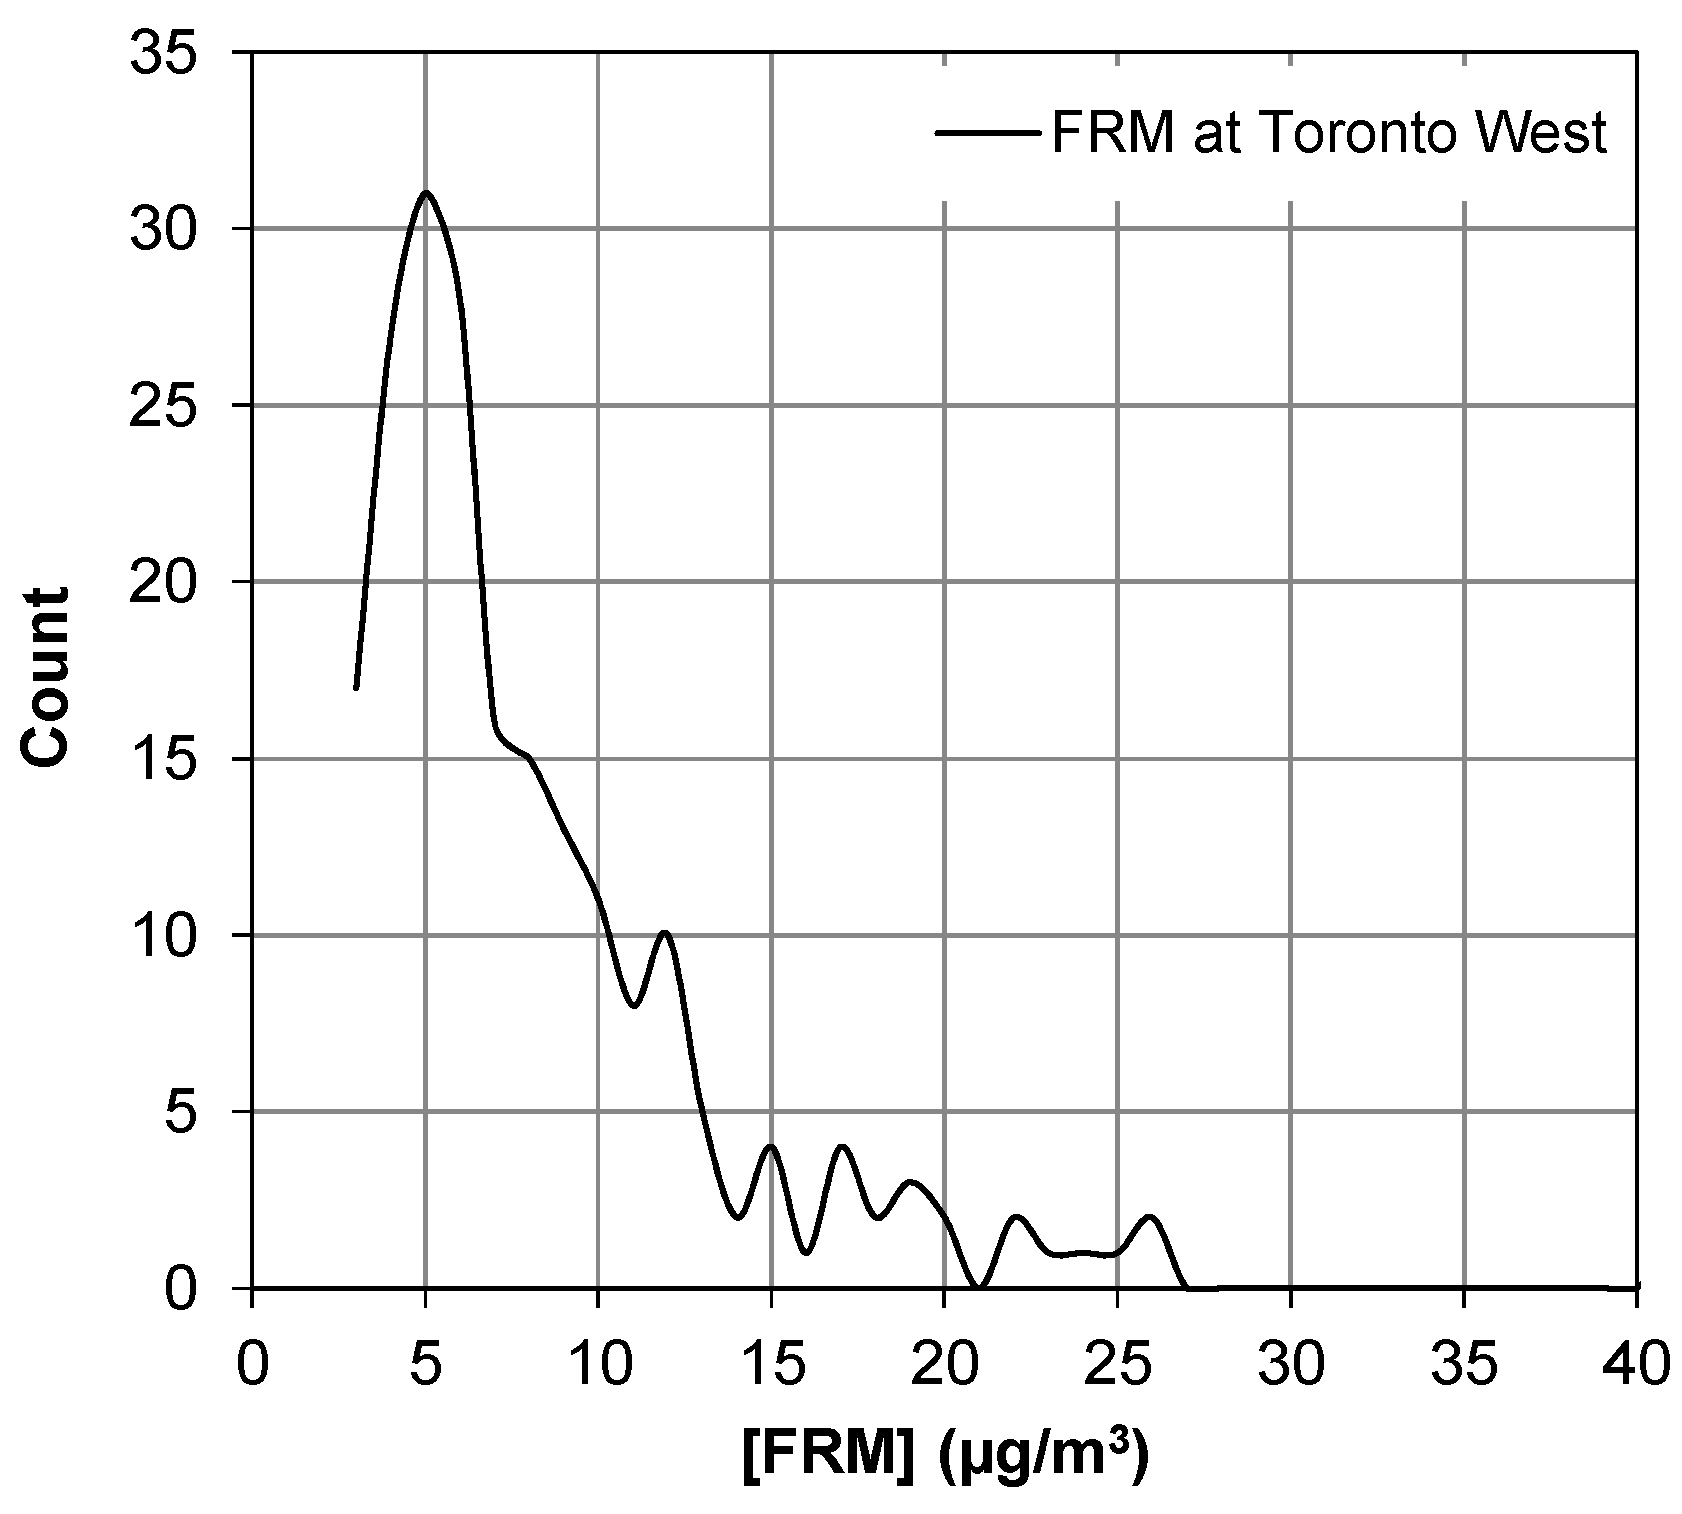
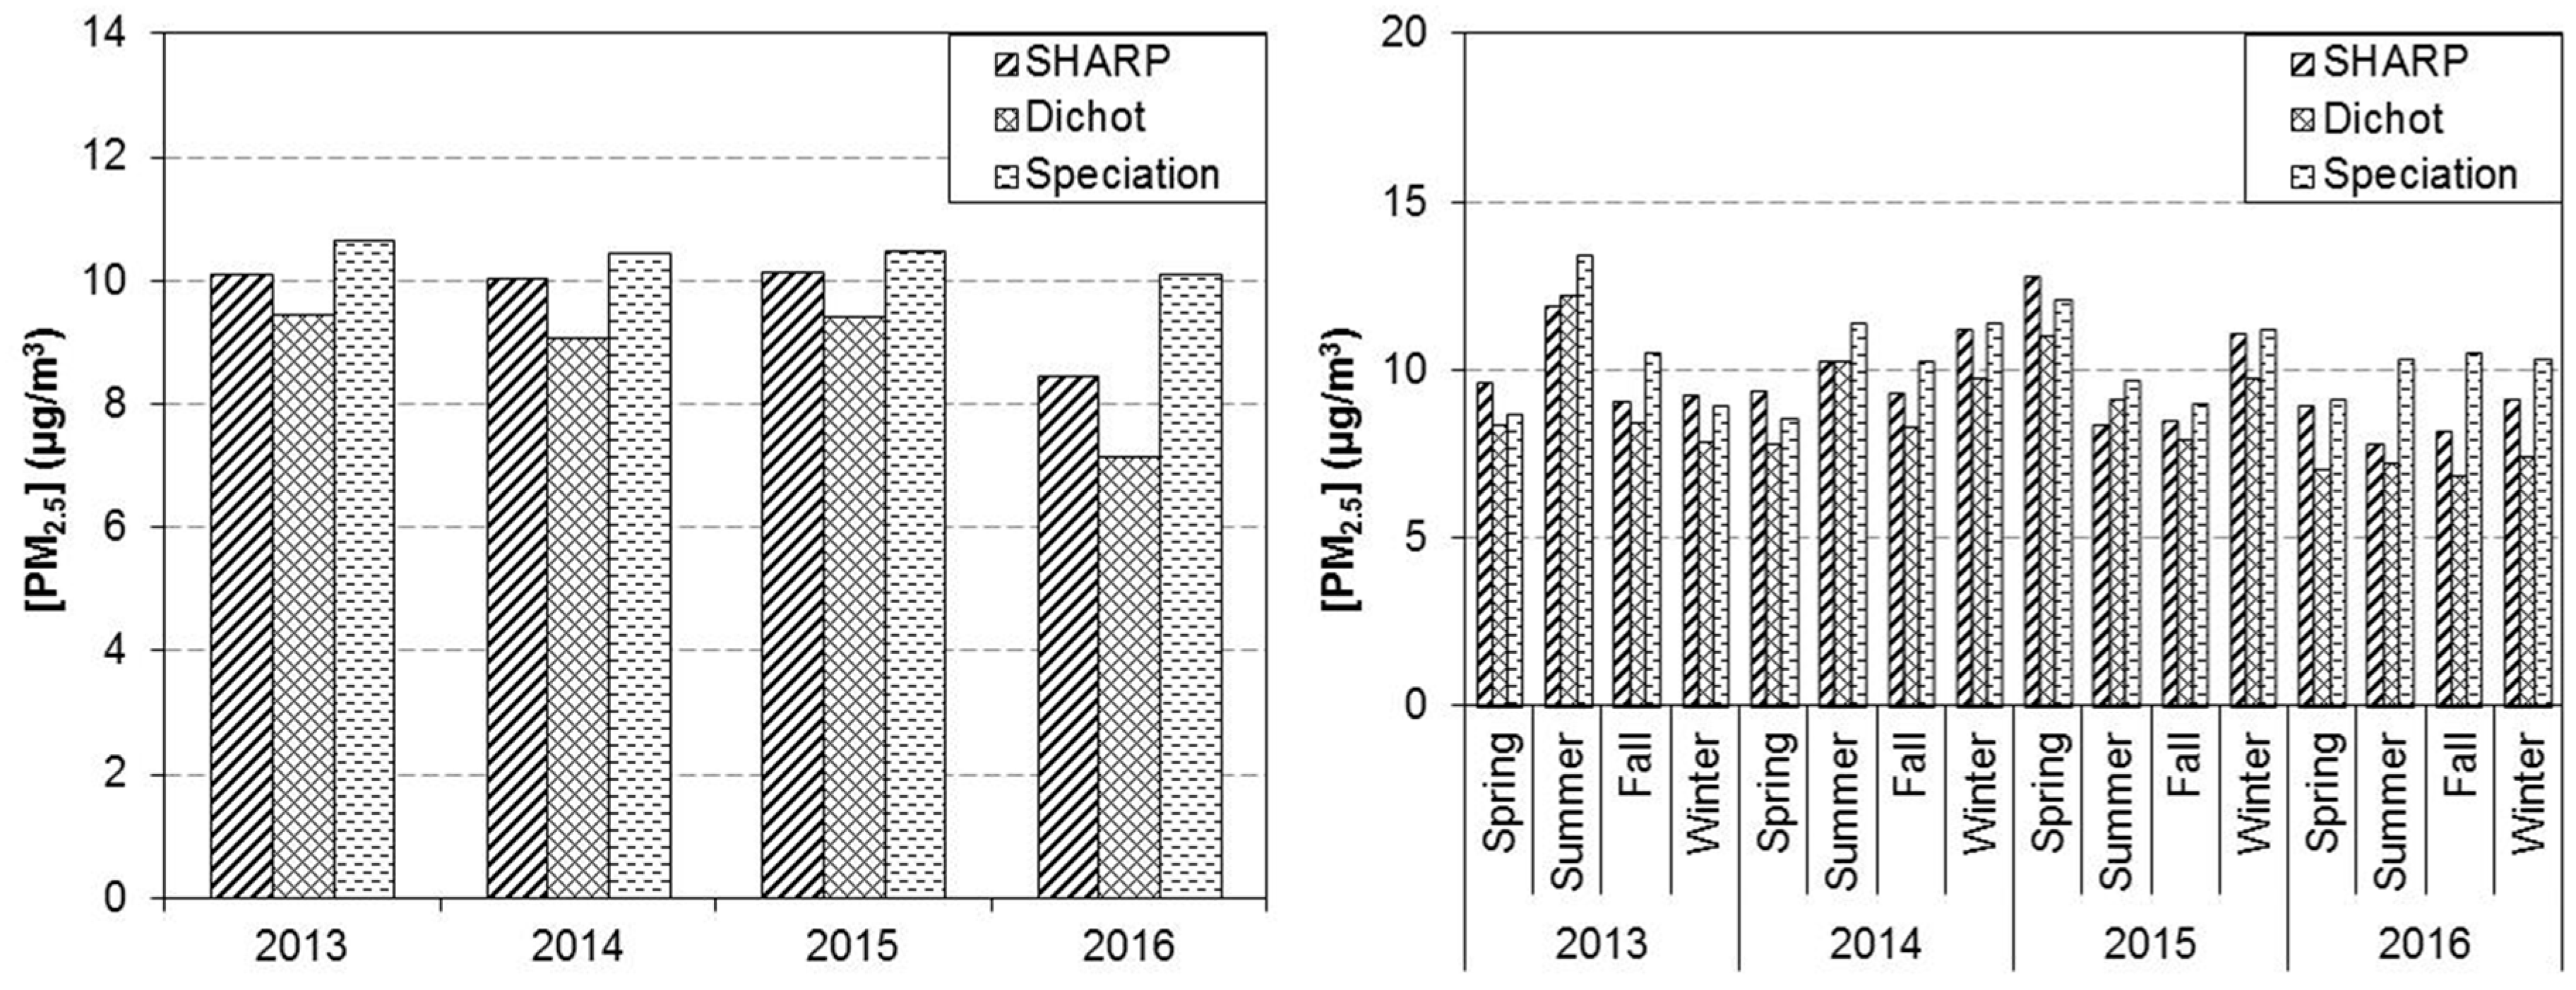
3.2. Comparison between the SHARP 5030 and the FRM

The FRM Thermo Partisol 2000 sampler was collocated with the SHARP 5030 at the Toronto West station from 2013 to 2016. Integrated air samples were collected over 24 h once every six days. The 24 h PM2.5 concentrations were compared between the SHARP 5030 and the FRM when both data were equal to or greater than 3 µg/m3 to be consistent with the U.S. EPA guideline [25]. In total, 211 pairs of concurrent 24 h SHARP and FRM data were obtained from 2013 to 2016. Large discrepancies between the SHARP 5030 and the integrated samples were observed on several occasions, which were likely caused by invalid data from either the SHARP 5030 or integrated measurements. Four out of the 211 pairs of valid data were identified as outliers by using a statistical test with Chauvenet’s criterion [27]. Those four pairs of data were examined more closely by comparing with measurements from additional SHARP 5030 monitors located elsewhere in Toronto given that PM2.5 is a regional air pollutant. It was found that one SHARP data point and three FRM measurements were questionable; therefore, those four data pairs were removed from further data analyses. The PM2.5 concentrations decreased in Ontario, Canada over the past years and levels were relatively low across the province [7]. The FRM measurements ranged from 3 to 41 µg/m3 with an average of 8 µg/m3 during 2013–2016. Figure 2 shows the frequency distribution of 24 h FRM PM2.5 concentrations at the Toronto West station. PM2.5 concentrations were frequently observed in the range of 4–6 µg/m3, and ~70% of them were lower than 10 µg/m3.
Following the U.S. EPA guidelines [25], linear regressions were performed between the 24 h SHARP 5030 averages and the 24 h FRM concentrations by using Equation (1).
[SHARP] = slope × [FRM] + intercept
A good linear correlation was found between the SHARP 5030 and FRM concentrations when all paired data were included (Figure 3A), suggesting that the SHARP 5030 provided comparable results to the 24 h FRM measurements. In comparison to the FRM, the continuous SHARP 5030 monitors recorded minute data in near-real-time and data can be used to track short-lived episodic events with elevated PM2.5 concentrations. The near-real-time air quality information is also valuable for public health protection.
Additional scenarios of the linear regression were performed for individual years and four different seasons to assess data comparability between the SHARP 5030 and the FRM. Table 3 shows that linear regressions between the SHARP 5030 and the FRM were generally good with slopes ranging from 0.82 to 1.1 and correlation coefficients ranging from 0.92 to 0.96. The ratio of FEM/FRM was 1.0 or 1.1 (Table 3), indicating that average measurements of the FEM SHARP 5030 were identical to or 10% higher than the FRM measurements. Figure 3B shows the acceptance limits of slope and intercept for PM2.5 Class III FEM designated by U.S. EPA [25], which were met for most scenarios except for 2014, winter, and summer in Ontario. Despite accepted intercepts, the slopes were out of their acceptance limit for the 2014, winter, and summer periods. During these time periods, there were more times when the SHARP 5030 reported higher concentrations than the FRM, and the high SHARP 5030 concentrations led to shallow slopes (i.e., less than 0.9). Figure 3A indicates that data points are randomly distributed on the two sides of the 1:1 line when all data are included. It suggests that deviation of the slopes from 0.9 appears to be not systemic for 2014, winter, and summer.
Difference percentages between the SHARP 5030 and the FRM were further quantified for individual paired data using Equation (2).
D i f f e r e n c e   ( % ) =   | [ S H A R P ] [ F R M ] | [ F R M ] × 100
The difference percentage of PM2.5 concentrations ranged from 0 to 100% with a median of 17% and an average of 19% from 2013 to 2016 at the Toronto West station. The difference appeared greater at low rather than at high concentrations (Figure 4A), but not dependent on seasons (Figure 4B). The low concentrations may lead to high difference percentages. Absolute differences between the SHARP 5030 and the FRM ranged from 0 to 10 µg/m3 and the root-mean-square difference was 2.0 µg/m3.
In addition to the FRM sampler collocated at the Toronto West station, FEM Thermo Partisol 2025 Dichot particle samplers were deployed at five other stations to collect PM2.5 samples once every six days (Table 1). Figure 5 shows that the 24 h averages of the SHARP 5030 correlated well with the Dichot results at five stations (slope = 0.94, R2 = 0.84, n = 1171). Speciation samplers were deployed at four stations to collect PM2.5 samples on a 3-day cycle (Table 1). Figure 5 indicates that the SHARP 5030 results correlated well with the Speciation results as well (slope = 0.88, R2 = 0.83, n = 1298). The collocated results suggested that continuous SHARP 5030 monitoring was equivalent to the 24 h integrated measurements. Similar to the FRM, the differences between the SHARP 5030 and the Dichot, as well as between the SHARP 5030 and the Speciation sampler, were greater at low than at high PM2.5 concentrations, and the differences were not dependent on seasons. Absolute differences ranged from 0 to 16 µg/m3 (root-mean-square difference of 2.3 µg/m3) between the SHARP 5030 and the Dichot, and from 0 to 10 µg/m3 (root-mean-square difference of 2.2 µg/m3) between the SHARP 5030 and the Speciation sampler. The differences were fairly similar when the SHARP 5030 was compared to the FRM, Dichot, and Speciation samplers.
The SHARP 5030 collocated with both the Dichot and Speciation samplers at four select stations (Table 1). Annual averages of the SHARP 5030 were 11% (ranging from 7 to 18%) higher than those of the Dichot, and 7% (ranging from 3 to 16%) lower than those of the Speciation sampler (Figure 6). The differences among the three types of measurements varied seasonally. On average, the SHARP 5030 measurements were 19% higher than the Dichot sampler and 6% higher than the Speciation sampler in Spring; 1% lower than the Dichot sampler and 15% lower than the Speciation sampler in Summer; 12% higher than the Dichot sampler and 13% lower than the Speciation sampler in Fall; and 17% higher than the Dichot sampler and 3% lower than the Speciation sampler in Winter (Figure 6). The differences among the three types of 24 h integrated measurements are likely associated with uncertainties of the different sampling methods.

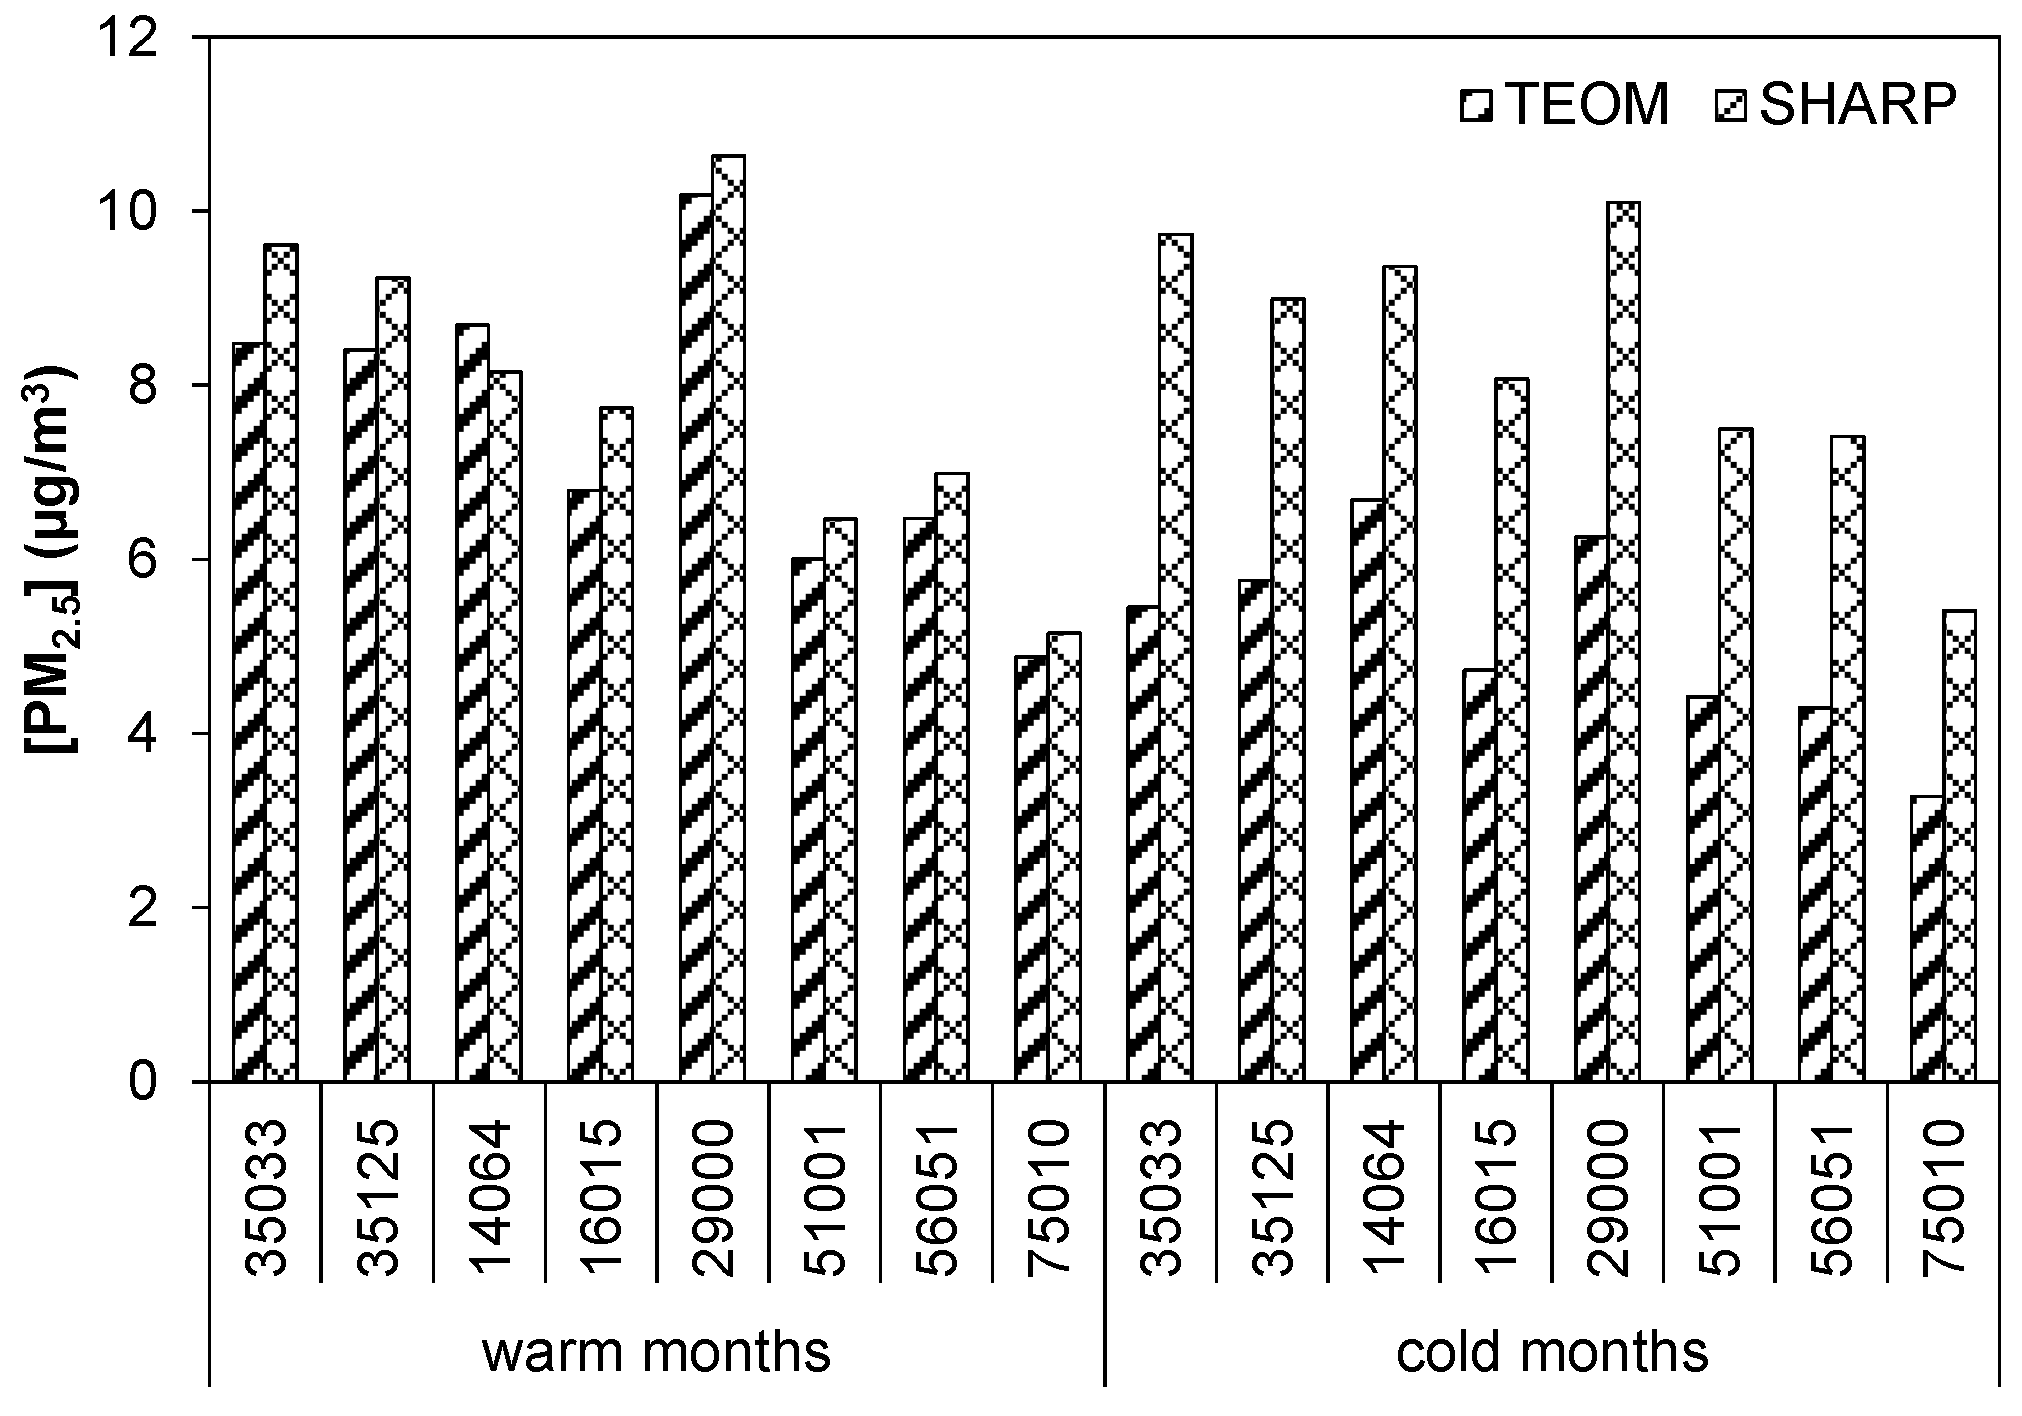
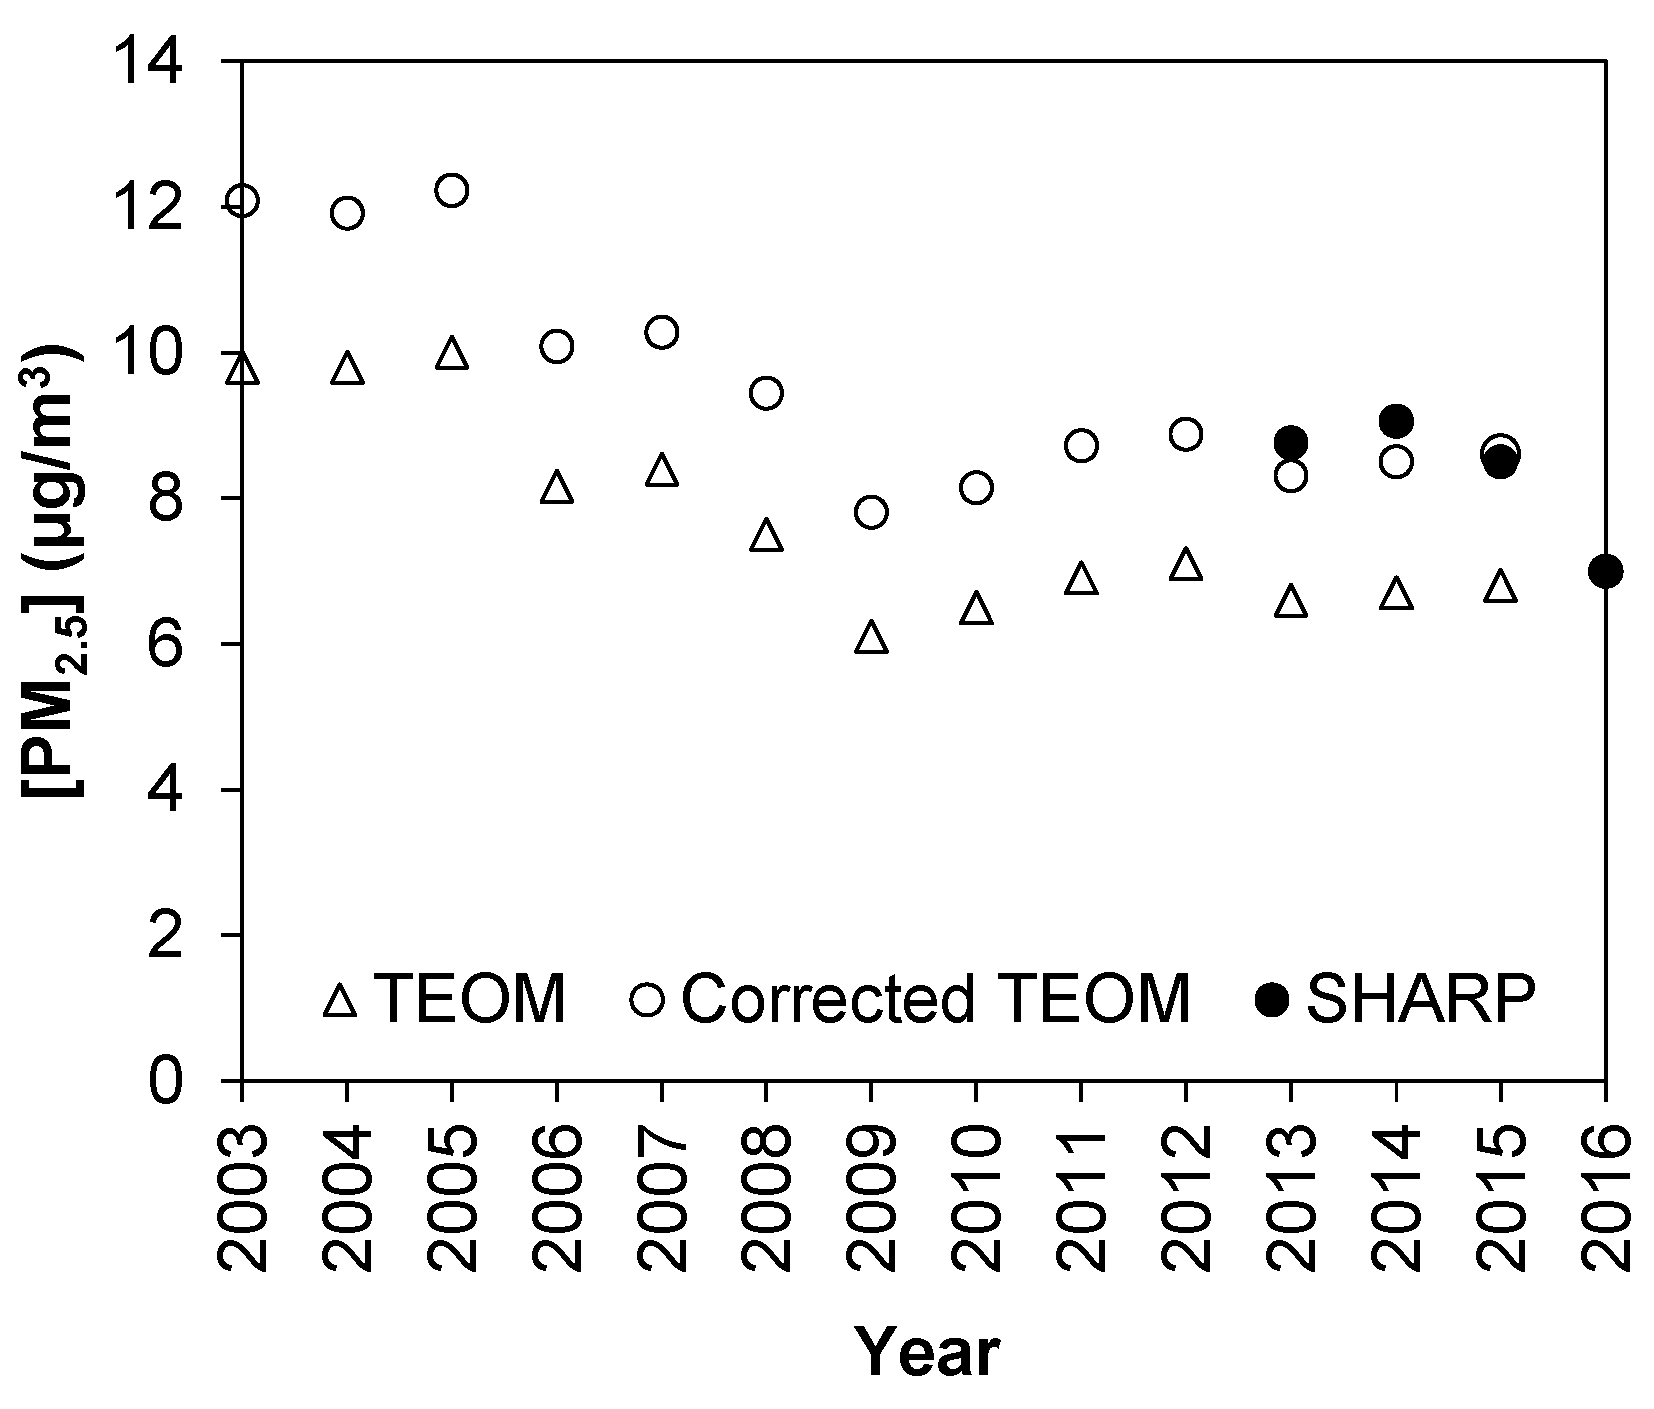
3.3. Comparison between the SHARP 5030 and the TEOM

The first SHARP 5030 monitor was set up for field testing in May 2009 at the Etobicoke South research station, and the second test monitor was deployed in February 2011 at the Toronto West station. The SHARP 5030 along with collocated integrated measurements indicated that the SHARP 5030 met the U.S. EPA Class III FEM designation and was suitable for continuously monitoring PM2.5 in Ontario, and the SHARP 5030 was more comparable to the FRM than the TEOM. The test results provided evidence for replacing the TEOM with SHARP 5030 across the ambient monitoring network in Ontario. In summer 2012, SHARP 5030 monitors were gradually deployed at stations where shelter space was available to collocate with TEOM monitors. For the few stations with limited shelter space, TEOM monitors were swapped with SHARP 5030 devices in December 2012/January 2013. Starting from January 2013, hourly PM2.5 measurements were officially reported to the public with the SHARP 5030 (www.airqualityontario.com). The hourly PM2.5 data collected by the SHARP 5030 were further used to calculate the AQI (before June 2015) or AQHI (after June 2015) for public air quality messaging. From January 2013 to December 2015, the TEOM continued to be deployed at eight select stations where PM2.5 emission sources were much different in various environments (e.g., urban, rural, industrial, and transboundary-influenced locations). The collocated SHARP 5030 and TEOM monitors helped assess data comparability under field operation environments. In summary, collocated PM2.5 measurements by the SHARP 5030 and the TEOM were available from May 2009 to December 2015 at the eight stations (Table 4).
One of the objectives of operating the ambient air monitoring network is to assess long-term trends of air pollutants. The change in monitoring technology introduced discrepancies in PM2.5 measurements and posed challenges in reporting long-term trends across Ontario. Traditional smog seasons in Ontario generally occur in warm months from May to September. PM2.5 averages were calculated separately for warm months (from May to September) and cold months (from October to April) at the eight stations. The differences between the SHARP 5030 and the TEOM were found to be much larger in cold months (29–44%) than in warm months (4–12%) (Figure 7), due to volatilization loss of ammonium nitrate when the TEOM was operated at 30 °C [18,20,23,24]. Since the differences were relatively small in warm months, the comparison between the SHARP and the TEOM in this study focused on the measurements in cold months to develop a correction factor for continuing long-term trend analyses.
At the eight collocated stations, PM2.5 measurements in cold months with the SHARP 5030 and the TEOM were pooled together for the time period of 2013–2016 in order to derive an equation applicable to all stations across the province. The database generally represented PM2.5 measurements across the province since emission sources varied in communities where the stations were located. As shown in the following equation, a good linear relationship was obtained between the SHARP 5030 and the TEOM for the cold months.
[TEOM]SHARP-like = 1.34 × [TEOM] + 1.09 (R2 = 0.75, n = 127,232)
With Equation (3), it is possible to correct historical TEOM data to obtain SHARP-like annual PM2.5 concentrations at all stations across the network to continue long-term trend analyses.
Figure 8 shows annual averages for the TEOM from 2003 to 2015, corrected TEOM (or SHARP-like) from 2003 to 2015, and the SHARP 5030 from 2013 to 2016 at the Toronto West station. Continuous PM2.5 measurements were officially reported with the TEOM before 2013 and with the SHARP 5030 after that year. As shown in Figure 6, the annual PM2.5 average in 2013 with the SHARP 5030 was much higher than that in 2012 which was measured by the TEOM. However, estimates of PM2.5 primary emissions in 2013 were not much different from those in 2012 in Ontario [7]. This suggests that the increase in the PM2.5 annual average in 2013 was caused by the instrument change from the TEOM to the SHARP 5030.
Both the TEOM and SHARP 5030 were used to monitor PM2.5 from 2013 to 2015. Annual PM2.5 averages of the SHARP 5030 were 33%, 35%, and 25% higher than those of the TEOM in 2013, 2014, and 2015, respectively. By applying Equation (3), historical TEOM data in the cold months were corrected to derive SHARP-like data. From 2003 to 2012, the SHARP-like annual averages were found to be higher than the original TEOM ones by 24% on average (ranging from 22 to 28%) at the Toronto West station (Figure 8). This is in line with the fact that ammonium nitrate composes approximately 20–30% of the PM2.5 mass at select sites in Ontario during cold months [15]. Across the network, the SHARP-like annual averages were 26% higher than the original TEOM measurements from 2003 to 2012. The SHARP-like PM2.5 annual average in 2012 aligned better with that in 2013 measured by the SHARP 5030. From 2013 to 2015, the differences of annual averages between SHARP-like and SHARP 5030 were much reduced (ranging from 1 to 7%) in comparison to those between the TEOM and the SHARP (26–27%). The improved comparability of annual averages between the SHARP-like and SHARP 5030 lends credibility to deriving long-term trends using SHARP-like annual averages before 2013 and SHARP 5030 annual averages after that year.

4. Conclusions

The TEOM was used in Ontario, Canada to continuously monitor PM2.5 concentrations from 2003 to 2012. In January 2013, the FEM SHARP 5030 replaced the TEOM across the monitoring network to improve PM2.5 measurements in the cold months. Four years (2013–2016) of field operations showed good reliability of the SHARP 5030 with an average of 98% valid data reported to the public across the air quality monitoring network. Measurements by the SHARP 5030 were generally comparable to those by the FRM at the Toronto West station, and the acceptance limits of slope and intercept for PM2.5 Class III FEM designation were met except for the periods of 2014, winter, and summer. In general, the SHARP 5030 met the U.S. EPA FEM designation for PM2.5 continuous monitoring in Ontario. This suggests that the SHARP 5030 improved PM2.5 measurements in the cold months and are suitable for PM2.5 continuous monitoring in Ontario. The SHARP 5030 were also collocated with 24 h FEM Dichot samplers at five stations and with 24 h Speciation samplers at four stations. Twenty-four-hour averages of the SHARP 5030 correlated well with the collocated FEM Dichot and Speciation results. The difference between SHARP 5030 and 24 h integrated results was found to be larger at lower than at higher PM2.5 levels, but not dependent on seasons.
To assess data comparability to continue on reporting of PM2.5 long-term trends with two different types of instruments, TEOM and SHARP 5030 monitors were collocated at eight select stations which may have various PM2.5 emissions sources and origins. The data from 2009 to 2015 showed that the TEOM reported much lower PM2.5 concentrations than did the SHARP 5030 in cold months. A linear regression was developed to derive a correction factor to calculate “SHARP-like” PM2.5 concentrations in cold months across the network by using the collocated measurements at the eight stations. Annual concentrations of “SHARP-like” PM2.5 were about 26% higher than original TEOM concentrations across the network. The SHARP-like data from 2003 to 2012, along with the SHARP data from 2013 onwards, could be used to derive long-term trends of PM2.5 at individual stations and across the province. As additional years of SHARP 5030 PM2.5 data become available in the future, long-term trends could be derived from data with the same instrumentation (i.e., the SHARP 5030), which would minimize uncertainties in calculating SHARP-like PM2.5 concentrations from historical TEOM data.

Author Contributions

Y.S., U.S., J.D., L.W. and A.M. contributed to the study design. Y.S., U.S. and A.M. took the lead in analyzing the data and drafting the manuscript. All authors contributed to data interpretation, provided critical revisions to the manuscript, and approved the final version.

Acknowledgments

We would like to thank all who maintained the continuous PM2.5 monitors in Ontario’s ambient air quality monitoring network. Environment and Climate Change Canada’s National Air Pollution Surveillance program is acknowledged for providing air monitoring instrumentation to the province of Ontario and the integrated PM2.5 data.

Conflicts of Interest

The authors declare no conflicts of interest.

References

  1. Brunekreef, B.; Holgate, S.T. Air pollution and health. Lancet 2002, 360, 1233–1242. [Google Scholar] [CrossRef]
  2. Pope, C.A.; Ezzati, M.; Dockery, D.W. Fine-particulate air pollution and life expectancy in the United States. N. Engl. J. Med. 2009, 360, 376–386. [Google Scholar] [CrossRef] [PubMed]
  3. Atkinson, R.W.; Kang, S.; Anderson, H.R.; Mills, I.C.; Walton, H.A. Epidemiological time series studies of PM2.5 and daily mortality and hospital admissions: A systematic review and meta-analysis. Thorax 2014, 69, 660–665. [Google Scholar] [CrossRef] [PubMed]
  4. Kim, K.-H.; Kabir, E.; Kabir, S. A review on the human health impact of airborne particulate matter. Environ. Int. 2015, 74, 136–143. [Google Scholar] [CrossRef] [PubMed]
  5. Lu, F.; Xu, D.; Cheng, Y.; Dong, S.; Guo, C.; Jiang, X.; Zheng, X. Systematic review and meta-analysis of the adverse health effects of ambient PM2.5 and PM10 pollution in the Chinese population. Environ. Res. 2015, 136, 196–204. [Google Scholar] [CrossRef] [PubMed]
  6. Loomis, D.; Grosse, Y.; Lauby-Secretan, B.; El Ghissassi, F.; Bouvard, V.; Benbrahim-Tallaa, L.; Guha, N.; Baan, R.; Mattock, H.; Straif, K.; et al. The carcinogenicity of outdoor air pollution. Lancet Oncol. 2013, 14, 1262–1263. [Google Scholar] [CrossRef]
  7. Ministry of the Environment and Climate Change (MOECC). Air Quality in Ontario 2015 Report; Queen’s Printer for Ontario: Toronto, ON, Canada, 2017; ISSN 1710-8136. [Google Scholar]
  8. Gillies, J.A.; Gertler, A.W.; Sagebiel, J.C.; Dippel, W.A. On-road particulate matter (PM2.5 and PM10) Emissions in the Sepulveda Tunnel, Los Angeles, California. Environ. Sci. Technol. 2001, 35, 1054–1063. [Google Scholar] [CrossRef] [PubMed]
  9. Kim, E.; Hopke, P.K.; Edgerton, E.S. Source identification of Atlanta aerosol by positive matrix factorization. J. Air Waste Manag. Assoc. 2003, 53, 731–739. [Google Scholar] [CrossRef] [PubMed]
  10. Begum, B.A.; Kim, E.; Jeong, C.H.; Lee, D.W.; Hopke, P.K. Evaluation of the potential source contribution function using the 2002 Quebec forest fire episode. Atmos. Environ. 2005, 39, 3719–3724. [Google Scholar] [CrossRef]
  11. Sofowote, U.M.; Su, Y.; Dabek-Zlotorzynska, E.; Rastogi, A.K.; Hopke, P.K. Sources and temporal variations of constrained PMF factors obtained from multiple-year receptor modeling of ambient PM2.5 data from five speciation sites in Ontario, Canada. Atmos. Environ. 2015, 108, 140–150. [Google Scholar] [CrossRef]
  12. Healy, R.M.; Sofowote, U.; Su, Y.; Debosz, J.; Noble, M.; Jeong, C.H.; Wang, J.M.; Hilker, N.; Evans, G.J.; Doerksen, G.; et al. Ambient measurements and source apportionment of fossil fuel and biomass burning black carbon in Ontario. Atmos. Environ. 2017, 161, 34–47. [Google Scholar] [CrossRef]
  13. Tucker, W.G. An overview of PM2.5 sources and control strategies. Fuel Process. Technol. 2000, 65–66, 379–392. [Google Scholar] [CrossRef]
  14. Zheng, M.; Cass, G.R.; Schauer, J.J.; Edgerton, E.S. Source apportionment of PM2.5 in the southeastern United States using solvent-extractable organic compounds as tracers. Environ. Sci. Technol. 2002, 36, 2361–2371. [Google Scholar] [CrossRef] [PubMed]
  15. Dabek-Zlotorzynska, E.; Dann, T.F.; Martinelango, P.K.; Celo, V.; Brook, J.R.; Mathieu, D.; Ding, Y.; Austin, C.C. Canadian National Air Pollution Surveillance (NAPS) PM2.5 speciation program: Methodology and PM2.5 chemical composition for the years 2003–2008. Atmos. Environ. 2011, 45, 673–686. [Google Scholar] [CrossRef]
  16. Patashnick, H.; Rupprecht, E.G. Continuous PM10 measurements using the tapered element oscillating microbalance. J. Air Waste Manag. Assoc. 1991, 41, 1079–1083. [Google Scholar] [CrossRef]
  17. United States Environmental Protection Agency (US EPA). List of Designated Reference and Equivalent Methods; National Exposure Research Laboratory, Human Exposure & Atmospheric Sciences Division: Research Triangle Park, NC, USA, 2011.
  18. Zhu, K.; Zhang, J.; Lioy, P.J. Evaluation and Comparison of Continuous Fine Particulate Matter Monitors for Measurement of Ambient Aerosols. J. Air Waste Manag. Assoc. 2007, 57, 1499–1506. [Google Scholar] [CrossRef] [PubMed]
  19. Motallebi, N.; Taylor, C.A., Jr.; Turkiewicz, K.; Croes, B.E. Particulate matter in California: Part 1—intercomparison of several PM2.5, PM10-2.5, and PM10 monitoring networks. J. Air Waste Manag. Assoc. 2003, 53, 1509–1516. [Google Scholar] [CrossRef] [PubMed]
  20. Rizzo, M.; Scheff, P.A.; Kaldy, W. Adjusting tapered element oscillating microbalance data for comparison with Federal Reference Method PM2.5 measurements in Region 5. J. Air Waste Manag. Assoc. 2003, 53, 596–607. [Google Scholar] [CrossRef] [PubMed]
  21. Tortajada-Genaro, L.-A.; Borrás, E. Temperature effect of tapered element oscillating microbalance (TEOM) system measuring semi-volatile organic particulate matter. J. Environ. Monit. 2011, 13, 1017–1026. [Google Scholar] [CrossRef] [PubMed]
  22. Hsu, Y.-M.; Wang, X.; Chow, J.C.; Watson, J.G.; Percy, K.E. Collocated comparisons of continuous and filter-based PM2.5 measurements at Fort McMurray, Alberta, Canada. J. Air Waste Manag. Assoc. 2016, 66, 329–339. [Google Scholar] [CrossRef] [PubMed]
  23. Charron, A.; Harrison, R.M.; Moorcroft, S.; Booker, J. Quantitative interpretation of divergence between PM10 and PM2.5 mass measurement by TEOM and gravimetric (Partisol) instruments. Atmos. Environ. 2004, 38, 415–423. [Google Scholar] [CrossRef]
  24. Chow, J.C.; Watson, J.G.; Lowenthal, D.H.; Chen, L.-W.A.; Tropp, R.J.; Park, K.; Magliano, K.A. PM2.5 and PM10 mass measurements in California’s San Joaquin Valley. Aerosol Sci. Technol. 2006, 40, 796–810. [Google Scholar] [CrossRef]
  25. The Office of the Federal Register. 40 CFR Parts 53 and 58: Revisions to Ambient Air Monitoring Regulations—Final Rule; 71 FR 61236-61328; Office of the Federal Register: College Park, MD, USA, 2006.
  26. Sofowote, U.; Su, Y.; Bitzos, M.M.; Munoz, A. Improving the correlations of ambient tapered element oscillating microbalance PM2.5 data and SHARP 5030 Federal Equivalent Method in Ontario: A multiple linear regression analysis. J. Air Waste Manag. Assoc. 2014, 64, 104–114. [Google Scholar] [CrossRef] [PubMed]
  27. Kennedy, J.B.; Neville, A.M. Basic Statistical Methods for Engineers & Scientists, 2nd ed.; Thomas Y. Crowell Company: New York, NY, USA, 1976; ISBN 0-7002-2480-7. [Google Scholar]
Figure 1. Ambient air monitoring stations across Ontario in 2013 (AQHI = Air Quality Health Index).
Atmosphere 09 00191 g001
Figure 2. Frequency distribution of 24 h FRM concentrations from the period of 2013–2016 at the Toronto West station.
Atmosphere 09 00191 g002
Figure 3. Comparison between the 24 h FEM SHARP 5030 and the FRM concentrations at the Toronto West station for all data included (A) and the acceptance limits of slope and intercept for PM2.5 Class III FEM designated by the United States Environmental Protection Agency (U.S. EPA) in various scenarios (B).
Atmosphere 09 00191 g003
Figure 4. Difference percentages between the SHARP 5030 and the FRM concentrations vs FRM concentrations at the Toronto West station (A) and difference percentages in different seasons (B).
Atmosphere 09 00191 g004
Figure 5. Correlations of 24 h PM2.5 concentrations between the SHARP 5030 and the Dichot at five stations, as well as between the SHARP 5030 and the Speciation concentrations at four stations from the period of 2013–2016 (Dichot and Speciation in the figure refer to the Dichot and Speciation samplers).
Atmosphere 09 00191 g005
Figure 6. Annual and seasonal averages of PM2.5 concentrations by the SHARP 5030, Dichot, and Speciation samplers from 2013 to 2016 at four collocated stations (Dichot and Speciation in the figure refer to the Dichot and Speciation samplers).
Atmosphere 09 00191 g006
Figure 7. PM2.5 average concentrations in warm months (May–September) and cold months (October–April) at eight stations.
Atmosphere 09 00191 g007
Figure 8. Annual PM2.5 concentrations for the TEOM, corrected TEOM, and the SHARP from 2003 to 2016 at the Toronto West station.
Atmosphere 09 00191 g008
Table 1. Sampling frequencies of 24 h integrated samplers at six select stations.
Station IDStation NameFRM (Thermo Partisol 2000)FEM Dichot (Thermo Partisol 2025)Speciation Sampler (Met One SASS or Partisol 2300)
12016Windsor WestNA6-day3-day
22071SimcoeNA6-day3-day
29000HamiltonNA6-day3-day
35033Etobicoke SouthNA6-dayNA
35125Toronto West6-dayNANA
51001Ottawa DowntownNA6-day3-day
FRM = Federal Reference Method; FEM = Federal Equivalent Method; SASS = Speciation Air Sampling System; NA = not available.
Table 2. Annual valid data percentages of the Synchronized Hybrid Ambient Real-time Particulate (SHARP) 5030 from 2013 to 2016.
Station IDStation NameValid Data Percentage (%)
2013201420152016
12008Windsor Downtown9698100100
12016Windsor West9510098100
13001Chatham98989798
14064/14110/14111Sarnia1009998100
15020Grand Bend97999899
15026London97989998
16015Port Stanley99939898
18007Tiverton84 a989897
21005Brantford96999999
26060Kitchener98979797
27067St. Catharines95999992
28028Guelph97989898
29000Hamilton Downtown9810010099
29114Hamilton Mountain959998100
29118Hamilton West971009999
31103Toronto Downtown9710010098
33003Toronto East99999998
34020Toronto North999810098
35125Toronto West96999899
44008Burlington999999100
44017Oakville991009599
45026Oshawa99999898
46089Brampton98999998
46108Mississauga98999899
47045Barrie98999999
48006Newmarket1009999100
49005Parry Sound97969898
49010Dorset99989897
51001Ottawa Downtown98989999
51002Ottawa Central99969897
51010Petawawa999997100
52022/52023Kingston96999999
54012Belleville991009699
56010Morrisburg9899NA bNA b
56051Cornwall98999899
59006Peterborough98999997
63203Thunder Bay1009410098
71078Sault Ste. Marie99989699
75010North Bay979898100
77233Sudbury999910099
a Some invalid data at Tiverton station in early 2013 were due to an installation issue. b The Morrisburg station was decommissioned in 2015. NA = not available.
Table 3. Linear regression results of the FEM SHARP 5030 vs the FRM at the Toronto West station.
SlopeInterceptrCountRatio (FEM/FRM)
All data0.921.20.942071.1
20130.911.90.95511.1
20140.822.00.94471.1
20150.980.40.93561.0
20160.900.90.94531.0
Spring0.991.00.94551.1
Summer0.851.20.95491.0
Fall1.1−0.200.92491.1
Winter0.871.70.96541.1
Table 4. Sampling time periods of collocated SHARP 5030 and Tapered Element Oscillating Microbalance (TEOM) monitors at eight select stations.
Station IDStation NameTime Period
14064SarniaJune 2012–December 2015
16015Port StanleyJuly 2012–December 2015
29000Hamilton DowntownJune 2012–December 2015
35033Etobicoke SouthMay 2009–December 2015
35125Toronto WestFebruary 2011–December 2015
51001Ottawa DowntownSeptember 2012–December 2015
56051CornwallJune 2012–December 2015
75010North BayJuly 2012–December 2015

