Microclimate Metrics Linked to the Use and Perception of Public Spaces: The Case of Chillán City, Chile


1
Departamento de Geografía, Universidad de Chile, Portugal 84, Santiago Centro, Santiago 8331051, Chile
2
Instituto de Geografía, Pontificia Universidad Católica de Chile; Vicuña Mackenna 4860, Macul, Santiago 7820436, Chile
3
Associate research CEDEUS & Centro de Cambio Global UC, Santiago 7820436, Chile
*
Author to whom correspondence should be addressed.
Atmosphere 2018, 9(5), 186; https://doi.org/10.3390/atmos9050186
Submission received: 22 March 2018
/
Revised: 3 May 2018
/
Accepted: 7 May 2018
/
Published: 14 May 2018
(This article belongs to the Special Issue Urban Design and City Microclimates)
Abstract
:This paper presents research carried out in the city of Chillán, a medium size city located on the southern limit of the Chilean Mediterranean domain, at 36°36′s south latitude. Chillán provides a good representative example of warm summers in central and southern Chilean cities. Five public spaces were selected, representing different typologies and relating to different urban background conditions. Users in these public spaces were observed, counted and photographed five times a day (12, 14, 16, 18 and 20 h, local time) during a heat wave event in the summer of 2016, while meteorological parameters were measured at different points within the public space. The variables evaluated were impervious surfaces, sky view factor, H/W, azimuth, shadow, and radiation. Local public environmental management should pay attention to the complex relations between urban climate, public spaces and thermal comfort since they affect the quality of life of the most vulnerable sectors of the population. This is particularly important given the increasing episodes of elevated temperatures and intense heat waves which have occurred in the city of Chillán in recent summers, which are related to urban heat islands and climate change.
1. Introduction
Public spaces are significant for the habitability and quality of urban life. Many movements, interactions, contacts, interpersonal relations and diverse activities occur within these spaces. The latter characterizes the functioning and essence of the city [1]. The environmental conditions of public spaces depend on various factors that include regional and local climate parameters (such as latitude, average altitude, continentality, orography, size of the city). At the same time, these factors are modified by the morphological components of the urban environment under the urban canopy layer (UCL), resulting in specific microclimatic conditions [2,3]. Among these parameters are the vegetal cover, impervious surfaces, sky view factor, orientation, and the height-width ratio (H/W). These factors define thermal comfort conditions and, consequently, the use of public spaces.
Urban microclimate is defined as the climate of a specific area where people live, act and suffer the effects of the city’s problems [4], experiencing rapid changes in time and distance, which results from the heterogeneity of the UCL. At this scale, the urban climate may change abruptly within a very short distance, because of the land use (for example residential, industrial, among others), proportion of built space, thermic quality of materials (color and construction material), orientation and slope of the surface, vegetal cover, ground humidity, among other factors [2]. At the microscale level, individual buildings and trees project their shadow and change wind direction; texturized wall coverings affect sunlight reflection and radiant temperatures to which people are exposed [5].
Most microclimatic studies refer to urban canyons, describing their relationship with building design, particularly with respect to height–width ratio and sky view factor. At the same time, thermal comfort in public spaces has attracted scientific attention. The first studies about thermal comfort were focused on instrumental methods, using equations that incorporate objective parameters (temperature and relative humidity of the air, wind or solar radiation). Later on, the studies included user’s degree of satisfaction with local climatic conditions for obtaining thermal comfort [6,7,8,9,10,11,12]. In recent years, research related to other public spaces such as parks, squares, riverside, beaches, etc. has increased significantly.
Even though the urbanization process has been intense in Latin America, microclimatic studies are scarce. A study developed in the city of Buenos Aires, Argentina determined that microclimate differences inside the urban areas depend on height and density of buildings, orientation, and width of streets and presence of parks and trees [13]. Ugeda [14] found that in the city of Jales in Brazil, the northern built slope was always warmer than the southern one. In her study, she also discovered a relationship between uncovered ground and heat and highlighted the importance of rainfall in previous years, because it affects ground humidity and, consequently, vegetation coverage.
A microclimatological perspective is relevant for the city of Chillán, located in central Chile, which presents very high summer temperatures. In the summer 2016–2017, for example, the city registered a maximum temperature of 41.5 °C. Furthermore, like many other cities in Chile, green areas and public spaces are significantly scarce. There are no studies of urban microclimate for the city of Chillán. This research aims to analyze the morphological conditions of five representative public spaces inside the city to evaluate their impact on microclimate and user’s thermal comfort.
2. Materials and Method
Chillán is the capital city of the Ñuble region (recently created in September 2017). It is located at 36°36’ south latitude. Its average altitude is 124 m above sea level (Figure 1). Chillán has a warm temperate climate with winter rains (Cwb), according to the Köppen classification for Chile [15]. The average annual temperature (13.7 °C) corresponds to its latitude. However, its average summer temperature (19.4 °C) and the average of summer maximums (28.4 °C) are similar to those of Arica and Iquique, two cities located in the northern regions of the country.
Chillán has 204,180 inhabitants. According to the classification of the Ministry of Housing and Urbanism, it is a medium-size city. There are few green areas within the urban surface (1.7 square meters per inhabitant). It is under the national average (four square meters per inhabitant). The minimum standard recommended by the World Health Organization (WHO) is nine square meters per inhabitant.
The public spaces selected for this study are Plaza de Armas, Paseo Peatonal Arauco, Parque Estero Las Toscas, Parque Sarita Gajardo and Parque Monumental Bernardo O’Higgins. This study uses a mixed method perspective, which combines quantitative and qualitative methods and data. Quantitative data were obtained by processing satellite images from SENTINEL 2 (5 March 2016) and field data gathering (January and February 2016) through observation and instrumental measurement of climatic and urban variables. Qualitative data comes from a survey administered to selected public spaces users.
The analysis of the urban microclimate considers atmospheric temperature and relative humidity, measured every 10 min. For the above, they used 10 Logtag HAXO-8 (accuracy: 0.1 °C and 0.1% for humidity) and 32 Ibutton Thermochron (accuracy: 0.5 °C) recorders installed in various locations inside the public spaces selected or in their proximities. These parameters were also measured every hour, by meteorological micro-station HOBO data logger RX-3,000, located in the University of Biobío, 800 m west from Parque Estero Las Toscas. This station also registers wind speed and direction as well as global solar radiation (photos in Figure 2 and location in Figure 1).
The solar radiation was calculated in Ecotect software from a 3D model of buildings and trees for each public space. The adjustment parameters to determine radiation in Ecotect were obtained from the weather data file for the city of Chillán, available at www.meteonorm.com. The solar radiation obtained from Ecotect was compared with the results registered by HOBO micro station.
The morphoclimatic description of the selected public spaces considered the following factors: total area and land coverage of each public space, height–width ratio and sky view factor in checkpoints (Figure 3) and building height in the adjacent blocks. The total area was calculated from the layer in ArcGIS; the method of obtaining morphoclimatic parameters for the others is detailed in Table 1.
At the same time, observations were developed from 29 January to 1 February 2016, to count the number of users located under the sun or in shady spots, five times every day (12, 14, 16, 18 and 20 h, local time) in different checkpoints of each public space (points in which the number of users is indicated in Figure 3).
Also, for four days (29 January to 1 February 2016), between 11 and 19 h, a field survey was applied to a sample of men and women over 18 years old, selected at random, to consult them about climate perception.
The method used by Lamarca [10] and Smith & Henriquez [11,12] to determine the user’s perception of urban climate considered the following elements: thermal sensation, solar exposure, wind speed, humidity and general comfort. All the questions included in the survey have an 11-point scale (0–10); values between four and six are considered acceptable for every parameter (Table 2).
A total of 362 surveys were made (Table 3). In average, the 25% of the users observed were consulted, from 12.9% in Paseo Peatonal Arauco to 47.8% in Parque Sarita Gajardo.
3. Results
3.1. Morphoclimatic Description of Selected Public Spaces
Chillán public spaces were classified into seven groups: median strip, soccer field, sports center, stream border, park, square and pedestrian walk. There are 323 public spaces with a total area of 84.2 ha, which amount to 2.8% of the city’s surface. Most public spaces are squares; there are 155, scattered around the city and representing 1.2% of the urban area. Their average area is 0.23 ha, but several of them do not reach 400 square meters. The six city parks have a more significant average area (1.3 ha). Stream borders are related to natural elements of the urban environment. For example, Estero Las Toscas, which gives its name to the homonymous park. There are a considerable number of soccer fields (38). These are located in low and middle-income residential areas and have scarce vegetation cover.
Among the public spaces of Chillán, the biggest green area is Parque Monumental Bernardo O’Higgins (3.4 ha). The second place belongs to Parque Sarita Gajardo (3 ha), which is part of a major project sponsored by the local government. Plaza de Armas covers 1.8 ha. The smallest public spaces are Parque Estero Las Toscas and Paseo Peatonal Arauco, with 1 and 0.6 ha respectively.
3.1.1. Land Cover inside Public Spaces
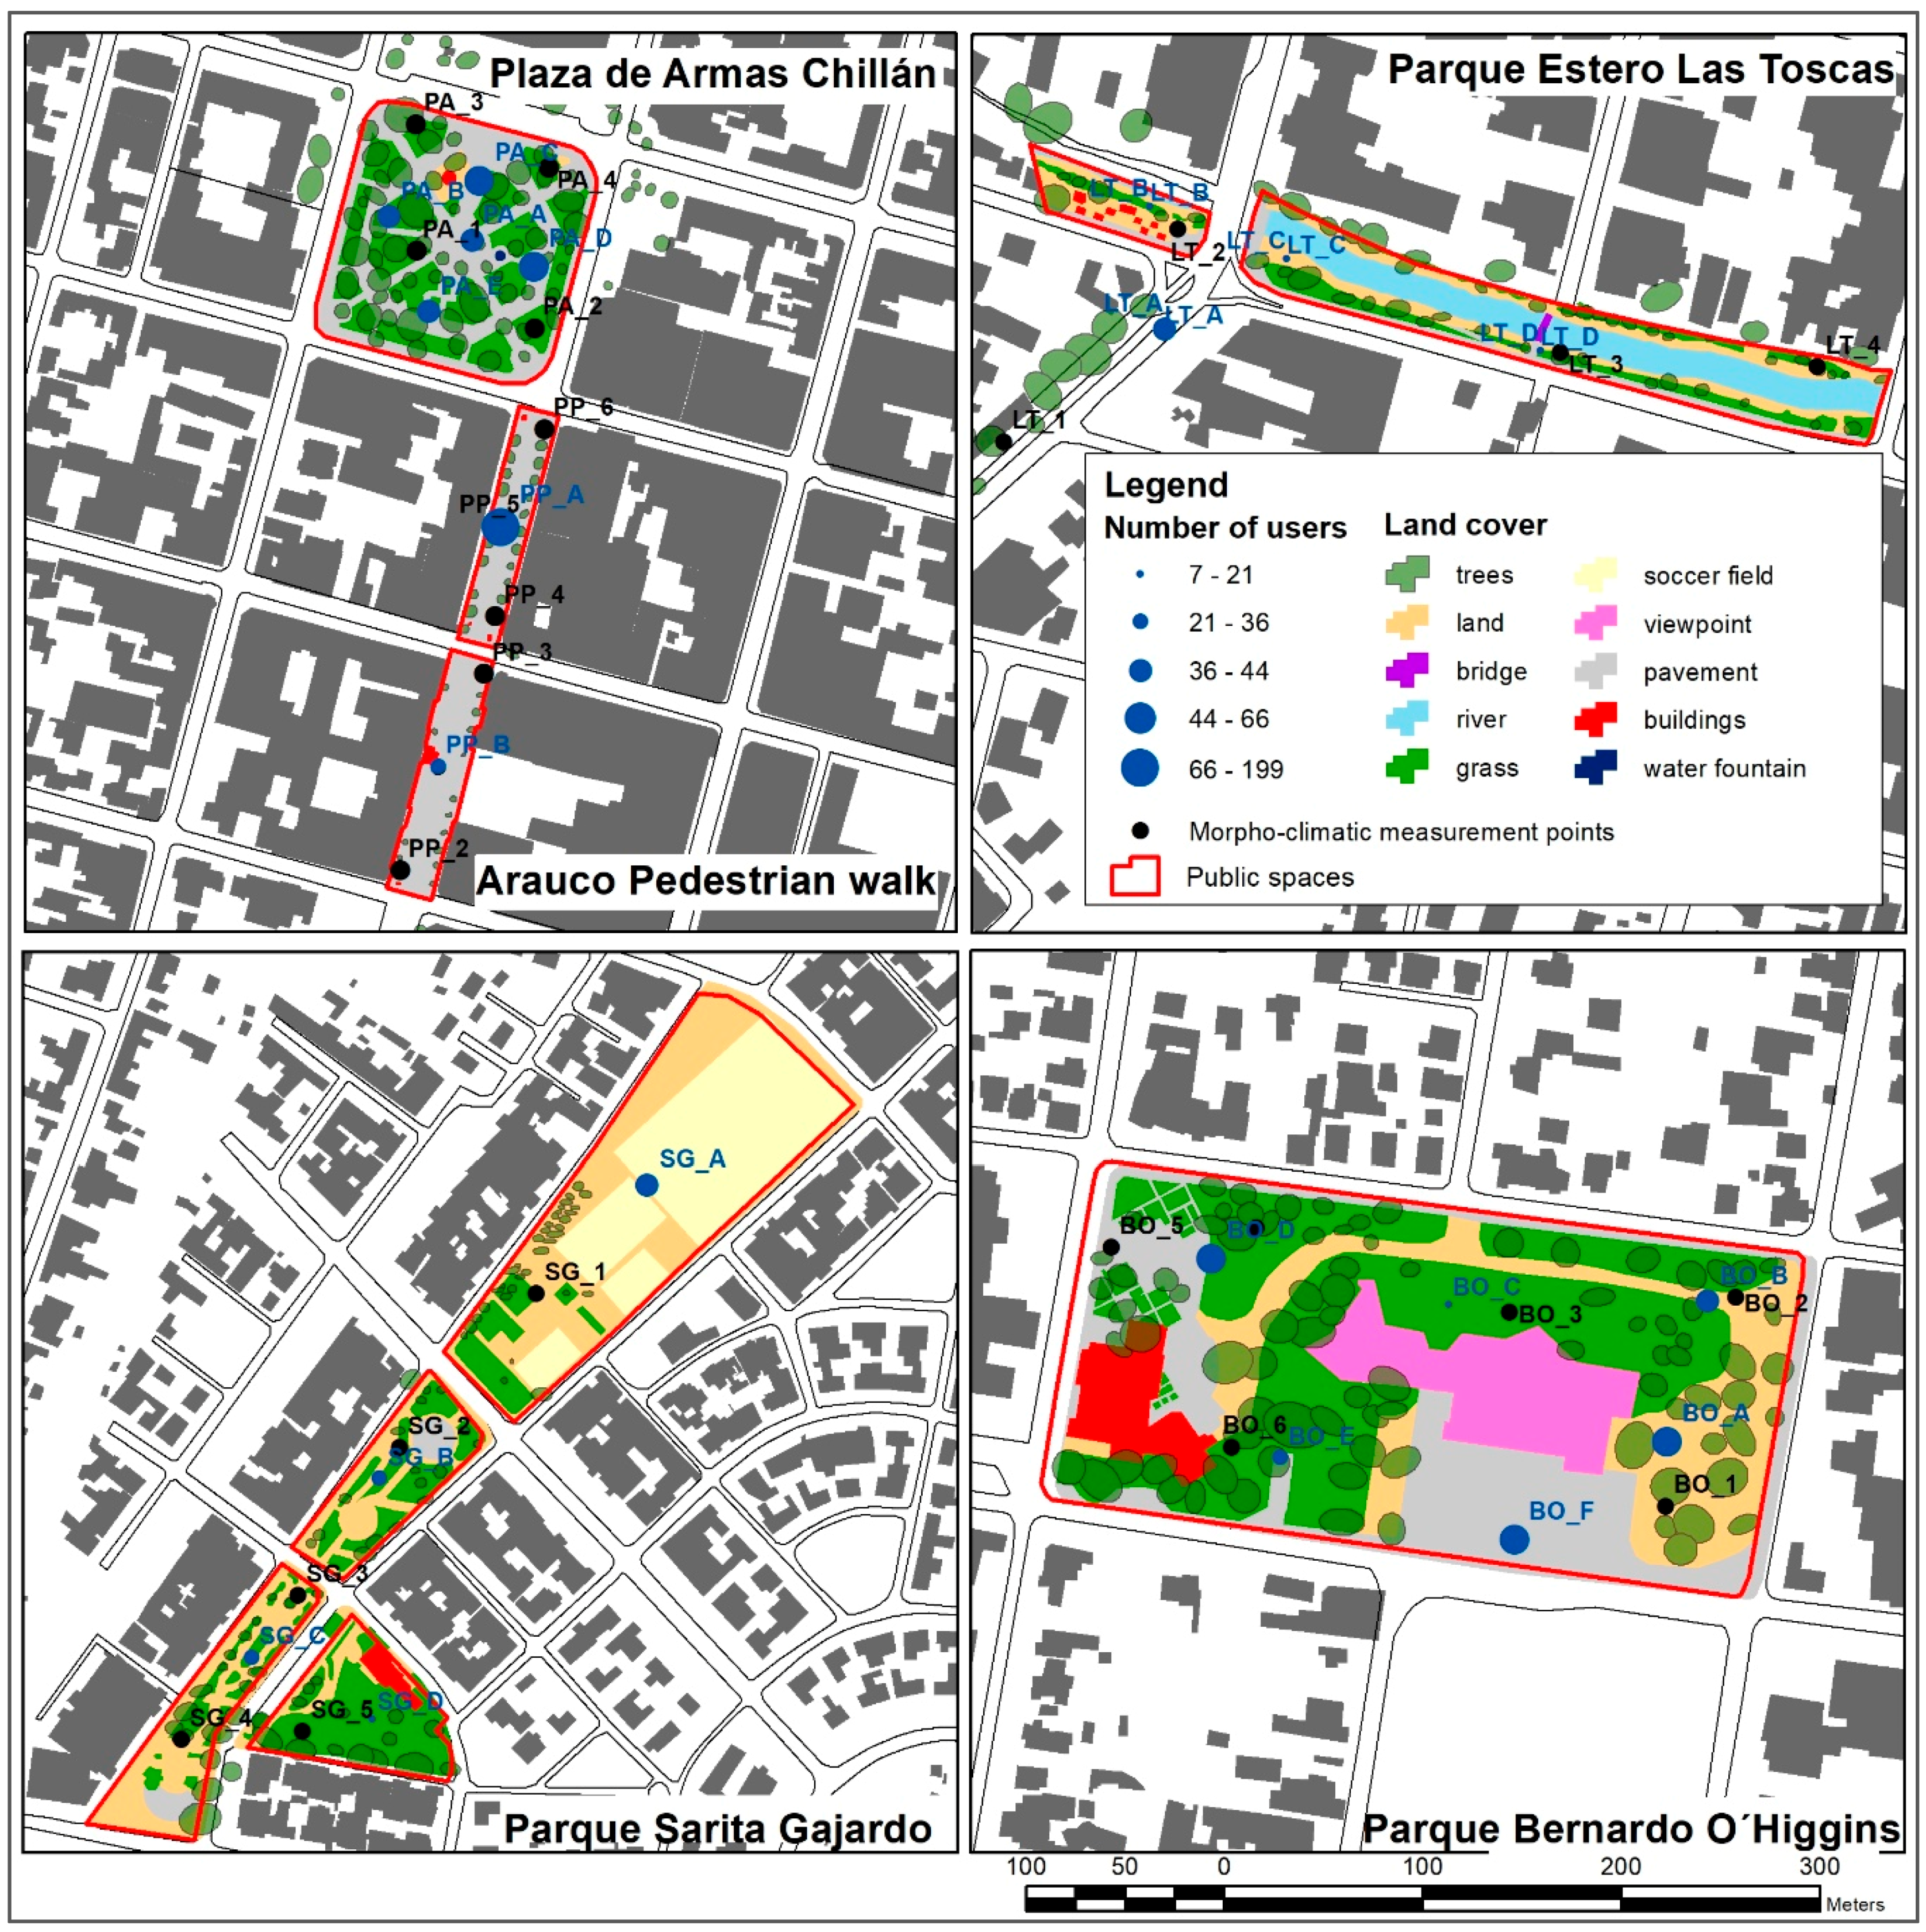
Except for Paseo Peatonal Arauco, 98% of whose area is paved, all public spaces selected in Chillán have green patches covered with grass: 41% Plaza de Armas, 38% Parque Monumental Bernardo O’Higgins, 34% Parque Sarita Gajardo and 20.5% Parque Estero Las Toscas (Figure 3).
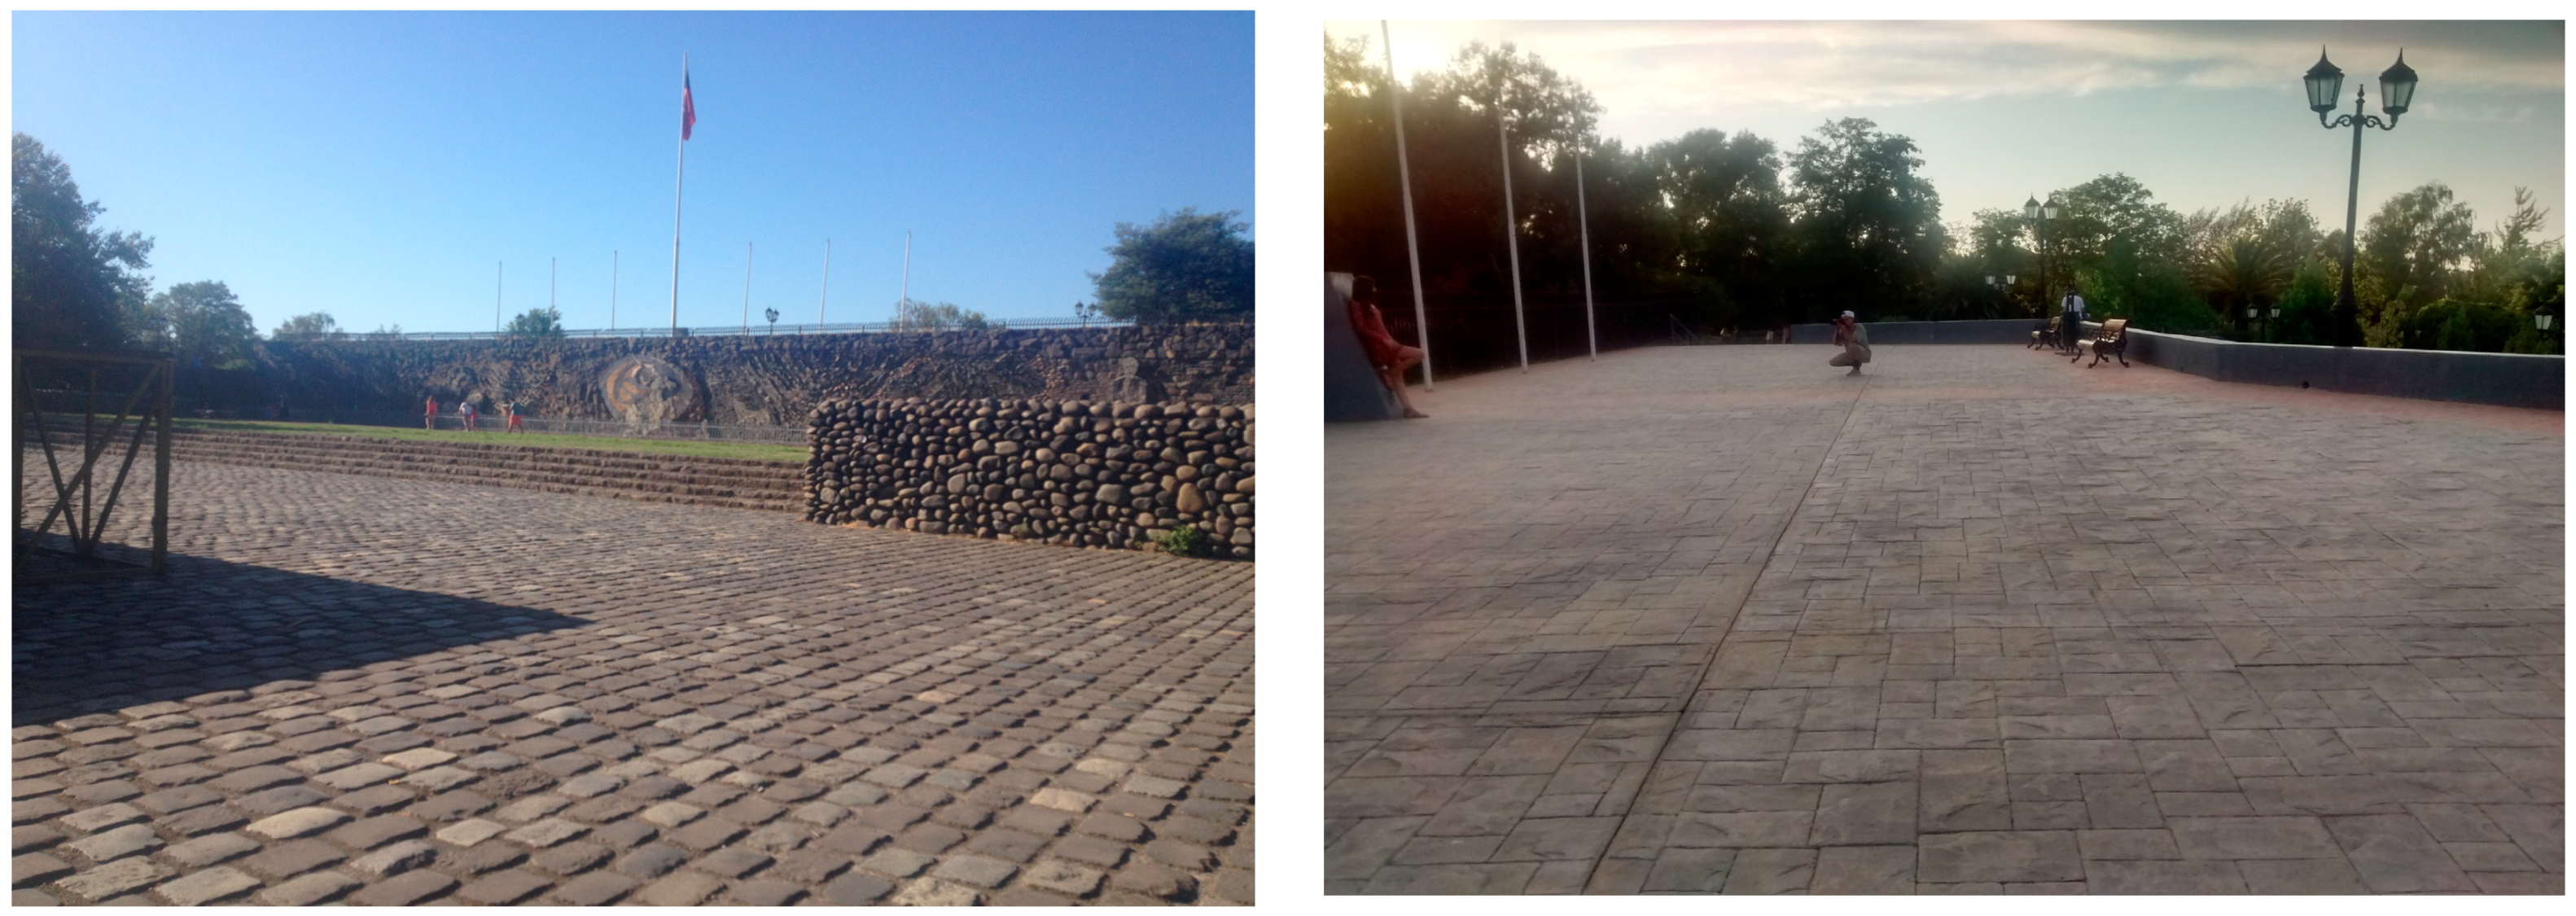
The smallest paved area is in Parque Sarita Gajardo. It represents only 5.4% of the total area, with 3% occupied by two multi-courts. In Parque Monumental Bernardo O’Higgins, the paved area accounts for 38% of its territory, 10% of which is a viewpoint (Figure 4) at six meters high.
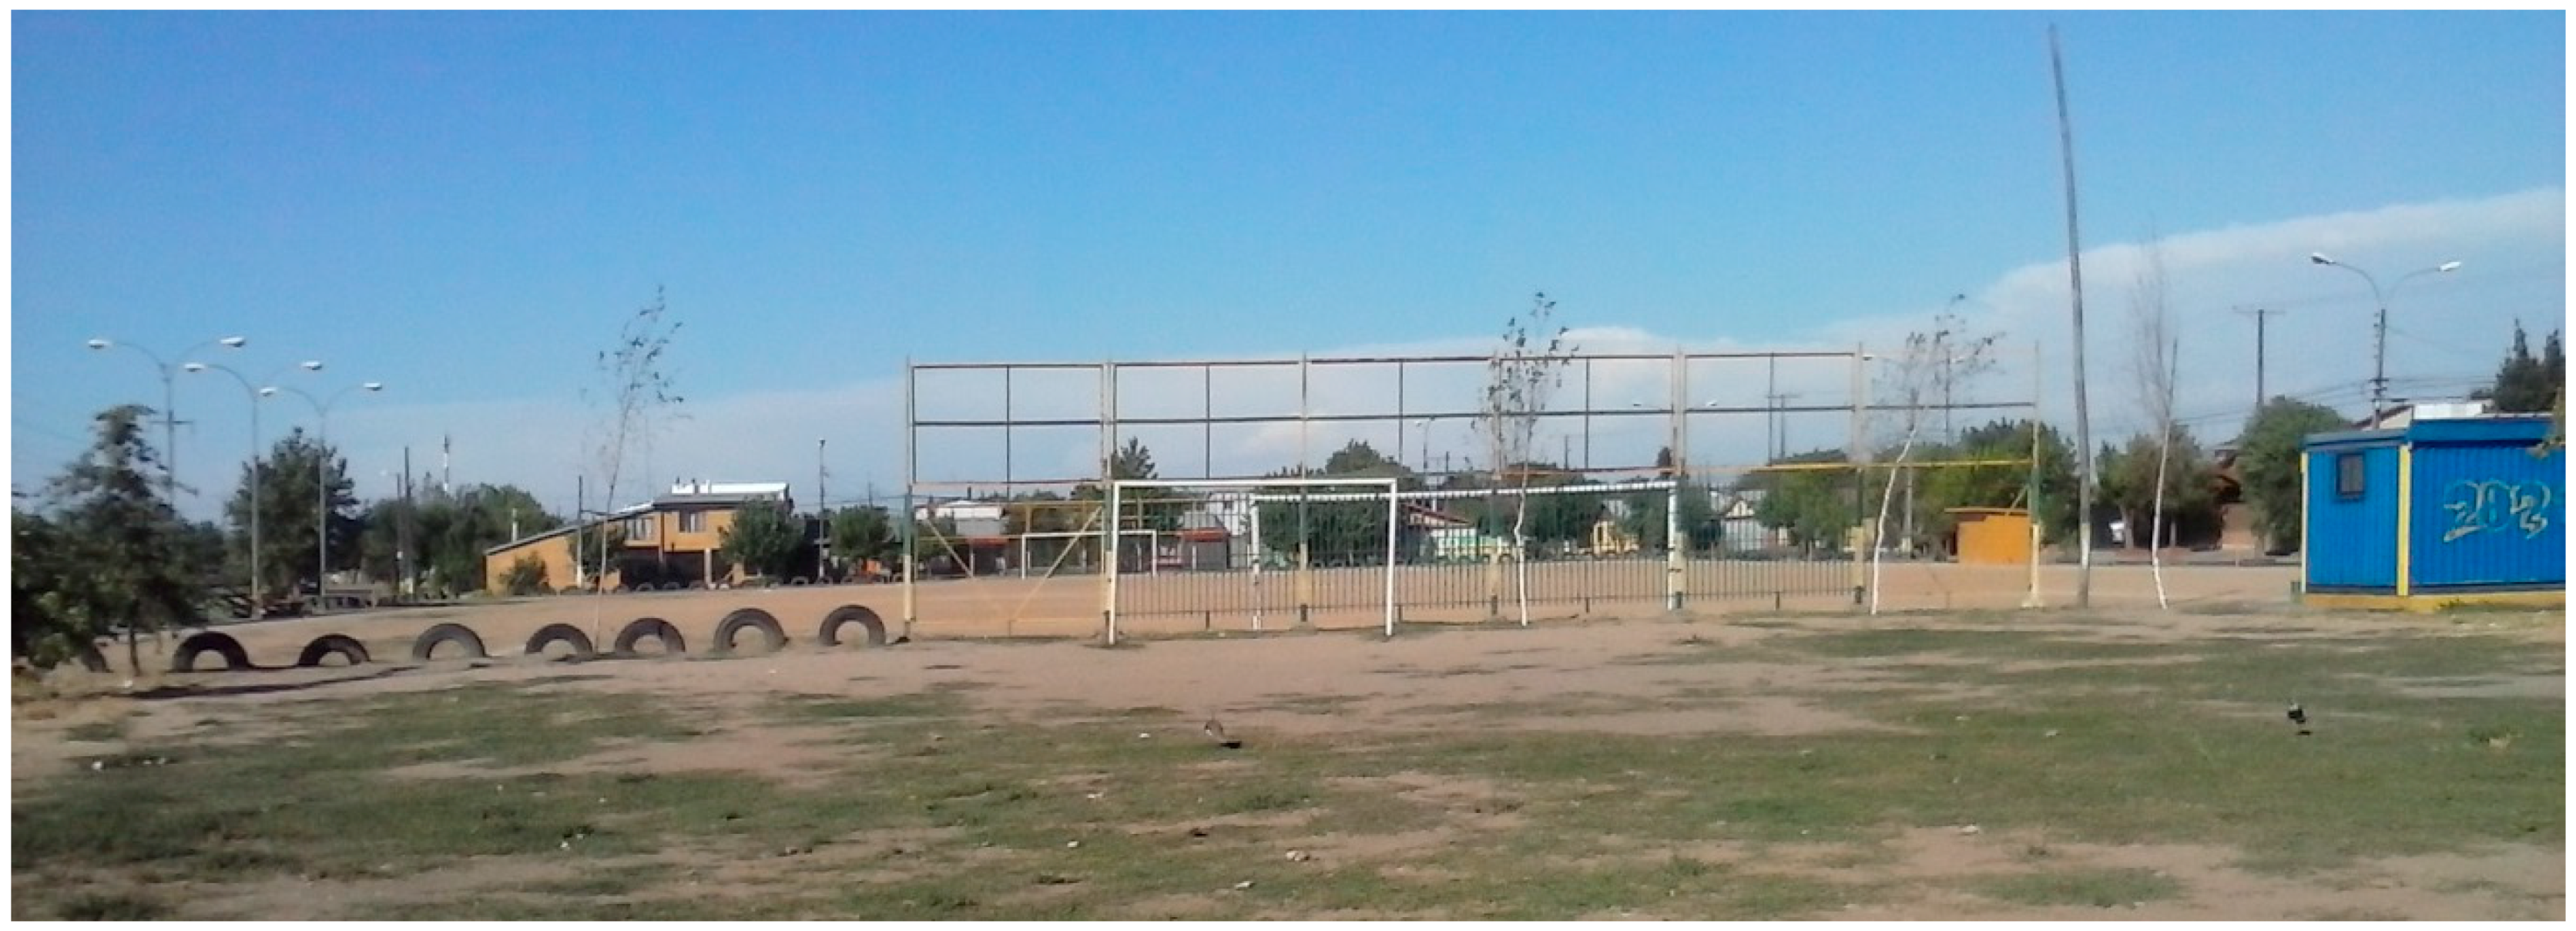
Parque Sarita Gajardo shows the greater area covered by bare ground: 69% of the total surface, 47% of which is occupied by two soccer fields with 6800 and 1500 square meters respectively. Grass in the park is poorly maintained (Figure 5): it is revealed to be a “brown area”.
The presence of water, as well as related objects and activities, was also considered in this study. As expected, the highest abundance of this element is observed in Estero Las Toscas, where the stream channel accounts for 33% of its area. In the other public spaces, water is only available in water fountains or water play zones (Parque Monumental Bernardo O’Higgins) (Figure 6).
All public spaces have built areas, as pergolas (Plaza de Armas), kiosks (Paseo Peatonal Arauco and Parque Estero Las Toscas), warehouses (Parque Sarita Gajardo) or bathrooms (Parque Monumental Bernardo O’Higgins). They all have benches, trashcans, signals and other public furniture.
Trees higher than 1.5 m, as well as treetop cover, were calculated for each public space. The highest number of individual trees is in Parque Sarita Gajardo (85) and Parque Monumental Bernardo O’Higgins (86). On the other hand, the largest treetop cover is in Plaza de Armas (32% of its area).
In the adjacent blocks of the public spaces, the average built surface varies considerably. In three of them, the average of the built surface is over 50% of the total area: Plaza de Armas of Chillán (59.1%), Paseo Peatonal Arauco (57.1%) and Parque Sarita Gajardo (54.6%). In the other two, it is near 30%: Parque Estero Las Toscas (33.7%) and Parque Monumental Bernardo O’Higgins (27.4%).
3.1.2. Buildings Height
Chillán has few high buildings. Low structures prevail in the blocks surrounding the public spaces. The taller buildings are beside Paseo Peatonal Arauco and in front of Plaza de Armas, with 18 and 8 m respectively (Grand Hotel Isabel Riquelme and Governance building). Most buildings around Plaza de Armas are over three floors high. Likewise, buildings surrounding Paseo Peatonal Arauco usually have two or three levels.
There are only three higher buildings in the proximities of these public spaces: two of them have nine levels (27 m), and the third has 18 floors (54 m) and is the highest structure inside the city. These buildings do not change the H/W ratio, but they increase the available shade.
3.1.3. Height–Width (H/W Ratio)
This index affects the percentage of the total space receiving direct solar radiation and the number of hours during which this occurs. When this value tends to 0, there is a higher difference between the height of buildings and the width of the street; hence, the latter are more exposed to solar radiation. Conversely, when this ratio is near 1, height and width are similar, and there is more shadow available (provided by the buildings).
The sites measured in Chillán generally have an H/W under 0.1, which shows an open profile associated with parks and squares (Table 4). The only exception is Paseo Peatonal Arauco, where the street width is smaller than the height of the buildings; therefore, direct solar radiation decreases.
3.1.4. Sky View Factor
Similar to H/W ratio, sky view factor (SVF) also affects direct solar radiation and shadow availability. In the selected public spaces, the average values of this indicator range from 0.51 in Plaza de Armas to 0.747 in Parque Sarita Gajardo (Table 4). Thus, in the first public space mentioned, half of the sky is visible. As this value increases, sky openness also increases and solar radiation is more intense.
Even though this indicator does not show much difference from one public space to another, it varies significantly along each of the selected spaces, except for Parque Sarita Gajardo (Table 4), where it is over 0.7 in all checkpoints. This high value shows great sky openness, due to its width as well as to the surrounding streets.
This indicator is low in three of the selected public spaces: Plaza de Armas (0.37 and 0.38 in checkpoints PA1 and PA3, respectively, Figure 4); Parque Estero Las Toscas (0.39 in checkpoint LT4, Figure 4) and Parque Monumental Bernardo O’Higgins (0.46 in checkpoint BO2, Figure 2). These values are due to the considerable number of trees, which results in less sky visibility. In Paseo Peatonal Arauco, SVF increases when moving away from Plaza de Armas (Table 4); in its second block, it is over 70% (checkpoints PP1, PP2, and PP3 in Figure 4); in the remaining checkpoints (PP4, PP5, and PP6, in Figure 4), the average sky visibility is near 50%.
During summer, shadow availability is a critical factor to increase climate comfort in public spaces. In Chillán, the shadow is provided by the trees inside each public space as well as by buildings in its surroundings.
The analysis of shadow availability in all public spaces shows that the prevailing value is near 30%. In Parque Estero Las Toscas and Parque Sarita Gajardo, the shadow is unavailable in as much as 70% of the total area at any time from 12 to 18 h. The remaining three public spaces have some shadow during daytime: Paseo Peatonal Arauco (30%), Plaza de Armas (14%) and Parque Bernardo O’Higgins (13.5%). Inside the parks, the shadow is related to the presence of trees. Instead, in Paseo Peatonal Arauco, buildings provide it. The first is permeable to solar radiation, which results in higher values for the latter.
3.2. Climatic Descriptions, Summer 2015–2016, and Heat Wave from 30 January to 1 February 2016
Data registered by Chilean Meteorological Service in Bernardo O’Higgins station—located in the rural area surrounding Chillán—shows that, during 30, 31 January and 1 February 2016, there was a heat wave with a peak of 36 °C in the rural sector. This peak is the highest temperature registered that summer by this institution in the entire country. According to the instruments used in this study, temperatures exceeded 38 °C inside the urban area.
During the field survey from 29 January to 1 February 2016, atmospheric temperatures in Plaza de Armas of Chillán ranged from 25 °C to 33 °C, with peak temperatures between 16 and 18 h. Relative humidity reached its minimum value during the afternoon (36%). The four checkpoints located in Plaza de Armas showed comparable results. Similar behavior could be observed in Parque Monumental Bernardo O’Higgins and Parque Estero Las Toscas, where the temperature reached 35 °C.
In Paseo Peatonal Arauco, temperatures fluctuated from 27 °C to 30 °C at 12 o’clock, increasing up to 35 °C at 16 h. The checkpoint PP2 (Figure 7) shows a greater difference with the rest of the measurement points (+2 °C), while humidity differs even 3% from one checkpoint to another at the same time.
In Parque Sarita Gajardo, as well as in the rest of public spaces, the temperature reached its peak between 16 and 18 h. Until 16 h, there are significant differences (2 °C) between the minimum and maximum temperatures registered in the different checkpoints. These differences tend to lessen at 18 h, with the only exception being checkpoint SG5 (Figure 3), located in the playground, which shows higher temperatures. The maximum average register is 36 °C at 20 h; all checkpoints have similar values (near 30 °C).
The meteorological micro-station is installed in a courtyard inside the Biobío university (Campus La Castilla), surrounded by buildings of two and three floors, and with the presence of vegetation (grass and trees), in conditions similar to those of the public spaces studied. As shown in Table 5, average data estimated with the radiation model are quite like those determined by the meteorological micro-station, with a slight difference of 60 W/m2 at noon and only 12 W/m2 in the afternoon.
Global radiation varies significantly inside each public space, particularly in the afternoon hours (17 to 18 h) (Table 4), because of the solar angle and the shadows projected by buildings and trees. During noon, average radiation is near its maximum value and covers larger areas within public spaces. In both time ranges, minimum values cover a small surface.
However, all public spaces show high radiation values between noon and 13 h: the greatest spatial homogeneity for these values is found in Parque Estero Las Toscas and Parque Sarita Gajardo. In the other public spaces, the radiation values show greater diversity, because of the difference between places exposed to solar radiation and shaded sites. Such is the case of higher vegetation in the Plaza de Armas and the Parque Monumental Bernardo O’Higgins or the continuous facade of the buildings flanking the Paseo Peatonal Arauco.
3.3. Urban Climate Perception and its Relationship with Morphoclimatic Parameters
During the morning, the proportion of users who feel thermal comfort and those who feel uncomfortable is quite similar; nevertheless, in the afternoon (12 to 16 h) and the evening, most people declare discomfort, particularly around 18 h when the temperature reaches its peak (38 °C). The individual analysis of each public space selected shows that in Parque Sarita Gajardo, positive thermal perception is near 30% of the sample. In the remaining spaces, it ranges from 10 to 15%. Even though Plaza de Armas has significant vegetation cover, 95% of its users are in discomfort (Figure 8a).
Solar exposure shows similar perceptions. Near 100% of the users surveyed in the Sarita Gajardo and Monumental Bernardo O’Higgins parks say that there is too much sun. In Paseo Peatonal Arauco and Parque Estero Las Toscas, some users enjoy solar exposition, though only 20% of the sample chose values between 4 and 6 (Figure 8b). Only four people chose the option “I want more sun”; two of them in Paseo Peatonal Arauco, one in Plaza de Armas and another in Parque Sarita Gajardo.
Wind is an essential weather agent since it helps to attenuate elevated temperatures. Its intensity is differently perceived by the persons sampled (Figure 8c). Nevertheless, users who perceive that there is little wind and those who feel comfortable with its intensity are very similar in amount. In Plaza de Armas, 60% of the sample chose the option “little wind”. A very small group of users perceived too much wind, particularly during the evening; most of them were visiting Parque Sarita Gajardo, Parque Estero Las Toscas and Parque Bernardo O’Higgins.
During daytime, air humidity registered in the checkpoints located inside the selected public spaces ranges from 45% to 55%. Within the sample, humidity and wind speed show a similar perception. During the afternoon, most people choose the option “too dry”. On the other hand, at noon, this alternative and “comfortable” show equivalent results (Figure 8d). Even though Parque Estero Las Toscas is located in a stream bank, it has the highest proportion of uncomfortable users because of air dryness. In the remaining public spaces, satisfaction with this parameter is approximately 50%.
3.4. Use of Public Spaces and Distribution of Their Users
About 70% of respondents recognize seasonal changes in their use of public spaces. Just over one-third of them suggest the following sequence, in decreasing order: summer–spring–autumn–winter. The options in which the summer season ranks first exceeded 200 respondents, which represents about 60% of the sample. None of the respondents chose the option “does not assist” for the spring–summer seasons.
According to survey results, the majority of respondents in Parque Estero Las Toscas and Parque Monumental Bernardo O’Higgins do not visit them in fall or winter. In the other three public spaces selected, most users choose “once or twice a week”. These results might be explained by the location and function of each public space. Indeed, Paseo Peatonal Arauco and Plaza de Armas are located downtown near the central business district, and Parque Sarita Gajardo is in a mainly residential neighborhood and is equipped for sports practice.
Weather—heat, cold, rain—explain to an extent the seasonal differences in the use of public spaces. In Parque Bernardo O’Higgins, about 90% of the respondents point to the bad weather—cold, rain—as responsible for the few visitors in winter. At the same time, the increase in its users during summer would obey “better climatic conditions”—higher temperatures. Respondents claim that “in summer, it is hotter and people spend more time outdoors”. A visitor in Paseo Peatonal Arauco noted that “in winter, the sole visitors are those who have to pass through the walk“ because “it is colder and darkens earlier”.
Others factors that affect the number of times public spaces are used in winter are the decrease in free time, fewer daylight hours, fewer users and fewer activities.
The observation of visitors complemented the data obtained through the survey. There are significant differences in the flow of users, depending on the social role of each public space. Thus, Plaza de Armas and Paseo Peatonal Arauco receive a greater number of attendants on Monday through Friday. With respect to the latter, the weekend studied constitutes an exception to the above in point A (PP_A in Figure 4), since a folkloric festival took place on Saturday, 30 January, at 19 h. On the other hand, the parks evaluated—Parque Sarita Gajardo and Parque Monumental Bernardo O’Higgins—concentrate their visitors on Saturdays and Sundays (Figure 9).
When relating the comfort perceived by users with the environmental and urban parameters analyzed, a statistically significant direct relationship between comfort and solar radiation (0.67) is obtained, which means that the higher the radiation, the greater the discomfort due to heat. In turn, the radiation is related to the sky visibility factor (0.46) and the height–width ratio (−0.2). Both relations indicate that a greater opening of the sky—caused by fewer obstacles to visibility and a ratio between the height and width of the streets in which the first does not exceed the second—allows the entry of greater solar radiation to the surface.
These parameters also relate to the number of users in each point of the public space. In the case of the height–width ratio, this relationship is direct (0.5): the higher H/W ratio, the greater presence of users. The two remaining factors are inversely related, SVF (−0.21) and solar radiation (−0.3), which means that the greater the radiation caused by a greater opening to the sky, the lower the number of users, as a result of the lower availability of shadows, whether vegetation, buildings or some particular infrastructure produces them.
4. Discussion
The results of the perceived thermal issues showed a positive relationship with air temperature (0.32) and a negative correlation with relative humidity (−0.24). Similar results were founded in Szeged, Hungary by Kántor et al. [17]. A study conducted in Australia showed that activities in outdoor spaces decrease in the thermal threshold between 28 °C and 32 °C [18]. The authors also concluded that those spaces “resistant to heat”, which have, for example, trees with a greater canopy, are more widely used. The results of Sharifi et al. [19] also show that, faced with the lack of measures in the public space to deal with episodes of heat stress, the population prefers to move to air-conditioned enclosures, which in turn increases the energy demand for refrigeration. Likewise, in a study of the city of Freiburg, Germany, it was concluded that the buildings adjacent to public spaces affect the availability of shadows in urban canyons and, in this way, increase the thermal comfort [20].
In the case of the city of Chillán, the availability of shade in the parks is mainly due to the presence of vegetation, whereas in the Paseo Peatonal Arauco it is related to the buildings. Both mechanisms of the provision of shade are very useful to mitigate the temperature of the air when the temperatures exceed the thermal comfort thresholds; however, considering the Mediterranean climate of the city and the cold conditions of winter, it is better to have less shade in this season, allowing the insolation of the urban cover [21]; for example, through the consideration of deciduous vegetation. The above is related to the “right to the sun” proposed by Bitan [22] and by the municipality of Barcelona, in its Urban Ecology Plan, which, among other measures, determines the number of hours entitled to the sun that each city housing [23].
In this sense, it is essential for public spaces to consider climate sensitive urban design (CSUD), which allows access to shade, sun and wind protection [24]. The design paradigms of public spaces considered by urban planning instruments have not been able to incorporate the complexity of urban climates [25], especially in Latin American cities [26]. However, studies developed in Australian urban areas propose the application of CSUD and incorporation of water and vegetation as measures to mitigate heat to improve the thermal comfort conditions of outdoor public spaces [27].
Local Management of Public Spaces and Urban Climate
Chillán has no local public policy regarding climate comfort and public spaces within the city. Municipal development plans and environmental ordinances of Chillán and Chillán Viejo—which make up the city—do not include this matter either. There are, however, some references in its urban planning instruments. Although both municipalities have valid communal regulatory plans (PRC in Spanish)—Chillán Viejo since 2012 and Chillán since 2016 [28,29]—they do not provide guidelines for the articulation of public spaces and existing green areas. The PRC set criteria for the density of occupancy and maximum building heights, which can affect the urban microclimate. Likewise, they determine the location of public spaces and green areas, as well as the allowed or forbidden uses in each of the different zones defined by them.
The density of land occupation and building height directly affect the degrees of sky openness and the availability of shade and, therefore, the thermal comfort of public spaces. There is a gap between the allowed construction density in the areas where the selected public spaces are located and the current characteristics of the neighboring blocks; thus, presenting a wide margin for increasing densities. For example, the regulatory plan of the commune of Chillán allows a coefficient of 1—that is to say, 100% of the land can be built upon—for areas surrounding Plaza de Armas and Paseo Peatonal Arauco, and the current average coefficients amount to 60%.
Seemingly, there is a gap between maximum heights allowed and current building heights. The prevalence of low structures could be explained by the higher costs involved in building high structures in a country with strong seismicity. The PRC of Chillán Viejo allows maximum heights ranging from 14 m in the mixed-use zone (commercial and residential area) to 20 m in the mixed-use zone. However, current structures on the blocks surrounding Parque Monumental Bernardo O’Higgins do not rise over five meters. At present, Chillán is a low-rise city. If its structures rose to the permitted maximum, the height-to-width ratio (H/W) and the sky visibility factor (SVF) would be modified.
The modification in the H/W and the SVF would cause a decrease in direct solar radiation and might favor comfort in public spaces during the summer. Nevertheless, it would have adverse effects on temperature and comfort in winter. Therefore, the increase in vegetation (particularly deciduous vegetal species) is the best alternative to modify sky visibility and cool the city in summer.
Likewise, at the national level, there are no explicit guidelines to improve micro-climatic conditions in public outdoor spaces. The National Urban Development Policy [30] includes, in the area of social integration, two objectives regarding this matter. One seeks to “ensure equal access to urban public goods”, and the other refers to the articulation of public spaces, by the interconnection of parks and green areas, generating tours and circuits, both at the neighborhood and city scale.
Furthermore, the document “The Human Dimension in Public Space. Recommendations for Analysis and Design” of the Ministry of Housing and Urbanism (MINVU in Spanish) [31], recently published by the Program for Public Spaces of the Ministry of Housing and Urban Development, provides 80 design guidelines for public spaces. It declares that “the functionality of public space, its dimensions, climatic comfort, and activities have a greater weight in the experience of its visitors than the formal characteristics typically privileged by many architects. The shape of the space must be subject to comfort and human activities, not the other way around”.
Finally, it is worth mentioning the Adapting Cities Plan to Climate Change [32], which has recently concluded a citizenship consultation process. The plan is focused on the risks involved in climate change at national level. The concept of urban climate is absent and, hence, the concern for temperature is restricted to the events of heat and cold waves, which are usually recorded by meteorological stations installed outside the urban limits, such as the station Bernardo O’Higgins in Chillán. It is essential that planning instruments consider urban climatology to understand the necessary relationships between the characteristics of planning, urban design, and climate, which, in turn, affect thermal comfort and climate quality in each sector of the city.
5. Conclusions
The city of Chillán has few green public areas whose combined cover only amounts to 1.7 m2 per inhabitant. Also, it has an urban morphology of low height and is little wooded, which allows greater insolation of open areas, affecting the climate quality of public spaces, especially during hot summers and episodes of heat waves, such as those observed in recent years. Paseo Peatonal Arauco revealed the worst comfort conditions since it is an impervious urban canyon with very little shade.
The distribution of users in each public space throughout the day depends on its social function and the availability of sun and shade. The largest number of users were observed in the evening from 18 h onwards, when temperature decreased, and shade availability increased. In contrast, visitors in Arauco walkway and Plaza de Armas were distributed more homogeneously during the day, since these spaces are associated with commercial activities and various city services. In all cases, around 75% of users looked for the shade. The city has high-density neighborhoods and few vegetated public spaces. Consequently, parks have become the only option for facing extreme heat events (residential air cooling systems are still relatively uncommon).
Local public environmental management should pay attention to the complex relations between urban climate, public spaces and thermal comfort that directly affect the quality of people’s lives. This is particularly important given the increasing episodes of high temperatures and intense heat waves which have occurred in the city of Chillán in recent summers, which are related to urban heat islands and climate change.
Planning and urban design proposals to improve comfort and climatic quality in public spaces are crucial elements. Some examples include measures such as planting more trees, particularly deciduous species, temporary/seasonal shading devices such as umbrellas, and installing some water features for urban users of squares and parks. Undertaking actions adjusted to local climate will result in a better quality of life for the population and more sustainable cities.
Author Contributions
The article shows the results of the doctoral research of P.S. P.S. conceived, designed and wrote the first draft of the article, and reviewed and edited the final version. C.H. led the overall research and reviewed and edited the first and final draft.
Acknowledgments
The contribution of eight students from the University of Biobío, who were indispensable for the realization of surveys and fieldwork, is gratefully acknowledged. Likewise, the help provided by Cristóbal Lamarca in the calculation of global radiation is highly appreciated. This research had the support of National Commission for Scientific and Technological Research (CONICYT) of Chile through its programs: National Doctoral Scholarship, FONDECYT Project Nº 1130305 and the CONICYT/FONDAP CEDEUS Center Nº 15110020. We gratefully thank the peer-reviewers for their valuable comments and suggestions.
Conflicts of Interest
The authors declare no conflict of interest.
References
- Bettini, V. Elementos de Ecología Urbana; Traducción M. Peinado Lorca. con la colaboración de L. G. García; Colección Estructuras y Procesos: Madrid, Spain, 1998. [Google Scholar]
- Ochoa de la Torre, J. Ciudad Vegetación e Impacto Climático; El confort en los Espacios Urbanos; Erasmus Ediciones: Barcelona, Spain, 2009; 184p. [Google Scholar]
- Oke, T. The distinction between canopy and boundary layer urban heat island. Atmosphere 2010, 14, 266–277. [Google Scholar]
- Gómez, N.; Ferrer, M. Microclimatic study of the space between buildings. Case: Urban housing developments, Maracaibo (Venezuela). Rev. Téc. Fac. Ing. Univ. Zulia 2010, 33, 223–234. [Google Scholar]
- Erell, E.; Pearlmutter, D.; Williamson, T. Urban Microclimate: Designing the Spaces between Buildings; Earthscan: London, UK, 2011. [Google Scholar]
- Nikolopoulou, M.; Lykoudis, S. Use of outdoor spaces and microclimate in a Mediterranean urban area. Build. Environ. 2007, 42, 3691–3707. [Google Scholar] [CrossRef]
- Nikolopoulou, M. Outdoor thermal comfort. Front. Biosci. 2011, S3, 1552–1568. [Google Scholar] [CrossRef]
- Guzmán, F.; Ochoa de la Torre, J. Confort térmico en los espacios públicos urbanos. Clima cálido y frío semi-seco. Rev. Hábitat Sustent. 2014, 4, 52–63. [Google Scholar]
- Zeng, Y.; Dong, L. Thermal human biometeorological conditions and subjective thermal sensation in pedestrian streets in Chengdu, China. Int. J. Biometeorol. 2015, 59, 99–108. [Google Scholar] [CrossRef] [PubMed]
- Lamarca, C.; Qüense, J.; Henríquez, H. Thermal comfort and urban canyons morphology in coastal temperate climate, Concepción, Chile. Urban Clim. 2016, 23, 159–172. [Google Scholar] [CrossRef]
- Smith, P.; Henríquez, C. Perception of Thermal Comfort in Public Spaces in the City of Chillán (Chile) During a Warm Summer. Int. J. Biometeorol. 2018. accepted. [Google Scholar]
- Smith, P.; Lamarca, C.; Henríquez, C. A comparative study of thermal comfort in public spaces in the cities of Concepción and Chillán, Chile. In Urban Climate in Latin-American Cities; Henríquez, C., Romero, H., Eds.; Springer Nature: Dordrecht, The Netherlands, 2018; Chapter 6. [Google Scholar]
- De Schiller, S.; Evans, J.M.; Katzschner, L. Isla de Calor, Microclima Urbano y Variables de Diseño Estudios en Buenos Aires y Río Gallegos. Rev. Avermas 2001, 5, 1–45. [Google Scholar]
- Ugeda, J. Correlacao Entre a Temperatura da Superficie e Temperatura do ar na Cidade de Jales/SP. In Climatologia Urbana e Regional, Cuestiones Teóricas y Estudios de Caso; de Costa Trindade, M.S., e Ana Monteiro, J.L.S.N., Eds.; Geografía en Movimiento: Sao Paulo, Brasil, 2013; pp. 221–246. [Google Scholar]
- Sarricolea, P.; Herrera-Ossandon, M.; Meseguer-Ruiz, Ó. Climatic regionalization of continental Chile. J. Maps 2017, 13, 66–73. [Google Scholar] [CrossRef]
- Cheng, V. Urban Climatic Map and Standards for Wind Environment Feasibility Study. In Methodologies and Findings of User’s Wind Comfort Level Survey; The Hong Kong University of Science and Technology, Ed.; Chinese University: Hong Kong, China, 2008. [Google Scholar]
- Kántor, N.; Égerházi, L.; Unger, J. Subjective estimation of thermal environment in recreational urban spaces—Part 1: Investigations in Szeged, Hungary. Int. J. Biometeorol. 2012, 56, 1075–1088. [Google Scholar] [CrossRef] [PubMed]
- Sharifi, W.E.; Boland, J. Heat resilience in public space and its applications in healthy and low carbon cities. Procedia Eng. 2017, 180, 944–954. [Google Scholar] [CrossRef]
- Sharifi, E.; Sivam, A.; Boland, J. Spatial and activity preferences during heat stress conditions in Adelaide: Towards increased adaptation capacity of the built environment. Procedia Eng. 2017, 180, 955–965. [Google Scholar] [CrossRef]
- Ali-Toudert, F.; Mayer, H. Thermal comfort in an east west oriented street canyon in Freiburg (Germany) under hot summer conditions. Theor. Appl. Climatol. 2007, 87, 223–237. [Google Scholar] [CrossRef]
- Salvati, A.; Coch Roura, H.; Cacere, C. Assessing the urban heat island and its energy impact on residential buildings in Mediterranean climate: Barcelona case study. Energy Build. 2017, 146, 38–54. [Google Scholar] [CrossRef]
- Bitan, A. The high climatic quality city of the future. Atmos. Environ. 1992, 26, 313–329. [Google Scholar] [CrossRef]
- Martin-Vide, J.; Montlleó, M.; Sanromá, I. Barcelona: Urban Heat Islands. In Cities and Climate Change. Urban Heat Islands; Terrin, J.J., Ed.; Editions Parenthèses: Marseille, France, 2016; pp. 38–57. [Google Scholar]
- Wilson, E.; Nicol, F.; Nanayakkara, L.; Ueberjahn-Tritta, A. Public Urban Open Space and Human Thermal Comfort: The Implications of Alternative Climate Change and Socio-economic Scenarios. J. Environ. Policy Plan. 2007, 10, 31–45. [Google Scholar] [CrossRef]
- Mills, G.; Cleugh, H.; Emmanuel, R.; Endlicher, W.; Erell, E.; McGranahan, G.; Steemer, K. Climate information for improved planning and management of mega cities (Needs Perspective). Procedia Environ. Sci. 2010, 1, 228–246. [Google Scholar] [CrossRef] [Green Version]
- Henríquez, C.; Romero, H. (Eds.) Urban Climate in Latin-American Cities; Springer Nature: Dordrecht, The Netherlands, 2018; accepted. [Google Scholar]
- Coutts, A.; Tapper, N.; Beringer, J.; Loughnan, M.; Demuzere, M. Watering our cities: The capacity for Water Sensitive Urban Design to support urban cooling and improve human thermal comfort in the Australian context. Prog. Phys. Geogr. 2012, 37, 2–28. [Google Scholar] [CrossRef]
- Plan Regulador Comunal de Chillán Viejo; Ilustre Municipalidad de Chillán Viejo: Chillán, Chile, 2012; 49p.
- Ilustre Municipalidad de Chillán. Ordenanza Local Plan Regulador Comunal de Chillán; Chillán Viejo: Chillán, Chile, 2016; 49p. [Google Scholar]
- Ministerio de Vivienda y Urbanismo. Hacia una Nueva Política Urbana para Chile. In Ciudades Sustentables y Calidad de Vida; Giménez, P., Ugarte, J.R., Eds.; Ministerio de Vivienda y Urbanismo: Santiago, Chile, 2014. [Google Scholar]
- Ministerio de Vivienda y Urbanismo (MINVU). La Dimensión Humana en el Espacio Público: Recomendaciones Para el Análisis y el Diseño; Serie Espacios Públicos Urbanos; MINVU, PNUD and Gehl: Santiago, Chile, 2017; 84p. [Google Scholar]
- Ministerio de Medio Ambiente. Plan de Adaptación al Cambio Climático Para Ciudades, Etapa de Consulta Entre el 24/07 y el 10/10 de 2017; Ministerio de Medio Ambiente: Santiago, Chile, 2017. [Google Scholar]
Figure 1.
Study area.

Figure 2.
Meteorological instrument installations. Note: (a) Logtag recorder; (b) Logtag recorder installation in the box; (c) Ibutton data logger; and (d) meteorological micro-station HOBO.
Figure 2.
Meteorological instrument installations. Note: (a) Logtag recorder; (b) Logtag recorder installation in the box; (c) Ibutton data logger; and (d) meteorological micro-station HOBO.
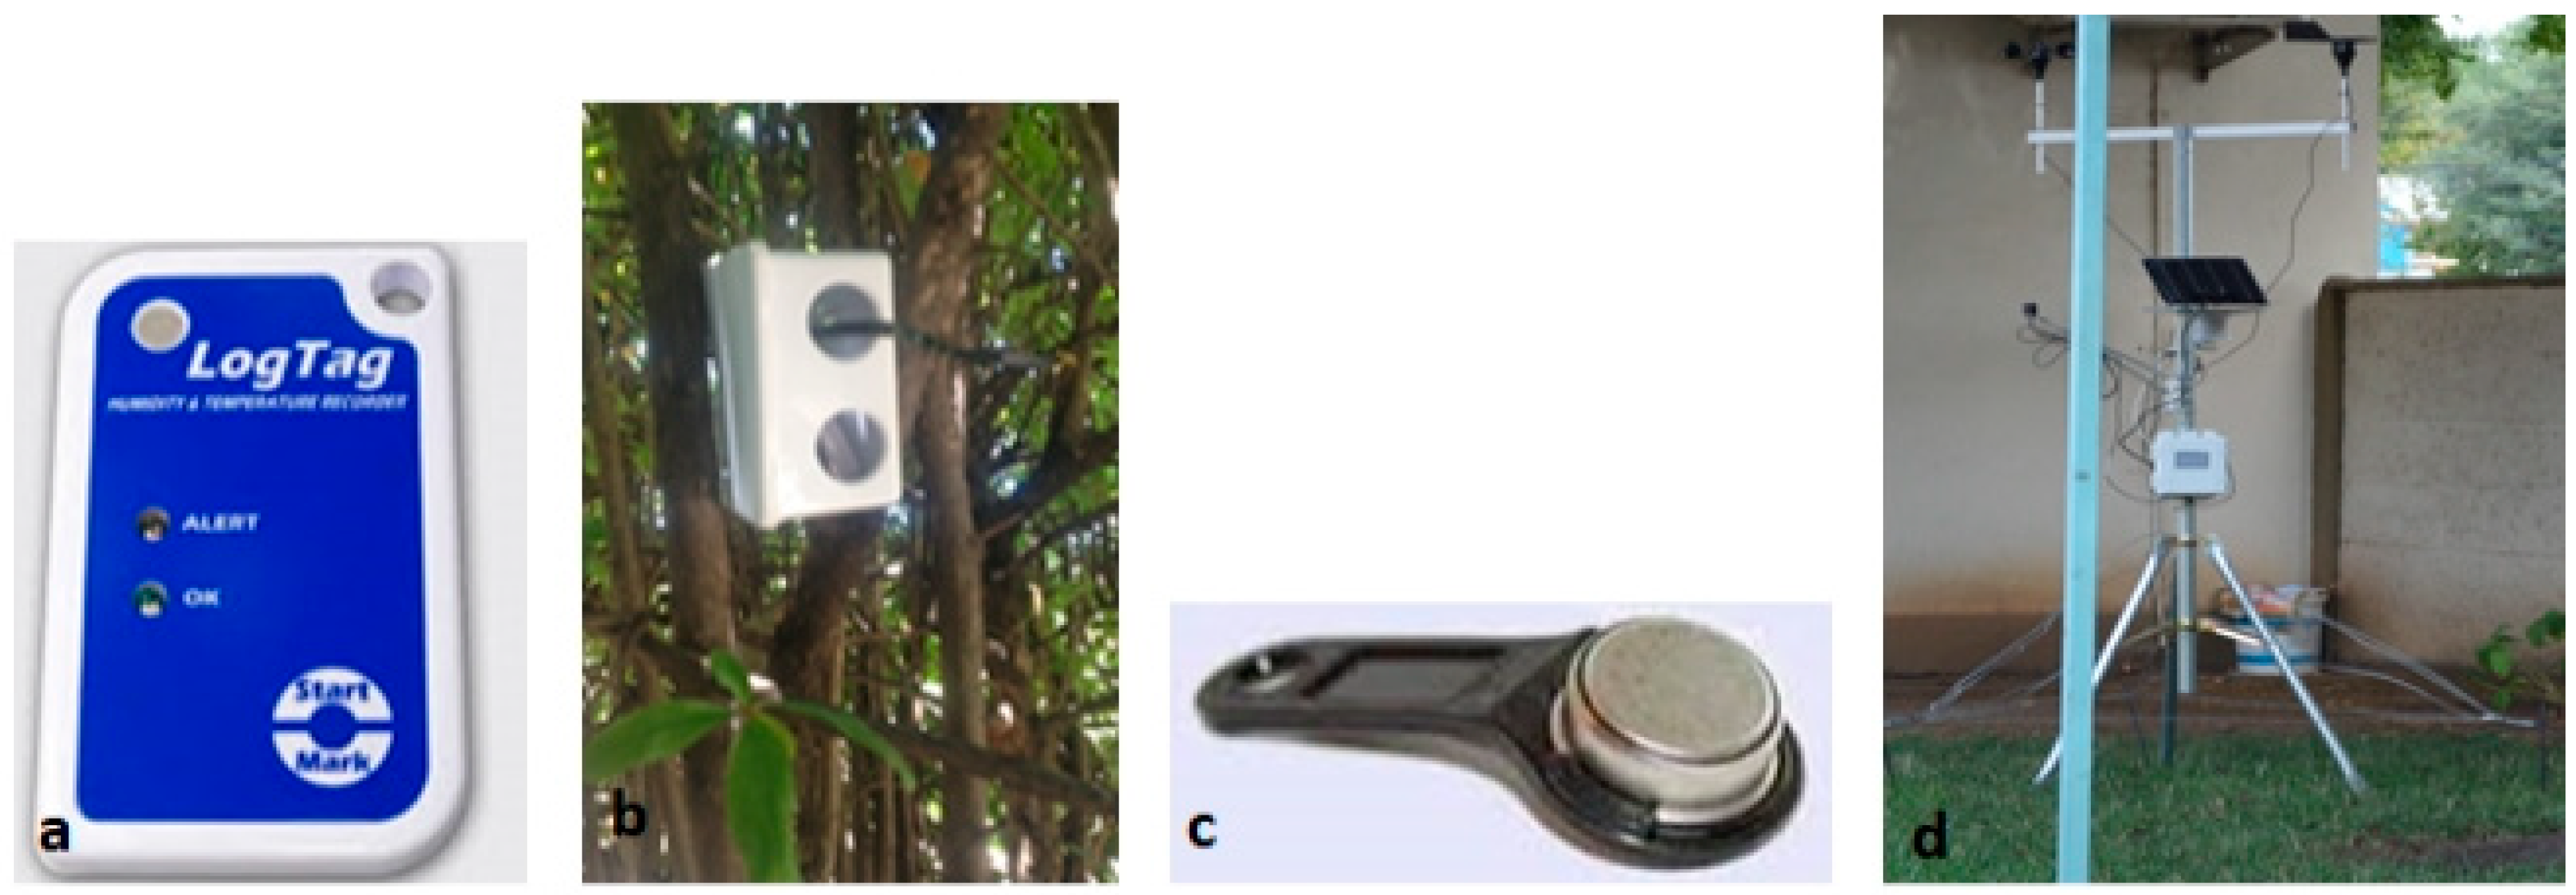
Figure 3.
Land cover in selected public spaces. Note: each of the visitor’s observation points is indicated in Figure 3, using a different prefix for each public space: Plaza de Armas (PA), Paseo Peatonal Arauco (PP), Parque Estero Las Toscas (LT), Parque Sarita Gajardo (SG) and Parque Monumental Bernardo O’Higgins (BO).

Figure 4.
Viewpoint Parque Monumental Bernardo O’Higgins. Source: personal archive.

Figure 5.
Soccer field Parque Sarita Gajardo. Source: personal archive.

Figure 6.
Water play zones in Parque Monumental Bernardo O’Higgins. Source: personal archive.
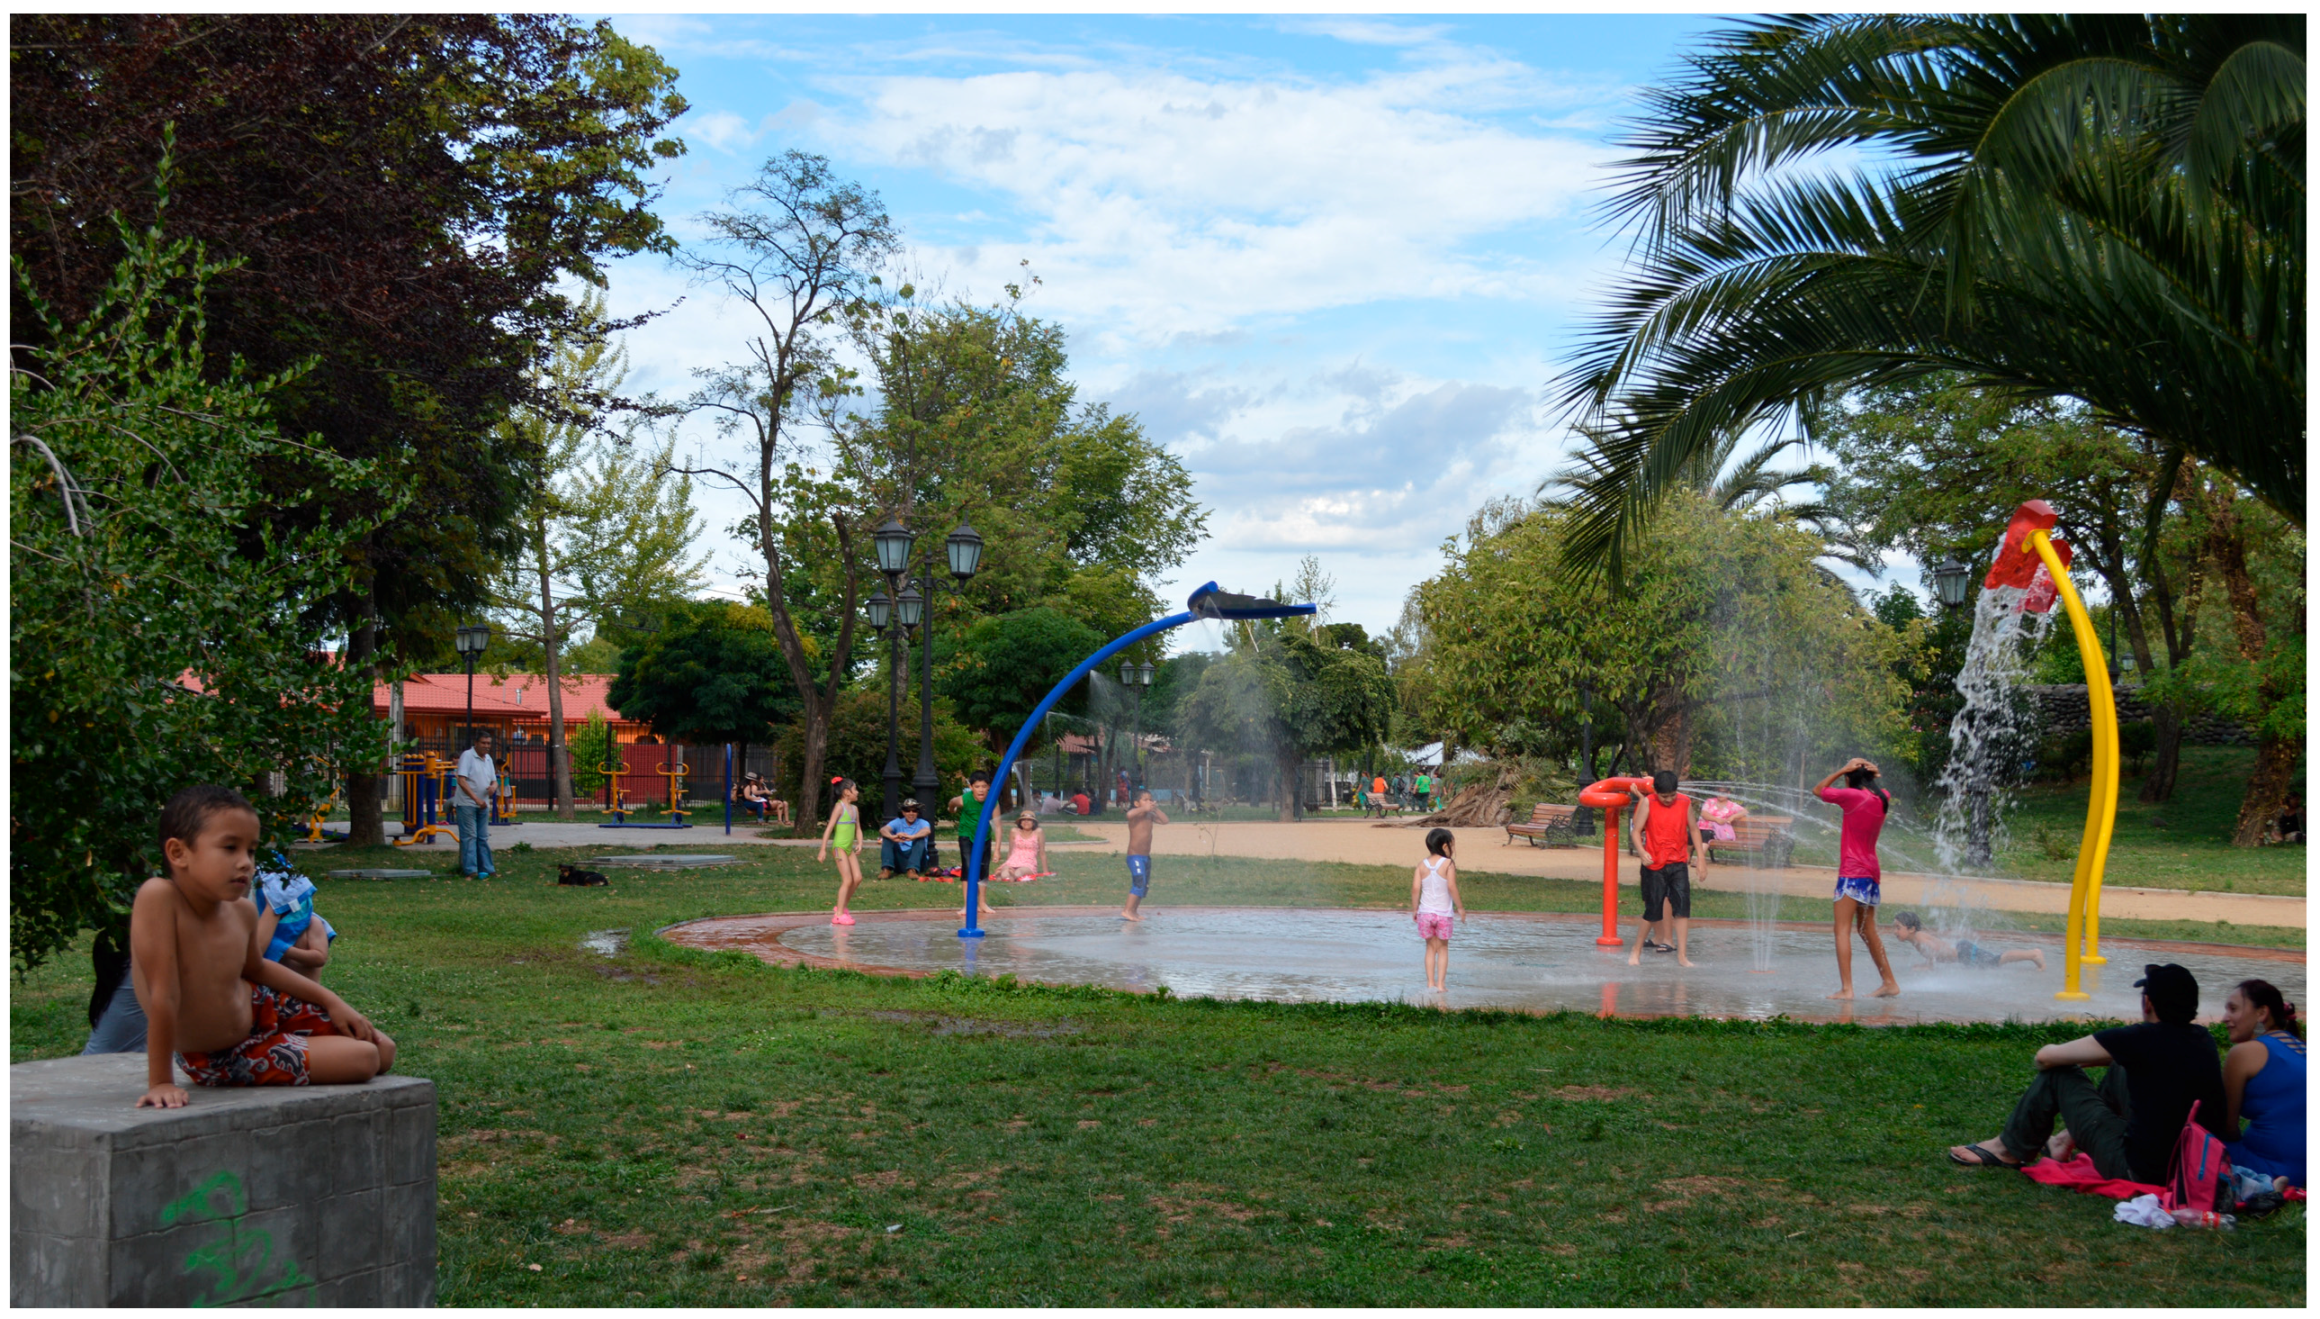
Figure 7.
Playground Parque Sarita Gajardo. Source: personal archive.

Figure 8.
Urban climate perception.
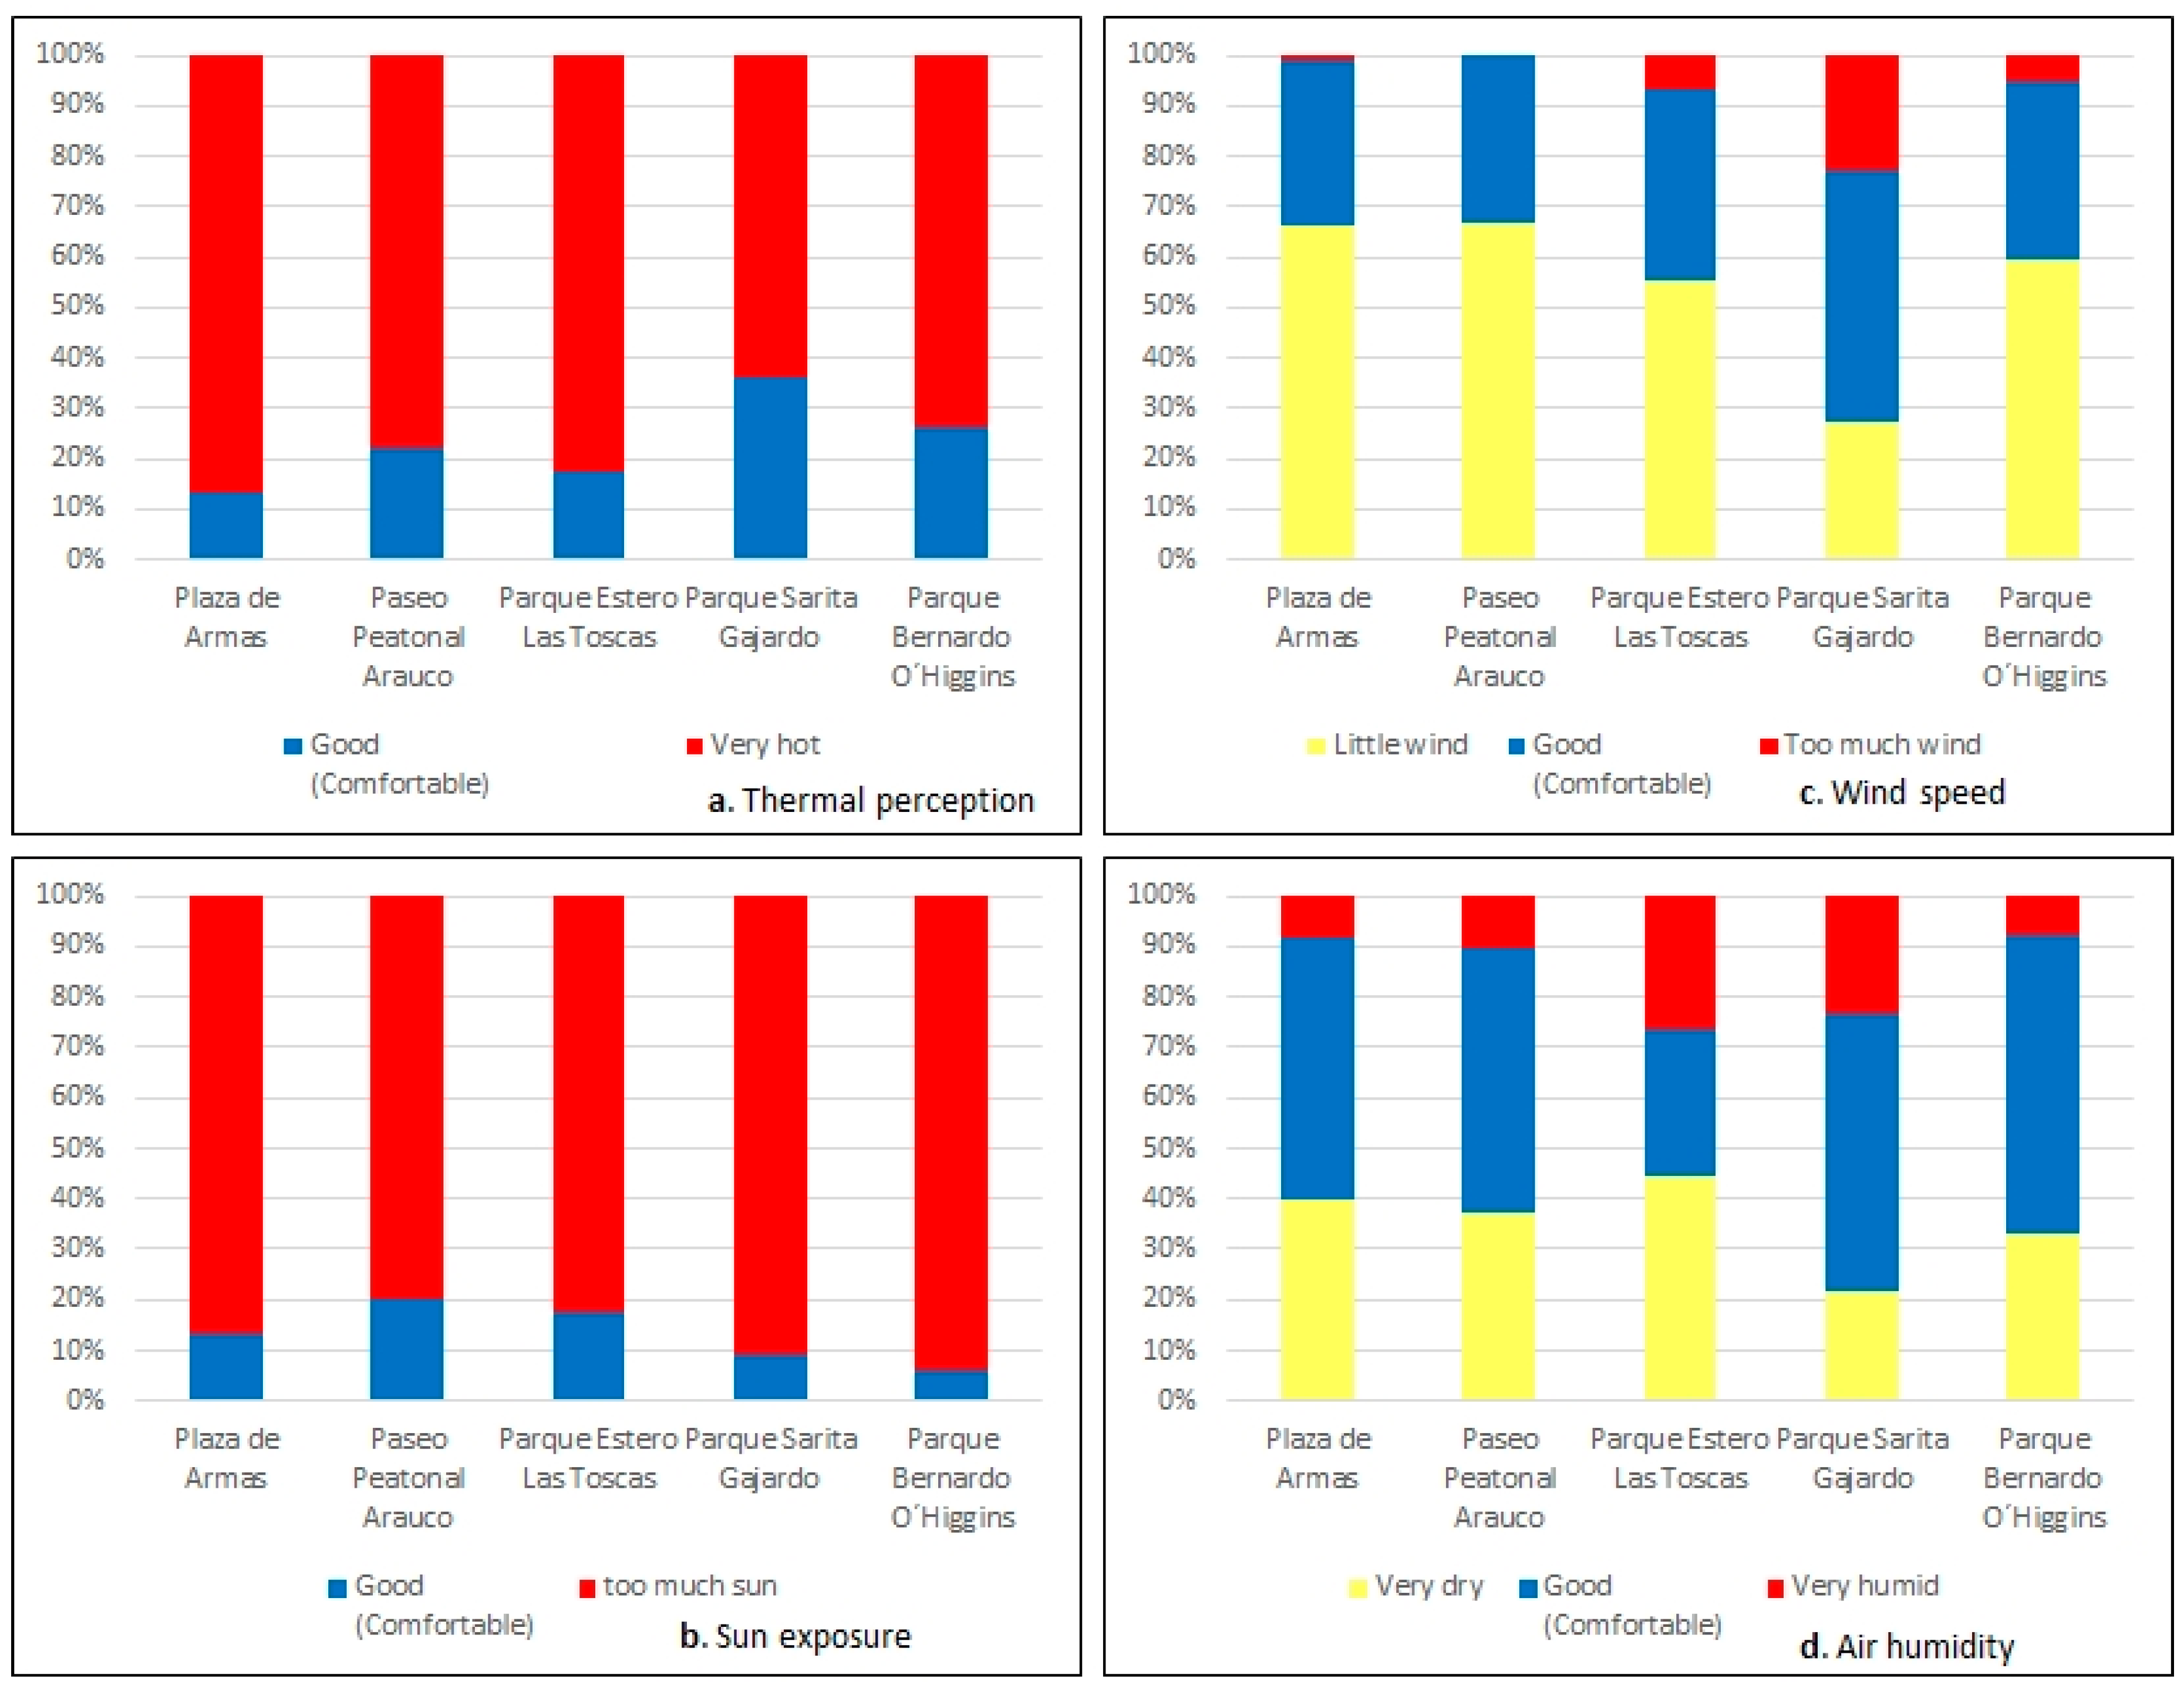
Figure 9.
Frequency of users according to the moment of the week (business days/weekend) during the field survey (from 29 January to 1 February 2016).
Figure 9.
Frequency of users according to the moment of the week (business days/weekend) during the field survey (from 29 January to 1 February 2016).


Table 1.
Morphoclimatic parameters of selected public spaces.
| Parameters | Method |
|---|---|
| Land cover | Recognition of land cover inside public spaces on a QuickBird mosaic image of the Google Earth program, from December 2016, and then validated in field work in January 2017 |
| Building height | This was obtained from the individualization of the buildings available in the coverage provided by the National Institute of Statistics. Then, each construction was assigned an estimated height, according to the number of floors observed in the land. An average height of three meters per level was determined, according to the construction regulations |
| Height-width ratio | This index expresses the ratio between the height of the buildings (H) and the width of the street (W). The width of the streets was measure in the Ecotect software from the information of blocks of the National Institute of Statistics for the year 2015 |
| Sky view factor | This index calculates the percentage of opening or closing of the streets towards the sky, on a scale from 0 to 1, where 1 represents an entirely open space and 0 a completely closed space. Modeling obtained this factor in the Autodesk Ecotect Analysis program based on the 3D model of the buildings, trees and any obstacle that could affect the visibility of the sky |
Table 2.
Ranges of user’s climate perception.
| Parameter | 0 | 1 | 2 | 3 | 4 | 5 | 6 | 7 | 8 | 9 | 10 |
|---|---|---|---|---|---|---|---|---|---|---|---|
| Thermal perception | Very cold | Good (Comfortable) | Very hot | ||||||||
| Sun exposure | I want more sun | Too much sun | |||||||||
| Wind speed | Little wind | Too much wind | |||||||||
| Air humidity | Very dry | Very humid | |||||||||
| Thermal comfort | Cold, very uncomfortable | Hot, very uncomfortable | |||||||||
Source: Adapted from Cheng [16].
Table 3.
User’s field survey.
| January, Friday 29 | January, Saturday 30 | January, Sunday 31 | February, Monday 1 | Total | ||||||
|---|---|---|---|---|---|---|---|---|---|---|
| Public space | N.U.O. | N.U.S. | N.O.U. | N.U.S. | N.O.U. | N.U.S. | N.O.U. | N.U.S. | N.O.U. | N.U.S. |
| Plaza de Armas | 255 | 21 | 122 | 26 | 121 | 39 | 186 | 35 | 684 | 121 |
| Paseo Peatonal Arauco | 153 | 21 | 100 | 17 | 37 | 17 | 267 | 17 | 557 | 72 |
| Estero Las Toscas | 80 | 4 | 62 | 9 | 54 | 16 | 92 | 17 | 288 | 46 |
| Parque Sara Gajardo | 25 | 15 | 20 | 11 | 24 | 10 | 23 | 8 | 92 | 44 |
| Parque Bernardo O’Higgins | 50 | 20 | 55 | 14 | 89 | 21 | 43 | 24 | 237 | 79 |
Note: N.U.O. is a number of users observed, and N.U.S. is a number of users surveyed.
Table 4.
Morphoclimatic parameters and perceived thermal comfort in each checkpoint. SVF: sky view factor; HW: height–width ratio.
Table 4.
Morphoclimatic parameters and perceived thermal comfort in each checkpoint. SVF: sky view factor; HW: height–width ratio.
| Public Space | Checkpoint | SVF | H/W | Solar Radiation (12 to 13 PM) (Wm2) | Solar Radiation (5 to 6 PM (Wm2) | Perceived Thermal Comfort (Average) |
|---|---|---|---|---|---|---|
| Plaza de Armas | PA1 | 0.382 | 0.056 | 226.18 | 80.24 | 7.6 |
| PA2 | 0.648 | 0.056 | 371.57 | 300.95 | 7.3 | |
| PA3 | 0.367 | 0.056 | 266.22 | 88.69 | 7.9 | |
| PA4 | 0.646 | 0.043 | 375.27 | 127.37 | 8.1 | |
| Paseo Peatonal Arauco | PP1 | 0.756 | 0.221 | 398.51 | 310.5 | 7.7 |
| PP2 | 0.738 | 0.232 | 395.47 | 309.43 | 8 | |
| PP3 | 0.437 | 0.236 | 296.77 | 232.13 | 7.6 | |
| PP4 | 0.485 | 0.222 | 334.75 | 113 | 7.8 | |
| PP5 | 0.563 | 0.434 | 352.2 | 119.19 | 8.7 | |
| Parque Estero Las Toscas | LT1 | 0.175 | 0.128 | 139.62 | 224.41 | 7.5 |
| LT2 | 0.723 | 0.130 | 385.37 | 305.84 | 7.7 | |
| LT3 | 0.823 | 0.073 | 405.44 | 312.96 | 8.3 | |
| LT4 | 0.388 | 0.068 | 232.84 | 275.48 | 8.3 | |
| Parque Sarita Gajardo | SG1 | 0.812 | 0.039 | 404.69 | 312.69 | 7.2 |
| SG2 | 0.813 | 0.053 | 403.47 | 312.26 | 8.3 | |
| SG3 | 0.79 | 0.033 | 401.62 | 136.72 | 7.9 | |
| SG4 | 0.559 | 0.105 | 334.22 | 287.69 | 7.4 | |
| SG5 | 0.696 | 0.088 | 382.37 | 304.78 | 7 | |
| Parque Monumental Bernardo O’Higgins | BO1 | 0.799 | 0.018 | 400.19 | 311.1 | 7.9 |
| BO2 | 0.461 | 0.020 | 250.32 | 263.68 | 8 | |
| BO3 | 0.801 | 0.078 | 402.7 | 311.99 | 8.3 | |
| BO4 | 0.541 | 0.020 | 337.94 | 245.29 | 8.2 | |
| BO5 | 0.632 | 0.041 | 372.84 | 126.51 | 8.7 | |
| BO6 | 0.591 | 0.056 | 357.81 | 121.18 | 7.7 |
Table 5.
Comparison of global radiation (in W/m2) estimated and measured in Campus La Castilla.
| Estimated Data (30 January 2016) | Measured Data (30 January 2016) | ||
|---|---|---|---|
| 12 to 13 h | 17 to 18 h | 12 to 13 h | 17 to 18 h |
| 403.8 | 312.4 | 462.5 | 325 |
Source: Constructed by the authors using data gathered by Ecotect and by the meteorological micro-station located in Campus Castilla, University of Biobío.
© 2018 by the authors. Licensee MDPI, Basel, Switzerland. This article is an open access article distributed under the terms and conditions of the Creative Commons Attribution (CC BY) license (http://creativecommons.org/licenses/by/4.0/).
Share and Cite
MDPI and ACS Style
Smith, P.; Henríquez, C. Microclimate Metrics Linked to the Use and Perception of Public Spaces: The Case of Chillán City, Chile. Atmosphere 2018, 9, 186. https://doi.org/10.3390/atmos9050186
AMA Style
Smith P, Henríquez C. Microclimate Metrics Linked to the Use and Perception of Public Spaces: The Case of Chillán City, Chile. Atmosphere. 2018; 9(5):186. https://doi.org/10.3390/atmos9050186
Chicago/Turabian StyleSmith, Pamela, and Cristián Henríquez. 2018. "Microclimate Metrics Linked to the Use and Perception of Public Spaces: The Case of Chillán City, Chile" Atmosphere 9, no. 5: 186. https://doi.org/10.3390/atmos9050186
Note that from the first issue of 2016, this journal uses article numbers instead of page numbers. See further details here.