Article

Lidar Measurements of Dust Aerosols during Three Field Campaigns in 2010, 2011 and 2012 over Northwestern China

Key Laboratory for Semi-Arid Climate Change of the Ministry of Education, College of Atmospheric Sciences, Lanzhou University, Lanzhou 730000, China
*
Author to whom correspondence should be addressed.
Atmosphere 2018, 9(5), 173; https://doi.org/10.3390/atmos9050173
Submission received: 19 February 2018 / Revised: 30 April 2018 / Accepted: 3 May 2018 / Published: 5 May 2018
(This article belongs to the Special Issue Aerosol Optical Properties: Models, Methods & Measurements)

Abstract

:
Ground-based measurements were carried out during field campaigns in April–June of 2010, 2011 and 2012 over northwestern China at Minqin, the Semi-Arid Climate and Environment Observatory of Lanzhou University (SACOL) and Dunhuang. In this study, three dust cases were examined, and the statistical results of dust occurrence, along with physical and optical properties, were analyzed. The results show that both lofted dust layers and near-surface dust layers were characterized by extinction coefficients of 0.25–1.05 km−1 and high particle depolarization ratios (PDRs) of 0.25–0.40 at 527 nm wavelength. During the three campaigns, the frequencies of dust occurrence retrieved from the lidar observations were all higher than 88%, and the highest frequency was in April. The vertical distributions revealed that the maximum height of dust layers typically reached 7.8–9 km or higher. The high intensity of dust layers mostly occurred within the planetary boundary layer (PBL). The monthly averaged PDRs decreased from April to June, which implies a dust load reduction. A comparison of the relationship between the aerosol optical depth at 500 nm (AOD500) and the Angstrom exponent at 440–870 nm (AE440–870) confirms that there is a more complex mixture of dust aerosols with other types of aerosols when the effects of human activities become significant.

1. Introduction

Mineral dust, as a major component of atmospheric aerosols, has a strong impact on the atmosphere [1,2,3,4,5,6]. It affects the radiation budget of the earth’s atmosphere by scattering and absorbing solar radiation, alters cloud characteristics by acting as cloud condensation nuclei or ice nuclei and heats up the surrounding environment [4,6,7,8,9]. The Taklimakan and Gobi Deserts in southern Mongolia and northern China are two major active sources of East Asian dust. The lofted dust plumes from these sources, which are affected by terrain and prevailing mid-latitude westerlies in late winter and spring, can be transported over long ranges [7,10,11,12,13,14,15,16,17,18], influencing the air quality, human health and climate/meteorological patterns, etc. along the transport pathway [19]. Therefore, mineral dust is a key player in the earth’s system.
Many studies have reported that the sign and magnitude of radiative forcing by dust aerosols rely greatly on accurate and reliable knowledge of the loading, optical properties, temporal-spatial distribution, and microphysical and chemical characteristics of dust aerosols [4,8,20,21]. However, accurately estimating the effects of these factors on radiative forcing by dust aerosols is very difficult due to their complexity and variability. Given this, more advanced instrumentation and greater numbers of measurements are needed in order to decrease the uncertainties of these estimations. We know that radiative forcing by dust aerosols is very sensitive to their vertical structure [22,23,24]. With the help of dust-sensitive instrumentation such as lidar, greater insight into the vertical structure of dust aerosols can be obtained. Polarization-function lidar instruments are highly sensitive to the particle shape, produce a signal that increases with the degree of particle nonsphericity and easily detect the faintest traces of dust [25]. Therefore, dust aerosol profiling using sophisticated and continuous observations by ground-based lidar instruments are required in order to better understand dust storm motions, the temporal-spatial distribution and their effects on the radiation budget, as well as cloud and precipitation development [26].
Until now, to the best of our knowledge, only a few campaigns have been performed in order to characterize dust aerosols using ground-based lidar measurements over northwestern China. In the summer of 2002, dust particles exhibiting a high depolarization ratio in the free troposphere were measured using lidar equipment at Dunhuang [27,28]. In Aksu (northwestern Taklimakan Desert), a large amount of dust particles was uplifted: the removal process was observed during the whole dust event via polarization-sensitive lidar [29,30], and the dust layer structure was validated via Cloud-Aerosol Lidar with Orthogonal Polarization (CALIOP) [31] and ground-based lidar [32]. The temporal-spatial distribution of the aerosol extinction coefficient was retrieved via micropulse lidar (MPL) from September 2008 to August 2009 at the oasis city Kashgar in the western Taklimakan Desert [33]. The characteristics of the vertical profiles and the long-range transport of the dust were measured over the Loess Plateau using the MPL system [34,35]. These field campaigns enriched the dataset and enabled the exploration of the properties of dust aerosols over this region. Nevertheless, knowledge of the properties of dust aerosols retrieved from ground-based lidar is still insufficient over this region. Several aspects have yet to be prioritized: none of these studies distinguished dust aerosols from the total aerosol load using lidar; the characteristics of the temporal-spatial variations in dust aerosols, especially in their vertical structure, during the dust season are still poorly described; and few of these studies have taken into account the differences and similarities in the properties of dust aerosols observed by lidar at multiple sites over this region. Carefully evaluating these aspects using dust aerosol profiling can provide more accurate and reliable knowledge of dust aerosols and can improve the simulation ability of models over this region. Therefore, more detailed analysis is urgently needed.
This study aimed to characterize the temporal-spatial distribution of the physical and optical properties of dust aerosols at three sites over northwestern China and to explore their differences and similarities; for this purpose, we used data from three field campaigns in 2010, 2011 and 2012 conducted at Minqin, the Semi-Arid Climate and Environment Observatory of Lanzhou University (SACOL) and Dunhuang. The remainder of our paper is structured as follows. The measurement sites, the lidar system and sun photometer used, other auxiliary data, and the lidar data evaluation are described in Section 2. An overview of the lidar observations, three dust event case studies, and statistics for comparing the dust occurrence frequencies and optical properties at three sites are found in Section 3. A short summary follows in Section 4.

2. Observations and Methods

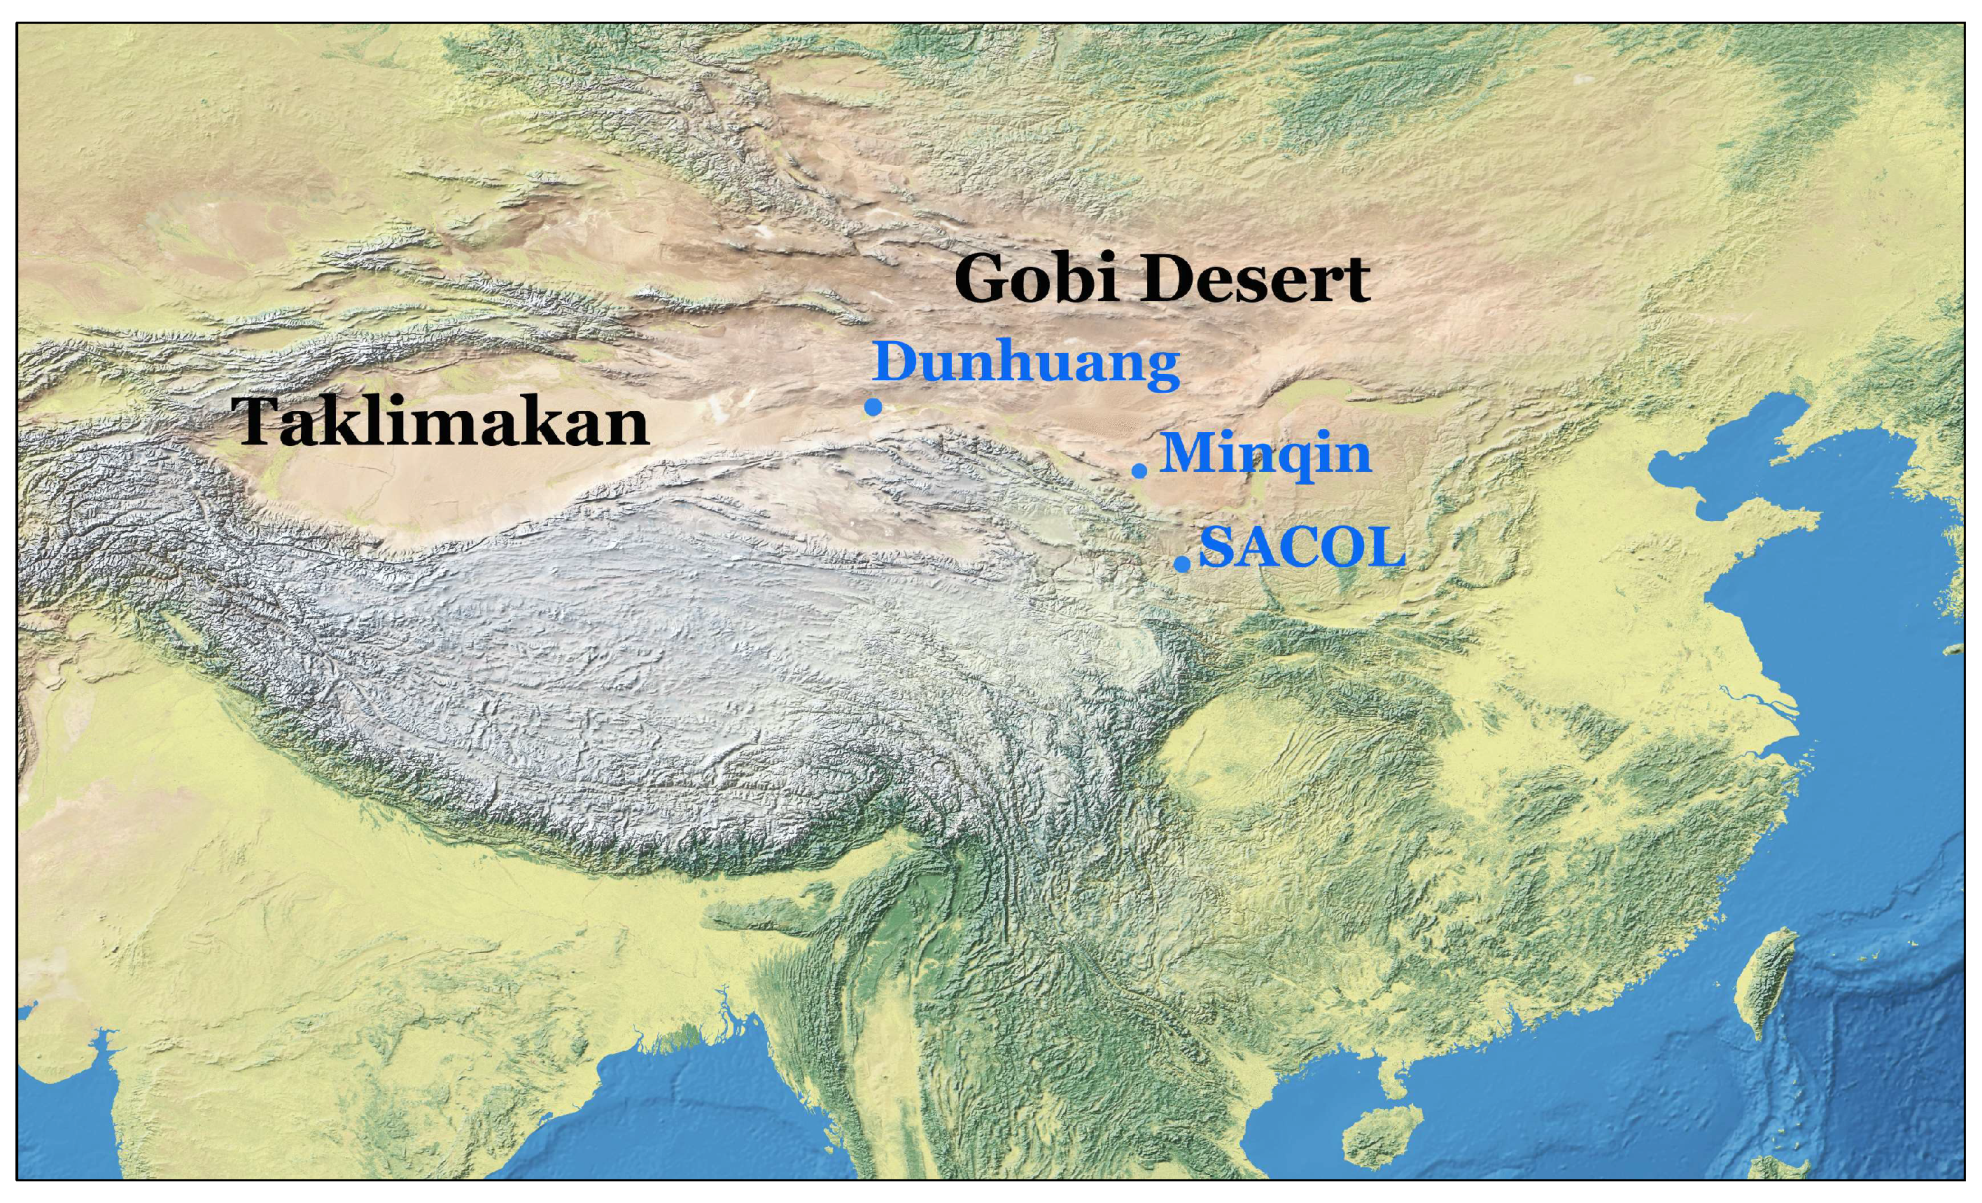
2.1. Observation Sites

2.1.1. SACOL

SACOL (35.946° N, 104.14° E, 1966 m a.s.l), established in 2006, is located at the top of a mountain on a new campus and is 48 km from the city of Lanzhou. The ambient atmosphere around this site is frequently affected not only by long-range-transported dust aerosols from adjacent source regions but also by human activity. Therefore, different types of aerosol particles can be measured at this site. Many instruments have continuously observed the optical, microphysical, chemical and radiation properties and vertical structures of aerosols, in addition to observations made for other projects, since 2007. Here, in order to match up with the field campaign periods at Dunhuang and Minqin as much as possible, only the measurements from the MPL lidar instrument and the Cimel CE318 sun photometer from 11 April to 27 June 2011 were used. Further details regarding the SACOL objectives, platforms, instruments and measurement strategy and a summary of the results can be found in Huang et al. [36]. The geographical locations of the three sites and the major dust source regions are marked in Figure 1.

2.1.2. Dunhuang

Dunhuang is situated at the westernmost fringe of the Hexi Corridor. The Taklimakan and Badain Jaran Deserts are located to the west and east of the Dunhuang region, respectively. Dunhuang is approximately 450 km downwind of the Taklimakan Desert. Agriculture and tourism are the dominant economic factors in this region. A field campaign with SACOL’s mobile facility was carried out from 1 April to 16 June 2012. The observation station (40.492° N, 94.955° E, 1061 m a.s.l), surrounded by farmland, the Gobi Desert and saline-alkali land (whose principal vegetation types are extremely sparse Alhagi), was located at edge of Dunhuang [37].

2.1.3. Minqin

Minqin lies in the middle of the Hexi Corridor and is close to the southeastern margin of the Badain Jaran Desert and the western border of the Tengger Desert. The unique geographical position and special land surface types, combined with an extremely dry climate and strong wind conditions, lead to frequent dust storms during spring and early summer over this region. From 21 April to 15 June 2010, SACOL’s mobile facility was deployed at a position (38.607° N, 102.959° E, 1373 m a.s.l) surrounded by many dunes and little farmland. More detailed information about this field campaign is given in a previous paper [38].

2.2. Instruments

2.2.1. The Lidar Instrument

The MPL-4B, manufactured by the Sigma Space Corporation, is a safe, compact, maintenance-free lidar system that has been automatically and continuously operated at a 527 nm wavelength since March 2007. The temporal and spatial resolutions are 1 min and 75 m, respectively. The emission energy is 6–8 µJ, and the pulse repetition rate is 2500 Hz. After September 2009, the lidar system was upgraded with a polarization detector, improving the spatial resolution to 30 m while not changing the other parameters. The volume depolarization ratio can be obtained directly from regular measurements. Inversion products including the backscatter coefficient, backscatter ratio, cloud height, cloud thermodynamic phase and aerosol layer height can also be obtained by an automatic detection algorithm [39].

2.2.2. Sun Photometer

Co-located with the MPL lidar is a Cimel CE-318 sun photometer, which is the standard instrument of AERONET [40]. CE-318 measures the direct and diffuse sky radiances within the spectral range from UV to near-infrared. The automatic sun-tracking and sky-scanning radiometer takes direct solar beam measurements every 15 min at wavelengths of 340, 380, 440, 500, 675, 870, 940 and 1020 nm [40]. The data are processed by AERONET (available online: http://aeronet.gsfc.nasa.gov) and are Level 2.0 quality assured. The AERONET data include the spectrally resolved aerosol optical depth as well as inversion products such as the Angstrom exponent, single scattering albedo, fine mode fraction, volume size distribution and complex refractive index. The uncertainty in the aerosol optical depth of a newly calibrated field instrument is approximately 0.01–0.021 [41]. The retrieval errors of the single scattering albedo and the real and imaginary parts of the complex refractive index are anticipated to be 0.03–0.05, 30–50% and 0.025–0.04, respectively, depending on the aerosol type and loading [42]. Furthermore, different aerosol types, such as pure desert dust and anthropogenic pollution particles, can be determined using AERONET data. In this study, the data gathered at stations Dunhuang_LZU, Minqin and SACOL were used.

2.2.3. Other Data and Tools

A weather transmitter (model WXT520, Vaisala, Vantaa, Finland) was used to record the air temperature (°C), relative humidity (%), ambient pressure (hPa), wind speed (m/s), and wind direction (°) at three sites. The instrument was installed at the top of a mobile facility approximately 4 m in height (hereafter, the height corresponds to above ground level (a.g.l.)) at Dunhuang and Minqin, and the 1-min-average raw data were used in this paper. At SACOL site, all half-hour average data from the meteorological tower were used. Relative humidity, air temperature and wind speed sensors were installed at 2 m, and the ambient pressure was determined at 8 m.
The HYbrid Single-Particle Lagrangian Integrated Trajectory (HYSPLIT) model was also run. This model was developed by the National Oceanographic and Atmospheric Administration (NOAA) in collaboration with Australia’s Bureau of Meteorology [43]. The HYSPLIT model output can provide backward trajectories with a starting time approximately corresponding to the time of the lidar observation of the aerosol layer and can assess the possible source regions of air masses. The heights in the vertical direction above the measurement site were set as the base, center, and top of the observed layer.

2.3. Evaluation of Lidar Data

Here, the normalized relative backscatter (NRB; defined as C β ( r ) T ( r ) 2 , C: system calibration constant; β ( r ) : the backscatter coefficient due to all types of atmospheric scattering; and T ( r ) : atmospheric transmittance) data from lidar measurements at three sites were processed by using the automated detection and classification algorithm of atmospheric particle layers. This algorithm mainly includes four steps: calculating ratios, identifying particle layers, distinguishing particle layer types and revising the identifications. Unlike in previous works [44,45], the range-dependent threshold profiles of the backscatter ratio and linear depolarization ratio were obtained only in order to detect atmospheric particle layers. Next, the empirical thresholds were also determined, mainly from the backscatter coefficient and linear depolarization ratio, as well as the atmospheric thermodynamic state (temperature and wet temperature). Thus, the detected atmospheric particle layers were further distinguished as aerosols and liquid-, ice- and mixed-phase clouds. Here, when relying on the empirical thresholds derived from one elastic channel without a best estimation of the lidar ratio, dense dust aerosol layers with a large depolarization ratio were frequently mistaken as ice clouds. Therefore, a continuous wavelet transform operation, which can identify different particle layers within the atmosphere at multiple dilations, was combined with the algorithm mentioned above to distinguish dust aerosols from ice clouds, especially during dust events. More details about this algorithm are given in a previous study [39].
In this algorithm, the so-called MPL depolarization ratio ( δ MPL ) (defined as the ratio of signals from the “cross-polar” and “co-polar” channels) was calculated first. Next, the volume linear depolarization ratio ( δ linear ) was acquired using Equation (1) [46]:
δ linear ( r ) = δ MPL ( r ) δ MPL ( r ) + 1
δ linear , cal ( r ) = K × δ linear ( r ) + σ
Unlike in some detailed calibration methods [47,48,49], the most general expression (as shown by Equation (2) [50]) was used to calibrate the volume linear depolarization ratio from MPL lidar data. K is a calibration constant that relates to the differences in the receiver channel gains. σ is a correction term. There is only a single detector in a standard MPL-4B lidar instrument. As suggested by Jabonero et al. [50], the impact of non-simultaneous measurements made by the polarization component on retrievals was ignored due to the rather small atmospheric particle variability within the 1 min temporal resolution. Thus, K was considered to be 1. The correction term σ , with a value of −0.065, can be estimated by using fitting procedures with molecular backgrounds under clear air conditions when considering a molecular volume linear depolarization ratio δ m   of   0.00363 .
As pointed out in other studies [51,52,53], the volume linear depolarization ratio is the so-called total (observed) depolarization ratio. Atmospheric molecules and particles contribute to this ratio. Therefore, if we estimate the contribution of non-spherical particles to the total extinction, the particle depolarization ratio (PDR; δ p ) is a more appropriate indicator. Here, the PDR can be derived from Equation (3) as follows:
δ p = δ linear , cal ( BR + BR   ×   δ m     δ m ) δ m BR   1 + BR   ×   δ m   δ linear , cal
where BR is the backscatter ratio ( ( β a + β m ) / β m , β m : backscatter coefficient of atmospheric molecules, and β a : backscatter coefficient of aerosols) and δ m is the depolarization ratio of atmospheric molecules. Here, a δ m of 0.00363 was used, which can be determined from the full widths at half maximum of an interference filter 0.3   nm [51]. For a non-dust aerosol layer, the relative variation of 0.1% in δ m can be introduced to δ p with a variation of approximately 3.96~4.26%. As shown by Equation (3), δ p directly depends on the BR, δ m and δ linear , cal . Therefore, the uncertainties in δ m , δ linear , cal and BR can also cause uncertainty in δ p . In the dust layers, it was considered that δ m is much smaller than δ linear , cal . Therefore, the term δ m can be ignored. The term δ linear , cal is an observed quantity and was calibrated by using previous method. Thus, the more critical influence on δ p is any potential uncertainty in BR. The relative variation of 7.36~31.54% in BR and of 1.19%~14.22% in δ linear , cal contributed to a variation of 7.06%–28.45% in δ p through on the basis of error analysis of a lofted dust layer on 1 April 2012 at Dunhuang. The uncertainty in δ p becomes large as BR approaches 1. The retrieved BR from Mie lidar data was affected significantly by the assumption of the lidar ratio and the reference value β a ( z 0 ) at a reference altitude z 0 . In this study, the backscatter coefficient was retrieved from the solution of a Fernald inversion [54], with an assumed lidar ratio of 50 sr for aerosols. The reference altitudes varied with the top of the atmospheric particle feature layers. The BR at reference altitudes was set to 1.0 in our automatic algorithm. A sufficient signal-to-noise ratio for the reference altitude ensured that the calculated aerosol backscatter coefficient was not negative. Next, the extinction coefficient was roughly estimated from the backscatter coefficient multiplied by the assumed lidar ratio. The molecular extinction can be calculated via the pressure and temperature profiles obtained from ERA-Interim data.
The profiles of the PDR and extinction coefficient were analyzed to determine the contribution of non-spherical aerosols in the ambient atmosphere. For this purpose, the estimation method suggested by Shimizu et al. [52] was applied to our MPL lidar data. The assumption for this method is that only two aerosol types, spherical and non-spherical aerosols, are present and that they are externally mixed. Considering that mineral dust is the most important component of non-spherical aerosols in East Asia during the spring season, we labeled non-spherical aerosols as mineral dust. The contribution ratio R dust of dust extinction to total extinction was calculated with Equation (4). R dust can be expressed as follows:
R dust = [ ( δ p δ 2 ) ( 1 + δ 1 ) ] / [ ( 1 + δ p ) ( δ 1 δ 2 ) ]
where the values of the depolarization ratio of mineral dust, δ 1 , and of the spherical aerosols, δ 2 , are 0.35 and 0.05, as given by Shimizu et al. [52]. R dust is sensitive to the values of δ 1 , δ 2 and δ p , and depends almost linearly on the inverse of δ 1 . δ 1 will vary during an observation campaign at the same location and vary across different stations at the same time. When the PDR is greater than δ 1 or lower than δ 2 , R dust is assigned a value of 1 or 0, respectively. When the dust density is high, R dust is not sensitive to this assumption [55,56].
In this study, we assumed the same lidar ratio for mineral dust and spherical aerosols and ignored the differences in the lidar ratio for different aerosol types and site locations. Thus, we can estimate the dust extinction from R dust multiplied by the same total aerosol extinction. Next, the extinction of a spherical aerosol ((1 −   R dust ext total ) was also calculated. The results derived from this method were compared with high-volume sampler data and optical particle counter data. This comparison showed that dust and spherical aerosols were very well separated.

3. Results and Discussion

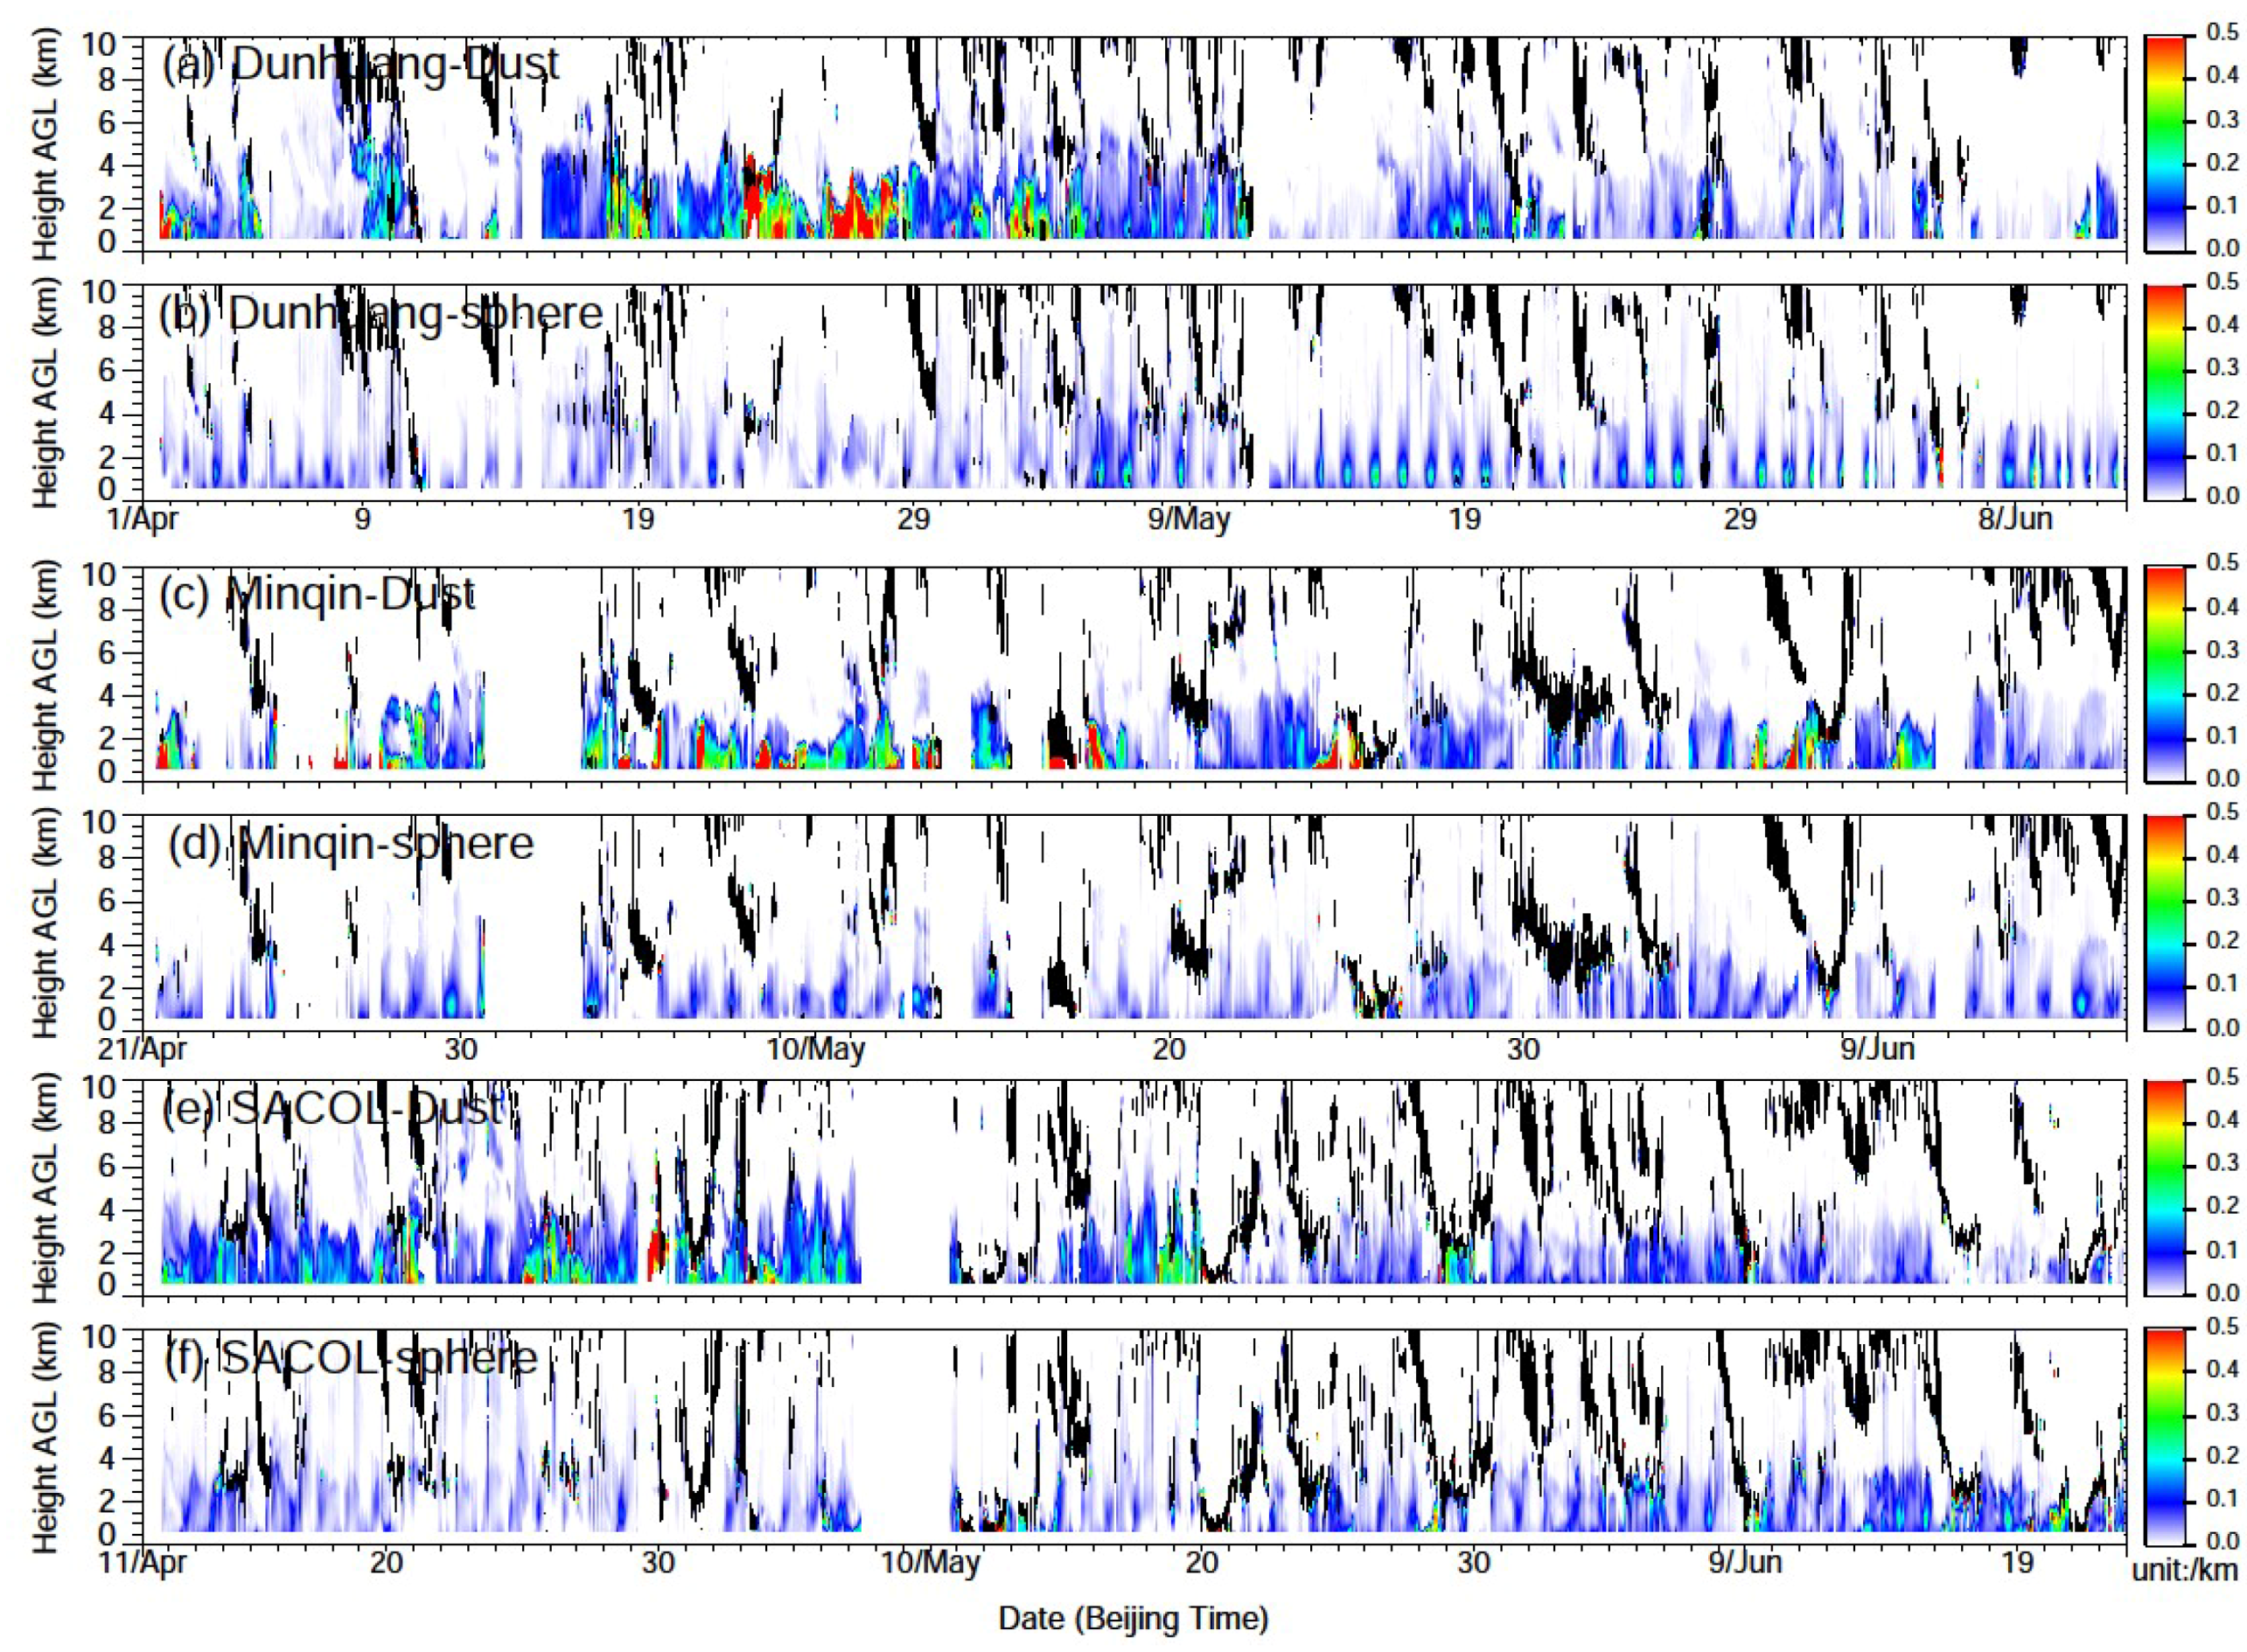
3.1. General Measurements

Figure 2 shows the time-height indications of the extinction of dust and spherical aerosols during the entire campaign periods at Dunhuang, Minqin, and SACOL. On the basis of the algorithm described in the above section, the features related to the distributions of dust and spherical aerosols are well separated at each station. Figure 2a,c,e shows that dust events with different intensities occur frequently at three sites. During remarkable dust events, the elevation of dust plumes can be traced in the time-height indications. Compared with the distribution of dust at Minqin, there are a number of lofted dust layers above the planetary boundary layer at Dunhuang and SACOL (as shown by Figure 2a,e). Owing to the large influence of human activities at SACOL, we considered spherical aerosols as air pollution. The features of regional-scale air pollution (variations over a temporal scale of several days) are clearly seen at SACOL. Because of the absence of PM10 data to support our work, the dust extinction coefficients retrieved from lidar are used only to identify obvious dust events observed on 1–2, 4–5, 8–10, 17–19 and 22–28 April and 1–5 May 2012 at Dunhuang (Figure 2a) and on 19–21, 25–27 and 29–30 April and 17–19 May 2011 at SACOL (Figure 2e). More dust events are observed at Minqin on 21–22 and 24–28 April; 1–3, 4–13, and 23–25 May; and 3–5 June 2010 in Figure 2c. These dust events are also confirmed by the operational weather records.
Referring to the suggestions by Jugder et al. [57], the dust events are classified into 3 categories according to the dust extinction ( α   [ km 1 ] ): low ( α < 0.1), medium (0.1 α < 0.3) and high (0.3 α ) density. The lidar observations at Dunhuang indicate dust events with a high density on 1–2, 17–19 and 22–28 April and 2–4 May 2012. The maximal height of these dense dust layers reaches approximately 2.0–4.0 km. At Minqin, the high-density dust events occur on 21–22 and 24–27 April; 2–4, 6–7, 10–11, 14–16 and 22–23 May; and 3–5 June 2010, while the maximal heights of these layers are located at 2–3.0 km. The dust events with extinctions higher than 0.3 km−1 are on 19–20, 25 and 29–30 April and 18 May 2011 in SACOL, and the top heights are 1.0–3.5 km.
The medium-density dust events are mainly associated with two scenes: (1) the lofted dust layers or long-range-transported dust layers over the measurement sites (for example, the transported dust layer whose top height is at approximately 5.5 km occurs on 8–9 April at Dunhuang) and (2) the weakening stage of high-density dust events. These scenes are also seen on 28 April and 5 and 8–9 May with decreased extinction at Minqin. The top heights of these medium-density dust layers are below 2 km. At the three sites, the effects of dust activities in spring on the aerosol load are more significant than those in the other seasons. Therefore, most of the days in spring are always identified as low-density dust events.

3.2. Case Studies

To illustrate the characteristics of the evolution of dust layers at three sites, we discuss three strongly contrasting cases in the following sections: Case 1, a lofted dust layer occurred on 22–24 April 2012 at Dunhuang (Figure 3); Case 2, an extreme dust event with a mixture of dust from multiple source regions was recorded on 23–25 May 2010 at Minqin (Figure 4); and Case 3, an extreme dust event transported within the PBL was observed on 18–19 May 2011 at SACOL (Figure 5).

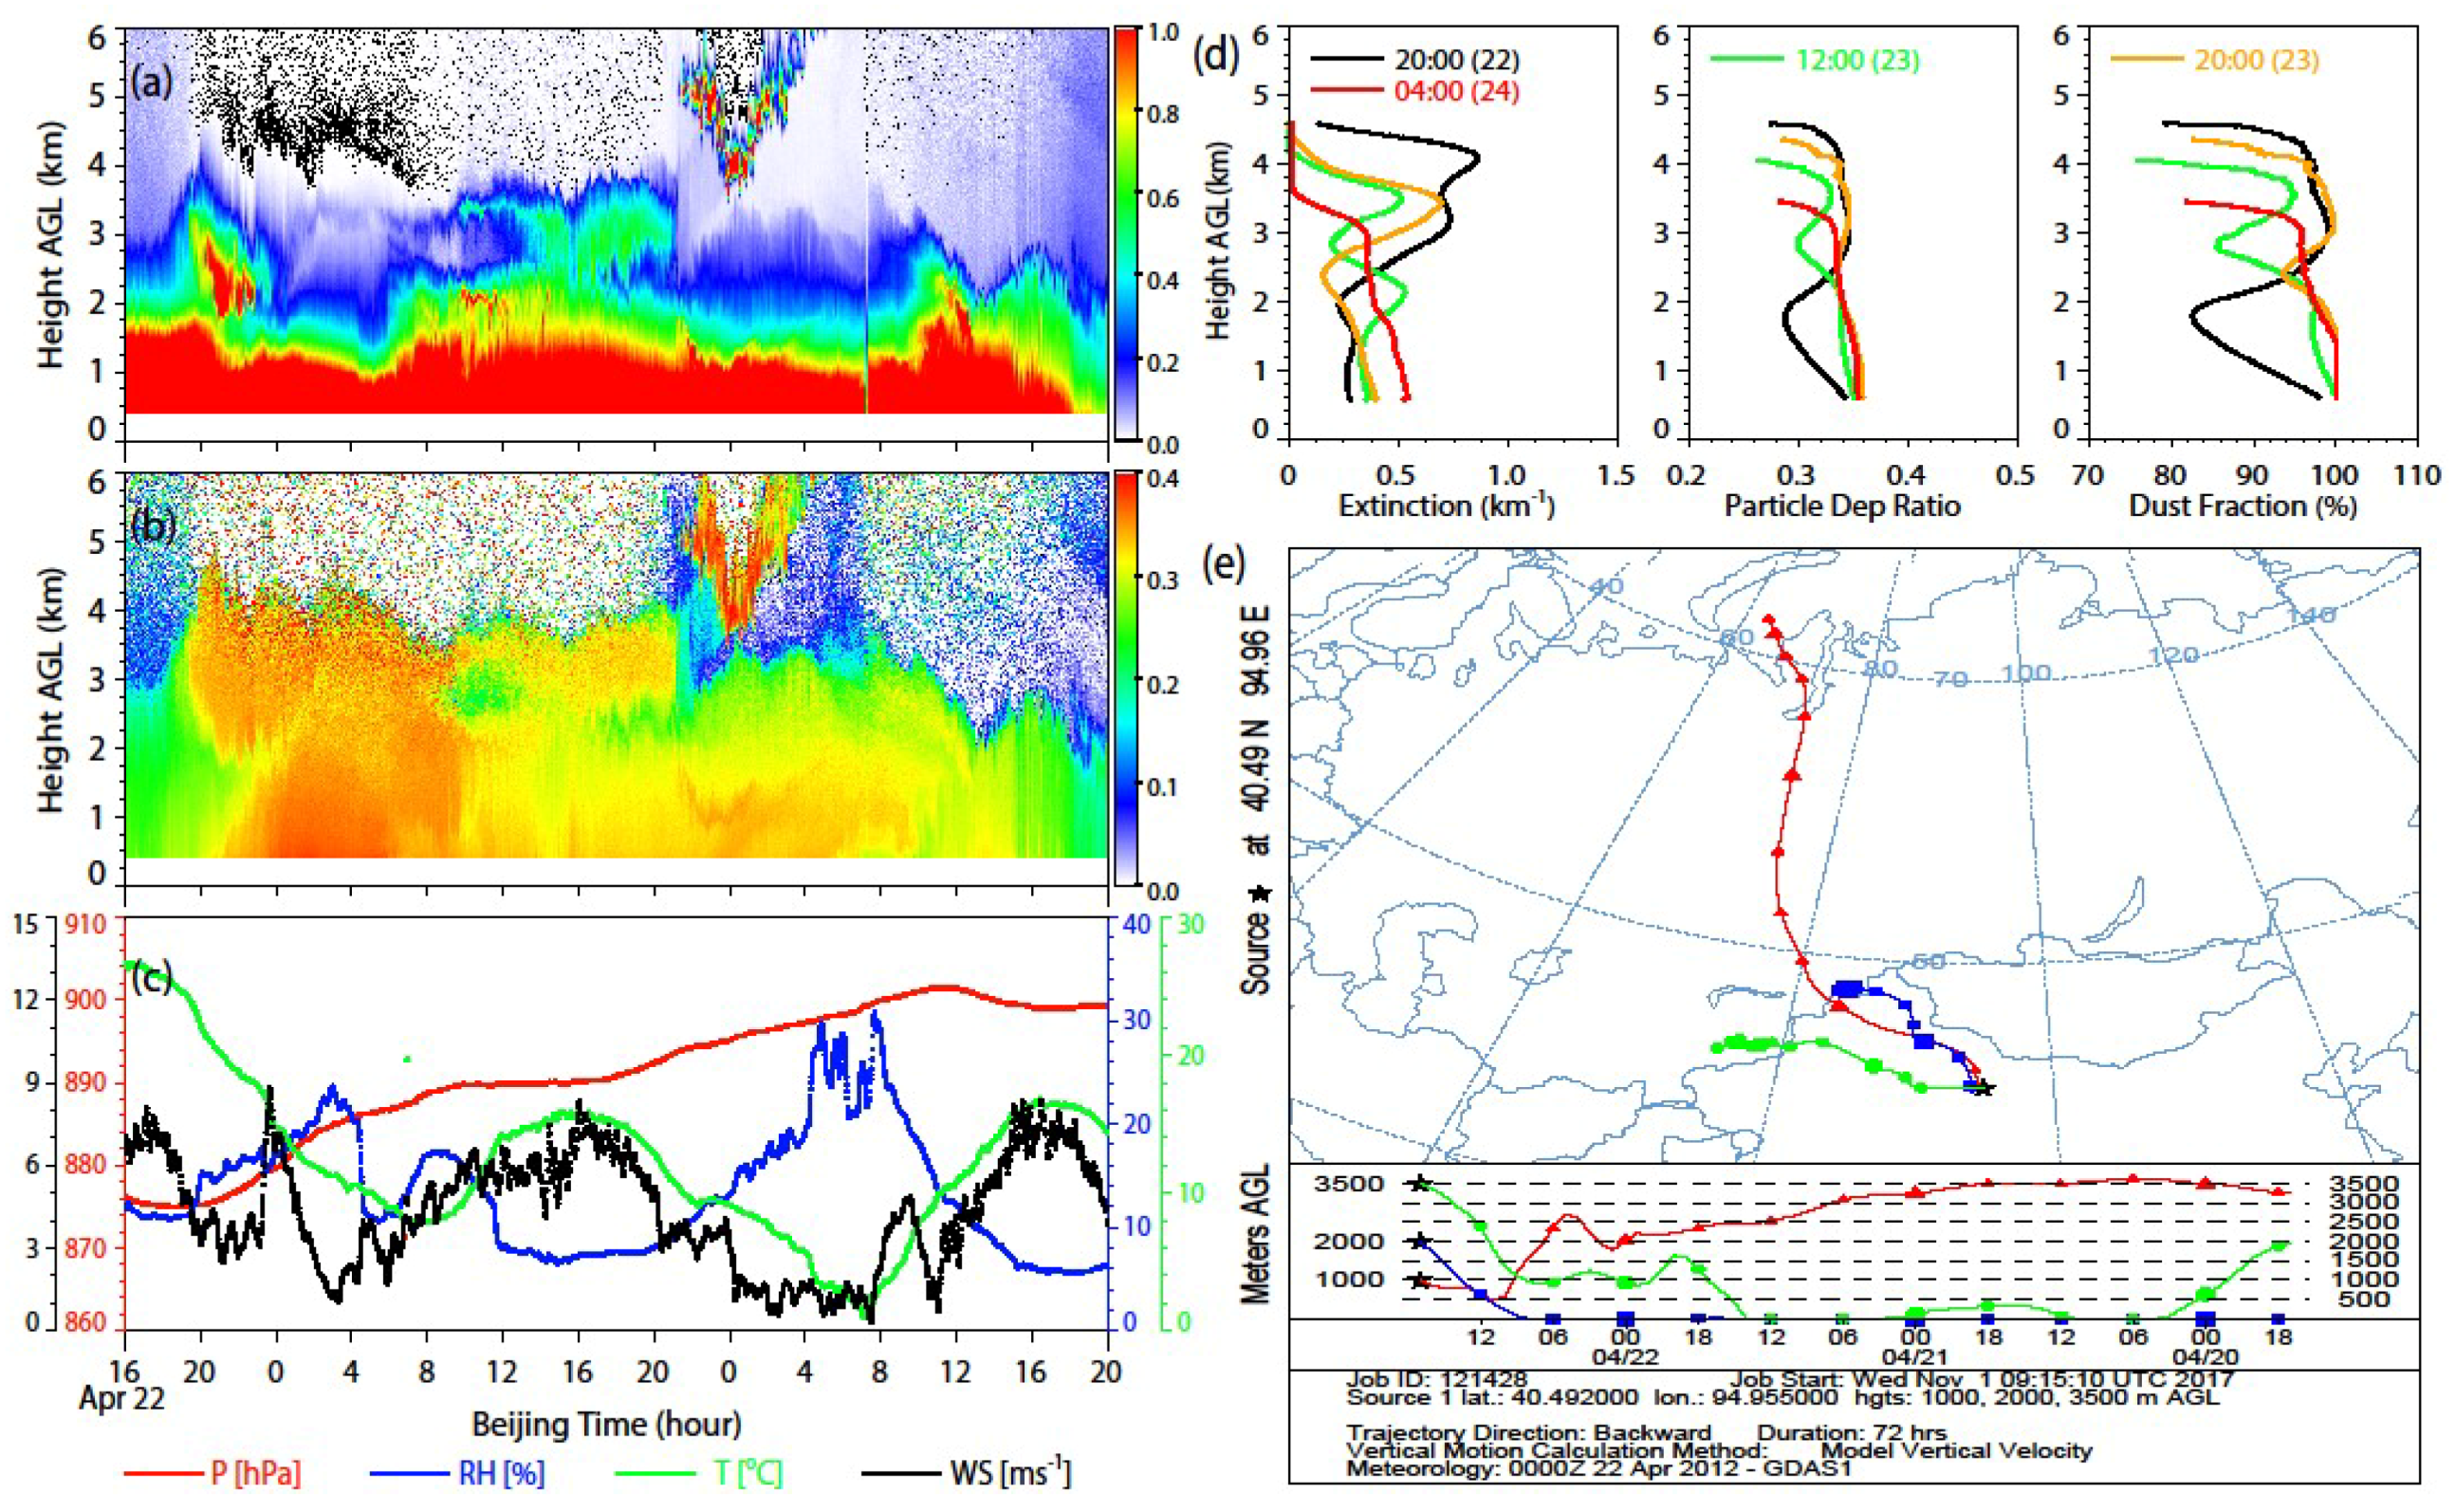
3.2.1. Case 1: On 22–24 April 2012 at Dunhuang

Figure 3a,b shows the temporal-spatial evolution of the NRB and linear depolarization ratio on 22–24 April 2012. Clearly, two dust layers arrive at this site. We can see from Figure 3b that the lofted dust layer first reaches a height of 3.5 km at 19:00 on 22 April. This dust layer roughly extends from 1.75 km to 4.6 km in height. It is possible that the top height of the lofted dust layer is higher than 4.6 km because the lidar signals are severely attenuated above this dust layer. This is shown as a black area in Figure 3a and a corresponding white area in Figure 3b. At approximately 20:00 on 22 April, another intense dust layer near the ground arrives at the site. The depth of this dust layer increases from the surface to approximately 2 km in four hours. At the end of 22 April, a mixing of the two dust layers takes place. The vertical structure did not change much until 08:00 on 23 April, after which time the whole dust layer is divided into two parts: a residual layer and a near-surface layer.
Figure 3c illustrates the variations in the meteorological parameters. After 20:00 on 22 April, the surface air pressure increases from 874.9 to 901.5 hPa in forty hours. The air temperature, relative humidity and wind speed display large diurnal cycles with differences of ~25.9 °C, ~30.9% and ~9.9 ms−1, respectively. The relative humidity and wind speed are always below 32% and 11 ms−1, respectively. There are indications of a diurnal cycle with a general tendency toward stronger winds during the afternoon and weaker winds during the night and morning. It is very clear that the minimal air temperature and maximal relative humidity arise at approximately 06:00–07:00 and that the opposite condition occurs at approximately 16:00. Moreover, there is a good consistency between air temperature and wind speed after 8:00 on 23 April.
Figure 3d shows the evolution of the profiles of extinction coefficients, PDRs and dust fraction over the entire process at different times with an 8-h interval. The profiles of the extinction coefficient between 2.0 km and 4.5 km demonstrate that the dust concentration gradually decreases and subsequently forms the residual layer at approximately 3.3 km height. The maximal extinction coefficient of the lofted dust layer is 0.87 km−1. The extinction coefficients of the dust layer near the surface are as high as 0.27–0.56 km−1, and it is categorized as a high-density dust layer. The profiles show that the PDR and dust fraction in the lofted and near-surface dust layers are always above 0.25 and 73%, respectively. The maximal PDR of 0.36 can be found below approximately 1.4 km. According to the dust fraction, this near-surface dust layer consists almost purely of dust at 20:00 on 23 April and 04:00 on 24 April.
According to the HYSPLIT backward trajectories, the air parcels arriving at 01:00 (Beijing time) on 23 April come from the northwest direction along the flanks of Mt. Tianshan (Figure 3e). The air at a lower trajectory is long-range transported toward the measurement site from Siberia and from the Arctic Ocean via surges onto the continent. The relatively cool air associated with falling temperatures, rising pressure, high winds, and dust mobilization is shown in Figure 3c. The center trajectory originates along the China-Kazakhstan border. The lower trajectory is above 2 km before 06:00 on 22 April, while the center trajectory nearly reaches the ground once it reaches northern Xinjiang. The upper trajectory originates from a more western direction, traveling over the northern margin of the Tarim basin, where the air parcels are uplifted upon passing over the Pamir Mountains.

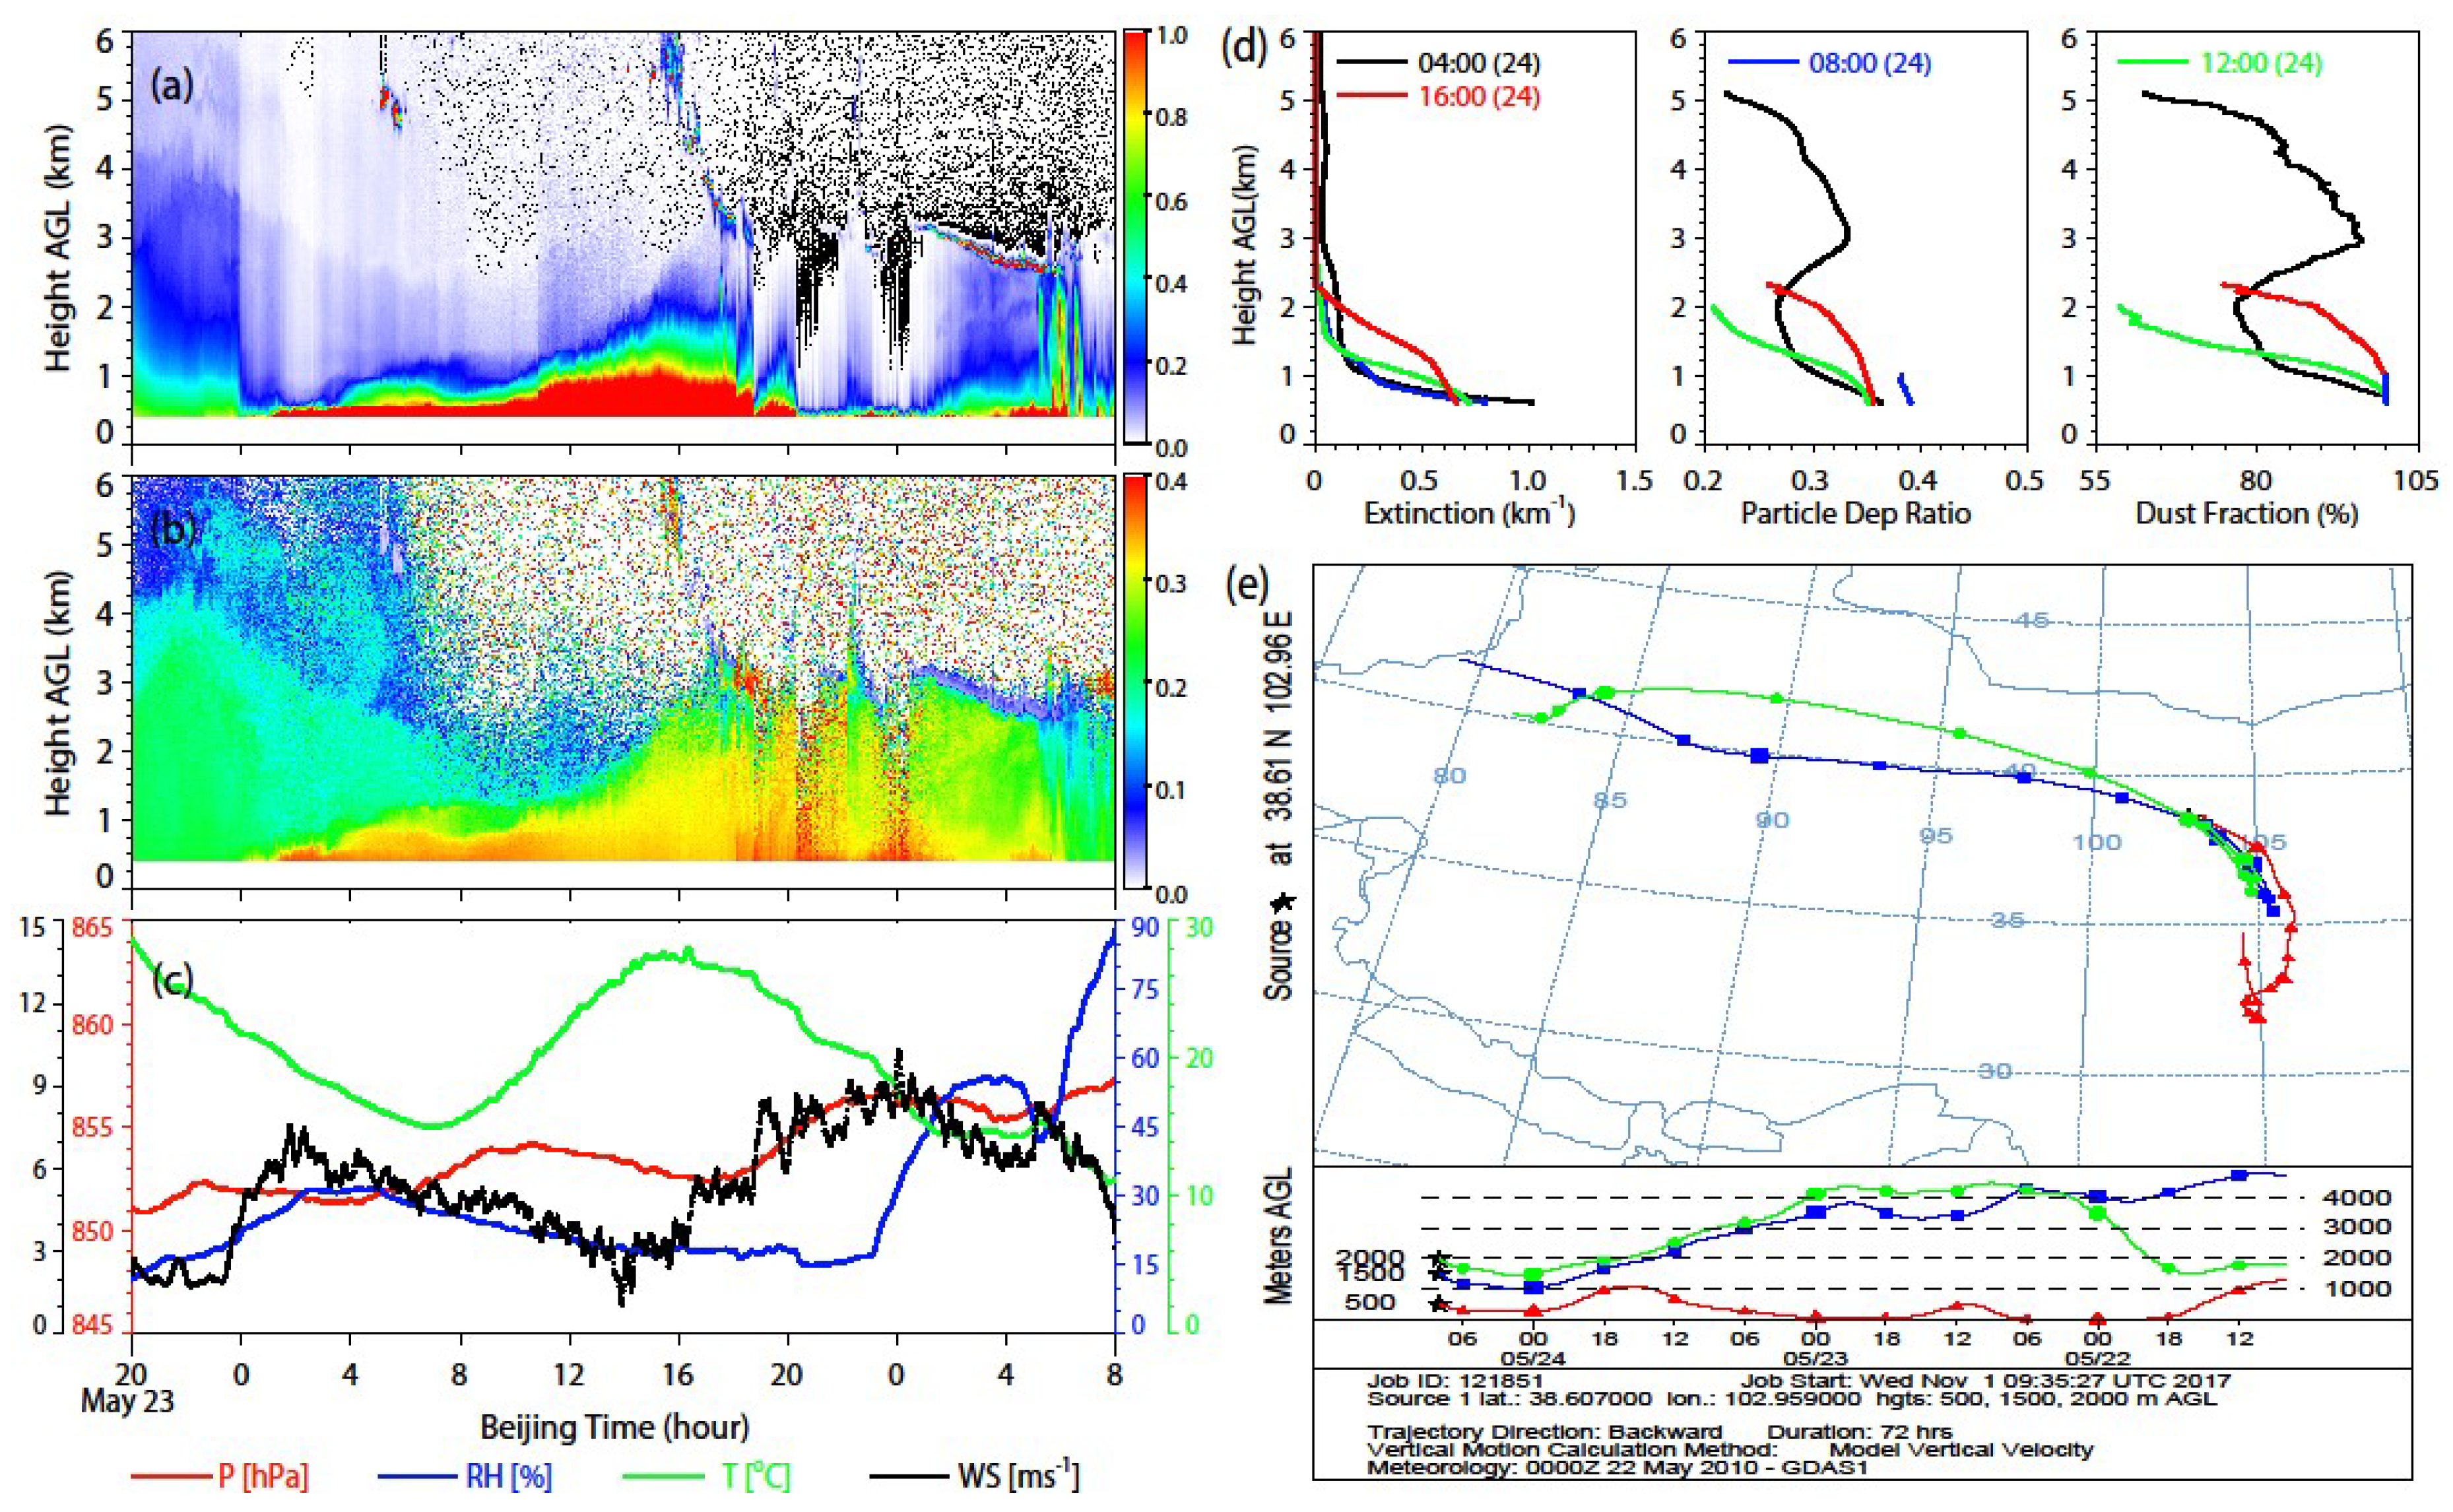
3.2.2. Case 2: On 23–25 May 2010 at Minqin

An extreme dust event with strong convective activity measured on 24–25 May 2010 is seen via the time-height indications of the NRB and linear depolarization ratio in Figure 4. As shown in Figure 4a–c, a shallow dust layer near the surface arrives at the site when the wind speed increases rapidly at the end of 23 May. The top height of the dust layer stays below 900 m until 10:00 on 24 May. After that time, the dust layer is uplifted with the development of a mixed layer. The dust layer actively mixes in the vertical direction and extends rapidly from 1 km to 3 km during the noon hours. After approximately 17:00, the development of the dust layer is capped by low clouds. Two hours later, lidar signals show that the laser beam does not penetrate the lower part of this dust layer with a higher wind speed near the surface. Then, precipitation forms at approximately 06:00 on 25 May. During this process, the relative humidity increases from 15% to 87%. In particular, there is a marked increase in the relative humidity from 45% to 87% at 06:00–08:00 on 25 May.
During the entire period, there is a wavy upward trend of air pressure with small amplitude of 6 hPa (Figure 4c). Compared with that in Case 1, the air temperature shows a significant diurnal cycle and then quickly falls when precipitation occurs. Distinct peaks in the wind speed are visible. When the wind speed is greater than approximately 4 ms−1, more dust particles maybe picked up from the ground and cause severe attenuation of the lidar signals. The same scenario is also observed after 18:00 but at wind speeds above 6 ms−1.
The profiles at different times with 4h intervals are shown in Figure 4d. The extinction coefficients at 04:00 and 08:00 on 24 May are roughly above 1.05 km−1 and 0.8 km−1, respectively, in the lowest 0.6 km. For the same height and time, the high PDR with a maximum of 0.39 indicates that it is a pure dust layer. The dust fraction at this height also corroborates this finding. With the strong convection on 24 May, a considerable amount of dust particles is uplifted to higher levels, as confirmed by an increase in the extinction coefficient at 0.8–2 km. The vertical layering of the profiles of the extinction coefficient significantly changes before and after the convection event while the profiles of the PDR and dust fraction remain consistent. These coherent structures in the profiles clearly indicate the vertical transport of dust.
The HYSPLIT trajectories arriving at the site at 16:00 (Beijing Time) on 24 May show a relatively complex situation with strongly changing airflow patterns between adjacent layers. A distinct turning of three trajectories from north-westerlies to south-easterlies is presented. The lower trajectory may pass over the site at an earlier time and meet the northward airflow first. With the airflow continuously moving to the north, the middle and upper trajectories also meet the northward-moving air parcels in succession. As shown by the parts of the middle and upper trajectories higher than 3 km, the air masses pass over the Taklimakan Desert or other possible dust sources before 23 May and probably pick up a small amount of dust particles. At the end of 23 May, all trajectories consistently descend before slowly ascending below 1.5 km. This movement may result in dust particles near the ground from the sources being picked up and injected into the air by the lower trajectory below 500 m. On the basis of the positions of possible dust sources around the Minqin site, we estimated that the dust layers are advected from the Tengger Desert within 10 h.

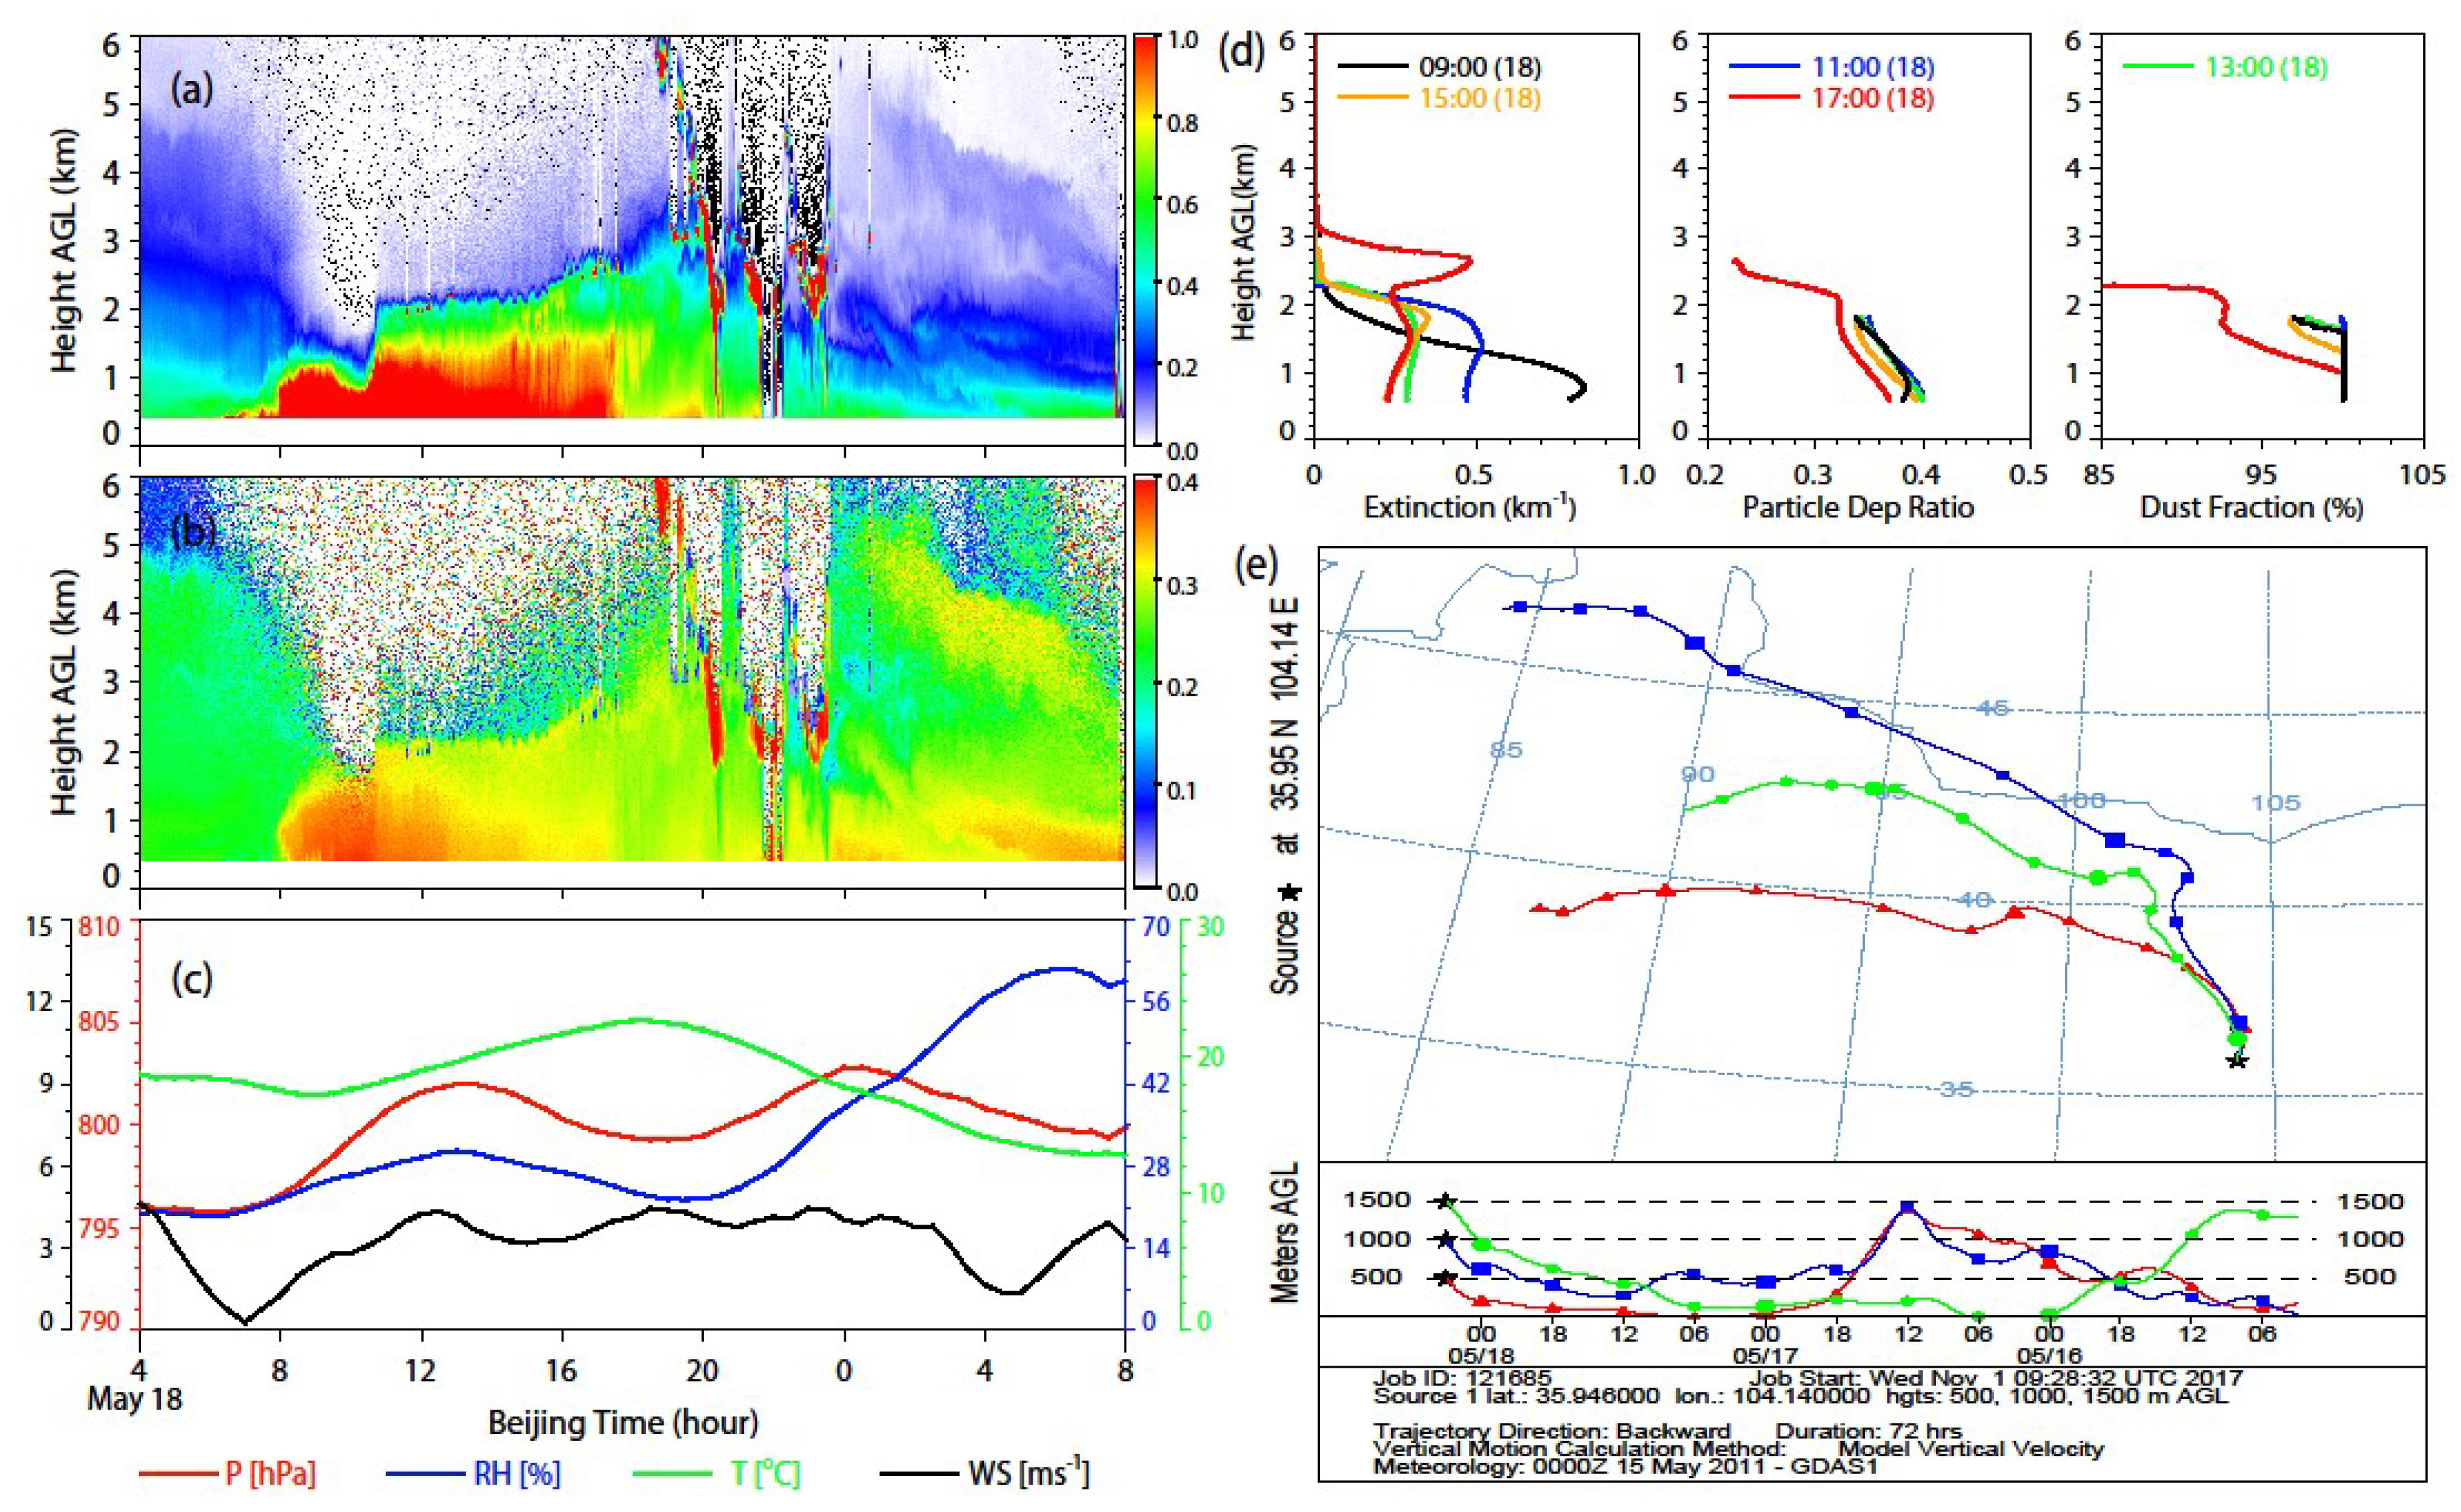
3.2.3. Case 3: On 18~19 May 2011 at SACOL

Similar to Case 2, the temporal-spatial plots of the NRB and linear depolarization ratio between 04:00 on 18 May and 08:00 on 19 May 2011 indicate the marked evolution of the dust layer with strong convective activities in Figure 5a,b. The passage of dust by the site is recorded by the sharp increase in the linear depolarization ratio in Figure 5b. The dust layer firstly arrives at SACOL site at a height of 900 m at approximately 08:00 on 18 May. After approximately 20 min, the site is occupied by the dust layer. This dust event may be attributed to the possible differences in the synoptic situation and air mass characteristics between Case 2 and 3. Then, the top height of the convective boundary layer ascends from approximately 2.3 km to 3.5 km between 10:00 and 18:00 on 18 May. Meanwhile, dust particles are transported to the top of the convective boundary layer with the upward movement of dust plumes, and this transport is more remarkable in the afternoon on 18 May. A few low-level, broken water clouds are also generated at the top of the convective boundary layer during this period and are surrounded by the lofted dust particles. Precipitation weakens the lofting of dust particles after 20:00 on the same day.
Similar to Case 2, a wavy upward trend of air pressure with amplitude of 7 hPa is shown in Figure 5c. The air temperature falls from 23 °C to 13 °C, and the relative humidity increases from 21% to 62% after precipitation. The wind speed is lower than 4.5 ms−1 during the entire dust event. In addition, two distinct minima of wind speed can be found at the start and end of the dust event.
As shown by Figure 5d, the evolution of the dust layer is also reflected by the profiles of the extinction coefficients and PDRs at different times (with 2-h intervals). The height of the peak in each profile of the extinction coefficient increases from 0.9 km to 2.5 km with the upward movement of dust particles. The extinction coefficients of each peak decrease from 0.85 km−1 at 09:00 and then increase to 0.23 km−1 at 17:00. The PDRs remain in the range of 0.33–0.40. During this period, the dust load continues to weaken over time and with increasing height.
The HYSPLIT trajectories arriving at SACOL at 11:00 (Beijing Time) on 18 May present different sources from northwest China in Figure 5e. Apparently, all trajectories pass by active dust source regions on 15–16 May. Although the heights of air parcels remain below 1.5 km and are even near the surface during this period, we are still not sure whether the air parcels pick up dust at first. The three trajectories could have picked up dust particles from the Gobi Desert over western Inner Mongolia on 17 May. Then, the dust particles are advected to SACOL.

3.3. Statistical Analysis

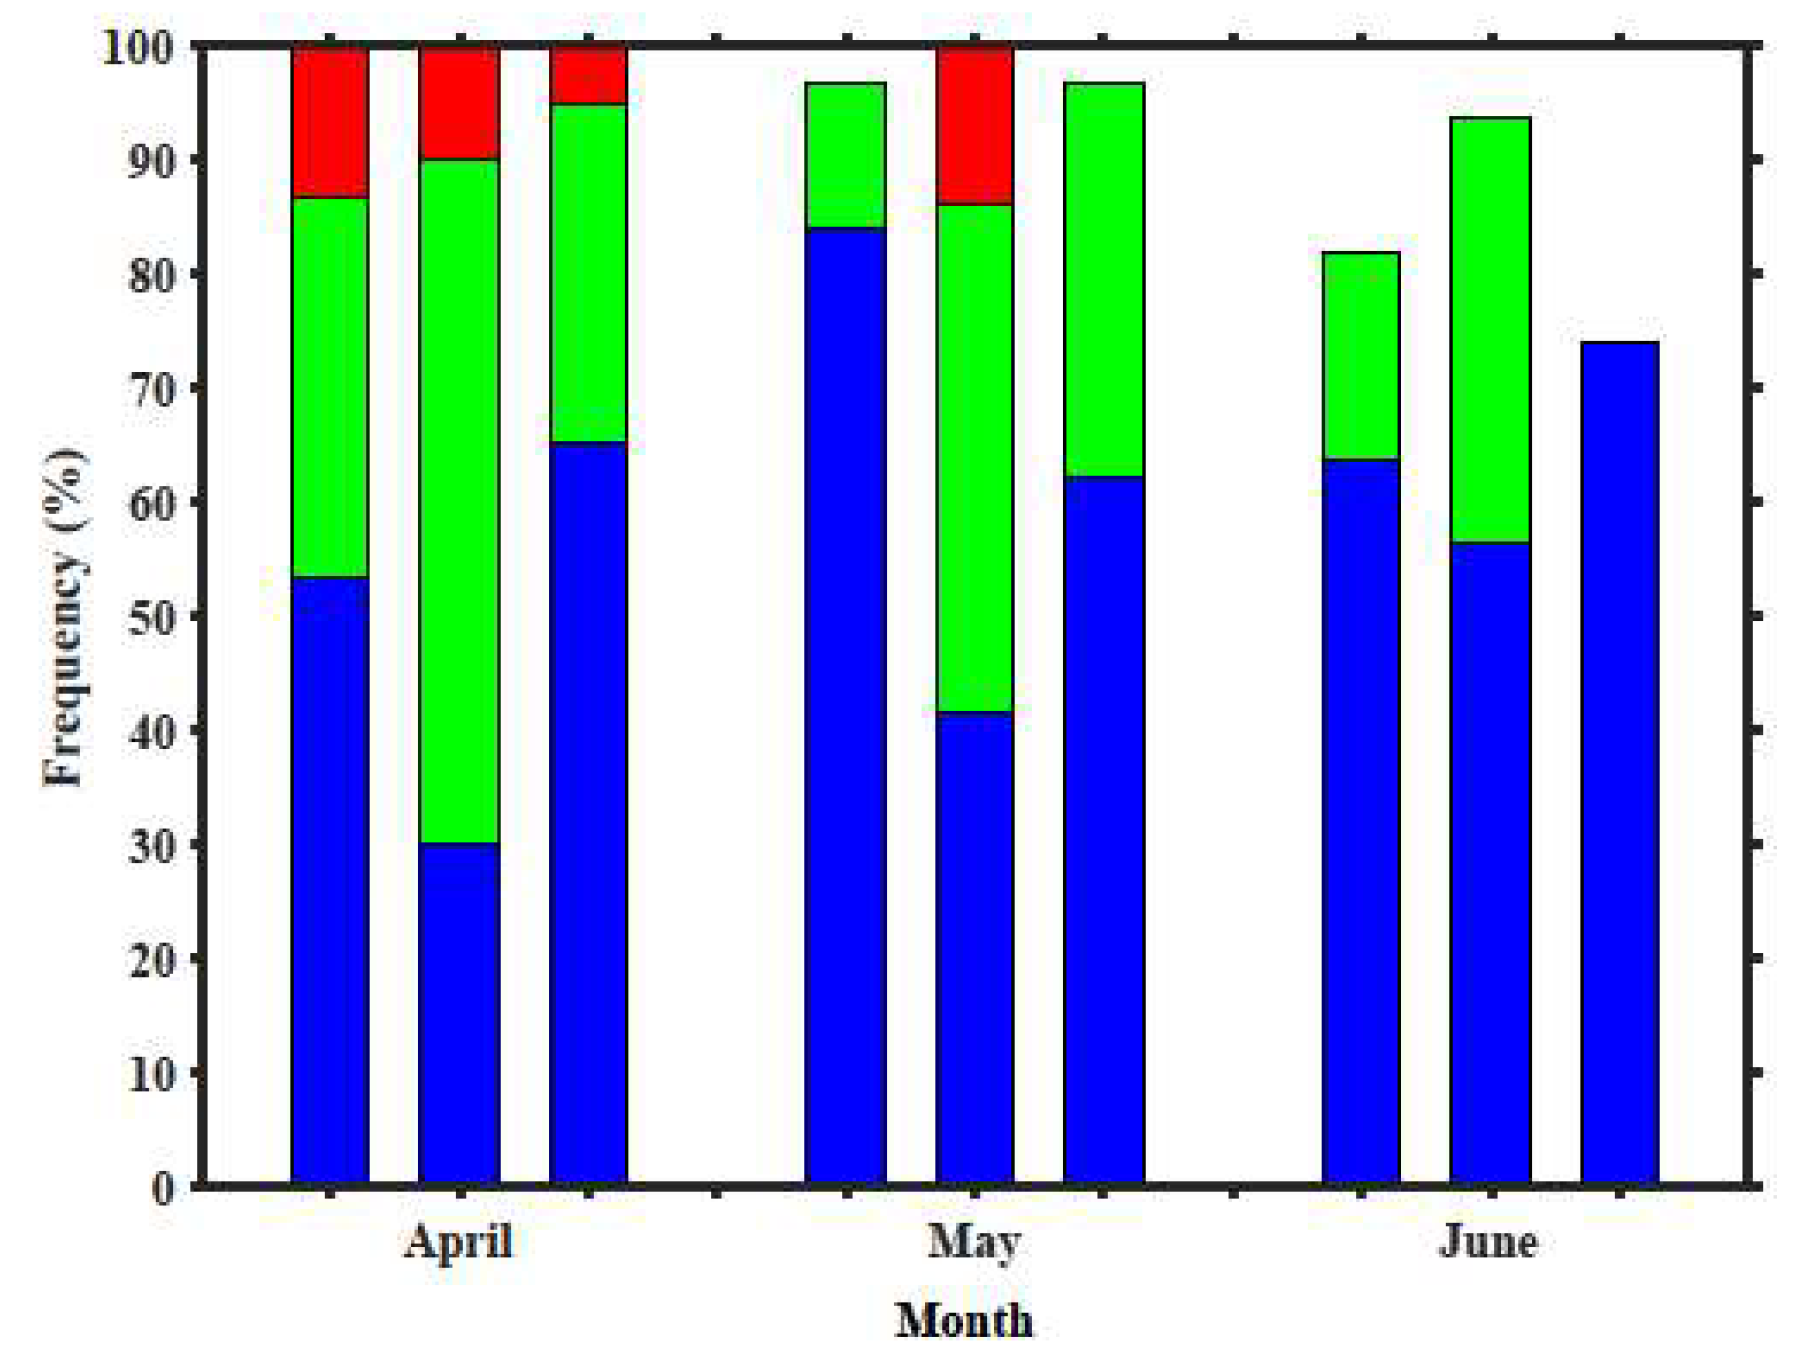
3.3.1. Dust Occurrence Frequency

Here, the PDRs and dust extinction coefficients are employed for statistical analysis of the occurrence frequency and intensity. The PDRs and dust extinction coefficients are all averaged on a daily basis. We assumed that the days with a mean PDR higher than 0.1 are dust days [52]. Based on this assumption, the number of dust days identified by lidar observations during the whole campaign is 69 (all available observation days: 72, similarly hereinafter), 54 (55) and 63 (71) at Dunhuang, Minqin and SACOL, respectively. The occurrence frequency of dust days is 95.8%, 98.2%, and 88.7% at the three respective sites. Figure 6 shows the monthly variation in the occurrence frequency: the number of dust days from April to June is 30 (30), 30 (31) and 9 (11) at Dunhuang; 10 (10), 29 (29), and 15 (16) at Minqin; and 20 (20), 28 (29), and 16 (23) at SACOL. It is clear that dust days occur quite often in April and May and that the occurrence frequencies of dust days at three sites decrease gradually from April to June. Regarding the intensity of dust days mentioned in Section 3.1, the dust intensities recorded at Dunhuang, Minqin and SACOL (Figure 6) have frequencies of 68.1%, 43.6%, and 66.7% at low density; 22.2%, 45.4%, and 22.2% at medium density; and 9.7%, 11%, and 11.1% at high density, respectively.

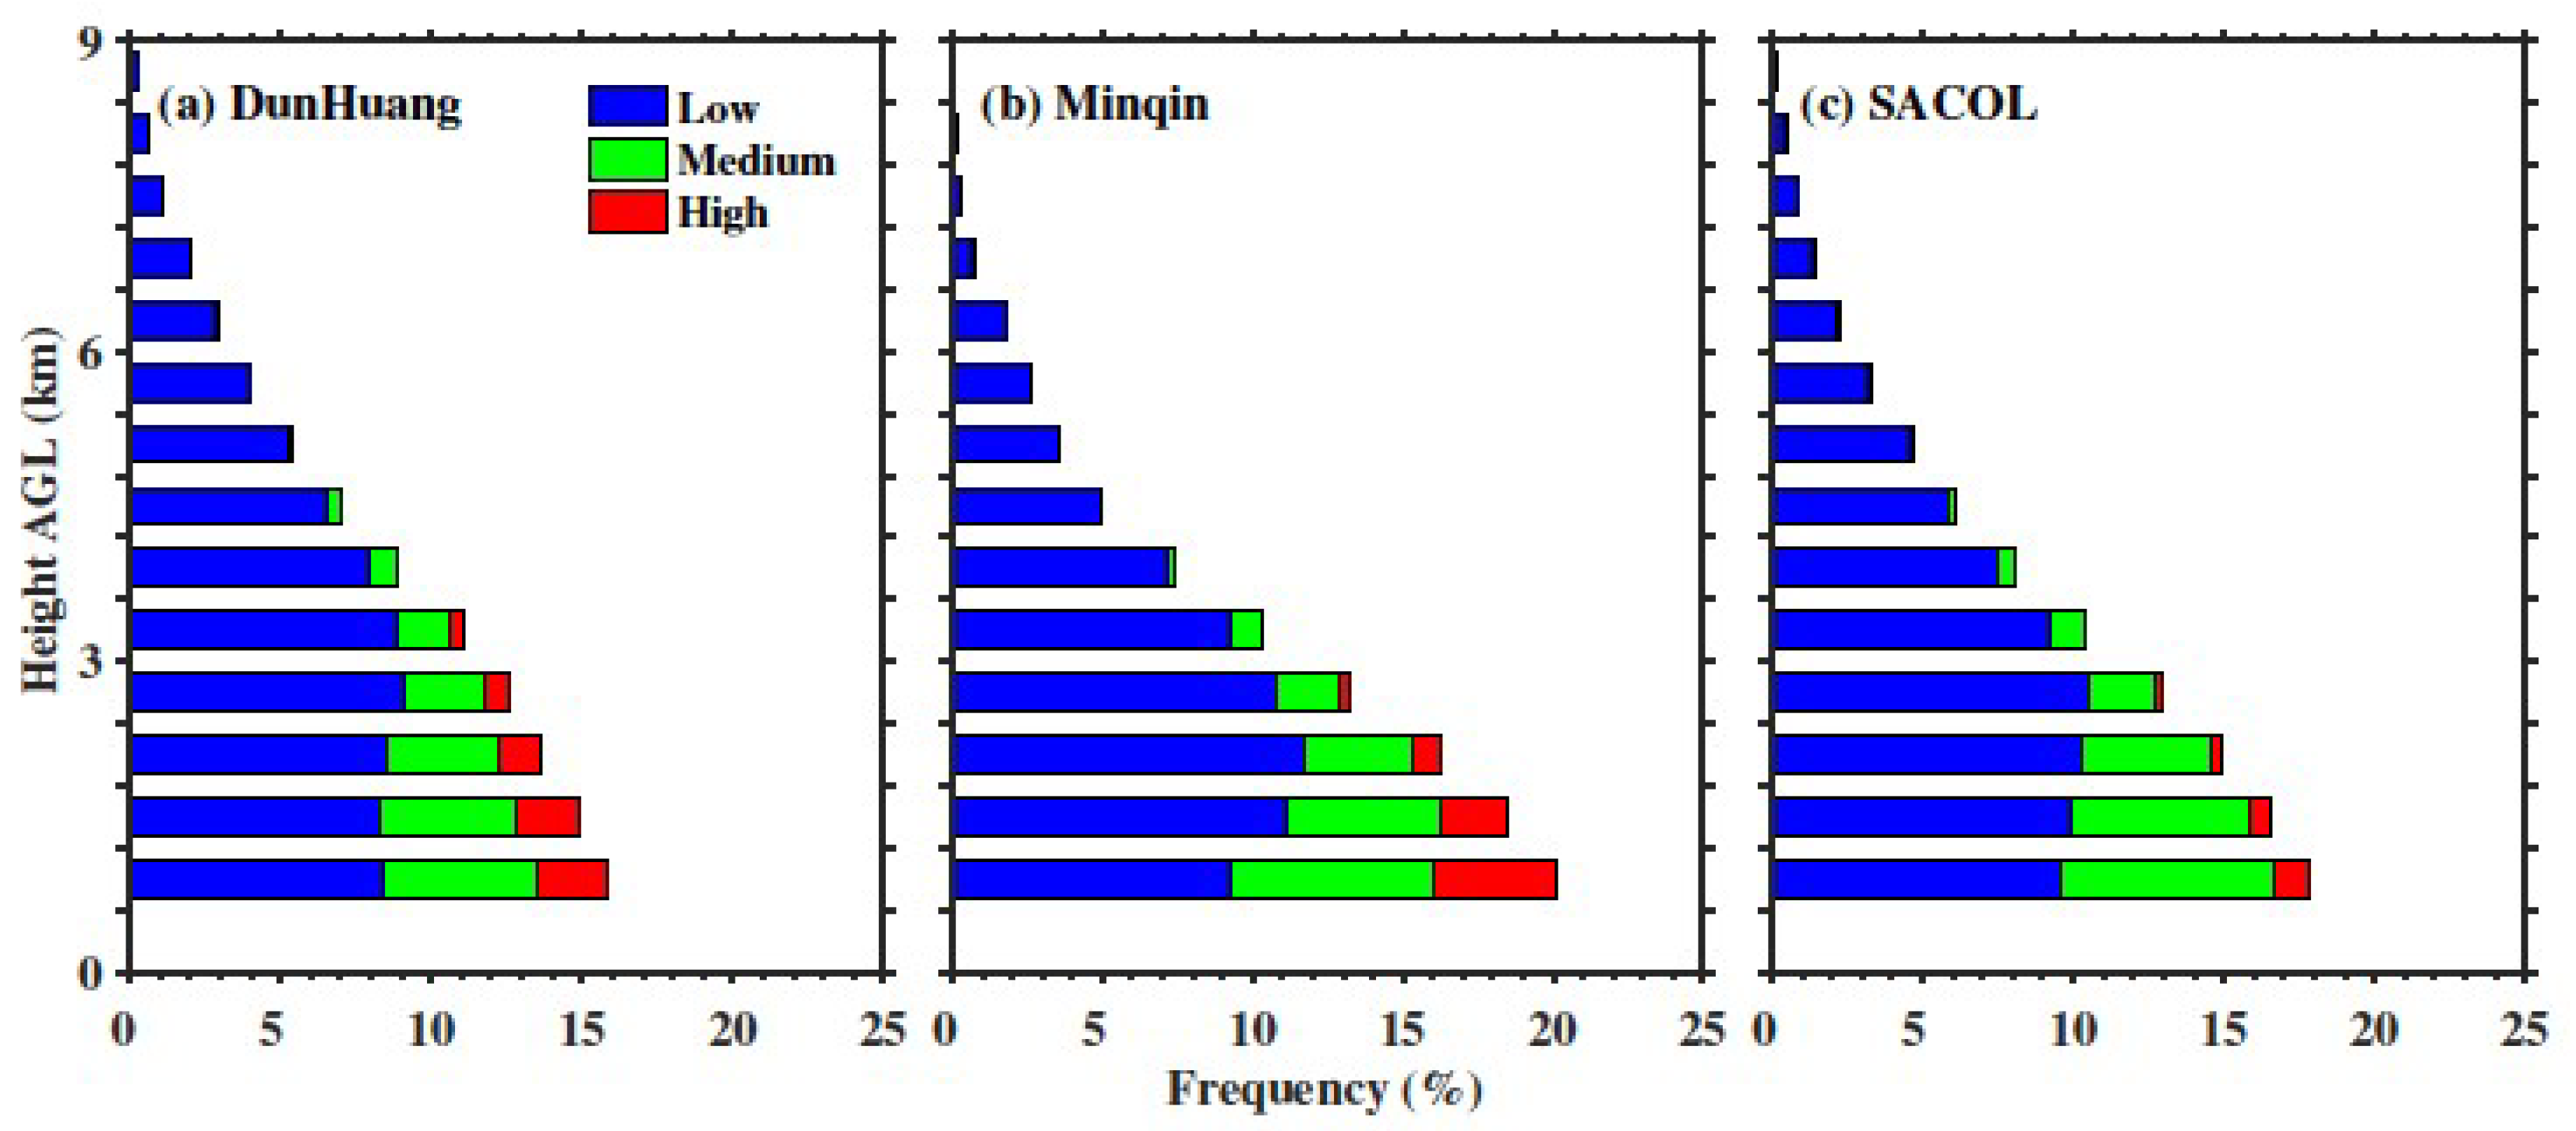
3.3.2. Dust Layer Height

A threshold of 0.1 for the PDRs is also used to verify the dust layer from each profile of the aerosol feature mask on days identified as dust days in Section 3.3.1. According to the low, medium and high intensities, the frequencies of each category are calculated with an interval of 600 m in height. As shown in Figure 7, the vertical distributions of the dust layer reveal that the maximum heights of the dust layers during dust event periods vary from 7.8 to 9 km at three sites. The frequencies of the dust layers decrease slowly with increasing height. The highest frequencies of 16%, 20% and 18% occur around a height below 1.2 km at Dunhuang, Minqin and SACOL, respectively. The vertical distributions also change depending on the dust intensity. For example, the total frequencies of the dust layers with a low intensity are all higher than 63.6% at each site. When the dust intensity changes from slight to severe, not only the maximum heights of the dust layers but also the total frequencies decrease. Notably, the dust layers with high intensities mostly occur within the atmospheric boundary layer.

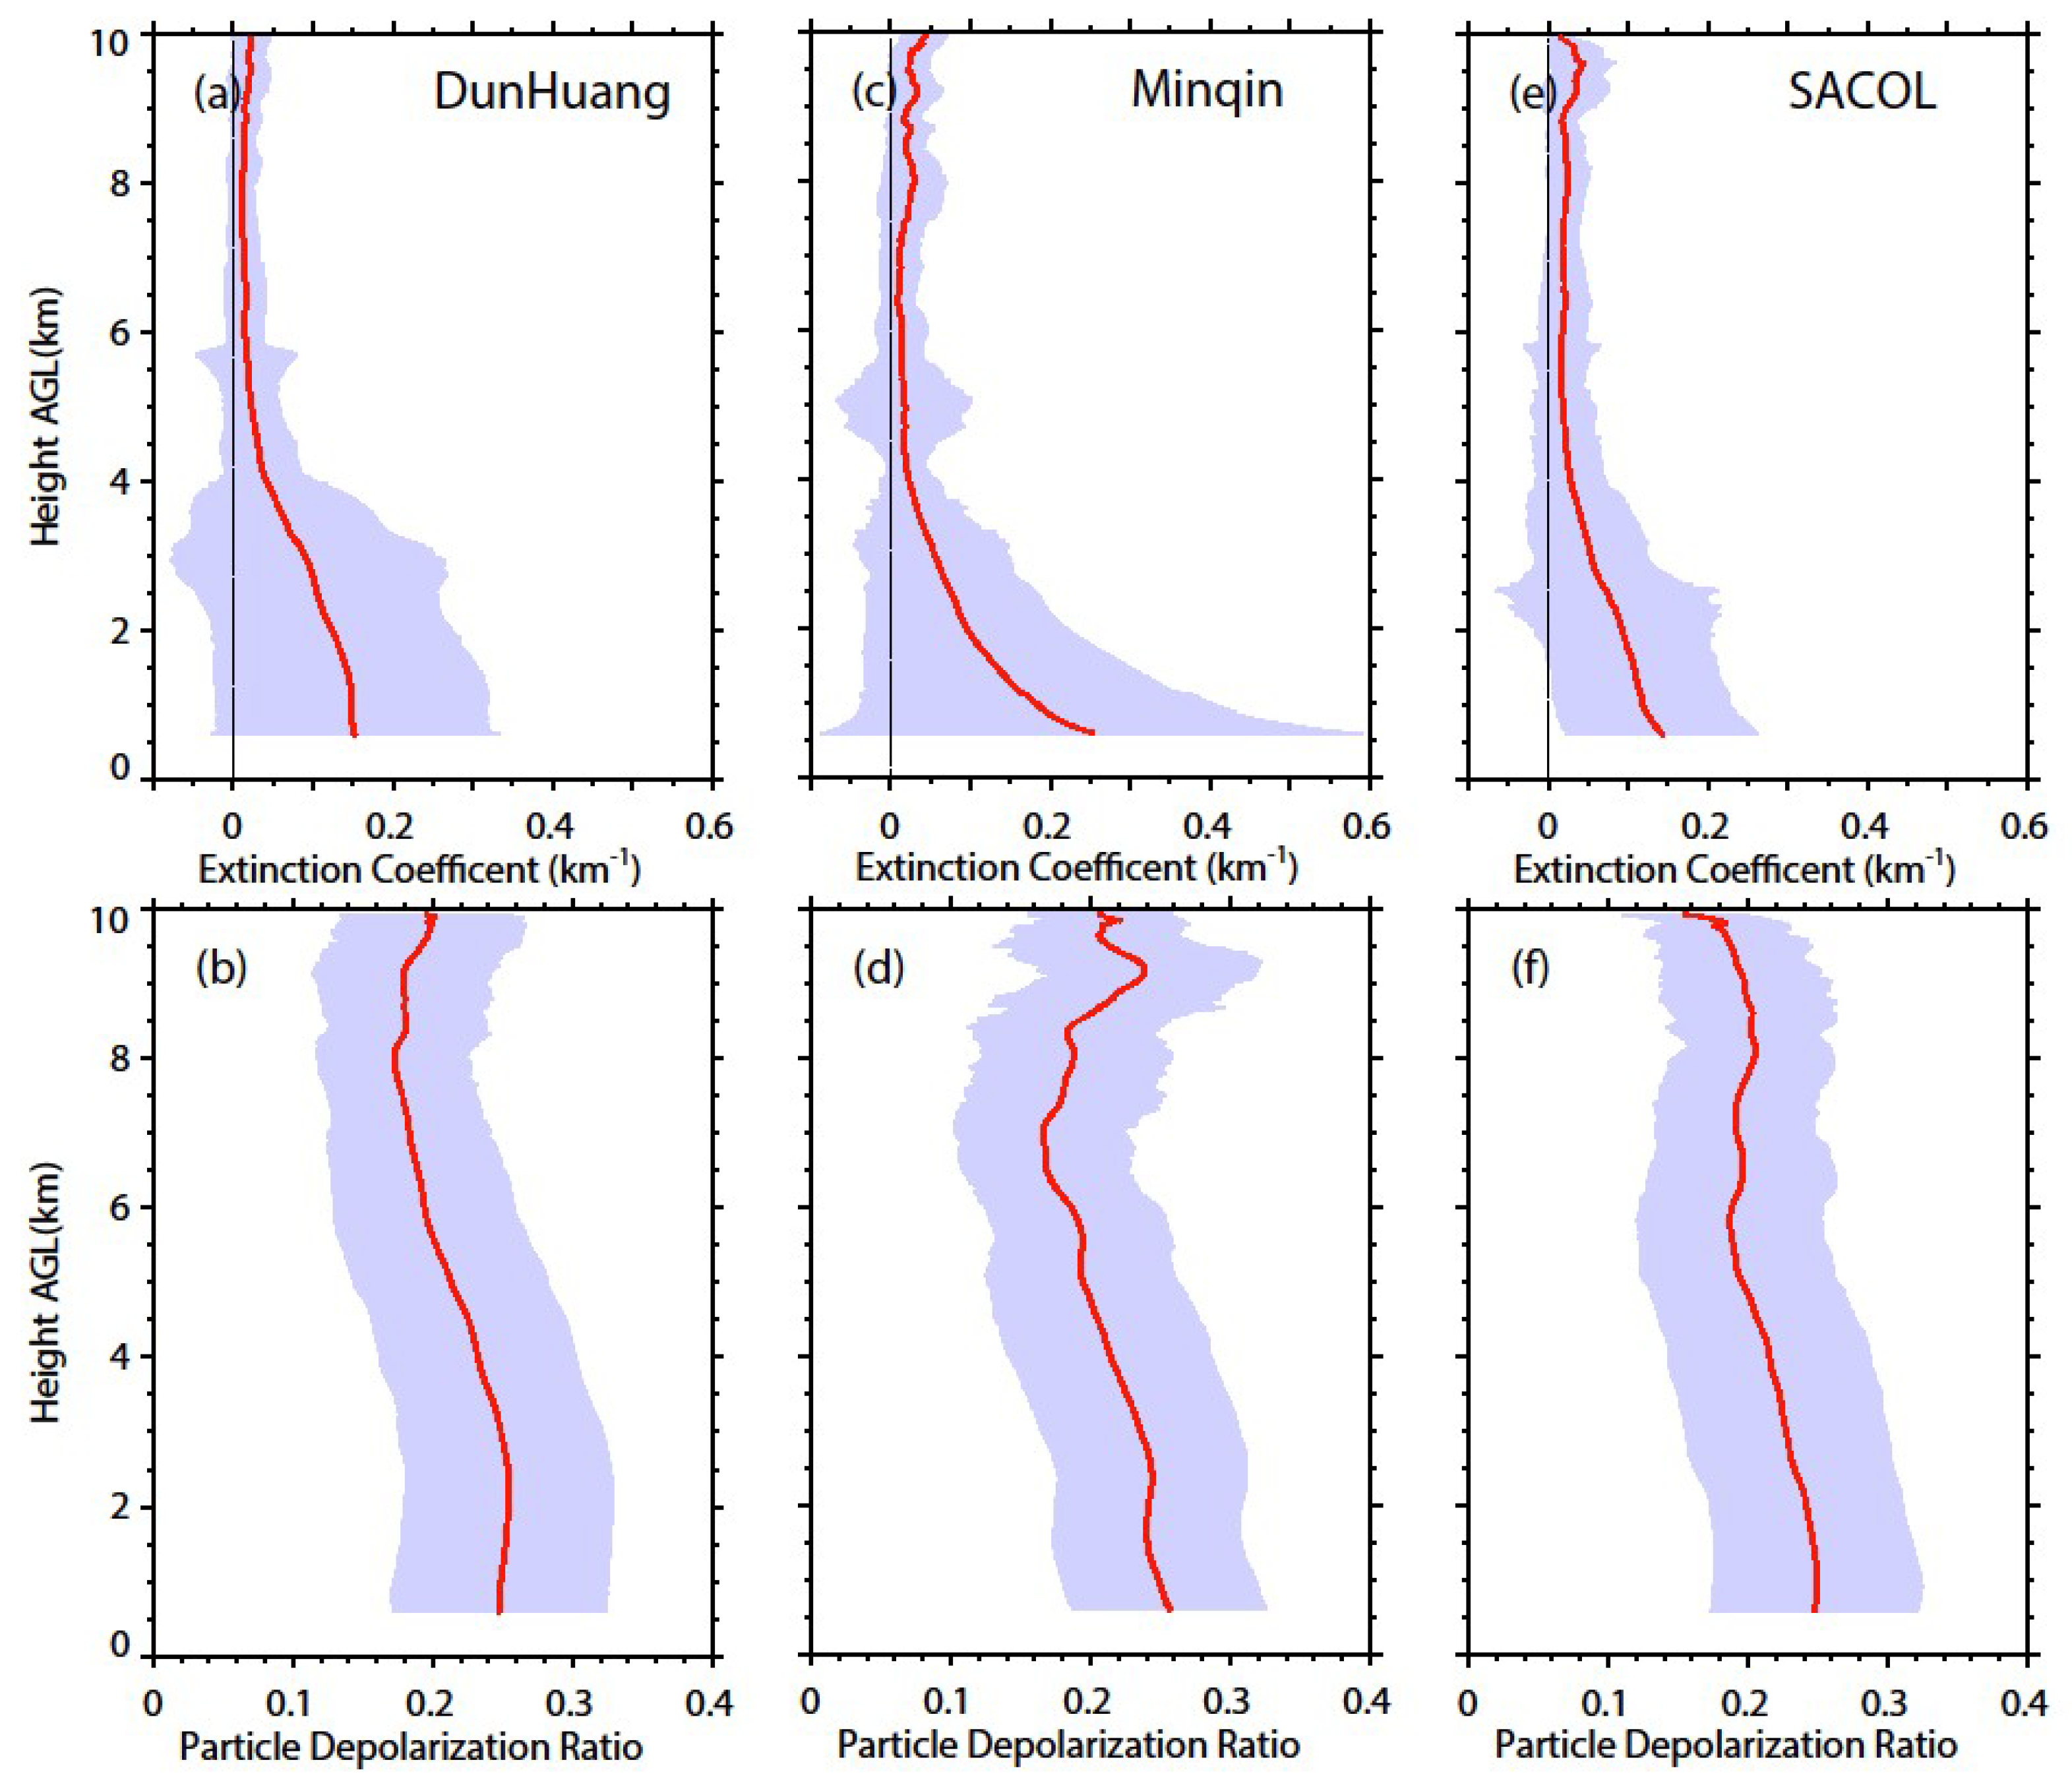
3.3.3. Profiles of Dust Aerosols

Figure 8a–f shows the average profiles of the dust extinction coefficients and PDRs during the entire periods of the three campaigns, along with their standard deviations. Generally, the peaks in the dust extinction coefficients have a similar vertical distribution. Dust aerosols are mostly located from the surface to approximately 4.5 km, with a peak in the extinction coefficient (higher than 0.15 km−1) at an altitude of 0.6 km at three sites. It is known that the extinction coefficient is related to the particle concentration and the PDR can indicate the non-spherical nature of atmosphere particles. Therefore, the dust concentrations in the free troposphere over Minqin and SACOL are slightly higher than those over Dunhuang. At Minqin and SACOL, relatively large peaks in the dust extinction coefficient (approximately 0.073 km−1) are observed from 7 km to 10.0 km and from 9 km to 10 km, respectively. Comparing with the vertical structure of the dust extinction coefficient at SACOL, the extension from the surface to 10 km height is larger in magnitude at Dunhuang and Minqin. The relatively large mean PDRs vary in the range of 0.17–0.26 at three sites. The PDRs are located between 0.22 and 0.24 at SACOL, corresponding to the smallest variation with height. Obviously, the nadirs at 5.5–8.0 km reflect the two peaks that exist in the three average profiles of the PDR. In other words, there are two dust layers in the average profiles. The lower peaks of the PDRs appear at heights of approximately 2.5 km, 0.6 km and 1.0 km at Dunhuang, Minqin and SACOL, respectively, while the upper peaks appear at heights of approximately 10 km, 9.2 km and 8 km, respectively. Therefore, it is very clear that the upper dust layers are scaling down from Dunhuang to SACOL. We attributed this finding to the differences in the locations of the three sites. Dunhuang and Minqin are located in the dust source regions. Minqin and SACOL are located in the eastward transmission path of the Taklimakan and Gobi Deserts dust from Dunhuang. The vertical transport of dust particles at Dunhuang and Minqin sites is often due to strong convective activities. Only two scenarios can be considered at SACOL: long-range-transported dust layers in the free troposphere or dust mobilization within the atmospheric boundary layer. The activities of the vertical transport gradually weaken, and the long-range-transported dust layers are more common when moving from Dunhuang and Minqin to SACOL. The large standard deviations in these profiles are mainly due to the large number of dust particle layers that are common at three sites during the observation periods (e.g., the lofted dust layer, near-surface dust layer and long-range-transported dust layer in the free troposphere).

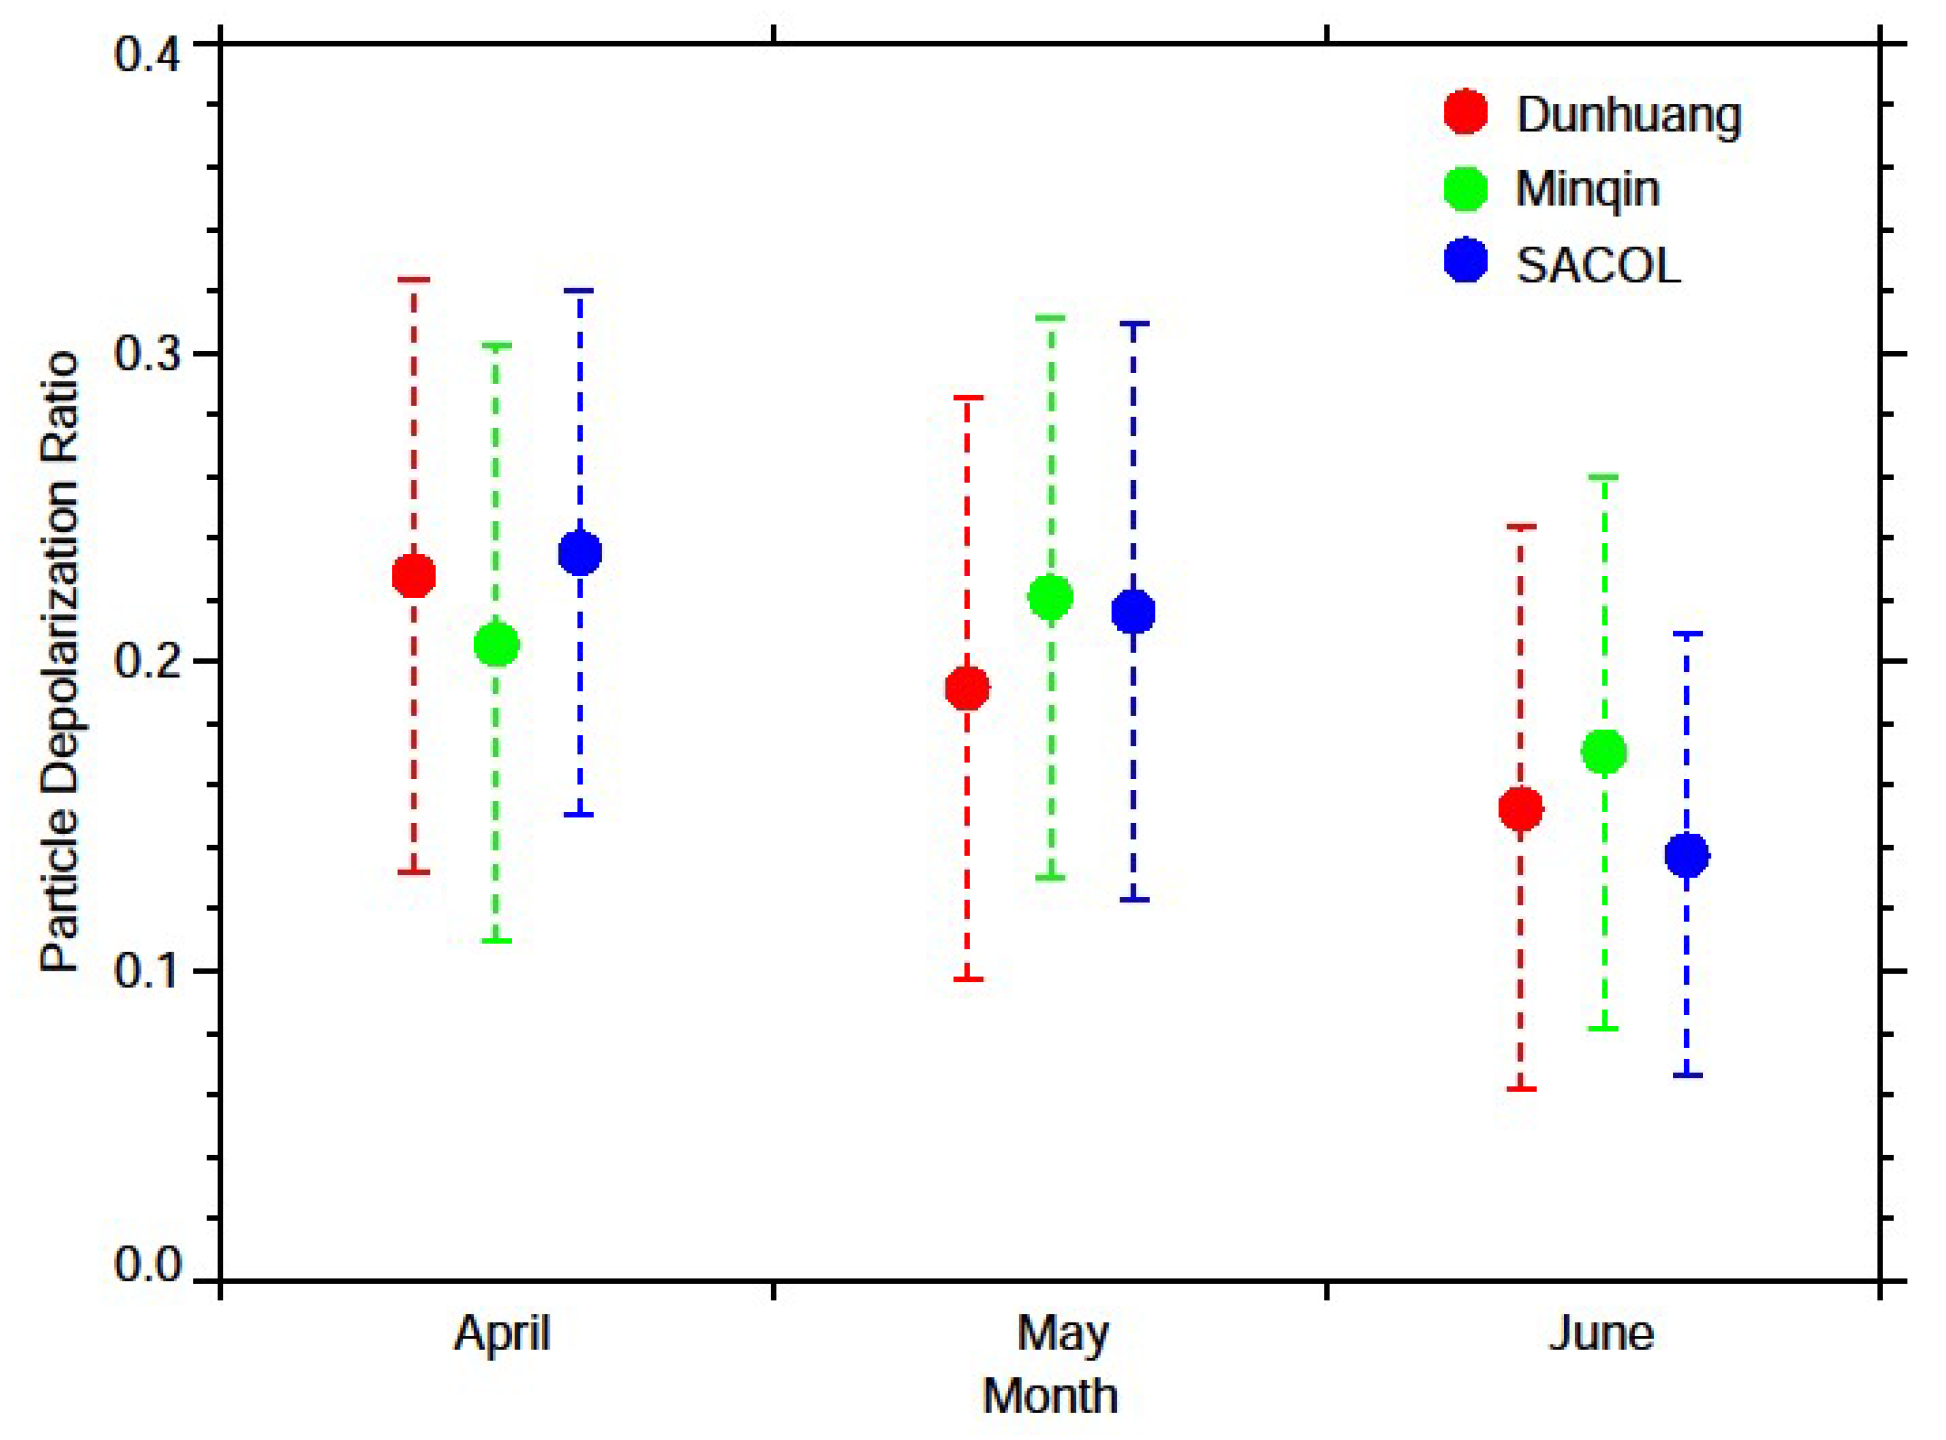
3.3.4. PDRs of Dust Aerosols

Previous studies with lidar measurements have focused mostly on the PDR at a wavelength of 532 nm. Here, we ignored the difference in the PDR due to the spectral differences between 532 nm and 527 nm. The PDR ranges from 0.25–0.40 in the dust cases in this study. The lofted dust layer in Case 1 has a mean PDR of 0.35. The mean PDRs (0.36) of the near-ground dust layers in Cases 2 and 3 are slightly higher than those in Case 1. As indicated by Sugimoto et al. [58], high values of 0.3–0.35 imply the occurrence of nearly pure dust particles. Therefore, all presented dust cases with a maximum PDR of 0.40 can be identified as pure dust cases. The monthly average PDRs at three sites are shown in Figure 9. We can clearly see that the mean PDRs gradually decrease from April to June at each site. These average values are all between 0.14 and 0.24, and the smallest magnitude can be found at Minqin. The negative trend of the average PDRs indicates that the dust load of the total air mass is gradually declining.
Comparing our results with those from the literature at sites in adjacent areas, PDRs of 0.31–0.35 were measured at Dushanbe, Tajikistan [26]. PDRs of 0.09–0.11 in a lofted dust layer and of 0.18–0.33 in a near-ground dust layer were reported in Aksu [30]. Iwasaka et al. [27] measured a high PDR of 0.27 in a lofted dust layer over Dunhuang. PDRs of 0.3–0.35 were measured for dust aerosols during a summer dust observation campaign [27,59]. At Shapotou, the PDRs ranged from 0.1–0.4 for dense dust within the boundary layer [60]. It was also reported that the PDRs of Asian dust particles vary from 0.08 to 0.35 [52,61,62]. According to these results, the PDRs of the dust cases in our study are mostly higher than those in the previous studies mentioned above, but the average PDRs are similar.

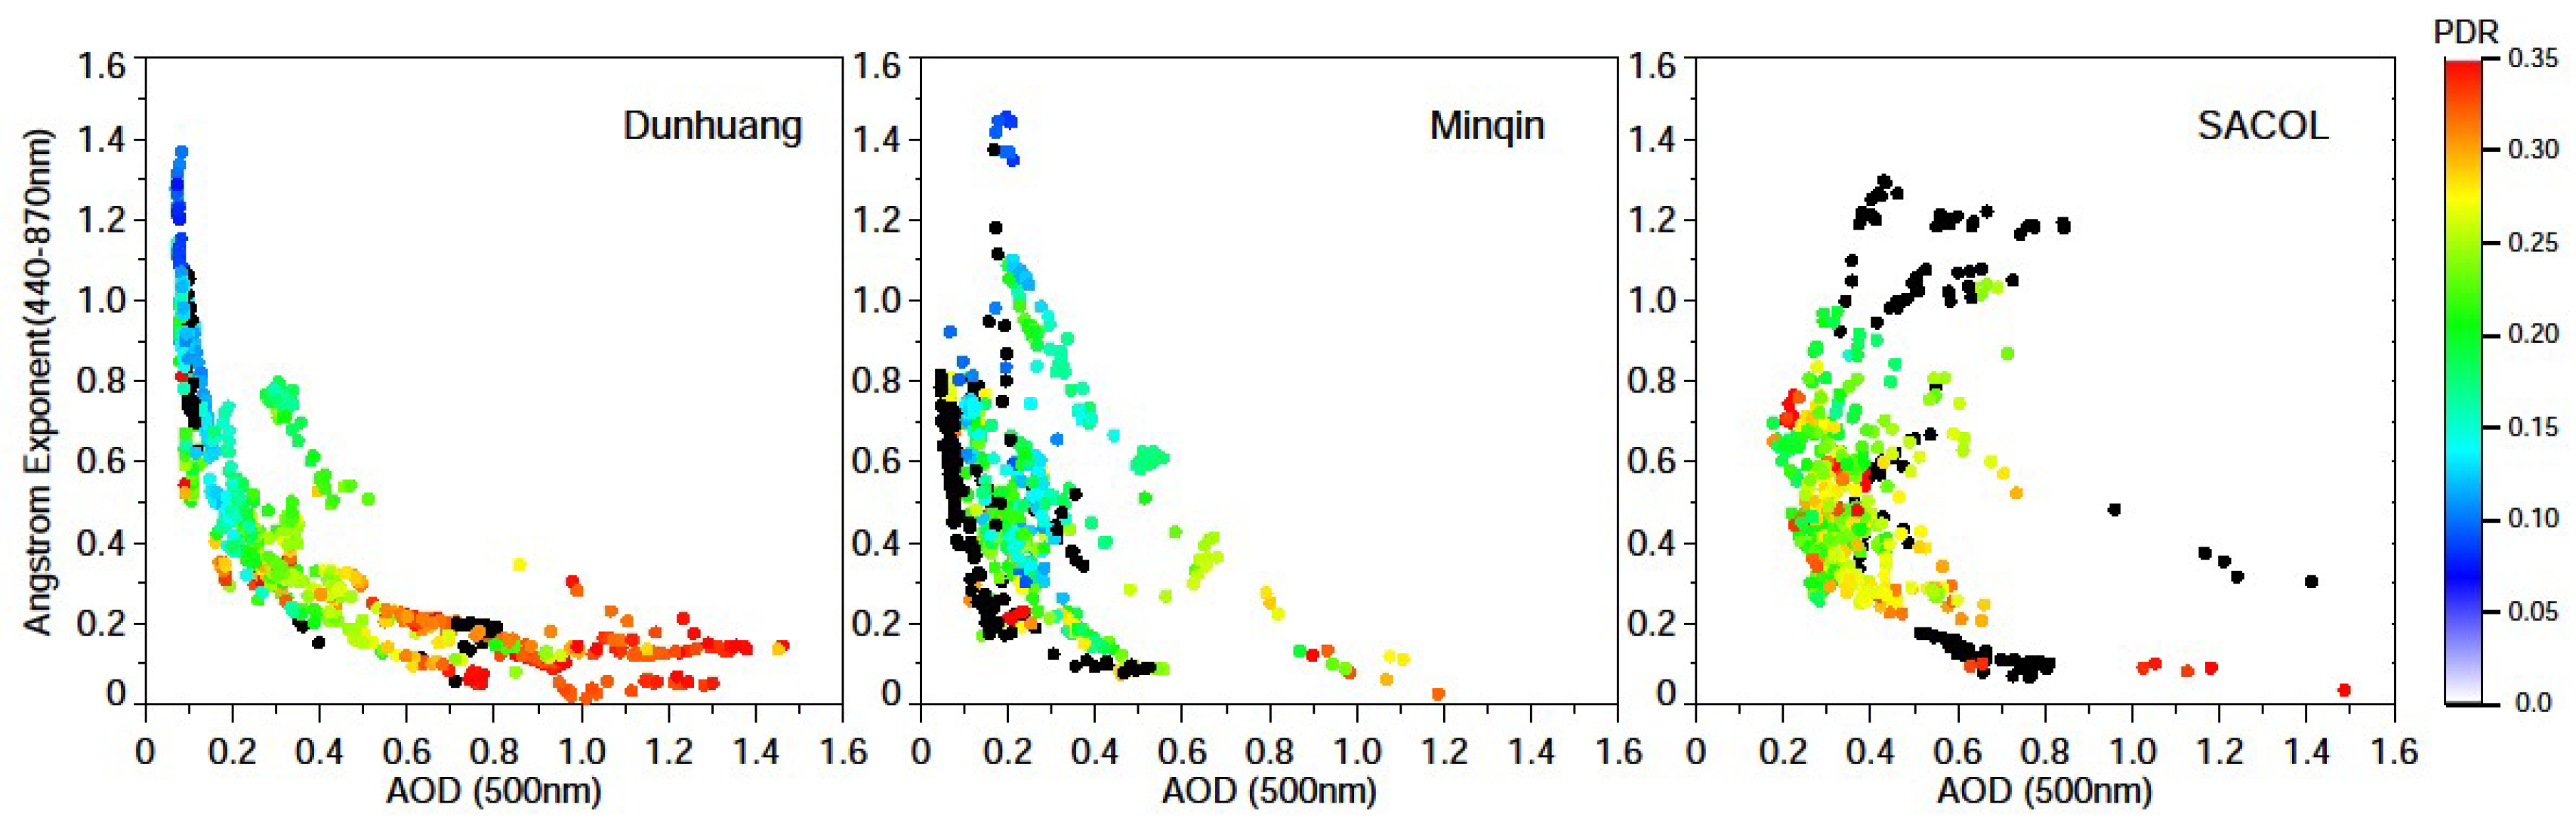
3.3.5. Potential Effect on Dust Aerosol Properties

As shown in Figure 10, the scatter plots of the AOD at 500 nm (AOD500) versus the AE at 440–870 nm (AE440–870) at three sites provide an indication of the aerosol loading associated with the particle size. Instantaneous measurements were made by the sun photometer during 3 April–2 May 2012 at Dunhuang, 18 May–20 June 2010 at Minqin, and 1 April–7 May 2011 at SACOL, respectively. Figure 10 reveals AOD500 ranges of 0.07–1.46, 0.05–1.19 and 0.18–2.95 at Dunhuang, Minqin and SACOL, respectively. The corresponding AE440–870 ranges are 0.016–1.37, 0.03–1.45, and −0.01–1.30. The largest AOD500 range occurs at SACOL. The spread of the AE440–870 values at the other sites is larger than that at SACOL. These scatter plots could be roughly classified into two types: (1) AE440–870 decreases monotonously as AOD500 increases and (2) AE440–870 ( < 0.7) decreases as AOD500 ( > 0.2) increases and AE440–870 ( > 0.7) increases as AOD500 ( > 0.2) increases. Consequently, the AE440–870 at Dunhuang exhibits a relatively simple negative correlation with AOD500. The AE440–870 at Minqin also shows a similar dependence on AOD500. The scatter plots of these two sites could be categorized as the first type, whereas the relationship between AE440–870 and AOD500 at SACOL matches the second type better. The PDRs of each scatter dot in Figure 10 are also presented by different colors. Overall, almost all PDRs are higher than 0.1, which suggests that dust particles are a main component of ambient air. The red dots suggest that severe dust events occurred. Pure dust with a maximum PDR of 0.40 can be seen at three sites. Certainly, a few areas with very clear air are also shown, for example, the blue dots located in the upper left corners of the Dunhuang and Minqin plots. Otherwise, a mixture of dust aerosols and other types of aerosols is indicated.
The scatter plots may allow us to define physically interpretable cluster regions for different types of aerosols [63]. Although the coarse model dominates during the three campaigns, distinct measured optical properties are presented among these sites, which indicate an abundance of other aerosol types and mixtures. To analyze the differences, a classification frame-diagram is employed in order to sort the aerosols at three sites. For AE440–870 and AOD500 in Figure 10, the thresholds of each category subsection for the different aerosol state (clean continental air, biomass burning/urban aerosols, mixed type aerosols and desert dust) are taken from Table 2 in a previous study [64]. The conditions of clean continental air with an AOD500 value below the threshold of 0.07 occurred only on 19 May and 17–18 June at Minqin. Dots with AOD500 values of 0.2–2 and AE440–870 values of −0.5–0.5 are considered to represent the arrival or end of dust events. During this process, the AOD500 increases with AE440–870 decreasing. The reverse pattern occurs at the end of a dust period. The dots with AE440–870 > 1.1 and AOD500 nearly equal to 0.07, which are located in the upper left corner of Figure 10 for Dunhuang, show the lowest turbidity and a relative predominance of fine particles. At SACOL, the dots with AOD500 equal to 0.07–2 and AE440–870 > 1.1 represent biomass burning/urban aerosols, similar to those reported in previous studies [64,65]. For mixtures of different aerosol types with AOD500 values of 0.07–0.2 and 0.07–2 and AE440–870 values corresponding to −0.5–0.5 and 0.5–1.1, the relatively high turbidity at three sites shows that dust particles and fine particles from anthropogenic emissions coexisted during campaigns periods. The highest turbidity occurs at SACOL, followed by Minqin. The distance increases gradually between the observation sites and major dust sources, and the effects of human activities on the properties of dust aerosols also gradually increase. Therefore, the differences among the results at three sites can be explained by how much the sites are affected by human activity. The greater the human influence, the more complex the aerosol properties become, leading to higher turbidity.

4. Summary and Conclusions

Ground-based lidar observations were carried out over northwestern China over nearly eight years. We provide for the first time a careful study that is mainly based on the observations of polarization-function MPL lidar and sun photometer at Dunhuang, Minqin and SACOL. In this study, dust cases at each site were studied successively. The dust occurrence frequency, vertical structure, and PDR were also statistically analyzed, and the results were compared. In addition, the potential effect of human activities on dust aerosol properties was preliminary analyzed.
Our results clearly show that both a lofted dust layer and near-surface dust layers were characterized by extinction coefficients of 0.25 to 1.05 km−1 and high PDRs of 0.25–0.40 at a 527 nm wavelength. These can be categorized as high-density dust layers. From April to June of 2010, 2011 and 2012 at Minqin, SACOL and Dunhuang, the occurrence frequencies of dust events retrieved from lidar observations were all higher than 88%. Dust events occurred quite often in April and May, and the highest frequency was observed in April. The vertical distributions revealed that the dust layers typically reached 7.8–9.0 km in height or higher. The dust layers with high intensity almost occurred within the atmospheric boundary layer. The average profiles of the dust extinction coefficient had a similar vertical distribution during the three campaigns. The activities of the vertical transport of dust aerosols weaken gradually, and the long-range transported dust aerosols were more common from Dunhuang and Minqin to SACOL. The monthly averaged PDR decreased gradually from April to June, which implies a dust load reduction. Comparing the AOD500, AE440–870 and PDRs, we further confirmed that the mixture of different aerosol types becomes more complex when the effects of human activities increase.
A limited quantitative and qualitative analysis of dust aerosols was presented with limited observations in this study, and we did not more carefully assess the impacts of some factors. For example, all the data were obtained during the same season but in different years. This may be part of the reason for the differences in physical and optical properties; moreover, the uncertainty in the extinction coefficient retrieved with the assumed constant lidar ratio was not examined. This uncertainty will additionally affect the calculation of the PDRs. Significant differences in the relationship between AOD500 and AE440–870 existed among the three sites. Although limited data were used here, a complex mixture of different aerosol types can still be recognized. Under these conditions, using the same constant lidar ratio for the three campaigns will lead to some uncertainty regarding the total differences. Therefore, the extinction coefficient is only roughly variable as a reference. In future work, we will continue to focus on observations to systematically explore more detailed information regarding this region based on multi-wavelength Raman polarization lidar data.

Author Contributions

J.H. and W.Z. conceived and designed the campaigns; J.B., Z.H., J.S. and B.Z. performed the campaigns; H.X. and T.Z. analyzed the data; T.Z. wrote the paper.

Acknowledgments

This work was supported by the National Science Foundation of China (41521004, 41430425, 41505011, 41627807, 41579517, 11562017, 41575017), China 111 project (No. B13045), and the Fundamental Research Funds for the Central University (lzujbky-2017-58, lzujbky-2017-k03, lzujbky-2017-kb02, lzujbky-2017-59). Sun photometer data were obtained through the AERONET website (available online: http://aeronet.gsfc.nasa.gov/cgi-bin/webtool_opera_v2_inv). The authors express gratitude to the NOAA Air Resources Laboratory (ARL) for the HYSPLIT transport model. Acknowledgements are also due to the efforts from all members of the three field campaigns. We also acknowledge all anonymous reviewers for their insightful and valuable comments.

Conflicts of Interest

The authors declare no conflict of interest.

References

  1. Huang, J.; Minnis, P.; Yan, H.; Yi, Y.; Chen, B.; Zhang, L.; Ayers, J.K. Dust aerosol effect on semi-arid climate over northwest china detected from a-train satellite measurements. Atmos. Chem. Phys. 2010, 10, 6863–6872. [Google Scholar] [CrossRef] [Green Version]
  2. Wang, W.; Huang, J.; Zhou, T.; Bi, J.; Lin, L.; Chen, Y.; Huang, Z.; Su, J. Estimation of radiative effect of a heavy dust storm over northwest china using Fu–Liou model and ground measurements. J. Quant. Spectrosc. Radiat. Transf. 2013, 122, 114–126. [Google Scholar] [CrossRef]
  3. Morman, S.A.; Plumlee, G.S. The role of airborne mineral dusts in human disease. Aeolian Res. 2013, 9, 203–212. [Google Scholar] [CrossRef]
  4. Huang, J.; Wang, T.; Wang, W.; Li, Z.; Yan, H. Climate effects of dust aerosols over East Asian arid and semiarid regions. J. Geophys. Res. Atmos. 2014, 119, 11398–11416. [Google Scholar] [CrossRef]
  5. Huang, J.; Liu, J.; Chen, B.; Nasiri, S. Detection of anthropogenic dust using CALIPSO lidar measurements. Atmos. Chem. Phys. 2015, 15, 11653–11665. [Google Scholar] [CrossRef]
  6. Huang, J.; Li, Y.; Fu, C.; Chen, F.; Fu, Q.; Dai, A.; Shinoda, M.; Ma, Z.; Guo, W.; Li, Z.; et al. Dryland climate change: Recent progress and challenges. Rev. Geophys. 2017, 55, 719–778. [Google Scholar] [CrossRef]
  7. Wang, W.; Huang, J.; Minnis, P.; Hu, Y.; Li, J.; Huang, Z.; Ayers, J.K.; Wang, T. Dusty cloud properties and radiative forcing over dust source and downwind regions derived from A-Train data during the Pacific Dust Experiment. J. Geophys. Res. Atmos. 2010, 115. [Google Scholar] [CrossRef]
  8. Ge, J.; Su, J.; Ackerman, T.; Fu, Q.; Huang, J.; Shi, J. Dust aerosol optical properties retrieval and radiative forcing over Northwestern China during the 2008 China-U.S. Joint field experiment. J. Geophys. Res. Atmos. 2010, 115. [Google Scholar] [CrossRef]
  9. Wang, W.; Sheng, L.; Dong, X.; Qu, W.; Sun, J.; Jin, H.; Logan, T. Dust aerosol impact on the retrieval of cloud top height from satellite observations of CALIPSO, CloudSat and MODIS. J. Quant. Spectrosc. Radiat. Transf. 2017, 188, 132–141. [Google Scholar] [CrossRef]
  10. Uno, I.; Eguchi, K.; Yumimoto, K.; Takemura, T.; Shimizu, A.; Uematsu, M.; Liu, Z.; Wang, Z.; Hara, Y.; Sugimoto, N. Asian dust transported one full circuit around the globe. Nat. Geosci. 2009, 2, 557–560. [Google Scholar] [CrossRef]
  11. Huang, J.; Minnis, P.; Chen, B.; Huang, Z.; Liu, Z.; Zhao, Q.; Yi, Y.; Ayers, J.K. Long-range transport and vertical structure of Asian dust from CALIPSO and surface measurements during PACDEX. J. Geophys. Res. Atmos. 2008, 113. [Google Scholar] [CrossRef]
  12. Liu, D.; Wang, Z.; Liu, Z.; Winker, D.; Trepte, C. A height resolved global view of dust aerosols from the first year CALIPSO lidar measurements. J. Geophys. Res. Atmos. 2008, 113. [Google Scholar] [CrossRef]
  13. Liu, D.; Wang, Y.; Wang, Z.; Zhou, J. The three-dimensional structure of transatlantic African dust transport: A new perspective from CALIPSO lidar measurements. Adv. Meteorol. 2012, 2012. [Google Scholar] [CrossRef]
  14. Luo, T.; Wang, Z.; Ferrare, R.A.; Hostetler, C.A.; Yuan, R.; Zhang, D. Vertically resolved separation of dust and other aerosol types by a new lidar depolarization method. Opt. Express 2015, 23, 14095–14107. [Google Scholar] [CrossRef] [PubMed]
  15. Luo, T.; Wang, Z.; Zhang, D.; Liu, X.; Wang, Y.; Yuan, R. Global dust distribution from improved thin dust layer detection using A-Train satellite lidar observations. Geophys. Res. Lett. 2015, 42, 620–628. [Google Scholar] [CrossRef]
  16. Ma, Y.; Gong, W. Evaluating the performance of SVM in dust aerosol discrimination and testing its ability in an extended area. IEEE J. Sel. Top. Appl. Earth Obs. Remote Sens. 2012, 5, 1849–1858. [Google Scholar] [CrossRef]
  17. Zhou, T.; Huang, J.; Huang, Z.; Liu, J.; Wang, W.; Lin, L. The depolarization-attenuated backscatter relationship for dust plumes. Opt. Express 2013, 21, 15195–15204. [Google Scholar] [CrossRef] [PubMed]
  18. Huang, Z.; Huang, J.; Hayasaka, T.; Wang, S.; Zhou, T.; Jin, H. Short-cut transport path for Asian dust directly to the arctic: A case study. Environ. Res. Lett. 2015, 10, 11. [Google Scholar] [CrossRef]
  19. Wang, X.; Pu, W.; Shi, J.; Bi, J.; Zhou, T.; Zhang, X.; Ren, Y. A comparison of the physical and optical properties of anthropogenic air pollutants and mineral dust over northwest china. J. Meteorol. Res. 2015, 29, 180–200. [Google Scholar] [CrossRef]
  20. Noh, Y.; Müller, D.; Lee, H.; Lee, K.; Kim, K.; Shin, S.; Kim, Y. Estimation of radiative forcing by the dust and non-dust content in mixed East Asian pollution plumes on the basis of depolarization ratios measured with lidar. Atmos. Environ. 2012, 61, 221–231. [Google Scholar] [CrossRef]
  21. Wang, X.; Liu, J.; Che, H.; Ji, F.; Liu, J. Spatial and temporal evolution of natural and anthropogenic dust events over Northern China. Sci. Rep. 2018, 8, 2141. [Google Scholar] [CrossRef] [PubMed]
  22. Chen, B.; Sverdlik, L.; Imashev, S.; Solomon, P.; Lantz, J.; Schauer, J.; Shafer, M.; Artamonova, M.; Carmichael, G. Lidar measurements of the vertical distribution of aerosol optical and physical properties over central Asia. Int. J. Atmos. Sci. 2013, 2013, 1–17. [Google Scholar] [CrossRef]
  23. Zhang, L.; Li, Q.B.; Gu, Y.; Liou, K.N.; Meland, B. Dust vertical profile impact on global radiative forcing estimation using a coupled chemical-transport–radiative-transfer model. Atmos. Chem. Phys. 2013, 13, 7097–7114. [Google Scholar] [CrossRef]
  24. Huang, J.; Fu, Q.; Su, J.; Tang, Q.; Minnis, P.; Hu, Y.; Yi, Y.; Zhao, Q. Taklimakan dust aerosol radiative heating derived from CALIPSO observations using the Fu–Liou radiation model with CERES constraints. Atmos. Chem. Phys. 2009, 9, 4011–4021. [Google Scholar] [CrossRef]
  25. Gross, S.; Tesche, M.; Freudenthaler, V.; Toledano, C.; Wiegner, M.; Ansmann, A.; Althausen, D.; Seefeldner, M. Characterization of Saharan dust, marine aerosols and mixtures of biomass-burning aerosols and dust by means of multi-wavelength depolarization and Raman lidar measurements during SAMUM 2. Tellus Ser. BChem. Phys. Meteorol. 2011, 63, 706–724. [Google Scholar] [CrossRef]
  26. Hofer, J.; Althausen, D.; Abdullaev, S.F.; Makhmudov, A.N.; Nazarov, B.I.; Schettler, G.; Engelmann, R.; Baars, H.; Fomba, K.W.; Müller, K.; et al. Long-term profiling of mineral dust and pollution aerosol with multiwavelength polarization/Raman lidar at the Central Asian site of Dushanbe, Tajikistan: Case studies. Atmos. Chem. Phys. Discuss. 2017, 17, 14559–14577. [Google Scholar] [CrossRef]
  27. Iwasaka, Y.; Shibata, T.; Nagatani, T.; Shi, G.; Kim, Y.; Matsuki, A.; Trochkine, D.; Zhang, D.; Yamada, M.; Nagatani, M.; et al. Large depolarization ratio of free tropospheric aerosols over the Taklamakan desert revealed by lidar measurements: Possible diffusion and transport of dust particles. J. Geophys. Res. Atmos. 2003, 108. [Google Scholar] [CrossRef]
  28. Iwasaka, Y.; Shi, G.; Yamada, M.; Matsuki, A.; Trochkine, D.; Kim, Y.; Zhang, D.; Nagatani, T.; Shibata, T.; Nagatani, M.; et al. Importance of dust particles in the free troposphere over the Taklamakan desert: Electron microscopic experiments of particles collected with a balloonborne particle impactor at Dunhuang, China. J. Geophys. Res.Atmos. 2003, 108. [Google Scholar] [CrossRef]
  29. Kai, K.; Tsunematsu, N.; Matsumoto, T.; Zhou, H.F.; Hu, S.J.; Nagai, T.; Matsumura, T.; Abo, M. Vertical structure of the dust layer and high- and middle-level clouds over the Taklamakan desert by lidar. In Proceedings of the 22nd International Laser Radar Conference, Matera, Italy, 12–16 July 2004; Volume 561, pp. 895–898. [Google Scholar]
  30. Kai, K.; Nagata, Y.; Tsunematsu, N.; Matsumura, T.; Kim, H.-S.; Matsumoto, T.; Hu, S.; Zhou, H.; Abo, M.; Nagai, T. The structure of the dust layer over the Taklimakan desert during the dust storm in April 2002 as observed using a depolarization lidar. J. Meteorol. Soc. Japan 2008, 86, 1–16. [Google Scholar] [CrossRef]
  31. Liu, J.; Huang, J.; Chen, B.; Zhou, T.; Yan, H.; Jin, H.; Huang, Z.; Zhang, B. Comparisons of PBL heights derived from CALIPSO and ECMWF reanalysis data over China. J. Quant. Spectrosc. Radiat. Transf. 2015, 153, 102–112. [Google Scholar] [CrossRef]
  32. Jin, Y.; Kai, K.; Shibata, T.; Zhang, K.; Zhou, H. Validation of the dust layer structure over the taklimakan desert, china by the CALIOP space-borne lidar using ground-based lidar. Sola 2010, 6, 121–124. [Google Scholar] [CrossRef]
  33. Zhu, W.; Xu, C.; Qian, X.; Wei, H. Statistical analysis of the spatial-temporal distribution of aerosol extinction retrieved by micro-pulse lidar in Kashgar, China. Opt. Express 2013, 21, 2531–2537. [Google Scholar] [CrossRef] [PubMed]
  34. Huang, Z.; Huang, J.; Bi, J.; Wang, G.; Wang, W.; Fu, Q.; Li, Z.; Tsay, S.-C.; Shi, J. Dust aerosol vertical structure measurements using three MPL lidars during 2008 China-U.S. Joint dust field experiment. J. Geophys. Res. Atmos. 2010, 115. [Google Scholar] [CrossRef]
  35. Huang, J.; Huang, Z.; Bi, J.; Zhang, W.; Zhang, L. Micro-pulse lidar measurements of aerosol vertical structure over the loess plateau. Atmos. Ocean. Sci. Lett. 2008, 1, 8–11. [Google Scholar]
  36. Huang, J.; Zhang, W.; Zuo, J.; Bi, J.; Shi, J.; Wang, X.; Chang, Z.; Huang, Z.; Yang, S.; Zhang, B.; et al. An overview of the semi-arid climate and environment research observatory over the loess plateau. Adv. Atmos. Sci. 2008, 25, 906–921. [Google Scholar] [CrossRef]
  37. Bi, J.; Huang, J.; Shi, J.; Hu, Z.; Zhou, T.; Zhang, G.; Huang, Z.; Wang, X.; Jin, H. Measurement of scattering and absorption properties of dust aerosol in a Gobi farmland region of northwestern China—A potential anthropogenic influence. Atmos. Chem. Phys. 2017, 17, 7775–7792. [Google Scholar] [CrossRef]
  38. Bi, J.; Huang, J.; Fu, Q.; Ge, J.; Shi, J.; Zhou, T.; Zhang, W. Field measurement of clear-sky solar irradiance in Badain Jaran desert of Northwestern China. J. Quant. Spectrosc. Radiat. Transf. 2013, 122, 194–207. [Google Scholar] [CrossRef]
  39. Xie, H.; Zhou, T.; Fu, Q.; Huang, J.; Huang, Z.; Bi, J.; Shi, J.; Zhang, B.; Ge, J. Automated detection of cloud and aerosol features with SACOL micro-pulse lidar in Northwest China. Opt. Express 2017, 25, 30732. [Google Scholar] [CrossRef] [PubMed]
  40. Holben, B.N.; Eck, T.F.; Slutsker, I.; Tanre, D.; Buis, J.P.; Setzer, A.; Vermote, E.; Reagan, J.A.; Kaufman, Y.J.; Nakajima, T.; et al. Aeronet—A federated instrument network and data archive for aerosol characterization. Remote Sens. Environ. 1998, 66, 1–16. [Google Scholar] [CrossRef]
  41. Eck, T.F.; Holben, B.N.; Reid, J.S.; Dubovik, O.; Smirnov, A.; O’Neill, N.T.; Slutsker, I.; Kinne, S. Wavelength dependence of the optical depth of biomass burning, urban, and desert dust aerosols. J. Geophys. Res. Atmos. 1999, 104, 31333–31349. [Google Scholar] [CrossRef]
  42. Dubovik, O.; Holben, B.; Eck, T.F.; Smirnov, A.; Kaufman, Y.J.; King, M.D.; Tanre, D.; Slutsker, I. Variability of absorption and optical properties of key aerosol types observed in worldwide locations. J. Atmos. Sci. 2002, 59, 590–608. [Google Scholar] [CrossRef]
  43. Haarig, M.; Ansmann, A.; Althausen, D.; Klepel, A.; Gross, S.; Freudenthaler, V.; Toledano, C.; Mamouri, R.-E.; Farrell, D.A.; Prescod, D.A.; et al. Triple-wavelength depolarization-ratio profiling of Saharan dust over Barbados during Saltrace in 2013 and 2014. Atmos. Chem. Phys. 2017, 17, 10767–10794. [Google Scholar] [CrossRef]
  44. Thorsen, T.; Fu, Q.; Newsom, R.; Turner, D.; Comstock, J. Automated retrieval of cloud and aerosol properties from the arm Raman lidar. Part I: Feature detection. J. Atmos. Ocean. Technol. 2015, 32, 1977–1998. [Google Scholar] [CrossRef]
  45. Thorsen, T.; Fu, Q. Automated retrieval of cloud and aerosol properties from the arm Raman lidar. Part II: Extinction. J. Atmos. Ocean. Technol. 2015, 32, 1999–2023. [Google Scholar] [CrossRef]
  46. Flynn, C.; Mendoza, A.; Zheng, Y.; Mathur, S. Novel polarization-sensitive micropulse lidar measurement technique. Opt. Express 2007, 15, 2785. [Google Scholar] [CrossRef] [PubMed]
  47. Bravo-Aranda, J.A.; Belegante, L.; Freudenthaler, V.; Alados-Arboledas, L.; Nicolae, D.; Granados-Muñoz, M.J.; Guerrero-Rascado, J.L.; Amodeo, A.; D’Amico, G.; Engelmann, R.; et al. Assessment of lidar depolarization uncertainty by means of a polarimetric lidar simulator. Atmos. Meas. Tech. 2016, 9, 4935–4953. [Google Scholar] [CrossRef]
  48. Freudenthaler, V. About the effects of polarising optics on lidar signals and the Delta90 calibration. Atmos. Meas. Tech. 2016, 9, 4181–4255. [Google Scholar] [CrossRef]
  49. Belegante, L.; Bravo-Aranda, J.A.; Freudenthaler, V.; Nicolae, D.; Nemuc, A.; Ene, D.; Alados-Arboledas, L.; Amodeo, A.; Pappalardo, G.; D’Amico, G.; et al. Experimental techniques for the calibration of lidar depolarization channels in earlinet. Atmos. Meas. Tech. 2018, 11, 1119–1141. [Google Scholar] [CrossRef]
  50. Córdoba-Jabonero, C.; Guerrero-Rascado, J.L.; Toledo, D.; Parrondo, M.; Yela, M.; Gil, M.; Ochoa, H.A. Depolarization ratio of polar stratospheric clouds in coastal Antarctica: Comparison analysis between ground-based micro pulse lidar and space-borne CALIOP observations. Atmos. Meas. Tech. 2013, 6, 703–717. [Google Scholar] [CrossRef]
  51. Behrendt, A.; Nakamura, T. Calculation of the calibration constant of polarization lidar and its dependency on atmospheric temperature. Opt. Express 2002, 10, 805–817. [Google Scholar] [CrossRef] [PubMed]
  52. Shimizu, A.; Sugimoto, N.; Matsui, I.; Arao, K.; Uno, I.; Murayama, T.; Kagawa, N.; Aoki, K.; Uchiyama, A.; Yamazaki, A. Continuous observations of Asian dust and other aerosols by polarization lidars in China and Japan during ACE-Asia. J. Geophys. Res. Atmos. 2004, 109. [Google Scholar] [CrossRef]
  53. Freudenthaler, V.; Esselborn, M.; Wiegner, M.; Heese, B.; Tesche, M.; Ansmann, A.; Mueller, D.; Althausen, D.; Wirth, M.; Fix, A.; et al. Depolarization ratio profiling at several wavelengths in pure Saharan dust during SAMUM 2006. Tellus Ser. BChem. Phys. Meteorol. 2009, 61, 165–179. [Google Scholar] [CrossRef] [Green Version]
  54. Fernald, F. Analysis of atmospheric lidar observations: Some comments. Appl. Opt. 1984, 23, 652. [Google Scholar] [CrossRef] [PubMed]
  55. Shimizu, A.; Sugimoto, N.; Matsui, I.; Mori, I.; Nishikawa, M.; Kido, M. Relationship between lidar-derived dust extinction coefficients and mass concentrations in Japan. Sola 2011, 7A, 1–5. [Google Scholar] [CrossRef]
  56. Sugimoto, N.; Huang, Z. Lidar methods for observing mineral dust. J. Meteorol. Res. 2014, 28, 173–184. [Google Scholar] [CrossRef]
  57. Jugder, D.; Sugimoto, N.; Shinoda, M.; Kimura, R.; Matsui, I.; Nishikawa, M. Dust, biomass burning smoke, and anthropogenic aerosol detected by polarization-sensitive Mie lidar measurements in Mongolia. Atmos. Environ. 2012, 54, 231–241. [Google Scholar] [CrossRef]
  58. Sugimoto, N.; Lee, C.H. Characteristics of dust aerosols inferred from lidar depolarization measurements at two wavelengths. Appl. Opt. 2006, 45, 7468–7474. [Google Scholar] [CrossRef] [PubMed]
  59. Yi, B.; Yang, P.; Baum, B.A. Impact of pollution on the optical properties of trans-pacific East Asian dust from satellite and ground-based measurements. J. Geophys. Res. Atmos. 2014, 119, 5397–5409. [Google Scholar] [CrossRef]
  60. Yasui, M.; Zhou, J.X.; Liu, L.C.; Itabe, T.; Mizutani, K.; Aoki, T. Vertical profiles of Aeolian dust in a desert atmosphere observed using lidar in Shapotou, China. J. Meteorol. Soc. Japan 2005, 83A, 149–171. [Google Scholar] [CrossRef]
  61. Murayama, T.; Muller, D.; Wada, K.; Shimizu, A.; Sekiguchi, M.; Tsukamoto, T. Characterization of Asian dust and Siberian smoke with multiwavelength Raman lidar over Tokyo, Japan in spring 2003. Geophys. Res. Lett. 2004, 31. [Google Scholar] [CrossRef]
  62. Shin, D.; Mueller, D.; Choi, T.; Noh, Y.; Yoon, Y.; Lee, K.; Shin, S.; Chae, N.; Kim, K.; Kim, Y. Influence of wind speed on optical properties of aerosols in the marine boundary layer measured by ship-borne depolarization lidar in the coastal area of Korea. Atmos. Environ. 2014, 83, 282–290. [Google Scholar] [CrossRef] [Green Version]
  63. Smirnov, A.; Holben, B.N.; Kaufman, Y.J.; Dubovik, O.; Eck, T.F.; Slutsker, I.; Pietras, C.; Halthore, R.N. Optical properties of atmospheric aerosol in maritime environments. J. Atmos. Sci. 2002, 59, 501–523. [Google Scholar] [CrossRef]
  64. Ma, Y.; Xin, J.; Ma, Y.; Kong, L.; Zhang, K.; Zhang, W.; Wang, Y.; Wang, X.; Zhu, Y. Optical properties and source analysis of aerosols over a desert area in Dunhuang, Northwest China. Adv. Atmos. Sci. 2017, 34, 1017–1026. [Google Scholar] [CrossRef]
  65. Holben, B.; Tanre, D.; Smirnov, A.; Eck, T.; Slutsker, I.; Abuhassan, N.; Newcomb, W.; Schafer, J.; Chatenet, B.; Lavenu, F.; et al. An emerging ground-based aerosol climatology: Aerosol optical depth from Aeronet. J. Geophys. Res. Atmos. 2001, 106, 12067–12097. [Google Scholar] [CrossRef]
Figure 1. Geographical map with major dust source regions (black text) over East Asia; the sites of the three field campaigns in Dunhuang, Minqin and SACOL a remarked in blue text. The map colors were modulated on the basis of the elevation and environment (arid regions, warm humid regions and cold humid regions) (adapted from http://www.naturalearthdata.com/).
Atmosphere 09 00173 g001
Figure 2. The MPL lidar extinction coefficients for dust (upper panel) and spherical aerosols (lower panel) at (a,b) Dunhuang, (c,d) Minqin, and (e,f) SACOL from April to June 2012, 2010 and 2011. The extinction coefficient is indicated by the colored bars: red, green and blue indicate high, medium, and low density, respectively. Clouds are indicated in black. The height ranges where the signal intensity is too low are indicated in white. Periods of missing measurements are also indicated in white.
Atmosphere 09 00173 g002
Figure 3. Case 1: on 22–24 April 2012. The time-height indications of the (a) NRB and (b) linear depolarization ratio; (c) the time series of air pressure, air temperature, wind speed and relative humidity; (d) the profiles of the extinction coefficient, PDR, and dust fraction (where the different colors represent different hours and days (parentheses)); and (e) the 72 HYSPLIT backward trajectories arriving at Dunhuang at 17:00 UTC on 22 April 2012 at 1.0, 2.0, and 3.5 km height.
Atmosphere 09 00173 g003
Figure 4. (ad) are the same as in Figure 3 but for Case 2, 23–25 May 2010; (e) the 72 HYSPLIT backward trajectories arriving at Minqin at 08:00 UTC on 24 May 2010 at 0.5, 1.5 and 2.0 km height.
Atmosphere 09 00173 g004
Figure 5. (ad) are the same as in Figure 3 but for Case 3, on 18–19 May 2011; (e) the 72 HYSPLIT backward trajectories arriving at SACOL at 03:00 UTC on 18 May 2011 at 0.5, 1.0, and 1.5 km height.
Atmosphere 09 00173 g005
Figure 6. The monthly frequency of high (red)-, medium (green)-, and low (blue)-density dust events at Dunhuang (Left), Minqin (Middle) and SACOL (Right) for each month.
Atmosphere 09 00173 g006
Figure 7. The vertical distribution of dust layers according to the occurrence frequency at (a) Dunhuang, (b) Minqin and (c) SACOL for various dust densities (low, medium and high) derived from the dust profiles identified from lidar observations during April–June in 2012, 2010 and 2011.
Atmosphere 09 00173 g007
Figure 8. The average profiles (red) with the standard deviations (purple) of the extinction coefficients and PDR during the entire periods of the three campaigns for dust aerosols at (a,b) Dunhuang, (c,d) Minqin, and (e,f) SACOL.
Atmosphere 09 00173 g008
Figure 9. The monthly averaged PDR of dust aerosols at Dunhuang (red dots), Minqin (green dots) and SACOL (blue dots). The vertical dashed lines indicate the standard deviations.
Atmosphere 09 00173 g009
Figure 10. The scatter plots of the AOD500 versus AE440–870 retrieved from AERONET data at Dunhuang, Minqin and SACOL. The variation in the PDR retrieved from lidar is indicated by the color scale. The black dots indicate missing lidar observations.
Atmosphere 09 00173 g010

