Multidecadal Variability in the Subseasonal Peak of Low-Level Convergence over the Pacific Warm Pool


1
Department of Plants, Soils, and Climate, Utah State University, Logan, UT 84322, USA
2
Utah Climate Center, Utah State University, Logan, UT 84322, USA
*
Author to whom correspondence should be addressed.
Atmosphere 2018, 9(5), 158; https://doi.org/10.3390/atmos9050158
Submission received: 6 February 2018
/
Revised: 20 April 2018
/
Accepted: 21 April 2018
/
Published: 24 April 2018
(This article belongs to the Special Issue Monsoons)
Abstract
:In the Western North Pacific (WNP), the atmospheric low-level convergence is one of the main factors that influences the genesis of tropical cyclones (TC). It has been observed that the timing of the seasonal maxima in the low-level convergence and TC genesis has shifted since the mid-1990s from mid-August to late-July, with this shift having also affected the number of TC. A multidecadal frequency of 20 years was revealed in the timing variation of the tropical intraseasonal oscillation (ISO) in the Western Pacific, in which a weak WNP low-level convergence in spring may trigger an advanced ISO phase in summer and vice versa. The present diagnostic analysis does not identify any prominent oceanic variations associated with these multidecadal variations in the summer ISO or in the spring setup of the ISO. The atmospheric circulation does show an anomaly, which suggests an intensified extension of the subtropical high. The possible mechanism may be related to stochastic low-frequency variability of the atmosphere, which acts to influence the seasonal evolution of the WNP low-level convergence.
1. Introduction
The Western North Pacific (WNP) features the highest population of tropical cyclones (TCs) compared to any other ocean basin [1]. Climatologically, the frequency of TC peaks in the month of August with the occurrence of approximately 6 cyclones. This seasonal increase in the TC activity during August accompanies the revival phase of the East Asia–WNP summer monsoon lifecycle [2]. The number of WNP TCs has declined in the recent decade [3,4], which is possibly due to the strengthening of the vertical wind shear and intensification of the subtropical high. In August 2014, WNP had a remarkably quiet TC season without a single TC having formed. This dramatic reduction in the TC activity created a “typhoon drought” in Taiwan, causing severe water shortage [5]. After analyzing the anomaly that occurred in August 2014, Hong et al. [6] suggested that the positive sea surface temperature anomaly (SSTA) in the eastern North Pacific reduced the Walker circulation, which formed a marked divergent anomaly that suppressed TC formation. Intrigued by the remarkable inactivity of TCs in August 2014 and how this event seems to be embedded in the recent decline in the TCs, we decided to investigate the timing or seasonality change in the WNP circulations.
TC genesis in the WNP is affected by multiple factors, including the warm sea surface, upper-ocean heat content, tropospheric water vapor, intensity and eastward extension of monsoon trough, weak vertical wind shear and large-scale low-level convergence [2,7,8]. All these factors are influenced by the intraseasonal oscillation (ISO). Climatologically, the low-level convergent circulation exhibits a spatial correspondence of the convergent center with the TC geneses, which is illustrated in Figure 1a by the mean 850-hPa velocity potential (VP) during June–October and the presence of divergent winds. The seasonal variations of VP and TCs are modulated by the tropical ISO [9,10,11,12,13]. At the same time, the ISO and TC activities are affected by interannual variations, such as the El Niño–Southern Oscillation (ENSO) [14,15,16,17]. Consequently, both the intraseasonal and interannual variations as well as the lower-frequency or decadal variability collectively affect the strength and position of the monsoon trough and subsequent TC geneses [9,10,11,12,13,14,15,16,17,18,19].
Despite these previous studies focusing on the WNP TC activity, there has been a lack of studies systematically investigating the timing change of TCs. In this study, we report apparent multi-decadal timing fluctuations in the TC genesis and large-scale low-level convergence. Furthermore, we include a discussion of the possible causes. The paper is arranged as follows: Section 2 presents the data sources; Section 3 shows the empirical analysis results; Section 4 discusses the possible mechanisms causing the changes in the timing of TC occurrence; and Section 5 is the summary.
2. Data
The following TC track and global reanalysis datasets were used: Joint Typhoon Warning Center (JTWC) best tracks, the National Centers for Atmospheric Research/National Center for Atmospheric Research reanalysis (NCEP1) daily variables from 1948 to 2016 [20] and the NOAA Extended Reconstructed Sea Surface Temperature version 5 (ERSSTv5) monthly data [21]. For the comparison of the long-term variability among the different reanalysis products, we also analyzed the Japan Meteorological Agency Japanese 55-year Reanalysis (JRA-55) [22], National Oceanic and Atmospheric Administration 20th Century Reanalysis Version 2 (NOAA 20C) [23,24,25] and European Centre for Medium-Range Weather Forecasts Re-Analysis 20th Century (ERA 20C) reanalysis data [26].
3. Empirical Analysis
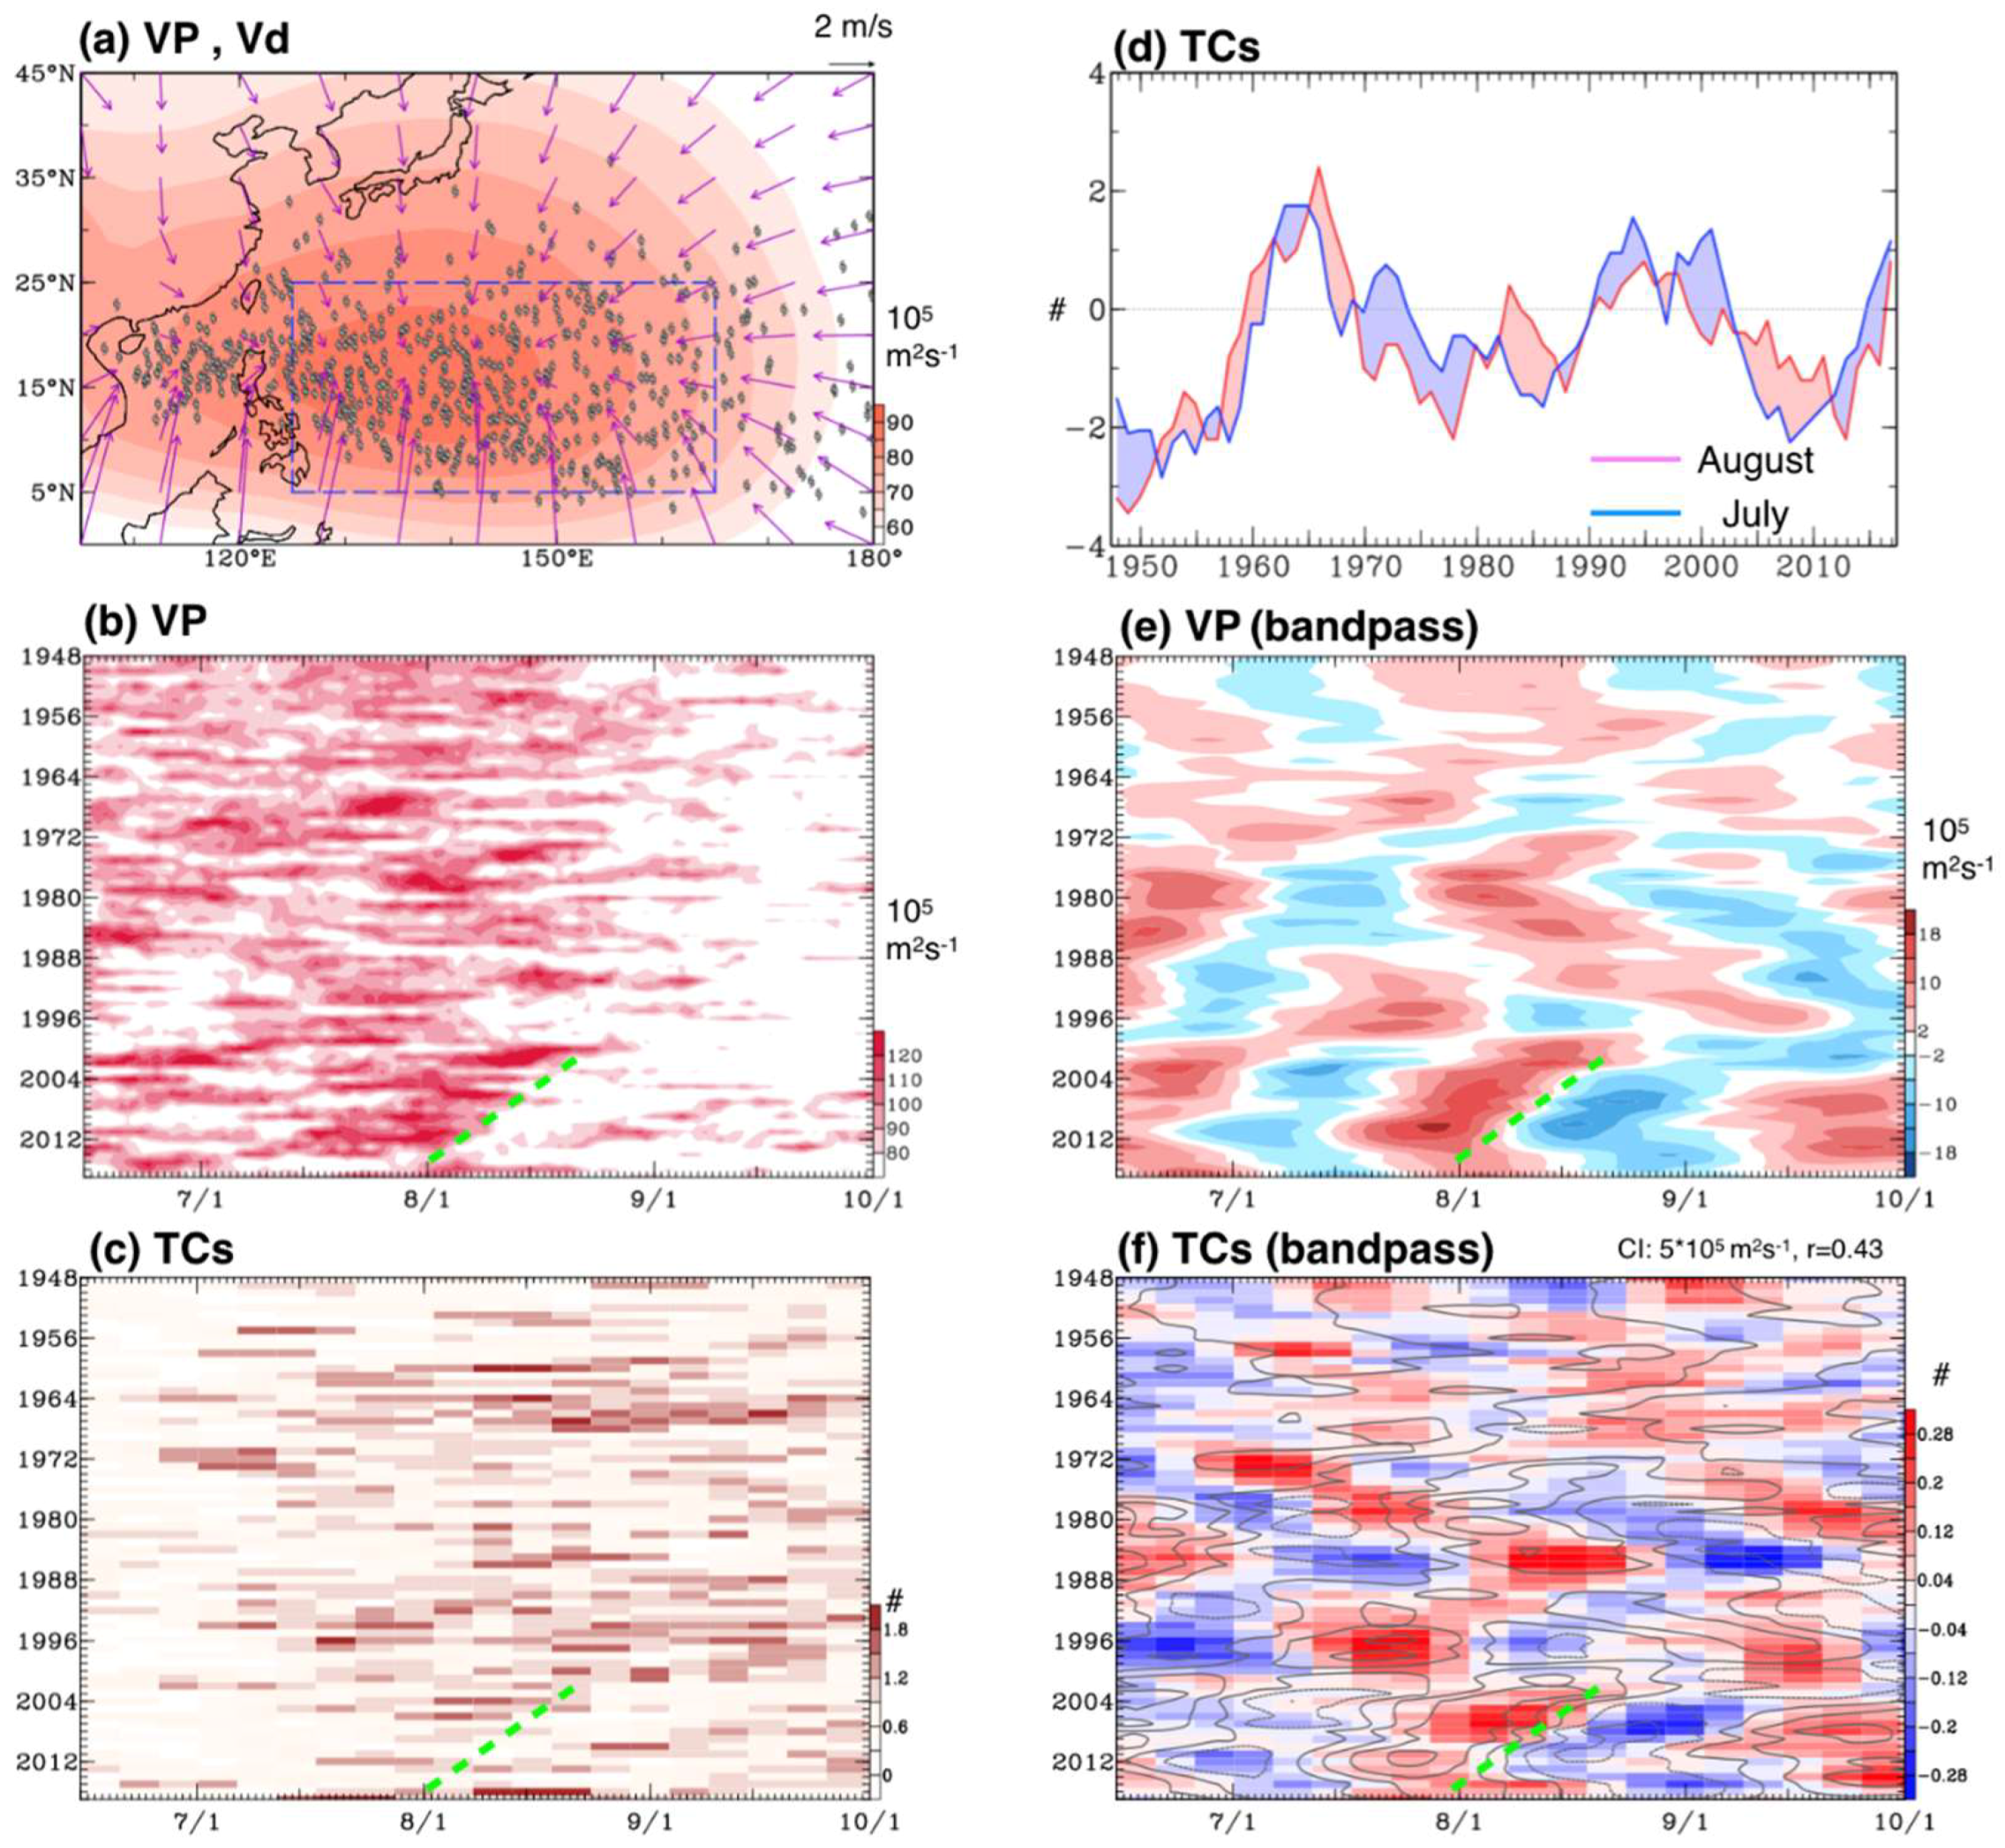
To examine the variation in the timing of the WNP’s low-level convergence, we plotted the yearly and seasonal distributions of the daily 850-hPa velocity potential (VP) averaged over the convergent center (10–30° N, 120–160° E; blue box in Figure 1a) during June–October over the time period of 1948–2017 (with the years on the y-axis and days on the x-axis) in Figure 1b. The corresponding 5-day-mean (pentad) TC counts are plotted in Figure 1c. A TC genesis on 2 January is counted in the period of 1–5 January and so forth. The post-1999 decrease in the August–September TC numbers was also revealed, which was noted by earlier studies [3,4]. Visual examination of Figure 1b,c shows a discernable timing shift on the multidecadal timescale. Within the TC season (x-axis), the concurrences of TC genesis and VP resemble that of the ISO, such as the one episode indicated by the green dashed lines. Combined with the yearly evolution (y-axis), these intraseasonal episodes appear to have advanced since the late 1990s. Before the 1990s, the timing of VP and TC genesis tends to persistently advance or delay every few years. This timing variation implies a change in the peak TC frequency between August and July. By plotting the corresponding TC genesis anomalies in Figure 1d (applied with a 5-year moving average), it appears that the number of July TCs oscillates inversely with the number of August TCs, which is demonstrated by the semi-periodic reversal of the two numbers every decade or two (indicated by the shading between the two time series).
To highlight the predominant intraseasonal variability, both the VP and TC numbers were further smoothed with the bandpass filter of 20–100 days, which are shown in Figure 1e,f. The timing variation in TC genesis is consistent with the intraseasonal episodes of VP (r = 0.43, July–August and 1979–2017), which supports the inference made from Figure 1b,c. The results suggest that the seasonality of the large-scale, low-level convergence in the WNP would become weaker in August and stronger in July for 20 years, with reversal of the situation in other decades. This trend is robust and is supported by the multiple reanalysis data sets as shown in Supplemental Figure S1, with JRA-55, NOAA 20C and ERA 20C revealing consistent variation in the seasonality of VP anomaly.
To qualitatively depict this seasonal variation, an empirical orthogonal function (EOF) analysis was conducted on the filtered VP (using data from Figure 1e) to examine how the time-mean circulation anomalies affect the seasonality of transient weather patterns, which was achieved by following the method of Wang et al. [27,28]. Conventionally, for climate diagnostics, the EOF analysis is performed on a spatial matrix varying in the time dimension. In this case, the EOF analysis was applied on two temporal dimensions by treating the VP’s daily interval as a field of variance (as in the spatial dimension) and its yearly interval in time. This produces a set of EOFs representing the daily variation and another set of principal components (PCs) representing the yearly variation of the daily evolution patterns. Furthermore, the covariance explains how the daily/seasonal distribution of VP changes in each year. By focusing on 1 July through 10 September, the first two EOFs of the filtered VP represent the temporal displacement of the climatological peak of VP. As shown in Figure 2a, EOF 1 presents a predominant intraseasonal variation with an opposite phase between July and August, which is temporarily in-quadrature with the climatological VP evolution (shaded curve). Thus, this suggests either an advancement or delay from the 1 August peak in VP. EOF 2 (Figure 2c) is in-phase with the climatological VP and it depicts either an amplification or weakening of the climatological peak of VP. Judging from the reconstruction of yearly evolution in the PC time series (Figure 2b,d) and the relevant variance of VP (Figure 2a,c), this reconstructed pattern suggests that the peak VP convergence has occurred earlier in late July/early August around the year of 2005 (PC2), before having changed to middle July after the year of 2010 (PC1). These results are consistent among the four reanalysis datasets analyzed, which is shown in Figure 2 by the time series of different colors. By subjecting these PC time series to the power spectral analysis (results in Supplemental Figure S2), we showed that the low-frequency shifts of the VP seasonality occur every 20 years or so, which signifies a multidecadal variability.
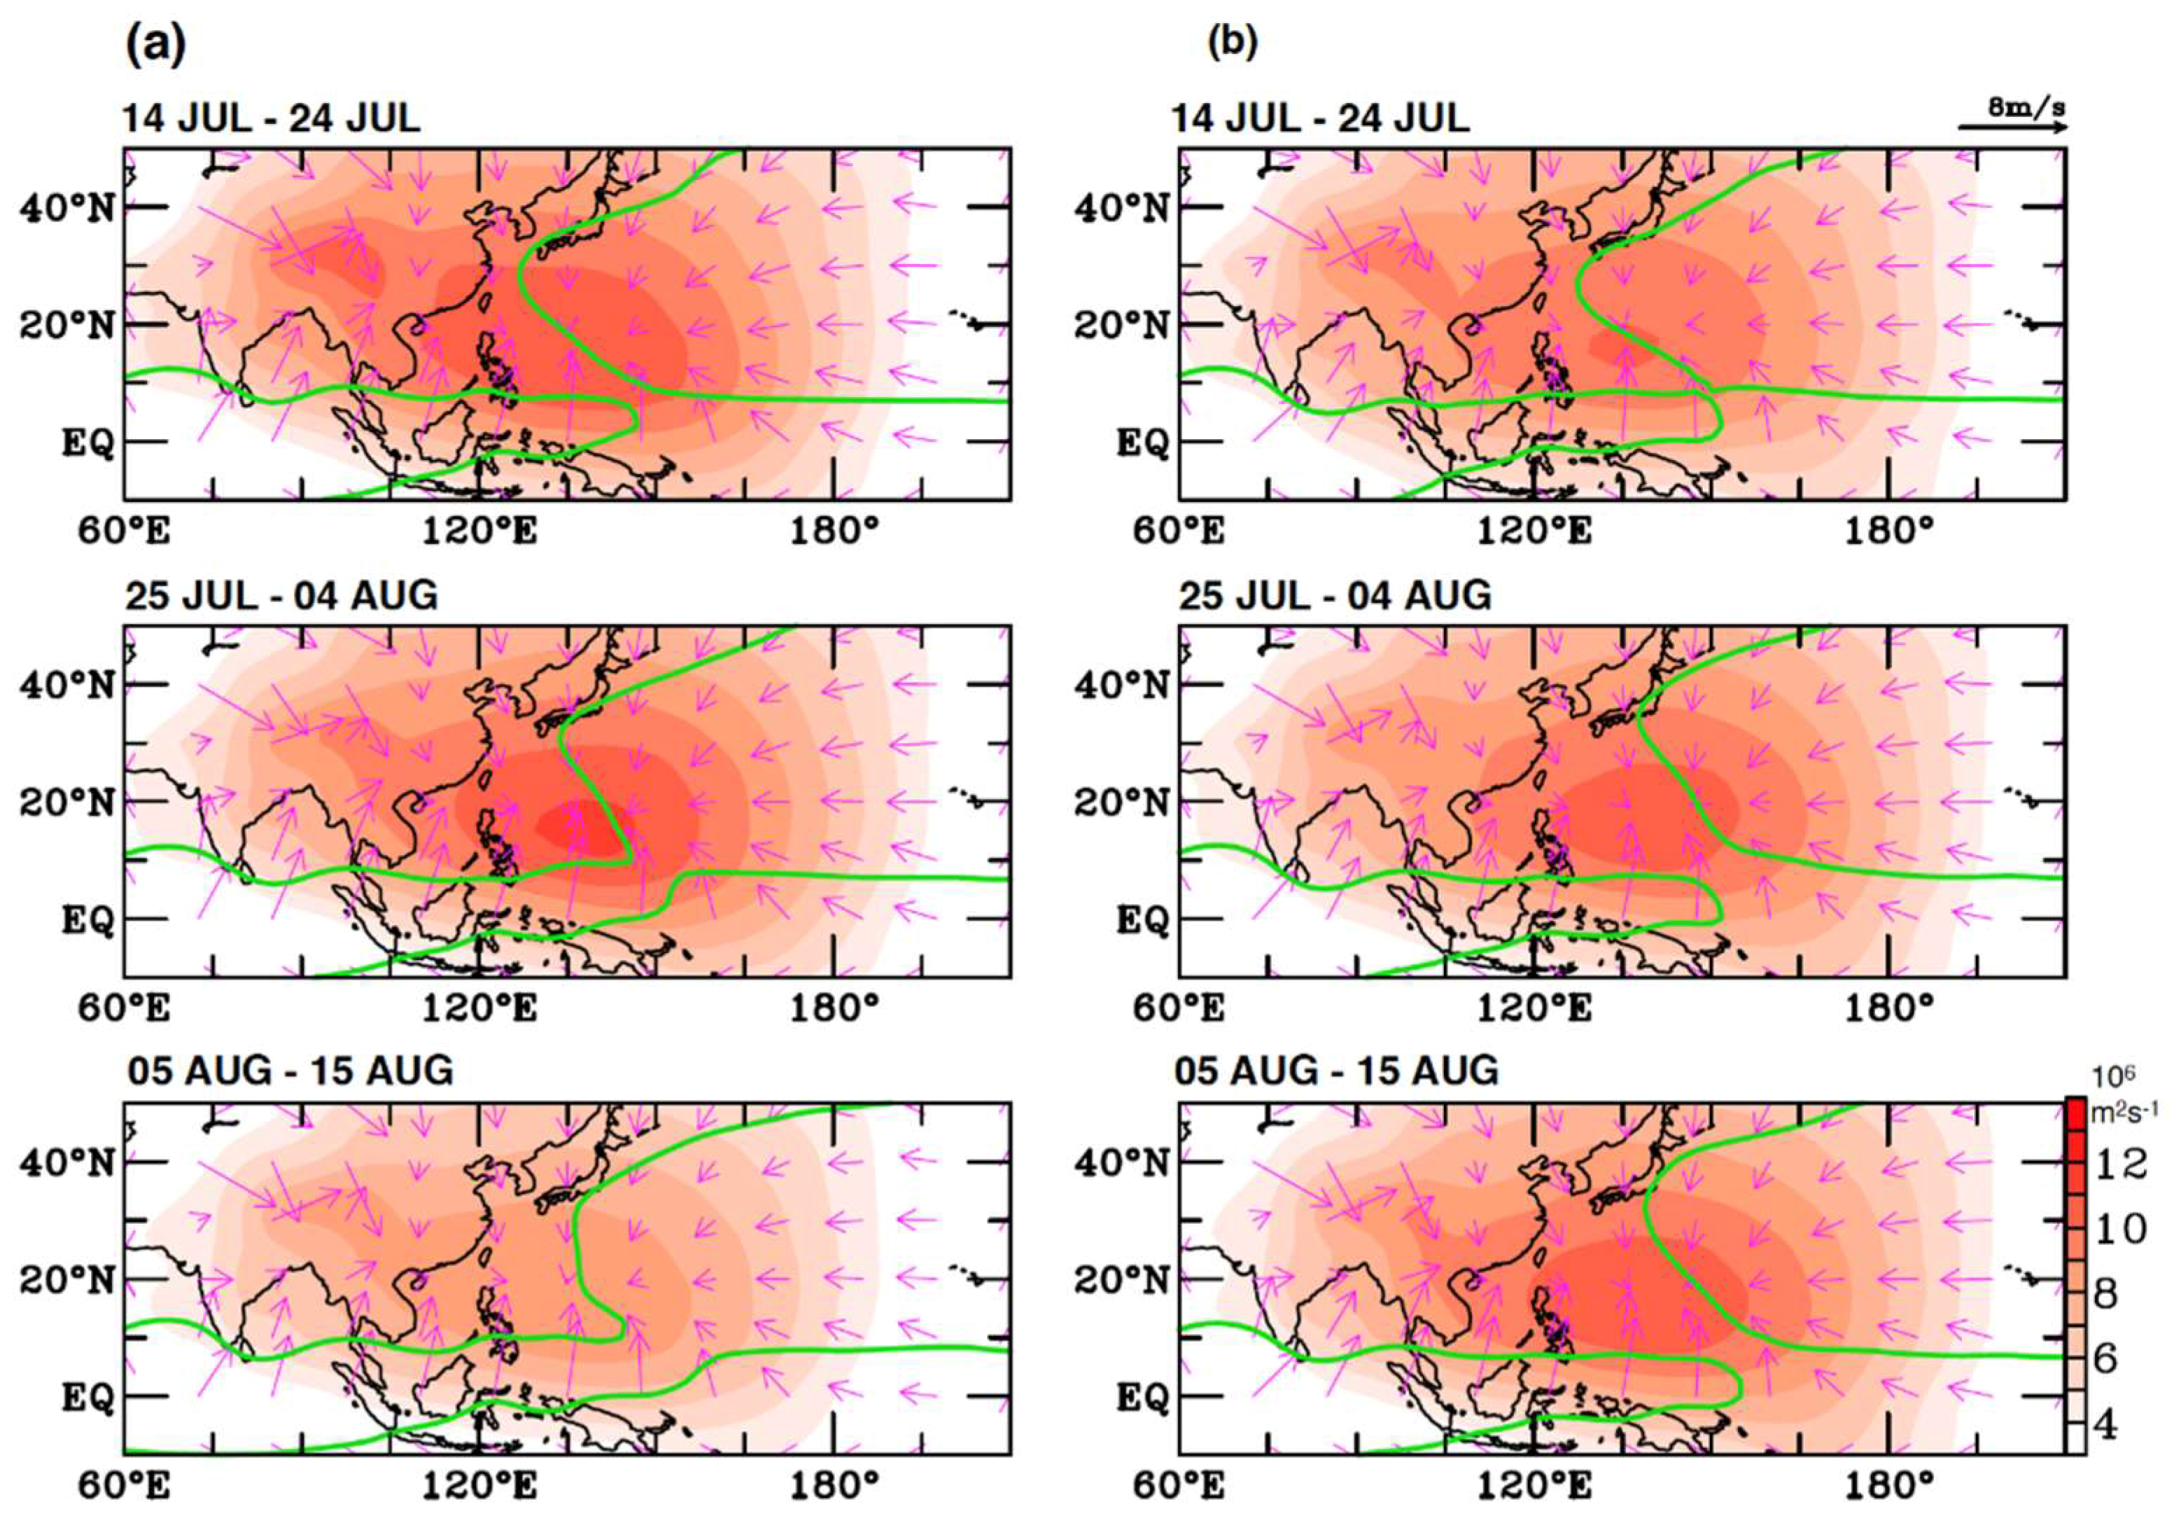
To investigate the influence of low-level convergence on the TC-related circulation in different periods, we illustrated the multidecadal change in the mean-state divergent circulation (850-hPa VP) in Figure 3, with the divergent winds and the corresponding monsoon trough position represented by the 850-hPa stream function. This was illustrated during two episodes: (A) 1990–1996 and 2008–2014 (with positive VP anomalies in July; Figure 2a,b) and (B) 1980–1986 and 1990–2005 (with negative VP anomalies in July). The evolution of the WNP monsoon lifecycle is illustrated in three periods from mid-July to late July and then to mid-August (dates indicated). During the episode that is marked as A (early WNP monsoon), the low-level convergence was most enhanced in late July, which was associated with a robust monsoon trough in the WNP. During episode B (late WNP monsoon), the late-July convergence center was weakened but it lasted longer through mid-August alongside a strengthened monsoon trough. During either episode, the eastern extension of monsoon trough fluctuates with the variation of the VP center. Based on Figure 1, these intraseasonal variations apparently also modulate the monthly distribution of TC genesis.
We next investigated the physical meaning of the multidecadal variation reflected in the PC time series by examining their associated change in the large-scale mean circulations. By regressing the bandpass-filtered VP with the PCs, the resultant pattern (Supplemental Figure S3a,b) revealed a wave-1 low-level convergence dipole with an eastward propagation that is similar to the Madden–Julian oscillation (MJO) [29,30]. The regressed stream function pattern (Supplemental Figure S3c,d) showed MJO-like patterns with the variations of North Pacific subtropical height and monsoon trough, which is consistent with the findings of Knutson and Weickmann [31]. In addition, previous studies [32,33] have shown that the MJO activity varies with the mean-state variations in the WNP VP/TC.
To investigate the possible forcing of the multidecadal variability in the timing of VP, Figure 4 shows the regressions of the 2-month mean VP, SSTA and the 850-hPa stream function with the same PC1 time series, which was obtained during March through July. The regression variables were subjected to the same filtering as the multidecadal PC1. Depending on the polarity, the regressed VP delineated the predominant pattern leading up to the shifted timing of peak convergence, which occurred either in July or in August. As shown in Figure 4a, a zonal wavenumber-1 structure emerged in April and persisted through June with a center in the Western Pacific Warm Pool, which then dissipates by June due to the possible elimination of the average intraseasonal anomalies of VP in summer. Furthermore, the regressed 850-hPa stream function (Figure 4b) shows anticyclonic flow anomalies in the Northern and Southern Hemispheres and cyclonic flow anomalies in the Indian Ocean in April–May, which is likely associated with the large-scale divergent pattern in Figure 4a (i.e., reduced VP with weak subtropical high in WNP). This result implies that the springtime anomaly in the large-scale divergent circulation could precondition the summertime intraseasonal variation. However, the SSTA regressions in Figure 4c did not reveal any unusual patterns in any season, suggesting that the more distinct VP pattern in March–May is of atmospheric origin. On the other hand, the regression coefficients of SSTA and VP are insignificant in July–August. The possible reason might be that the multidecadal variability revealed from the timing change in VP is associated with the atmospheric intraseasonal variation (cf., Figure S3), which results in little to no persistent SSTA during the summer season. Nonetheless, the stream function regression pattern shows a significant pattern over WNP, which suggests a weakening of the North Pacific subtropical high and deepening of the monsoon trough. Thus, this may influence the TC activity.
4. Possible Mechanisms
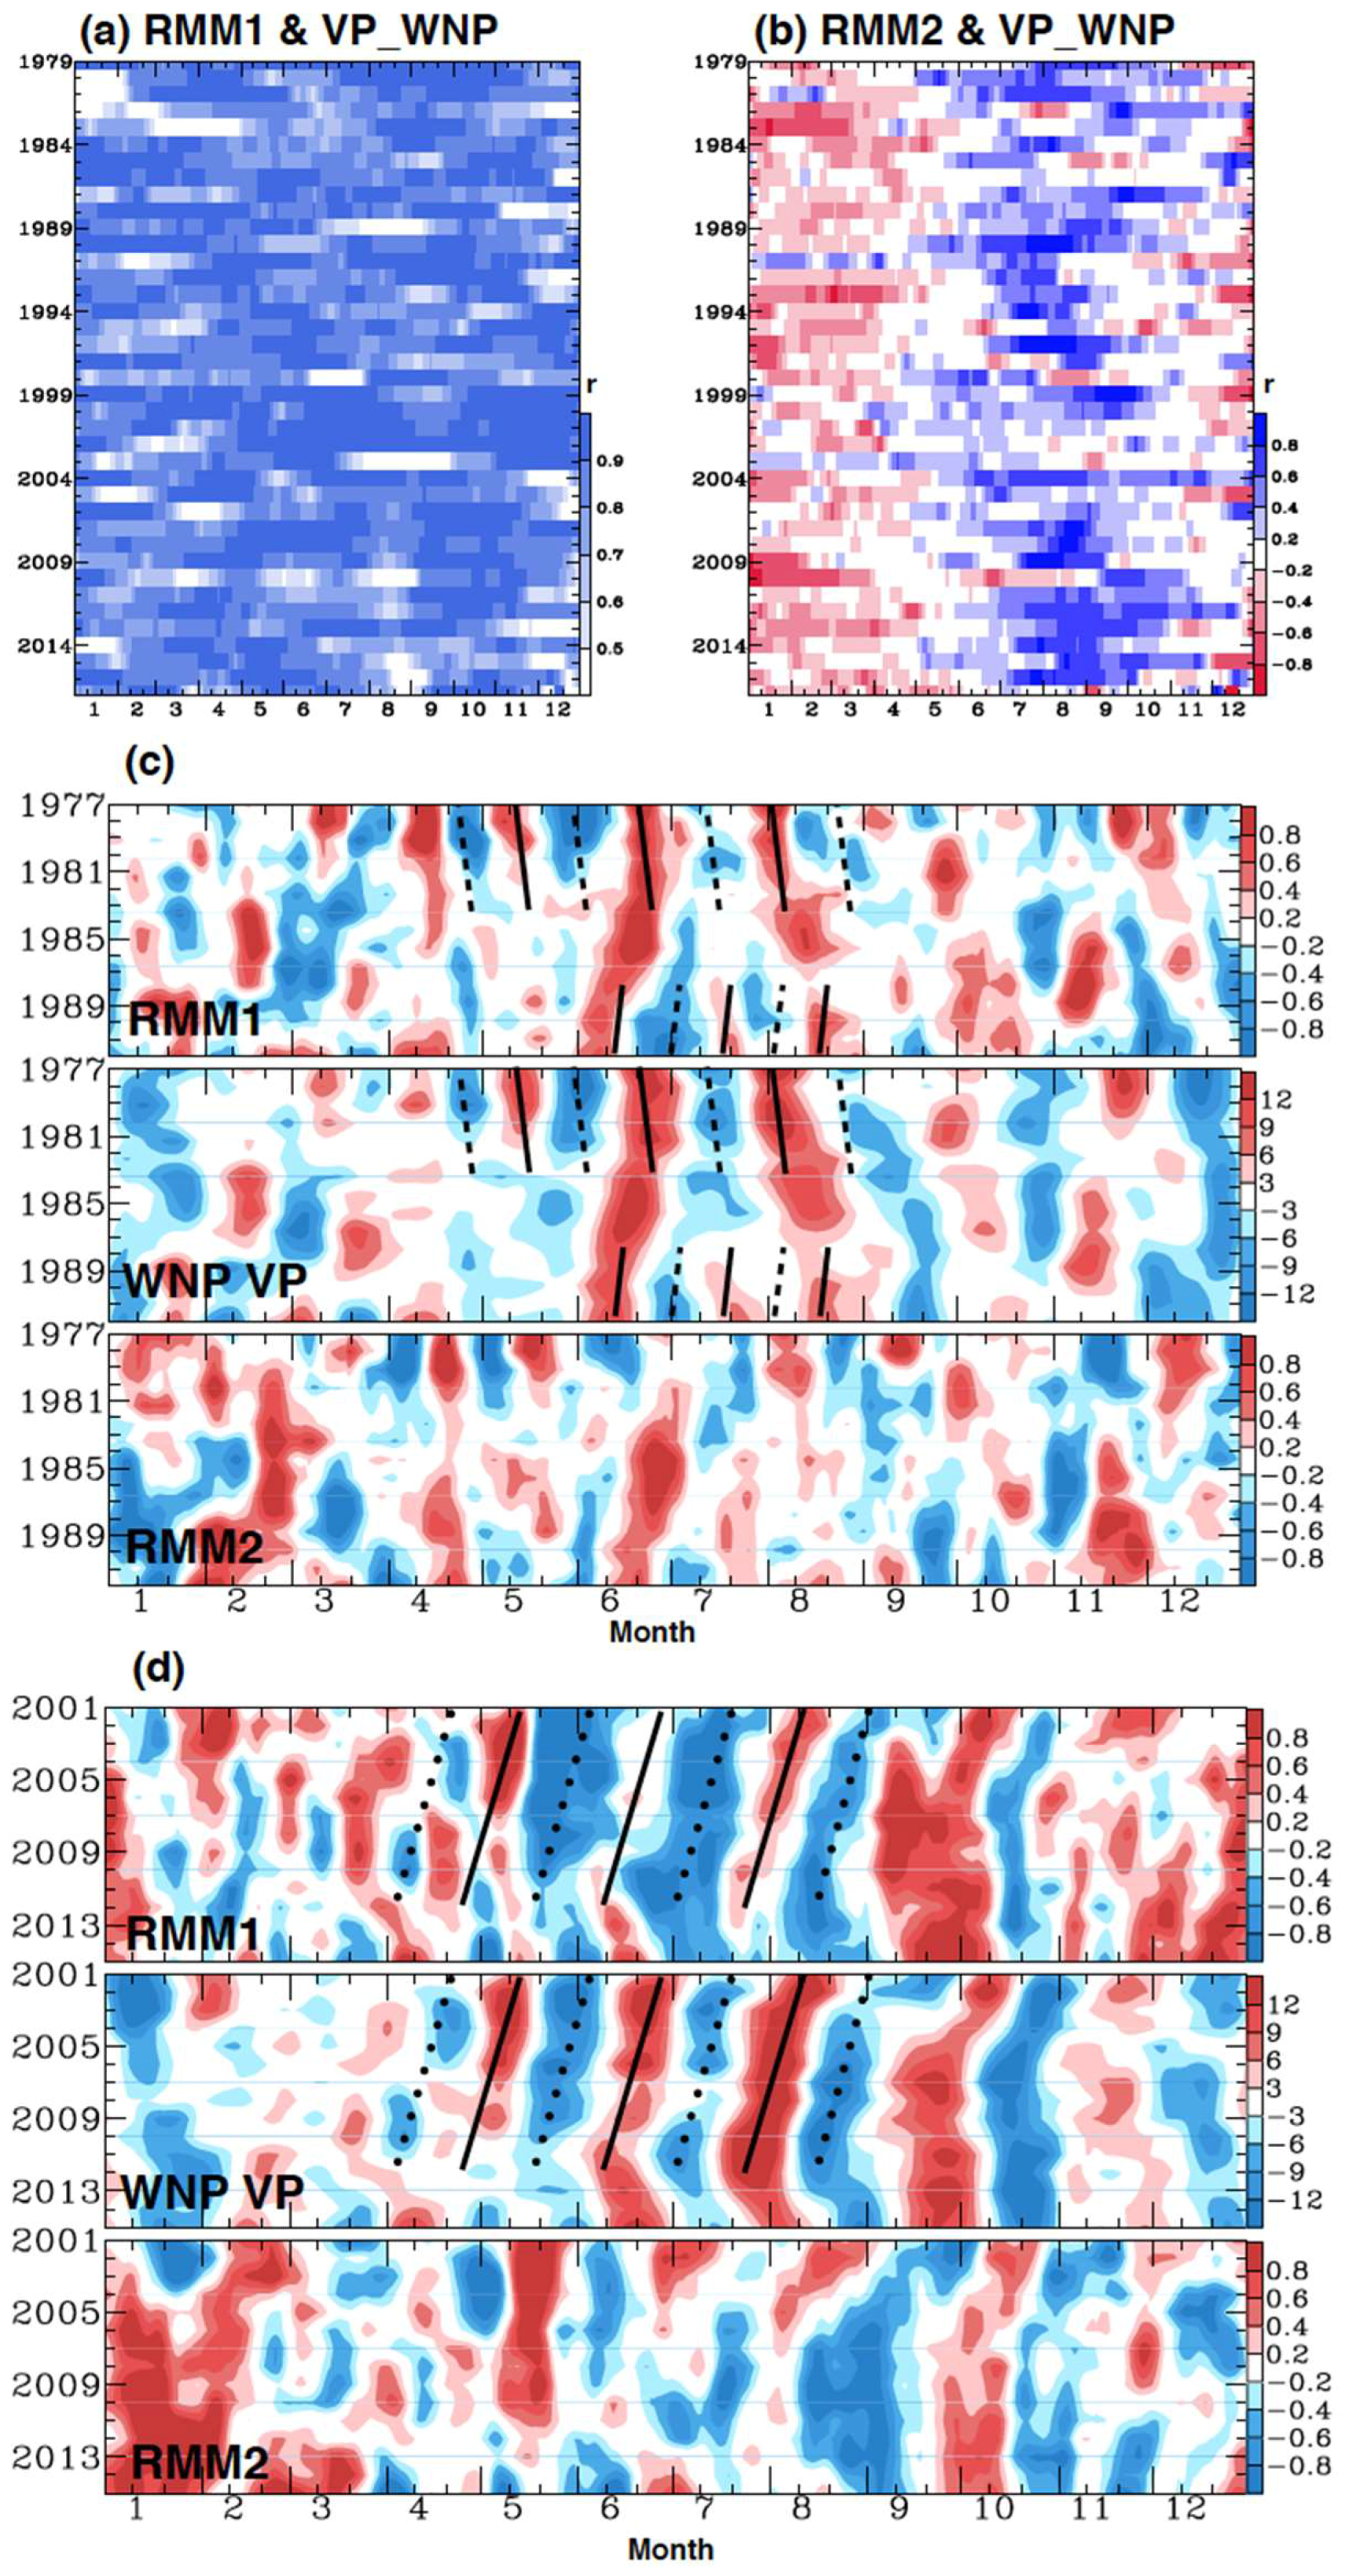
The following analysis explores the physical relationship between the multidecadal variations in WNP VP and ISO. To depict the primary driver of ISO, namely the MJO, we adopted the Real-time Multivariate MJO index 1 and 2 (RMM1 and RMM2) [34]. For this present study, the daily values of RMM1 and RMM2 were obtained from the Australian Bureau of Meteorology (http://www.bom.gov.au/climate/mjo/). The RMM1 and RMM2 indices, which were approximately in quadrature, were used for the monitoring of the phases and amplitude of the westerly propagation MJO. We computed the sliding correlation between RMM1&2 and the area-averaged WNP VP (from Figure 1a, blue box) within a 61-day running window throughout each year from 1979 to 2017 (Figure 5a,b). Since RMM1 represents the outgoing longwave radiation (OLR) and large-scale divergence in the Maritime Continent near our studying region, its sliding correlations with the WNP VP were positive and significant (r = ±0.32, p < 0.05) in all seasons. The RMM2 sliding correlation (Figure 5b) showed an annual cycle of correlation coefficient with a positive (negative) correlation in boreal summer (winter), which suggests the seasonal meridional shift of the VP circulation.
The seasonal migration of solar heating profoundly impacts global circulation, such as the Intertropical Convergence Zone (ITCZ), and this could influence the low-level convergence of RMM2-related VP in WNP. Zhang and Dong [35] have shown that the variation of MJO low-level moisture convergence was associated with the seasonal migration of ITCZ and thus, springtime MJO phases could be used to predict the variation and timing of summertime MJO and WNP VP. To further understand the possible connection between the summer and spring, we plotted the yearly distribution of daily RMM1, RMM2, and WNP VP during two periods in which the low-level convergence shifts: July–August (Figure 5c) and August–July (Figure 5d). The RMM1 has similar distributions to the WNP VP, while RMM2 shows similar patterns in summer. It appears that the timing shifts of RMMs and VP starting in spring have a constant phase speed that persists into summer. This result was associated with the wavenumber-1 structure of the regressed VP (Figure 4a), which apparently modulates the MJO strength and timing. Previous studies have indicated that the tropical convections can impact the propagation speed of MJO [36,37,38,39], suggesting a lingering effect on the subsequent MJO development. However, we have not yet identified the source of springtime anomalies in the WNP VP due to the lack of tropical oceanic features.
5. Summary
The low-level convergence in WNP is the major factor of the atmospheric circulation influencing the TC genesis in this basin. The analysis shows that the timing of peak low-level convergence has undergone a multidecadal variation that shifts between July and August, affecting the seasonality of TC genesis. Since the mid-1990s, the timing shift in the low-level convergence from August to July has been persistent, which has been accompanied by an observed decrease in TC numbers. Our analysis indicated that the timing variation of the low-level convergence was associated with a corresponding shift in the timing of the tropical ISO or the MJO. Regression analysis shows that this multidecadal variation may be related to a large-scale low-level convergence anomaly in the Western Pacific that begins in spring and lasts through early summer, although the sea surface temperature anomalies did not reveal any significant or recognizable patterns. We found that the MJO phase occurring in late spring can be a precursor determining whether the peak low-level convergence would occur in July or August, but what drives the apparent multidecadal variation in the springtime MJO remains unclear. Further research is necessary to comprehensively understand the possible mechanism of the natural low-frequency variation in the timing of the ISO.
Supplementary Materials
The following are available online at https://www.mdpi.com/2073-4433/9/5/158/s1, Figure S1: Yearly distributions of daily 850-hPa velocity potential (VP) with 30–90 days bandpass filter and 5years moving averaged over convergent center in Western North Pacific for (a) NCEP1 reanalysis data with domain average over 125° E–165° E and 5° N–25° N, (b) JRA 55 reanalysis data with domain average over 120° E–150° E and 5° N–25° N, (c) NOAA 20th Century Reanalysis with domain average over 122° E–152° E and 8° N–24° N, and (d) ERA 20th Century Reanalysis with domain average over 115° E–155° E and 5° N–25° N; Figure S2: Power spectrum analysis of (a) NCEP1-PC1, (b) NCEP1-PC2,(c) NOAA 20C-PC1, (d) NOAA 20C-PC2, (e) ERA 20C-PC1, and (f) ERA20C-PC2. Green line shows the 99% significance level; Figure S3: NCEP1 10-days average 850-hPa velocity potential (VP) regresses onto the (a) PC1 and (b) PC2, and 850-hPa stream function (ST) regressed on (c) PC1 and (d) PC2 from 1948 to 2016.
Author Contributions
All authors have equally contributed to the preparation of this paper. Y.-H.L. and S.-Y.S.W. conceived the research, analyzed the data, and wrote the paper.
Acknowledgments
This study was supported by the Utah Agricultural Experiment Station, Utah State University, and approved as journal paper number 9087. Yen-Heng Lin is supported by the Utah State University Presidential Doctoral Research Fellows (PDRF) program.
Conflicts of Interest
The authors declare no conflict of interest. The founding sponsors had no role in the design of the study; in the collection, analyses, or interpretation of data; in the writing of the manuscript, and in the decision to publish the results.
References
- Emanuel, K.; Sundararajan, R.; Williams, J. Hurricanes and global warming: Results from downscaling IPCC AR4 simulations. Bull. Am. Meteorol. Soc. 2008, 89, 347–367. [Google Scholar] [CrossRef]
- Chen, T.-C.; Wang, S.-Y.; Yen, M.-C.; Gallus, W.A., Jr. Role of the monsoon gyre in the interannual variation of tropical cyclone formation over the western North Pacific. Weather Forecast. 2004, 19, 776–785. [Google Scholar] [CrossRef]
- Liu, K.S.; Chan, J.C. Inactive Period of Western North Pacific Tropical Cyclone Activity in 1998–2011. J. Clim. 2013, 26, 2614–2630. [Google Scholar] [CrossRef]
- Yeh, S.-W.; Kang, S.-K.; Kirtman, B.P.; Kim, J.-H.; Kwon, M.-H.; Kim, C.-H. Decadal change in relationship between western North Pacific tropical cyclone frequency and the tropical Pacific SST. Meteorol. Atmos. Phys. 2010, 106, 179–189. [Google Scholar] [CrossRef]
- Jennings, R. Taiwan Aims to Rein in Water Use Amid Unusual Drought. Available online: http://www.latimes.com/world/asia/la-fg-taiwan-drought-20150510-story.html (accessed on 1 March 2018).
- Hong, C.-C.; Lee, M.-Y.; Hsu, H.-H.; Chang, T.-C. Compounding factors causing the unusual absence of tropical cyclones in the western North Pacific during August 2014. J. Geophys. Res. Atmos. 2016, 121, 9964–9976. [Google Scholar] [CrossRef]
- Harr, P.A.; Elsberry, R.L. Large-Scale Circulation Variability over the Tropical Western North Pacific. Part I: Spatial Patterns and Tropical Cyclone Characteristics. Mon. Weather Rev. 1995, 123, 1225–1246. [Google Scholar] [CrossRef]
- McBride, J.L. Tropical cyclone formation. In Global Perspective on Tropical Cyclones; WMO/TD-No. 693; World Meteorological Organization: Geneva, Switzerland, 1995; pp. 63–105. [Google Scholar]
- Sobel, A.H.; Maloney, E.D. Effect of ENSO and the MJO on western North Pacific tropical cyclones. Geophys. Res. Lett. 2000, 27, 1739–1742. [Google Scholar] [CrossRef]
- Maloney, E.D.; Dickinson, M.J. The Intraseasonal Oscillation and the Energetics of Summertime Tropical Western North Pacific Synoptic-Scale Disturbances. J. Atmos. Sci. 2003, 60, 2153–2168. [Google Scholar] [CrossRef]
- Chen, T.-C.; Wang, S.-Y.; Yen, M.-C.; Clark, A.J. Impact of the intraseasonal variability of the western North Pacific large-scale circulation on tropical cyclone tracks. Weather Forecast. 2009, 24, 646–666. [Google Scholar] [CrossRef]
- Huang, P.; Chou, C.; Huang, R. Seasonal modulation of tropical intraseasonal oscillations on tropical cyclone geneses in the western North Pacific. J. Clim. 2011, 24, 6339–6352. [Google Scholar] [CrossRef]
- Nakano, M.; Sawada, M.; Nasuno, T.; Satoh, M. Intraseasonal variability and tropical cyclogenesis in the western North Pacific simulated by a global nonhydrostatic atmospheric model. Geophys. Res. Lett. 2015, 42, 565–571. [Google Scholar] [CrossRef]
- Chen, T.-C.; Wang, S.-Y.; Yen, M.-C. Interannual variation of the tropical cyclone activity over the Western North Pacific. J. Clim. 2006, 19, 5709–5720. [Google Scholar] [CrossRef]
- Pohl, B.; Matthews, A.J. Observed changes in the lifetime and amplitude of the Madden–Julian Oscillation associated with interannual ENSO sea surface temperature anomalies. J. Clim. 2007, 20, 2659–2674. [Google Scholar] [CrossRef]
- Kim, J.; Ho, C.; Kim, H.; Sui, C.; Park, S.K. Systematic variation of summertime tropical cyclone activity in the western North Pacific in relation to the Madden–Julian oscillation. J. Clim. 2008, 21, 1171–1191. [Google Scholar] [CrossRef]
- Li, R.C.; Zhou, Y.W.; Chan, J.C.L.; Huang, P. Asymmetric modulation of western North Pacific cyclogenesis by the Madden–Julian oscillation under ENSO conditions. J. Clim. 2012, 25, 5374–5385. [Google Scholar] [CrossRef]
- Wang, B.; Chan, J.C.L. How Strong ENSO Events Affect Tropical Storm Activity over the Western North Pacific. J. Clim. 2002, 15, 1643–1658. [Google Scholar] [CrossRef]
- Camargo, S.J.; Emanuel, K.A.; Sobel, A.H. Use of a Genesis Potential Index to Diagnose ENSO Effects on Tropical Cyclone Genesis. J. Clim. 2010, 20, 4819–4834. [Google Scholar] [CrossRef]
- Kalnay, E.; Kanamitsu, M.; Kistler, R.; Collins, W.; Deaven, D.; Gandin, L.; Iredell, M.; Saha, S.; White, G.; Woolen, J.; et al. The NCEP/NCAR 40-Year Reanalysis Project. Bull. Am. Meteorol. Soc. 1996, 77, 437–471. [Google Scholar] [CrossRef]
- Huang, B.; Thorne, P.; Banzon, V.; Boyer, T.; Chepurin, G.; Lawrimore, J.; Menne, M.; Smith, T.; Vose, R.; Zhang, H. Extended Reconstructed Sea Surface Temperature version 5 (ERSSTv5): Upgrades, Validations, and Intercomparisons. J. Clim. 2017, 30, 8179–8205. [Google Scholar] [CrossRef]
- Kobayashi, S.; Ota, Y.; Harada, Y.; Ebita, A.; Moriya, M.; Onoda, H.; Onogi, K.; Kamahori, H.; Kobayashi, C.; Endo, H.; et al. The JRA-55 Reanalysis: General specifications and basic characteristics. J. Meteorol. Soc. Jpn. 2015, 93, 54–58. [Google Scholar] [CrossRef]
- Compo, G.P.; Whitaker, J.S.; Sardeshmukh, P.D.; Matsui, N.; Allan, R.J.; Yin, X.; Gleason, B.E.; Vose, R.S.; Rutledge, G.; Bessemoulin, P.; et al. The Twentieth Century Reanalysis Project. Q. J. R. Meteorol. Soc. 2011, 137, 12–18. [Google Scholar] [CrossRef]
- Compo, G.P.; Whitaker, J.S.; Sardeshmukh, P.D. Feasibility of a 100 year reanalysis using only surface pressure data. Bull. Am. Meteorol. Soc. 2006, 87, 175–190. [Google Scholar] [CrossRef]
- Whitaker, J.S.; Compo, G.P.; Wei, X.; Hamill, T.M. Reanalysis without radiosondes using ensemble data assimilation. Mon. Weather Rev. 2004, 132, 1190–1200. [Google Scholar] [CrossRef]
- Poli, P.; Hersbach, H.; Dee, D.P.; Berrisford, P.; Simmons, A.J.; Vitart, F.; Laloyaux, P.; Tan, D.G.H.; Peubey, C.; Thépaut, J.-N.; et al. ERA-20C: An atmospheric reanalysis of the twentieth century. J. Clim. 2016, 29, 4083–4097. [Google Scholar] [CrossRef]
- Wang, S.-Y.; Gillies, R.R.; Dool, H. On the yearly phase delay of winterintraseasonal mode in the western United States. Clim. Dyn. 2014, 42, 1649–1664. [Google Scholar] [CrossRef]
- Wang, S.-Y.S.; Lin, Y.-H.; Wu, C.-H. Interdecadal change of the active-phase summer monsoon in East Asia (Meiyu) since 1979. Atmos. Sci. Lett. 2016, 17, 128–134. [Google Scholar] [CrossRef]
- Madden, R.A.; Julian, P.R. Detection of a 40–50 day oscillation in the zonal wind in the tropical Pacific. J. Atmos. Sci. 1971, 28, 702–708. [Google Scholar] [CrossRef]
- Madden, R.A.; Julian, P.R. Description of global-scale circulation cells in the tropics with a 40–50 day period. J. Atmos. Sci. 1972, 29, 1109–1123. [Google Scholar] [CrossRef]
- Knutson, T.R.; Weickmann, K.M. 30–60 day atmospheric oscillations: Composite life cycles of convection and circulation anomalies. Mon. Weather Rev. 1987, 115, 1407–1436. [Google Scholar] [CrossRef]
- Hsu, H.-H.; Weng, C.-H. Northwestward Propagation of the Intraseasonal Oscillation in the Western North Pacific during the Boreal Summer: Structure and Mechanism. J. Clim. 2001, 14, 3834–3850. [Google Scholar] [CrossRef]
- Maloney, E.D.; Hartmann, D.L. The Madden–Julian oscillation, Barotropic dynamics, and North Pacific tropical cyclone formation. Part I: Observations. J. Atmos. Sci. 2001, 58, 2545–2558. [Google Scholar] [CrossRef]
- Wheeler, M.; Hendon, H.H. An all-season real-time multivariate MJO index: Development of an index for monitoring and prediction. Mon. Weather Rev. 2004, 132, 1917–1932. [Google Scholar] [CrossRef]
- Zhang, C.; Dong, M. Seasonality in the Madden–Julian oscillation. J. Clim. 2004, 17, 3169–3180. [Google Scholar] [CrossRef]
- Zhang, C. Madden-Julian Oscillation. Rev. Geophys. 2005, 43. [Google Scholar] [CrossRef]
- Miura, H.; Satoh, M.; Nasuno, T.; Noda, A.T.; Oouchi, K. A Madden–Julian Oscillation event realistically simulated by a global cloudresolving model. Science 2007, 318, 1763–1765. [Google Scholar] [CrossRef] [PubMed]
- Zhang, G.J.; Song, X. Interaction of deep and shallow convection is key to Madden-Julian Oscillation simulation. Geophys. Res. Lett. 2009, 36. [Google Scholar] [CrossRef]
- Ling, J.; Zhang, C. Structural evolution in heating pro-files of the MJO in global reanalyses and TRMM retrievals. J. Clim. 2011, 24, 825–842. [Google Scholar] [CrossRef]
Figure 1.
(a) Climatological 850-hPa velocity potential (VP) and divergent wind (Vd) during the Western North Pacific main tropical cyclone season (July–September), with the locations of tropical cyclogenesis superimposed; (b) Yearly and seasonal distribution of the daily VP over the convergent center (blue box in (a)), with the years on the y-axis and days on the x-axis; (c) Yearly distribution of the number of tropical cyclones in a pentad scale with a 3-pentad moving average in Western North Pacific; (d) The time series of the monthly tropical cyclone number anomaly in July (blue) and August (red) relative to the period of 1981–2010 with a 5-year moving average. The shaded area shows the deficit of two months; (e) is same as (b), but with a band pass filter of 20–100 days and 5-year moving average; (f) is the same as (c), but with a bandpass filter of 20–100 days and 5-year moving average, with the contour of VP from (e) superimposed in a pentad scale. The distribution (spatial) correlation (r) is calculated in the period of July–August and 1948–2017 (840 samples). In (e,f), the positive/negative value presents the convergent/divergent VP and high/low TC genesis anomalies. In (b–f), the green dashed line shows a discernable timing shift within the timescale manifest of a multidecadal variation in a recent time period.

Figure 2.
The EOF analysis of yearly distribution of the daily 850-hPa velocity potential (VP) with a band-pass filter of 20–100 days and a 5-year moving average and 30-year moving average removed over the convergent center (Figure 1a, blue box). The daily interval from 1 July to 10 September was analyzed with EOF and the yearly interval was depicted as a time series (PCs). (a) The EOF1 of VP daily variance; (b) the PC1 of yearly time series; (c) the EOF2 of VP daily variance and (d) PC2 of yearly time series for NCEP1 (black line), JRA 55 (purple line), NOAA 20C (red line) and ERA 20C (blue line). The green shading in (a,c) is the climatology of VP from NCEP1.
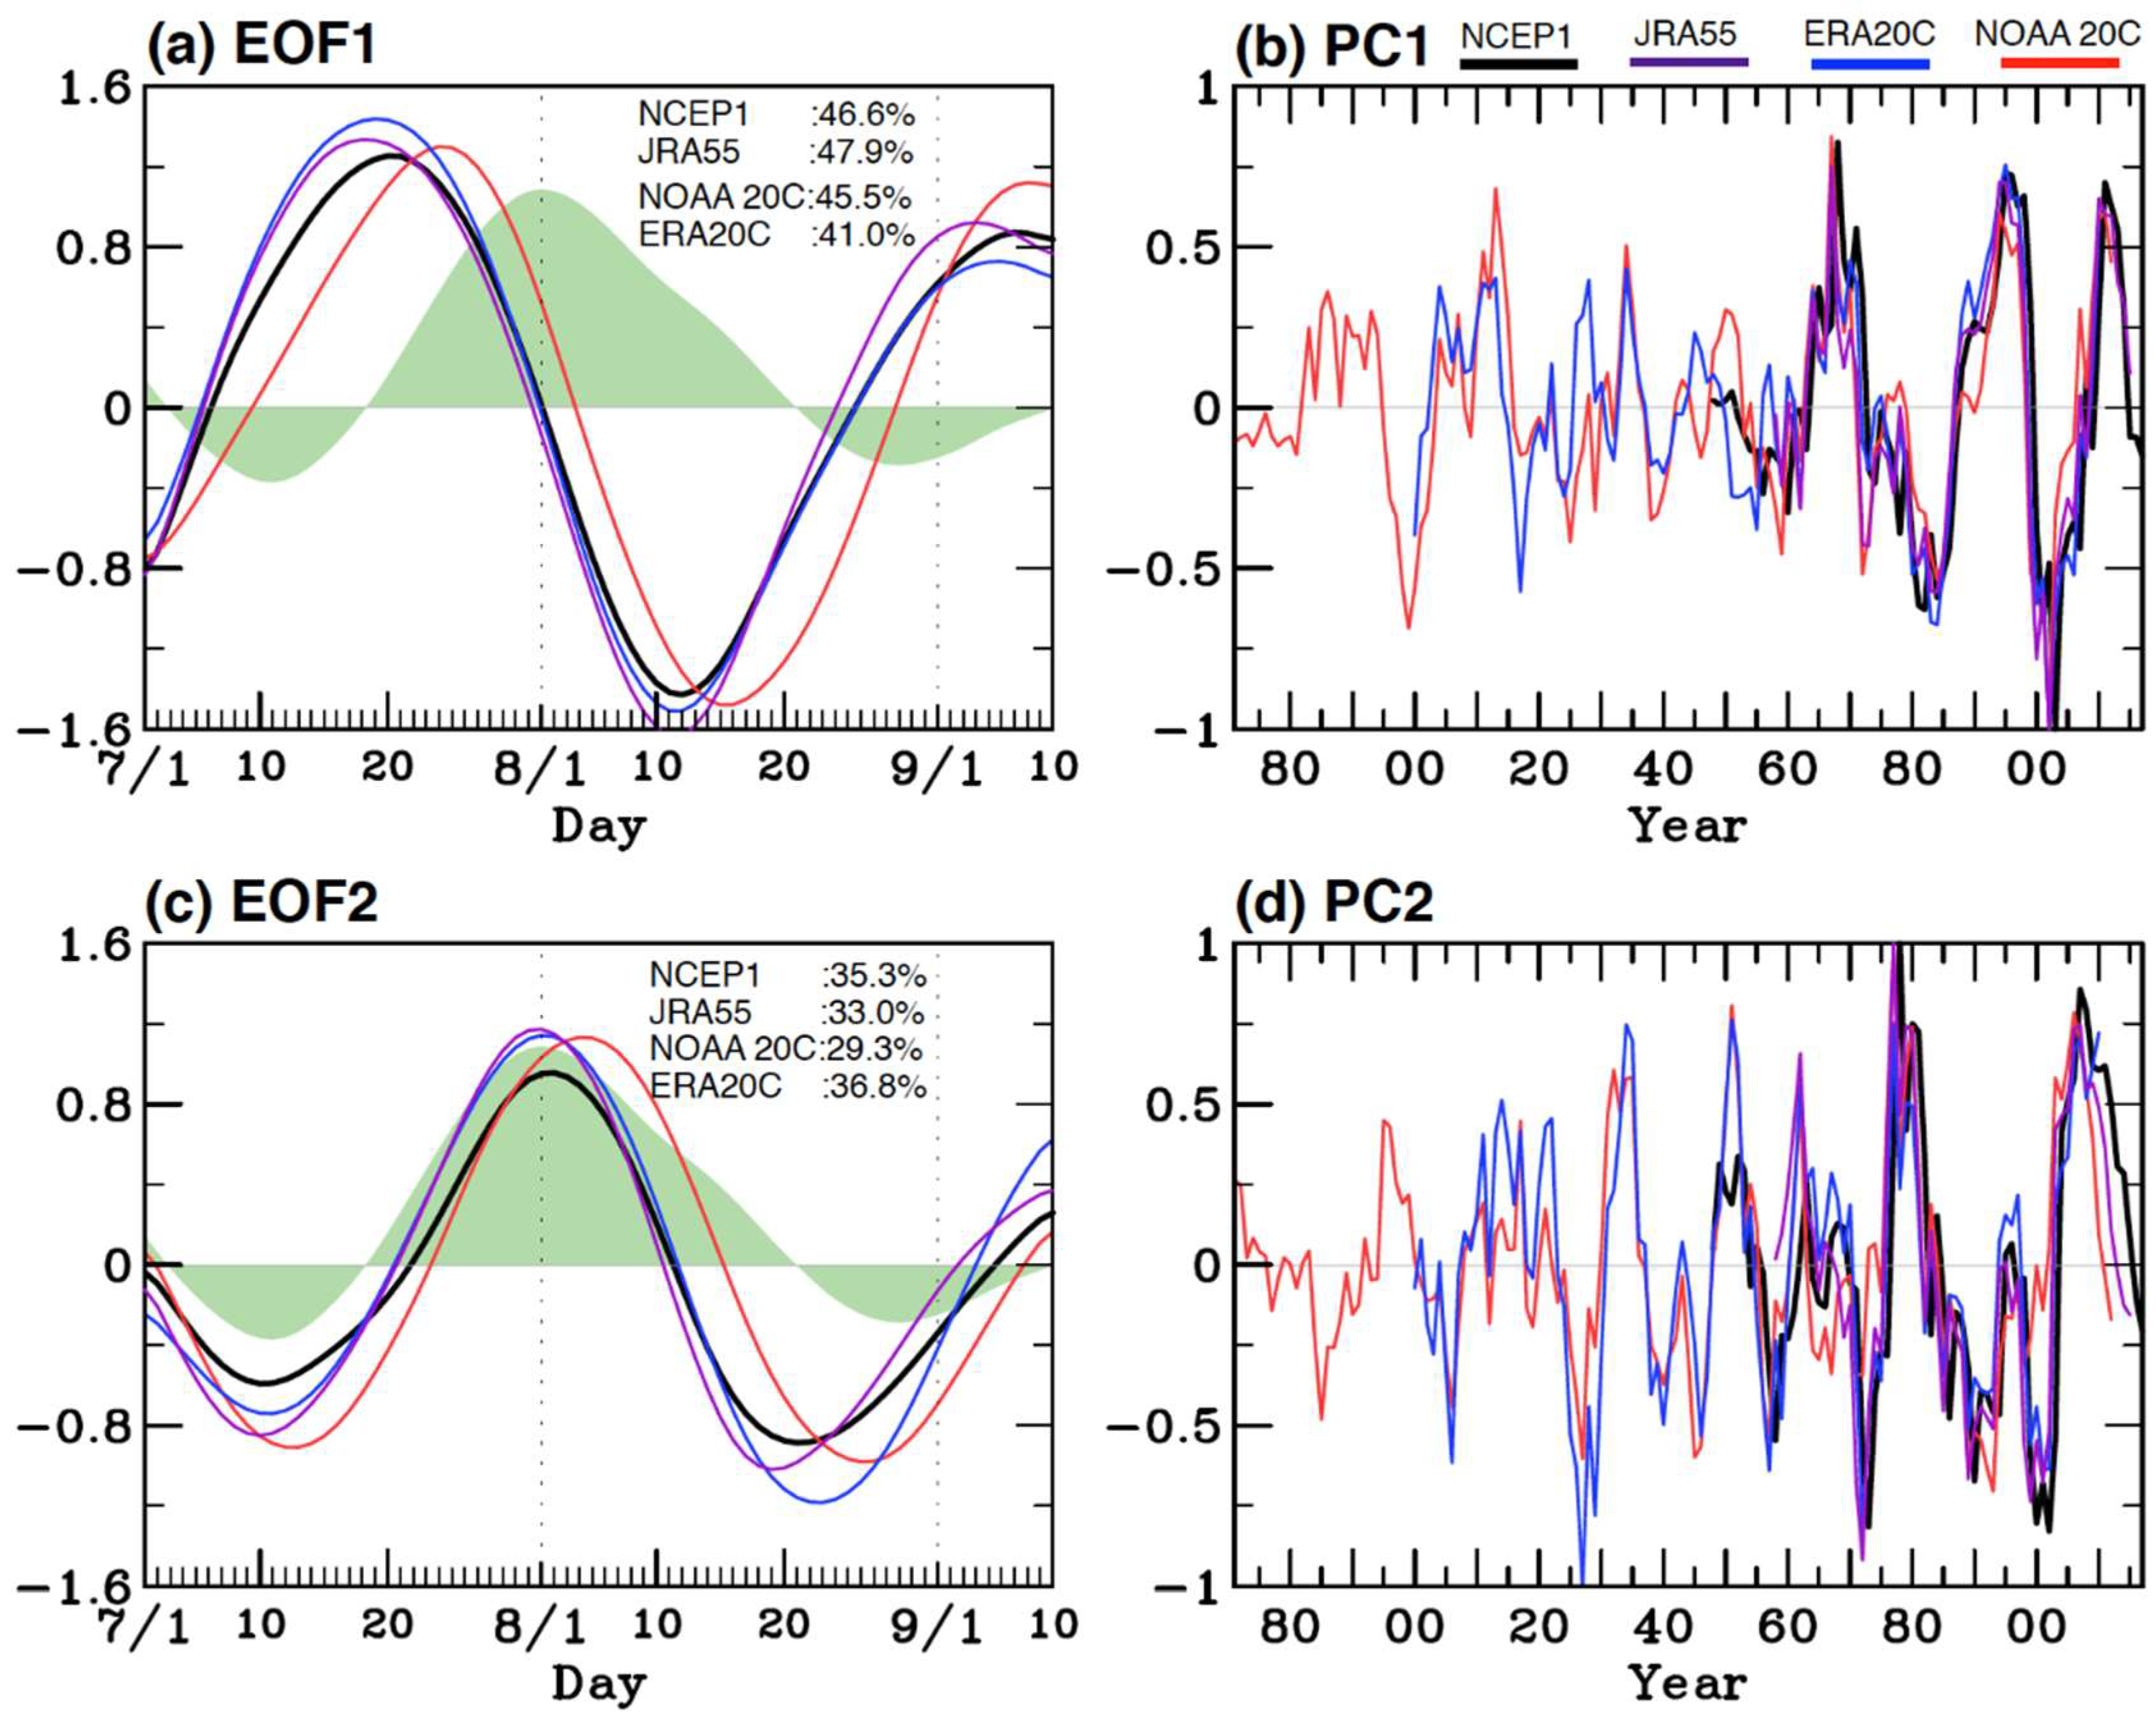
Figure 3.
The composites of 850-hPa velocity potential (shaded), divergent wind (vector) and stream function (green line) at 2 × 10⁶ m2·s−1 during 3 different periods with positive VP anomalies, including: (a) July (1990–1996 and 2008–2014) and (b) August (1980–1986 and 1990–2005).
Figure 3.
The composites of 850-hPa velocity potential (shaded), divergent wind (vector) and stream function (green line) at 2 × 10⁶ m2·s−1 during 3 different periods with positive VP anomalies, including: (a) July (1990–1996 and 2008–2014) and (b) August (1980–1986 and 1990–2005).

Figure 4.
NCEP1-PC1 regresses with every 2-month average of: (a) 850-hPa velocity potential (VP), (b) 850-hPa stream function (ST) and (c) Sea surface temperature anomaly (SSTA) from 1948 to 2017. The hatched areas indicate significance at p < 0.05 for the regression.
Figure 4.
NCEP1-PC1 regresses with every 2-month average of: (a) 850-hPa velocity potential (VP), (b) 850-hPa stream function (ST) and (c) Sea surface temperature anomaly (SSTA) from 1948 to 2017. The hatched areas indicate significance at p < 0.05 for the regression.
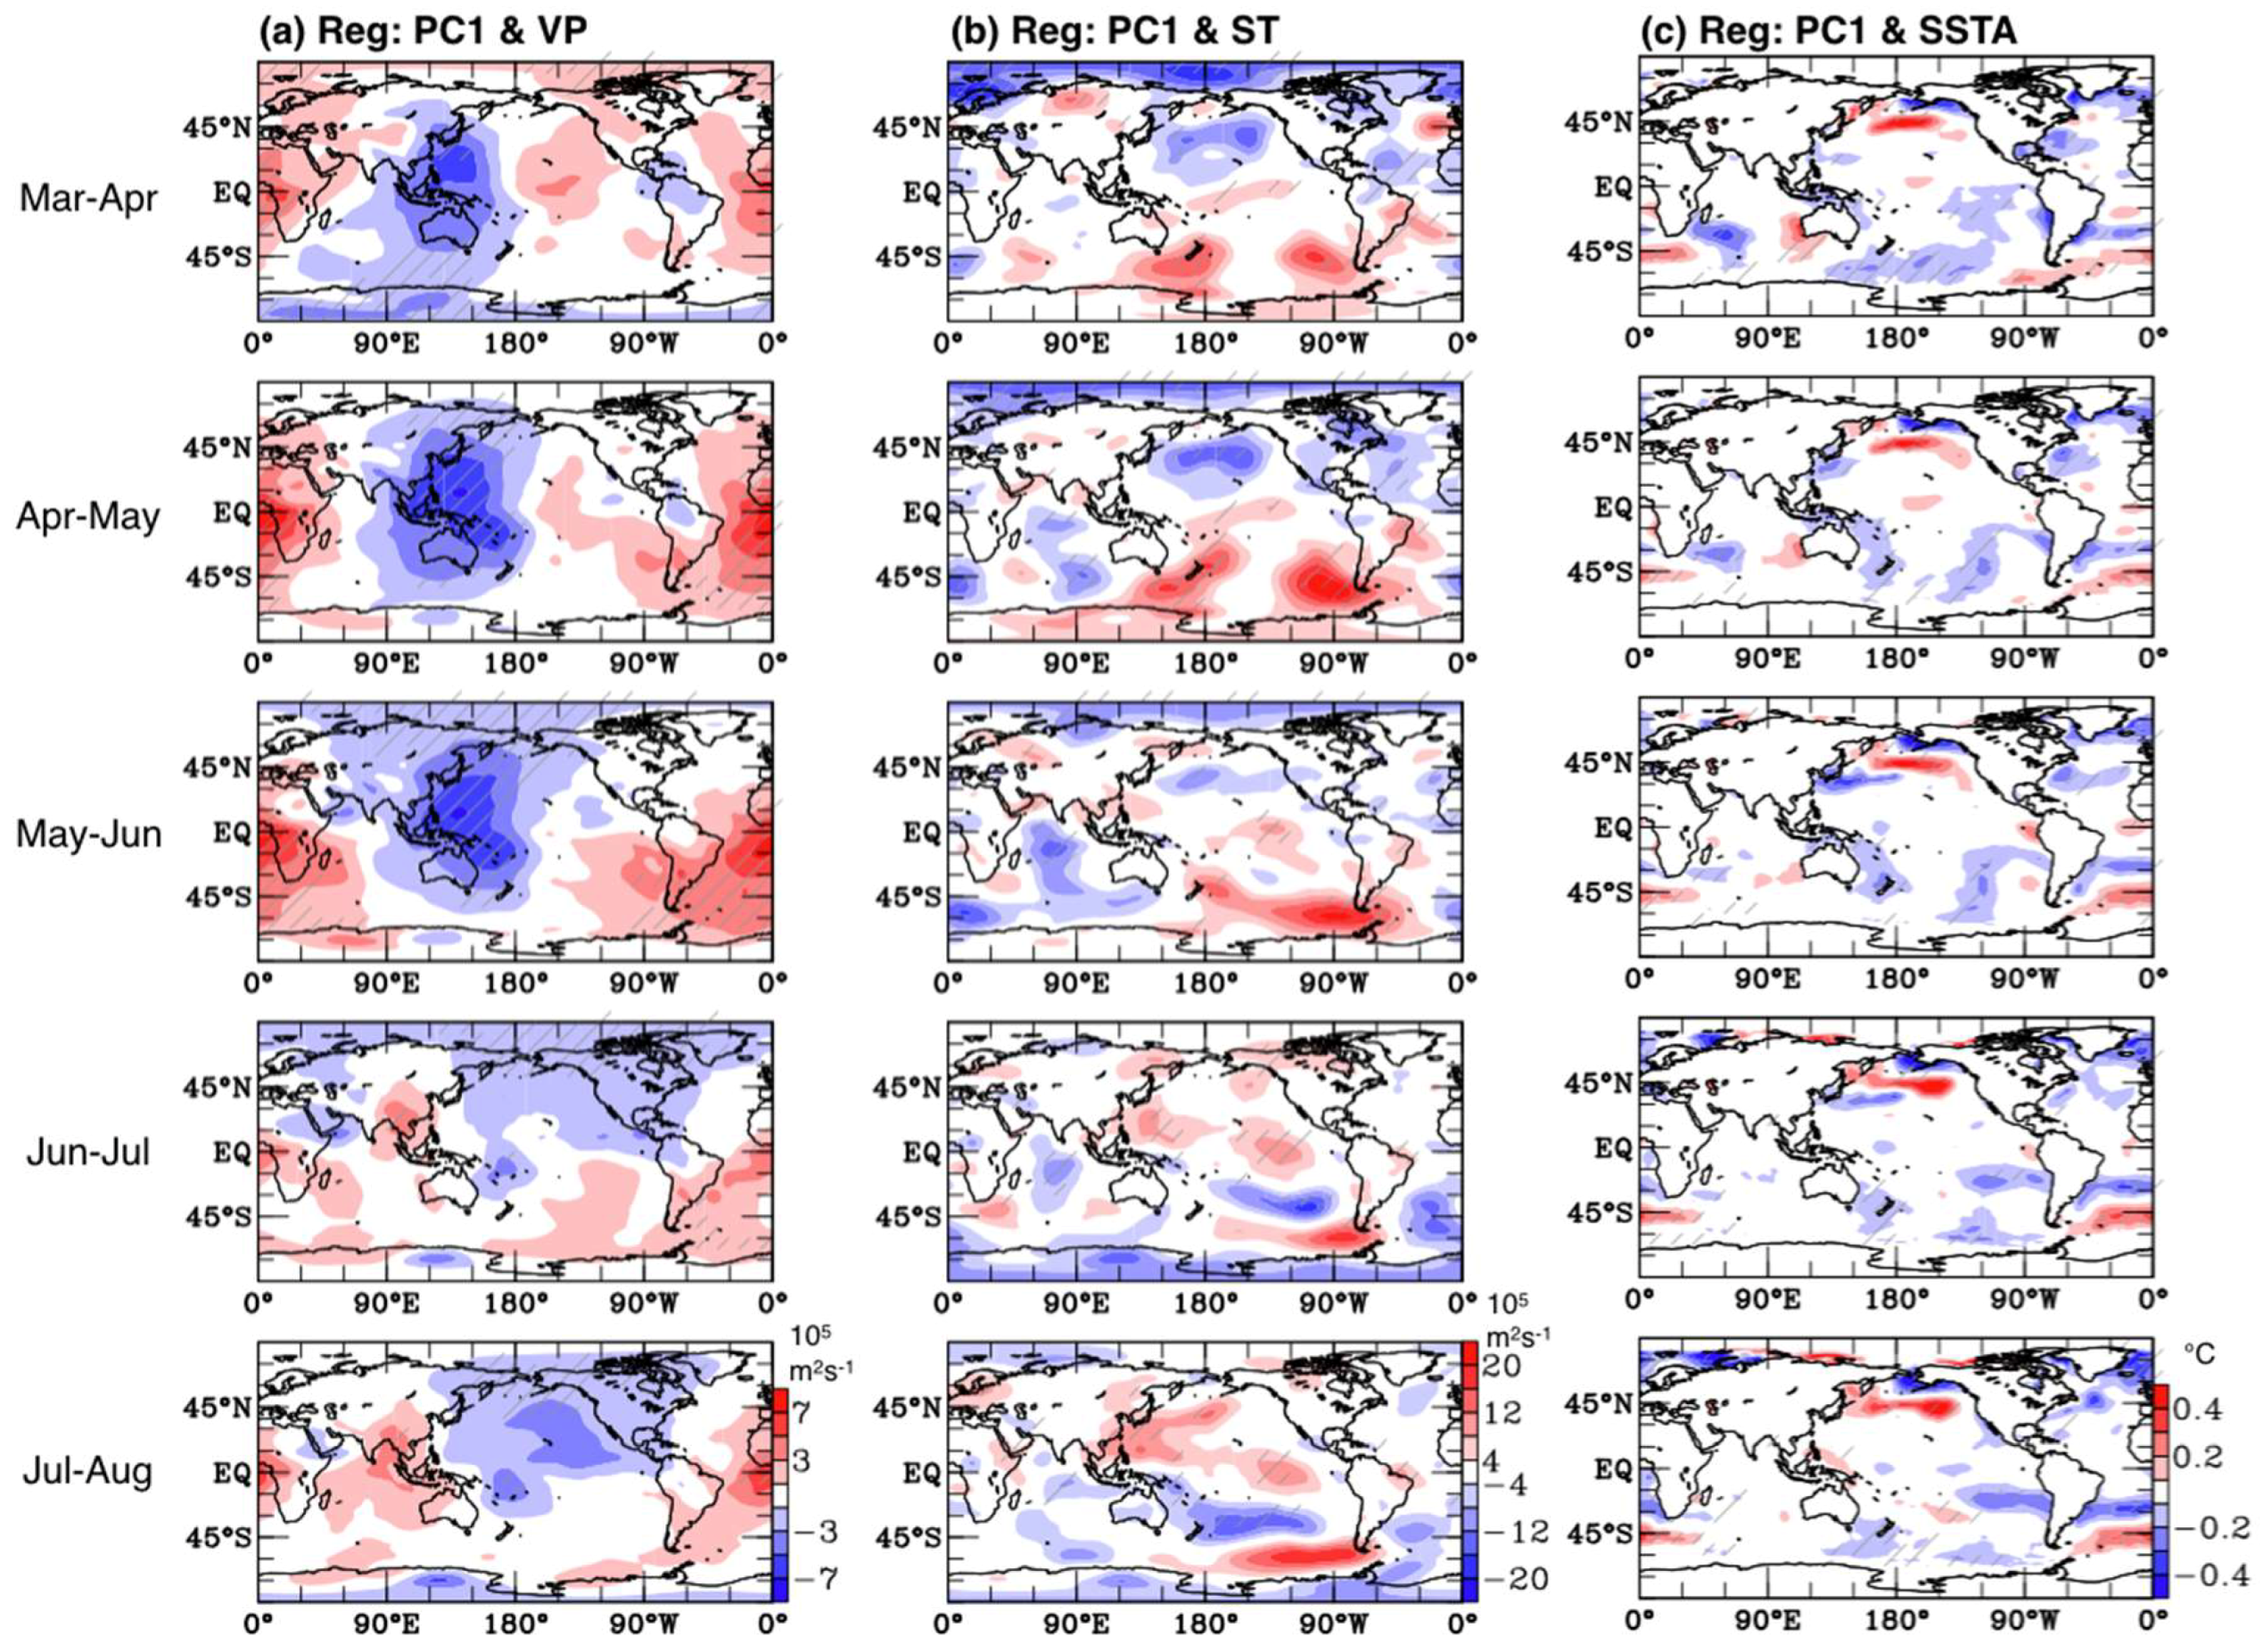
Figure 5.
(a) Sliding correlation with 61-day running window (from day −30 to day +30) between 850-hPa velocity potential (VP) over the Western North Pacific (WNP) and MJO-RMM1 during 1979–2017. (b) is the same as (a) but focuses on MJO-RMM2 f. (c) Yearly distributions of daily RMM1 (Top), RMM2 (bottom) and 850-hPa velocity potential (VP) during 1977–1991 with bandpass filter of 20–100 days averaged over the convergent center in Western North Pacific, with a 5-day and 5-year moving average applied. (d) is the same as (c) but covers the period of 2001–2015. Solid (dashed) lines indicate the convergent (divergent) anomalies of WNP VP with a constant interval of days.
© 2018 by the authors. Licensee MDPI, Basel, Switzerland. This article is an open access article distributed under the terms and conditions of the Creative Commons Attribution (CC BY) license (http://creativecommons.org/licenses/by/4.0/).
Share and Cite
MDPI and ACS Style
Lin, Y.-H.; Wang, S.-Y.S. Multidecadal Variability in the Subseasonal Peak of Low-Level Convergence over the Pacific Warm Pool. Atmosphere 2018, 9, 158. https://doi.org/10.3390/atmos9050158
AMA Style
Lin Y-H, Wang S-YS. Multidecadal Variability in the Subseasonal Peak of Low-Level Convergence over the Pacific Warm Pool. Atmosphere. 2018; 9(5):158. https://doi.org/10.3390/atmos9050158
Chicago/Turabian StyleLin, Yen-Heng, and S.-Y. Simon Wang. 2018. "Multidecadal Variability in the Subseasonal Peak of Low-Level Convergence over the Pacific Warm Pool" Atmosphere 9, no. 5: 158. https://doi.org/10.3390/atmos9050158
Note that from the first issue of 2016, this journal uses article numbers instead of page numbers. See further details here.