Air-Pollutant Emissions from Agricultural Burning in Mae Chaem Basin, Chiang Mai Province, Thailand

Faculty of Environment and Resource Studies, Mahidol University, Salaya 73170, Nakhon Pathom, Thailand
*
Author to whom correspondence should be addressed.
Atmosphere 2018, 9(4), 145; https://doi.org/10.3390/atmos9040145
Submission received: 20 February 2018
/
Revised: 2 April 2018
/
Accepted: 10 April 2018
/
Published: 13 April 2018
(This article belongs to the Special Issue Fire and the Atmosphere)
Abstract
:Particulate pollution is a continual problem which is usually caused by the burning of crop residues in highland agricultural systems. The objectives of this study are to investigate crop-residue management and estimate the amount of pollutant emissions from burning crop residues for each land-use pattern (grain maize, seed maize and integrated farming), and to estimate the chemical compositions of PM2.5 emissions from agricultural burning in Mae Chaem basin, Chiang Mai Province, Thailand. The purposive sampling method was used for sample selection. A door-to-door questionnaire survey was used to obtain responses from 149 respondents. Greenhouse gas (GHG) emissions from the open burning of crop residues were estimated, using specific emission factors obtained from several literature reviews and from the field by the questionnaire survey. Results revealed that the majority of farmers burned maize residues during April and May and mostly in the afternoon. These burning behaviors are in line with the supportive weather conditions that reflect high values of temperature and wind speed, and less rainfall and relative humidity result in maize residues being burned easily and quickly. The integrated farming system generated the lowest GHG emissions and amount of chemical composition of PM2.5 emissions, followed by the grain maize and seed maize patterns, respectively. This study strongly supports the implementation of the integrated farming system in Mae Chaem basin. Proactive and reactive measures should be taken in a well-organized and systematic fashion and should engage all related parties. More importantly, there is an urgent need for policy makers to include PM2.5 concentrations to upgrade Thailand’s air-quality index (PM2.5 AQI).
1. Introduction
Biomass burning is a common phenomenon across the globe that has played a vital part in worsening the climate [1]. Many studies have illustrated the amounts of biomass being burnt from various sources, including deforestation, shifting cultivation, forest fires and burning of fuel as well as agricultural residues, most of which occur in the tropical zone [2,3,4]. At the global scale, forest fires are the largest source of greenhouse gas (GHG) emissions as they release large amounts of carbon at one time, accounting for approximately 2020 Tg (25% of all the burnt biomass), while the second largest source is the burning of agricultural residues [5,6,7]. Burning agricultural or crop residues has resulted in serious air pollution in many countries and over 50% of the black carbon in the global atmosphere [8]. Particulate matter (PM) that results from biomass burning also has negative effects on both the environment and human health. In the developing world, especially in South-East Asia, open biomass burning is a common activity that typically takes place before and after cultivation as a way of controlling crop residues and weeds [9,10]. Specifically, PM2.5 particles with an aerodynamic size of less than 2.5 µm can be deposited primarily in the pulmonary region [11,12]. Due to the large surface area of PM2.5, toxins, including polycyclic aromatic hydrocarbons (PAHs) and heavy metals, are absorbed onto the surface. This can trigger or exacerbate conditions such as asthma, emphysema, bronchitis, silicosis and lung cancer [13].
In the northern part of Thailand, particulate pollution has been a recurrent problem mainly caused by burning of agricultural residues in highlands where maize is grown for animal feed. In Thailand, maize is produced mainly for animal feed: most of the maize production (80–100%) is sold to animal feed factories for commercial purposes and for domestic consumption. Only a small amount of the maize production is exported. In 2015, Thailand’s domestic demand for maize was 5.34 million tons, which was a slight increase (around 5.95%) from 2006, because of the growing demand from the animal feed industry and the expansion of the livestock industry [14]. As a result, the maize-producing areas in the highland were expanded and a total amount of more than 12 million rais (1,920,000 hectares) of agricultural area and forest was turned into maize farms [15]. Farmers usually choose to burn crop residues, as burning is a quick and easy way of getting rid of them to prepare for the next cultivation season. However, burning of such biomass often releases significant amounts of air pollutants such as CO2, N2O, CH4, CO, NH3, NOx, SO2, NMHC, volatile organic compounds (VOCs), semi-volatile organic compounds (SVOCs) and PM10 (particles with aerodynamic size less than 10 µm) [16]. Turning forest and agricultural areas into maize farms also leads to further problems such as pervasive invasions into forests, which result in floods, landslides, and subsequent road accidents as well as damage to crops. Mae Chaem basin is one area in northern Thailand that has changed the use of land from other crops and forests to grow maize significantly [17]. In addition, the overuse of chemical fertilizers and pesticides always has an impact on the environment and the burning of maize residues is a major cause of air pollutants and particulate pollution [18].
Recently, PM2.5 has become a major threat to people’ health in Thailand and the government is placing more emphasis on the monitoring and improvement of local and regional air quality. Khamkaew et al. [19] found that the average PM2.5 concentrations at Chiang Mai University and Doi Ang Khang stations were 74.5 ± 43.5 and 59.1 ± 44.1 µg m−3, respectively, and confirmed that biomass burning was a major source of PM2.5 at both sites. Moreover, Greenpeace [20] reported that Chiang Mai province was one out of five cities with the highest annual average concentrations of PM2.5 from January to July 2016. Seven out of 11 cities measured (63.6%) did not reach the National Ambient Air Quality Standard, which puts the annual limits at 25 µg m−3 for PM2.5, and all 11 cities measured did not reach the World Health Organization (WHO) guideline annual limit of 10 µg m−3. Therefore, the objectives of this study are (1) to investigate the management of crop residues and to estimate the amounts of GHG emissions from burning crop residues of each land-use pattern: grain maize, seed maize and integrated farming; and (2) to estimate the chemical composition of PM2.5 emissions from agricultural burning.
2. Materials and Methods
2.1. Study Area
The study area is Mae Chaem (Chaem River) basin, which is located in Chiang Mai Province in the northern part of Thailand. It is a tributary to the north of the Ping River, which is the largest tributary of the Chao Phraya River in the central part of Thailand. The location of the Mae Chaem basin is 18°6′0″ to 19°10′0″ N and 98°4′0″ to 98°34′0″ E, covering an area of 3853 km2 (Figure 1). The climate of this area is determined by the amount of seasonal precipitation, given that the annual precipitation is influenced by Pacific-born typhoons and superimposed on the south-west monsoon [21]. These geographic parameters result in the spatial distribution of precipitation [22], an average annual temperature between 20–34 °C, and a rainy season that lasts from May to October.
The pattern of land use has shifted drastically over the past decades. In the 1960s, much of the plantation area at high altitude (>1000 m.a.s.l.) was dedicated to opium plantations, while at medium altitude (600–1000 m.a.s.l.), farmers carried out rotational farming, meaning that they grew their crops for a decade and then left the land empty for another decade. The main crop grown was rice, mostly around residential areas [23,24]. In the 1980s, the Mae Chaem basin development projects led to the development of infrastructure and the promotion of small agricultural projects for commercial purposes with the aim of fighting poverty and encouraging the cultivation of other crops over opium. The development project resulted in an increasing number of agricultural products from the highlands, such as cabbage and carrots, and the expansion of industrial crops such as soybean and maize around basins between high and medium altitudes, as well as the expansion of irrigated areas for rice, fruit and orchids [23,24,25,26]. However, in the last 10 years maize monoculture has increased dramatically due to increasing demand for maize according to the growth of the animal feed industry [27].
2.2. Data Collection
The objective of this research is to study the areas dedicated to growing grain maize, seed maize and integrated farming. In this study, integrated farming refers to the cultivation of more than two different cash crops in the same area. Crops that were commonly grown in the Mae Chaem basin included peanut, potato, soybean, pumpkin, napa cabbage, strawberry, cabbage, shallot, Chinese parsley, avocado, coffee bean and other vegetables. The sampling method was purposive sampling, by which the researcher identified the expected numbers of farming villages and households that grew maize and maize seed and practiced integrated farming in relation to the objective of the study. To be precise, this study aimed to collect data from farming households that grew grain maize and seed maize and practiced integrated farming, which meant that a sample size determined on the basis of the total number of households in the villages would be too large for this study. However, the number of samples to be taken from each village was determined based on the consultation with the sub-district administrative organization, making effective use of their broad knowledge of the area, expertise, and experience to come up with the group of samples that best represented the area. Onsite data collection included 10 sub-districts from two districts: (1) Mae Suek, Mae Na Chon, Tha Pha, Pang Hin Fon, Kong Khaek, Ban Thap, and Chang Khoeng sub-districts in Mae Chaem District; and (2) Chaem Luang, Ban Chan, and Mae Daet sub-districts in Galyani Vadhana District. Each of these sub-districts was represented by two of its villages, and each village was represented by approximately 10 of its households. In-depth interviews included 20 community leaders and 10 chief officials from district and sub-district administrative organizations. In total, there were 149 respondents.
Monthly temperature, relative humidity, rainfall and wind speed data were obtained from Chiang Mai meteorological station during the period 2012–2017. Data were analyzed to detect the climatological trend and connect with crop residual burning activities during the past 5 years.
2.3. Estimating Greenhouse Gas (GHG) Emissions
The volume of emissions of gas “x” from burning crop residues was estimated based on the amounts of crop residues burnt, called “activity data”, and the emission factor [28], as shown in Equation (1). In estimating activity data, the burned area, biomass density and burning efficiency were taken into account, as shown in Equation (2):
where x is the emission type; Ex (g) is the amount of emission of each type; A (kg) is the activity data; EFx (g kg −1) is the emission factor; BA (km2) is the burned area; BD (kg m−2) is the biomass per surface unit; and BE (dimensionless) is the burning efficiency.
In this study, the specific emission factors from several literature reviews were used, as shown in Table 1. In this study, BD is 0.40 kg m−2 (range: 0.30–0.50 kg m−2) [29], while BA and BE were obtained from the field.
More specifically, chemical compositions of PM2.5 emissions from maize burning were estimated using the emission factor from Li et al. [30].
2.4. Estimating Activity Data
2.4.1. Burned Area (BA)
The burned area was estimated based on the crop harvest area (HA) and the ratio of the burned area to harvest area, as shown in Equation (3).
where HA is the area where the crop of each type was harvested and %BA is the ratio of the burned area to harvest area. The data on harvest areas of both maize and maize seed in the study area were collected from Mae Chaem District Agriculture Office, and %BA data were collected from the farmers.
2.4.2. Burning Efficiency (BE)
Burning efficiency was the actual ratio of both types of maize residues that were burned down. Burning efficiency was divided into four groups: (1) minimal burning (1–25%), (2) nearly half burned (26–50%), (3) more than a half burned (51–75%), and (4) nearly all burned (76–100%).
2.5. Ground Observation and Questionnaire Survey
Questionnaires were used to collect data about farm management practices, crop residue management, and burned areas. The main topics in the questionnaire included the following: (1) the cultivation area of crops; (2) the number of crop plantations; (3) the variety of crops grown; (4) planting, storing and harvesting methods; (5) the method of removing residues of crops from the farm after harvesting; (6) the reasons for burning or not burning residues; (7) did farmers burn their residues of both maize types? (If yes, how much and when?); (8) if the farmers did not burn the crop residues, what did they do with them? (9) How much of the residue was burned (1–25%, 26–50%, 51–75%, 76–100%)? (10) How much of the planting area was burned (1–25%, 26–50%, 51–75%, 76–100%)? (11) What were the income, cost, and revenue per crop (baht/year)? (12) Was there any other income, aside from maize (baht/year)? (13) Was there any policy or support from the government and/or any related agency concerning maize production? (14) Was there any policy or support from the government and/or any related agency concerning aspects other than maize production? (15) If they were asked to stop growing maize and start growing other crops, would they be willing to? Why? What were the advantages and disadvantages?
3. Results
3.1. Meteorological Data
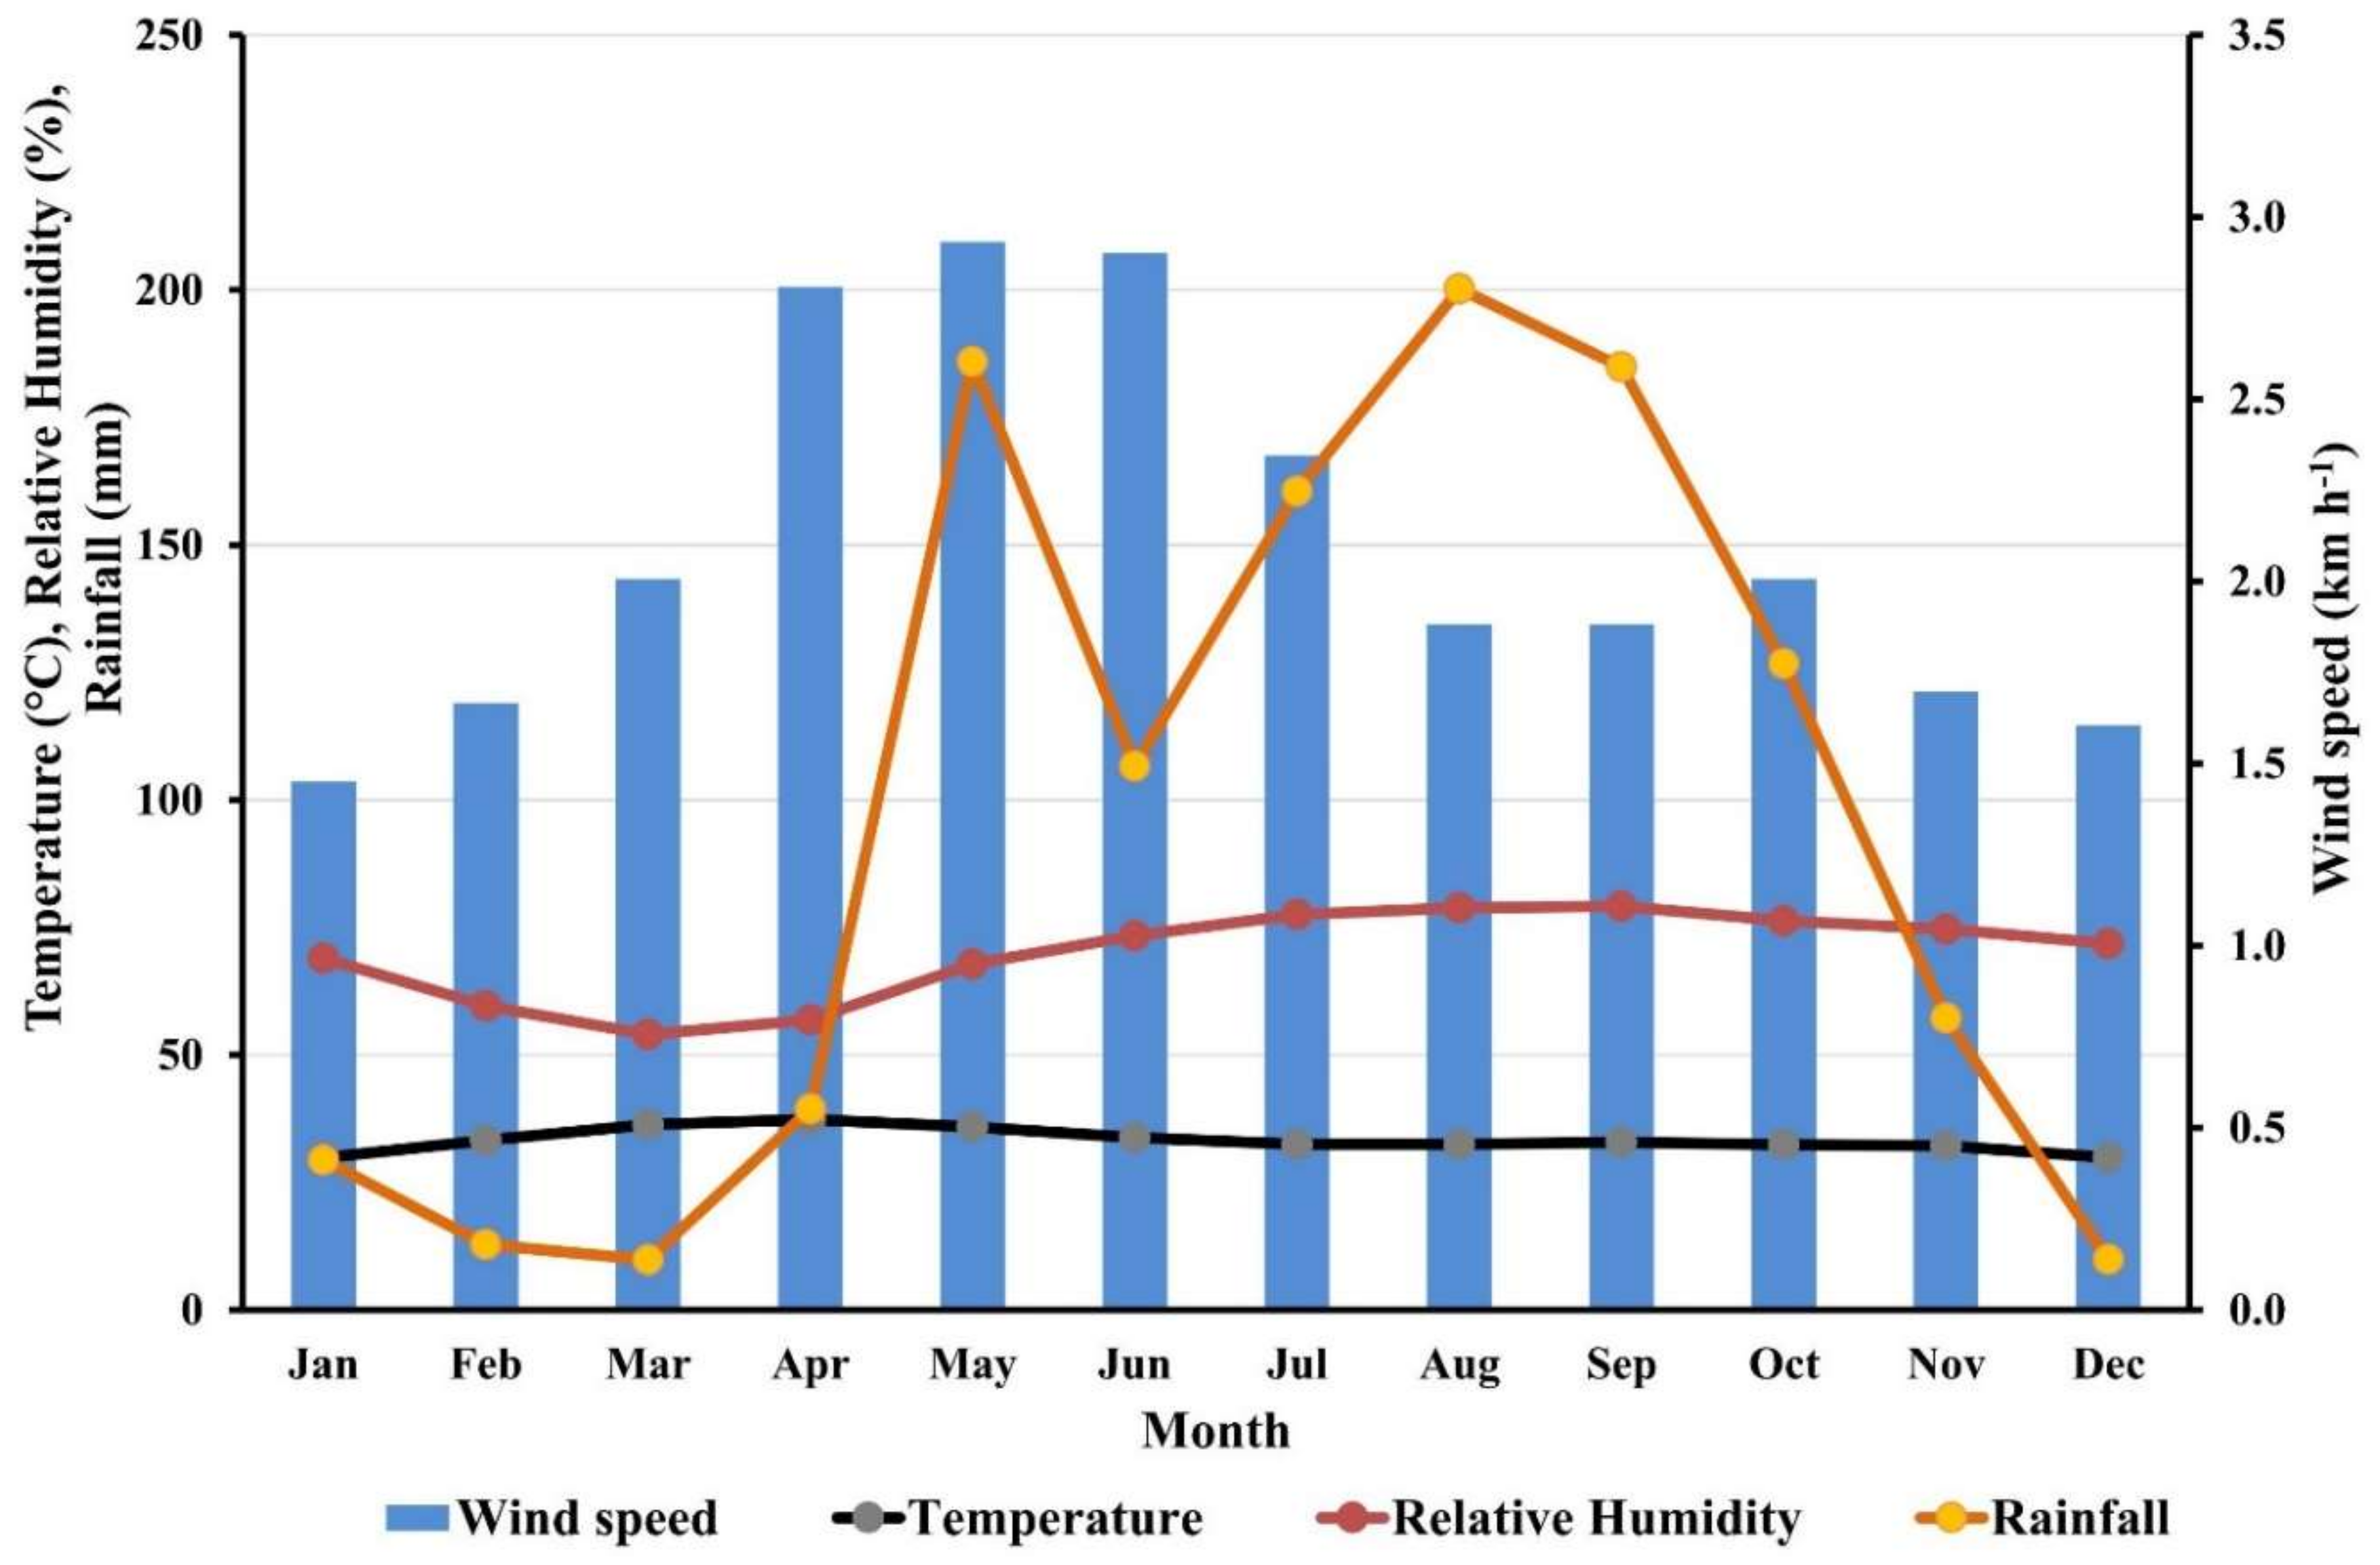
The meteorological data collected at Chiang Mai Province during the period of 2012–2017 is shown in Figure 2. The average temperatures of the 5-year period ranged from 29.8 °C (January) to 37.4 °C (April). The monthly average rainfall ranged from 9.8 mm (March) to 200.2 mm (August). The average relative humidity and wind speed ranged from 54.0% (March) to 79.2% (September), and 1.5 km h−1 (January) to 2.9 km h−1 (May), respectively.
3.2. Burning Seasons of Grain Maize, Seed Maize and Integrated Farming
Field data showed that, among the farmers in the Mae Chaem basin, 29% and 27% burned residues of grain maize and seed maize in April and May, respectively. After that, the most common months for burning these residues were December (21%), February (7.7%), November (5.8%), January (3.8%), and June, July, and October (1.9% each). However, none of them burned the maize residue in March, August and September. Meanwhile, 31.82% burned crop residues from the integrated farming system in April, 22.72% in May, 9.09% in January, March, and December, and 4.54% in February, August, September, and November. Also, it was found that none of the farmers burned the crop residue from the integrated farming system in June, July or October (Figure 3).
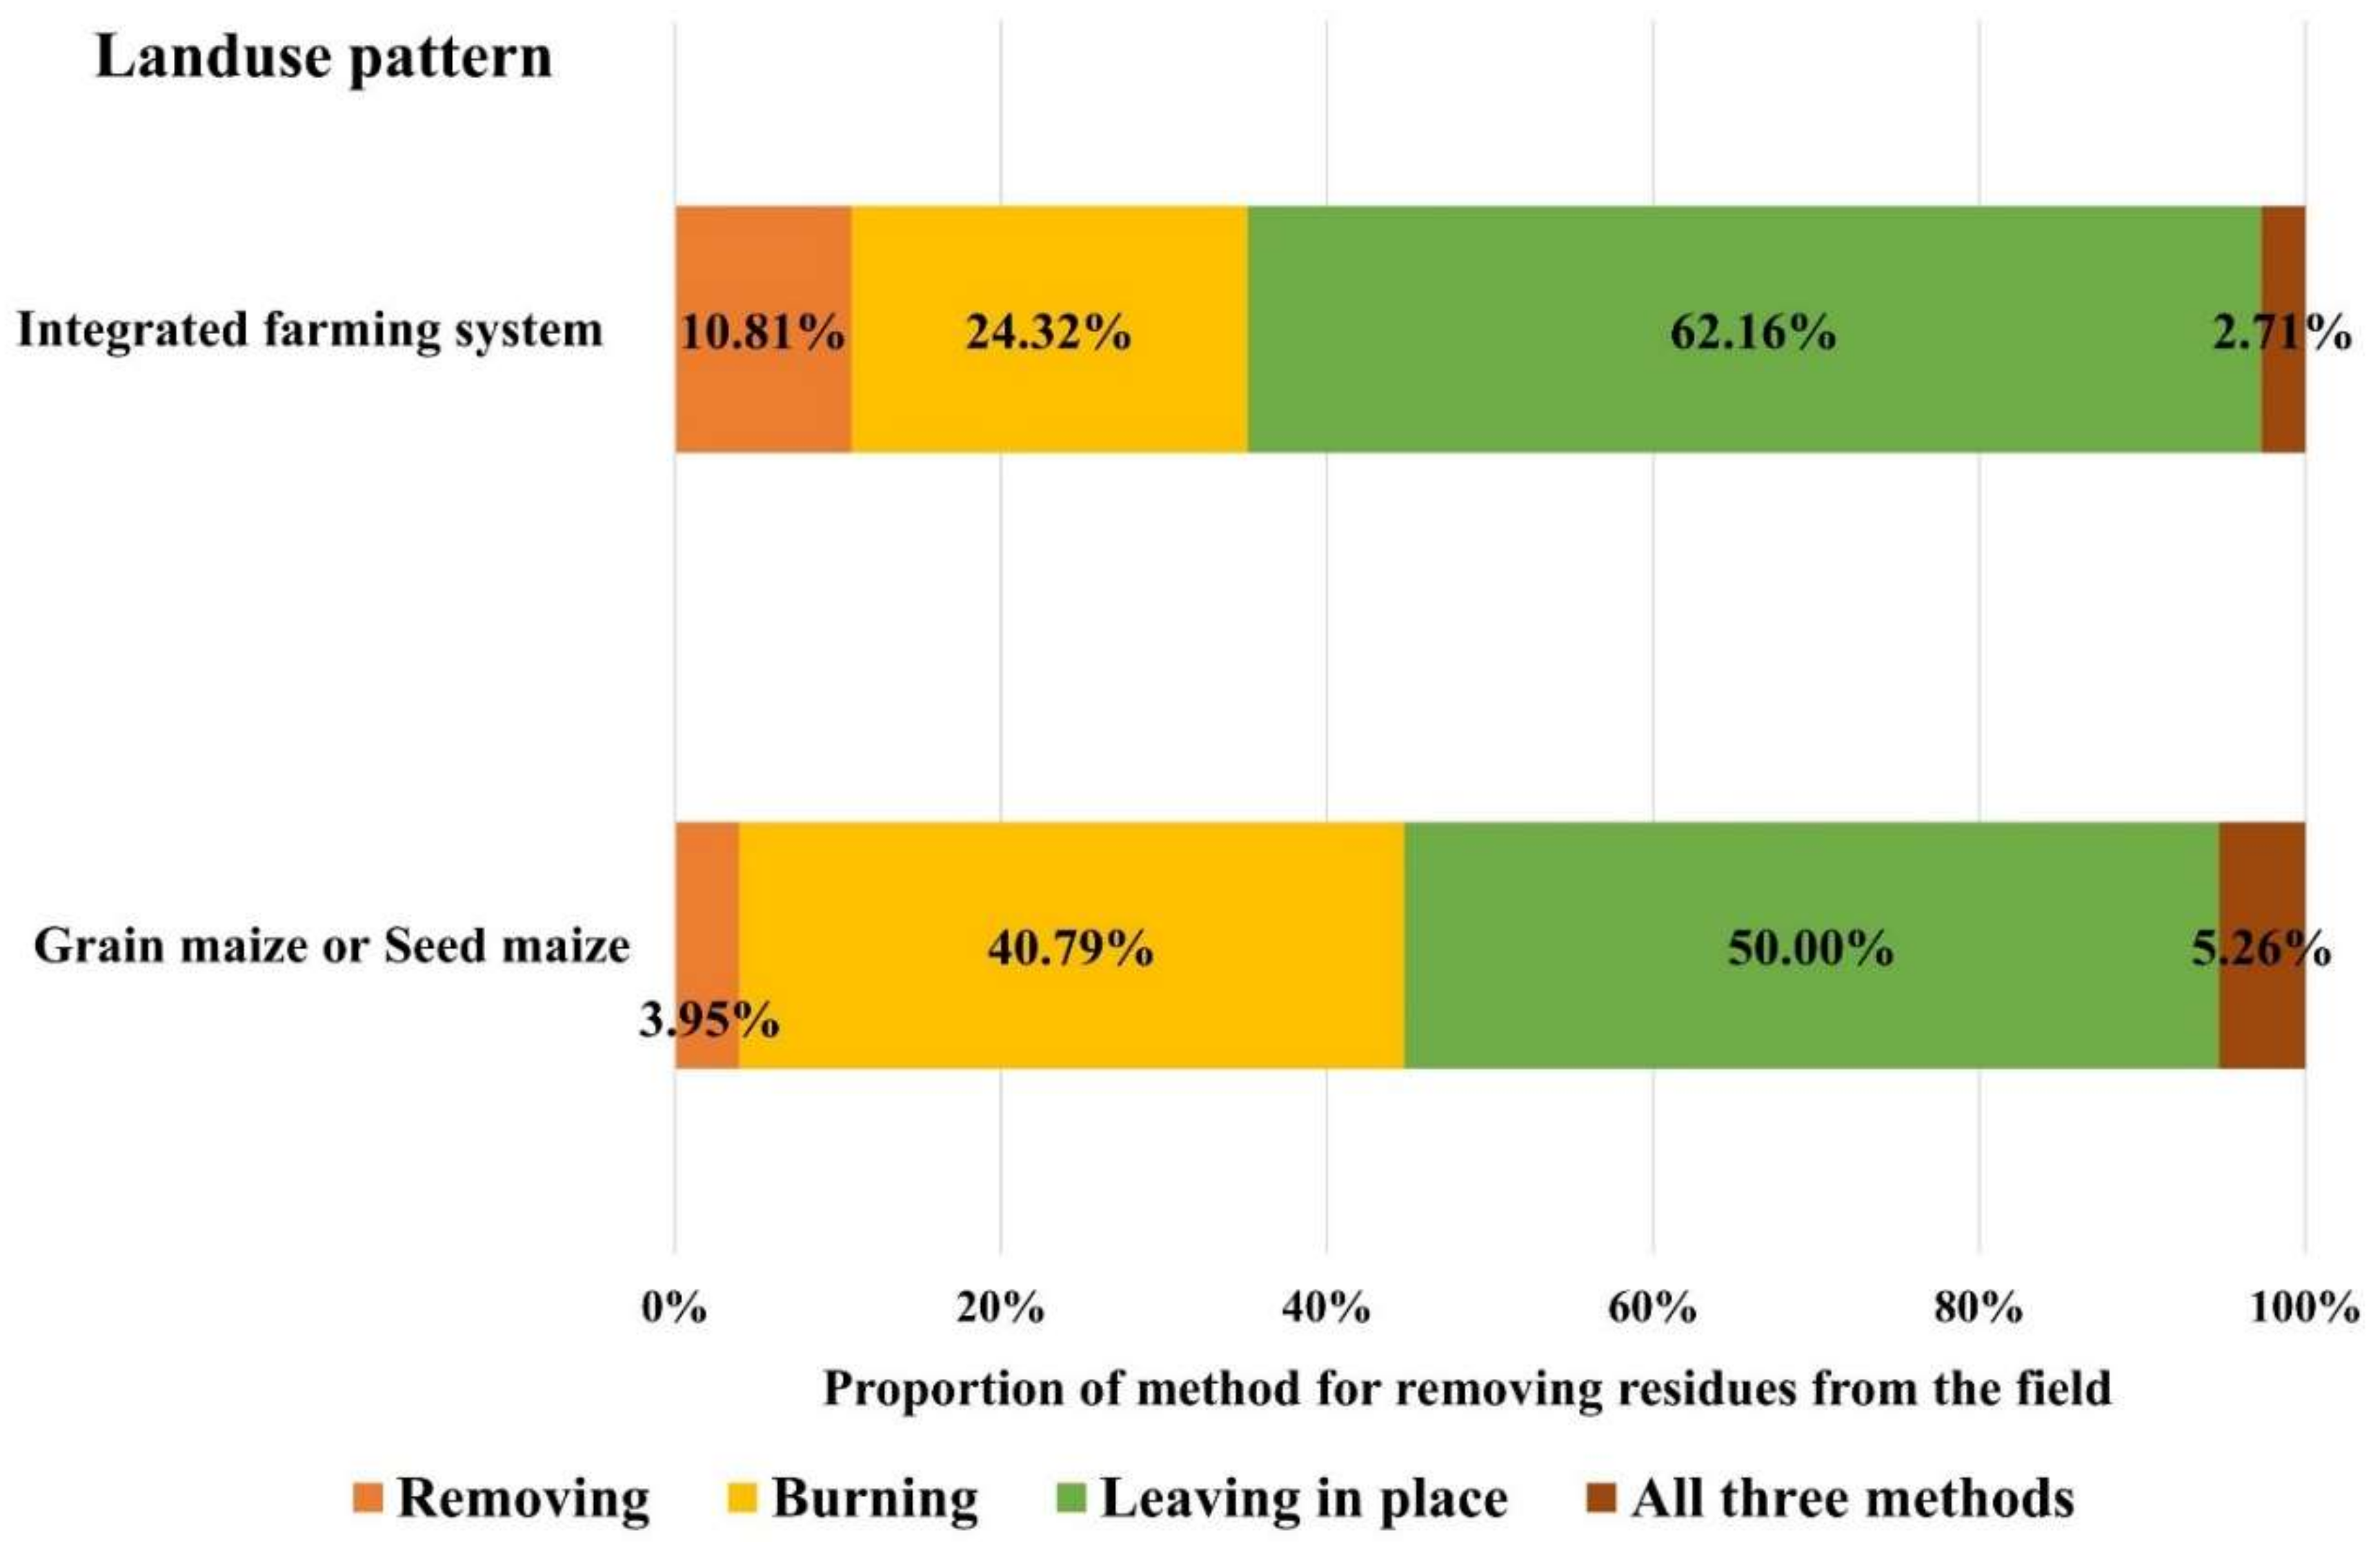
3.3. Method of Removing Residues from the Field
Approximately 50% of the farmers left the grain maize and seed maize residues in their fields without burning or removing them while 41% of them burned them in the field. In addition, it was found that 4% of the farmers took the residue out of their fields to use it for other purposes, and 5% of them practiced all three methods: burning, removing and leaving in place. Most of the farmers (approximately 62%) left the crop residue from the integrated farming system within their fields, while 24% of them burned it down. Only 11% of them removed the crop residue from their fields to use it for other purposes and 3% of them practiced all three methods (Figure 4).
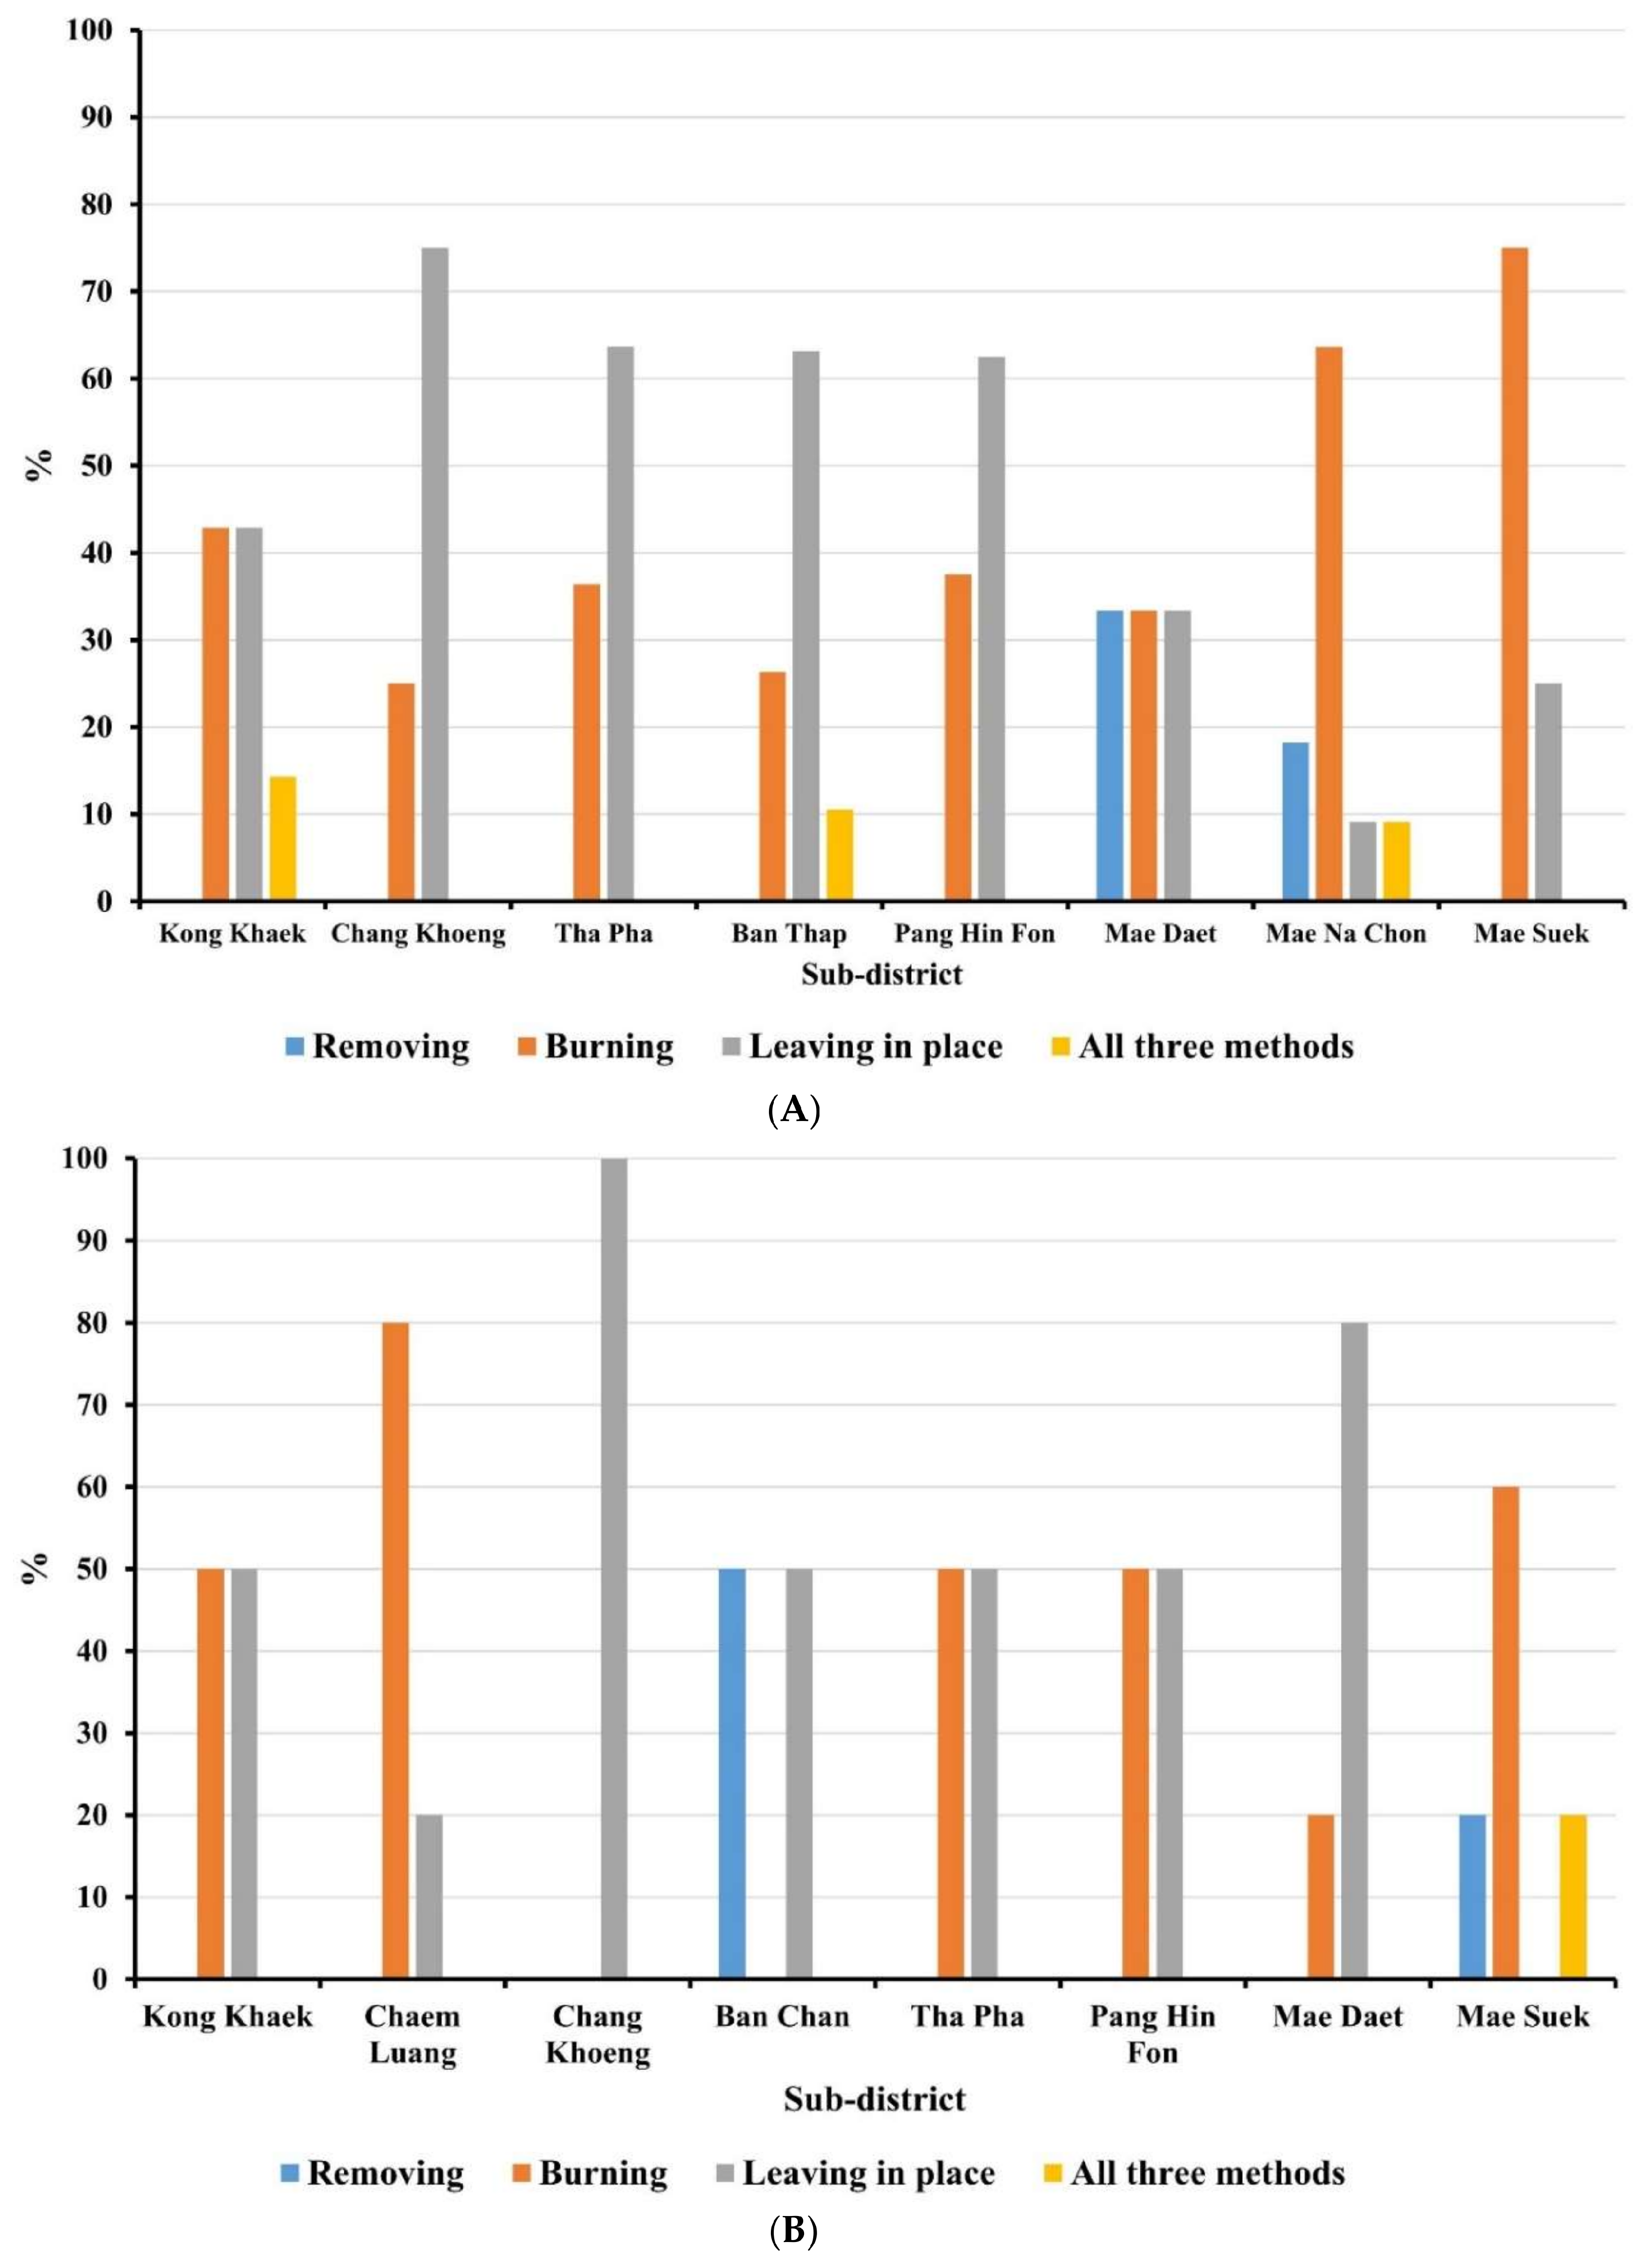
However, farmers in each area had different ways of dealing with the crop residues. The results showed that 75% of farmers in Chang Khoeng sub-district left the grain maize and seed maize residue on their fields, while 25% of them burned it. Of the farmers in Mae Daet sub-district, 33.33% removed the residue from their fields, 33.33% burned it down, and the remaining 33.34% left it within their fields. Moreover, of the farmers in Mae Suek sub-district, 75% burned the residue on their fields while 25% of them left it on their fields (Figure 5A). Figure 5B illustrates how crop residues were dealt with by farmers who practiced integrated farming. It was found that in Chaem Luang sub-district most of the farmers burned it down in their fields (80%) and 20% of them left it in their fields. Farmers in Ban Thap and Pang Hin Fon sub-districts were similar: 50% of them burned the crop residue in their fields and the other 50% left it in their fields. Meanwhile, Mae Suek sub-district was the only area where farmers did not leave any crop residue in their fields, with 60% of them burning it down and 20% of them removing it from their fields. It was also found that in Chang Khoeng sub-district, all the farmers left the crop residue in their fields.
3.4. Times of the Day at Which Crop Residues Were Burnt
Most of the farmers (66.67%) burned the grain maize and seed maize residues in the afternoon (12:01–18:00 h), while 27.78% of them did so in the morning (06:01–12:00 h), and 5.55% of them did so in the evening (18:01–06:00 h). Moreover, the results showed that 85.71% of the farmers burned the crop residue from the integrated farming system in the afternoon (12:01–18:00 h), 14.29% did so in the morning (06:01–12:00 h), and none of them did so in the evening (18:01–06:00 h) (Figure 6).
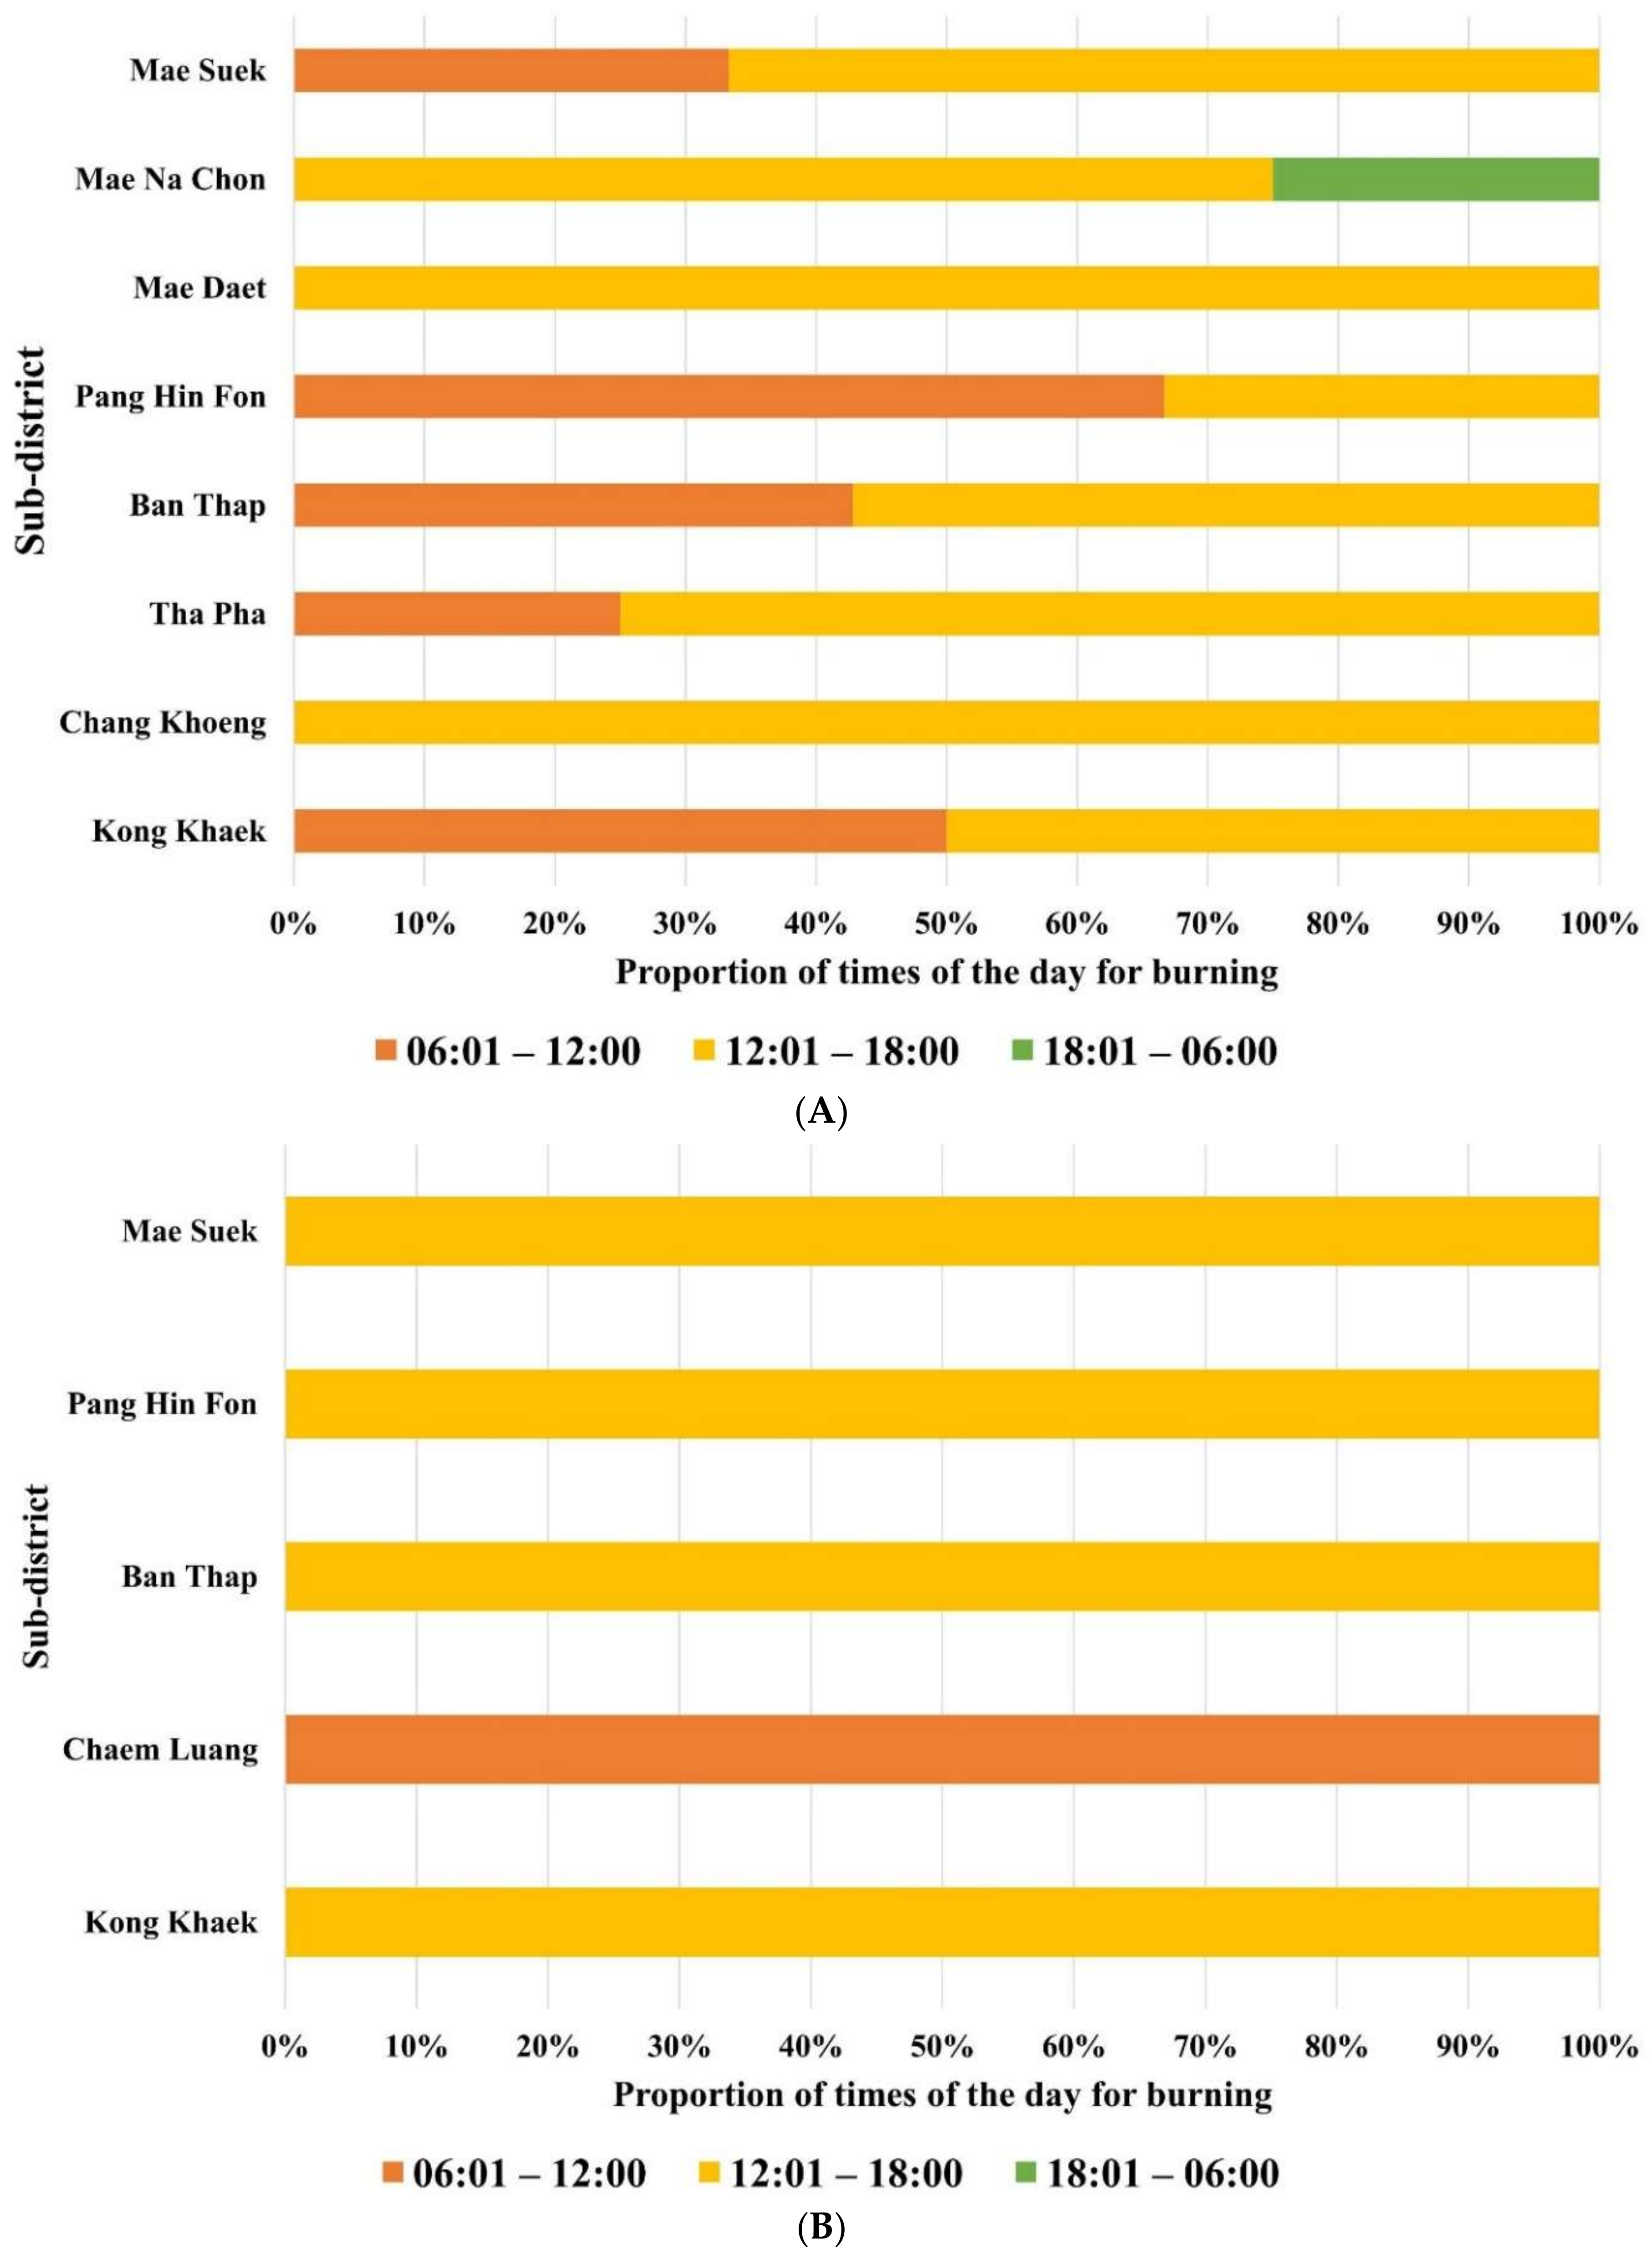
Concerning each area, all of the farmers in Chang Khoeng and Mae Daet sub-districts burned the grain maize and seed maize residues in the afternoon. Of the farmers in Mae Na Chon sub-district, 75% burned it in the afternoon and 25% of them did so in the evening. On the other hand, 67% of the farmers in Pang Hin Fon sub-district burned it in the morning and 33% of them did so in the afternoon (Figure 7A). In the case of integrated farming, most of the farmers in Kong Khaek, Ban Thap, Pang Hin Fon, Mae Suek, and Mae Daet sub-districts chose to burn the crop residue in the afternoon. Meanwhile, most of the farmers (86%) in Chaem Luang sub-districts chose to burn the crop residue in the morning (Figure 7B). In addition, it was found that 61% of the burning activity took between one to two hours, while 39% of the activity took less than one hour.
3.5. GHG Emissions from Burning Grain Maize and Seed Maize Residues
From highest to lowest amounts, the GHG emissions that resulted from burning grain maize and seed maize residues were as follows: CO2 > CO > PM10 > PM2.5 > NMVOCs > CH4 > NOx > BC > SOx > N2O. Estimated amounts of CO2, CO, PM10, PM2.5, NMVOCs, CH4, NOx, BC, SOx, and N2O emissions from burning grain maize residues were 9879.3, 253.0, 40.4, 39.1, 29.3, 17.6, 11.7, 4.9, 1.3, and 0.5 kg ha−1 year−1, respectively (Table 2). Meanwhile, the estimated amounts of the greenhouse gases CO2, CO, PM10, PM2.5, NMVOCs, CH4, NOx, BC, SOx, and N2O emitted by burning seed maize residues were 16,851.7, 656.1, 104.8, 101.5, 76.1, 45.7, 30.4, 12.7, 3.4, and 1.2 kg ha−1 year−1, respectively (Table 3). Overall, the total amount of GHG emissions caused by the burning of seed maize residues was 23.94% higher than the total emissions caused by the burning of grain maize residues.
3.6. GHG Emissions from Burning Crop Residues under the Integrated Farming System
Similarly, GHG emissions that resulted from burning crop residues from the integrated farming system were as follows: CO2 > CO > PM10 > PM2.5 > NMVOCs > CH4 > NOx > BC > SOx > N2O. On average, the estimated amounts of the greenhouse gases emitted from burning crop residues under the integrated farming system were 6383.4, 163.5, 26.1, 25.3, 19.0, 11.4, 7.6, 3.2, 0.8, and 0.3 kg ha−1 year−1 (Table 4). In addition, it was found that the farmers in Ban Thap sub-district who grew grain maize and, after harvesting, shallot, accounted for the greatest amount of GHG emissions from burning crop residues among all crops grown in the area, whereas the farmers in Chaem Luang sub-district who grew Japanese pumpkin twice a year accounted for the smallest amount of GHG emissions.
3.7. Chemical Components Characteristics in PM2.5
The estimation shows that the integrated farming system produced the lowest amount of chemical composition of PM2.5 emissions, followed by grain maize and seed maize, respectively. OC was detected as the dominant chemical composition in PM2.5 mass, followed Cl−, NH4+, K+, EC, SO42−, and NO3−, respectively. The top 10 pollution levels of heavy metals in the PM2.5 mass were in the following order: Pb > K > Ti > Mn > V > Sr > S > Cd > As > Se in all three land-use patterns (Table 5).
4. Discussions
4.1. Prescribed Agricultural Burning Behaviors
Prescribed burning can be accomplished by applying knowledge of and skill with burning to specific site and weather conditions [35]. However, common prescribed burning parameters influencing land-management purposes are rainfall, relative humidity, temperature and wind speed [36,37]. Based on our findings, the majority of farmers in the Mae Chaem basin burned residues of grain maize and seed maize during April and May (Figure 3) and mostly in the afternoon (Figure 6). These burning behaviors are in line with the supportive weather conditions for burning. This is because the high values of temperature and wind speed, and less rainfall and relative humidity during the burning period (Figure 2), result in maize residues that are burned easily and quickly. This finding can be supported by Indiana Department of Natural Resources [35], which indicated that high temperatures help dry residues quickly and increase the heat intensity of the fire. High wind speed can also increase the spread of flames and airborne particulate distribution, while calm wind supports air-pollutant accumulation. Moreover, temperature and wind speed generally increase to a maximum in the early afternoon and then decrease to a minimum after sunset.
Furthermore, fires are more intense under low rainfall or in an area to be burned that has dried after rainfall. These results are due to the rainfall effects on relative humidity of the surrounding air and moisture content of residues; if they retain more moisture, they are less apt to burn. Our results are also consistent with Chantara et al. [38] who found that the concentrations of atmospheric pollutants in Chiang Mai (Thailand) were high from January to April (dry season), decreased from May to October (wet season), and increased again from November to December (the cool, dry season). The Pollution Control Department (PCD) [39] also reported that open biomass burning in agricultural and forest areas in northern Thailand produced vast smoke/haze during the dry season (February–April), which is consistent with Chantara et al. [38] and Sillapapiromsuk et al. [40].
4.2. Field Burning of Crop Residues and GHG Emissions
Maize cultivation in the Mae Chaem basin takes place in the non-irrigated highlands. After harvesting, farmers leave the maize residues in the field until the next crop. However, open field burning of crop residues is a simple method by which farmers in this area can clean the agricultural land to facilitate soil tillage. Several studies have confirmed that open burning of crop residues is an efficient way to control insects, diseases and the emergence of invasive weed species [41,42]. On the other hand, it has been argued that this practice has negative impacts in terms of national economic losses [43,44], environmental degradation [45,46], health impacts [47], and soil organic matter (SOM) loss [48], which leads to a reduction of soil fertility and crop production.
Importantly, open field burning of crop residue transforms soil nutrients to gaseous form which is released to the atmosphere [49]. It has been reported that field burning of crop residues represents a major source of GHGs and aerosols [50,51]. These trace gases have negative impacts not only on the environment but also on human and animal health, especially in pregnant woman and small children [52,53]. According to Singh et al. [54], the medical records of the civil hospital of Jira, Punjab, indicated that there was a 10% increase in the number of patients within 20–25 days of the burning period. This is because more than 60% of the people live in the rice cultivation areas and rice residues are burned every season. In addition, Gadde et al. [55], Gullett and Touati [56], and Lin et al. [57] mentioned that burning crop residues results in the release of harmful chemicals to the atmosphere such as polychlorinated dibenzo-p-dioxins, polycyclic aromatic hydrocarbons, and polychlorinated dibenzofurans, which are referred to as dioxins. These air pollutants have toxicological properties and are potential carcinogens. Air pollution can result in the death of animals, as the high levels of CO2 and CO in the animals’ blood can convert the normal hemoglobin into deadly hemoglobin. There can also be a potential decrease in the yield of the milk-producing animals [53].
Moreover, the burning of crop residues affects not only soil fertility but also farmers’ income, because the conversion of forest areas to agricultural land has resulted in a significant decline in SOM content [58]. On steep slopes in the highlands, this can easily result in soil erosion and a decline of soil fertility. According to Boonlertnirun and Jompuk [59], nitrogen and sulfur most frequently limit the maize yield and are emitted to the atmosphere in fires. Heard and Hay [60] found that about 98–100% of the nitrogen, 24% of the phosphorus, 35% of the potassium, and 75% of the sulfur were lost through burning in Manitoba, Western Canada. Moreover, Gupta et al. [61] estimated that the burning of straw increases soil temperature up to 33.8–42.2 °C (1-cm depth). However, for maize production in the highlands, an alternative to residue burning is needed, and this takes the form of the sequestration of carbon from plant biomass into SOM. To enhance the nutrient balance of maize-planting areas, implementing crop rotation (e.g., mung bean, soybean, red bean, pumpkin) under different types of fertilizers and incorporating these crop residues in the soil can help to develop effective policies to address nutrient-related environmental problems and achieve a sustainable maize stover harvest [62].
4.3. Chemical Compositions of PM2.5 Emissions from Agricultural Burning
In terms of air-quality assessment, an important parameter is PM, especially PM2.5 that causes the negative effects on human health (such as impeded breathing, chronic asthma and lung cancer), visibility, radiation [63,64,65,66] and climate change [67]. Our finding revealed that OC was the dominant chemical composition in PM2.5 mass, which is in line with Turn et al. [34] who reported that about 50% of PM emission from crop residue combustion is carbonaceous aerosol. Moreover, our findings are in line with several studies, which reported that Cl−, NH4+, K+, EC, SO42− and NO3− were derived from the combustion process, while K+ and Cl− were the dominant pollution from agricultural residue burning [40,68,69,70,71]. Long et al. [72] reported a 34% increase in ambient PM2.5 concentrations from agricultural burning in the North China Plain. Cheng et al. [73] attributed 37% of PM2.5 mass, 70% of OC, and 61% EC to crop burning in southern China. Elevated K+ and Cl− abundances in PM have been reported for biomass burning in China [74] and in Korea [75]. In Thailand, Chantara et al. [38] determined the seasonal variation of atmospheric ion species and gases in the suburban area of Chiang Mai Province. Their results show that the first component had a high loading of SO42−, NH4+ and K+, which was probably generated from fuel combustion, agricultural activity and biomass burning, respectively. In addition, Khamkaew et al. [19], Vinitketkumnuen et al. [76] and Chantara et al. [77] found the major elements in the PM2.5 from biomass burning in Chiang Mai Province were K+, Mg, Al and Fe.
Moreover, PM2.5 contain various toxic heavy metal elements, among which Pb represented the highest concentration of heavy metals in PM2.5 from agricultural burning compared with the other elements in this area. Previous studies have demonstrated that Pb is a carcinogenic heavy metal that can be enriched in the human body via inhalation, dermal absorption and ingestion [78,79,80]. It should be noted that an integrated farming system generated the lowest concentrations of heavy metals in PM2.5 due to the lower amount of maize residue burning than other land-use patterns.
4.4. Comparisons of GHG Emissions among Grain Maize, Seed Maize and Integrated Farming
Comparisons of GHG emissions among the three land-use patterns—grain maize, seed maize, and integrated farming—pointed to the fact that farmers who grew seed maize were responsible for the largest amount of GHG emissions, followed by those who grew grain maize and those who practiced integrated farming, respectively. It was also found that most of the farmers who did not grow grain maize or seed maize but grew other plants such as strawberry, Japanese pumpkin and cabbage did not burn any crop residues. In addition, field data showed that there were several reasons why the farmers burnt their crop residues. First, residues of grain maize and seed maize are hardly degradable and lead to pests and weeds. Secondly, the residues are a hindrance to farming activities such as tillage, pesticide, herbicide and fertilizer applications, and planting. Thirdly, burning is a cost- and time-saving method. Fourthly, it is difficult to remove grain maize and seed maize residues from the fields as trucks cannot get into them. Finally, some farmers understand that burning is allowed before or after the period announced by the government.
4.5. Proposed Policies
Proactive and reactive measures should be taken in a well-organized and systematic fashion and should engage all related parties. The following plausible solutions for particulate pollution and forest-fire control are suggested: (1) Urgent measures: state agencies must enhance their collaboration and work to officially announce severe particulate pollution warnings in specific areas to urge the government to allocate budgets to help alleviate hardship among those affected. A royal rainmaking station should be established in the northern part of Thailand to cope with the particulate pollution issue. In addition, there should be communication with countries in the Greater Mekong Subregion (GMS)—including Myanmar, Vietnam, and Laos—in order to improve how these countries prevent and cope with open biomass burning. (2) Long-term measures: the concept of “wet forest” that was initiated by King Bhumibol Adulyadej, or King Rama IX, should be incorporated into the proactive and reactive measures for particulate pollution and forest fire using the following methods: first, water from the waterways should be used and various plants should be planted along the waterways. Second, a forest fire prevention system should be built with a wet fire line using irrigation water and rain water. Third, fast-growing trees should be grown to cover a water channel to gradually increase the surrounding moisture and spread it to both sides of the channel, thus helping plants to grow and preventing forest fires, since fires normally thrive on drier land. Fourth, a check dam should be built to close off a water channel or small streams at various intervals to retain some of the water and sediment. The retained water will be absorbed into the soil and will increase moisture on both banks, thus making it a wet forest. Fifth, water should be pumped to the highest possible location and released in small amounts so that it is absorbed into the soil to grow “mountain forests” as wet forests. Sixth, two meters’ worth of banana plants should be planted in forests as they can retain water better than other plants can, which will reduce water loss.
More importantly, policy makers urgently need to include PM2.5 concentrations in Thailand’s air quality index (PM2.5 AQI) in order to provide the public with more comprehensive air-quality data, and implement the measures to control and reduce air pollution in the future.
5. Conclusions
The majority of farmers in the Mae Chaem basin burned residues of grain maize and seed maize during April and May and mostly in afternoon. These burning behaviors are in line with the supportive weather conditions for burning that reflect high values of temperature and wind speed, and less rainfall and relative humidity result in maize residues that are burned easily and quickly. The amount of GHG emissions from burning crop residues showed that grain maize planting generated emissions of CO2 > CO > PM10 > PM2.5> NMVOCs > CH4 > NOx > black carbon > SOx > N2O with average values of 9879.3, 253.0, 40.4, 39.1, 29.3, 17.6, 11.7, 4.9, 1.3, and 0.5 kg ha−1 year−1, respectively; while seed maize planting demonstrated about 23.94% higher emissions than maize planting, with values of 16,851.7, 656.1, 104.8, 101.5, 76.1, 45.7, 30.4, 12.7, 3.4, and 1.2 kg ha−1 year−1, respectively. Meanwhile, the integrated farming system generated GHG emissions, with average values of 6383.4, 163.5, 26.1, 25.3, 19.0, 11.4, 7.6, 3.2, 0.8, and 0.3 kg ha−1 year−1, respectively.
The integrated farming system recorded the lowest amount of chemical composition of PM2.5 emissions, followed by grain maize and seed maize, respectively. OC was detected as the dominant chemical composition in PM2.5 mass, followed by Cl−, NH4+, K+, EC, SO42−, and NO3−, respectively. The top 10 pollution levels of heavy metals in the PM2.5 mass were in the following order: Pb > K > Ti > Mn > V > Sr > S > Cd > As > Se.
This study strongly supports the implementation of the integrated farming system in Mae Chaem basin. More importantly, including PM2.5 concentrations to upgrade Thailand’s air-quality index (PM2.5 AQI) is an urgent need for policy makers.
Acknowledgments
This article was a part of the research grant nr. RDG6020014. Furthermore, the authors would like to thank the reviewers for their helpful comments to improve the manuscript.
Author Contributions
Noppol Arunrat collected and preformed data analysis, wrote and revised the manuscript. Nathsuda Pumijumnong collected and preformed data analysis, and provided advice. Sukanya Sereenonchai collaborated in discussing the manuscript and provided advice to this study.
Conflicts of Interest
The authors declare no conflict of interest.
References
- Yang, S.; He, H.; Lu, S.; Chen, D.; Zhu, J. Quantification of crop residue burning in the field and its influence on ambient air quality in Suqian, China. Atmos. Environ. 2008, 42, 1961–1969. [Google Scholar] [CrossRef]
- Wang, Q.; Shao, M.; Liua, Y.; William, K.; Paul, G.; Lia, X.; Lua, S. Impact of biomass burning on urban air quality estimated by organic tracers: Guangzhou and Beijing as cases. Atmos. Environ. 2007, 41, 8380–8390. [Google Scholar] [CrossRef]
- Cao, G.; Zhang, X.; Gong, S.; Zheng, F. Investigation on emission factors of particulate matter and gaseous pollutants from crop residue burning. J. Environ. Sci. 2008, 20, 50–55. [Google Scholar] [CrossRef]
- Zhang, H.; Hu, D.; Chen, J.; Ye, X.; Wang, S.X.; Hao, J.; Wang, L.; Zhang, R.; An, Z. Particle size distribution and polycyclic aromatic hydrocarbons emissions from agricultural crop residue burning. Environ. Sci. Technol. 2011, 45, 5477–5482. [Google Scholar] [CrossRef] [PubMed]
- Crutzen, P.J.; Andreae, M.O. Biomass burning in the tropics: Impact on atmospheric chemistry and biogeochemical cycles. Science 1990, 250, 1669–1678. [Google Scholar] [CrossRef] [PubMed]
- Andreae, M.O.; Artaxo, P.; Fischer, H.; Freitas, S.R.; Grégoire, J.M.; Hansel, A.; Hoor, P.; Kormann, R.; Krejci, R.; Lange, L.; et al. Transport of biomass burning smoke to the upper troposphere by deep convection in the equatorial region. Geophys. Res. Lett. 2001, 28, 951–954. [Google Scholar] [CrossRef]
- Chang, D.; Song, Y. Estimates of biomass burning emissions in tropical Asia based on satellite-derived data. Atmos. Chem. Phys. 2010, 10, 2335–2351. [Google Scholar] [CrossRef]
- Bond, T.C.; Streets, D.G.; Yarber, K.F.; Nelson, S.M.; Woo, J.H.; Klimont, Z. A technology-based global inventory of black and organic carbon emissions from combustion. J. Geophys. Res. Planets 2004, 109, D14203. [Google Scholar] [CrossRef]
- Garivait, S.; Bonnet, S.; Sorapipith, V.; Chaiyo, U. Estimation of air pollutant emission from open biomass burning in Thailand. In Proceedings of the Joint International Conference on Sustainable Energy and Environment, Phachuapkhirikhan, Thailand, 10–14 October 2004. [Google Scholar]
- Tipayarat, Y.; Sajor, E.E. State simplification, heterogeneous cause of vegetation fires and implication on local haze management: Case study in Thailand. Environ. Dev. Sustain. 2012, 14, 1047–1064. [Google Scholar] [CrossRef]
- World Health Organization (WHO). Air Quality Guidelines for Europe, 2nd ed.; Chapter 7.3 Particulate Matter; Regional Office for Europe: Copenhagen, Denmark, 2000. [Google Scholar]
- Dockery, D.W.; Stone, P.H. Cardiovascular risks from fine particulate air pollution. N. Engl. J. Med. 2007, 356, 511–513. [Google Scholar] [CrossRef] [PubMed]
- Anderson, K.R.; Avol, E.L.; Edwards, S.A.; Shamoo, D.A.; Peng, R.C.; Linn, W.S.; Hackney, J.D. Controlled exposure of volunteers to respirable carbon and sulfuric acid aerosols. J. Air Waste Manag. Assoc. 1992, 42, 770–776. [Google Scholar] [CrossRef]
- Office of Agricultural Economics (OAE). Agricultural Statistic in Thailand, 2014; OAE: Bangkok, Thailand, 2015. [Google Scholar]
- United Nations Development Programme (UNDP). Innovation: Thailand Maize. 2015. Available online: http://www.th.undp.org (accessed on 8 January 2018).
- Mittal, S.K.; Susheel, K.; Singh, N.; Agarwal, R.; Awasthi, A.; Gupta, P.K. Ambient air quality during wheat and rice crop stubble burning episodes in Patiala. Atmos. Environ. 2009, 43, 238–244. [Google Scholar] [CrossRef]
- Oanh, N.T.K.; Leelasakultum, K. Analysis of meteorology and emission in haze episode prevalence over mountain-bounded region for early warning. Sci. Total Environ. 2011, 409, 2261–2271. [Google Scholar] [CrossRef] [PubMed]
- Jain, N.; Bhatia, A.; Pathak, H. Emission of Air Pollutants from Crop Residue Burning in India. Aerosol Air Qual. Res. 2014, 14, 422–430. [Google Scholar] [CrossRef]
- Khamkaew, C.; Chantara, S.; Wiriya, W. Atmospheric PM2.5 and its elemental composition from near source and receptor sites during open burning season in Chiang Mai, Thailand. Int. J. Environ. Sci. Dev. 2016, 7, 436–440. [Google Scholar] [CrossRef]
- Greenpeace. Greenpeace’s City Rankings for PM2.5 in Thailand. 2017. Available online: https://greenpeace.or.th/s/right-to-clean-air/PM2.5CityRankingsREV.pdf (accessed on 28 March 2018).
- Walker, A. Forests and Water in Northern Thailand. Resource Management in Asia-Pacific Working Paper No. 37. Resource Management in Asia-Pacific Program; The Australian National University: Canberra, Australia, 2002. [Google Scholar]
- Kuraji, K.; Punyatrong, K.; Suzuki, M. Altitudinal increase in rainfall in the Mae Chaem watershed, Thailand. J. Meteorol. Soc. Jpn. 2001, 79, 353–363. [Google Scholar] [CrossRef]
- Thomas, D.; Preechapanya, P.; Saipothong, P. Landscape agroforestry in upper tributary watersheds of northern Thailand. J. Agric. 2002, 18, S255–S302. [Google Scholar]
- Walker, A. Agricultural transformation and the politics of hydrology in northern Thailand. Dev. Chang. 2003, 34, 941–964. [Google Scholar] [CrossRef]
- Praneetvatakul, S.; Janekarnkij, P.; Potchanasin, C.; Prayoonwong, K. Assessing the sustainability of agriculture a case of Mae Chaem catchment, northern Thailand. Environ. Int. 2001, 27, 103–109. [Google Scholar] [CrossRef]
- Pinthong, J.; Thomsen, A.; Rasmussen, P.; Iversen, B.V. Studies of Soil and Water Dynamics. Approach and Methodology; Working Paper No. 2; Research Center on Forest and People in Thailand: Tjele, Denmark, 2000. [Google Scholar]
- Royal Forest Department. General Information: The National Forest Management Center 26, Mae Chaem Forest 2, Chiang Mai, Forest Resource Management Bureau 1 (Chiang Mai) and The National Forest Management Bureau; Royal Forest Department, Ministry of Natural Resources and Environment: Bangkok, Thailand, 2016. (In Thai)
- Crutzen, P.J.; Heidt, L.E.; Krasnec, J.P.; Pollock, W.H.; Seiler, W. Biomass burning as a source of the atmospheric gases CO, H2, N2O, NO, CH3C1 and COS. Nature 1979, 282, 253–256. [Google Scholar] [CrossRef]
- Intergovernmental Panel on Climate Change (IPCC). Revised 1996 IPCC Guidelines for National Greenhouse Gas Inventories; Reference Manual; IPCC Guidelines for National Greenhouse Gas Inventories: Geneva, Switzerland, 1996; Volume 3. [Google Scholar]
- Li, X.; Wang, S.; Duan, L.; Hao, J.; Li, C.; Chen, Y.; Yang, L. Particulate and Trace Gas Emissions from Open Burning of Wheat Straw and Corn Stover in China. Environ. Sci. Technol. 2007, 41, 6052–6058. [Google Scholar] [CrossRef] [PubMed]
- Andreae, M.O.; Merlet, P. Emission of trace gases and aerosols from biomass burning. Glob. Biogeochem. Cycles 2001, 15, 955–966. [Google Scholar] [CrossRef]
- Jenkins, B.M.; Jones, D.; Turn, S.Q.; Williams, R.B. Particle concentrations, gas-particle partitioning, and species intercorrelations for Polycyclic Aromatic Hydrocarbons (PAH) emitted during biomass burning. Atmos. Environ. 1996, 30, 3825–3835. [Google Scholar] [CrossRef]
- Lee, D.S.; Atkins, D.H.F. Atmospheric ammonia emission from agricultural waste combustion. Geophys. Res. Lett. 1994, 21, 281–284. [Google Scholar] [CrossRef]
- Turn, S.Q.; Jenkins, B.M.; Chow, J.C.; Pritchett, L.C.; Campbell, D.; Cahill, T.; Whalen, S.A. Elemental characterization of particulate matter emitted from biomass burning: Wind tunnel derived source profiles for herbaceous and wood fuels. J. Geophys. Res. 1997, 102, 3683–3699. [Google Scholar] [CrossRef]
- Indiana Department of Natural Resources. Prescribed Burning: Habitat Management Fact Sheet; Indiana Division of Fish and Wildlife: Indianapolis, IN, USA, 2005. [Google Scholar]
- Pechony, O.; Shindell, D.T. Fire parameterization on a global scale. J. Geophys. Res. 2009, 114. [Google Scholar] [CrossRef]
- Bistinas, I.; Harrison, S.P.; Prentice, I.C.; Pereira, J.M.C. Causal relationships versus emergent patterns in the global controls of fire frequency. Biogeosciences 2014, 11, 5087–5101. [Google Scholar] [CrossRef]
- Chantara, S.; Sillapapiromsuk, S.; Wiriya, W. Atmospheric pollutants in Chiang Mai (Thailand) over a five-year period (2005–2009), their possible sources and relation to air mass movement. Atmos. Environ. 2012, 60, 88–98. [Google Scholar] [CrossRef]
- Pollution Control Department (PCD). Manual Report: Air Quality Data Monitoring. Pollution Control Department, 2015. Available online: http://aqmthai.com/ (accessed on 13 April 2016).
- Sillapapiromsuk, S.; Chantara, S.; Tengjaroenkul, U.; Prasitwattanaseree, S.; Prapamontol, T. Determination of PM10 and its ion composition emitted from biomass burning in the chamber for estimation of open burning emissions. Chemosphere 2013, 93, 1912–1919. [Google Scholar] [CrossRef] [PubMed]
- Kutcher, H.R.; Malhi, S.S. Residue burning and tillage effects on diseases and yield of barley (Hordeum vulgare) and canola (Brassica napus). Soil Tillage Res. 2010, 109, 153–160. [Google Scholar] [CrossRef]
- Gonçalves, C.; Evtyugina, M.; Alves, C.; Monteiro, C.; Pio, C.; Tomé, M. Organic particulate emissions from field burning of garden and agriculture residues. Atmos. Res. 2011, 101, 666–680. [Google Scholar] [CrossRef]
- Meesubkwang, S. Chiang Mai’s Polluted Air: Chiang Mai’s Polluted Air. 2007. Available online: http://www.chiangmai-mail.com/212/news.shtml (accessed on 8 January 2018).
- Kludze, H.; Deen, B.; Weersink, A.; Van Acker, R.; Janovicek, K.; De Laporte, A.; McDonald, I. Estimating sustainable crop residue removal rates and costs based on soil organic matter dynamics and rotational complexity. Biomass Bioenergy 2013, 56, 607–618. [Google Scholar] [CrossRef]
- Estrellan, C.R.; Iino, F. Toxic emissions from open burning. Chemosphere 2010, 80, 193–207. [Google Scholar] [CrossRef] [PubMed]
- Viana, M.; Reche, C.; Amato, F.; Alastuey, A.; Querol, X.; Moreno, T.; Lucarelli, F.; Nava, S.; Calzolai, G.; Chiari, M.; et al. Evidence of biomass burning aerosols in the Barcelona urban environment during winter time. Atmos. Environ. 2013, 72, 81–88. [Google Scholar] [CrossRef]
- Agarwal, R.; Awasthi, A.; Singh, N.; Gupta, P.K.; Mittal, S.K. Effects of exposure to rice-crop residue burning smoke on pulmonary functions and Oxygen Saturation level of human beings in Patiala (India). Sci. Total Environ. 2012, 429, 161–166. [Google Scholar] [CrossRef] [PubMed]
- Granged, A.J.P.; Zavala, L.M.; Jordán, A.; Bárcenas-Moreno, G. Post-fire evolution of soil properties and vegetation cover in a Mediterranean heathland after experimental burning: A 3-year study. Geoderma 2011, 164, 85–94. [Google Scholar] [CrossRef]
- Haider, M.Z. Determinants of rice residue burning in the field. J. Environ. Manag. 2013, 128, 15–21. [Google Scholar] [CrossRef] [PubMed]
- Johnson, J.M.-F.; Franzluebbers, A.J.; Weyers, S.L.; Reicosky, D.C. Agricultural opportunities to mitigate greenhouse gas emissions. Environ. Pollut. 2007, 150, 107–124. [Google Scholar] [CrossRef] [PubMed]
- Vadrevu, K.P.; Giglio, L.; Justice, C. Satellite based analysis of fire-carbon monoxide relationships from forest and agricultural residue burning (2003–2011). Atmos. Environ. 2013, 64, 179–191. [Google Scholar] [CrossRef]
- Gupta, P.K.; Sahai, S. Residues open burning in rice-wheat cropping system in India: An agenda for conservation of environment and agricultural conservation. In Conservation Agriculture: Status and Prospects; Abrol, I.P., Gupta, R.K., Malik, R.K., Eds.; Centre for Advancement of Sustainable Agriculture, National Agriculture Science Centre: New Delhi, India, 2005; pp. 50–54. [Google Scholar]
- Kumar, P.; Kumar, S.; Joshi, L. Chapter 2: The Extent and Management of Crop Stubble. In Knowledge Systems of Societies for Adaptation and Mitigation of Impacts of Climate Change. Environmental Science; Nautiyal, S., Rao, K.S., Kaechele, H., Raju, K.V., Schaldach, R., Eds.; Springer: Berlin/Heidelberg, Germany, 2015. [Google Scholar]
- Singh, R.P.; Dhaliwal, H.S.; Sidhu, H.S.; Manpreet-Singh, Y.S.; Blackwell, J. Economic assessment of the Happy Seeder for Rice-Wheat Systems in Punjab, India. In Proceedings of the AARES 52nd Annual Conference, Canberra, Australia, 5–8 February 2008. [Google Scholar]
- Gadde, B.; Bonnet, S.; Menke, C.; Garivait, S. Air pollutant emissions from rice straw open field burning in India, Thailand and the Philippines. Environ. Pollut. 2009, 157, 1554–1558. [Google Scholar] [CrossRef] [PubMed]
- Gullett, B.; Touati, A. PCDD/F emissions from burning wheat and rice field residue. Atmos. Environ. 2003, 37, 4893–4899. [Google Scholar] [CrossRef]
- Lin, L.-F.; Lee, W.-J.; Li, H.-W.; Wang, M.-S.; Chang-Chien, G.-P. Characterization and inventory of PCDD/F emissions from coal-fired power plants and other sources in Taiwan. Chemosphere 2007, 68, 1642–1649. [Google Scholar] [CrossRef] [PubMed]
- Paustian, K.; Six, J.; Elliott, E.T.; Hunt, H.W. Management options for reducing CO2 Emissions from agricultural soils. Biogeochemistry 2000, 48, 147–163. [Google Scholar] [CrossRef]
- Boonlertnirun, K.; Jompuk, C. Nitrogen use efficiency and low nitrogen tolerance in waxy corn. Khon Kaen Agric. J. 2011, 39, 231–240. [Google Scholar]
- Heard, J.; Hay, D. Typical nutrient content, uptake pattern and Carbon: Nitrogen ratios of prairie crops. In Proceedings of the Manitoba Agronomists Conference, Winnipeg, MB, Canada, 12–13 December 2006. [Google Scholar]
- Gupta, P.K.; Sahai, S.; Singh, N.; Dixit, C.K.; Singh, D.P.; Sharma, C.; Tiwari, M.K.; Gupta, R.K.; Garg, S.C. Residue burning in rice-wheat cropping system: Causes and implications. Curr. Sci. 2004, 87, 1713–1717. [Google Scholar]
- Khanal, S.; Anex, R.P.; Gelder, B.K.; Wolter, C. Nitrogen balance in Iowa and the implications of corn-stover harvesting. Agric. Ecosyst. Environ. 2014, 183, 21–30. [Google Scholar] [CrossRef]
- Tzanis, C.; Tsivola, E.; Efstathiou, M.; Varotsos, C. Forest fires pollution impact on the solar UV irradiance at the ground. Fresenius Environ. Bull. 2009, 18, 2151–2158. [Google Scholar]
- Chow, J.C.; Watson, J.G. Air quality management of multiple pollutants and multiple effects. Air Qual. Clim. Chang. 2011, 45, 26–32. [Google Scholar]
- Fiore, A.M.; Naik, V.; Leibensperger, E.M. Air quality and climate connections. J. Air Waste Manag. Assoc. 2015, 65, 645–685. [Google Scholar] [CrossRef] [PubMed]
- Yao, H.; Song, Y.; Liu, M.X.; Archer-Nicholls, S.; Lowe, D.; McFiggans, G.; Xu, T.T.; Du, P.; Li, J.F.; Wu, Y.S.; et al. Direct radiative effect of carbonaceous aerosols from crop residue burning during the summer harvest season in East China. Atmos. Chem. Phys. 2017, 17, 5205–5219. [Google Scholar] [CrossRef]
- Haywood, J.; Boucher, O. Estimates of the direct and indirect radiative forcing due to tropospheric aerosols: A review. Rev. Geophys. 2000, 38, 513–543. [Google Scholar] [CrossRef]
- Zhang, M.; Wang, S.; Wu, F.; Yuan, X.; Zhang, Y. Chemical compositions of wet precipitation and anthropogenic influences at a developing urban site in southeastern China. Atmos. Res. 2007, 84, 311–322. [Google Scholar] [CrossRef]
- Al-Khashman, O.A. Chemical characteristics of rainwater collected at a western site of Jordan. Atmos. Res. 2009, 91, 53–61. [Google Scholar] [CrossRef]
- Huang, D.; Xu, Y.; Peng, P.; Zhang, H.; Lan, J. Chemical composition and seasonal variation of acid deposition in Guangzhou, South China: Comparison with precipitation in other major Chinese cities. Environ. Pollut. 2009, 157, 35–41. [Google Scholar] [CrossRef] [PubMed]
- Hong, L.; Liu, G.; Zhou, L.; Li, J.; Xu, H.; Wu, D. Emission of organic carbon, elemental carbon and water-soluble ions from crop straw burning under flaming and smoldering conditions. Particuology 2017, 31, 181–190. [Google Scholar] [CrossRef]
- Long, X.; Tie, X.X.; Cao, J.J.; Huang, R.J.; Feng, T.; Li, N.; Zhao, S.Y.; Tian, J.; Li, G.H.; Zhang, Q. Impact of crop field burning and mountains on heavy haze in the North China Plain: A case study. Atmos. Chem. Phys. 2016, 16, 9675–9691. [Google Scholar] [CrossRef]
- Cheng, Z.; Wang, S.X.; Fu, X.; Watson, J.G.; Jiang, J.K.; Fu, Q.Y.; Chen, C.H.; Xu, B.Y.; Yu, J.S.; Chow, J.C. Impact of biomass burning on haze pollution in the Yangtze River Delta, China: A case study of summer in 2011. Atmos. Chem. Phys. 2014, 14, 4573–4585. [Google Scholar] [CrossRef] [Green Version]
- Shen, Z.X.; Cao, J.J.; Arimoto, R.; Han, Z.W.; Zhang, R.J.; Han, Y.M.; Liu, S.X.; Okuda, T.; Nakao, S.; Tanaka, S. Ionic composition of TSP and PM2.5 during dust storms and air pollution episodes at Xi’an, China. Atmos. Environ. 2009, 43, 2911–2918. [Google Scholar] [CrossRef]
- Park, S.S.; Hong, S.B.; Jung, Y.G.; Lee, J.H. Measurements of PM10 aerosol and gas-phase nitrous acid during fall season in a semi-urban atmosphere. Atmos. Environ. 2004, 38, 293–304. [Google Scholar] [CrossRef]
- Vinitketkumnuen, U.; Kalayanamitra, K.; Chewonaria, T.; Kamens, R. Particulate matter, PM10 & PM2.5 levels and airborne mutagenicity in Chiang Mai, Thailand. Mutat. Res. 2002, 519, 121–131. [Google Scholar] [PubMed]
- Chantara, S.; Wangkarn, S.; Tengjaroenkul, U.; Sangchang, W.; Rayanakorn, M. Chemical analysis of airborne particulates for air pollutants in Chiang Mai and Lumphun Provinces, Thailand. Chiang Mai. J. Sci. 2009, 36, 123–135. [Google Scholar]
- Ferreira-Baptista, L.; De Miguel, E. Geochemistry and risk assessment of street dust in Luanda, Angola: A tropical urban environment. Atmos. Environ. 2005, 38, 4501–4512. [Google Scholar] [CrossRef] [Green Version]
- Xue, M.; Yang, Y.; Ruan, J.; Xu, Z. Assessment of noise and heavy metals (Cr, Cu, Cd, Pb) in the ambience of the production line for recycling waste printed circuit boards. Environ. Sci. Technol. 2012, 46, 494–499. [Google Scholar] [CrossRef] [PubMed]
- Cheng, X.; Huang, Y.; Long, Z.; Ni, S.; Shi, Z.; Zhang, C. Characteristics, sources and health risk assessment of trace metals in PM10 in Panzhihua, China. Bull. Environ. Contam. Toxicol. 2016, 98, 76–83. [Google Scholar] [CrossRef] [PubMed]
Figure 1.
Study area.
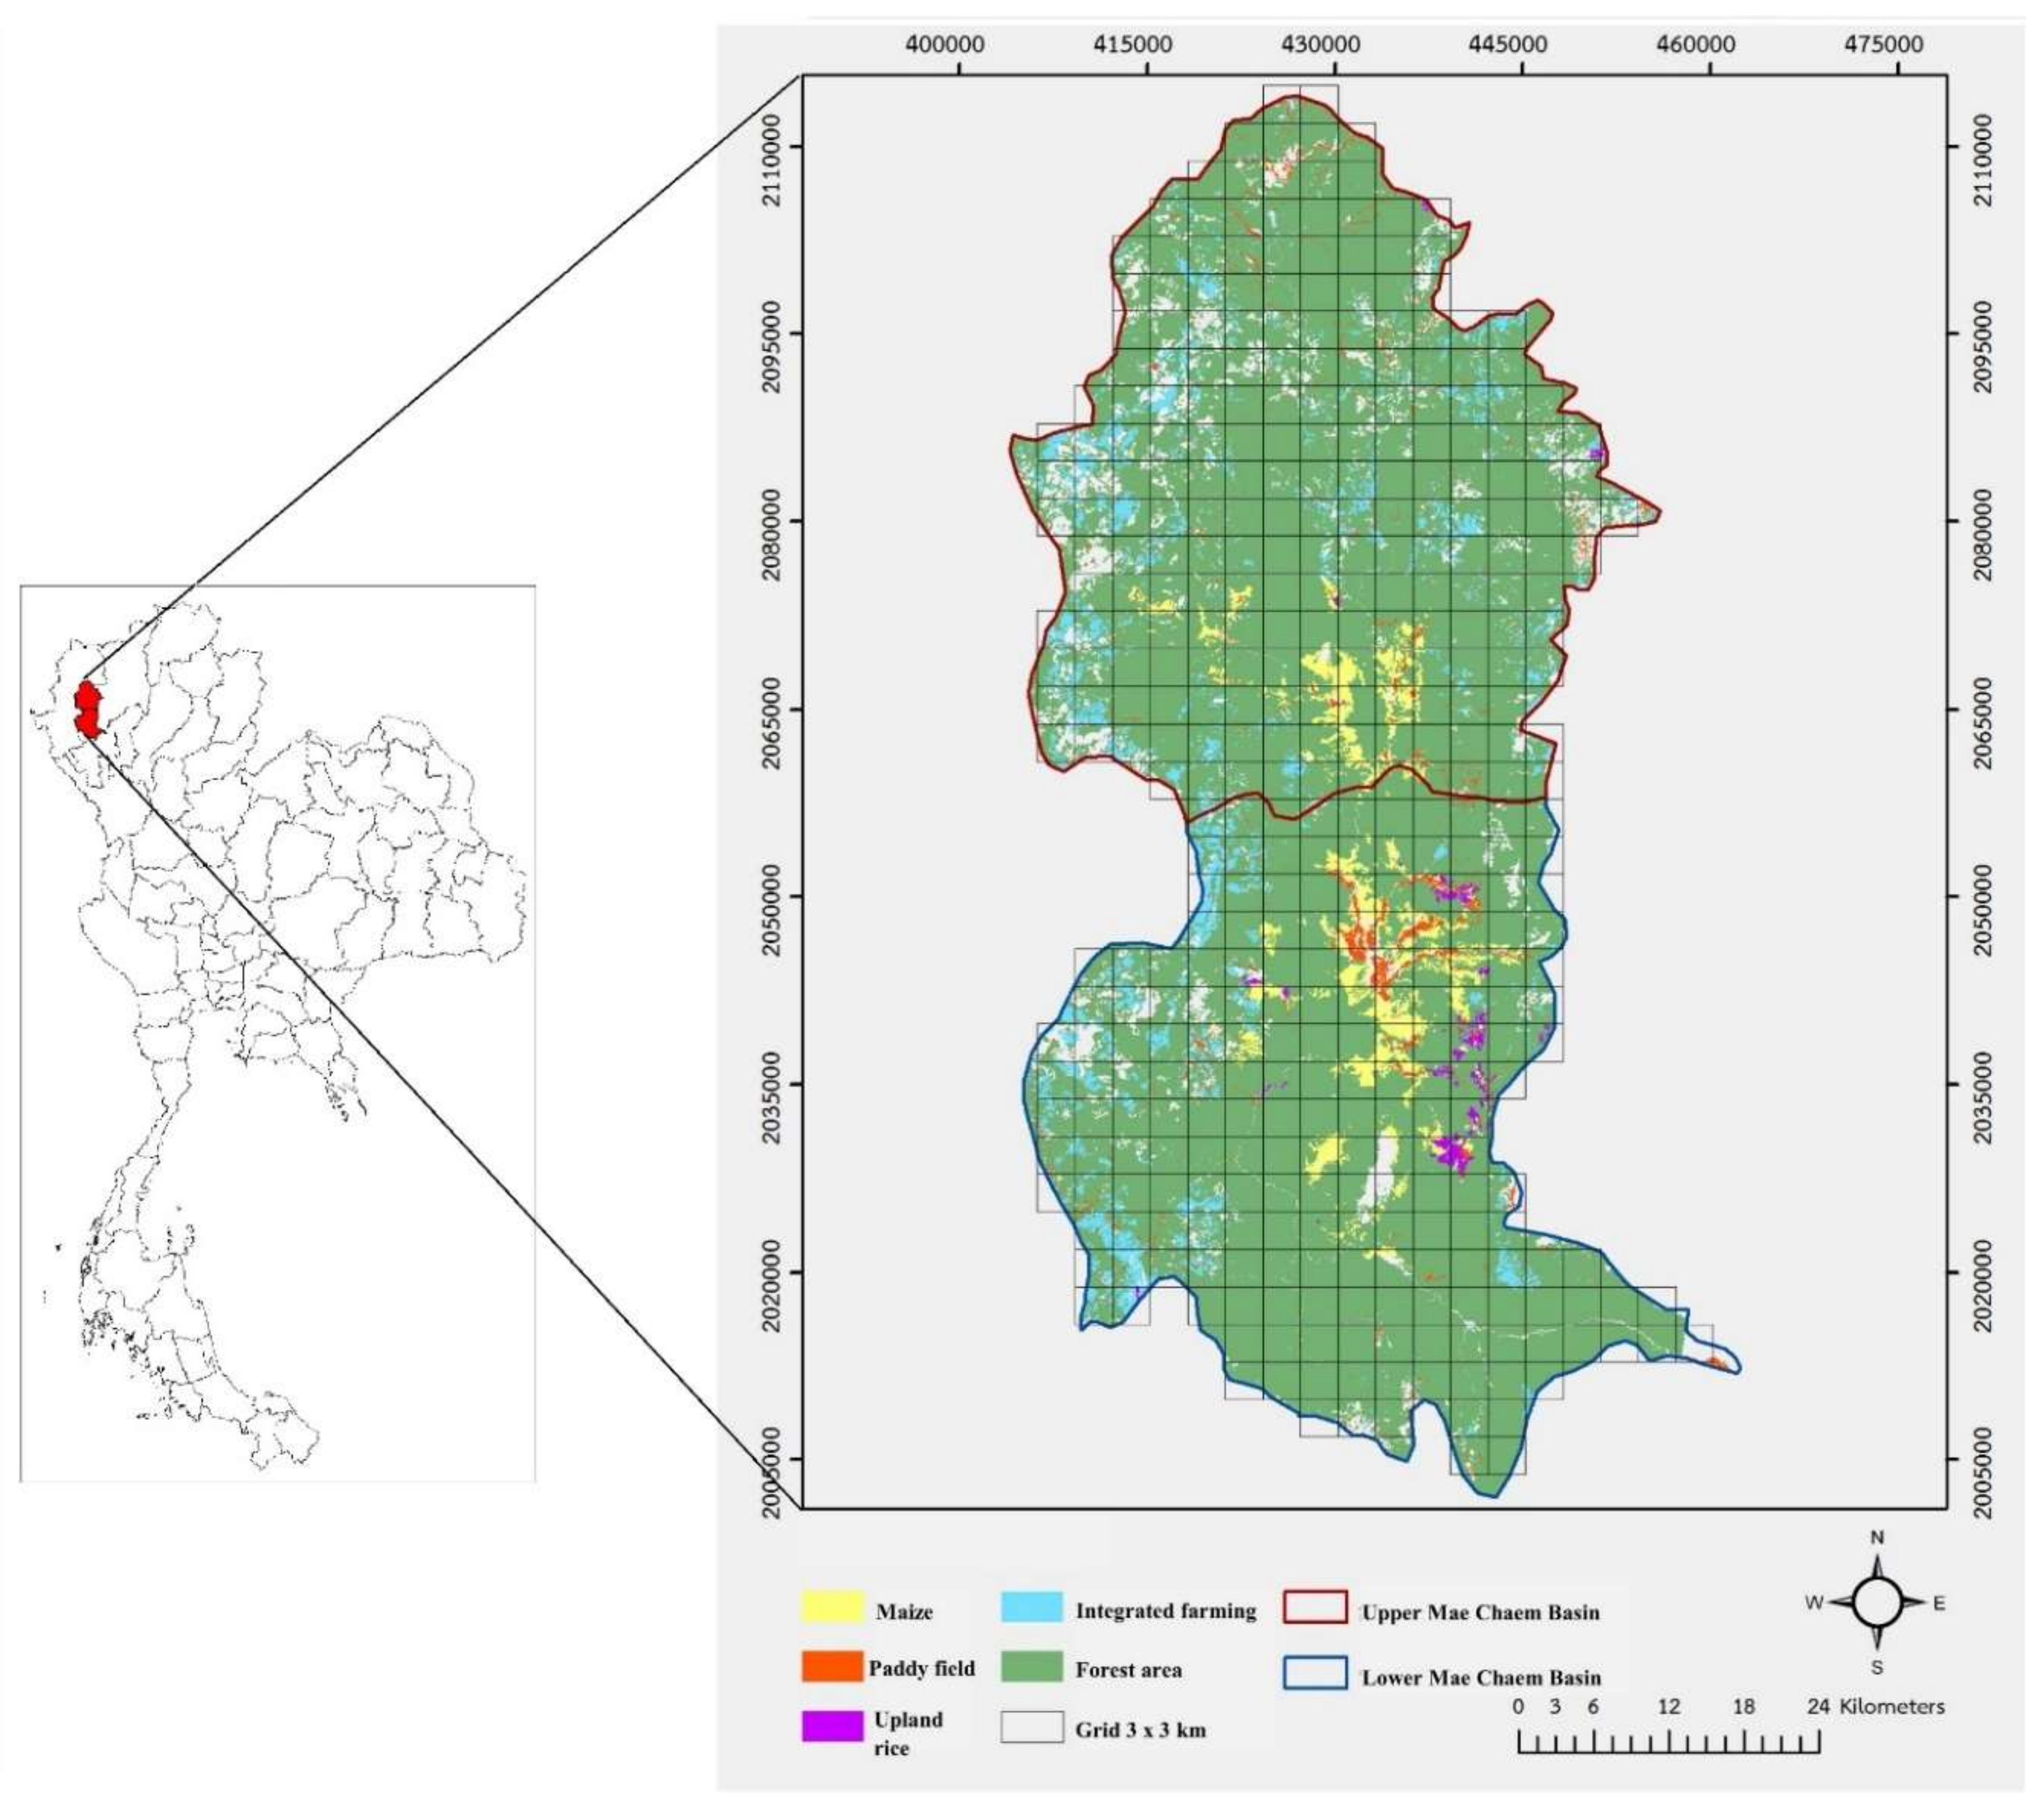
Figure 2.
Temperature, relative humidity, rainfall and wind speed at Chiang Mai Province during the period 2012–2017.
Figure 2.
Temperature, relative humidity, rainfall and wind speed at Chiang Mai Province during the period 2012–2017.

Figure 3.
Burning seasons of grain maize, seed maize and integrated farming system.

Figure 4.
Method of removing residues from the field.

Figure 5.
Method of removing residues from the field of each sub-district: (A) grain maize and seed maize, (B) integrated farming system.
Figure 5.
Method of removing residues from the field of each sub-district: (A) grain maize and seed maize, (B) integrated farming system.

Figure 6.
Times of the day for burning crop residues.
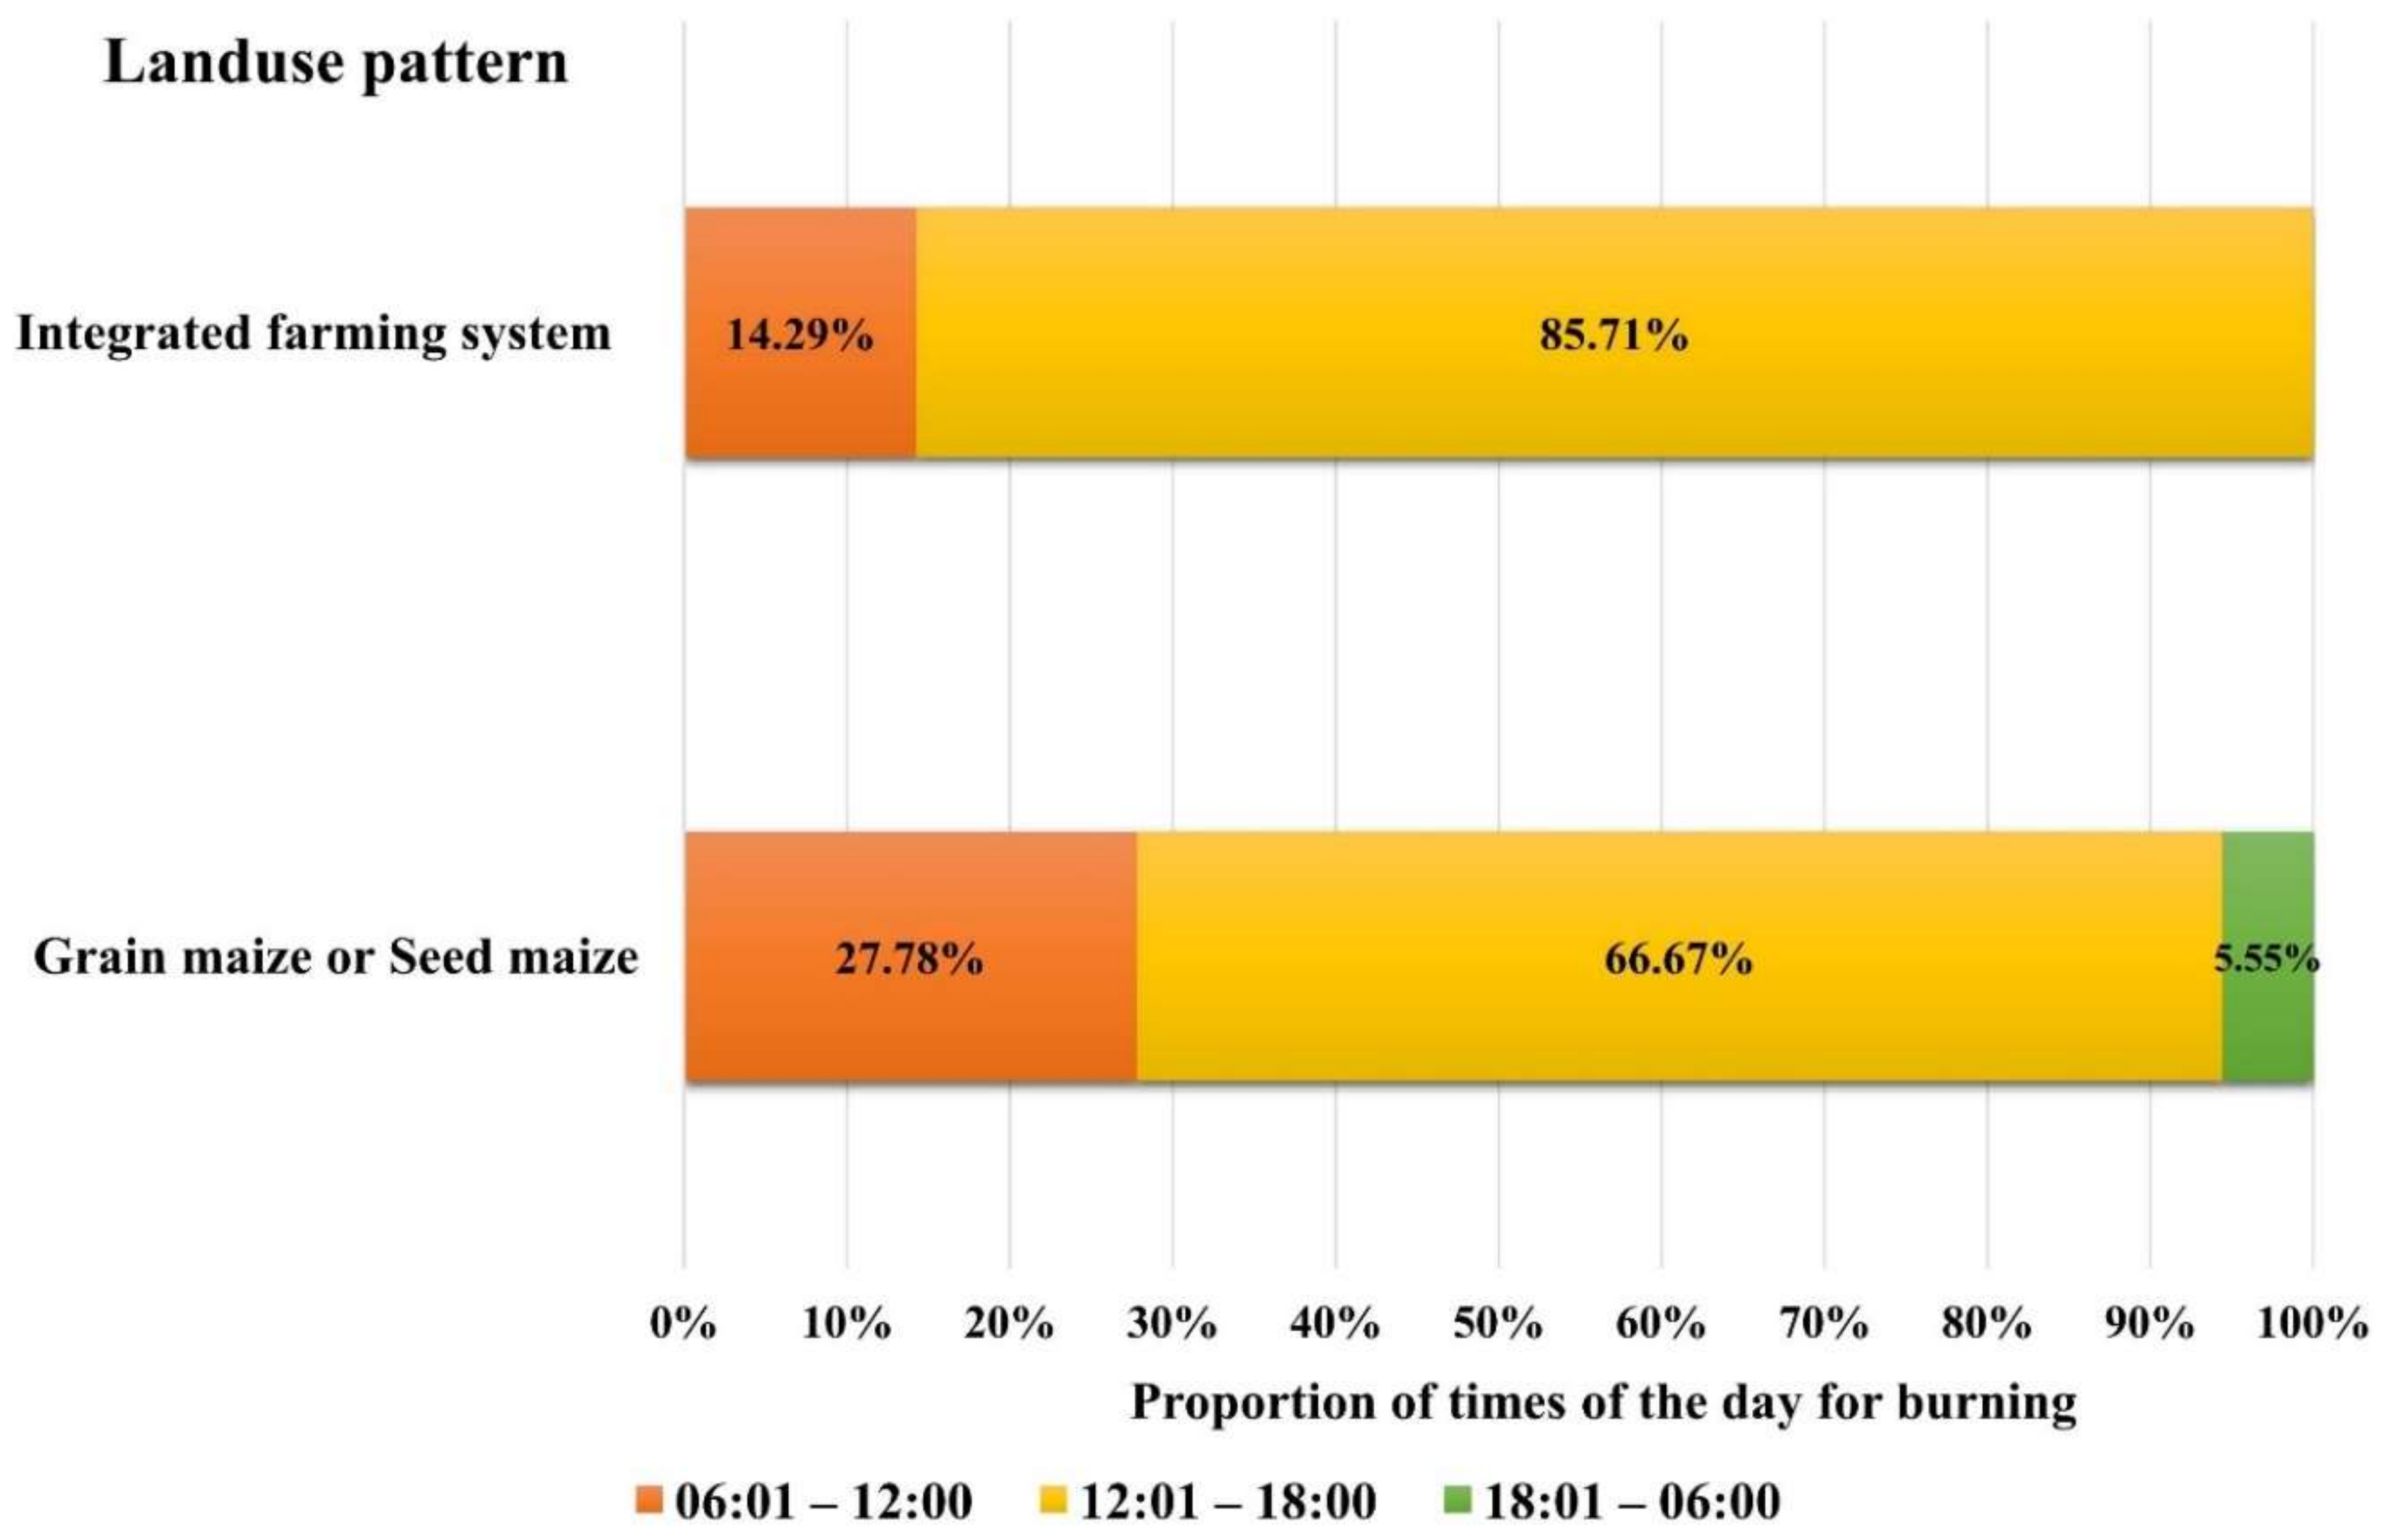
Figure 7.
Times of the day for burning crop residues of each sub-district: (A) grain maize and seed maize, (B) integrated farming system.
Figure 7.
Times of the day for burning crop residues of each sub-district: (A) grain maize and seed maize, (B) integrated farming system.

Table 1.
Summary of emission factors (EFs) specific to grain maize and maize seed open burning (Tier 2).
Table 1.
Summary of emission factors (EFs) specific to grain maize and maize seed open burning (Tier 2).
| Name of Pollutant | Unit | EF (Open Burning) | Source |
|---|---|---|---|
| CO2 | g kg−1dm | 1515.00 | Andrea and Merlet [31] |
| CO | g kg−1dm | 38.80 | Jenkins et al. [32] |
| CH4 | g kg−1dm | 2.70 | Andrea and Merlet [31] |
| N2O | g kg−1dm | 0.07 | Andrea and Merlet [31] |
| NH3 | g kg−1dm | 2.40 | Lee and Atkins [33] |
| NOx | g kg−1dm | 1.80 | Jenkins et al. [32] |
| Non-methane volatile organic compounds (NMVOCs) | g kg−1dm | 4.50 | Jenkins et al. [32] |
| SOx | g kg−1dm | 0.20 | Jenkins et al. [32] |
| Fine particulate matter (PM2.5) | g kg−1dm | 6.00 | Jenkins et al. [32] |
| PM10 | g kg−1dm | 6.20 | Jenkins et al. [32] |
| Black carbon (BC) | mg kg−1dm | 750.00 | Turn et al. [34] |
dm = Dry material.
Table 2.
Air-pollutant emissions from burning grain maize residues.
| Sub-District | Land-use Pattern and Varieties | CO2 | CO | CH4 | N2O | NOx | NMVOCs | SOx | PM2.5 | PM10 | BC |
|---|---|---|---|---|---|---|---|---|---|---|---|
| kg ha−1 year−1 | |||||||||||
| Kong Khaek | shallots, glutinous rice, grain maize, seed maize | 3607.1 | 92.4 | 6.4 | 0.2 | 4.3 | 10.7 | 0.5 | 14.3 | 14.8 | 1.8 |
| Tha Pha | pumpkin, grain maize | 5908.5 | 151.3 | 10.5 | 0.3 | 7.0 | 17.6 | 0.8 | 23.4 | 24.2 | 2.9 |
| Ban Thap | grain maize | 5681.3 | 145.5 | 10.1 | 0.3 | 6.8 | 16.9 | 0.8 | 22.5 | 23.3 | 2.8 |
| shallots, upland rice, grain maize | 12,120.0 | 310.4 | 21.6 | 0.6 | 14.4 | 36.0 | 1.6 | 48.0 | 49.6 | 6.0 | |
| Mae Daet | grain maize | 22,725.0 | 582.0 | 40.5 | 1.1 | 27.0 | 67.5 | 3.0 | 90.0 | 93.0 | 11.3 |
| Mae Na Chon | grain maize | 6775.3 | 173.5 | 12.1 | 0.3 | 8.1 | 20.1 | 0.9 | 26.8 | 27.8 | 3.4 |
| Mae Suek | grain maize | 12,338.1 | 316.0 | 22.0 | 0.6 | 14.7 | 36.6 | 1.6 | 48.9 | 50.5 | 6.1 |
| Average | 9879.3 | 253.0 | 17.6 | 0.5 | 11.7 | 29.3 | 1.3 | 39.1 | 40.4 | 4.9 | |
Table 3.
Air-pollutant emissions from burning seed maize residues.
| Sub-District | Land-use Pattern and Varieties | CO2 | CO | CH4 | N2O | NOx | NMVOCs | SOx | PM2.5 | PM10 | BC |
|---|---|---|---|---|---|---|---|---|---|---|---|
| kg ha−1 year−1 | |||||||||||
| Kong Khaek | shallots, pumpkin, seed maize | 9561.6 | 244.9 | 17.1 | 0.4 | 11.4 | 28.4 | 1.3 | 37.9 | 39.1 | 4.8 |
| Chang Khoeng | shallots, seed maize | 12,271.5 | 314.3 | 21.9 | 0.6 | 14.6 | 36.4 | 1.6 | 48.6 | 50.3 | 6.1 |
| Tha Pha | seed maize | 18,066.4 | 462.7 | 32.2 | 0.8 | 21.5 | 53.7 | 2.4 | 71.6 | 73.9 | 8.9 |
| Ban Thap | seed maize | 21,829.3 | 559.1 | 38.9 | 1.0 | 25.9 | 64.8 | 2.9 | 86.4 | 89.3 | 10.8 |
| Pang Hin Fon | seed maize | 20,009.4 | 2083.8 | 145.0 | 3.8 | 96.7 | 241.7 | 10.8 | 322.3 | 333.0 | 40.3 |
| Mae Na Chon | seed maize | 18,455.8 | 472.7 | 32.9 | 0.8 | 21.9 | 54.8 | 2.4 | 73.1 | 75.6 | 9.1 |
| Mae Suek | seed maize | 17,768.1 | 455.1 | 31.7 | 0.9 | 21.1 | 52.8 | 2.3 | 70.4 | 72.7 | 8.8 |
| Average | 16,851.7 | 656.1 | 45.7 | 1.2 | 30.4 | 76.1 | 3.4 | 101.5 | 104.8 | 12.7 | |
Table 4.
Air-pollutant emissions from burning crop residues under integrated farming system.
| Sub-District | Land-use Pattern and Varieties | CO2 | CO | CH4 | N2O | NOx | NMVOCs | SOx | PM2.5 | PM10 | BC |
|---|---|---|---|---|---|---|---|---|---|---|---|
| kg ha−1 year−1 | |||||||||||
| Kong Khaek | 888 grain maize | 1212.0 | 31.0 | 2.2 | 0.1 | 1.4 | 3.6 | 0.12 | 4.8 | 5.0 | 0.6 |
| 888 grain maize, shallots | - | - | - | - | - | - | - | - | - | - | |
| Chaem Luang | peanuts, red beans | 6817.5 | 174.6 | 12.1 | 0.3 | 8.1 | 20.3 | 0.9 | 27.0 | 27.9 | 3.4 |
| Japanese pumpkin, peanuts | 5113.1 | 130.9 | 9.1 | 0.3 | 6.1 | 15.2 | 0.7 | 20.3 | 20.9 | 2.6 | |
| Japanese pumpkin, Japanese pumpkin | 378.8 | 9.7 | 0.7 | 0.0 | 0.4 | 1.1 | 0.1 | 1.5 | 1.6 | 0.2 | |
| Japanese pumpkin, red beans | 5681.3 | 145.5 | 10.1 | 0.3 | 6.8 | 16.9 | 0.8 | 22.5 | 23.3 | 2.8 | |
| peanuts, peanuts | 511.3 | 13.1 | 0.9 | 0.0 | 0.6 | 1.5 | 0.1 | 2.0 | 2.1 | 0.3 | |
| red beans, avocado, pumpkin | - | - | - | - | - | - | - | - | - | - | |
| rice, red bean, avocado, coffee bean | - | - | - | - | - | - | - | - | - | - | |
| lettuce, potato, bog choy, parsley | - | - | - | - | - | - | - | - | - | - | |
| strawberry 329, strawberry 80 | - | - | - | - | - | - | - | - | - | - | |
| Chang Khoeng | pumpkin, pumpkin | - | - | - | - | - | - | - | - | - | - |
| Japanese pumpkin, peanuts | - | - | - | - | - | - | - | - | - | - | |
| Ban Chan | corn, peanuts | - | - | - | - | - | - | - | - | - | - |
| pear, avocado, plum, cape gooseberry | - | - | - | - | - | - | - | - | - | - | |
| kale, coriander, rice, Japanese pumpkin | - | - | - | - | - | - | - | - | - | - | |
| cabbage, lettuce, rice, Japanese pumpkin | - | - | - | - | - | - | - | - | - | - | |
| Japanese pumpkin, vegetable salad, cabbage, coriander, vocado, passion fruit, pear | - | - | - | - | - | - | - | - | - | - | |
| Nakhon Sawan 3 grain maize, red beans | 3933.2 | 100.8 | 7.0 | 0.2 | 4.7 | 11.7 | 0.5 | 15.6 | 16.1 | 1.9 | |
| 888 grain maize, shallots | 26,512.5 | 679.0 | 47.3 | 1.3 | 31.5 | 78.8 | 3.5 | 105.0 | 108.5 | 13.1 | |
| Ban Thap | strawberry 329, strawberry 80 | - | - | - | - | - | - | - | - | - | - |
| strawberry 80, strawberry 329, cabbage | - | - | - | - | - | - | - | - | - | - | |
| Mae Daet | strawberry 80, strawberry 329, napa cabbage | - | - | - | - | - | - | - | - | - | - |
| strawberry 80, strawberry 329 | - | - | - | - | - | - | - | - | - | - | |
| NK328 grain maize, NK62 grain maize, Japanese pumpkin | - | - | - | - | - | - | - | - | - | - | |
| potatoes, avocado, grape, cabbage | - | - | - | - | - | - | - | - | - | - | |
| Mae Suek | green grapes, seed maize | - | - | - | - | - | - | - | - | - | - |
| cabbage, potatoes, avocado, grapes | - | - | - | - | - | - | - | - | - | - | |
| NK grain maize, pioneer grain maize, 888 grain maize, napa cabbage, arabica coffee | 927.6 | 23.8 | 1.6 | 0.1 | 1.1 | 2.8 | 0.1 | 3.7 | 3.8 | 0.4 | |
| Average | 6383.4 | 163.5 | 11.4 | 0.3 | 7.6 | 19.0 | 0.8 | 25.3 | 26.1 | 3.2 | |
Table 5.
Chemical composition of PM2.5 emissions from agricultural residue burning.
| Chemical Species | Grain Maize (g ha−1 year−1) | Seed Maize (g ha−1 year−1) | Integrated Farming System (g ha−1 year−1) |
|---|---|---|---|
| OC | 152.59 | 395.61 | 98.48 |
| EC | 13.69 | 35.50 | 8.84 |
| Cl− | 105.64 | 273.88 | 68.18 |
| NO3− | 2.74 | 7.10 | 1.77 |
| SO42− | 8.61 | 22.32 | 5.56 |
| NH4+ | 46.95 | 121.73 | 30.30 |
| K+ | 39.13 | 101.44 | 25.25 |
| Al | 0.00016 | 0.00043 | 0.00011 |
| Ca | 0.00027 | 0.00070 | 0.00017 |
| Fe | 0.00005 | 0.00014 | 0.00004 |
| Si | 0.00021 | 0.00055 | 0.00014 |
| Mg | 0.00021 | 0.00055 | 0.00014 |
| K | 0.03169 | 0.08216 | 0.02045 |
| Na | 0.00078 | 0.00203 | 0.00051 |
| S | 0.00309 | 0.00801 | 0.00199 |
| Sc | 0.00027 | 0.00071 | 0.00018 |
| Ti | 0.00548 | 0.01420 | 0.00354 |
| V | 0.00391 | 0.01014 | 0.00253 |
| Mn | 0.00509 | 0.01319 | 0.00328 |
| Co | 0.00016 | 0.00041 | 0.00010 |
| Ni | 0.00133 | 0.00345 | 0.00086 |
| Zn | 0.00110 | 0.00284 | 0.00071 |
| Ga | 0.00012 | 0.00030 | 0.00008 |
| As | 0.00270 | 0.00700 | 0.00174 |
| Se | 0.00231 | 0.00598 | 0.00149 |
| Sr | 0.00333 | 0.00862 | 0.00215 |
| Zr | 0.00157 | 0.00406 | 0.00101 |
| Mo | 0.00027 | 0.00071 | 0.00018 |
| Ag | 0.00070 | 0.00183 | 0.00045 |
| Cd | 0.00274 | 0.00710 | 0.00177 |
| Sb | 0.00020 | 0.00051 | 0.00013 |
| Ba | 0.00102 | 0.00264 | 0.00066 |
| Tl | 0.00035 | 0.00091 | 0.00023 |
| Pb | 0.04304 | 0.11158 | 0.02778 |
© 2018 by the authors. Licensee MDPI, Basel, Switzerland. This article is an open access article distributed under the terms and conditions of the Creative Commons Attribution (CC BY) license (http://creativecommons.org/licenses/by/4.0/).
Share and Cite
MDPI and ACS Style
Arunrat, N.; Pumijumnong, N.; Sereenonchai, S. Air-Pollutant Emissions from Agricultural Burning in Mae Chaem Basin, Chiang Mai Province, Thailand. Atmosphere 2018, 9, 145. https://doi.org/10.3390/atmos9040145
AMA Style
Arunrat N, Pumijumnong N, Sereenonchai S. Air-Pollutant Emissions from Agricultural Burning in Mae Chaem Basin, Chiang Mai Province, Thailand. Atmosphere. 2018; 9(4):145. https://doi.org/10.3390/atmos9040145
Chicago/Turabian StyleArunrat, Noppol, Nathsuda Pumijumnong, and Sukanya Sereenonchai. 2018. "Air-Pollutant Emissions from Agricultural Burning in Mae Chaem Basin, Chiang Mai Province, Thailand" Atmosphere 9, no. 4: 145. https://doi.org/10.3390/atmos9040145
Note that from the first issue of 2016, this journal uses article numbers instead of page numbers. See further details here.