The Influence of Absolute Mass Loading of Secondary Organic Aerosols on Their Phase State

Department of Chemistry, University of Vermont, 82 University Place, Burlington, VT 05405, USA
*
Author to whom correspondence should be addressed.
Atmosphere 2018, 9(4), 131; https://doi.org/10.3390/atmos9040131
Submission received: 19 December 2017
/
Revised: 26 February 2018
/
Accepted: 27 March 2018
/
Published: 31 March 2018
(This article belongs to the Special Issue Formation and Transformation of Organic Aerosol)
Abstract
:Absolute secondary organic aerosol (SOA) mass loading (CSOA) is a key parameter in determining partitioning of semi- and intermediate volatility compounds to the particle phase. Its impact on the phase state of SOA, however, has remained largely unexplored. In this study, systematic laboratory chamber measurements were performed to elucidate the influence of CSOA, ranging from 0.2 to 160 µg m−3, on the phase state of SOA formed by ozonolysis of various precursors, including α-pinene, limonene, cis-3-hexenyl acetate (CHA) and cis-3-hexen-1-ol (HXL). A previously established method to estimate SOA bounce factor (BF, a surrogate for particle viscosity) was utilized to infer particle viscosity as a function of CSOA. Results show that under nominally identical conditions, the maximum BF decreases by approximately 30% at higher CSOA, suggesting a more liquid phase state. With the exception of HXL-SOA (which acted as the negative control), the phase state for all studied SOA precursors varied as a function of CSOA. Furthermore, the BF was found to be the maximum when SOA particle distributions reached a geometric mean particle diameter of 50–60 nm. Experimental results indicate that CSOA is an important parameter impacting the phase state of SOA, reinforcing recent findings that extrapolation of experiments not conducted at atmospherically relevant SOA levels may not yield results that are relevant to the natural environment.
1. Introduction
Organic aerosols (OA) are an important component of atmospheric particulate as they contribute 20–50% to the total fine particle mass at continental mid-latitudes, while in tropical forested areas they contribute up to 90% [1,2,3]. These OA are emitted from the earth’s surface by human and natural sources influencing both human health [4] and global climate [5,6]. Studies suggest that 90% of these OA are from secondary sources, termed secondary organic aerosol (SOA), due to oxidation of volatile compounds in the atmosphere [2,7].
There is growing evidence that SOA influences the earth’s energy budget both directly and indirectly either by scattering/absorbing solar radiation [8] or by acting as cloud condensation/ice nuclei [9,10]. SOA can also alter atmospheric gas and condensed phase species concentrations through multiphase reactions [11]. Despite the integral role of SOA in atmospheric processes, there remains a limited understanding of the chemical and physical changes induced in SOA as it is formed and subsequently aged. Understanding the physical state of SOA is especially important, as it can provide insight into SOA formation [12,13] and growth [14], gas–particle partitioning [15], reactive uptake on particle surfaces [16,17], and atmospheric impacts [18,19,20].
Recent attention on the phase state of atmospheric particles has motivated several questions regarding parameters/conditions that influence the phase state and physical properties. Models assume that SOA particles remain liquid-like throughout their lifetime, and that an equilibrium exists between the particle and gas phase due to rapid evaporation and condensation [21,22,23,24]. However, recent measurements have provided strong evidence to challenge this assumption [25,26,27], showing that SOA can adopt liquid, semisolid (viscous), and solid phase states depending on their composition and ambient conditions [11,28,29].
It has been shown previously that environmental conditions such as temperature and relative humidity (RH) could have a significant impact on SOA phase and viscosity [11,30,31,32,33,34,35,36]. Lingnell et al. showed that a decrease in temperature from 20 °C to 0 °C decreases the viscosity of α-pinene/O3 SOA by roughly two orders of magnitude. They hypothesize that SOA viscosity is altered either by slowing down unimolecular decomposition and bimolecular reactions of photo-excited molecules or by physically changing the SOA matrix [32]. Furthermore, results from Renbaum-Wolff et al. suggest that viscosity of α-pinene/O3 SOA is comparable to that of honey (10 Pa s) at 90% RH, similar to that of peanut butter (103 Pa s) at 70% RH, and greater than or equal to bitumen (108 Pa s) at ≤30% RH [30].
In addition to RH and temperature, the phase state of SOA may also be impacted by the absolute SOA mass loading (CSOA; reported in μg m−3). It has been shown recently that aerosol composition of SOA generated from the ozonolysis of α-pinene changes as a function of total organic aerosol mass loading [37]. Results from two independent studies have shown that for α-pinene/O3 SOA, the aerosol mass spectrometry (AMS) signal intensity at m/z 44 (which includes fragments of oxo- and di-carboxylic acids) increases relative to m/z 43 (predominantly acetyl cations) at low mass loading, suggesting that more polar components appear to dominate at low mass loading [37,38]. The authors have also shown that as SOA mass loading increases, particle mass yield and H:C ratio increase, while O:C ratio decreases largely due to variable partitioning of semivolatile molecules into the gas phase [37,38]. These findings are supported by volatility basis set (VBS) theory, which is a modeling framework that distributes all organic species into volatility bins having discrete values of effective saturation concentration [39,40]. These seminal studies, however, did not provide insight with regard to changes in phase as a function of absolute mass loading.
Mass loading affects chemical composition, which, in turn, affects viscosity/phase. However, to the best of our knowledge, no reports have been published elucidating the impact of absolute SOA mass loading upon the SOA phase state. Therefore, we report herein the results of a systematic study investigating the influence of CSOA on the phase state of SOA formed by ozonolysis of several atmospherically relevant SOA precursors: α-pinene, limonene, cis-3-hexenyl acetate (CHA) and cis-3-hexen-1-ol (HXL). These chemical systems were selected to represent both cyclic and linear analogues of atmospheric volatile organic compounds (VOCs). α-pinene is arguably one of the most important monoterpene precursors to global SOA, and limonene is the most important indoor SOA precursor. Green leaf volatiles (GLVs) such as CHA and HXL are unsaturated, oxygenated hydrocarbons emitted in large quantities by stressed plants and are susceptible to atmospheric oxidation, possessing significant ozonolysis aerosol yields of approximately 1−10% [41]. Experiments were performed with each of the precursors by either varying the VOC or ozone concentration to obtain a different maximum CSOA. Phase state was inferred by measuring the maximum bounce factor (BF) of the generated polydisperse SOA using a previously established method [42]. Reported here are the BF results for each chemical system as a function of CSOA ranging from 0.2 µg m−3 to 160 µg m−3. Elucidating the impact of CSOA on phase state is essential to better understanding atmospheric processes, such as gas–particle partitioning and chemical reactive uptake by SOA.
2. Experiments
2.1. Reagents and Equipment
α-pinene (>99%), limonene (>99%), CHA (>98%) and HXL (>99%), were purchased from Sigma Aldrich (St. Louis, MO, USA) and used without further purification. All experiments were performed in the 8 m3 University of Vermont Environmental Chamber (UVMEC) [43] operated at ambient temperature (~298(±2) K) and atmospheric pressure. Gaseous wall losses were previously determined to be insignificant [41]. Dry, zero air was produced by passing compressed air sequentially through silica, activated carbon and HEPA filters. This zero air was also used to generate ozone using a commercial corona discharge ozone generator (OL80A/DLS, Ozone Lab, Burton, BC, Canada). The UVMEC is equipped with ambient O3 (Serinus O3 model E020010, American Ecotech, Cincinnati, OH, USA) and NOx (EC9041A NOx Analyser, American Ecotech, Cincinnati, OH, USA) analyzers.
Current distributions to estimate the bounce factor and aerosol particle number size distributions were measured continuously using an electrical low pressure impactor (ELPI+, Dekati, Finland) operating either with sintered plates (to eliminate particle bounce) or smooth plates (to favor particle bounce) [42]. Aerosol particle number size distributions were also measured in parallel with a scanning mobility particle sizer (SMPS model 3080, TSI Inc., Shoreview, MN, USA) operating at 0.3 L min−1 and 3.0 L min−1 for aerosol flow and sheath flow, respectively. This checked for reproducibility and for potential disparity between the ELPI+ and SMPS measurements.
2.2. Chamber Experiments (Generation of SOA)
Experiments using different SOA precursors (see Table 1) were carried out in the UVMEC [43]. Volumes of both the SOA precursors and ozone were varied to achieve increasingly larger mass loadings. During experiments, ozonolysis of all the SOA precursors led to SOA formation and subsequent growth. While seed particles are present in the atmosphere, SOA was formed in their absence of seed in the UVMEC, as these would be detected by the ELPI+ and lead to changes in the current measured, thus skewing bounce factor values. Also, no OH scavenger was used. Experimental conditions and details are provided in Table 1. All experiments were carried out in duplicate. Between experiments, the chamber was passivated with O3 (1–2 ppm) overnight and then flushed with zero air until the background aerosol mass (assuming an average particle density of 1.2 g cm−3 [44,45,46,47,48])and number concentrations were below 0.1 µg m−3 and 50 particles cm−3, respectively.
Aliquots of the selected SOA precursor were extracted from reagent bottles using a glass syringe with volume markings. The SOA precursor was then quantitatively introduced into a clear three-neck flask which was placed in a warm-hot water bath. The three-neck flask was sealed except for a zero air inlet and an outlet leading directly to the UVMEC. The SOA precursor in the three-neck flask was only able to travel into the UVMEC following vaporization. This resulted in a desired, theoretical maximum VOC mixing ratio in the UVMEC. Ozone was then introduced to the chamber in a 30–60 s burst, until the desired concentration was attained. Injection of ozone was previously calibrated in the absence of VOC for our environmental chamber such that a 30 s injection of ozone corresponded to a 100 ppb mixing ratio in the chamber. Identical injection times were used for duplicate experiments. Ozone concentrations shown in Table 1 correspond to the measured value of ozone in the presence of VOC. All experiments were conducted at a relative humidity of 20–25%. The aerosol mass loading in the chamber for these experiments varied from 0.25 to 163 μg m−3. The environmental chamber was at a minimally higher pressure relative to its surroundings.
2.3. Bounce Analysis
Details of the method used to estimate the phase state of generated SOA is presented elsewhere [42]. Briefly, two separate cascade impactors are used to perform bounce analysis and calculate bounce factor (BF). One cascade impactor was equipped with smooth impaction plates, favoring particle bounce. The second cascade impactor used sintered impaction plates coated with a thin layer of vacuum grease to minimize (ideally shut down) bounce. When using smooth impaction plates, particles with sufficient kinetic energy can overcome the adhesion energy at the surface and bounce to lower impactor stages, resulting in a systematic bias of the raw current distribution toward lower channels and smaller particle diameters. The presence of bounce, therefore, generates an erroneously high raw current in the lower stages (i.e., larger particles are mistakenly counted as smaller particles). Raw currents are subject to a correction algorithm, which corrects for diffusion and space charger losses [49,50].
BF is then calculated by analyzing the corrected current measured with the ELPI+ operating sequentially with smooth and sintered plates according to Equation (1):
where and are the corrected currents measured at the back up filter (i.e., smallest diameter channel) of the smooth and sintered plates, respectively. is the sum of the corrected currents obtained from all stages of the sintered plates except the backup filter. Sequential experiments (smooth followed by sintered impaction plates and vice versa) were conducted under identical conditions and experimental parameters. Any potential particle phase wall losses would be identical for sequential experiments and thus would not impact BF. Each data point for Figure 2, Figure 3 and Figure 4 represents the maximum BF, independent of experimental time, reached during a separate experiment conducted at a given CSOA.
3. Results and Discussion
The impact of absolute CSOA upon the phase state of SOA remains a question of considerable importance to the atmospheric science community. The volatility of α-pinene SOA, for example, has been measured to be mostly independent of the SOA mass loading over several orders of magnitude (1–800 μg m−3) [51]. Comparison of this result with kinetic models suggests that SOA from the ozonolysis of α-pinene is composed of a large fraction of effectively non-volatile but thermally unstable species, which are likely dimers or higher-order oligomers, but could also be exceptionally low volatility monomers [51]. Somewhat contradictory, a separate study [52] showed that at low mass loading, the cloud condensation nuclei activity increased beyond predicted values, implying differences in the physico-chemical properties of the organic component. As a result, particle viscosity and therefore the corresponding BF values may be impacted.
Below, we describe the results of a systematic study, utilizing several key SOA precursors, to better understand the role of CSOA on phase. In the ensuing discussion, the particle BF is measured and used as a surrogate for particle viscosity or phase. No quantitative absolute measure of viscosity has been made. Rather, the BF is used to provide information regarding the relative particle viscosity between different SOA systems.
3.1. α-Pinene
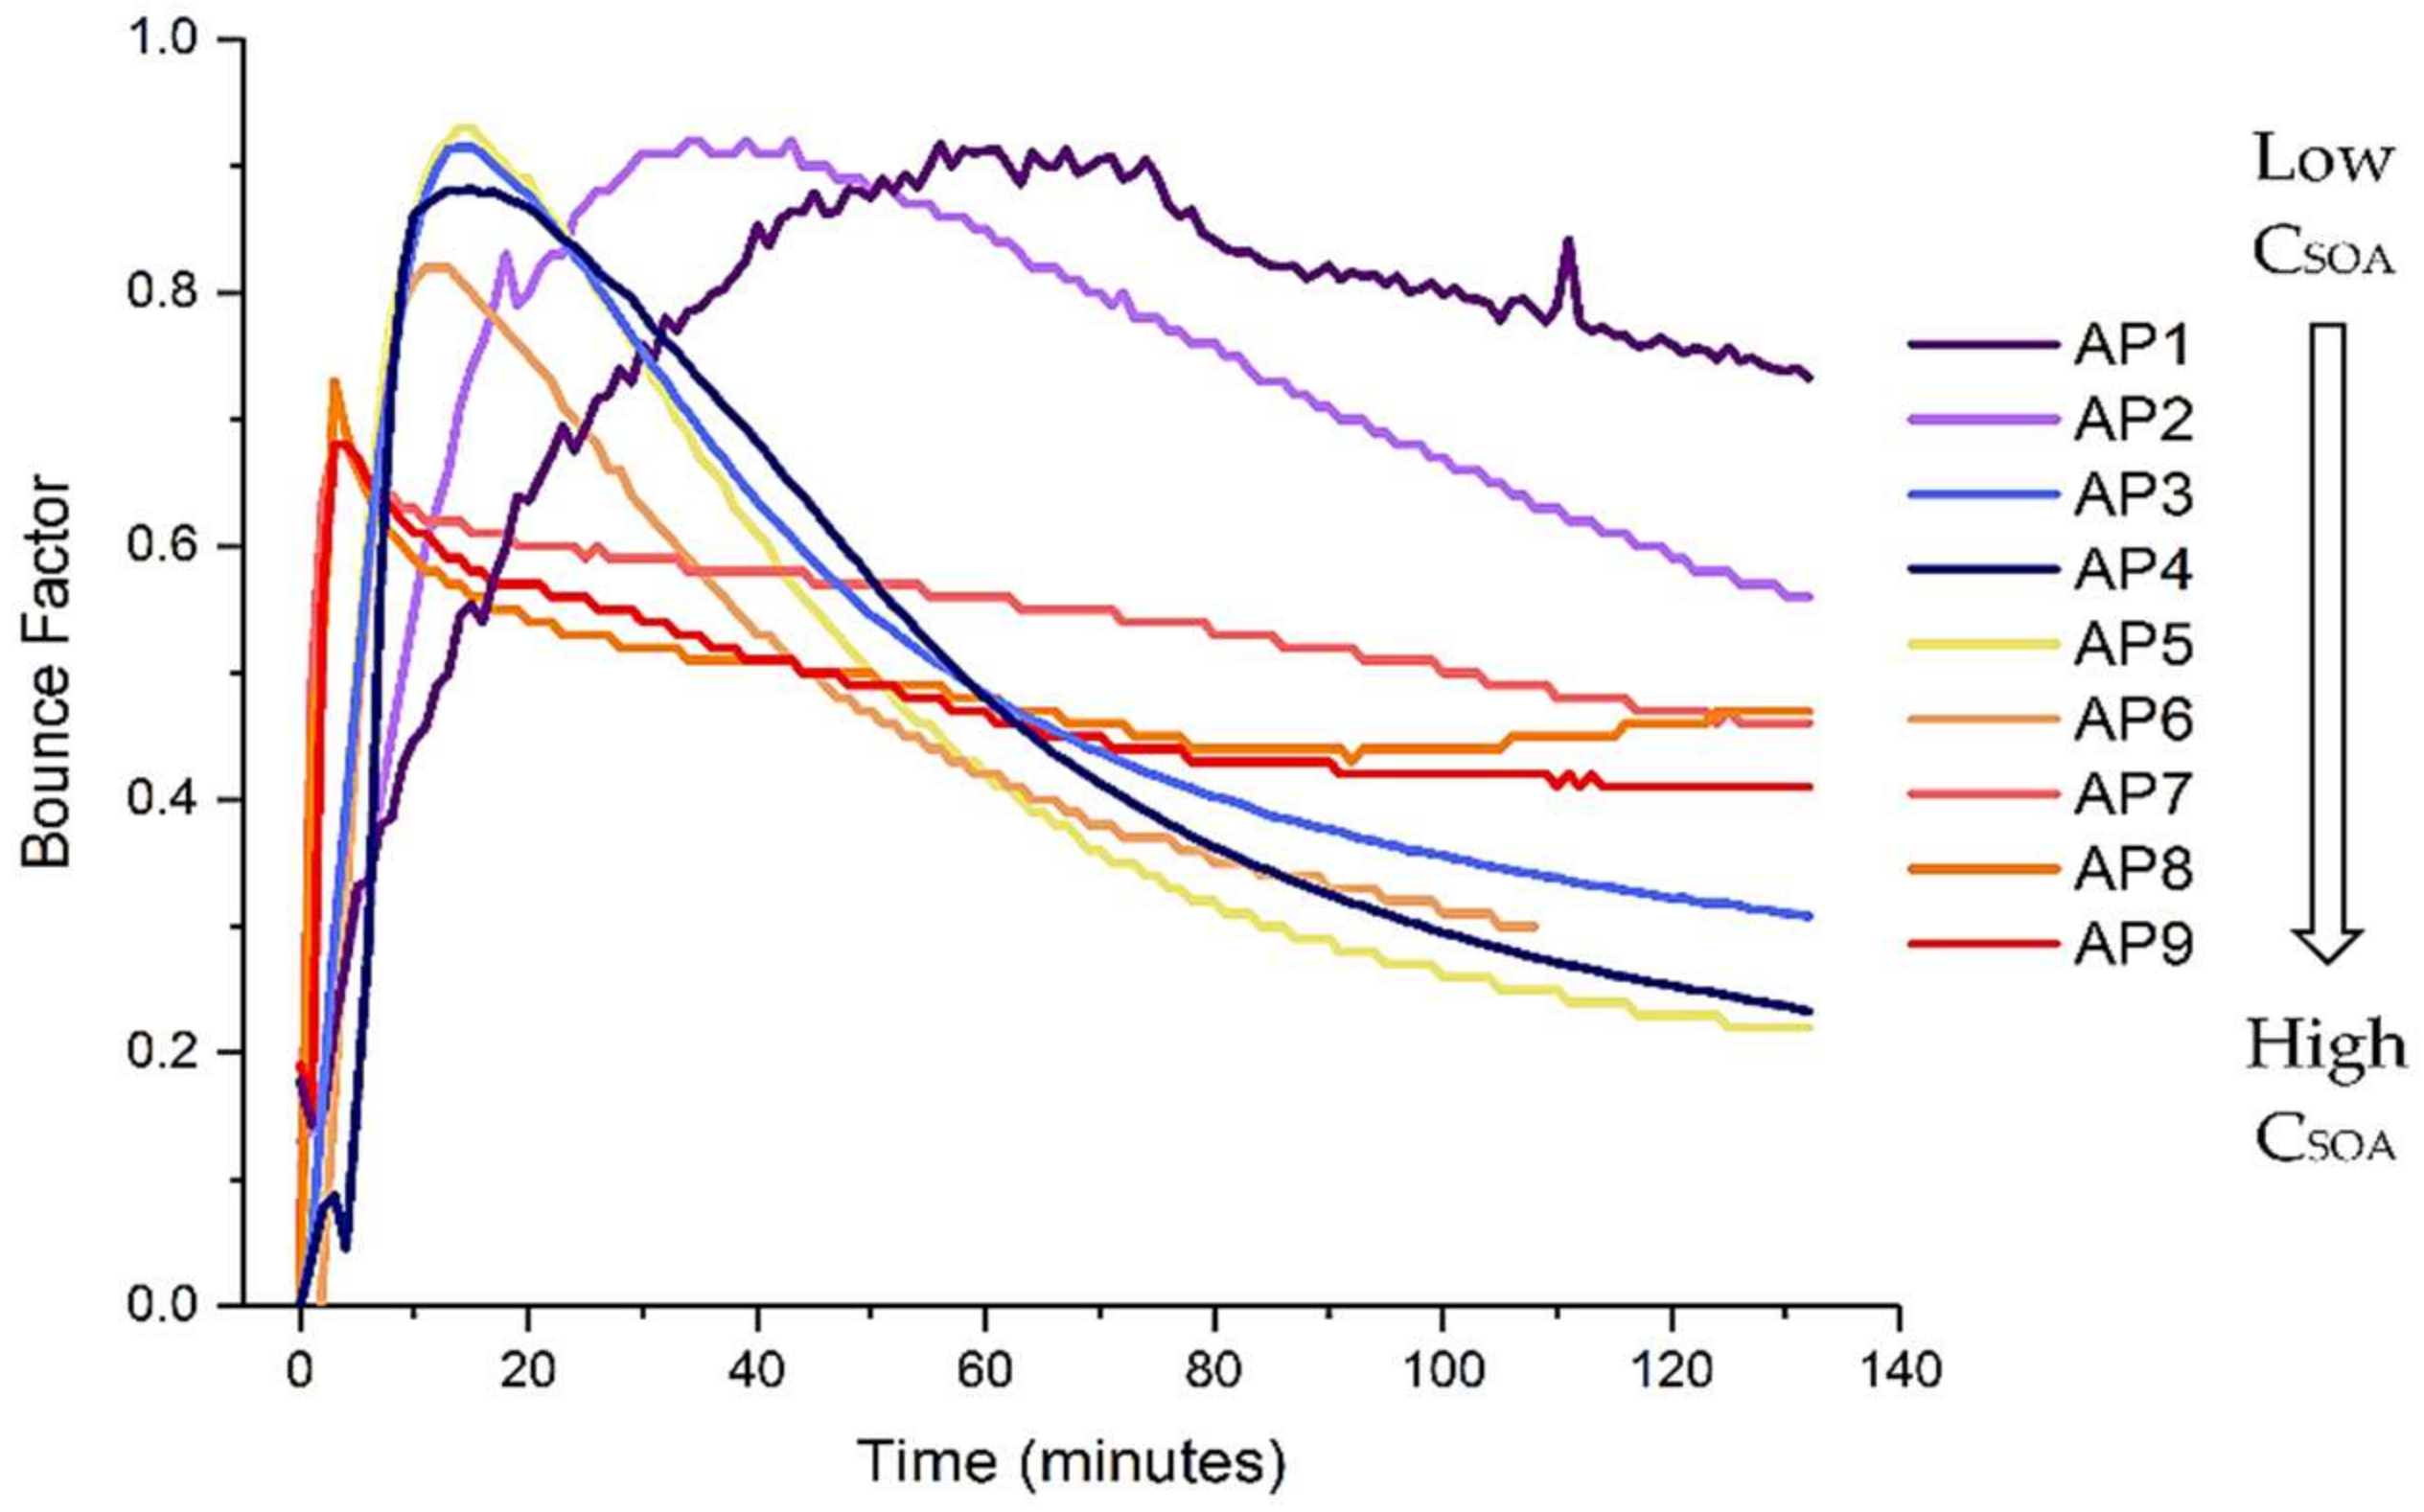
A simple cursory analysis of the BF of SOA generated from α-pinene ozonolysis under different absolute mass loadings clearly illustrates a strong dependence between the BF and the mass loading (Figure 1; where α-pinene was introduced into the UVMEC immediately prior to time 0, and ozone injection occurred at time 0). Additional important general conclusions that may be gleaned from these data include (1) an initial increase in the BF immediately following SOA particle inception to reach the most non-liquid state and (2) a general reduction in BF as a function of experimental time.
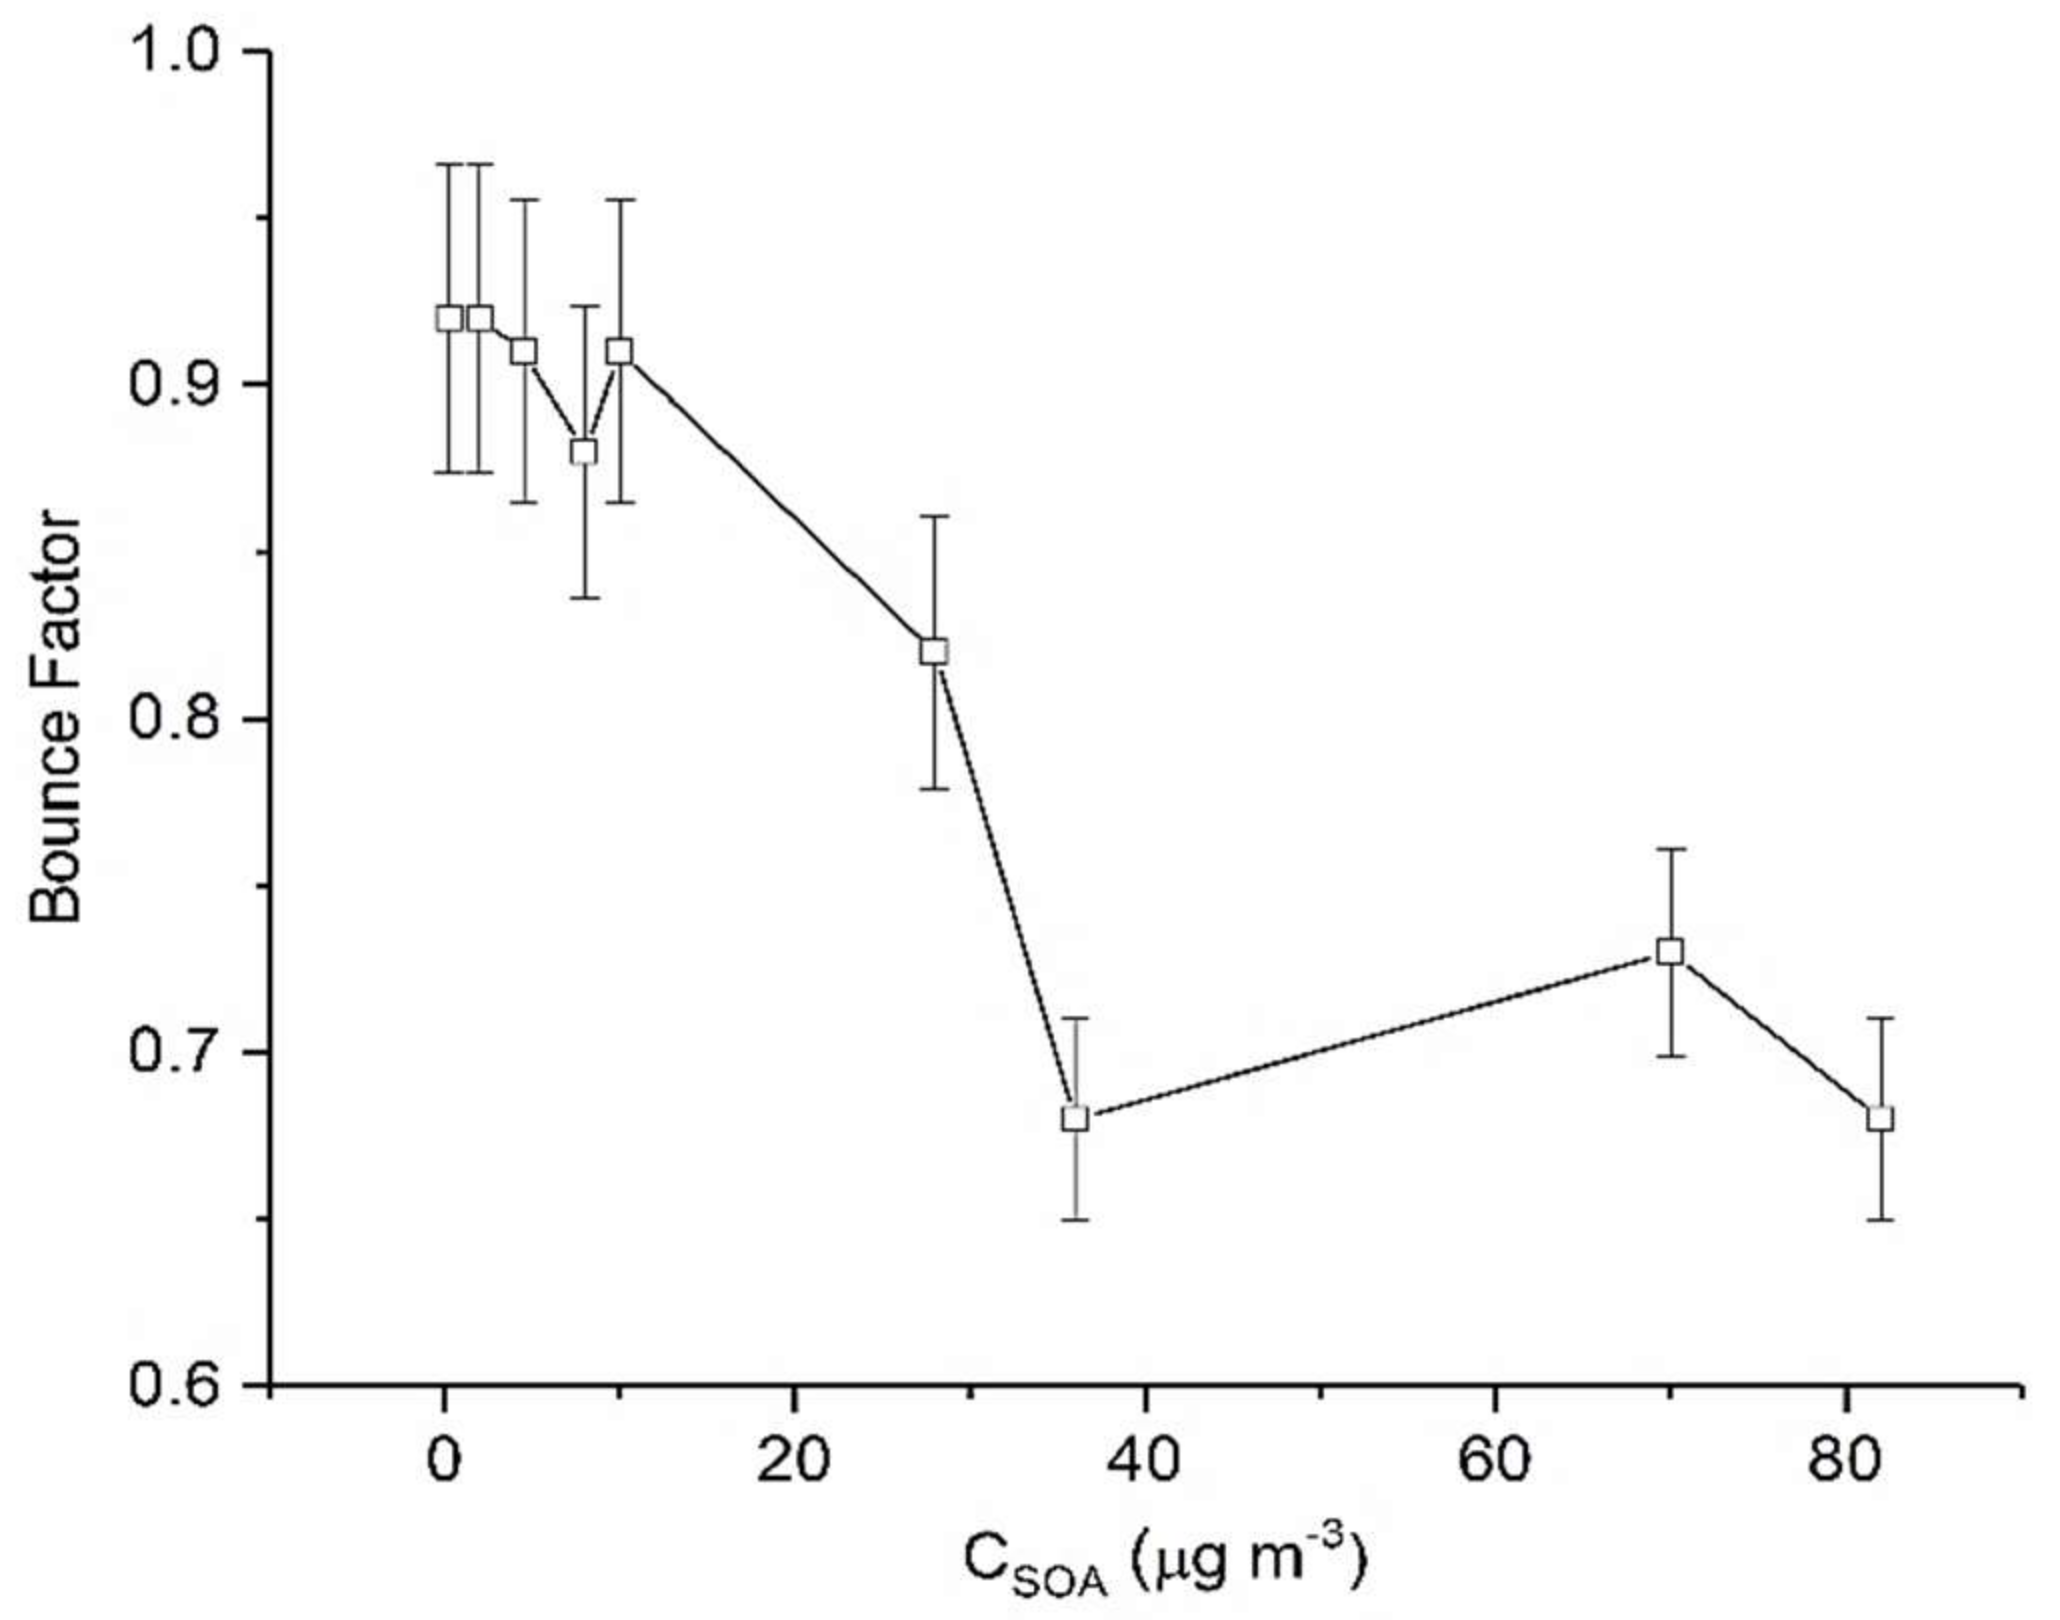
While there is some degree of similarity in BF trends at different mass loadings, Figure 2 illustrates that the maximum BF achieved (i.e., most non-liquid state) changes substantially with CSOA. For example, at the lowest mass loading (0.25 μg m−3), we measure the greatest BF (0.92). As successively greater CSOA was present, we observed a very steep change in BF. It was seen that for higher mass loadings maximum BF decreases, from 0.92 at 8 μg m−3 to 0.68 at 36 μg m−3. Beyond a CSOA of approximately 36 µg m−3, further increases in CSOA did not result in changes in BF (Figure 2).
These results suggest that at low CSOA, which more closely approximates atmospherically relevant conditions, α-pinene SOA is more non-liquid in state. This further suggests that dimers, lower volatility and highly viscous products form the majority of the SOA chemical composition. These results can also be used to rationalize observations reported in the literature previously. For example, Shilling et al. [37] showed that for α-pinene SOA, changes in particle composition were more pronounced at low mass loadings (below 15 µg m−3). These results, along with the findings of this work, suggest mass loading plays a significant role in determining the phase state of SOA. Additionally, Gao et al. [53] reported that formation of a dimer of pinic acid and terpenylic acid was enhanced substantially as CSOA decreased. If our reasoning is correct then, the greater BF observed at the lowest mass loadings may be indicative of an increased oligomeric content. This is in keeping with our present understanding that high molecular weight oligomers/dimers are more viscous than smaller molecules due to increased hydrogen bonding and intramolecular forces with surrounding molecules [29,33]. Therefore, particles containing oligomers have a higher probability of forming glassy/semisolid matrices as compared to their monomeric units [29,33]. Finally, it has been shown [54] that α-pinene SOA is more oxygenated at low organic mass loading, a condition which can also produce particles of higher viscosity.
It is important to highlight that oxidative processing can also influence particle viscosity. Hosny et al. showed that final viscosity attained for a particle is dependent on the concentration of ozone used, with lower concentrations leading to somewhat higher viscosities [55]. Higher (and non-atmospherically relevant) ozone concentrations possibly impede secondary chemical reactions, thereby reducing the production of high molecular weight products [55]. This may also help explain why lower BF is observed at high mass loading.
Furthermore, recent work has shown that, at relative humidity less than 30%, partitioning of organic molecules between gas and particle phases may be confined to the top few surface monolayers of the particle [30]. At this RH, therefore, instantaneous equilibrium partitioning within the particle bulk is not expected to take place. As a result, models that assume equilibrium partitioning at ≤30% RH may over predict SOA particle mass [30,56]. The same would hold true for SOA at different mass loadings, which, as shown above, has an effect on the phase state of α-pinene SOA. At lower mass loading, where SOA is more non-liquid (more viscous), one can therefore expect that the particles may take up fewer semi volatile organic compounds (SVOCs) compared to a higher mass loading where SOA is relatively less viscous. It should also be further noted that composition and partitioning, which, as shown above, is closely related to CSOA, may serve as additional factors affecting particle viscosity.
Additionally, it is well established that the physical properties of a particle can play a crucial role in its interaction with gases [16,31,57,58]. An accurate description of reactions and interactions at the surface is important to understand the fate and role of SOA in the atmosphere. Reactions at the interface between gas and condensed phase become increasingly important as particle size decreases. A decrease in the particle size results in an increase in the effective surface area and hence the reaction rates. As an example, for a 50 nm particle, 25% of the molecules are on the surface of the particle [57]. Furthermore, the mixing within the particle bulk is kinetically limited as only the surface of the particle initially interacts with, and engages in gaseous uptake, meaning the gas–particle partitioning cannot be well represented by an equilibrium process. Hence, at low CSOA during the initial stages of SOA formation, reactions and gas uptake would be limited primarily to the thin layers at the particle surface. Interestingly it was also observed that, at all CSOA studied, the most non-liquid state (i.e., maximum BF) was achieved invariably when particles reach a geometric mean diameter (GMD) of 50–60 nm.
3.2. Limonene
Some literature reports suggest that limonene SOA could exist as non-liquid, but no concrete evidence has yet been presented to support this supposition. Kundu et al. provided a detailed molecular analysis of limonene SOA, generated by ozonolysis, using ultrahigh-resolution Fourier transform ion cyclotron resonance (FT-ICR) mass spectrometry and identified over 1200 molecular formulas over the mass range of 140 to 850 Da [59]. The high molecular weight compounds (m/z > 300) were found to constitute a significant number fraction of the identified SOA components, consisting primarily of oligomers formed by the reactive uptake of gas-phase carbonyls during the ozonolysis reaction [59,60]. As stated earlier, oligomers have much higher glass transition temperatures, resulting in a higher probability of forming glassy/semisolid particles. In another study, evaporation kinetics of limonene-generated SOA particles show different behaviors at <5% RH and 90% RH. It was shown that for SOA at 90% RH, a slightly larger fraction of the particle mass evaporated as compared to SOA at lower RH, suggesting that the SOA may be non-liquid/solid at lower RH [61].
Here, the influence of CSOA on the phase state of SOA generated by limonene oxidation was investigated. Unlike α-pinene, which has only one endocyclic double bond, limonene possesses both an endocyclic and exocyclic double bond. In the case of limonene, the endocyclic double bond is oxidized first, followed by heterogeneous ozonolysis of the terminal double bond in the first-generation condensed-phase products [43,62]. The presence of multiple double bonds would result in more highly oxygenated species and are expected to produce products with a wider range of volatilities.
Results from our chamber experiments show that limonene SOA demonstrated considerable bounce from the outset of SOA formation (Figure 3) suggesting a non-liquid state. Also, as was the case with α-pinene SOA, we see a significant mass loading dependence of the measured BF. Analogous to α-pinene SOA, the highest BF (0.98) is also measured at the lowest mass loading (5 μg m−3). It was also observed that as CSOA increases, the BF decreases very quickly only to a certain mass loading and then remains constant.
Interestingly, it was observed that the BF in general was higher for limonene SOA as compared to the α-pinene SOA across the range of mass loadings studied. The overall greater BF for limonene SOA may be attributed to the relative volatility of α-pinene and limonene SOA, which has been measured in previous studies [63]. The lower volatility of limonene SOA may be indicative of higher oligomeric content [23] and particle hardening, [25,61] both of which would produce greater bounce.
3.3. Cis-3-Hexenyl Acetate (CHA) and Cis-3-Hexen-1-ol (HXL)
Several studies have considered the effect of GLVs on SOA formation [41,64,65], and progress has been made in understanding the oxidation pathways to SOA formation from CHA and HXL via ozonolysis [66,67]. The alkene ozonolysis mechanism is described in detail elsewhere [68,69,70,71,72]. Previous NIR-LDI-MS [67] studies have shown that SOA from these GLVs consists of a complex mixture of oxygenated compounds ranging from 70 to >300 m/z. It has been shown that HXL-SOA is formed primarily by oligomerization via ester-type linkages. HXL-SOA can undergo hydration/dehydration reactions and reactive uptake of gas-phase products, such as propionaldehyde, to form higher MW compounds. Contrary to HXL, CHA-derived SOA is formed primarily through the hydroperoxide channel, as oligomer formation is inhibited by the lower reactivity of the acetate functionality. The greater oligomeric content in the HXL-SOA would suggest particles of greater viscosity than pure liquid, yet no studies thus far have reported on the phase and physical properties of SOA formed from these GLVs.
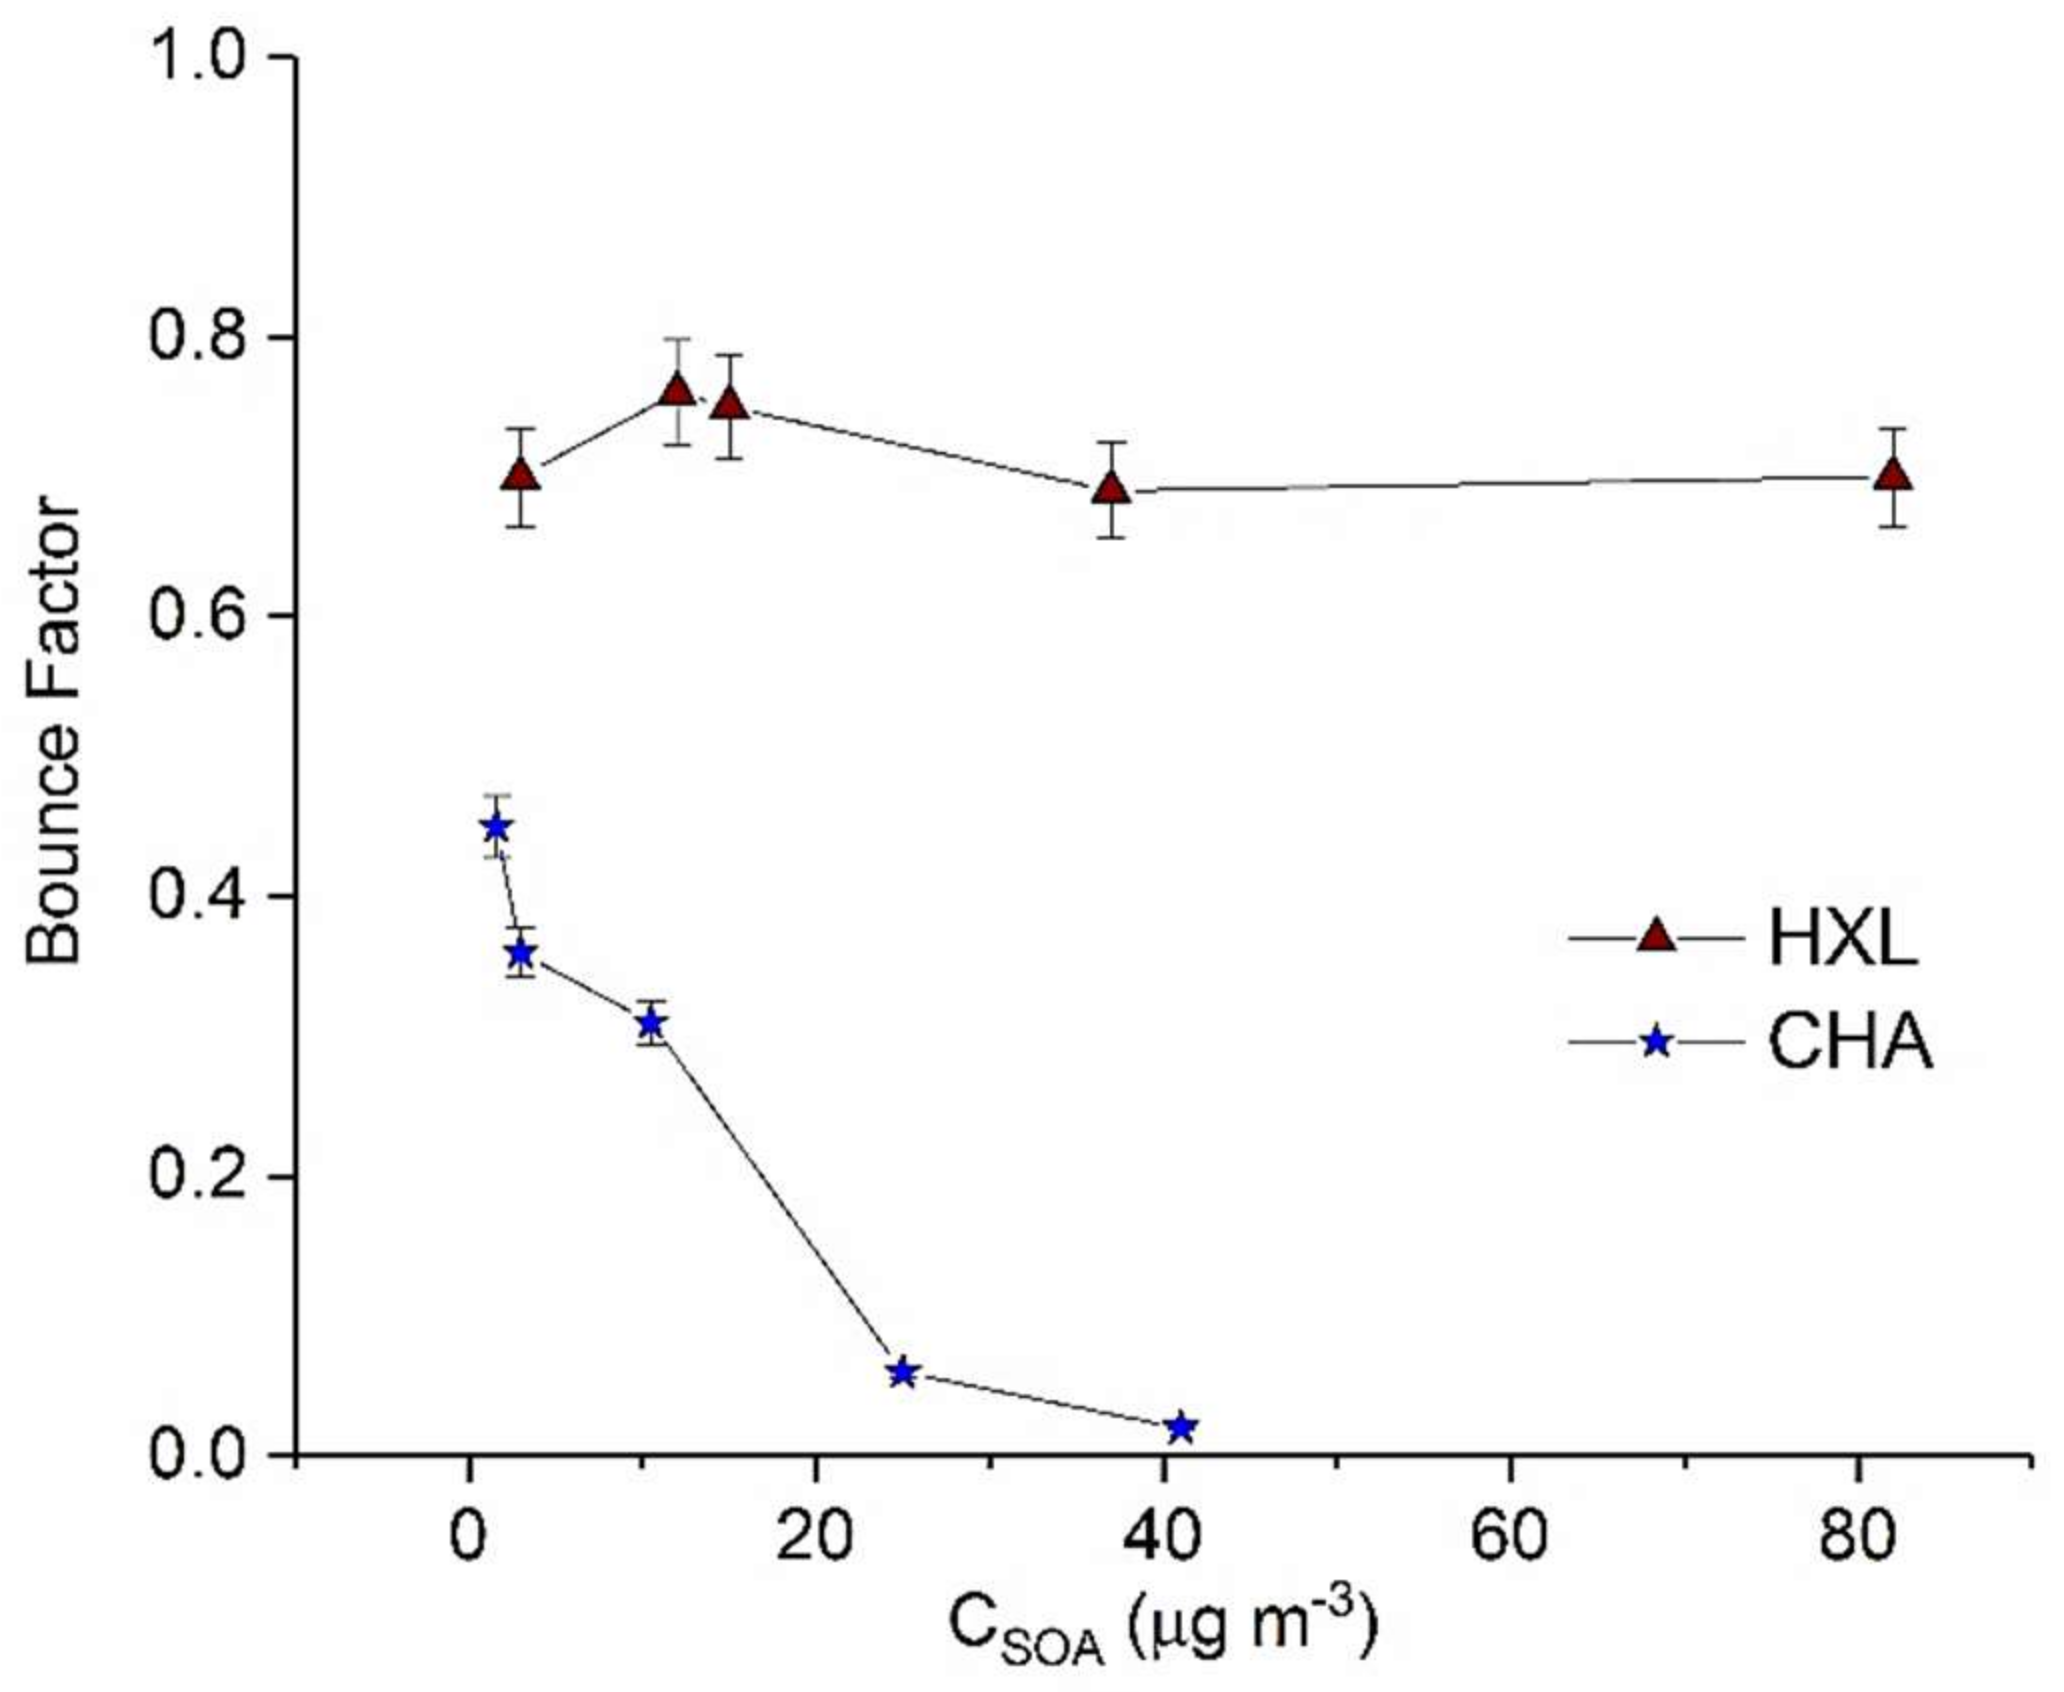
In this work, we demonstrate dependence of the phase of GLV-derived SOA on the absolute SOA mass loading (Figure 4). While both HXL- and CHA-derived SOA exhibit non-liquid behavior, HXL-SOA appears more viscous (or less liquid-like) (maximum BF = 0.7) than CHA-derived SOA (maximum BF = 0.45). It was also observed (Figure 4) that the BF of HXL-SOA was largely independent of CSOA, unlike other SOA precursors in this study. Independence of BF from absolute CSOA suggests that the physical properties, chemical composition and reactive uptake of HXL-SOA do not change significantly with SOA mass loading.
Interestingly, for the case of CHA-SOA, we observed significant particle bounce (BF = 0.45) at low mass loading (1.6 µg m−3), despite a hypothesized lack of oligomeric content. However, at slightly higher SOA mass loadings (25 µg m−3), the BF quickly decreased to 0.06, indicating a transition to a liquid SOA. The evolution of the BF for this system suggests a continuous changing chemical composition of CHA-SOA with mass loading. Clearly these results call for further studies to understand what classes of chemical compounds, besides oligomers such as aldehydes, ketones, alcohols etc., may impact the phase state of SOA.
4. Conclusions
The results presented in this study demonstrate that SOA absolute mass loading can have a significant influence on the phase state of the organic aerosols produced via separate ozonolysis of α-pinene, limonene, and cis-3-hexenyl acetate, while minimally impacting the phase state of cis-3-hexen-1-ol. As this study probed a select few organic precursors to SOA, caution should be exercised in extrapolating these results to all particle types, which can vary in their sources and geographic prevalence. It is also worth noting that changes in SOA composition are likely with changes in CSOA [37], which affects the viscosity and the phase state of the SOA. This conclusion complements the findings demonstrated herein and may help explain the differences in observed BF for varying CSOA of the same SOA precursor. With this, we are not excluding composition as a possible reason for the observed BF variations, and we are not implying that CSOA is the sole factor affecting the phase state of atmospheric aerosols. Rather, we are reporting on the apparent CSOA dependence of SOA phase from a select few SOA precursors.
Our results therefore provide new insights into parameters influencing the phase state of atmospheric aerosols. We provided evidence that, besides α-pinene, other SOA precursors can form SOA which are non-liquid in phase. Our findings show that under ambient environmental conditions (<10 µg m−3), α-pinene, limonene, CHA and HXL SOA is not a pure liquid as has been previously assumed, which could have important implications on the ultimate fate of SOA in the atmosphere. It should be noted that, since experiments were conducted under relatively dry conditions (RH 20–25%), the phase of the SOA produced may vary under conditions of higher RH. Nevertheless, based on our results, we suggest and highly recommend that chamber studies must be performed at atmospherically relevant SOA levels to accurately simulate the chemical properties, reactions and phase of ambient organic aerosol.
Persistent disparity between the measured and modelled SOA level is a question of considerable importance to the atmospheric science community. Attempts thus far to close the gap between model and data have focused primarily on finding additional SOA precursors and refining methods of estimating the aerosol yield from precursors. Meanwhile, the fundamental assumptions about SOA properties have remained mostly unchallenged. Our findings show that phase of select atmospheric aerosols changes with SOA mass loading, which may help to constrain the discrepancy between measured and modelled SOA levels.
Semi-solid, non-liquid or glassy particles can have an impact on atmospheric reactions and uptake. Molecular diffusion in the condensed phase, which largely depends on SOA viscosity, can affect the gas uptake and chemical transformation of organic particles. Estimation of the SOA phase and viscosity at specific, relevant SOA mass loadings would help to better constrain gas uptake estimates. Moreover, a decrease in diffusion rates within the particles results in an increase in the chemical lifetime of reactive compounds in atmospheric particles from seconds to days [31]. An improved understanding of the parameters that result in a phase change would thereby improve model accuracy of particle growth rates and reactive processes.
Current models of atmospheric aerosol assume that various properties of the aerosol are governed by equilibrium thermodynamics. However, the presence of non-liquid aerosol in the atmosphere highlights the importance of quantifying the rates of change of these properties. Studies suggest that non-liquid particles can kinetically inhibit the partitioning of semi volatile components, in contrast to the traditional assumption that organic compounds exist in quasi-instantaneous gas–particle equilibrium [15]. Studies also demonstrate that the timescale for particle equilibration correlates with bulk viscosity/phase [73,74]. Therefore, if absolute SOA mass loading can influence the phase state by up to 30%, it could very well have a significant impact on various properties such as partitioning, water and gas uptake, and condensation and evaporation kinetics. For example, a 100 nm particle, which is in a non-liquid phase at organic mass loadings of 1 µg m−3, can have an equilibration time scale of SOA partitioning (Teq) of approximately 1 h [75]. On the other hand, that same particle at a much higher organic mass loading of 15 µg m−3 (which, according to results presented herein, could now be less viscous) would have Teq of only 1 min. Our results add support to the hypothesis of kinetic inhibition of the partitioning by non-liquid particles, suggesting that accounting for the additional parameters such as the SOA mass loading influence on the phase can be important for accurately modelling the behavior of atmospheric aerosols. We are currently expanding this work to improve our understanding of the impact that various other parameters, such as SOA precursor, oxidation type (O3 vs. OH vs. NOx), mixing ratio and chamber surface area to volume ratio can have on the phase of atmospheric aerosols.
Supplementary Files
Supplementary File 1Acknowledgments
This material is based upon work supported by the National Science Foundation under Grant No. CHE-1709751.
Author Contributions
For research articles with several authors, a short paragraph specifying their individual contributions must be provided. Giuseppe A. Petrucci and Shashank Jain conceived and designed the experiments; Shashank Jain and Kevin B. Fischer performed the experiments; Giuseppe A. Petrucci, Shashank Jain and Kevin B. Fischer analyzed the data.
Conflicts of Interest
The authors declare no conflict of interest. The founding sponsors had no role in the design of the study; in the collection, analyses, or interpretation of data; in the writing of the manuscript, and in the decision to publish the results.
References
- Jimenez, J.L.; Canagaratna, M.R.; Donahue, N.M.; Prevot, A.S.H.; Zhang, Q.; Kroll, J.H.; DeCarlo, P.F.; Allan, J.D.; Coe, H.; Ng, N.L.; et al. Evolution of organic aerosols in the atmosphere. Science 2009, 326, 1525–1529. [Google Scholar] [CrossRef] [PubMed]
- Hallquist, M.; Wenger, J.C.; Baltensperger, U.; Rudich, Y.; Simpson, D.; Claeys, M.; Dommen, J.; Donahue, N.M.; George, C.; Goldstein, A.H.; et al. The formation, properties and impact of secondary organic aerosol: Current and emerging issues. Atmos. Chem. Phys. 2009, 9, 5155–5236. [Google Scholar] [CrossRef] [Green Version]
- Ehn, M.; Thornton, J.A.; Kleist, E.; Sipilä, M.; Junninen, H.; Pullinen, I.; Springer, M.; Rubach, F.; Tillmann, R.; Lee, B.; et al. A large source of low-volatility secondary organic aerosol. Nature 2014, 506, 476–479. [Google Scholar] [CrossRef] [PubMed]
- Pope, C.A.; Dockery, D.W. Health effects of fine particulate air pollution: Lines that connect. J. Air Waste Manag. Assoc. 2006, 56, 709–742. [Google Scholar] [CrossRef] [PubMed]
- Poschl, U. Atmospheric aerosols: Composition, transformation, climate and health effects. Angew. Chem. Int. Ed. 2005, 44, 7520–7540. [Google Scholar] [CrossRef] [PubMed]
- Shiraiwa, M.; Li, Y.; Tsimpidi, A.P.; Karydis, V.A.; Berkemeier, T.; Pandis, S.N.; Lelieveld, J.; Koop, T.; Pöschl, U. Global distribution of particle phase state in atmospheric secondary organic aerosols. Nat. Commun. 2017, 8, 15002. [Google Scholar] [CrossRef] [PubMed]
- Shrivastava, M.; Easter, R.C.; Liu, X.; Zelenyuk, A.; Singh, B.; Zhang, K.; Ma, P.-L.; Chand, D.; Ghan, S.; Jimenez, J.L.; et al. Global transformation and fate of SOA: Implications of low-volatility SOA and gas-phase fragmentation reactions. J. Geophys. Res. Atmos. 2015, 120, 4169–4195. [Google Scholar] [CrossRef]
- Yu, H.; Kaufman, Y.J.; Chin, M.; Feingold, G.; Remer, L.A.; Anderson, T.L.; Balkanski, Y.; Bellouin, N.; Boucher, O.; Christopher, S.; et al. A review of measurement-based assessments of the aerosol direct radiative effect and forcing. Atmos. Chem. Phys. 2006, 6, 613–666. [Google Scholar] [CrossRef]
- Berkemeier, T.; Shiraiwa, M.; Poschl, U.; Koop, T. Competition between water uptake and ice nucleation by glassy organic aerosol particles. Atmos. Chem. Phys. 2014, 14, 12513–12531. [Google Scholar] [CrossRef]
- Scott, C.E.; Spracklen, D.V.; Pierce, J.R.; Riipinen, I.; D’Andrea, S.D.; Rap, A.; Carslaw, K.S.; Forster, P.M.; Artaxo, P.; Kulmala, M.; et al. Impact of gas-to-particle partitioning approaches on the simulated radiative effects of biogenic secondary organic aerosol. Atmos. Chem. Phys. 2015, 15, 12989–13001. [Google Scholar] [CrossRef]
- Wang, B.; O’Brien, R.E.; Kelly, S.T.; Shilling, J.E.; Moffet, R.C.; Gilles, M.K.; Laskin, A. Reactivity of liquid and semisolid secondary organic carbon with chloride and nitrate in atmospheric aerosols. J. Phys. Chem. A 2014, 119, 4498–4508. [Google Scholar] [CrossRef] [PubMed]
- Perraud, V.; Bruns, E.A.; Ezell, M.J.; Johnson, S.N.; Yu, Y.; Alexander, M.L.; Zelenyuk, A.; Imre, D.; Chang, W.L.; Dabdub, D.; et al. Nonequilibrium atmospheric secondary organic aerosol formation and growth. Proc. Natl. Acad. Sci. USA 2012, 109, 2836–2841. [Google Scholar] [CrossRef] [PubMed]
- O’Brien, R.E.; Neu, A.; Epstein, S.A.; MacMillan, A.C.; Wang, B.; Kelly, S.T.; Nizkorodov, S.A.; Laskin, A.; Moffet, R.C.; Gilles, M.K. Physical properties of ambient and laboratory-generated secondary organic aerosol. Geophys. Res. Lett. 2014, 41, 4347–4353. [Google Scholar] [CrossRef]
- Power, R.M.; Simpson, S.H.; Reid, J.P.; Hudson, A.J. The transition from liquid to solid-like behaviour in ultrahigh viscosity aerosol particles. Chem. Sci. 2013, 4, 2597–2604. [Google Scholar] [CrossRef]
- Shiraiwa, M.; Zuend, A.; Bertram, A.K.; Seinfeld, J.H. Gas-particle partitioning of atmospheric aerosols: Interplay of physical state, non-ideal mixing and morphology. Phys. Chem. Chem. Phys. 2013, 15, 11441–11453. [Google Scholar] [CrossRef] [PubMed]
- Kuwata, M.; Martin, S.T. Phase of atmospheric secondary organic material affects its reactivity. Proc. Natl. Acad. Sci. USA 2012, 109, 17354–17359. [Google Scholar] [CrossRef] [PubMed]
- Pajunoja, A.; Lambe, A.T.; Hakala, J.; Rastak, N.; Cummings, M.J.; Brogan, J.F.; Hao, L.; Paramonov, M.; Hong, J.; Prisle, N.L.; et al. Adsorptive uptake of water by semisolid secondary organic aerosols. Geophys. Res. Lett. 2015, 42, 3063–3068. [Google Scholar] [CrossRef]
- Virtanen, A.; Kannosto, J.; Kuuluvainen, H.; Arffman, A.; Joutsensaari, J.; Saukko, E.; Hao, L.; Yli-Pirila, P.; Tiitta, P.; Holopainen, J.K.; et al. Bounce behavior of freshly nucleated biogenic secondary organic aerosol particles. Atmos. Chem. Phys. 2011, 11, 8759–8766. [Google Scholar] [CrossRef]
- Slade, J.H.; Knopf, D.A. Multiphase oh oxidation kinetics of organic aerosol: The role of particle phase state and relative humidity. Geophys. Res. Lett. 2014, 41, 5297–5306. [Google Scholar] [CrossRef]
- Slade, J.H.; Shiraiwa, M.; Arangio, A.; Su, H.; Pöschl, U.; Wang, J.; Knopf, D.A. Cloud droplet activation through oxidation of organic aerosol influenced by temperature and particle phase state. Geophys. Res. Lett. 2017, 44, 1583–1591. [Google Scholar] [CrossRef]
- Pankow, J.F. An absorption-model of gas-particle partitioning of organic-compounds in the atmosphere. Atmos. Environ. 1994, 28, 185–188. [Google Scholar] [CrossRef]
- Chan, A.W.H.; Kroll, J.H.; Ng, N.L.; Seinfeld, J.H. Kinetic modeling of secondary organic aerosol formation: Effects of particle- and gas-phase reactions of semivolatile products. Atmos. Chem. Phys. 2007, 7, 4135–4147. [Google Scholar] [CrossRef]
- Vaden, T.D.; Imre, D.; Beranek, J.; Shrivastava, M.; Zelenyuk, A. Evaporation kinetics and phase of laboratory and ambient secondary organic aerosol. Proc. Natl. Acad. Sci. USA 2011, 108, 2190–2195. [Google Scholar] [CrossRef] [PubMed]
- Loza, C.L.; Coggon, M.M.; Nguyen, T.B.; Zuend, A.; Flagan, R.C.; Seinfeld, J.H. On the mixing and evaporation of secondary organic aerosol components. Environ. Sci. Technol. 2013, 47, 6173–6180. [Google Scholar] [CrossRef] [PubMed]
- Abramson, E.; Imre, D.; Beranek, J.; Wilson, J.; Zelenyuk, A. Experimental determination of chemical diffusion within secondary organic aerosol particles. Phys. Chem. Chem. Phys. 2013, 15, 2983–2991. [Google Scholar] [CrossRef] [PubMed]
- Cappa, C.D.; Wilson, K.R. Evolution of organic aerosol mass spectra upon heating: Implications for oa phase and partitioning behavior. Atmos. Chem. Phys. 2011, 11, 1895–1911. [Google Scholar] [CrossRef]
- Sato, K.; Fujitani, Y.; Inomata, S.; Morino, Y.; Tanabe, K.; Ramasamy, S.; Hikida, T.; Shimono, A.; Takami, A.; Fushimi, A.; et al. Lower than expected volatility of secondary organic aerosols formed during α-pinene ozonolysis. Atmos. Chem. Phys. Discuss. 2017, 2017, 1–17. [Google Scholar] [CrossRef]
- Virtanen, A.; Joutsensaari, J.; Koop, T.; Kannosto, J.; Yli-Pirila, P.; Leskinen, J.; Makela, J.M.; Holopainen, J.K.; Poschl, U.; Kulmala, M.; et al. An amorphous solid state of biogenic secondary organic aerosol particles. Nature 2010, 467, 824–827. [Google Scholar] [CrossRef] [PubMed]
- Koop, T.; Bookhold, J.; Shiraiwa, M.; Poschl, U. Glass transition and phase state of organic compounds: Dependency on molecular properties and implications for secondary organic aerosols in the atmosphere. Phys. Chem. Chem. Phys. 2011, 13, 19238–19255. [Google Scholar] [CrossRef] [PubMed]
- Renbaum-Wolff, L.; Grayson, J.W.; Bateman, A.P.; Kuwata, M.; Sellier, M.; Murray, B.J.; Shilling, J.E.; Martin, S.T.; Bertram, A.K. Viscosity of alpha-pinene secondary organic material and implications for particle growth and reactivity. Proc. Natl. Acad. Sci. USA 2013, 110, 8014–8019. [Google Scholar] [CrossRef] [PubMed]
- Shiraiwa, M.; Ammann, M.; Koop, T.; Poschl, U. Gas uptake and chemical aging of semisolid organic aerosol particles. Proc. Natl. Acad. Sci. USA 2011, 108, 11003–11008. [Google Scholar] [CrossRef] [PubMed]
- Lignell, H.; Hinks, M.L.; Nizkorodov, S.A. Exploring matrix effects on photochemistry of organic aerosols. Proc. Natl. Acad. Sci. USA 2014, 111, 13780–13785. [Google Scholar] [CrossRef] [PubMed]
- Zobrist, B.; Marcolli, C.; Pedernera, D.A.; Koop, T. Do atmospheric aerosols form glasses? Atmos. Chem. Phys. 2008, 8, 5221–5244. [Google Scholar] [CrossRef]
- Li, Y.J.; Liu, P.; Gong, Z.; Wang, Y.; Bateman, A.P.; Bergoend, C.; Bertram, A.K.; Martin, S.T. Chemical reactivity and liquid/nonliquid states of secondary organic material. Environ. Sci. Technol. 2015, 49, 13264–13274. [Google Scholar] [CrossRef] [PubMed]
- Pajunoja, A.; Malila, J.; Hao, L.Q.; Joutsensaari, J.; Lehtinen, K.E.J.; Virtanen, A. Estimating the viscosity range of soa particles based on their coalescence time. Aerosol Sci. Technol. 2014, 48, I–IV. [Google Scholar] [CrossRef]
- Saukko, E.; Lambe, A.T.; Massoli, P.; Koop, T.; Wright, J.P.; Croasdale, D.R.; Pedernera, D.A.; Onasch, T.B.; Laaksonen, A.; Davidovits, P.; et al. Humidity-dependent phase state of soa particles from biogenic and anthropogenic precursors. Atmos. Chem. Phys. 2012, 12, 7517–7529. [Google Scholar] [CrossRef] [Green Version]
- Shilling, J.E.; Chen, Q.; King, S.M.; Rosenoern, T.; Kroll, J.H.; Worsnop, D.R.; DeCarlo, P.F.; Aiken, A.C.; Sueper, D.; Jimenez, J.L.; et al. Loading-dependent elemental composition of alpha-pinene soa particles. Atmos. Chem. Phys. 2009, 9, 771–782. [Google Scholar] [CrossRef]
- Grieshop, A.P.; Donahue, N.M.; Robinson, A.L. Is the gas-particle partitioning in alpha-pinene secondary organic aerosol reversible? Geophys. Res. Lett. 2007, 34. [Google Scholar] [CrossRef]
- Chan, M.N.; Chan, A.W.H.; Chhabra, P.S.; Surratt, J.D.; Seinfeld, J.H. Modeling of secondary organic aerosol yields from laboratory chamber data. Atmos. Chem. Phys. 2009, 9, 5669–5680. [Google Scholar] [CrossRef]
- Zhao, B.; Wang, S.; Donahue, N.M.; Chuang, W.; Hildebrandt Ruiz, L.; Ng, N.L.; Wang, Y.; Hao, J. Evaluation of one-dimensional and two-dimensional volatility basis sets in simulating the aging of secondary organic aerosol with smog-chamber experiments. Environ. Sci. Technol. 2015, 49, 2245–2254. [Google Scholar] [CrossRef] [PubMed]
- Harvey, R.M.; Zahardis, J.; Petrucci, G.A. Establishing the contribution of lawn mowing to atmospheric aerosol levels in american suburbs. Atmos. Chem. Phys. 2014, 14, 797–812. [Google Scholar] [CrossRef]
- Jain, S.; Petrucci, G.A. A new method to measure aerosol particle bounce using a cascade electrical low pressure impactor. Aerosol Sci. Technol. 2015, 49, 390–399. [Google Scholar] [CrossRef]
- Geddes, S.; Nichols, B.; Flemer, S.; Eisenhauer, J.; Zahardis, J.; Petrucci, G.A. Near-infrared laser desorption/ionization aerosol mass spectrometry for investigating primary and secondary organic aerosols under low loading conditions. Anal. Chem. 2010, 82, 7915–7923. [Google Scholar] [CrossRef] [PubMed]
- Hoffmann, T.; Odum, J.R.; Bowman, F.; Collins, D.; Klockow, D.; Flagan, R.C.; Seinfeld, J.H. Formation of organic aerosols from the oxidation of biogenic hydrocarbons. J. Atmos. Chem. 1997, 26, 189–222. [Google Scholar] [CrossRef]
- Odum, J.R.; Jungkamp, T.P.W.; Griffin, R.J.; Flagan, R.C.; Seinfeld, J.H. The atmospheric aerosol-forming potential of whole gasoline vapor. Science 1997, 276, 96–99. [Google Scholar] [CrossRef] [PubMed]
- Turpin, B.J.; Lim, H.-J. Species contributions to pm2.5 mass concentrations: Revisiting common assumptions for estimating organic mass. Aerosol Sci. Technol. 2001, 35, 602–610. [Google Scholar] [CrossRef]
- Pathak, R.K.; Stanier, C.O.; Donahue, N.M.; Pandis, S.N. Ozonolysis of α-pinene at atmospherically relevant concentrations: Temperature dependence of aerosol mass fractions (yields). J. Geophys. Res. Atmos. 2007, 112, D03201. [Google Scholar] [CrossRef]
- Nakao, S.; Tang, P.; Tang, X.; Clark, C.H.; Qi, L.; Seo, E.; Asa-Awuku, A.; Cocker, D. Density and elemental ratios of secondary organic aerosol: Application of a density prediction method. Atmos. Environ. 2013, 68, 273–277. [Google Scholar] [CrossRef]
- Virtanen, A.; Marjamäki, M.; Ristimäki, J.; Keskinen, J. Fine particle losses in electrical low-pressure impactor. J. Aerosol Sci. 2001, 32, 389–401. [Google Scholar] [CrossRef]
- Järvinen, A.; Aitomaa, M.; Rostedt, A.; Keskinen, J.; Yli-Ojanperä, J. Calibration of the new electrical low pressure impactor (ELPI+). J. Aerosol Sci. 2014, 69, 150–159. [Google Scholar] [CrossRef]
- Kolesar, K.R.; Chen, C.; Johnson, D.; Cappa, C.D. The influences of mass loading and rapid dilution of secondary organic aerosol on particle volatility. Atmos. Chem. Phys. 2015, 15, 9327–9343. [Google Scholar] [CrossRef]
- King, S.M.; Rosenoern, T.; Shilling, J.E.; Chen, Q.; Martin, S.T. Increased cloud activation potential of secondary organic aerosol for atmospheric mass loadings. Atmos. Chem. Phys. 2009, 9, 2959–2971. [Google Scholar] [CrossRef]
- Gao, Y.Q.; Hall, W.A.; Johnston, M.V. Molecular composition of monoterpene secondary organic aerosol at low mass loading. Environ. Sci. Technol. 2010, 44, 7897–7902. [Google Scholar] [CrossRef] [PubMed]
- Pfaffenberger, L.; Barmet, P.; Slowik, J.G.; Praplan, A.P.; Dommen, J.; Prevot, A.S.H.; Baltensperger, U. The link between organic aerosol mass loading and degree of oxygenation: An alpha-pinene photooxidation study. Atmos. Chem. Phys. 2013, 13, 6493–6506. [Google Scholar] [CrossRef]
- Hosny, N.A.; Fitzgerald, C.; Vysniauskas, A.; Athanasiadis, A.; Berkemeier, T.; Uygur, N.; Poschl, U.; Shiraiwa, M.; Kalberer, M.; Pope, F.D.; et al. Direct imaging of changes in aerosol particle viscosity upon hydration and chemical aging. Chem. Sci. 2016, 7, 1357–1367. [Google Scholar] [CrossRef]
- Booth, A.M.; Murphy, B.; Riipinen, I.; Percival, C.J.; Topping, D.O. Connecting bulk viscosity measurements to kinetic limitations on attaining equilibrium for a model aerosol composition. Environ. Sci. Technol. 2014, 48, 9298–9305. [Google Scholar] [CrossRef] [PubMed]
- Finlayson-Pitts, B.J. Reactions at surfaces in the atmosphere: Integration of experiments and theory as necessary (but not necessarily sufficient) for predicting the physical chemistry of aerosols. Phys. Chem. Chem. Phys. 2009, 11, 7760–7779. [Google Scholar] [CrossRef] [PubMed]
- Shiraiwa, M.; Yee, L.D.; Schilling, K.A.; Loza, C.L.; Craven, J.S.; Zuend, A.; Ziemann, P.J.; Seinfeld, J.H. Size distribution dynamics reveal particle-phase chemistry in organic aerosol formation. Proc. Natl. Acad. Sci. USA 2013, 110, 11746–11750. [Google Scholar] [CrossRef] [PubMed]
- Kundu, S.; Fisseha, R.; Putman, A.L.; Rahn, T.A.; Mazzoleni, L.R. High molecular weight soa formation during limonene ozonolysis: Insights from ultrahigh-resolution ft-icr mass spectrometry characterization. Atmos. Chem. Phys. 2012, 12, 5523–5536. [Google Scholar] [CrossRef]
- Bateman, A.P.; Nizkorodov, S.A.; Laskin, J.; Laskin, A. Time-resolved molecular characterization of limonene/ozone aerosol using high-resolution electrospray ionization mass spectrometry. Phys. Chem. Chem. Phys. 2009, 11, 7931–7942. [Google Scholar] [CrossRef] [PubMed]
- Wilson, J.; Imre, D.; Beranek, J.; Shrivastava, M.; Zelenyuk, A. Evaporation kinetics of laboratory-generated secondary organic aerosols at elevated relative humidity. Environ. Sci. Technol. 2015, 49, 243–249. [Google Scholar] [CrossRef] [PubMed]
- Maksymiuk, C.S.; Gayahtri, C.; Gil, R.R.; Donahue, N.M. Secondary organic aerosol formation from multiphase oxidation of limonene by ozone: Mechanistic constraints via two-dimensional heteronuclear nmr spectroscopy. Phys. Chem. Chem. Phys. 2009, 11, 7810–7818. [Google Scholar] [CrossRef] [PubMed]
- Kim, H.; Paulson, S.E. Real refractive indices and volatility of secondary organic aerosol generated from photooxidation and ozonolysis of limonene, alpha-pinene and toluene. Atmos. Chem. Phys. 2013, 13, 7711–7723. [Google Scholar] [CrossRef]
- Hamilton, J.F.; Lewis, A.C.; Carey, T.J.; Wenger, J.C.; Garcia, E.B.I.; Munoz, A. Reactive oxidation products promote secondary organic aerosol formation from green leaf volatiles. Atmos. Chem. Phys. 2009, 9, 3815–3823. [Google Scholar] [CrossRef]
- Kleist, E.; Mentel, T.F.; Andres, S.; Bohne, A.; Folkers, A.; Kiendler-Scharr, A.; Rudich, Y.; Springer, M.; Tillmann, R.; Wildt, J. Irreversible impacts of heat on the emissions of monoterpenes, sesquiterpenes, phenolic bvoc and green leaf volatiles from several tree species. Biogeosciences 2012, 9, 5111–5123. [Google Scholar] [CrossRef] [Green Version]
- Jain, S.; Zahardis, J.; Petrucci, G.A. Soft ionization chemical analysis of secondary organic aerosol from green leaf volatiles emitted by turf grass. Environ. Sci. Technol. 2014, 48, 4835–4843. [Google Scholar] [CrossRef] [PubMed]
- Hamilton, J.F.; Lewis, A.C.; Carey, T.J.; Wenger, J.C. Characterization of polar compounds and oligomers in secondary organic aerosol using liquid chromatography coupled to mass spectrometry. Anal. Chem. 2008, 80, 474–480. [Google Scholar] [CrossRef] [PubMed]
- Criegee, R. Mechanism of ozonolysis. Angew. Chem. Int. Ed. 1975, 14, 745–752. [Google Scholar] [CrossRef]
- Grosjean, E.; Grosjean, D. The gas-phase reaction of alkenes with ozone: Formation yields of carbonyls from biradicals in ozone-alkene-cyclohexane experiments. Atmos. Environ. 1998, 32, 3393–3402. [Google Scholar] [CrossRef]
- Horie, O.; Moortgat, G.K. Gas-phase ozonolysis of alkenes. Recent advances in mechanistic investigations. Acc. Chem. Res. 1998, 31, 387–396. [Google Scholar] [CrossRef]
- Johnson, D.; Marston, G. The gas-phase ozonolysis of unsaturated volatile organic compounds in the troposphere. Chem. Soc. Rev. 2008, 37, 699–716. [Google Scholar] [CrossRef] [PubMed]
- Vereecken, L.; Francisco, J.S. Theoretical studies of atmospheric reaction mechanisms in the troposphere. Chem. Soc. Rev. 2012, 41, 6259–6293. [Google Scholar] [CrossRef] [PubMed]
- Bones, D.L.; Reid, J.P.; Lienhard, D.M.; Krieger, U.K. Comparing the mechanism of water condensation and evaporation in glassy aerosol. Proc. Natl. Acad. Sci. USA 2012, 109, 11613–11618. [Google Scholar] [CrossRef] [PubMed]
- Hodas, N.; Zuend, A.; Mui, W.; Flagan, R.C.; Seinfeld, J.H. Influence of particle-phase state on the hygroscopic behavior of mixed organic-inorganic aerosols. Atmos. Chem. Phys. 2015, 15, 5027–5045. [Google Scholar] [CrossRef]
- Shiraiwa, M.; Seinfeld, J.H. Equilibration timescale of atmospheric secondary organic aerosol partitioning. Geophys. Res. Lett. 2012, 39, L24801. [Google Scholar] [CrossRef]
Figure 1.
Calculated bounce factor (BF) for α-pinene derived secondary organic aerosol (SOA) as a function of time. Colors indicate different CSOA as shown in Table 1.
Figure 1.
Calculated bounce factor (BF) for α-pinene derived secondary organic aerosol (SOA) as a function of time. Colors indicate different CSOA as shown in Table 1.

Figure 2.
Calculated maximum BF for α-pinene derived SOA as a function of CSOA. Error bars represent 1 standard deviation.
Figure 2.
Calculated maximum BF for α-pinene derived SOA as a function of CSOA. Error bars represent 1 standard deviation.

Figure 3.
Calculated maximum BF for limonene derived SOA as a function of CSOA. Error bars represent 1 standard deviation.
Figure 3.
Calculated maximum BF for limonene derived SOA as a function of CSOA. Error bars represent 1 standard deviation.
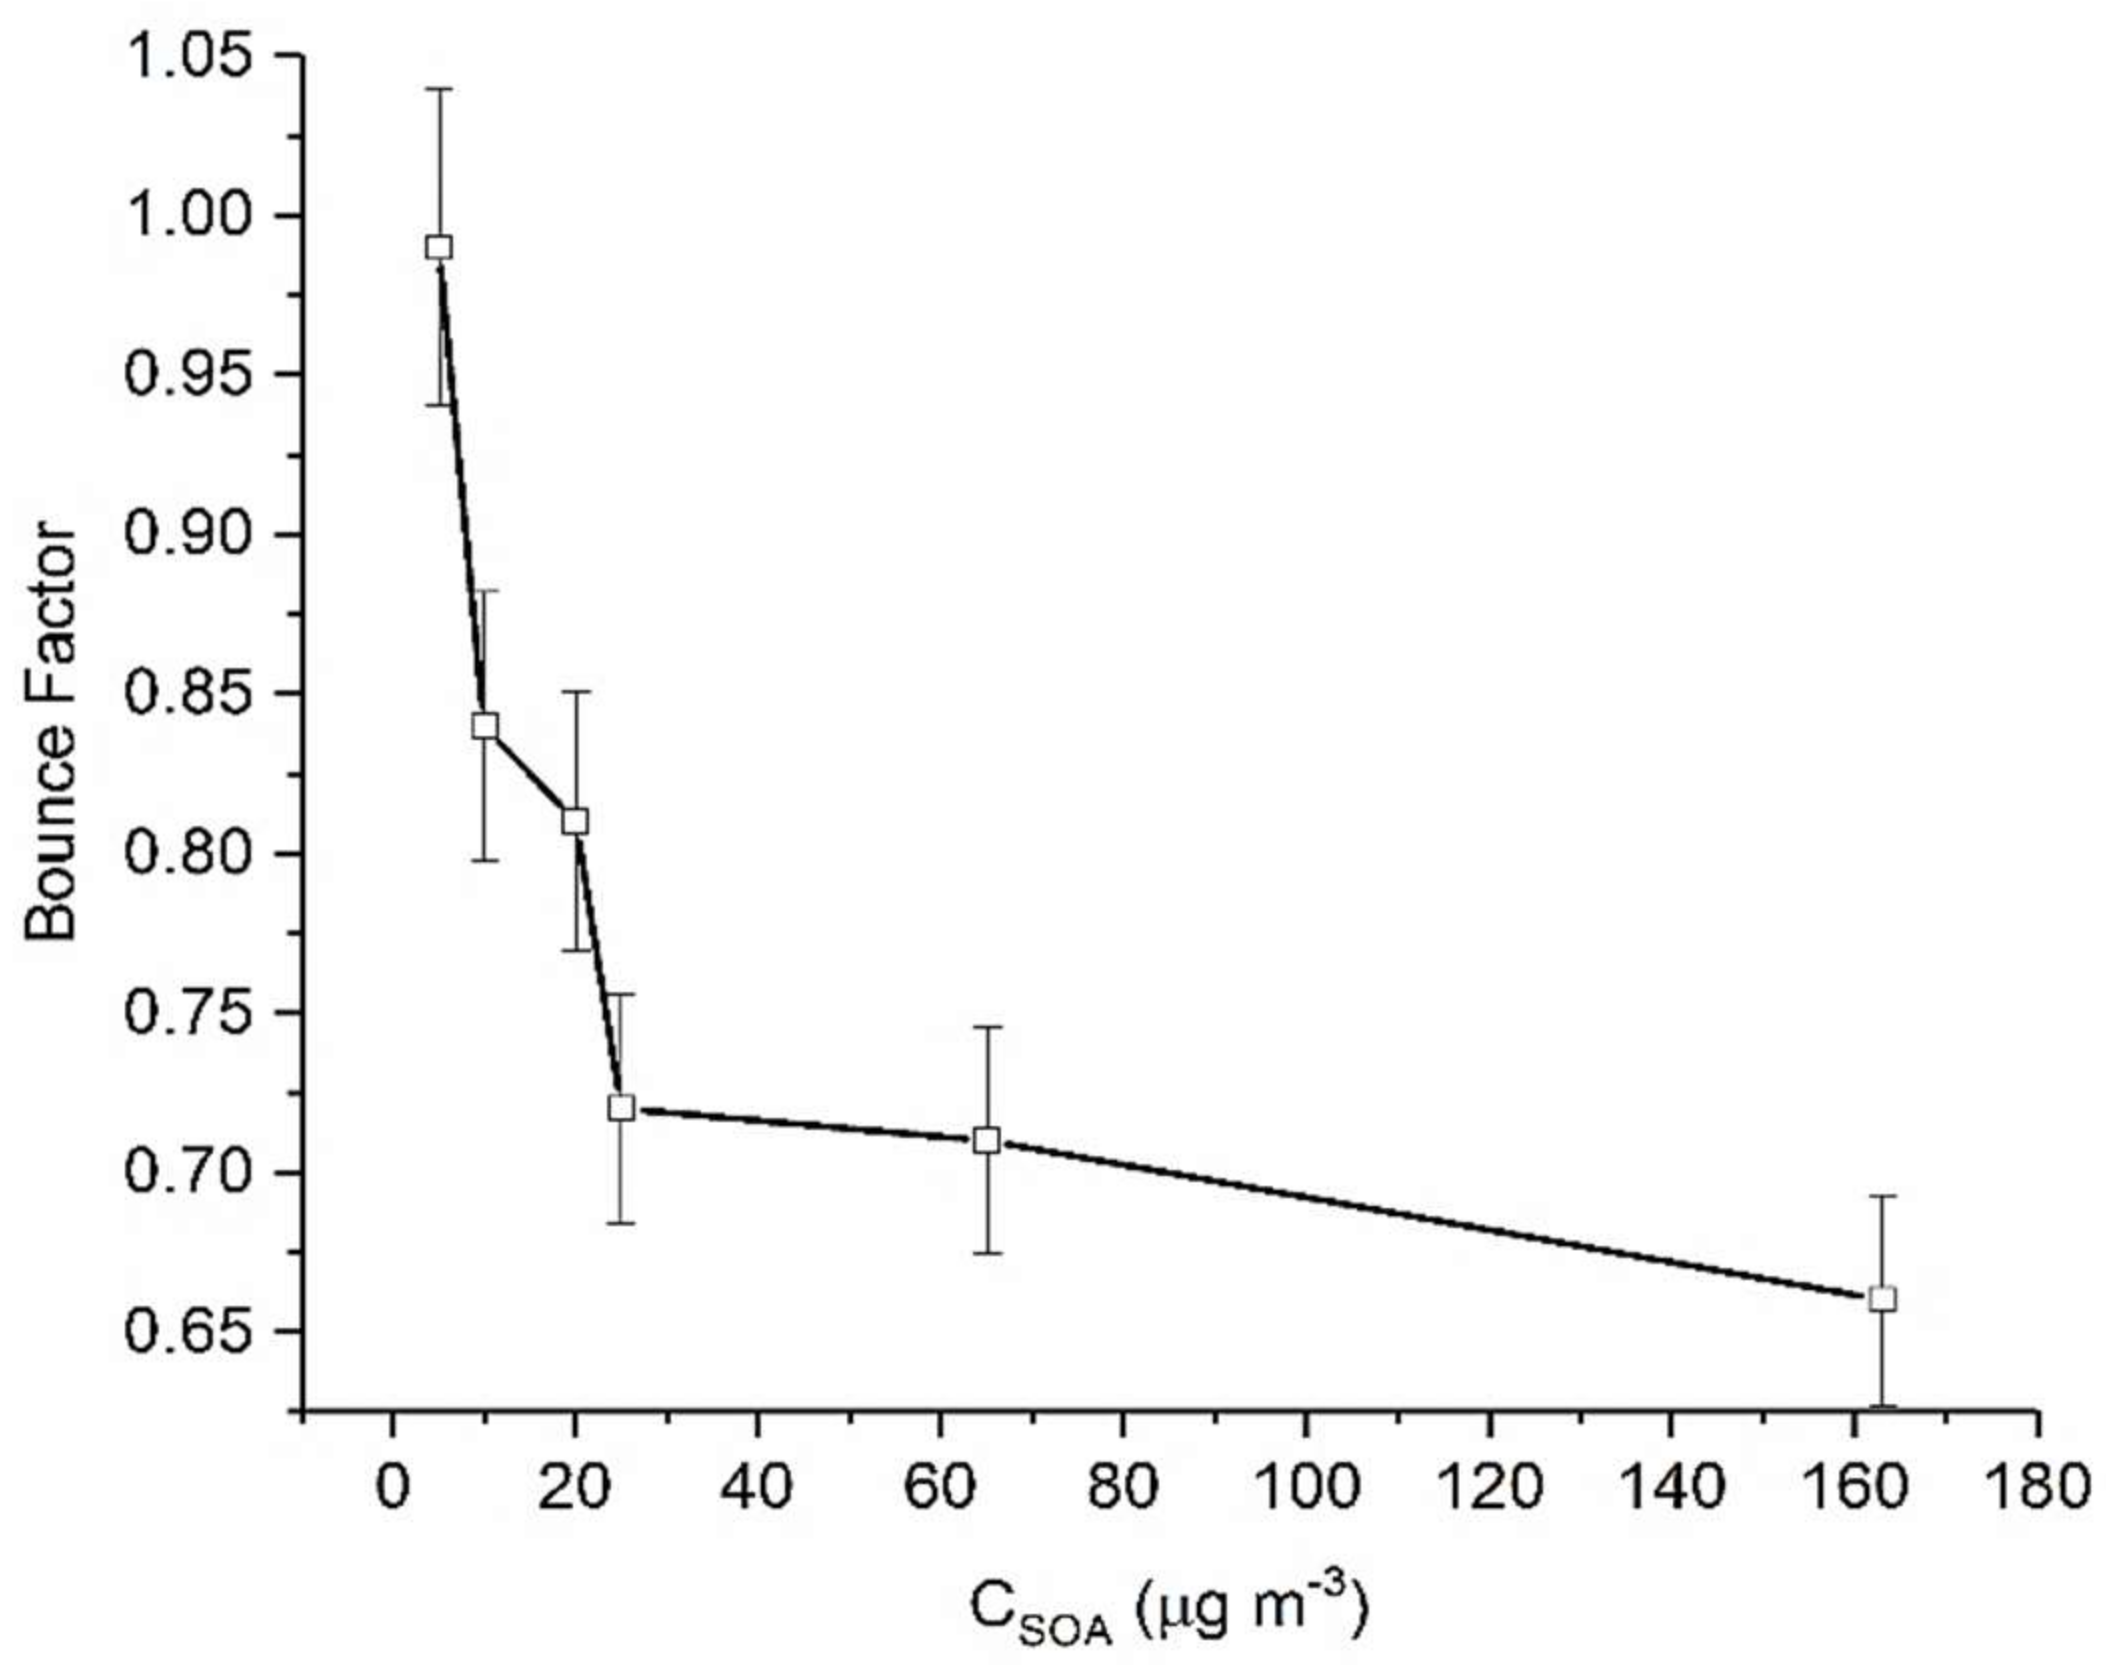
Figure 4.
Calculated maximum BF for HXL (cis-3-Hexen-1-ol) and CHA (cis-3-Hexenyl Acetate) derived SOA as a function of CSOA. Error bars represent 1 standard deviation.
Figure 4.
Calculated maximum BF for HXL (cis-3-Hexen-1-ol) and CHA (cis-3-Hexenyl Acetate) derived SOA as a function of CSOA. Error bars represent 1 standard deviation.

Table 1.
Summary of experimental conditions. VOC: volatile organic compounds; RH: relative humidity.
Table 1.
Summary of experimental conditions. VOC: volatile organic compounds; RH: relative humidity.
| Parent VOC | Code | VOC (µL) | VOC (ppbv) | Ozone (ppbv) | RH (%) | CSOA Max (µg m−3) |
|---|---|---|---|---|---|---|
 | AP1 | 1 | 20 | 25 | 23 | 0.25 |
| AP2 | 1 | 20 | 58 | 22 | 2 | |
| AP3 | 3 | 60 | 58 | 21 | 4.5 | |
| AP4 | 5 | 100 | 89 | 21 | 8 | |
| AP5 | 3 | 60 | 57 | 22 | 10 | |
| AP6 | 5 | 100 | 58 | 23 | 28 | |
| AP7 | 10 | 200 | 77 | 21 | 36 | |
| AP8 | 10 | 200 | 200 | 21 | 70 | |
| AP9 | 10 | 200 | 550 | 23 | 82 | |
 | L1 | 1 | 20 | 12 | 23 | 5 |
| L2 | 2.5 | 50 | 13 | 23 | 10 | |
| L3 | 5 | 100 | 13 | 23 | 20 | |
| L4 | 2.5 | 50 | 47 | 25 | 25 | |
| L5 | 2.5 | 50 | 160 | 24 | 65 | |
| L6 | 5 | 100 | 235 | 23 | 163 | |
 | CHA1 | 40 | 750 | 280 | 20 | 1.6 |
| CHA2 | 50 | 1000 | 280 | 22 | 3 | |
| CHA3 | 40 | 750 | 420 | 21 | 10.5 | |
| CHA4 | 50 | 1000 | 990 | 22 | 25 | |
| CHA5 | 40 | 750 | 620 | 21 | 41 | |
 | HXL1 | 13 | 350 | 195 | 22 | 3 |
| HXL2 | 25 | 670 | 200 | 20 | 12 | |
| HXL3 | 13 | 350 | 350 | 21 | 15 | |
| HXL4 | 25 | 670 | 350 | 22 | 37 | |
| HXL5 | 25 | 670 | 600 | 19 | 82 |
© 2018 by the authors. Licensee MDPI, Basel, Switzerland. This article is an open access article distributed under the terms and conditions of the Creative Commons Attribution (CC BY) license (http://creativecommons.org/licenses/by/4.0/).
Share and Cite
MDPI and ACS Style
Jain, S.; Fischer, K.B.; Petrucci, G.A. The Influence of Absolute Mass Loading of Secondary Organic Aerosols on Their Phase State. Atmosphere 2018, 9, 131. https://doi.org/10.3390/atmos9040131
AMA Style
Jain S, Fischer KB, Petrucci GA. The Influence of Absolute Mass Loading of Secondary Organic Aerosols on Their Phase State. Atmosphere. 2018; 9(4):131. https://doi.org/10.3390/atmos9040131
Chicago/Turabian StyleJain, Shashank, Kevin B. Fischer, and Giuseppe A. Petrucci. 2018. "The Influence of Absolute Mass Loading of Secondary Organic Aerosols on Their Phase State" Atmosphere 9, no. 4: 131. https://doi.org/10.3390/atmos9040131
Note that from the first issue of 2016, this journal uses article numbers instead of page numbers. See further details here.