Article

Variation of Indoor Particulate Matter Concentrations and Association with Indoor/Outdoor Temperature: A Case Study in Rural Limpopo, South Africa

1
Environment and Health Research Unit, South African Medical Research Council, Johannesburg 2090, South Africa
2
Unit for Environmental Sciences and Management, North West University, Potchefstroom 2520, South Africa
3
Environment and Health Research Unit, South African Medical Research Council, Private Bag x385, Pretoria 0001, South Africa
4
Department of Geography, Geoinformatics and Meteorology, University of Pretoria, Private Bag X20, Hatfield, Pretoria 0001, South Africa
*
Author to whom correspondence should be addressed.
Atmosphere 2018, 9(4), 124; https://doi.org/10.3390/atmos9040124
Submission received: 24 January 2018 / Revised: 20 February 2018 / Accepted: 23 February 2018 / Published: 23 March 2018
(This article belongs to the Special Issue Indoor Air Pollution)

Abstract

:
There is still a pressing concern regarding the causes of poor indoor air quality and the consequent effects on health, because people spend a considerable amount of time indoors. Information about seasonal variation and the determinants of particulate matter (PM) concentrations could guide the design and implementation of intervention strategies. This study was conducted in Giyani, Limpopo province, South Africa. The main aim was to assess indoor air quality. Indoor PM and temperature were monitored to describe seasonal and diurnal patterns of indoor PM4 concentration and to estimate the association between PM concentrations and indoor as well as ambient conditions. Indoor PM4 was monitored hourly in kitchens for the duration of spring (September), summer (February) and winter (July). Indoor temperatures were monitored hourly in kitchens, living rooms and bedrooms. Outdoor temperature and outdoor relative humidity were also monitored for the same period. Indoor temperatures showed a large range in the three sampled seasons, with the maximum values raising the largest cause for concern. Maximum indoor temperatures in summer exceeded the threshold of 35 °C, which has been shown to have adverse health effects. Occupants of the sampled households were exposed to indoor PM4 concentrations that exceeded national and international guidelines. Hourly indoor temperature was statistically significantly correlated to PM4 concentrations in the summer and spring (r = 0.22 and 0.24 respectively, p < 0.001 for both) and negatively correlated to outdoor relative humidity (r = −0.27, p < 0.001). Diurnal PM4 variations showed pronounced patterns with morning and evening peaks. PM4 was consistently higher throughout the day in summer compared to spring and winter. Community-based intervention strategies should consider these seasonal differences in PM4 exposure and tailor awareness messages for exposure prevention accordingly.

1. Introduction

The burning of wood, charcoal, animal dung and crop wastes to fulfill primary energy requirements is common around the world, with approximately 2.4 billion people relying on these solid fuels for their daily domestic requirements [1]. South Africa is no exception, with the national census data showing that at least 4,502,709 people use wood, coal or animal dung (also referred to as biomass fuel) as fuel for domestic cooking and space heating. A substantial proportion (26%) of these citizens reside in Limpopo province where wood is the most commonly used fuel for both cooking and space heating. Table 1 describes the proportions of people in Limpopo Province classified according to the sources of energy or fuel used for cooking and space heating as recorded in 2011 during the last national census.
During combustion, solid fuels release high concentrations of particulate matter (PM), carbon monoxide (CO), hydrocarbons, oxygenated organics, free radicals and chlorinated organics, which affect indoor environmental air quality [2,3,4]. The PM component of smoke released from burning biofuels is classified according to its aerodynamic diameter into size fractions such as PM10 (particles ≤ 10 μm), PM4 (particles ≤ 4 μm), PM2.5 (particles ≤ 2.5) and PM1, which consists of ultrafine particles which are ≤ 1 μm in size [5].
The concentration of PM in homes is dependent on various factors including building structure, types of human activities, the opening and closing of doors and meteorological factors such as temperature, wind, rainfall and humidity [6]. Differences in temperature indoors and outdoors influence natural ventilation through the movement of air. A higher rate of air exchange dilutes the concentration of PM generated indoors [6]. Changes in temperature also affect PM by influencing the change of chemical reaction rates and atmospheric mixing heights that affect the vertical dispersion of pollutants and modifying local wind and flow patterns that control the transportation of pollutants [7].
Studies conducted in rural areas have shown that the use of wood and/or coal for cooking or heating can be a significant source of particulate matter inside homes [8,9]. PM10 in homes that use biomass fuel was found to be 10–70 times above ambient concentrations observed in some of the world’s most polluted cities [10]. Therefore, poor indoor air quality due to the combustion of biomass or fossil fuels can pose significant health risks due to exposure to increased levels of pollutants such as particulate matter [11].
Indoor conditions represent an important micro-environment because of the amount of time people spend in this space. Therefore, the main aim of this study was to assess indoor air quality in a rural setting among houses in Giyani, Limpopo Province, South Africa. Indoor PM4 concentrations (known as the thoracic fraction of inhaled particles), indoor and outdoor temperature were monitored during spring, summer and winter. The objectives were to (1) assess the indoor temperatures and PM that household occupants are exposed to; (2) describe seasonal and diurnal patterns of indoor PM4 concentration; and (3) estimate the association between PM concentrations and indoor as well as ambient temperature and relative humidity conditions.
The case study approach was applied to test the methods for a larger study that will include seasonal and spatial variability in four villages over two years. The findings reported here will be useful for the larger study, as well as several other studies presently underway across the country, for example, in Umlazi (KwaZulu-Natal Province) and Agincourt (Mpumalanga Province).

2. Materials and Methods
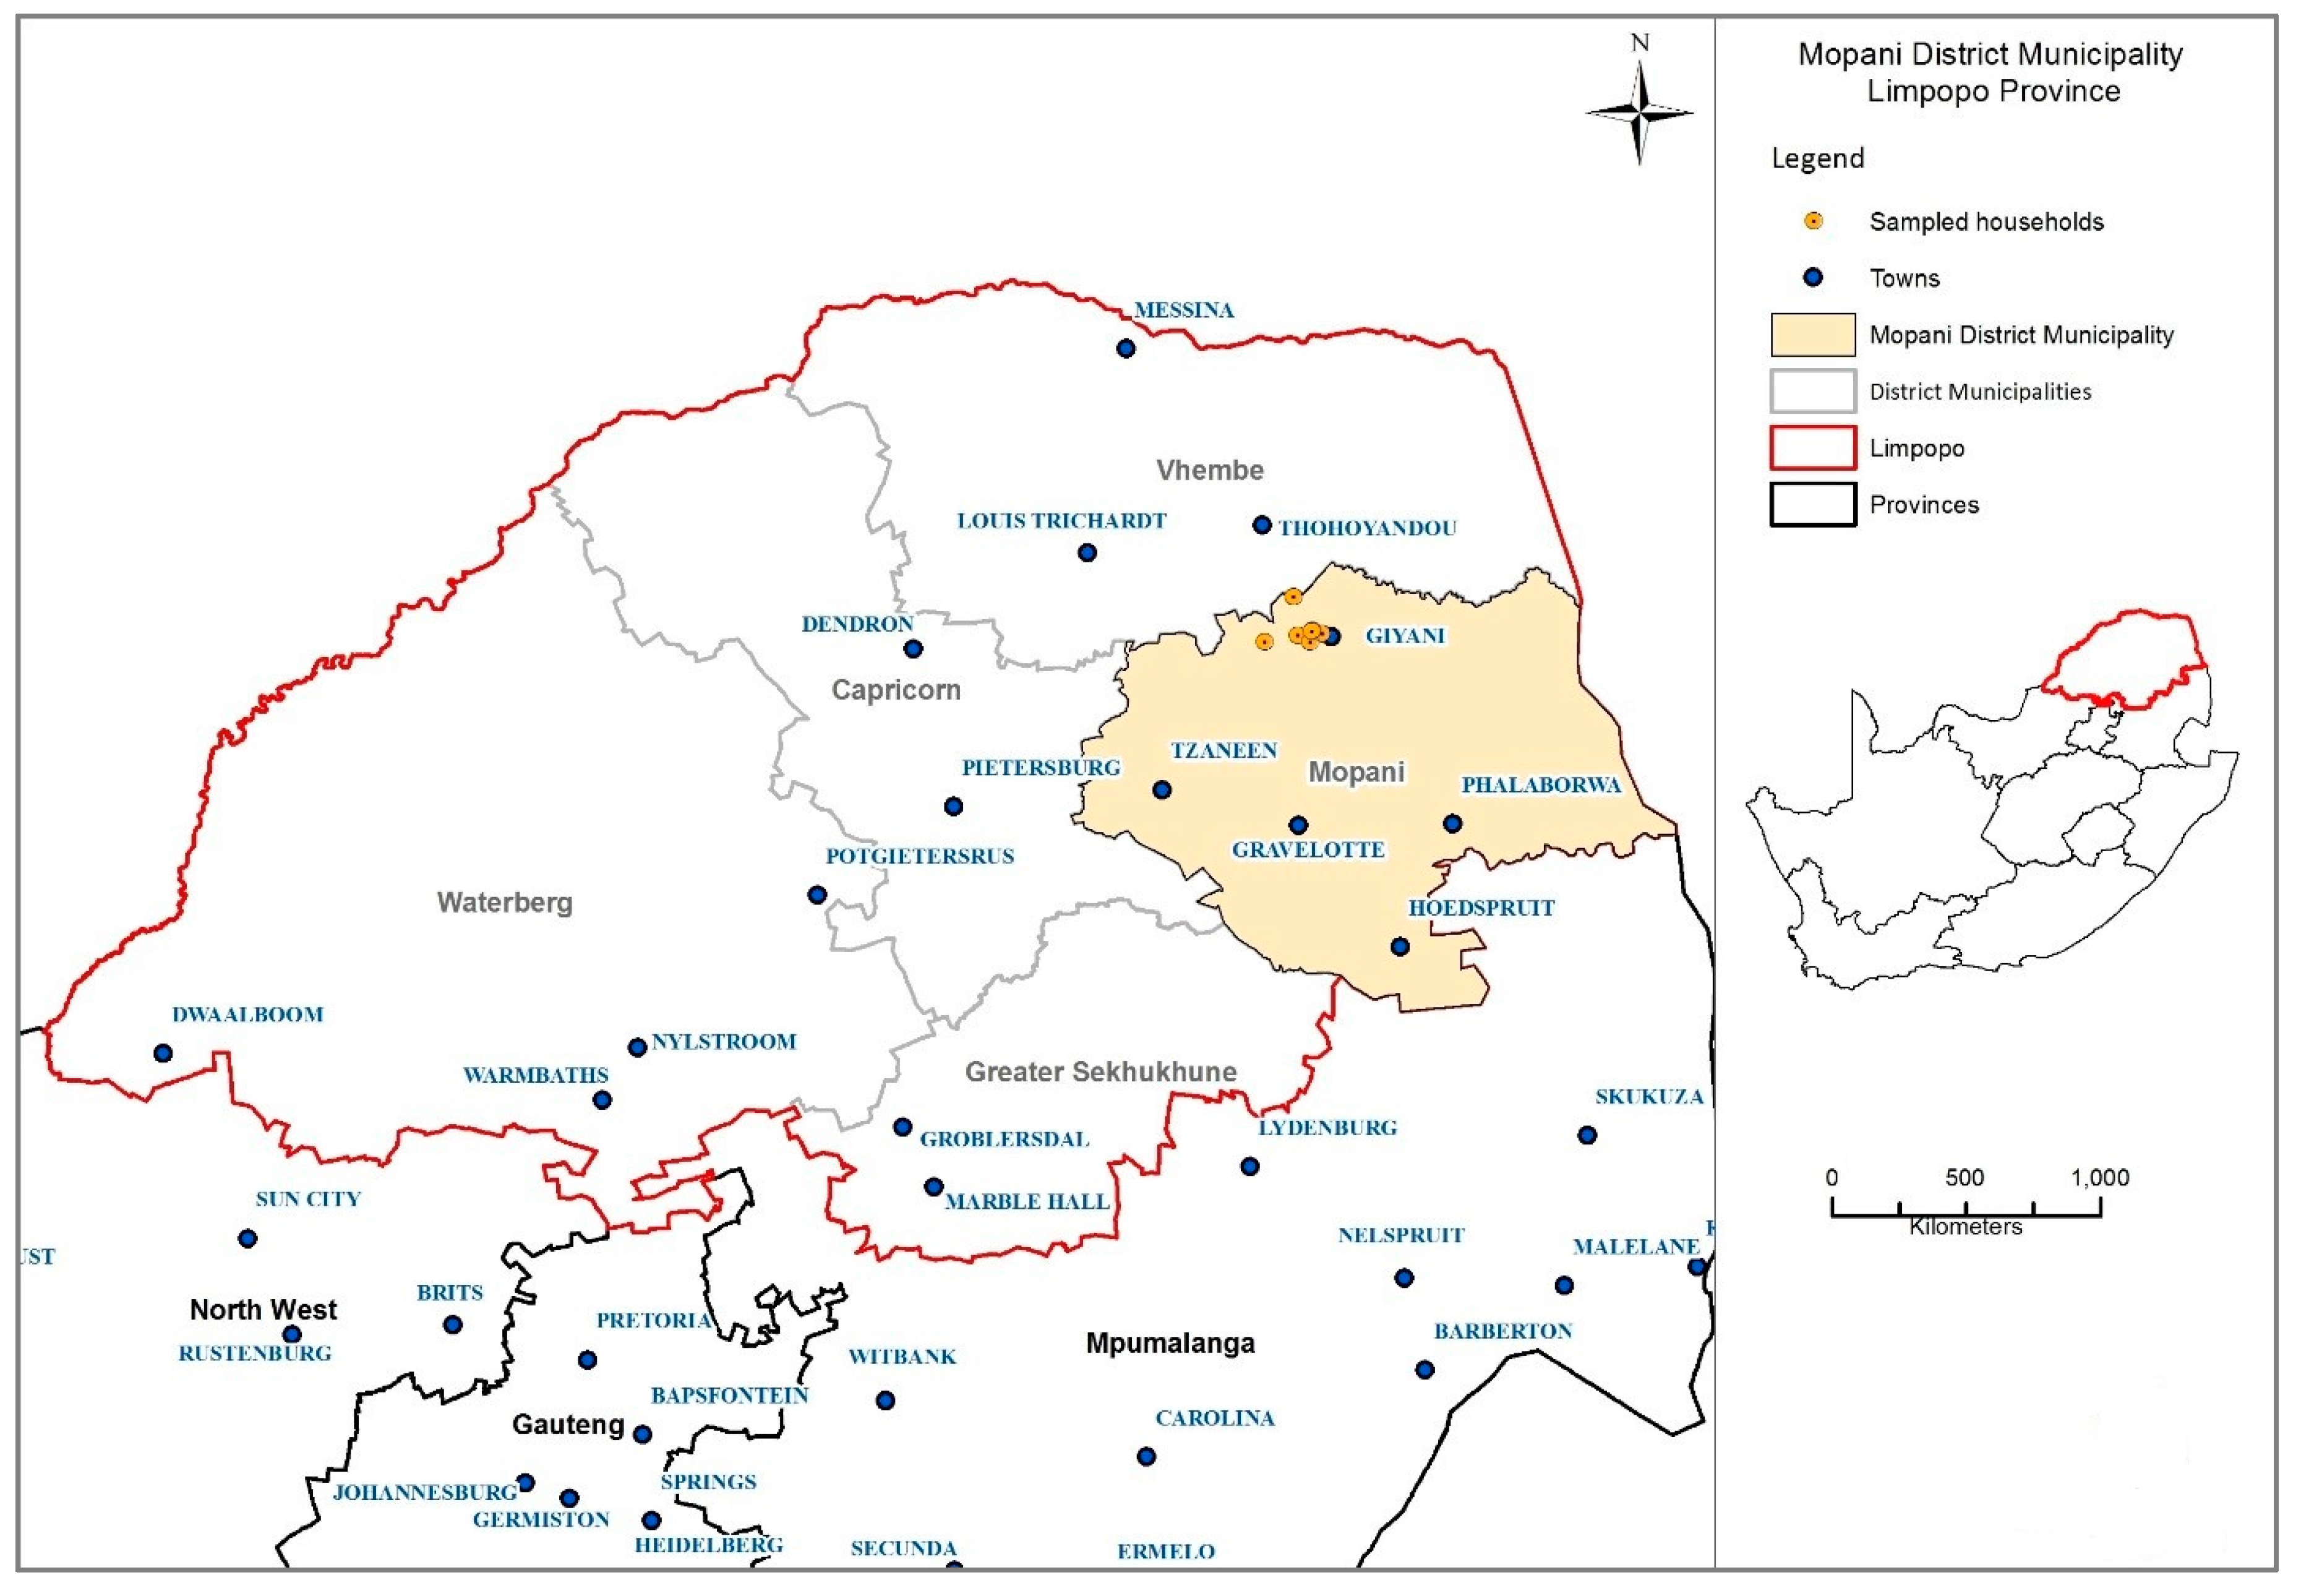
2.1. Study Site

The study was conducted in Giyani, a predominately rural town in the Mopani District, Limpopo Province of South Africa. The district has five sub-districts known as local municipalities, namely Greater Tzaneen, Greater Giyani, Greater Letaba, Maruleng and Ba-Phalaborwa. This study is one component of a larger project focused on determining environmental health in four villages in Limpopo. Air pollution, specifically indoor air pollution, is a major environment-related health threat due to the associated health risks of exposure. The four villages in the study are Tomu, Ka-Siyandani, Ka-Maswanganyi and Dzingidzingi. Two houses from each village were included in this air quality study (Figure 1). The households in Ka-Maswanganyi were sampled over three seasons (spring 2016, summer and winter 2017) while the households in the remaining three villages were sampled over two seasons (summer and winter 2017).

2.2. Household Questionnaire

In July 2017, a household survey was conducted as part of the larger project. A total of 408 structured questionnaires were administered to consenting participants representing the households. The responses relevant to the seven households used in this study were extracted from the larger dataset to be reported upon. Residents of the eighth household (located in Dzingidzingi) were unavailable at the time of the survey. The questions and responses are provided in detail in Appendix A. These pertain to type of fuel used for cooking and heating purposes and socio-demographic information.

2.3. Physical Indoor Air Quality Monitoring

Indoor air quality was monitored in spring, summer and winter in Giyani. Photometric light scattering instruments were used to continuously measure the concentration of respirable particulates within the indoor environment of individual households [12,13]. The DustTrak II Model 8530 has a laser with a wavelength of 780 nm, a mass concentration range of 0.001–100 mg·m−3, and a particle size range of 0.1 to ±10 µm. Each instrument was flow calibrated, using a cyclone calibration jar and wet cell Sensidyne Gilian Gilibrator II, to a flow rate of 1.7 L·min−1. This specific flow rate was selected as the instruments were fitted with a 10 mm Nylon Dorr-Oliver Cyclone, which provides a 50% cut size of 4 µm (TSI Inc., Shoreview, MN, USA, 2013, 2014). Prior to the sampling, the instruments underwent zero calibration, flow calibration, filter changes and the cyclones were cleaned. These instruments were placed in the kitchen area of each house (they were not placed in the outside burning hut/kitchen where the household did also have such a facility).
The PM data was combined into a single data set and corrected by a calibration factor of 0.78. The calibration factor was obtained by comparing the continuous measurements to 24-hour gravimetric measurements sampled during the sampling period in the same households. This was done because previous studies that used the DustTrak [14,15,16,17,18,19,20,21,22] for photometric aerosol monitoring have indicated a significant overestimation of the particulate concentrations when compared to a reference gravimetric method. These studies were all conducted in various settings and compared to different reference methods. It is therefore critical to estimate a calibration factor for each monitor within the specific sampling environment.

2.4. Indoor and Outdoor Temperature Measurements

Thermochron iButton loggers were used to measure indoor and outdoor temperature. One logger was placed in the kitchen, bedroom and living room of each house as a representation of the temperature in the indoor environment. Loggers recorded measurements for the duration of spring (15 days in September), summer (23 days in February) and winter (29 days in July). A logging interval of 10 min was selected for each 24-hour period. Loggers were placed at a height of 1.6 m to ensure uniformity of sampling between the houses. Data was collected at the end of each sampling campaign and formatted into a single dataset.

2.5. Household Characteristics

Households in Giyani on average comprise five people. Household characteristics are presented in Appendix A. The most commonly used fuel for cooking was wood (five households) as opposed to electricity (two households). Most homes used wood fires for cooking in the morning (six households) and evening (four households) daily. The majority of households used wood or coal stoves (four households) and fireplaces (three households) to heat their homes during cold weather in winter. Only one household used an electric heater for space heating. None of the households reported using gas or paraffin for cooking or space heating. The eight sampled homes were constructed using bricks and all households were naturally ventilated through windows and doors.

2.6. Data Analysis

Statistical analysis were performed using R (version 3.4.2), a software environment for statistical computing and graphics (R Core Team, 2013). These analyses included descriptive statistics as well as exploring seasonal and diurnal variations. Pearson’s correlation coefficient (r) was used to assess the relationship between PM4 concentration and indoor and outdoor temperature and outdoor relative humidity.

3. Results

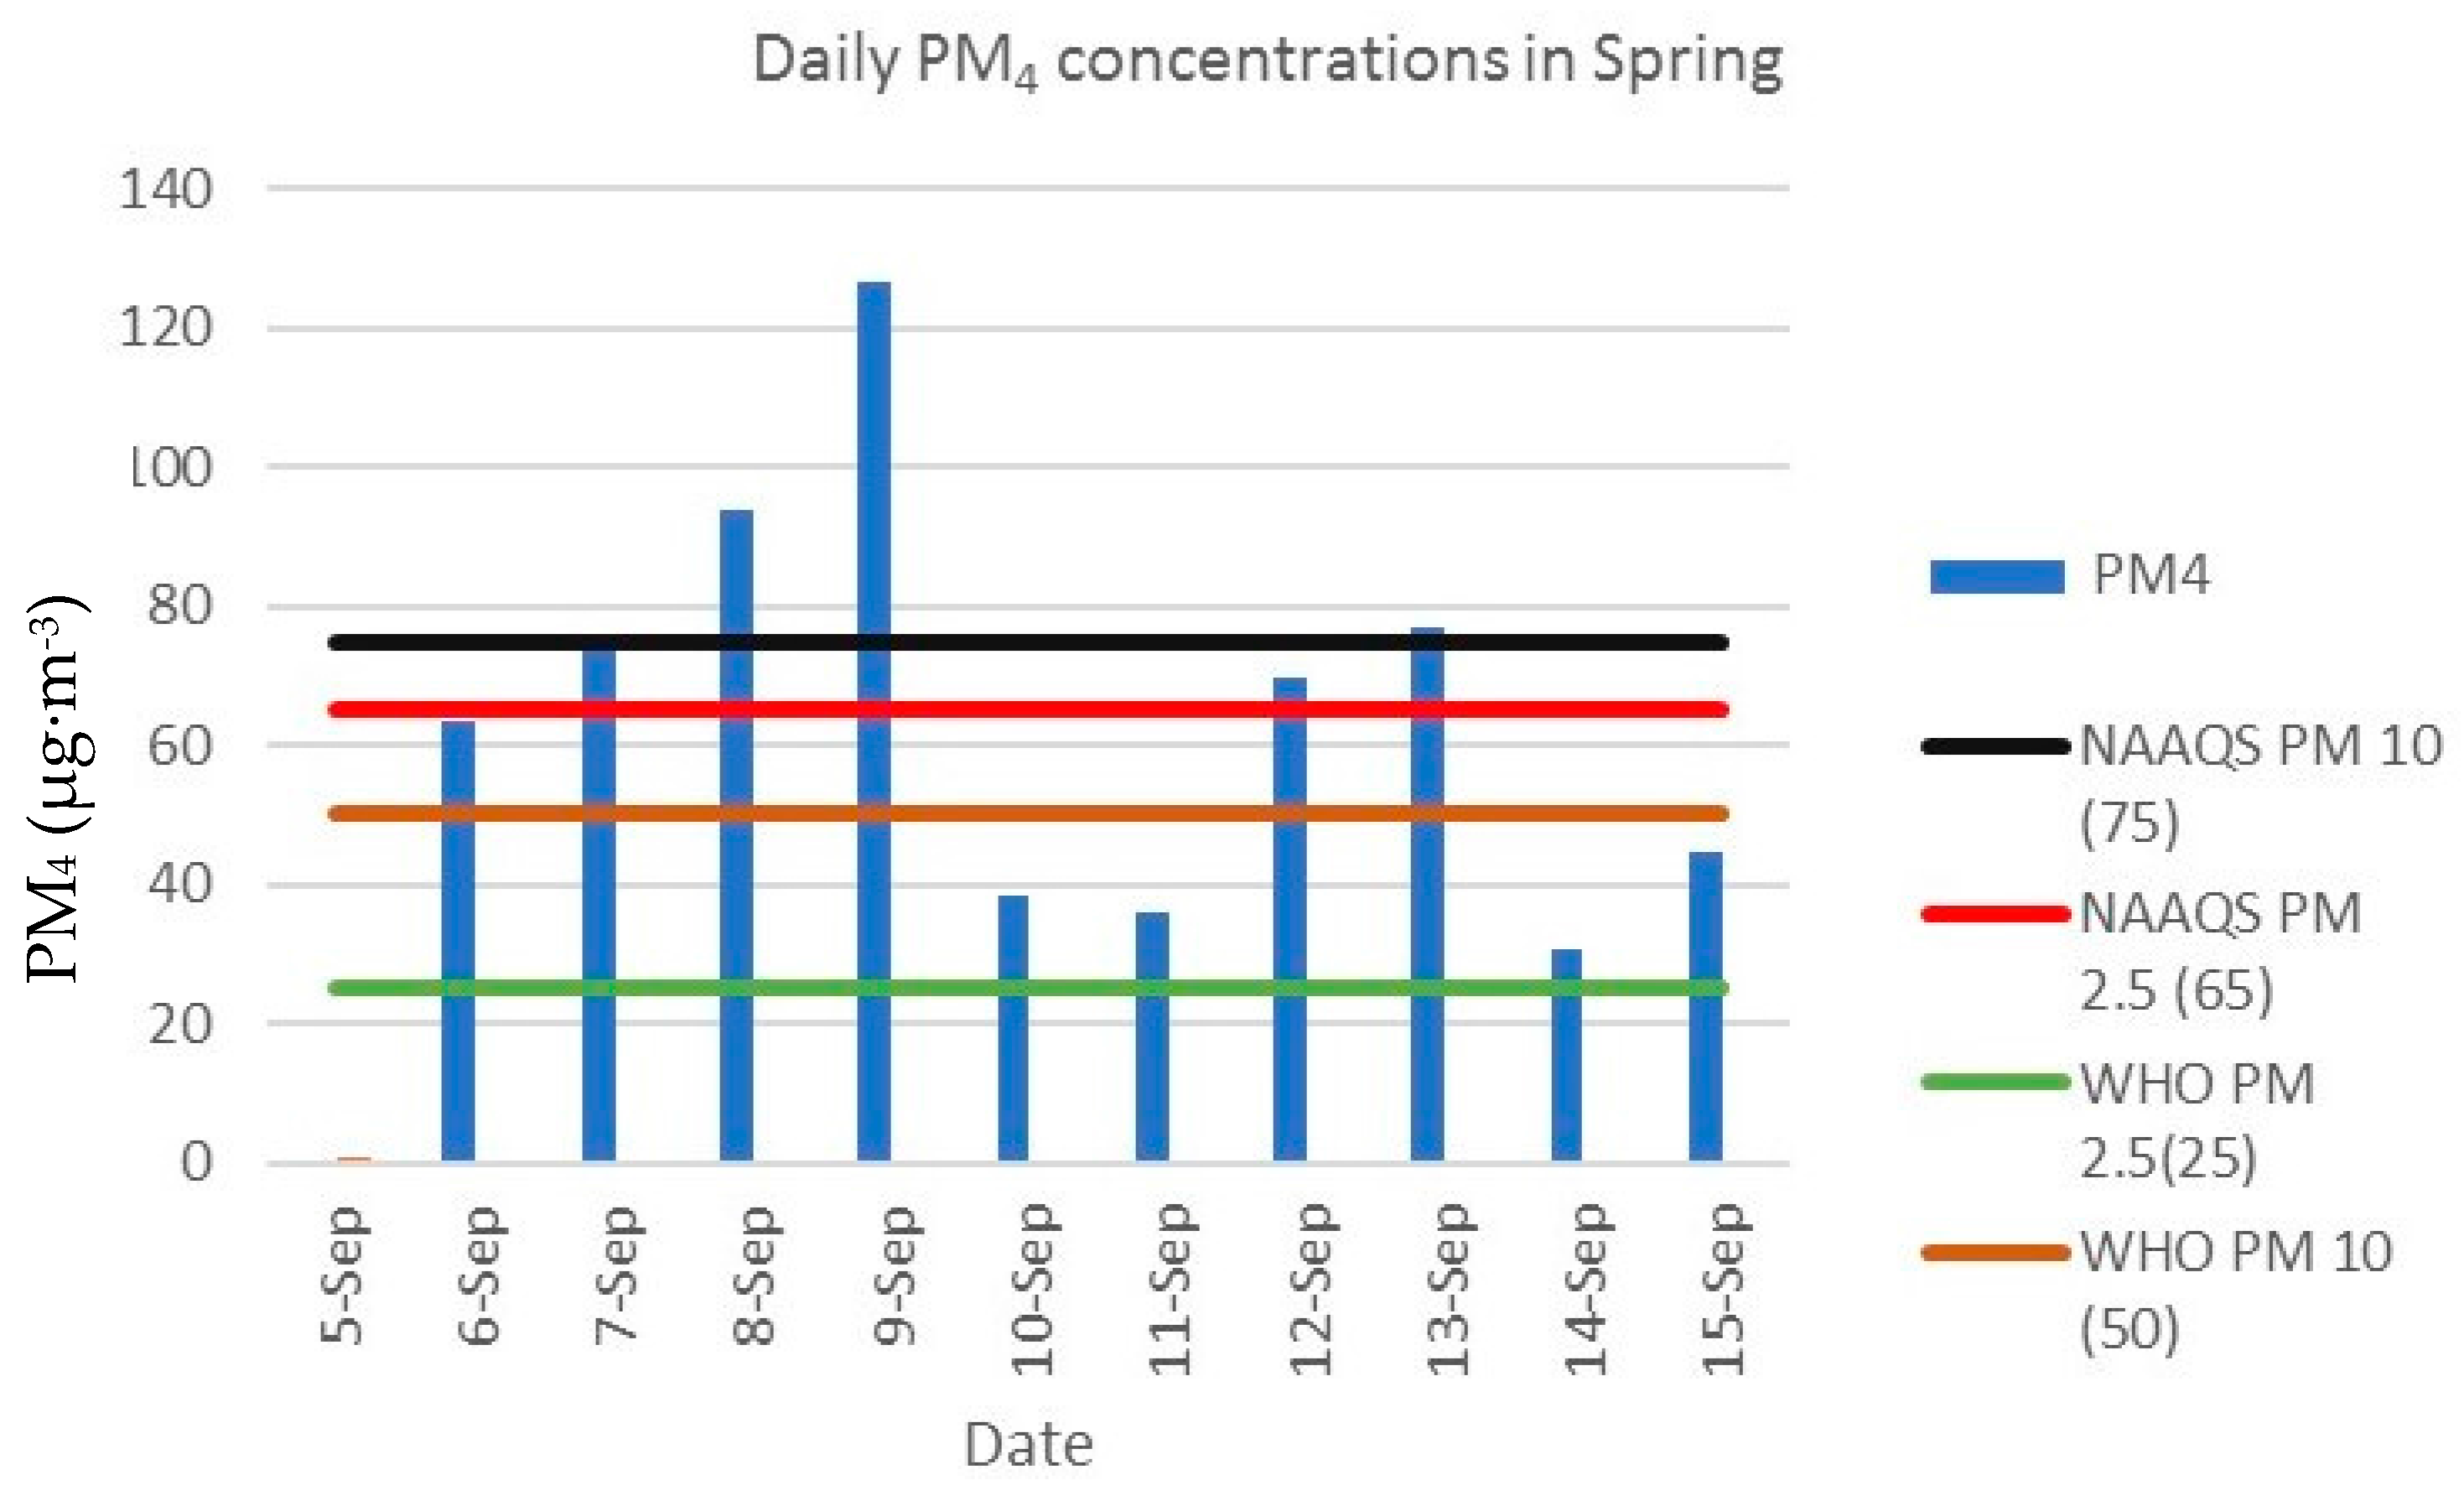
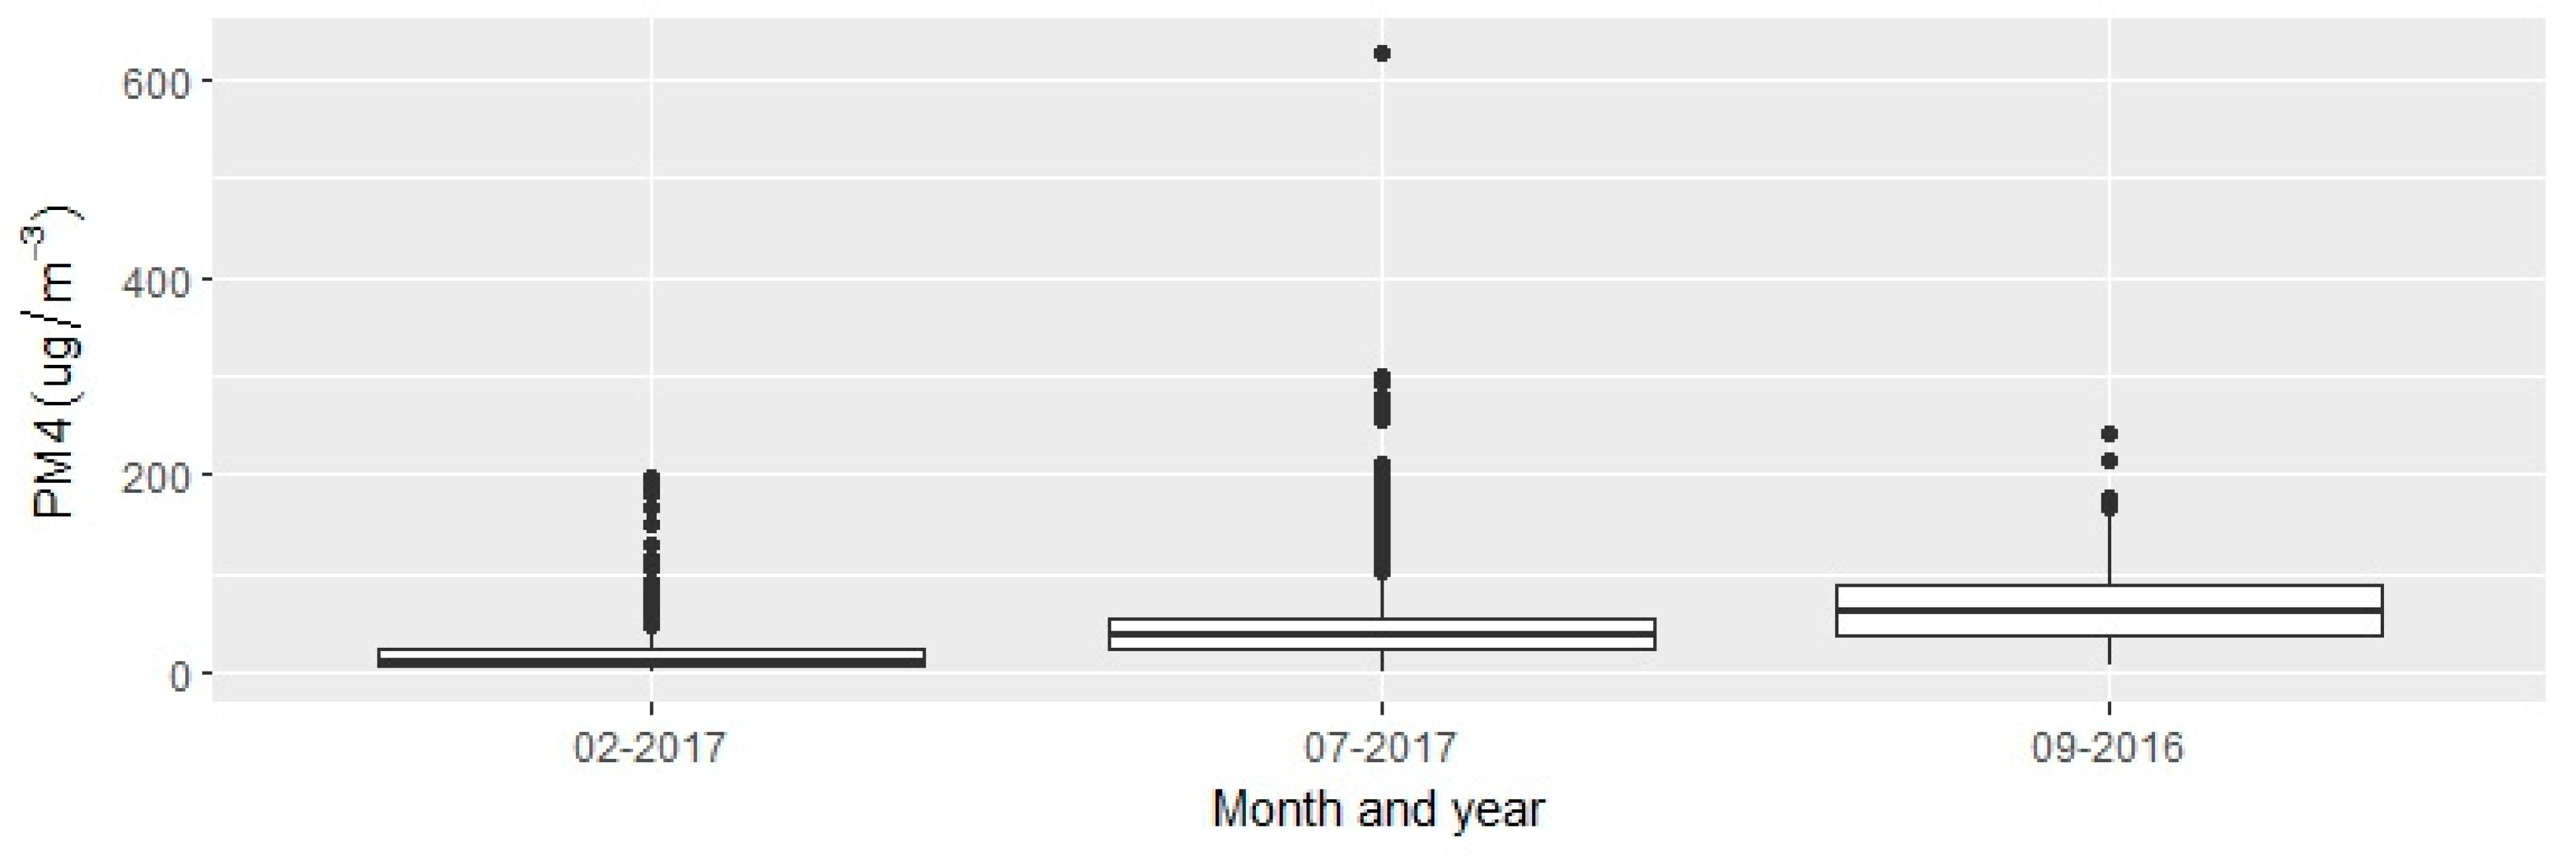
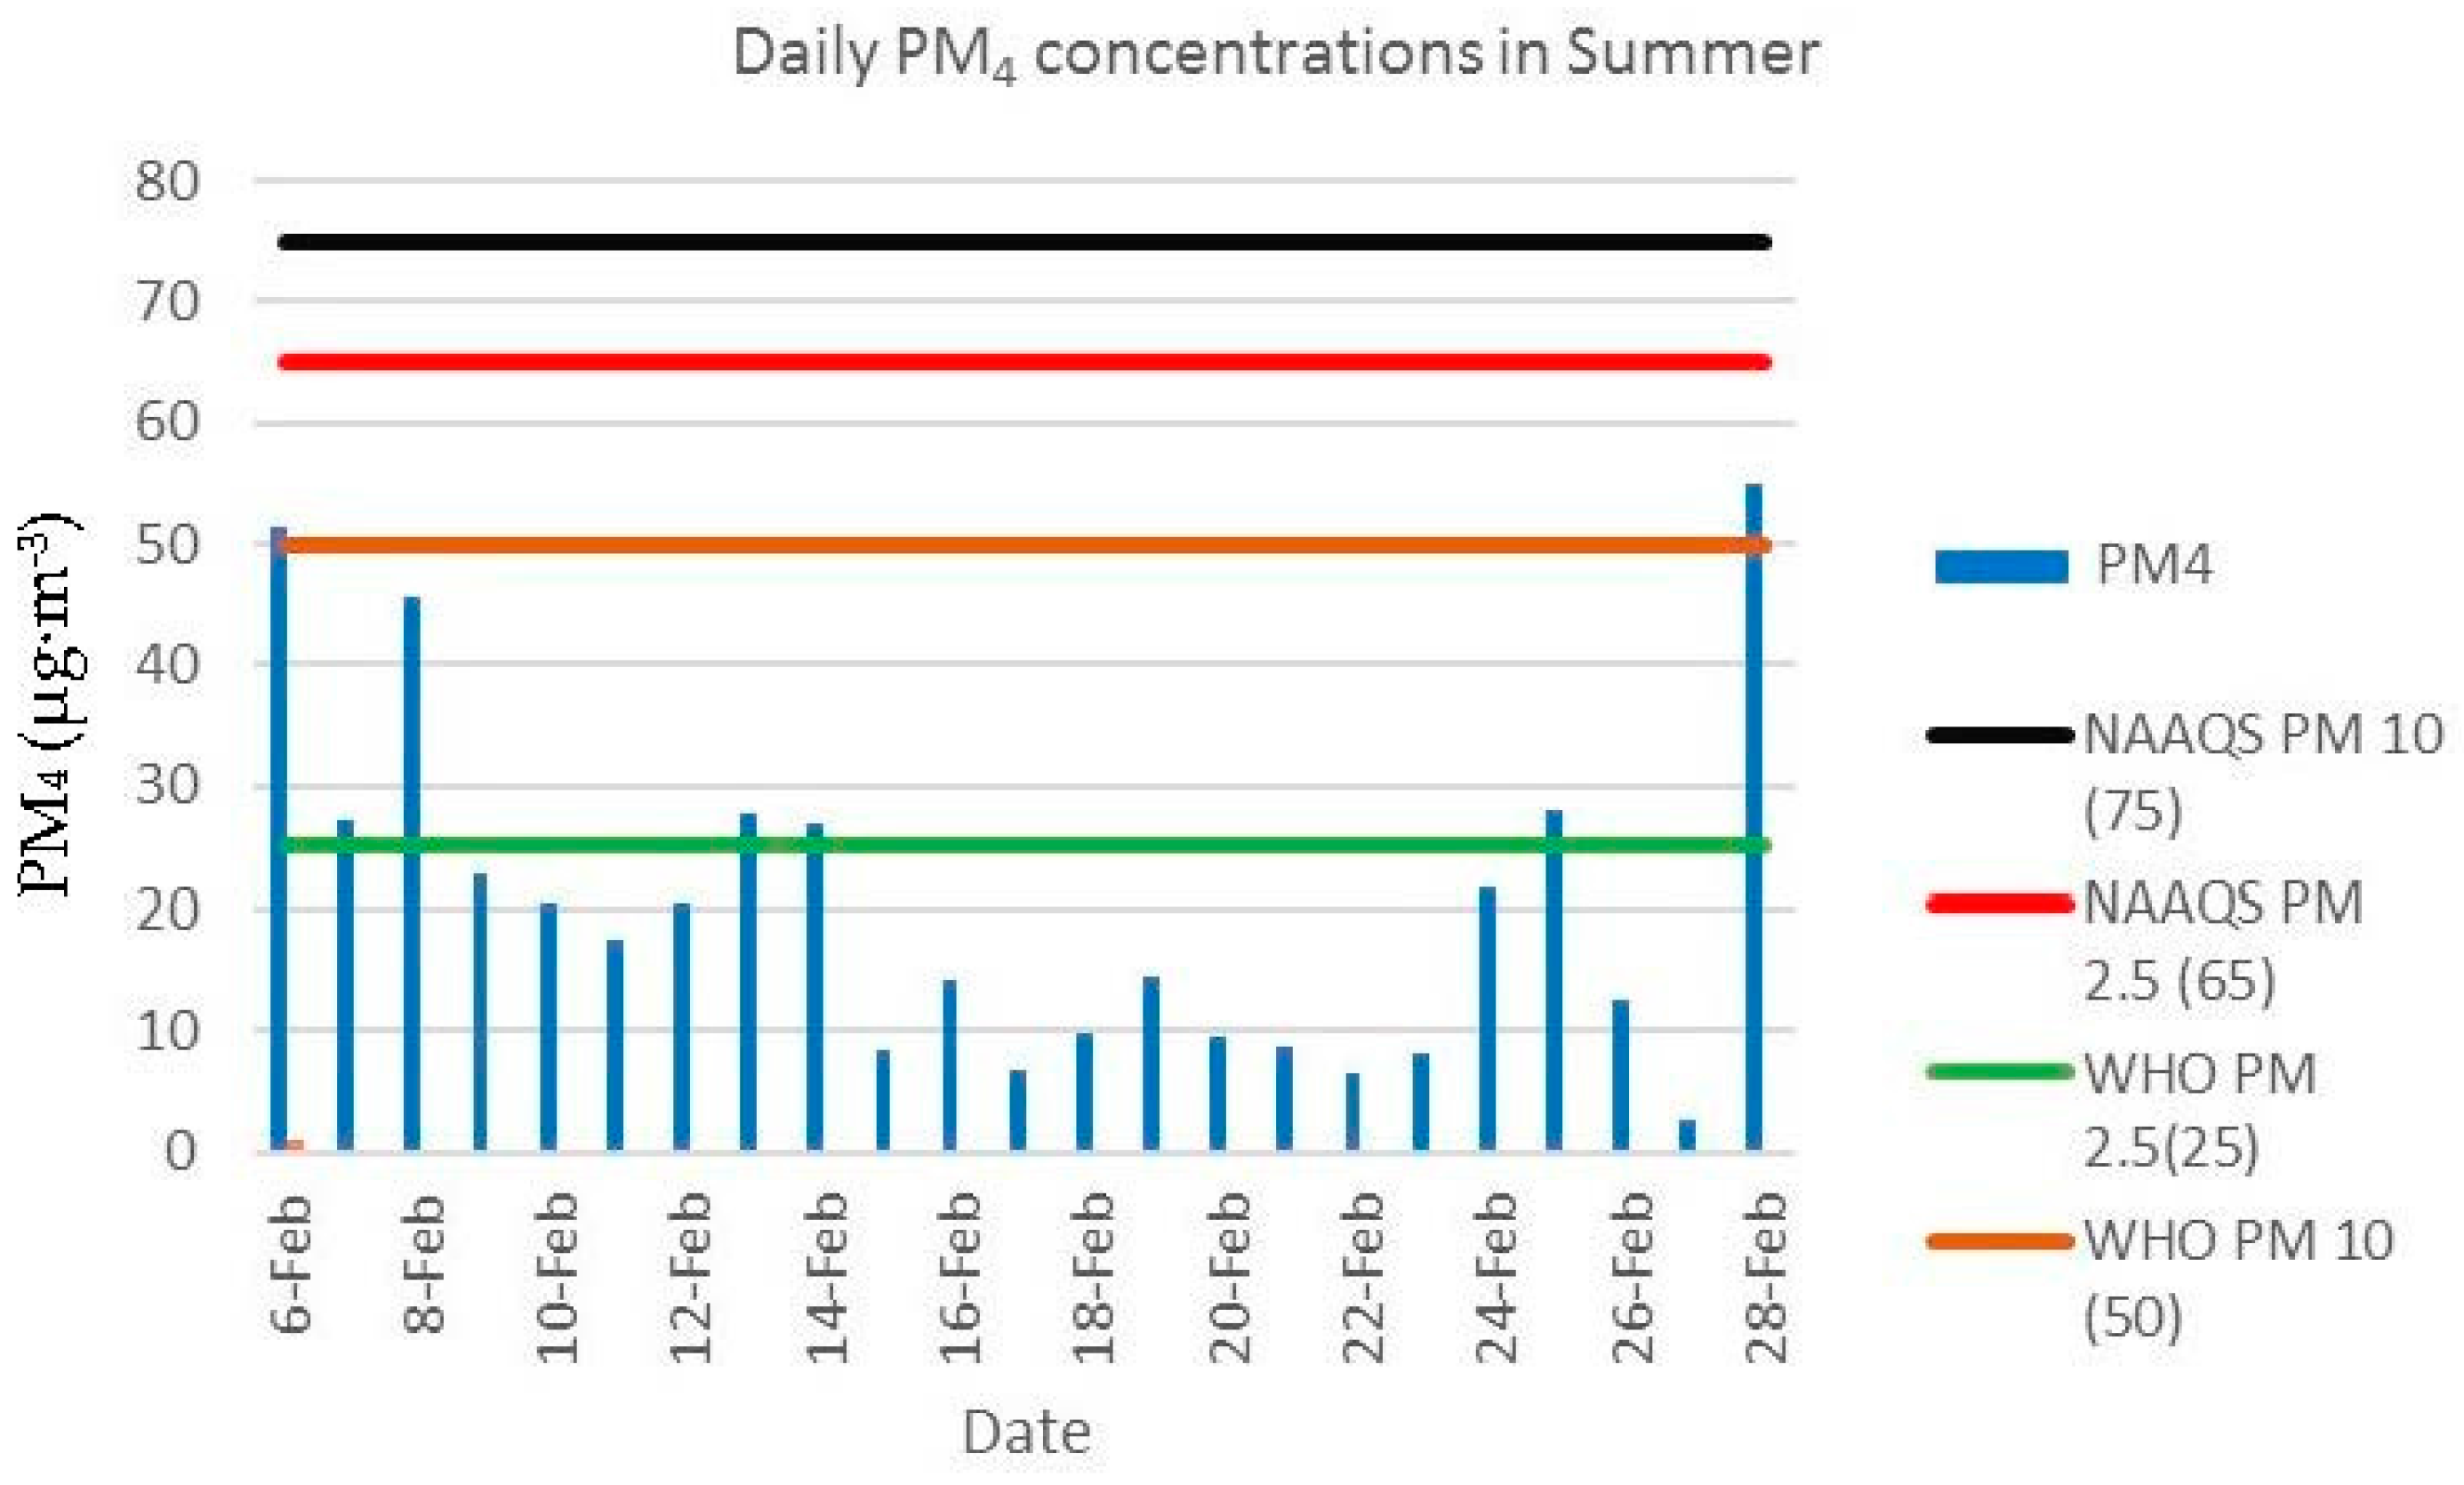
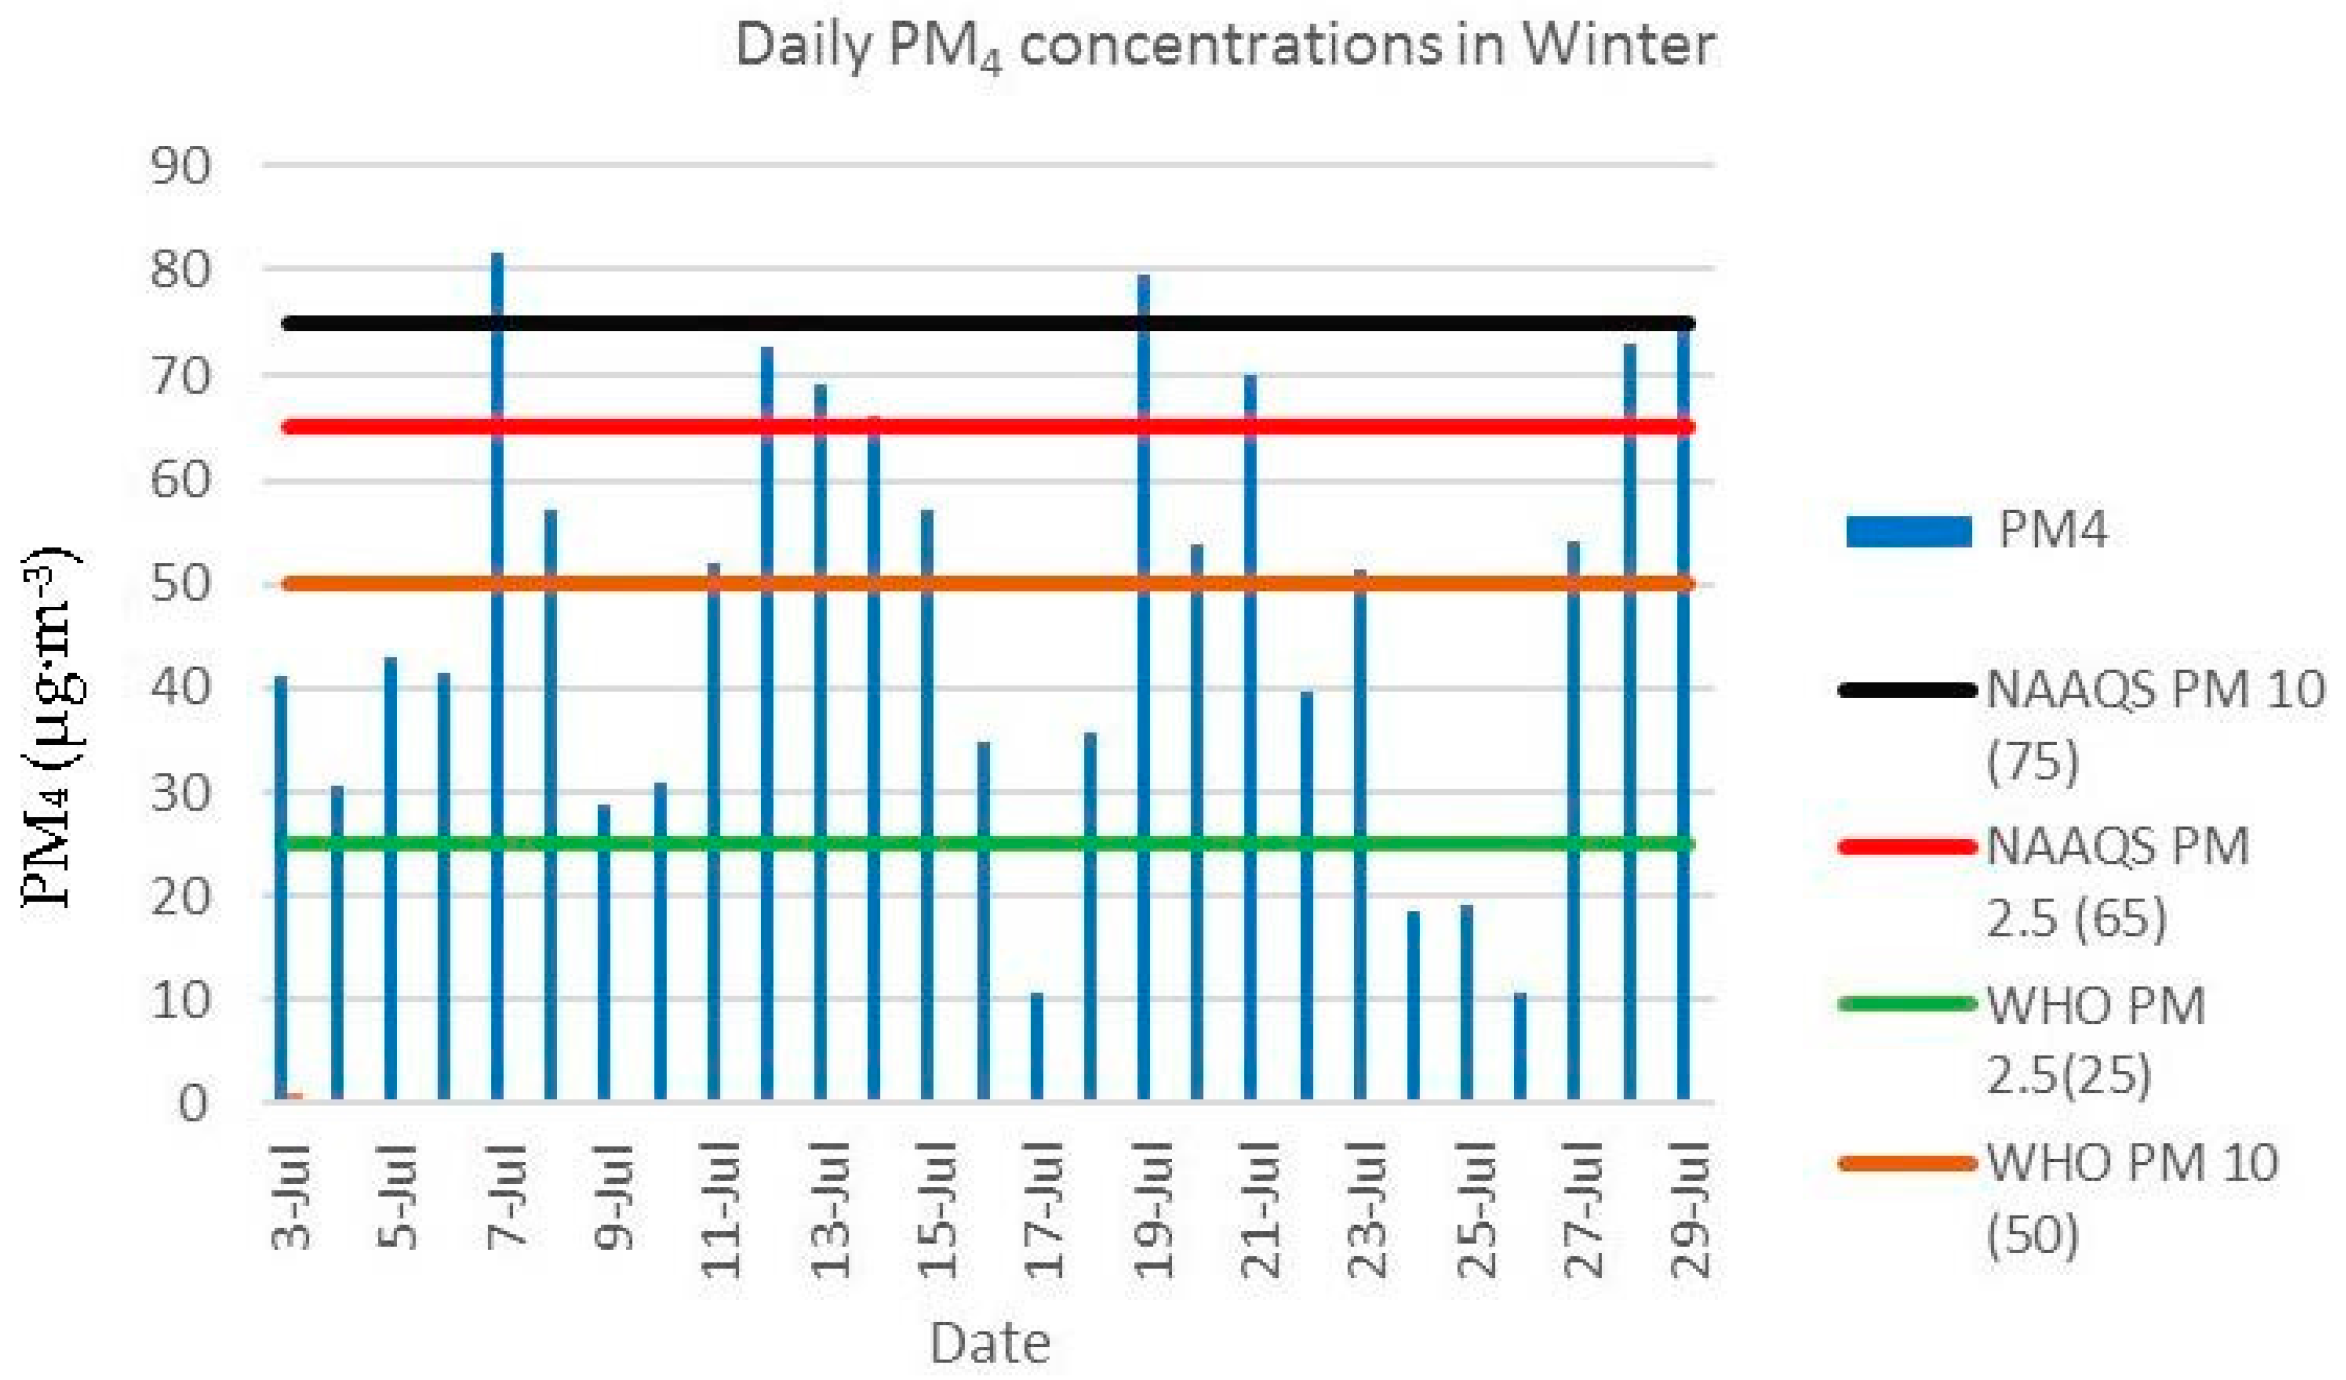
3.1. Seasonal Variation of Indoor Air Quality and Indoor and Outdoor Meteorological Variables

Hourly averages were calculated for ambient and indoor temperatures, ambient humidity and indoor PM4 concentrations (Table 2). During the sampling campaigns, ambient temperatures ranged from 8.3 °C to 44.9 °C, compared to the indoor temperatures, which had warmer minimum and cooler maximum temperatures (ranging from 15.1 °C to 39.9 °C). Temperatures above 35 °C have been associated with heat-related illnesses and in extreme events, deaths [23,24]. Even though the maximum indoor temperatures were cooler than the ambient maximum temperature, they still exceeded this threshold value. External humidity ranged between 7.1% and 100%, with the highest humidity values recorded in the hottest months (February and March). The highest PM4 concentration, 628 µg·m−3, was measured in winter. Mean precipitation and wind speed were highest in summer (6.3 mm and 12.6 km/h, respectively).
Figure 2 shows hourly PM4 concentrations in the eight kitchens sampled during the three seasons. The highest mean values were measured during spring (September). The highest variability was observed during winter (July), with a minimum of 1.9 µg·m−3 and a maximum value of 628 µg·m−3, measured at 6 p.m. Concentrations display seasonal variation with a significantly higher PM4 measured in winter (July) and spring (September), compared to summer. This could be attributed to the fact that the majority of households reported in the questionnaire responses that they use biomass fuels for space heating during cold seasons. Another possible explanation for these levels of PM could be regional biomass burning that occurs during winter and spring [25]. Results obtained in previous studies found that PM in homes increased during cold seasons, when heating is common and ventilation is reduced, because doors and windows are typically closed, thus trapping PM inside [26,27].
The South African National Department of Environmental Affairs has legislated the National Ambient Air Quality Standards (NAAQS). These are 24-hour average recommendations, 65 µg·m−3 for PM2.5 and 75 µg·m−3 for PM10 [28,29]. These standards are specific to outdoor air quality, there are no published standards or guidelines for indoor air quality in households in South Africa. The World Health Organization (WHO) also has ambient (outdoor) guidelines for 24-hour mean PM2.5 and PM10 concentrations, which are 25 µg·m−3 and 50 µg·m−3, respectively [30]. Figure 3, Figure 4 and Figure 5 show daily average indoor PM4 concentrations measured in kitchens in all households compared to the PM2.5 and PM10 concentration standards and guidelines set by NAAQS and the WHO, respectively. Levels of indoor PM4 on all days in spring and winter exceeded the levels set by the WHO and NAAQS. However, in summer, none of the national daily average recommendations of PM10 and PM2.5 by NAAQS were exceeded. The WHO international recommendations are exceeded on only a few days.

Correlation Analysis

Table 3 presents Pearson’s correlation coefficients and statistical significance between the outdoor temperature, indoor temperature, outdoor relative humidity and indoor PM4 concentration. Statistically significant, although modest, positive correlations were found between indoor temperature and indoor PM4 in spring and summer (r = 0.24, r = 0.22 respectively, p < 0.001 for both). Therefore, as indoor temperatures increase in spring and summer, so do indoor PM4 concentrations. A significant negative correlation was observed between PM4 and humidity in spring, although the strength of association was small (r = −0.27, p < 0.001). Therefore, as the outdoor relative humidity increases, the indoor PM4 concentrations decrease. Precipitation and wind speed were not included because they were not monitored as part of this case study campaign; measurements were obtained from the closest weather station.

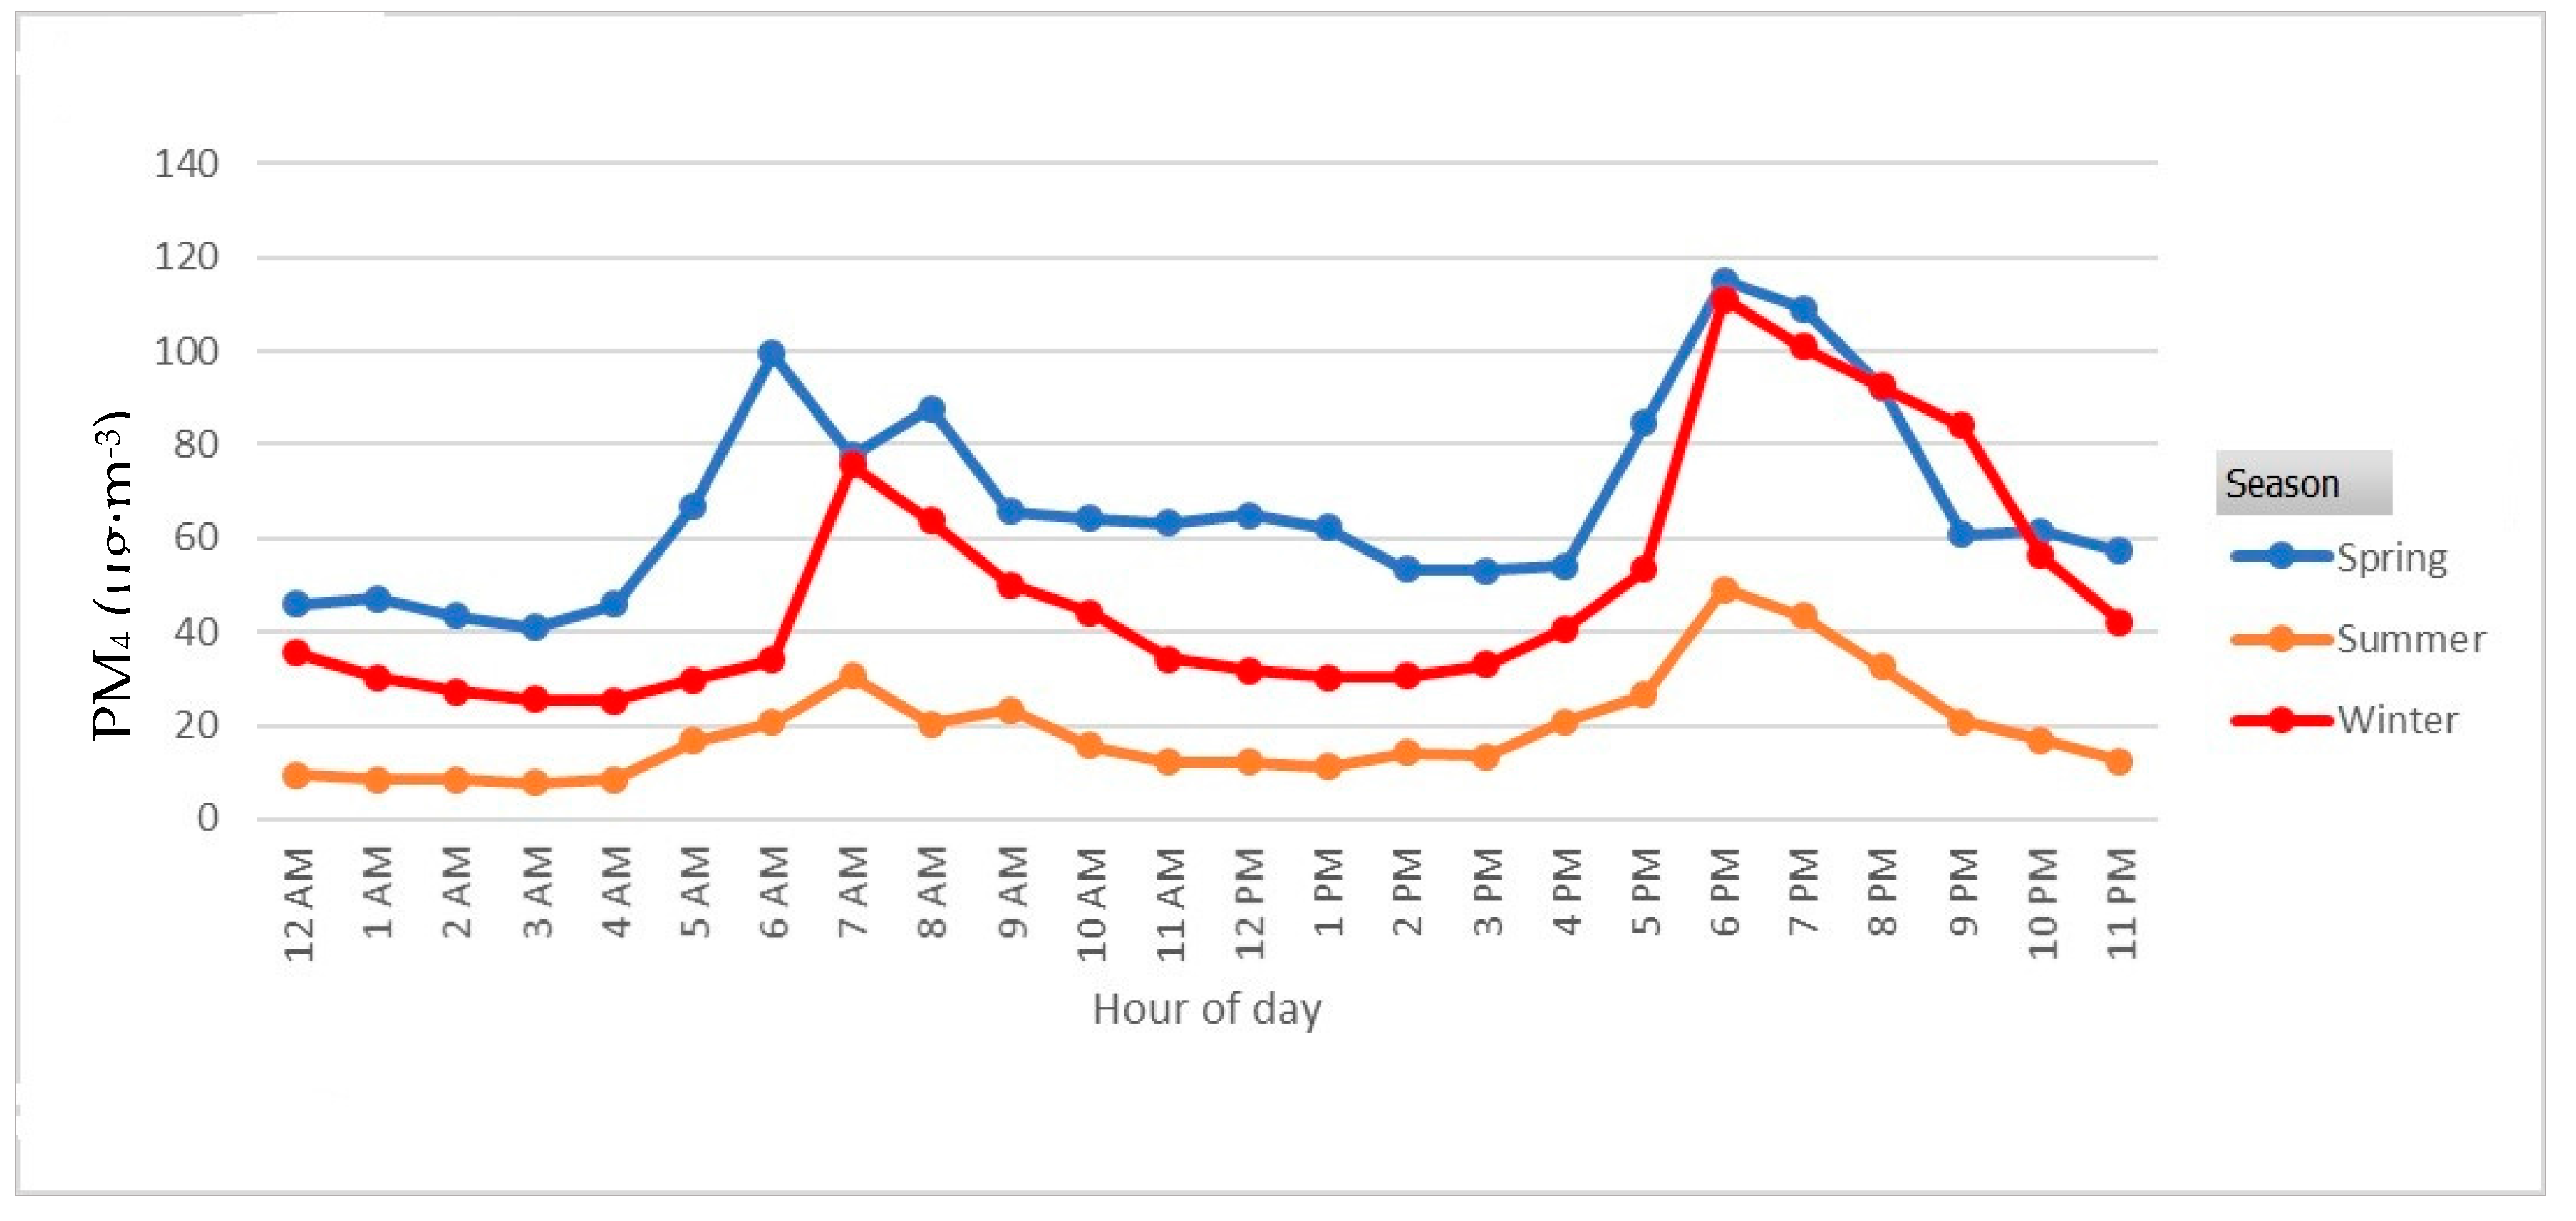
3.2. Time Series Analysis

Diurnal Variation

Hourly PM4 concentrations from the eight sampled households were averaged for spring, summer and winter. A pronounced bimodal diurnal pattern in PM concentrations was observed in all three seasons (Figure 6). PM4 concentration peaked between 5 a.m. and 7 a.m. and again between 6 p.m. and 8 p.m. during all the seasons. However, PM4 was consistently lower throughout the day in summer compared to spring and winter. The lowest concentrations of PM4 were measured during the early hours of the morning before 5 a.m., between noon and 4 p.m. and during late evening for all seasons. Six of the eight households reported lighting fires using wood or coal in the morning and four in the evening. The results show that the morning and evening peaks correspond to these times of the day during which combustion and space heating occur.

4. Discussion

Maximum indoor temperatures recorded in summer in the bedrooms, living room and kitchen exceeded 35 °C. A study conducted by Nitschke et al. [23] in South Australia found that for every 1 °C increment in maximum temperature above 35 °C, ambulance callouts increased by 0.7% and mortality increased by 0.9%. Household occupants were therefore exposed to adverse health effects due to elevated indoor temperatures.
The PM measured in this study, namely PM4 is classified as the respirable fraction. This is the mass fraction of inhaled particles that penetrates to the unciliated airways [31]. It is particularly important because it can penetrate beyond the terminal bronchioles into the gas-exchange region of the lungs [32]. The inhalation of PM in indoor air causes harmful health effects because it deposits in the nasal, pharyngeal and laryngeal regions of the respiratory system, causing respiratory disease [33]. Therefore, it is important to understand the indoor and outdoor factors that affect indoor particle concentrations at sites that are representative of population exposure.
The range of the effects that PM has on human health is broad, but it predominately affects the respiratory and cardiovascular systems. The WHO guidelines and NAAQS standards for 24-hour mean PM10 are 50 µg·m−3 and 75 µg·m−3, respectively [28,30]. The average daily indoor PM4 concentrations measured in the households in winter and spring exceeded the WHO guidelines and NAAQS standards for 24-hour mean PM10, which are 25 µg·m−3 and 65 µg·m−3, respectively. Other studies conducted in low income countries also revealed that indoor PM concentrations were substantially higher than WHO guidelines [3,34,35]. This study confirms that household occupants are exposed to poor indoor air quality and that their health and comfort is likely being negatively impacted. An exposure response study in rural Kenya found that study participants exposed to high concentrations of PM experienced a higher frequency of acute respiratory infections [36].
We found a positive correlation between indoor PM4 and indoor temperature in spring and summer. Several studies [37,38] found positive relationships between PM and temperature. This occurs because warm weather induces the formation of secondary fine particles, therefore increased temperatures result in increased PM [39,40]. PM was negatively correlated with relative humidity in spring. A similar study by Fromme et al. [41] also found a significant negative correlation between humidity and PM when assessing indoor air quality. This could have been caused by low relative humidity increasing particle deposition of fine particles [42,43] and high relative humidity decreasing particle deposition [44].
Most households cooked in kitchen structures that were not part of the main house, except for one household. These outdoor structures were however generally less than 100 m from the main house. Therefore, PM from combustion could have contributed to the PM measured inside the households. Furthermore, the majority of sampled households used wood and coal for space heating inside the homes. The kitchen inside the house is mostly used as a common area where space heating occurs; the burning of wood and coal exposes household occupants to fine particles in the air [45]. The diurnal pattern of PM concentrations coincides with the daily cycle of human activities associated with cooking and space heating. Diurnal variations in PM4 concentrations measured in indoor kitchens showed morning and evening peaks, these peaks were during hours when heating using coal and wood usually occurs. The timing of these peaks is of particular concern because they occur during times when most people, including vulnerable groups, are inside the home. The number of people in a home and activities in the home such as smoking and dust resuspension by cleaning also contribute to higher PM levels [26].
Since this was a case study, these results require validation in a large sample and in households located in other rural locations. One study limitation was that the only instrument available to measure PM measured PM4. Despite the national standards and international air quality guidelines being for PM2.5 and PM10, we used these to evaluate our PM4 concentrations as an indication of the possible presence of health risks due to PM exposure.
Our results suggested a strong seasonal variability in PM, with variability being highest in winter. Exposure to extreme PM values was thus highest in winter. A study by Wheeler et al. [46] found that both indoor and outdoor 24-hour-averaged PM concentrations were significantly higher in winter than in summer, by as much as 50%. Research has attributed this seasonal variation to several factors, including the longer residence time of particulates in the atmosphere during winter due to low winds and low mixing height [47,48] and wood and coal burning for heating [49,50]. Poor ventilation in winter could also have contributed to the increased PM concentrations observed in the study, similar observations were reported by Nasir et al. [51]. Elevated concentrations of PM observed in spring during our study could be attributed to regional biomass burning. Biomass burning emissions contribute significantly to the aerosol burden in a region [52]. Studies suggest that the maximum biomass burning activity in South Africa occurs between June and September [25,53].

5. Conclusions

Indoor temperatures showed a large range in the three sampled seasons, with the maximum values raising the largest cause for concern. Maximum indoor temperatures in summer exceeded the threshold of 35 °C, which has been shown to have adverse health effects. Indoor temperature was found to have a statistically significant positive effect on indoor PM concentrations. Indoor household concentrations of PM4 exceeded the standards and guidelines set by the NAAQS and the WHO, respectively. The implications of these findings are that increased heating in homes, either from lighting fires for cooking, or for heating, reduces indoor air quality by increasing the concentration of PM indoors. Also, the high indoor PM4 concentrations observed in this study could have been associated with higher background concentrations. Information about seasonal variation and the determinants of PM concentration could guide the design, timing and implementation of intervention strategies. Effective household indoor air quality monitoring programs may need to include interventions in seasons other than winter, for example, spring, when indoor air quality may also be poor. As a result, this could reduce exposure to PM and limit the associated health risks to people living in households using biomass or fossil fuels.

Acknowledgments

We thank the local authorities for allowing us to work in the communities and the households for permitting the installation of equipment in their homes. We also acknowledge the fieldworkers, North-West University and Medical Research Council staff who installed and collected the equipment. Funding for this project was made possible through the South African Medical Research Council Seed Flagship Grant, as well as funds from National Treasury under its Economic Competitiveness and Support Package. This research was also carried out for the iDEWS (infectious Diseases Early-Warning System) project supported by SATREPS (Science and Technology Research Partnership for Sustainable Development) Programme of JICA (JAPAN International Cooperation Agency)/AMED (Japan Agency for Medical Research and Development) in Japan and the ACCESS (Applied Centre for Climate and Earth Systems Science) program of NRF (National Research Foundation) and DST (Department of Science and Technology in South Africa).

Author Contributions

C.Y.W. conceived the air quality study and prepared the study protocol. B.L. implemented the fieldwork. T.K. and B.L. performed the data analyses. All authors contributed to the writing of the manuscript.

Conflicts of Interest

The authors declare there are no conflicts of interest.

Declarations

Permission to install the air quality monitoring equipment and temperature and RH loggers in the households was obtained from Limpopo Provincial Department of Health and the Mopani District Municipality. Research ethics clearance was granted from the South African Medical Research Council Research Ethics Committee (EC005-3/2014).

Appendix A

N = 7
QuestionCount of responses
How many people including you make up this main household?
4–65
6–82
>8-
How many children under the age of 5 are part of this household?
04
1–33
>3-
How many people over the age of 60 are part of this household?
03
1–34
>3-
During very cold weather, do you use any of the following systems to heat your home?
Wood or coal stove4
Fireplace3
Gas-
Electric heater1
Paraffin heater 0
How often do you use the wood/coal stove?
About everyday4
2–3 times a week
2–3 times a month
Seldom
Never
How often do you use the fireplace?
About everyday3
2–3 times a week
2–3 times a month
Seldom
Never
How often do you use the electric heater
About everyday
2–3 times a week
2–3 times a month1
Seldom
Never
What fuel do you mainly use for cooking?
Electricity2
Paraffin
Gas
Wood5
Coal
Crop waste/cow dung
Does the family sit in the same room around the stove or cooking fire–when cooking is taking place?
Yes
No7
Please specify when fires are made?
Morning6
Midday
Evening4
Where do you do your daily cooking?
kitchen (part of the house)1
kitchen (separated from the house)6
Do you have any dampness in the dwelling?
No7
Yes0
Do you have any leaks in the roof or leaking water pipes in or around the dwelling?
No7
Yes0

References

  1. Perez-Padilla, R.; Schilmann, A.; Riojas-Rodriguez, H. Respiratory health effects of indoor air pollution. Int. J. Tuberc. Lung Dis. 2010, 14, 1079–1086. [Google Scholar] [PubMed]
  2. Naeher, L.P.; Brauer, M.; Lipsett, M.; Zelikoff, J.T.; Simpson, C.D.; Koenig, J.Q.; Smith, K.R. Woodsmoke health effects: A review. Inhal. Toxicol. 2007, 19, 67–106. [Google Scholar] [CrossRef] [PubMed]
  3. Fullerton, D.G.; Bruce, N.; Gordon, S.B. Indoor air pollution from biomass fuel smoke is a major health concern in the developing world. Trans. R. Soc. Trop. Med. Hyg. 2008, 102, 843–851. [Google Scholar] [CrossRef] [PubMed]
  4. Barnes, B.; Mathee, A.; Thomas, E.; Bruce, N. Household energy, indoor air pollution and child respiratory health in South Africa. J. Energy South Afr. 2009, 20, 4–13. [Google Scholar]
  5. Araujo, J.A.; Nel, A.E. Particulate matter and atherosclerosis: Role of particle size, composition and oxidative stress. Part. Fibre Toxicol. 2009, 6, 1. [Google Scholar] [CrossRef] [PubMed]
  6. EPA, Office of Air Quality Planning and Standards. Review of the National Ambient Air Quality Standards for Particulate Matter: Policy Assessment of Scientific and Technical Information. 2005. Available online: https://www.google.com.sg/url?sa=t&rct=j&q=&esrc=s&source=web&cd=1&ved=0ahUKEwiww5Cqz73ZAhUCTrwKHSIrDUoQFggnMAA&url=https%3A%2F%2Fepa.gov%2Fttn%2Fnaaqs%2Fstandards%2Fpm%2Fdata%2F1996pmstaffpaper.pdf&usg=AOvVaw0OyaIWWGEVUL0Z-spJ2KHg (accessed on 15 January 2018).
  7. Megaritis, A.; Fountoukis, C.; Charalampidis, P.; Pilinis, C.; Pandis, S.N. Response of fine particulate matter concentrations to changes of emissions and temperature in europe. Atmos. Chem. Phys. 2013, 13, 3423–3443. [Google Scholar] [CrossRef]
  8. Semmens, E.O.; Noonan, C.W.; Allen, R.W.; Weiler, E.C.; Ward, T.J. Indoor particulate matter in rural, wood stove heated homes. Environ. Res. 2015, 138, 93–100. [Google Scholar] [CrossRef] [PubMed]
  9. Paulin, L.M.; Williams, D.A.; Oberweiser, C.; Diette, G.B.; Breysse, P.N.; McCormack, M.M.; Matsui, E.C.; Peng, R.; Metts, T.A.; Hansel, N.N. Indoor air quality in central appalachia homes impacted by wood and coal use. J. Environ. Prot. 2013, 4, 67. [Google Scholar] [CrossRef] [PubMed]
  10. Salvi, S.; Barnes, P.J. Is exposure to biomass smoke the biggest risk factor for COPD globally? Chest 2010, 138, 3–6. [Google Scholar] [CrossRef] [PubMed]
  11. Frontczak, M.; Wargocki, P. Literature survey on how different factors influence human comfort in indoor environments. Build. Environ. 2011, 46, 922–937. [Google Scholar] [CrossRef]
  12. Kim, J.Y.; Magari, S.R.; Herrick, R.F.; Smith, T.J.; Christiani, D.C.; Christiani, D.C. Comparison of fine particle measurements from a direct-reading instrument and a gravimetric sampling method. J. Occup. Environ. Hyg. 2004, 1, 707–715. [Google Scholar] [CrossRef] [PubMed]
  13. Inc, T. Sidepak Personal Aerosol Monitor Model AM510: User Guide. 2002. Available online: https://www.google.com.sg/url?sa=t&rct=j&q=&esrc=s&source=web&cd=1&ved=0ahUKEwjR3PvM1r3ZAhWMvbwKHRutBucQFggnMAA&url=http%3A%2F%2Fwww.tsi.com%2FuploadedFiles%2F_Site_Root%2FProducts%2FLiterature%2FManuals%2FSidePak_AIM510_US_1980456-web.pdf&usg=AOvVaw0GTsN7Azqoy-vjfoarg40R (accessed on 17 November 2017).
  14. Tung, T.C.; Chao, C.Y.; Burnett, J. A methodology to investigate the particulate penetration coefficient through building shell. Atmos. Environ. 1999, 33, 881–893. [Google Scholar] [CrossRef]
  15. Heal, M.R.; Beverland, I.J.; McCabe, M.; Hepburn, W.; Agius, R.M. Intercomparison of five PM10 monitoring devices and the implications for exposure measurement in epidemiological research. J. Environ. Monit. 2000, 2, 455–461. [Google Scholar] [CrossRef] [PubMed]
  16. Ramachandran, G.; Adgate, J.L.; Hill, N.; Sexton, K.; Pratt, G.C.; Bock, D. Comparison of short-term variations (15-minute averages) in outdoor and indoor PM2.5 concentrations. J. Air Waste Manag. Assoc. 2000, 50, 1157–1166. [Google Scholar] [CrossRef] [PubMed]
  17. Chung, A.; Chang, D.P.; Kleeman, M.J.; Perry, K.D.; Cahill, T.A.; Dutcher, D.; McDougall, E.M.; Stroud, K. Comparison of real-time instruments used to monitor airborne particulate matter. J. Air Waste Manag. Assoc. 2001, 51, 109–120. [Google Scholar] [CrossRef] [PubMed]
  18. Yanosky, J.D.; Williams, P.L.; MacIntosh, D.L. A comparison of two direct-reading aerosol monitors with the federal reference method for PM2.5 in indoor air. Atmos. Environ. 2002, 36, 107–113. [Google Scholar] [CrossRef]
  19. Braniš, M.; Hovorka, J. Performance of a photometer DustTrak in various indoor and outdoor environments. In Proceedings of the Evaluations and Assessment Conference, Ghent, Belgium, 28 Septemper–10 October 2005; p. 535. [Google Scholar]
  20. Kingham, S.; Durand, M.; Aberkane, T.; Harrison, J.; Wilson, J.G.; Epton, M. Winter comparison of TEOM, minivol and dusttrak PM10 monitors in a woodsmoke environment. Atmos. Environ. 2006, 40, 338–347. [Google Scholar] [CrossRef]
  21. McNamara, M.L.; Noonan, C.W.; Ward, T.J. Correction factor for continuous monitoring of wood smoke fine particulate matter. Aerosol Air Qual. Res. 2011, 11, 315. [Google Scholar] [CrossRef] [PubMed]
  22. Wallace, L.A.; Wheeler, A.J.; Kearney, J.; Van Ryswyk, K.; You, H.; Kulka, R.H.; Rasmussen, P.E.; Brook, J.R.; Xu, X. Validation of continuous particle monitors for personal, indoor, and outdoor exposures. J. Exposure Sci. Environ. Epidemiol. 2011, 21, 49–64. [Google Scholar] [CrossRef] [PubMed]
  23. Nitschke, M.; Tucker, G.R.; Hansen, A.L.; Williams, S.; Zhang, Y.; Bi, P. Impact of two recent extreme heat episodes on morbidity and mortality in Adelaide, South Australia: A case-series analysis. Environ. Health 2011, 10, 42. [Google Scholar] [CrossRef] [PubMed]
  24. Bai, L.; Ding, G.; Gu, S.; Bi, P.; Su, B.; Qin, D.; Xu, G.; Liu, Q. The effects of summer temperature and heat waves on heat-related illness in a coastal city of China, 2011–2013. Environ. Res. 2014, 132, 212–219. [Google Scholar] [CrossRef] [PubMed]
  25. Garland, R.M.; Horowitz, H.M.; Engelbrecht, C.J.; Dedekind, Z.; Bopape, M.-J.M.; Engelbrecht, F.A. Representation of aerosol particles and associated transport pathways in regional climate modelling in Africa. In Proceedings of the 32nd Annual Conference of the South African Society for Atmospheric Sciences, Cape Town, South Africa, 31 October–1 November 2016. [Google Scholar]
  26. Jung, K.H.; Patel, M.M.; Moors, K.; Kinney, P.L.; Chillrud, S.N.; Whyatt, R.; Hoepner, L.; Garfinkel, R.; Yan, B.; Ross, J. Effects of heating season on residential indoor and outdoor polycyclic aromatic hydrocarbons, black carbon, and particulate matter in an urban birth cohort. Atmos. Environ. 2010, 44, 4545–4552. [Google Scholar] [CrossRef] [PubMed]
  27. Vilčeková, S.; Apostoloski, I.Z.; Mečiarová, L.; Burdová, E.K.; Kiseľák, J. Investigation of indoor air quality in houses of macedonia. Int. J. Environ. Res. Public Health 2017, 14, 37. [Google Scholar] [CrossRef] [PubMed]
  28. Department of Environmental Affairs. National Environmental Management: Air Quality Act, 2004 (Act No. 39 of 2004). National Ambient Air Quality Standards. Available online: https://www.environment.gov.za/sites/default/files/legislations/nemaqa_airquality_g32816gon1210.pdf (accessed on 22 January 2018).
  29. Department of Environmental Affairs. National Environmental Management: Air Quality Act, 2004 (Act No. 39 of 2004) No. 354637 29 June 2012 National Ambient Air Quality Standard for Particulate Matter with Aerodynamic Diameter Less than 2.5 Micron Metres (PM2.5). Available online: https://cer.org.za/wp-content/uploads/2010/03/National-Ambient-Air-Quality-Standard_PM2.5.pdf (accessed on 22 January 2018).
  30. World Health Organization. WHO Air Quality Guidelines: Global Update 2005: Particulate matter, Ozone, Nitrogen Dioxide, and Sulfur Dioxide. Available online: http://apps.who.int/iris/bitstream/10665/69477/1/WHO_SDE_PHE_OEH_06.02_eng.pdf (accessed on 25 November 2017).
  31. Brown, J.S.; Gordon, T.; Price, O.; Asgharian, B. Thoracic and respirable particle definitions for human health risk assessment. Part. Fibre Toxicol. 2013, 10, 12. [Google Scholar] [CrossRef] [PubMed]
  32. Hazard Prevention and Control in the Work Environment: Airborne Dust. Available online: Http://www.Who.Int/occupational_health/publications/en/oehairbornedust3.Pdf (accessed on 10 January 2018).
  33. Bernstein, J.A.; Alexis, N.; Bacchus, H.; Bernstein, I.L.; Fritz, P.; Horner, E.; Li, N.; Mason, S.; Nel, A.; Oullette, J. The health effects of nonindustrial indoor air pollution. J. Allergy Clin. Immunol. Pract. 2008, 121, 585–591. [Google Scholar] [CrossRef] [PubMed]
  34. Kaplan, C. Indoor air pollution from unprocessed solid fuels in developing countries. Rev. Environ. Health 2010, 25, 221–242. [Google Scholar] [CrossRef] [PubMed]
  35. Oluwole, O.; Otaniyi, O.O.; Ana, G.A.; Olopade, C.O. Indoor air pollution from biomass fuels: A major health hazard in developing countries. J. Public Health 2012, 20, 565–575. [Google Scholar] [CrossRef]
  36. Ezzati, M.; Kammen, D.M. Indoor air pollution from biomass combustion and acute respiratory infections in Kenya: An exposure-response study. Lancet 2001, 358, 619–624. [Google Scholar] [CrossRef]
  37. Tai, A.P.; Mickley, L.J.; Jacob, D.J. Correlations between fine particulate matter (PM2.5) and meteorological variables in the United States: Implications for the sensitivity of PM2.5 to climate change. Atmos. Environ. 2010, 44, 3976–3984. [Google Scholar] [CrossRef]
  38. Massey, D.; Kulshrestha, A.; Masih, J.; Taneja, A. Seasonal trends of PM10, PM5.0, PM2.5 & PM10 in indoor and outdoor environments of residential homes located in north-central India. Build. Environ. 2012, 47, 223–231. [Google Scholar]
  39. Dawson, J.; Adams, P.; Pandis, S. Sensitivity of PM2.5 to climate in the Eastern Us: A modeling case study. Atmos. Chem. Phys. 2007, 7, 4295–4309. [Google Scholar] [CrossRef]
  40. Liu, Z.; Hu, B.; Wang, L.; Wu, F.; Gao, W.; Wang, Y. Seasonal and diurnal variation in particulate matter (PM10 and PM2.5) at an urban site of Beijing: Analyses from a 9-year study. Environ. Sci. Pollut. Res. 2015, 22, 627–642. [Google Scholar] [CrossRef] [PubMed]
  41. Van Donkelaar, A.; Martin, R.V.; Brauer, M.; Kahn, R.; Levy, R.; Verduzco, C.; Villeneuve, P.J. Global estimates of ambient fine particulate matter concentrations from satellite-based aerosol optical depth: Development and application. Environ. Health Perspect. 2010, 118, 847. [Google Scholar] [CrossRef] [PubMed]
  42. Fromme, H.; Twardella, D.; Dietrich, S.; Heitmann, D.; Schierl, R.; Liebl, B.; Rüden, H. Particulate matter in the indoor air of classrooms—exploratory results from munich and surrounding area. Atmos. Environ. 2007, 41, 854–866. [Google Scholar] [CrossRef]
  43. Litvak, A.; Gadgil, A.; Fisk, W. Hygroscopic fine mode particle deposition on electronic circuitsand resulting degradation of circuit performance: An experimentalstudy. Indoor Air 2000, 10, 47–56. [Google Scholar] [CrossRef] [PubMed]
  44. Miguel, A.F.; Reis, A.H.; Aydin, M. Aerosol particle deposition and distribution in bifurcating ventilation ducts. J. Hazard Mater. 2004, 116, 249–255. [Google Scholar] [CrossRef] [PubMed]
  45. Gurley, E.S.; Salje, H.; Homaira, N.; Ram, P.K.; Haque, R.; Petri, W.A.; Bresee, J.; Moss, W.J.; Luby, S.P.; Breysse, P. Seasonal concentrations and determinants of indoor particulate matter in a low-income community in Dhaka, Bangladesh. Environ. Res. 2013, 121, 11–16. [Google Scholar] [CrossRef] [PubMed]
  46. Wheeler, A.J.; Wallace, L.A.; Kearney, J.; Van Ryswyk, K.; You, H.; Kulka, R.; Brook, J.R.; Xu, X. Personal, indoor, and outdoor concentrations of fine and ultrafine particles using continuous monitors in multiple residences. Aerosol Sci. Technol. 2011, 45, 1078–1089. [Google Scholar] [CrossRef]
  47. Karar, K.; Gupta, A.; Kumar, A.; Biswas, A.K. Seasonal variations of PM10 and TSP in residential and industrial sites in an urban area of kolkata, India. Environ. Monit. Assess. 2006, 118, 369–381. [Google Scholar] [CrossRef] [PubMed]
  48. Järvi, L.; Junninen, H.; Karppinen, A.; Hillamo, R.; Virkkula, A.; Mäkelä, T.; Pakkanen, T.; Kulmala, M. Temporal variations in black carbon concentrations with different time scales in Helsinki during 1996–2005. Atmos. Chem. Phys. 2008, 8, 1017–1027. [Google Scholar] [CrossRef]
  49. LaRosa, L.E.; Buckley, T.J.; Wallace, L.A. Real-time indoor and outdoor measurements of black carbon in an occupied house: An examination of sources. J. Air Waste Manag. Assoc. 2002, 52, 41–49. [Google Scholar] [CrossRef] [PubMed]
  50. Demerjian, K.L.; Mohnen, V.A. Synopsis of the temporal variation of particulate matter composition and size. J. Air Waste Manag. Assoc. 2008, 58, 216–233. [Google Scholar] [CrossRef] [PubMed]
  51. Nasir, Z.A.; Colbeck, I.; Ali, Z.; Ahmad, S. Indoor particulate matter in developing countries: A case study in pakistan and potential intervention strategies. Environ. Res. Lett. 2013, 8, 024002. [Google Scholar] [CrossRef] [Green Version]
  52. Tesfaye, M.; Botai, J.; Sivakumar, V.; Mengistu Tsidu, G. Evaluation of regional climatic model simulated aerosol optical properties over south africa using ground-based and satellite observations. Atmos. Sci. 2013, 2013, 17. [Google Scholar] [CrossRef]
  53. Eck, T.; Holben, B.; Ward, D.; Mukelabai, M.; Dubovik, O.; Smirnov, A.; Schafer, J.; Hsu, N.; Piketh, S.; Queface, A. Variability of biomass burning aerosol optical characteristics in Southern Africa during the safari 2000 dry season campaign and a comparison of single scattering albedo estimates from radiometric measurements. J. Geophys. Res. Atmos. 2003, 108. [Google Scholar] [CrossRef]
Figure 1. Map showing the location of Mopani District in Limpopo Province, South Africa (map produced in-house using ArcGIS® software (version 10.3) created by ESRI (Environmental Systems Resource Institute, Redlands, CA, USA)).
Atmosphere 09 00124 g001
Figure 2. Box plot of average concentrations of PM4 from all houses sampled in Giyani during 2016 and 2017 (line: median; interquartile range box: middle 50% of the data; whiskers extending from either end of the box: ranges for the bottom and top 25% of the data values; solid black dots: outliers).
Atmosphere 09 00124 g002
Figure 3. Indoor kitchen PM4 concentrations measured in spring compared to NAAQS (National Ambient Air Quality Standards) standards and WHO guidelines.
Atmosphere 09 00124 g003
Figure 4. Indoor kitchen PM4 concentrations measured in summer compared to NAAQS standards and WHO guidelines.
Atmosphere 09 00124 g004
Figure 5. Indoor kitchen PM4 concentrations measured in winter compared to NAAQS standards and WHO guidelines.
Atmosphere 09 00124 g005
Figure 6. Diurnal time series of average hourly PM4 concentrations by time of day and season.
Atmosphere 09 00124 g006
Table 1. Source of cooking and space heating fuel for population of Limpopo province. (Census, 2011).
Number of Households (N = 14,450,161)
ElectricityGasParaffinWoodCoalAnimal dungSolar
Cooking708,924.4621,958.0458,473.23616,311.926381.001882.991366.63
Space heating637,815.6911,765.1726,084.63541,947.4212,594.702420.501940.52
Table 2. Descriptive statistics for indoor air quality and indoor and outdoor meteorological variables.
VariableSeptember (Spring 2016)February (Summer 2017)July (Winter 2017)
Mean (SD)RangeMean (SD)RangeMean (SD)Range
Kitchen temperature (°C)25.1 (3.2)19.5–32.528.0 (3.3)22.1–39.922.3 (2.1)16.3–29.5
Bedroom temperature (°C)25.0 (3.2)19.5–32.328.5 (3.5)22.4–38.421.5 (2.3)15.6–27.8
Living room temperature (°C)25.2 (3.4)19.4–33.428.2 (3.4)22.3–38.521.2 (2.1)15.1–27.2
Outdoor temperature (°C)24.9 (6.1)15.9–44.926.7 (5.6)19.0–43.019.3 (5.8)8.3–35.3
Outdoor humidity (%)38.3 (15.1)7.5–87.973.4 (19.9)16.4–100.054.9 (19.7)7.1–93.1
PM4 (µg·m−3) 67.2 (42.0)6.5–240.619.9 (25.7)0.0–197.150.4 (51.9)1.9–628.0
* Precipitation (mm)0.3 (1.1)0.0–7.96.3 (11.8)0.0–28.00.4 (1.9)0–10.9
* Wind speed (km/h)11.8 (3.7)6–21.012.6 (4.9)6.0–24.010.5 (3.5)3–19.0
* Obtained from Tzaneen weather station.
Table 3. Pearson’s correlation coefficients showing the correlation between PM4, temperature and relative humidity, stratified by season.
VariableSpringSummerWinter
Indoor PM4
Indoor temperature0.24 ***0.22 ***0.03
Outdoor temperature0.110.04−0.06
Outdoor relative humidity−0.27 ***−0.080.01
Note: Significance levels are indicated with * where * p < 0.05, ** p < 0.01, *** p < 0.001; indoor PM4 and temperature were measured in kitchens.

