Precipitation Extremes in Dynamically Downscaled Climate Scenarios over the Greater Horn of Africa


1
National Drought Mitigation Center, School of Natural Resources, University of Nebraska-Lincoln, 3310 Holdrege Street, Lincoln, NE 68583, USA
2
Department of Earth and Atmospheric Sciences (EAS), University of Nebraska-Lincoln, 126 Bessey Hall, Lincoln, NE 68588, USA
*
Author to whom correspondence should be addressed.
Atmosphere 2018, 9(3), 112; https://doi.org/10.3390/atmos9030112
Submission received: 11 November 2017
/
Revised: 24 February 2018
/
Accepted: 13 March 2018
/
Published: 18 March 2018
(This article belongs to the Special Issue Precipitation Variability and Change in Africa)
Abstract
:This study first assesses the performance of regional climate models in the Coordinated Regional Climate Downscaling Experiment (CORDEX) in reproducing observed extreme precipitation indices over the Greater Horn of Africa (GHA) region during 1989–2005. The study then assesses projected changes in these extremes during 2069–2098 compared to 1976–2005. The Regional Climate Model (RCM) simulations are made using two RCMs, with large-scale forcing from four CMIP5 Global limate Models(GCMs) under two Representative Concentration Pathways (RCP4.5 and RCP8.5). We found that RCM simulations have reasonably captured observed patterns of moderate precipitation extreme indices (MPEI). Pattern correlation coefficients between simulated and observed MPEI exceed 0.5 for all except the Simple Daily Intensity Index (SDII). However, significant overestimations or underestimations exist over localized areas in the region. Projected changes in Total annual Precipitation (PRCPTOT) and the annual number of heavy (>10 mm) and very heavy (>20 mm) precipitation days by 2069–2098 show a general north-south pattern, with decreases over the southern half and increases over the northern half of the GHA. These changes are often greatest over parts of Somalia, Eritrea, the Ethiopian highlands and southern Tanzania. Maximum one- and five-day precipitation totals over a year and SDII (ratio of PRCPTOT to rainy days) are projected to increase over a majority of the GHA, including areas where PRCPTOT is projected to decrease, suggesting fewer, but heavier rainy days in the future. Changes in the annual sum of daily precipitation above the 95th and 99th percentiles are statistically significant over a few locations, with the largest projected decrease/increase over Eritrea and northwestern Sudan/Somalia. Projected changes in Consecutive Dry Days (CDD) suggest longer periods of dryness over the majority of the GHA, except the central portions covering northern Uganda, southern South Sudan, southeastern Ethiopia and Somalia. Substantial increases in CDD are located over southern Tanzania and the Ethiopian highlands. The magnitude and the spatial extent of statistically-significant changes in all MPEI increase from RCP4.5 to RCP8.5, and the separation between positive and negative changes becomes clearer under RCP8.5.
1. Introduction
Increases in atmospheric greenhouse gas concentrations are expected to result not only in changes in mean climate, but also in changes in the frequency and intensity of extreme events, such as floods, droughts and heat waves [1,2]. Confidence has increased that some extremes will become more frequent, more widespread and/or more intense during the 21st Century [3]. Societal vulnerability to climate variability and change is likely to depend more on changes in these extreme weather and climate events [4,5].
The Greater Horn of Africa (GHA) region is one of the most vulnerable regions to current and projected future changes in climate extremes. This is mainly attributed to the fact that the economies and livelihoods of people in the majority of countries in the region still rely on rain-dependent systems [6], and they lack the technology and resources to mitigate the adverse impacts of climate-induced risks. Precipitation (water availability) is by far the most critical parameter for the region, and therefore, changes in frequency and intensity of precipitation will ultimately affect water availability and may lead to decreased agricultural production and potentially widespread food shortages [5]. The region is already witnessing dire consequences of erratic climatic conditions that are likely to be associated with regional climate change [7]. Climate extremes such as flooding and seasonal drought have been experienced more frequently during the last 30–60 years [8,9,10,11,12] and are already undermining the economies of countries in the Horn of Africa, with agriculture and water resources being the most affected sectors.
Despite recognition of the existing challenges and growing demand for information services on weather and climate extremes, understanding, predicting and mitigating low frequency variations and trends in climate still comprise a challenge facing the region and the continent at large [13]. Thus, there is an obvious need for better analyses of the likely response of extreme climate events in this region to global warming, to better understand changes that may occur and to inform disaster preparedness, adaption planning and policy making [6,14,15].
Dynamically downscaled GCM projections have proven to be suitable tools for providing high-resolution data used in regional and local assessment of climate extremes. Regional climate model simulations are particularly useful for understanding local climate in regions that have complex topography such as the GHA region [6]. Currently, the Coordinated Regional Climate Downscaling Experiment (CORDEX) program, initiated by the World Climate Research Program (WCRP), provides an opportunity for generating high-resolution regional climate projections that can be used for assessment of the future impacts of climate change on extremes at regional scales [16]. Consequently, several studies, e.g., [1,14,15,17], have been undertaken in different parts of the world to understand possible changes in climate extremes by making use of dynamically downscaled projections archived through the CORDEX project.
Because extreme precipitation events affect individual sectors in different ways [15], several types of extreme indices can be defined to describe these events [18]. Accordingly, indices used in studies that investigate changes in precipitation extremes also vary considerably. One of the most widely-used types is based on exceeding various threshold values, such as an absolute value (e.g., 10 mm, 20 mm, etc.) or a given percentile of a long climatological time series (e.g., 90th, 95th, etc.). Other more complex indices consider duration, intensity and/or persistence of the events [15]. To facilitate the investigation of changes in climate extremes and obtain coherent pictures of change around the world, the Expert Team on Climate Change Detection and Indices (ETCCDI) [18] defined a set of climate change indices focusing on extreme events. These indices in general describe moderate extreme events with a recurrence time of a year or less, forming a balance between data availability and the robustness of changes [18].
This study analyzes a set of extreme precipitation indices similar to ETCCDI over the GHA region, which is characterized by complex topography, land surface heterogeneity and diverse spatial rainfall patterns. The region comprises 11 countries: Burundi, Djibouti, Eritrea, Ethiopia, Kenya, Rwanda, Somalia, Sudan, South Sudan, Tanzania and Uganda (Figure 1). The study evaluates the ability of Regional Climate Model (RCM) simulations from the CORDEX project to simulate extreme precipitation indices and then presents the projections for the end of the 21st Century over the GHA. The paper is organized as follows: Section 2 gives a brief description of the observational and model dataset and methodology used in the study. Section 3 provides results of a comparison between observed and simulated precipitation extremes and their projected changes by the end of the 21st Century, and Section 4 presents conclusions.
2. Data and Methods
2.1. Model data
This study is based on a dynamically downscaled daily precipitation dataset from two RCM simulations available at the CORDEX project archive (Table 1): the Rossby Center (SMHI) regional climate model RCA4 [19] and the Consortium for Small-scale Modeling (COSMO) Regional Climate Model (COSMO-CLM) [20]. The two RCMs are selected for this study based on the availability and completeness of downscaled datasets for an overlapping period to make a consistent comparison. The key criteria considered were availability of downscaled datasets from each RCM forced by multiple GCMs under multiple RCPs for two 30-year climatological periods (historical and end of 21st Century), as well as the availability of the downscaled dataset with boundary forcing from ERA-Interim reanalysis during the historical period. All but the CCLM and RCA4 RCM datasets in the CORDEX archive failed to meet one or more of the above criteria. For the ERA-Interim-driven evaluation run, the RCA4 model run is available for the period of 1980–2010, while for CCLM data, it is available for the 1989–2008 period only [21,22]. Thus, the 1989–2008 common period has been chosen for both RCMs. For GCM-driven runs, RCA4 has been driven by eight CGCMs, while CCLM has been driven by four of the same GCMs used in RCA4 simulations [21,23]. In this study, RCM runs with the four common driving GCMs (i.e., MPI-ESM-LR, HadGEM2-ES, CNRM-CM5 and EC-EARTH (Table 2) have been considered. For the historical GCM-driven run, both RCMs have data for the period 1950–2005. The period from 1976–2005 has been chosen to represent the historical 30-year climatological period. Both RCMs have projections covering the period 2006–2100 under two emission scenarios (i.e., RCP4.5 and RCP8.5). Thus, taking into account the above four driving GCMs and two scenarios, an eight-member ensemble of climate projections (for each RCM) covering a 30-year climatological period from 2069–2098 is considered as the future climatological period. The period 2069–2098 is chosen over 2071–2100 due to the occurrence of missing data during 2099 and 2100 in some of the ensemble members. All the above simulations were performed at a grid resolution of 0.44 by 0.44( km) over the same Africa domain, and simulated extreme indices were latter extracted for the study domain (i.e., the GHA region) for the purpose of this study.
2.2. Observed Data
Because of the limited spatial and temporal coverage of stations in Africa, observed datasets are insufficient for quantifying model biases [6] in simulating climate extremes during historical periods. Gridded rainfall data based on gauge-satellite products are an alternative for evaluating climate models (e.g., [22,40,41]). In this study, a quasi-global daily gridded time series of the Climate Hazards Infrared Precipitation with Stations version 2 (CHIRPSv2) dataset [42] with a resolution of 0.05 × 0.05 is used to generate observed precipitation extreme indices for the evaluation period (1989–2005) and to validate the accuracy of extremes from RCM simulations. As all RCM simulations are performed on the same rotated grid with 0.44 horizontal resolution, the CHIRPSv2 dataset is remapped to this reference grid through bilinear interpolation. CHIRPSv2 remapping and all other subsequent analysis and mapping of extremes (except generating extremes performed by the ClimPACT2 package) presented in this study are performed using NCAR Command Language (NCL) Version 6.3 [43].
2.3. Indices
This study made use of indices from World Meteorology Organization (WMO) Expert Team on Climate Risk and Sector-specific Climate Indices (ET-CRSCI) [44], which are based on daily precipitation in order to assess future changes in precipitation extremes. These indices characterize moderate extreme events with recurrence times of a year or less [18], i.e., events that are not record-setting and occur frequently enough to be amenable to statistical analysis, but still have substantial impacts. These indices have been widely used for analyzing changes in extremes in observational records, as well as climate change projections, e.g., [14,15,45,46,47,48,49]. ClimPACT2 [44], a downloadable R-software package developed by ET-CRSCI that calculates a wide range of sector-specific climate indices, was used to generate extremes. The ClimPACT2 software is based on the RClimDEX software developed by the WMO CCl/CLIVAR/JCOMM Expert Team on Climate Change Detection and Indices (ETCCDI) [18]. Among the wide range of generated indices, a subset of indices that have been widely used in detection, attribution and projection of changes in precipitation-related climate extremes was considered for this study (Table 3). Out of the nine indices considered in this study, ClimPACT2 generates three of the indices (i.e., Simple Daily Intensity Index (SDII), annual sum of daily precipitation ≥95th and ≥99th percentile) only on annual time scales, while the rest are generated both on annual and monthly time scales. Indices on a monthly time scale are aggregated to a seasonal time scale for both evaluation and projection periods. SDII describes the daily precipitation amount averaged over all wet days in a year. The sum of daily precipitation (Total annual Precipitation (PRCPTOT)) and SDII is not necessarily associated with climate extremes, but provides useful information about the relationship between changes in extreme conditions (e.g., RX5DAY or R95p) and other aspects of the distribution of daily precipitation [49].
2.4. Analysis and Evaluation
In order to have confidence in climate change projections, it is essential that climate models are capable of simulating the current climate [50]. For this purpose, precipitation extremes generated from RCM simulations forced by GCMs during the historical period 1989–2005 were compared with indices generated from observed precipitation (i.e., CHIRPSV2), as well as indices generated from RCM simulations forced by ERA-Interim (not shown). The period 1989–2005 was chosen because it is a common period for studies using ERA-Interim, RCM data and CHIRPSv2 observations. Pattern Correlation Coefficient (PCC), mean bias and visual comparisons were used to evaluate the performance of the RCMs in capturing observed precipitation extremes. The PCC (centered) is computed according to the usual Pearson correlation operating on the M grid point pairs of extreme indices generated from RCM simulations and observations [51]:
where y and o are RCM simulated and observed extreme indices at the mth grid point and the over-bars refer to these variables averaged over M grid points (i.e., here, M refers to grid points within the boundary of the Greater Horn of Africa region; see Figure 1. The PCC ranges from −1 to 1 [52] with values closer to one indicating the higher skill of RCMs in capturing the spatial patterns of observed extreme indices over the region. Following the evaluation, indices are calculated for two 30-year climatological periods-reference period (1976–2005) and end of the 21st Century (2069–2098), using daily precipitation from RCM simulations. For each index, 30-year climatological means from each RCM-GCM combination are then generated and averaged to determine an ensemble mean. During the averaging process, equal weights are assigned to each member despite the relative differences in performance during the 1989–2005 period. Projected changes in the respective extreme precipitation indices are then determined by comparing the ensemble mean climatology of the two periods.
3. Result and Discussion
3.1. Comparison between Observed and Simulated Extremes
The skill of CCLM4 and RCA4 RCMs in capturing observed extremes is evaluated using selected representative indices (shown in Figure 2, Figure 3 and Figure 4). Though the evaluation was done on each individual RCM-GCM combination (i.e., eight downscaled datasets), most of the results presented in this and subsequent sections are ensemble mean of the eight individual members. However, the climatological pattern and spatial correlations for the ensemble means are found to outperform the majority of individual members (not shown). See the Supplemantary Materials for the Pattern Correlation Coefficient (PCC) scores, as well as plots for each member and extreme indices. Figure 2a,d,g and Figure 4a,d,g represent observed climatology of precipitation extremes generated from CHIRPSv2, and Figure 2b,e,h and Figure 4b,e,h show the ensemble mean of extremes generated from eight members, where each RCM is driven by four different GCMs. The numbers in the lower right corner of the figures indicate PCC between RCM simulated and observed extremes. In general, the RCM simulations have captured the overall spatial climatological patterns of the selected extremes with PCC above 0.5 for all indices but SDII.
The RCM simulations have reasonably captured the north-south and east-west gradients in annual Total Precipitation (PRCPTOT) over the GHA. Precipitation maxima located over the Ethiopian highlands, southwestern Kenya, the western part of South Sudan and southern Tanzania are also reproduced by RCMs. The PCC of ensemble mean PRCPTOT is 0.65 (Figure 2b), further indicating that the RCM simulations have captured the spatial pattern fairly well. The individual ensemble members have PCCs that range from 0.46–0.65, suggesting that the individual members have a comparable accuracy. The ensemble mean of the models (with the exception of CCLM4 driven by EC-EARTH GCM that has a PCC the same as the ensemble mean, i.e., 0.65) have better scores than individual members, possibly suggesting that the use of ensembles from different RCMs driven by different GCMs might provide an optimal approach to the provision of climate change scenarios over this region [14]. However, noticeable positive bias can be seen over very localized areas like those over the Ethiopian highlands (Figure 2a–c), which resulted from the inaccurate spatial extent of wet spots in addition to the overestimation. This is also the case with RCM simulations driven by ERA-Interim reanalysis as perfect boundary conditions (not shown). Given the lack of sufficient gauging stations used in the development of gridded precipitation datasets over the region [21,22,41], it is expected that the localized wet biases might be an issue with the observational dataset. However, a quick comparison of annual precipitation climatology between the RCM ensemble and fifteen gauge stations in Ethiopia located over areas with the largest wet biases (not shown) showed a wet bias ranging from ≈400–1300 mm. Apart from these localized positive biases, significant underestimations can be seen over a larger area covering the Ethiopian Rift Valley, western Kenya, western Uganda and Rwanda.
The pattern of maximum five-day precipitation (RX5DAY) (Figure 2d–f) and annual sum of daily precipitation ≥99th percentile (R99p) (Figure 4a–c) follows the PRCPTOT pattern. In the same way as PRCPTOT, simulated extremes have captured the overall spatial pattern with PCCs of 0.77 and 0.54 for RX5DAY and R99p, respectively. However, similar to the PRCPTOT case, simulations overestimated RX5DAY and R99p over the Ethiopian highlands, western South Sudan and parts of Tanzania and underestimated them over eastern Kenya. The mean bias over some of these locations is in excess of ±75 mm for both indices.
The RCM-simulated extremes performed poorest in capturing the observed mean pattern of SDII (Figure 2g–i). This is evident from the lowest PCC value of 0.31. As SDII is the ratio of PRCPTOT and number of rainy days, its correct representation is subject to how well the RCMs simulate total rainfall and associated rainy days. SDII is significantly overestimated over small areas where total annual precipitation is overestimated and slightly underestimated over a large area where total annual precipitation is underestimated. To better understand the possible reasons for the very low PCC for ensemble mean SDII, each individual ensemble member (including ERA-Interim-driven cases) is compared with observed SDII (Figure 3). It can be seen that the low PCC in the ensemble mean SDII comparison is the result of the poor performance of CCLM, which has a PCC ranging from 0.04–0.2 when driven by GCMs and only improves slightly (0.26) when driven by ERA-Interim. Major deficiencies leading to low PCC in CCLM include significantly overestimated SDII over the Sahara Desert parts of northern Sudan and underestimated SDII over southeastern Ethiopia and coastal areas of GHA extending from Somalia to Tanzania. Though RCA4 performed relatively better than CCLM, significant biases in SDII can also be seen In the RCA4 case. The largest negative bias is seen over the eastern half of Ethiopia and southeastern Kenya, while the Ethiopian highlands, western Kenya and parts of southern Tanzania show the highest positive bias in SDII. It can be seen that the spatial pattern in SDII bias is similar to PRCPTOT. Furthermore, analysis of the mean annual number of rainy days (precipitation > 1 mm) (not shown) indicated that the RCMs have reasonably reproduced the observed number of rainy days in a year, and their spatial pattern with CCLM performs relatively better than RCA4. This indicates that positive/negative bias in the intensity of rainfall is the probable cause of overestimated/underestimated SDII and thereby low PCC values.
The general pattern of the simulated maximum number of Consecutive Dry Days (CDD) is in general consistent with the observations (Figure 4g–i), as well as RCM simulation forced by ERA-Interim (not shown); for example, shorter CDD over the Ethiopian highlands, eastern Tanzania, Uganda and western Kenya and relatively longer duration CDD over northern Kenya and western Tanzania. However, there is a consistent overestimation of CDD over large parts of the region, with bias ranging from a few days to several weeks. On the other hand, CDD is underestimated over northwestern Ethiopia, Eritrea and eastern Tanzania, with the latter being most significant (120–160 days). However, it should be noted that CDD calculations included the climatologically dry seasons, which might be one or two months over some locations, but an entire year without rain for others. Thus, a single rainy day that is not captured by RCMs can result in a bias of several weeks in CDD. In addition, given the very sparse gauge network over parts of the region, the amount of observed data used in the construction of CHIRPSv2 data is very small over these locations. Thus, observational uncertainty can be quite large and can potentially be attributed to some of the biases in CDD and the other indices.
It can be seen from the above evaluations that this study is based on the ensemble mean of eight members (i.e., CCLM forced by four GCMs and RCA4 forced by the same set of GCMs). Although this helps in summarizing and presenting results, it hides some key details including inter-RCM differences in skill and added value brought about by RCMs with respect to an individual driving GCM. Although RCMs are capable of adding value to the forcing global climate models, there is a limit to what can be corrected by the downscaling of imperfect driving conditions [14]. For example, a study by [23] over the CORDEX Africa domain investigated the ability of CCLM to improve (or not) the GCMs’ results using the added value score () [53] (using a similar set of GCMs used in this study). This study found out that precipitation intensity is not always better reproduced by the RCM, despite some improvements like correction of the GCMs’ wet bias, satisfactorily reproducing the bimodal distribution of the annual cycle. The added value scores (including GHA region) were positive for some parts of the region (improved GCM), zero score for some (no improvement), and some even have negative scores (deteriorated skill) with significant differences among GCMs and and seasons. Studies by [14,23] over the southern Africa region have also shown that CCLM does not always improve on the GCM seasonal climatology and found GCMs to perform better in producing a reasonable precipitation pattern and amounts over some particular regions.
The evaluation of the added value of downscaling to the driving GCM is beyond the scope of this study, and no attempt has been made to compare the performance of forcing GCMs with RCMs. The reader is referred to [23] for details on RCM (CCLM in particular) added value over Africa and [54] for a detailed assessment of RCM added value (both CCLM and RCA4) over Eastern Africa in terms of their ability to simulate teleconnections and associated atmospheric circulation patterns over the region. On the other hand, we attempted to assess the differences in CCLM and RCA4 skills by comparing RCMs-GCM and RCM-ERA-Interim simulations with observation. As indicated by [23,54], comparing reanalysis-driven and CGCM-driven RCMs results with observational data will help to determine whether errors come from the RCMs or driving lateral boundary conditions. Accordingly, we considered the case with PRCPTOT and SDII indices for such comparison. Figure 5 shows seasonal PRCPTOT generated from CHIRPS (top), bias in seasonal precipitation relative to CHIRPSv2 when ERA-Interim was used as the driving lateral boundary conditions for RCA4 (RCA4-ERA-Interim: second row) and CCLM (CCLM-ERA-Interim: third row), the ensemble mean of four GCMs downscaled by RCA4 (RCA4-GCM: fourth row) and CCLM (CCLM: fifth row) during the four seasons.
Overall, the downscaled simulation has captured the observed spatial patterns of seasonal precipitation when driven by both ERA-Interim and GCMS. The CCLM-GCM simulation has underestimated PRCPTOT during the January-February-March (JFM) season over the southern half of the GHA region with peak dry bias (as high as 600 mm) over southeastern Tanzania. This is in line with [21], who have shown that CCLM underestimates JFM precipitation over the coast of Tanzania compared to ERA-Interim and multiple observational datasets. A similar pattern is seen during the April-May-June (AMJ) and July-August-September (JAS) seasons, but dry biases over South Sudan, southern Uganda, Kenya and the southern half of Ethiopia are further intensified, while significant wet biases are seen over western and northwestern Ethiopia and western Sudan. Endris et al. [6] has also found the majority of RCMs they used in their study to overestimate precipitation over the Ethiopian highlands and Congo Basin. The most notable biases during October-November-December (OND) are wet biases over western and northwestern Ethiopia, eastern Ethiopia and eastern parts of Tanzania. It can be noted that for the JFM, AMJ and JAS seasons, the biases in CCLM-GCM simulations are similar in spatial distribution and magnitude with those seen when CCLM is driven by ERA-Interim reanalysis (third row) and appear to be somehow independent of the influence of the lateral boundary conditions. However, the wet bias over western and northwestern Ethiopia, Eritrea, Sudan and South Sudan can be seen to be lower (by an order 100 mm). Dosio, et. al. [23] has also found CCLM simulation to closely follow the geographical distribution of seasonal precipitation inherited by the GCMs. During OND, CCLM-GCM differs from CCLM-ERA-Interim relatively more than the other seasons, with wet bias being more intense and wide-spread than the latter. Though the wet biases are significantly lower (e.g., those over Ethiopia and eastern Tanzania) in CCLM-ERA-Interim, some of the marginally wet/dry biased areas can be seen to have a more intense dry bias (e.g., eastern Kenya, southern South Sudan and Rwanda).
The RCA4-GCM simulations also show a bias pattern that strongly corresponds to CCLM-GCM, but some key differences can be seen. During the JFM season, the biases in RCA4-GCM simulations over localized areas become extremely large (wet bias over southern Tanzania and dry bias over Rwanda and southern Tanzania). Compared to CCLM-GCM, the wet biases in RCA4-GCM over the Ethiopian highlands and western Sudan are significantly lower, but localized and extreme wet biases are seen over southwestern Ethiopia. RCA4-GCM and CCLM-GCM show the largest contrast during JAS with the former showing extreme wet biases over the Ethiopian highlands (an order of twice observed climatology) and extreme dry bias (more than 600 mm) over northeastern Ethiopia. Similarities between RCA4-ERA-Interim and RCA4-GCMs are even more pronounced than the case with CCLM-ERA-Interim and CCLM-GCMs. However, there are still some improvements, with the wet bias over southern Kenya and Tanzania seen to be significantly smaller for RCA4-ERA-Interim than RCA4-GCM.
However, as suggested by Dosio, et al. [23], the fact that RCMs may not add significant value to the representation of the seasonal precipitation climatology depends on several factors, including the biases inherited by the driving GCM, structural biases of the RCM and, last but not least, the choice of the observational dataset. Studies, [6,22,41], covering the GHA region have highlighted the issue of observational uncertainty by demonstrating discrepancies in several gridded precipitation products. Furthermore, the inability of the RCMs to significantly improve seasonal mean climatology is somehow expected, as, in order to add value, regional climate statistics have to contain fine-scale variability that would be absent on a coarser grid [55]. The work in [23] has demonstrated this by showing that CCLM is able to better simulate some precipitation indices such as the number of consecutive wet and dry days and the frequency of heavy rain events and, therefore, supposedly is the most reliable when looking at climate change projections.
The uncertainties associated with observational datasets is highlighted by several studies over the region, e.g., [6,22,41], by demonstrating discrepancies in several gridded precipitation products. In addition to these studies, we compared selected indices (i.e., PRCPTOT, RX1DAY, SDII and R10 mm) generated on annual time scales from different daily rainfall gridded products to briefly highlight possible observational uncertainties of extreme indices. The daily gridded datasets considered are (in addition to CHIRPSv2): Global Precipitation Climatology Project Version 1.2 (GPCP) with 1 × 1 resolution [56]; Tropical Rainfall Measuring Mission version 7 (TRMM 3B42) with 0.25 × 0.25 resolution [57]; the Global Precipitation Climatology Centre Version 7 (GPCC) with 1 × 1 resolution [58] and EartH2Observe, WATCH forcing data methodology applied to ERA-Interim reanalysis data and ERA-Interim data Merged and Bias-corrected for Inter-Sectoral Impact Model Inter-comparison Project(EWEMBI) dataset with 0.75 × 0.75 resolution [59]. A 16-year common period from 1998–2013 is selected for analysis, and each of the selected indices was first generated on the native grid and the temporal mean over the 16-years period then regridded to the CHIRPS grid configuration. Figure 6 shows a comparison of the above indices on annual time scales averaged over the 1998–2013 period. The pattern correlation coefficient is also calculated for the mean climatology of the above indices over the entire GHA region to show similarities in spatial patterns of the indices across datasets (Table 4).
The high pattern correlation coefficients for PRCPTOT found between all pairs of observation datasets (exceeding 0.9) in Table 4 shows that there is a good level of agreement in the observed precipitation patterns. TRMM followed by EWEMBI, which has a relatively higher spatial resolution, agree well with CHIRPS, while GPCP, which has lower resolution, has underestimated annual rainfall maxima located over the Ethiopian highlands, western Kenya and eastern Uganda. For R10 mm, the datasets also agree reasonably well except for EWEMBI, which shows consistently fewer days with daily precipitation greater than 10 mm, with differences over South Sudan, Uganda and western Tanzania being the most significant. This is also reflected in the correlation coefficients, i.e., relatively lower scores are seen when datasets are correlated with EWEMBI. In the case of SDII, model disagreement is relatively higher, and correlations can be seen to range from 0.35–0.74. As shown in Figure 2, the comparison of CHIRPSv2 with the ensemble mean of RCM simulations has the lowest pattern correlations for SDII. The relatively higher disagreement between datasets for SDII is partly justified because disagreements can occur either as a result of differences in annual total precipitation and/or the number of wet days. Unlike total annual precipitation, CHIRP, GPCP and GPCC appear to agree more for SDII, with three of the highest correlation scores for the SDII index occurring among these three datasets (Table 4).
As can be seen from Figure 6 and Table 4, the differences in PRCPTOT cannot explain the disagreements in SDII among datasets. A quick comparison of mean annual wet day frequency (>1 mm) shows that EWEMBI has too many rainy days, particularly higher over western and southwestern Ethiopia and southern South Sudan areas around Lake Victoria. TRMM, on the other hand, has a fairly similar or even lower wet day frequency compared to CHIRPS, GPCP and GPCC. The SDII pattern that stands out from the rest of the datasets results from the higher number of days with heavier rainfall intensities. This can be seen from spatial patterns in RX1DAY in Figure 6, which indicate that TRMM has significantly higher intensities than the other datasets. It should also be noted that for SDII, the comparison of CHIRPSv2 with RCM simulation (RCA4 RCM in particular) shows a better agreement than observational datasets (e.g., CHIRPS vs. EWEMBI, TRMM vs. GPCC, TRMM vs. GPCP and GPCP vs. EWEMBI) (Figure 3). The above analysis indicates that the datasets generally agree with each other, but at the same time, some notable differences can be seen, especially for the more extreme indices like RX1DAY. Thus, these differences (observational uncertainties) should be taken into consideration while evaluating RCM performances during historical periods.
3.2. Projected Changes in PRCPTOT and SDII
Percentage changes in the ensemble mean annual and seasonal PRCPTOT by the end of the 21st Century (2069–2098) relative to the reference period (1976–2005) are shown in Figure 7. Stippling shows changes that are not significant at the 5% significance level. On an annual time scale, the central part of Somalia is the only place in the region with a statistically-significant increase in PRCPTOT (i.e., 10–20%) under RCP4.5. Under the RCP8.5 scenario, the increase in PRCPTOT covers all of Somalia, southeastern Ethiopia and the eastern half of Kenya, with the northeastern tip of Somalia showing changes that go above 70%. However, it should be noted that the majority of the above locations receive less than 300 mm of rainfall on average, and thus, the changes are only a few tens of millimeters. On the other hand, statistically-significant reduction as high as 50% can be seen over western and northern Ethiopia, Eritrea, South Sudan and Sudan under RCP4.5 The spatial pattern of decrease in PRCPTOT under RCP8.5 is consistent with RCP4.5, but the magnitude of changes increases by approximately 10%.
On seasonal timescales, the change patterns differ from season to season. During the JFM season, most of the GHA region receives little to no rain, while most of Tanzania and Burundi receive a large proportion of their annual rainfall (30–80%). The changes in JFM rainfall under RCP4.5 are not statistically significant for the majority of the GHA. Under RCP8.5, the decrease in PRCPTOT seen over southwestern Ethiopia, southern Uganda and Rwanda is significant and goes as high as 70%, 30% and 20%, respectively. Over Tanzania, where JFM rain is critical, the western part of the country shows a slight reduction in PRCPTOT, while the eastern part (extending to parts of southern Kenya) shows an increase of 20–30%. During the AMJ season, all the statistically-significant changes are decreases in PRCPTOT and cover the northern half of the GHA. Western and southwestern Ethiopia, southwestern South Sudan, western Kenya, parts of northern Uganda and narrow coastlines in Kenya and Tanzania are the wettest regions during the AMJ season, and AMJ rains account for 30–70% of annual precipitation for these locations. Thus, the reduction in PRCPTOT will be most significant for the above locations and range from 10–30% under the RCP8.5 scenario. The decrease in AMJ precipitation (at least for southeastern Ethiopia and Somalia) is in line with the findings of [60], who found a considerable weakening of the southeasterly cross-equatorial moisture transport (associated with the Somale Jet) by early May and thereby a premature end of the rainy season. For the JAS season, the central parts of the GHA between 5N and 16N (including the Ethiopian highlands, Eritrea, South Sudan and southern parts of Sudan) receive 30–90% of their annual rainfall. In the same way as the AMJ season, all statistically-significant changes are reductions in PRCPTOT. These reductions range from 10–50% and are most critical for Eritrea (and the adjoining area in Ethiopia) and southern parts of Sudan, as these locations are already marginally dry with JAS rainfall below 400 mm. Though areas like Tanzania and Kenya show large decreases of up to 70%, these locations are climatologically dry during this season and receive PRCPTOT less than 100 mm.
Unlike the AMJ and JAS seasons, during the OND season, parts of GHA covering Uganda, northern Tanzania, Kenya, southern Ethiopia and Somalia can be seen to have a statistically-significant increase in seasonal precipitation. The projected increase in OND rains, ranging from 30–90%, will have the most impact for the eastern half of Kenya, southeastern Ethiopia and southern Somalia as they receive 30–80% of their annual rainfall during the OND season. This can be partly attributed to a projected anomalous moisture influx from the Atlantic Ocean through the Congo Basin over the equatorial GHA region during the OND season [61]. The work in [60] also found the OND season to be lengthened by about two months in the 21st Century simulation in the southern Kenya and Tanzania region in association with a continental-scale pattern with enhanced rainfall along a diagonal to the northeast of the climatological position of the South Indian Convergence Zone (SICZ) and drying to the southwest. This represents a northeastward shift of the SICZ in response to a strengthening of the thermal low (Angola low). This can also be one potential driver for the statistically-significant increases (>70%) in OND precipitation (PRCPTOT), which extends to the JFM season, where increases in seasonal rainfall are statistically significant over southern Kenya and Tanzania. In addition to PRCPTOT, it can be seen in the subsequent section that SDII, RX1DAY, R95p and R10 mm show a statistically-significant increase during OND, while CDD show a decrease.
The SDII, which is the ratio of annual total precipitation and number of wet days, shows an increasing pattern over the entire GHA except for fragmented areas stretching from the Ethiopian highlands all the way to Eritrea showing decreases of up to 20% (Figure 8). The spatial pattern of change is similar between the RCP4.5 and RCP8.5 scenarios, but under RCP4.5, the changes are not statistically significant for a large proportion of the region. In addition, the magnitude of change is intensified in the RCP8.5 from a few locations showing positive change above 10% under RCP4.5 to a widespread occurrence of similar magnitude (going above 40% on a few occasions). The increasing trend in SDII occurred even for locations where PRCPTOT has decreased (i.e., South Sudan, Sudan and parts of the Ethiopian highlands). With the reduction in PRCPTOT covering a large proportion of the GHA (Figure 7a–b) and also the slight increase in annual PRCPTOT, the increase in SDII over the majority of the domain indicates that there will be fewer rainy days, but with higher intensity.
3.3. Projected Changes in RX1DAY and RX5DAY Precipitation
Changes in highest one-day (RX1DAY) precipitation totals in a season for the RCP4.5 and RCP8.5 scenarios are shown in Figure 9. Changes in RX1DAY vary considerably (both in pattern and intensity) among seasons. However, for all four seasons, statistically-significant changes are seen over a small fraction of the region. During the JFM season, a reduction of up to 5 mm can be seen over the northwestern and western parts of Ethiopia, Eritrea and western Sudan, while an increase of up to 20 mm is seen over southern parts of Tanzania and southern parts of Kenya under the RCP8.5 scenario. It should be noted that, while Tanzania and Burundi receive a large proportion of annual rains in JFM, the majority of the region receives little or no rainfall during JFM, which accounts for a relatively small change in RX1day. For the AMJ season, except for slight increases (under 10 mm) over Tanzania and Uganda during the RCP8.5 scenario, the statistically-significant changes are negative and located over the northern part of the region. The decreases in RX1DAY go as high as 20 mm and cover Eritrea, Sudan, northern Ethiopia, Djibouti and northern parts of South Sudan. It should be noted that AMJ is not the main rainy season for the above locations and accounts for less than 30 mm of annual rainfall. Thus, the changes in RX1DAY resemble the change in seasonal total precipitation over these locations (Figure 7).
During JAS, statistically-significant increases in RX1DAY are seen over parts of the GHA that are relatively wetter during this season and cover large parts of South Sudan and northern parts of Ethiopia. For most of these locations, seasonal precipitation is projected to decrease, and the increases in RX1DAY suggest the occurrence of fewer and more intense rainy days. In areas like Tanzania where total JAS rainfall falls short of 100 mm, the decreasing pattern is the reflection of the projected decrease in JAS precipitation as a whole. For OND, all the statistically-significant changes are positive and cover a small area under RCP4.5 when compared with RCP8.5. Under RCP4.5, southern Somalia and parts of Uganda are the only places showing a statistically-significant increase, as high as 15 mm. Under RCP8.5, the areas with statistically-significant changes increase significantly and cover all of Somalia, southeastern Ethiopia, Kenya, Uganda, Rwanda, Burundi and northern Tanzania. For RX1DAY, the magnitude of change has also increased significantly and is greater than 20 mm over a few locations.
Changes in highest five-day (RX5DAY) total precipitation in a season for the RCP4.5 and RCP8.5 scenarios are shown in Figure 10. As in RX1DAY, changes in RX5DAY show season-to-season differences, and statistically-significant changes are seen over a small fraction of the region for all seasons. Despite the differences in magnitude of change, RX5DAY shows a similar pattern of changes. During JFM, northwestern and western parts of Ethiopia, parts of Eritrea and a small part of Sudan were the only locations with statistically-significant changes, with the latter having the largest decrease (70 mm). Under RCP8.5, the reduction in RX5DAY intensifies and covers a wider area that includes western and northern Ethiopia, Eritrea, eastern and northeastern Sudan. In addition, the increases in RX5DAY over southern Kenya, southern Tanzania, southeastern Ethiopia and northern Somalia become statistically significant under RCP4.5.
For the AMJ season, statistically-significant increases (15–30 mm) are seen over central Tanzania and western Uganda under the RCP8.5 scenario. Statistically-significant decreases of up to 70 mm can be seen over the northern part of the region (i.e., Eritrea, Sudan, northern Ethiopia, Djibouti and northern parts of South Sudan) under both RCP4.5 and RCP8.5. During JAS, increases in RX5DAY are seen over parts of south Sudan and northern parts of Ethiopia, with the highest increase (50 mm) located over small areas. The decrease in RX5DAY appears to be more pronounced, especially over Tanzania, which shows a decrease of up to 100 mm. In the same way as RX1DAY, all the statistically-significant changes in RX5DAY for the OND season are positive. The spatial extent of areas with statistically-significant changes increase from RCP4.5 to RCP8.5 and covers all of Somalia, southeastern Ethiopia, Kenya, Uganda, Rwanda, Burundi and northern Tanzania. The increase in RX5DAY is below 15 mm in most cases, but increases as high as 50 mm in a few locations like northern Somalia and western Kenya.
3.4. Projected Changes in Daily Precipitation Absolute Threshold Indices
On a daily scale, days with precipitation in excess of 10 mm and 20 mm are considered as heavy (R10 mm) and very heavy (R20 mm) precipitation days, respectively [44]. The changes in both indices show a similar spatial pattern for annual and seasonal time scales except for differences in the magnitude of changes, which is higher for R10 mm as it occurs more frequently than R20 mm (Figure 11 and Figure 12). Unlike the indices discussed above, there is not much difference between changes seen under RCP4.5 and RCP8.5 (with the exception of patches over the Ethiopian highlands). This is particularly the case with R20 mm. The difference between the two emission scenarios is in the spatial extent of statistically-significant changes, which are larger under RCP8.5. On annual time scales, both indices show a general north-south pattern (i.e., an increasing trend over the southern half and a decreasing trend in the northern half of the region, with the highest decrease of more than 10 days seen over the Ethiopian highlands). The magnitude of the highest positive change is much lower than the negative changes. For example, the highest increase in R10 mm under RCP8.5, covering the majority of Somalia, parts of Kenya, Uganda and Tanzania, is only four days.
On seasonal time scales, the spatial patterns vary from one season to the other. For the JFM season, a change in R10 mm and R20 mm is in the ±2 days range except for southeastern Tanzania, which shows an increase of up to four days for R10 mm under RCP8.5. Unlike Tanzania, where JFM is the main rainy season, most of the other locations with statistically-significant changes are either climatologically dry or receive a small amount of rainfall (100–300 mm) by the end of the JFM season as spring rains start to set in (e.g., southwestern Ethiopia). For the AMJ season, all subregions receiving spring rains (western and southwestern Ethiopia, western Kenya, northern Uganda and South Sudan), with the exception of the Indian Ocean coastline from southern Somalia to Kenya, show statistically-significant changes on the order of -2 days for most locations and going as high as eight days over parts of the Ethiopian highlands. Northwestern Tanzania and southern Uganda showed an increase in heavy precipitation days (two days) during their dry seasons. During the Northern Hemisphere summer, subregions with statistically-significant changes in R10 mm and R20 mm become defined only under RCP8.5. The changes in R10 mm and R20 mm show similar patterns as mean JJA precipitation (Figure 7),i.e., slight increases (≤2 days) in R10 mm and R20 mm over parts of South Sudan, southern Uganda, the northern part of Tanzania and fragmented locations in Ethiopia and decreases elsewhere, with a highest magnitude of eight days over Ethiopia. The opposite is true for the OND season, where with only a few exceptions (over Tanzania), all the statistically-significant changes are positive and cover southeastern Ethiopia, Somalia, Kenya, Uganda and Rwanda, as well as adjoining regions in Burundi and Tanzania. Though not large in magnitude, this season accounts for 30–70% of annual rainfall for western Kenya, southeastern Ethiopia and Somalia, and the increase in R10 mm and R20 mm together with the increase in total seasonal precipitation will have a significant impact on pastoral and agro-pastoral communities across the subregion.
3.5. Projected Changes in Daily Precipitation Percentile Indices
In this study, the annual sum of daily precipitation above the 99th (R99p) and 95th percentiles (R95p) represents the percentile-based indices category. Percent changes in R95p and R99p by the end of the 21st Century compared to the reference period are shown in Figure 13a,b, respectively. Both indices show a similar north-south spatial pattern of changes: decreasing to the north and increasing in south and east. However, statistically-significant changes are confined to very small areas.
For R99p, under the RCP4.5 scenario, the Sahara Desert part of northern Sudan and small parts of southern Somalia are the only places with statistically-significant changes of −50–90% and 30–70% respectively. However, as the former is climatologically very dry, the changes in actual units under both scenarios only translate into ±4 mm. Under the RCP8.5 scenario, a small area over the Sudan-Eritrea border, parts of Somalia, western Uganda, an area over the Kenya-Tanzania border and a small area over western Tanzania are the other locations with statistically-significant changes of −30 to (−50)% (10–30 mm), 30–90% (10–40 mm), 20–50% (10–30 mm), 20–50% (10–30 mm) and 20–30% (10–30 mm), in R99p, respectively. The spatial pattern and magnitude of change in R95p is fairly similar to R99p, but the areas with statistically-significant change have increased significantly. For example, under RCP8.5, a reduction of 10–50% can been seen covering parts of western and northern Ethiopia, all of Eritrea and large parts of Sudan. Similarly, 20–90% increases in R95p, which were limited to small parts of Somalia, now cover a majority of Somalia and the southeastern and southern tip of Ethiopia.
3.6. Projected Changes in Duration-Based Precipitation Indices
Among the different duration-based indices in WMO-SCI, this study analyzes the maximum number of Consecutive Dry Days (CDD) in each season and for the year. The seasonal CDD are the maximum of the CDD of the individual months in the seasons. In other words, the analyses do not take into consideration dry spells that start in a given month and spill over to the next month(s) in the season. The annual CDD is calculated in such a way that days in a climatologically dry season are counted. Thus, annual CDD should be taken as a proxy that indicates the increase or decrease in growing season length, and seasonal CDD can be an indication of the risk of within-season dry spell length.
Statistically-significant increases in CDD in a year are projected over western and northern Ethiopia, Eritrea and Tanzania with 0–20% under RCP4.5 and 0–50% under RCP8.5. Statistically-significant decreases in CDD of up to 20% under RCP8.5 can be seen over the central part of the GHA running from east to west and covering the southeastern part of Ethiopia, Somalia and northern Uganda (Figure 14a,b).
CDD shows a very different pattern among seasons. During JFM, CDD decreases for most of the GHA, and over some locations, the reduction goes as high as 50%. However, it increases 10–30% over southwestern and western Tanzania and parts of Burundi, where JFM rains matter most. During AMJ, there is a north-south pattern CDD, decreasing over the southern half and increasing over the northern half of the GHA, with the Ethiopian highlands showing the highest increase (above 70% and 100% for the RCP4.5 and RCP8.5 scenarios, respectively). Changes in CDD during summer range from a slight decrease over a few locations to an increasing pattern that dominates the entire region; this pattern is most significant in South Sudan, western parts of Sudan and Eritrea. Changes in CDD during OND are most significant over Kenya, Tanzania and Burundi; over locations like eastern Kenya and eastern Tanzania, CDD increases by more than 70%. The large changes (both CDD increases and decreases) in the Sahara are not significant due to high volatility in the lengths of very long dry spells spanning many years that may occur in this region [49].
3.7. Model Agreement
As indicated in the previous section, the projected changes reported above for the different indices are the mean of eight ensemble members (i.e., average of the CCLM and RCA4 each forced by four GCMs). However, it should be noted that there is a considerable variation among ensemble members. Thus, it is important to look at the model spread, as it is provides a way to quantify the uncertainties in the projected changes in extreme indices. Figure 15 provides an overview of model agreement on projected changes in the precipitation indices (PRCPTOT, R95p, RX1DAY, R10 mm and CDD) by the end of the 21st Century averaged over the GHA region. Model agreement is assessed based on interquartile and full ensemble member range. In all cases, models projection uncertainty increases from RCP45 to RCP85, i.e., increased interquartile and full ensemble member range. Changes in CDD and R95p (presented in the annual time scale only) are found to be more consistent across the members with the majority showing an increase in regionally averaged seasonal (annual) CDD (R95p). The magnitude of the Interquartile Range (IQR) in CDD might appear relatively large, but the sign of change is consistent. For example, at least seven ensemble members out of eight show positive change in CDD during the JAS and OND seasons under both emission scenarios. The PRCPTOT, RX1DAY and R10 mm indices show a similar change pattern where models agree well during the JFM and OND seasons with relatively small IQR (≤4%) for all three indices. During AMJ and JAS, members disagree in the sign of change and magnitude of spread. For example, for RX1DAY during JAS, half (four out of eight) of the ensemble members show an increase, while the other half show a decrease with interquartile and full ensemble range around 13 and 21%, respectively, under RCP8.5.
In order to examine the spatial variations in model agreement, interquartile range is also computed for all the above indices on a grid-by-grid basis. It is found out that there is a considerable variation in model agreement with seasons. For a given area, ensemble members tend to agree well during the main rainy season and show bigger differences during the off-season. Accordingly, the PRCPTOT, RX1DAY and R10 mm indices can be seen to have similar interquartile range patterns with small IQR (good agreement) seen over South Sudan, the Ethiopian highlands and Eritrea during JAS and the highest IQR (disagreement) during JFM and OND when these places are climatologically dry. The same holds true for Tanzania, where good ensemble member agreement is seen for the above indices during OND and JFM. The R95p (Figure 16) index, as computed for annual timescales, shows an overall spatial pattern in ensemble member agreement. The Ethiopian highlands, southern and western parts of Eritrea, southern Sudan, South Sudan, northern and southwestern Uganda, southwestern Kenya and large parts of Tanzania show good member agreement (). It can also be seen that member agreement deteriorates significantly from RCP4.5 to RCP8.5. For CDD (Figure 17), models agree the least (high IQR) during the JAS season and agree the most (small IQR) during JFM. Areas like the Ethiopian highlands, northeastern Ethiopia, South Sudan, parts of Sudan and southern Eritrea are places where the models disagree the most. Models agree relatively better over Tanzania, Somalia, southeastern Ethiopia (AMJ season) and southern Ethiopia and Kenya and eastern Uganda (JFM season) (see the Supplemantary Materials for spatial patterns in the interquartile range and model agreement on the sign of change for the PRCPTOT, R95p, RX1DAY, R10 mm and CDD indices).
4. Conclusions
This study analyzes how moderate precipitation extremes of the present climate are represented in dynamically downscaled data from models in the CORDEX experiment over the Greater Horn of Africa region and presents projected changes in these extremes by the end of the 21st Century. The analysis was based on an ensemble of two regional climate models, CCLM4 and RCA4, forced by four different GCMs. Occurrences of precipitation extremes for a future climatological period (2069–2098) under the RCP4.5 and 8.5 emission scenarios are compared with the present (1976–2005) climate conditions.
In general, RCM-based simulations are able to reasonably capture the observed climatological patterns of the extreme precipitation indices during the 1989–2005 evaluation period. This can be seen from the PCC between RCM simulated and observed extremes exceeding 0.5 for all indices except the simple daily intensity index. Though we have only reported results from an ensemble mean of multiple RCM-GCM combinations, a comparison of validation results between the ensemble mean and individual ensemble members showed that the latter performed better than almost all individual members. Several other studies have found similar results, e.g., [14,22,49,62], and attribute the improvements to error cancellation between the individual members.
Comparisons of projected extremes by the end of the 21st Century (2069–2098) with a reference period of 1976–2005 show that under RCP8.5, R95p and R99p are projected to increase significantly over the eastern and southern part of the GHA and change only slightly over the rest of the region. The frequency of heavy and very heavy precipitation (R10 mm and R20 mm) is projected to decrease for the northern half of the GHA and increase over the southern half. The decreasing pattern is most significant over the Ethiopian highlands during AMJ (as high as nine days), while an increasing pattern of up to five days is seen over southern Somalia, Kenya and Uganda during the OND season. Precipitation intensities RX1DAY and RX5DAY are likely to increase over most of the GHA during the AMJ and JAS seasons, except over Tanzania. During OND, the increasing pattern dominates, with percentage changes above 70% seen over many locations. Annual CDD is projected to decrease slightly () over the central GHA and increase over the rest of the region, with parts of eastern Tanzania showing up to a 50% increase under RCP8.5. The most critical changes on a seasonal scale include: (1) an increase in CDD over the Ethiopian highlands during the AMJ season, with the highest increase going above 70% and 100% for the RCP4.5 and RCP8.5 scenarios, respectively; (2) a significant increase in CDD during JAS over South Sudan, western parts of Sudan and Eritrea ranging from 30% to more than 100%; and (3) an increase over Kenya, Tanzania and Burundi during OND that goes above 70% over some locations.
However, studies, e.g., [6,21,22,23,41], have shown that the choice of the reference dataset influences the outcome of the RCM performance evaluation. A brief comparison undertaken in this study has also highlighted differences that exist among observational datasets. As such uncertainty in observational datasets can reduce the credibility of RCM skill assessment, due attention should be given to thoroughly investigate RCM skills. As this study used CHIRPSv2 as a primary reference dataset to evaluate RCM skills in capturing observed extremes, future work should include a range of available reference datasets to sufficiently address such uncertainties.
Supplementary Materials
The following are available online at https://www.mdpi.com/2073-4433/9/3/112/s1.
Acknowledgments
This study is supported by the National Drought Mitigation Center (NDMC) at the University of Nebraska-Lincoln and NASA under Grant Agreement NNX14AD30G. The authors thank the Holland Computing Center of the University of Nebraska-Lincoln for the super computing facility used to perform data analysis. The authors also thank Deborah Wood of the NDMC for her thorough editing work.
Author Contributions
Andualem Shiferaw designed the work, analyzed the data and prepared first draft; all co-authors took part in the rest of the writing process.
Conflicts of Interest
The authors declare no conflict of interest.
References
- Dosio, A. Projection of temperature and heat waves for Africa with an ensemble of CORDEX Regional Climate Models. Clim. Dyn. 2017, 49, 493–519. [Google Scholar] [CrossRef]
- Seneviratne, S.I.; Nicholls, N.; Easterling, D.; Goodess, C.M.; Kanae, S.; Kossin, J.; Luo, Y.; Marengo, J.; McInnes, K.; Rahimi, M.; et al. Changes in climate extremes and their impacts on the natural physical environment. In Managing the Risks of Extreme Events and Disasters to Advance Climate Change Adaptation; Cambridge University Press: Cambridge, UK, 2012; pp. 109–230. [Google Scholar]
- Stocker, T. Climate Change 2013: The Physical Science Basis: Working Group I Contribution to the Fifth Assessment Report of the Intergovernmental Panel on Climate Change; Cambridge University Press: Cambridge, UK, 2014. [Google Scholar]
- Mariotti, L.; Diallo, I.; Coppola, E.; Giorgi, F. Seasonal and intraseasonal changes of African monsoon climates in 21st century CORDEX projections. Clim. Chang. 2014, 125, 53–65. [Google Scholar] [CrossRef]
- Case, M. Climate Change Impacts on East Africa: A Review of the Scientific Literature; /hl2006. Available online: www.taccire.suanet.ac.tz/xmlui/bitstream/handle/123456789/138/east_africa_climate_change_impacts.pdf?sequence=1 (accessed on 15 March 2018).
- Endris, H.S.; Omondi, P.; Jain, S.; Lennard, C.; Hewitson, B.; Chang’a, L.; Awange, J.L.; Dosio, A.; Ketiem, P.; Nikulin, G.; et al. Assessment of the Performance of CORDEX Regional Climate Models in Simulating East African Rainfall. J. Clim. 2013, 26, 8453–8475. [Google Scholar] [CrossRef]
- Anyah, R.O.; Qiu, W. Characteristic 20th and 21st century precipitation and temperature patterns and changes over the Greater Horn of Africa. Int. J. Climatol. 2012, 32, 347–363. [Google Scholar] [CrossRef]
- Funk, C.; Dettinger, M.D.; Michaelsen, J.C.; Verdin, J.P.; Brown, M.E.; Barlow, M.; Hoell, A. Warming of the Indian Ocean threatens eastern and southern African food security but could be mitigated by agricultural development. Proc. Natl. Acad. Sci. USA 2008, 105, 11081–11086. [Google Scholar] [CrossRef] [PubMed]
- Williams, A.P.; Funk, C. A westward extension of the warm pool leads to a westward extension of the Walker circulation, drying eastern Africa. Clim. Dyn. 2011, 37, 2417–2435. [Google Scholar] [CrossRef]
- Maidment, R.I.; Allan, R.P.; Black, E. Recent observed and simulated changes in precipitation over Africa. Geophys. Res. Lett. 2015, 42, 8155–8164. [Google Scholar] [CrossRef]
- Lyon, B.; DeWitt, D.G. A recent and abrupt decline in the East African long rains. Geophys. Res. Lett. 2012, 39. [Google Scholar] [CrossRef]
- Mequanint, F.; Takele, R.; Shiferaw, A. Observed and Future Climate Variability and Extremes Over East Shoa Zone, Ethiopia. J. Climatol. Weather Forecast. 2016, 4, 1–9. [Google Scholar]
- Jury, M.R.; Funk, C. Climatic trends over Ethiopia: regional signals and drivers. Int. J. Climatol. 2013, 33, 1924–1935. [Google Scholar] [CrossRef]
- Pinto, I.; Lennard, C.; Tadross, M.; Hewitson, B.; Dosio, A.; Nikulin, G.; Panitz, H.; Shongwe, M. Evaluation and projections of extreme precipitation over southern Africa from two CORDEX models. Clim. Chang. 2016, 135, 655–668. [Google Scholar] [CrossRef]
- Bartholy, J.; Pongrácz, R.; Kis, A. Projected changes of extreme precipitation using multi-model approach. Q. J. Hung. Meteorol. Serv. 2015, 119, 129–142. [Google Scholar]
- Giorgi, F.; Jones, C.; Asrar, G. Addressing climate information needs at the regional level: The CORDEX framework. WMO Bull. 2009, 58, 175–183. [Google Scholar]
- Dosio, A. Projections of climate change indices of temperature and precipitation from an ensemble of bias-adjusted high-resolution EURO-CORDEX regional climate models. J. Geophys. Res. Atmos. 2016, 121, 5488–5511. [Google Scholar] [CrossRef]
- Zhang, X.; Alexander, L.; Hegerl, G.C.; Jones, P.; Tank, A.K.; Peterson, T.C.; Trewin, B.; Zwiers, F.W. Indices for monitoring changes in extremes based on daily temperature and precipitation data. Wiley Interdiscipl. Rev. Clim. Chang. 2011, 2, 851–870. [Google Scholar] [CrossRef]
- Dieterich, C.; Schimanke, S.; Wang, S.; Väli, G.; Liu, Y.; Hordoir, R.; Höglund, A.; Meier, M. Evaluation of the SMHI Coupled Atmosphere-Ice-Ocean Model RCA4-NEMO; Technical Report 47; SMHI: Norrköping, Sweden, 2013. [Google Scholar]
- Rockel, B.; Will, A.; Hense, A. The Regional Climate Model COSMO-CLM (CCLM). Meteorol. Z. 2008, 17, 347–348. [Google Scholar] [CrossRef]
- Panitz, H.J.; Dosio, A.; Büchner, M.; Lüthi, D.; Keuler, K. COSMO-CLM (CCLM) climate simulations over CORDEX-Africa domain: Analysis of the ERA-Interim driven simulations at 0.44∘ and 0.22∘ resolution. Clim. Dyn. 2014, 42, 3015–3038. [Google Scholar] [CrossRef]
- Nikulin, G.; Jones, C.; Giorgi, F.; Asrar, G.; Büchner, M.; Ruth, C.; Christensen, O.; Déqué, M.; Fernandez, J.; Hänsler, A.; et al. Precipitation Climatology in an Ensemble of CORDEX-Africa Regional Climate Simulations. J. Clim. 2012, 25, 6057–6078. [Google Scholar] [CrossRef]
- Dosio, A.; Panitz, H.J.; Schubert-Frisius, M.; Lüthi, D. Dynamical downscaling of CMIP5 global circulation models over CORDEX-Africa with COSMO-CLM: Evaluation over the present climate and analysis of the added value. Clim. Dyn. 2015, 44, 2637–2661. [Google Scholar] [CrossRef] [Green Version]
- Baldauf, M. Stability analysis for linear discretisations of the advection equation with Runge—Kutta time integration. J. Comput. Phys. 2008, 227, 6638–6659. [Google Scholar] [CrossRef]
- Tiedtke, M. A comprehensive mass flux scheme for cumulus parameterization in large-scale models. Mon. Weather Rev. 1989, 117, 1779–1800. [Google Scholar] [CrossRef]
- Kain, J.S.; Fritsch, J.M. A one-dimensional entraining/detraining plume model and its application in convective parameterization. J. Atmos. Sci. 1990, 47, 2784–2802. [Google Scholar] [CrossRef]
- Kain, J. Convective parameterization for mesoscale models: The Kain-Fritcsh scheme. In The Representation of Cumulus Convection in Numerical Models; American Meteorological Society: Boston, MA, USA, 1993. [Google Scholar]
- Ritter, B.; Geleyn, J.F. A comprehensive radiation scheme for numerical weather prediction models with potential applications in climate simulations. Mon. Weather Rev. 1992, 120, 303–325. [Google Scholar] [CrossRef]
- Savijärvi, H. Fast radiation parameterization schemes for mesoscale and short-range forecast models. J. Appl. Meteorol. 1990, 29, 437–447. [Google Scholar] [CrossRef]
- Sass, B.H.; Rontu, L.; Räisänen, P. HIRLAM-2 Radiation Scheme: Documentation and Tests; HIRLAM: Norrköping, Sweden, 1994. [Google Scholar]
- Herzog, H.J.; Vogel, G.; Schubert, U. LLM–a nonhydrostatic model applied to high-resolving simulations of turbulent fluxes over heterogeneous terrain. Theor. Appl. Climatol. 2002, 73, 67–86. [Google Scholar] [CrossRef]
- Cuxart, J.; Bougeault, P.; Redelsperger, J.L. A turbulence scheme allowing for mesoscale and large-eddy simulations. Q. J. R. Meteorol. Soc. 2000, 126, 1–30. [Google Scholar] [CrossRef]
- Buzzi, M.; Rotach, M.W.; Holtslag, M.; Holtslag, A.A. Evaluation of the COSMO-SC turbulence scheme in a shear-driven stable boundary layer. Meteorol. Z. 2011, 20, 335–350. [Google Scholar] [CrossRef]
- Doms, G.; Förstner, J.; Heise, E.; Herzog, H.; Raschendorfer, M.; Schrodin, R.; Reinhardt, T.; Vogel, G. A description of the non-hydrostatic regional model LM (version 3.20). In Part II: Physical Parameterization; Deutscher Wetterdienst: Offenbach, Germany, 2007. [Google Scholar]
- Baldauf, M.; Schulz, J. Prognostic precipitation in the Lokal-Modell (LM) of DWD. Cosmo Newslett. 2004, 4, 177–180. [Google Scholar]
- Rasch, P.; Kristjánsson, J. A comparison of the CCM3 model climate using diagnosed and predicted condensate parameterizations. J. Clim. 1998, 11, 1587–1614. [Google Scholar] [CrossRef]
- Samuelsson, P.; Gollvik, S.; Ullerstig, A. The Land-Surface Scheme of the Rossby Centre Regional Atmospheric Climate Model (RCA3); SMHI: Norrkoping, Sweden, 2006. [Google Scholar]
- Baldauf, M.; Seifert, A.; Förstner, J.; Majewski, D.; Raschendorfer, M.; Reinhardt, T. Operational Convective-Scale Numerical Weather Prediction with the COSMO Model: Description and Sensitivities. Mon.Weather Rev. 2011, 139, 3887–3905. [Google Scholar] [CrossRef]
- Jones, C.G.; Samuelsson, P.; Kjellström, E. Regional climate modelling at the Rossby Centre. Tellus A 2011, 63, 1–3. [Google Scholar] [CrossRef]
- Shongwe, M.E.; Van Oldenborgh, G.; Van Den Hurk, B.; De Boer, B.; Coelho, C.; Van Aalst, M. Projected changes in mean and extreme precipitation in Africa under global warming. Part I: Southern Africa. J. Clim. 2009, 22, 3819–3837. [Google Scholar] [CrossRef]
- Sylla, M.B.; Giorgi, F.; Coppola, E.; Mariotti, L. Uncertainties in daily rainfall over Africa: assessment of gridded observation products and evaluation of a regional climate model simulation. Int. J. Climatol. 2013, 33, 1805–1817. [Google Scholar] [CrossRef]
- Funk, C.; Peterson, P.; Landsfeld, M.; Pedreros, D.; Verdin, J.; Shukla, S.; Husak, G.; Rowland, J.; Harrison, L.; Hoell, A.; et al. The climate hazards infrared precipitation with stations—A new environmental record for monitoring extremes. Sci. Data 2015, 2, 150066. [Google Scholar] [CrossRef] [PubMed]
- UCAR/NCAR/CISL/TDD. The NCAR Command Language (Version 6.3.0) [Software]; UCAR/NCAR/CISL/TDD: Boulder, Colorado, 2016. [Google Scholar]
- Alexander, L.; Yang, H.; Perkins, S. ClimPACT—Indices and Software. User Manual. 2013. Available online: http://www.wmo.int/pages/prog/wcp/ccl/opace/opace4/meetings/documents/ETCRSCI_software_documentation_v2a.doc (accessed on 17 January 2017).
- Frich, P.; Alexander, L.V.; Della-Marta, P.; Gleason, B.; Haylock, M.; Tank, A.K.; Peterson, T. Observed coherent changes in climatic extremes during the second half of the twentieth century. Clim. Res. 2002, 19, 193–212. [Google Scholar] [CrossRef]
- Alexander, L.V.; Zhang, X.; Peterson, T.C.; Caesar, J.; Gleason, B.; Klein Tank, A.M.G.; Haylock, M.; Collins, D.; Trewin, B.; Rahimzadeh, F.; et al. Global observed changes in daily climate extremes of temperature and precipitation. J. Geophys. Res. Atmos. 2006, 111. [Google Scholar] [CrossRef] [Green Version]
- Yin, H.; Donat, M.G.; Alexander, L.V.; Sun, Y. Multi-dataset comparison of gridded observed temperature and precipitation extremes over China. Int. J. Climatol. 2015, 35, 2809–2827. [Google Scholar] [CrossRef]
- Diallo, I.; Giorgi, F.; Deme, A.; Tall, M.; Mariotti, L.; Gaye, A.T. Projected changes of summer monsoon extremes and hydroclimatic regimes over West Africa for the twenty-first century. Clim. Dyn. 2016, 47, 3931–3954. [Google Scholar] [CrossRef]
- Sillmann, J.; Kharin, V.V.; Zwiers, F.W.; Zhang, X.; Bronaugh, D. Climate extremes indices in the CMIP5 multimodel ensemble: Part 2. Future climate projections. J. Geophys. Res. Atmos. 2013, 118, 2473–2493. [Google Scholar] [CrossRef]
- Diro, G.T.; Toniazzo, T.; Shaffrey, L. Ethiopian rainfall in climate models. In African Climate and Climate Change; Springer: Berlin, Germany, 2011; pp. 51–69. [Google Scholar]
- Wilks, D.S. Statistical Methods in the Atmospheric Sciences; Academic Press: Cambridge, MA, USA, 2011; Volume 100. [Google Scholar]
- Pattern Correlation Coefficient. Available online: https://www.ncl.ucar.edu/Document/Functions/ Contributed/pattern_cor.shtml (accessed on 25 April 2017).
- Di Luca, A.; de Elía, R.; Laprise, R. Potential for small scale added value of RCM’s downscaled climate change signal. Clim. Dyn. 2013, 40, 601–618. [Google Scholar] [CrossRef]
- Endris, H.S.; Lennard, C.; Hewitson, B.; Dosio, A.; Nikulin, G.; Panitz, H.J. Teleconnection responses in multi-GCM driven CORDEX RCMs over Eastern Africa. Clim. Dyn. 2016, 46, 2821–2846. [Google Scholar] [CrossRef]
- Feser, F.; Rockel, B.; von Storch, H.; Winterfeldt, J.; Zahn, M. Regional climate models add value to global model data: a review and selected examples. Bull. Am. Meteorol. Soc. 2011, 92, 1181–1192. [Google Scholar] [CrossRef]
- Huffman, G.J.; Adler, R.F.; Morrissey, M.M.; Bolvin, D.T.; Curtis, S.; Joyce, R.; McGavock, B.; Susskind, J. Global Precipitation at One-Degree Daily Resolution from Multisatellite Observations. J. Hydrometeorol. 2001, 2, 36–50. Available online: https://doi.org/10.1175/1525-7541(2001)002<0036:GPAODD>2.0.CO;2 (accessed on 5 February 2018). [CrossRef]
- Huffman, G.J.; Bolvin, D.T.; Nelkin, E.J.; Wolff, D.B.; Adler, R.F.; Gu, G.; Hong, Y.; Bowman, K.P.; Stocker, E.F. The TRMM Multisatellite Precipitation Analysis (TMPA): Quasi-Global, Multiyear, Combined-Sensor Precipitation Estimates at Fine Scales. J. Hydrometeorol. 2007, 8, 38–55. Available online: https://doi.org/10.1175/JHM560.1 (accessed on 5 February 2018). [CrossRef]
- Schneider, U.; Becker, A.; Finger, P.; Meyer-Christoffer, A.; Rudolf, B.; Ziese, M. GPCC Full Data Reanalysis Version 7.0: Monthly Land-Surface Precipitation from Rain Gauges built on GTS based and Historic Data. Available online: https://rda.ucar.edu/datasets/ds496.0/(accessed on 5 February 2018).
- Lange, S. EartH2Observe, WFDEI and ERA-Interim data Merged and Bias-corrected for ISIMIP (EWEMBI): GFZ Data Services. Available online: http://dataservices.gfz-potsdam.de/pik/showshort.php?id=escidoc:1809891(accessed on 5 February 2018).
- Cook, K.H.; Vizy, E.K. Projected Changes in East African Rainy Seasons. J. Clim. 2013, 130222102159002. [Google Scholar] [CrossRef]
- Otieno, V.O.; Anyah, R.O. CMIP5 simulated climate conditions of the Greater Horn of Africa (GHA). Part II: projected climate. Clim. Dyn. 2013, 41, 2099–2113. [Google Scholar] [CrossRef]
- Alexander, L.V.; Arblaster, J.M. Historical and projected trends in temperature and precipitation extremes in Australia in observations and CMIP5. Weather Clim. Extremes 2017, 15, 34–56. [Google Scholar] [CrossRef]
Figure 1.
Study domain covering the Greater Horn of Africa countries. Background: based on 30-arc seconds GTOPO30 Digital Elevation Model https://lta.cr.usgs.gov/GTOPO30.
Figure 1.
Study domain covering the Greater Horn of Africa countries. Background: based on 30-arc seconds GTOPO30 Digital Elevation Model https://lta.cr.usgs.gov/GTOPO30.

Figure 2.
Comparison of selected extremes (i.e., PRCPTOT, RX5DAY and SDII) from observation (a,d,g); the ensemble mean of two RCMs driven by four GCMs (b,e,h) and difference between simulated and observed extremes (c,f,i) for the evaluation period of 1989–2008.
Figure 2.
Comparison of selected extremes (i.e., PRCPTOT, RX5DAY and SDII) from observation (a,d,g); the ensemble mean of two RCMs driven by four GCMs (b,e,h) and difference between simulated and observed extremes (c,f,i) for the evaluation period of 1989–2008.

Figure 3.
Comparison of SDII from observation, RCA4 and CCLM driven by ERA-Interim (top row), RCA4 driven by GCMs (middle row) and CCLM driven GCMs (bottom row) for the evaluation period of 1989–2008. PCC between observed and simulated SDII shown at the bottom right of each figure.
Figure 3.
Comparison of SDII from observation, RCA4 and CCLM driven by ERA-Interim (top row), RCA4 driven by GCMs (middle row) and CCLM driven GCMs (bottom row) for the evaluation period of 1989–2008. PCC between observed and simulated SDII shown at the bottom right of each figure.

Figure 4.
Comparison of selected extremes (i.e., R99p, R10 mm and CDD) from observation (a,d,g) and the ensemble mean of two RCMs driven by four GCMs (b,e,h) and bias (c,f,i) for the evaluation period of 1989–2008.
Figure 4.
Comparison of selected extremes (i.e., R99p, R10 mm and CDD) from observation (a,d,g) and the ensemble mean of two RCMs driven by four GCMs (b,e,h) and bias (c,f,i) for the evaluation period of 1989–2008.
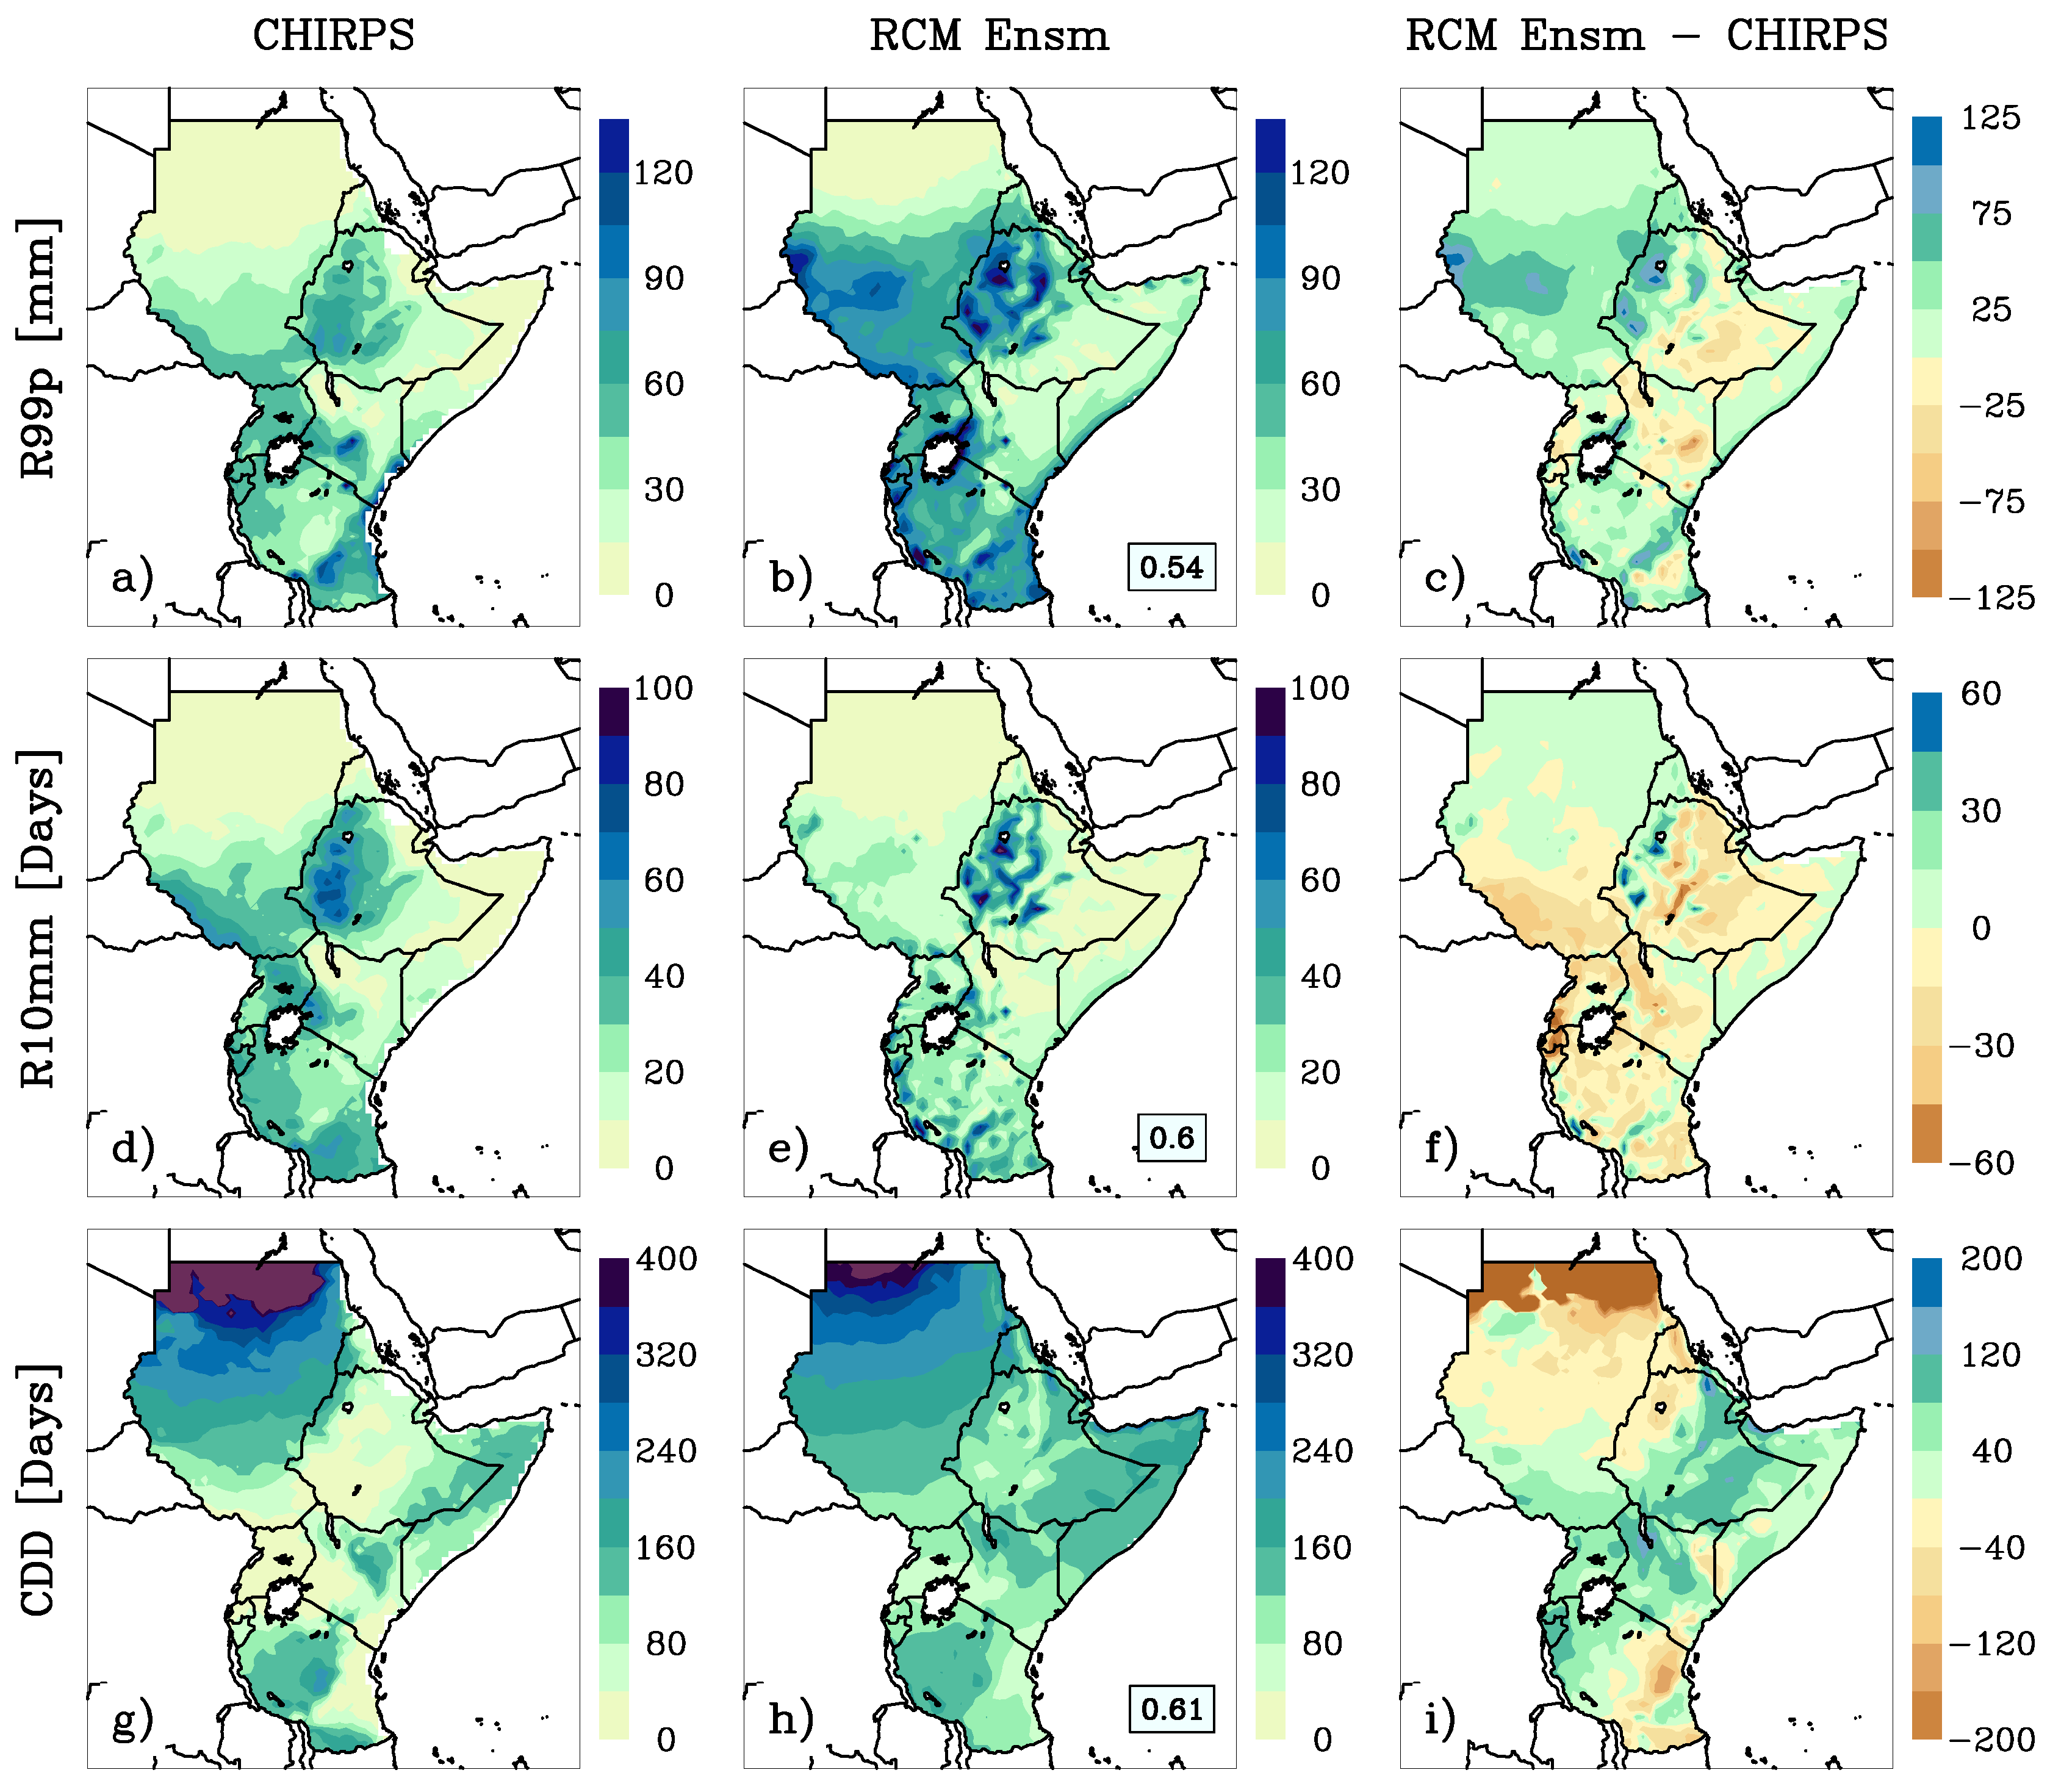
Figure 5.
Seasonal total precipitation climatology (in mm): observed (CHIRPSv2) during the 1989–2008 period (first row), bias in seasonal precipitation climatology relative to CHIRPSv2 for RCA4 driven by ERA-Interim (second row) and GCMs (third row) and for CCLM driven by ERA-Interim (fourth row) and GCMs (fifth row). The bias in RCA4-GCM and CCLM-GCM biases in third and fifth rows is calculated for the ensemble mean RCM simulation driven by the four GCMs used in this study.

Figure 6.
Comparison of mean annual PRCPTOT, SDII, R10 mm and RX1DAY indices (top to bottom) generated from CHIRPS (first column), TRMM (second column), GPCP (third column), GPCC (fourth column) and EWEMBI (fifth column) for the 1998–2013 period.
Figure 6.
Comparison of mean annual PRCPTOT, SDII, R10 mm and RX1DAY indices (top to bottom) generated from CHIRPS (first column), TRMM (second column), GPCP (third column), GPCC (fourth column) and EWEMBI (fifth column) for the 1998–2013 period.

Figure 7.
Projected ensemble mean changes in annual and seasonal precipitation during the 2069–2098 period relative to 1976–2005 for (a) Annual, (c) JFM, (e) AMJ, (g) JAS and (i) OND seasons under the RCP4.5 scenario and (b) Annual, (d) JFM, (f) AMJ, (h) JAS and (j) OND seasons under the RCP8.5 scenario. Stippling indicates grid points with changes that are not significant (5% significance level using the t-test).
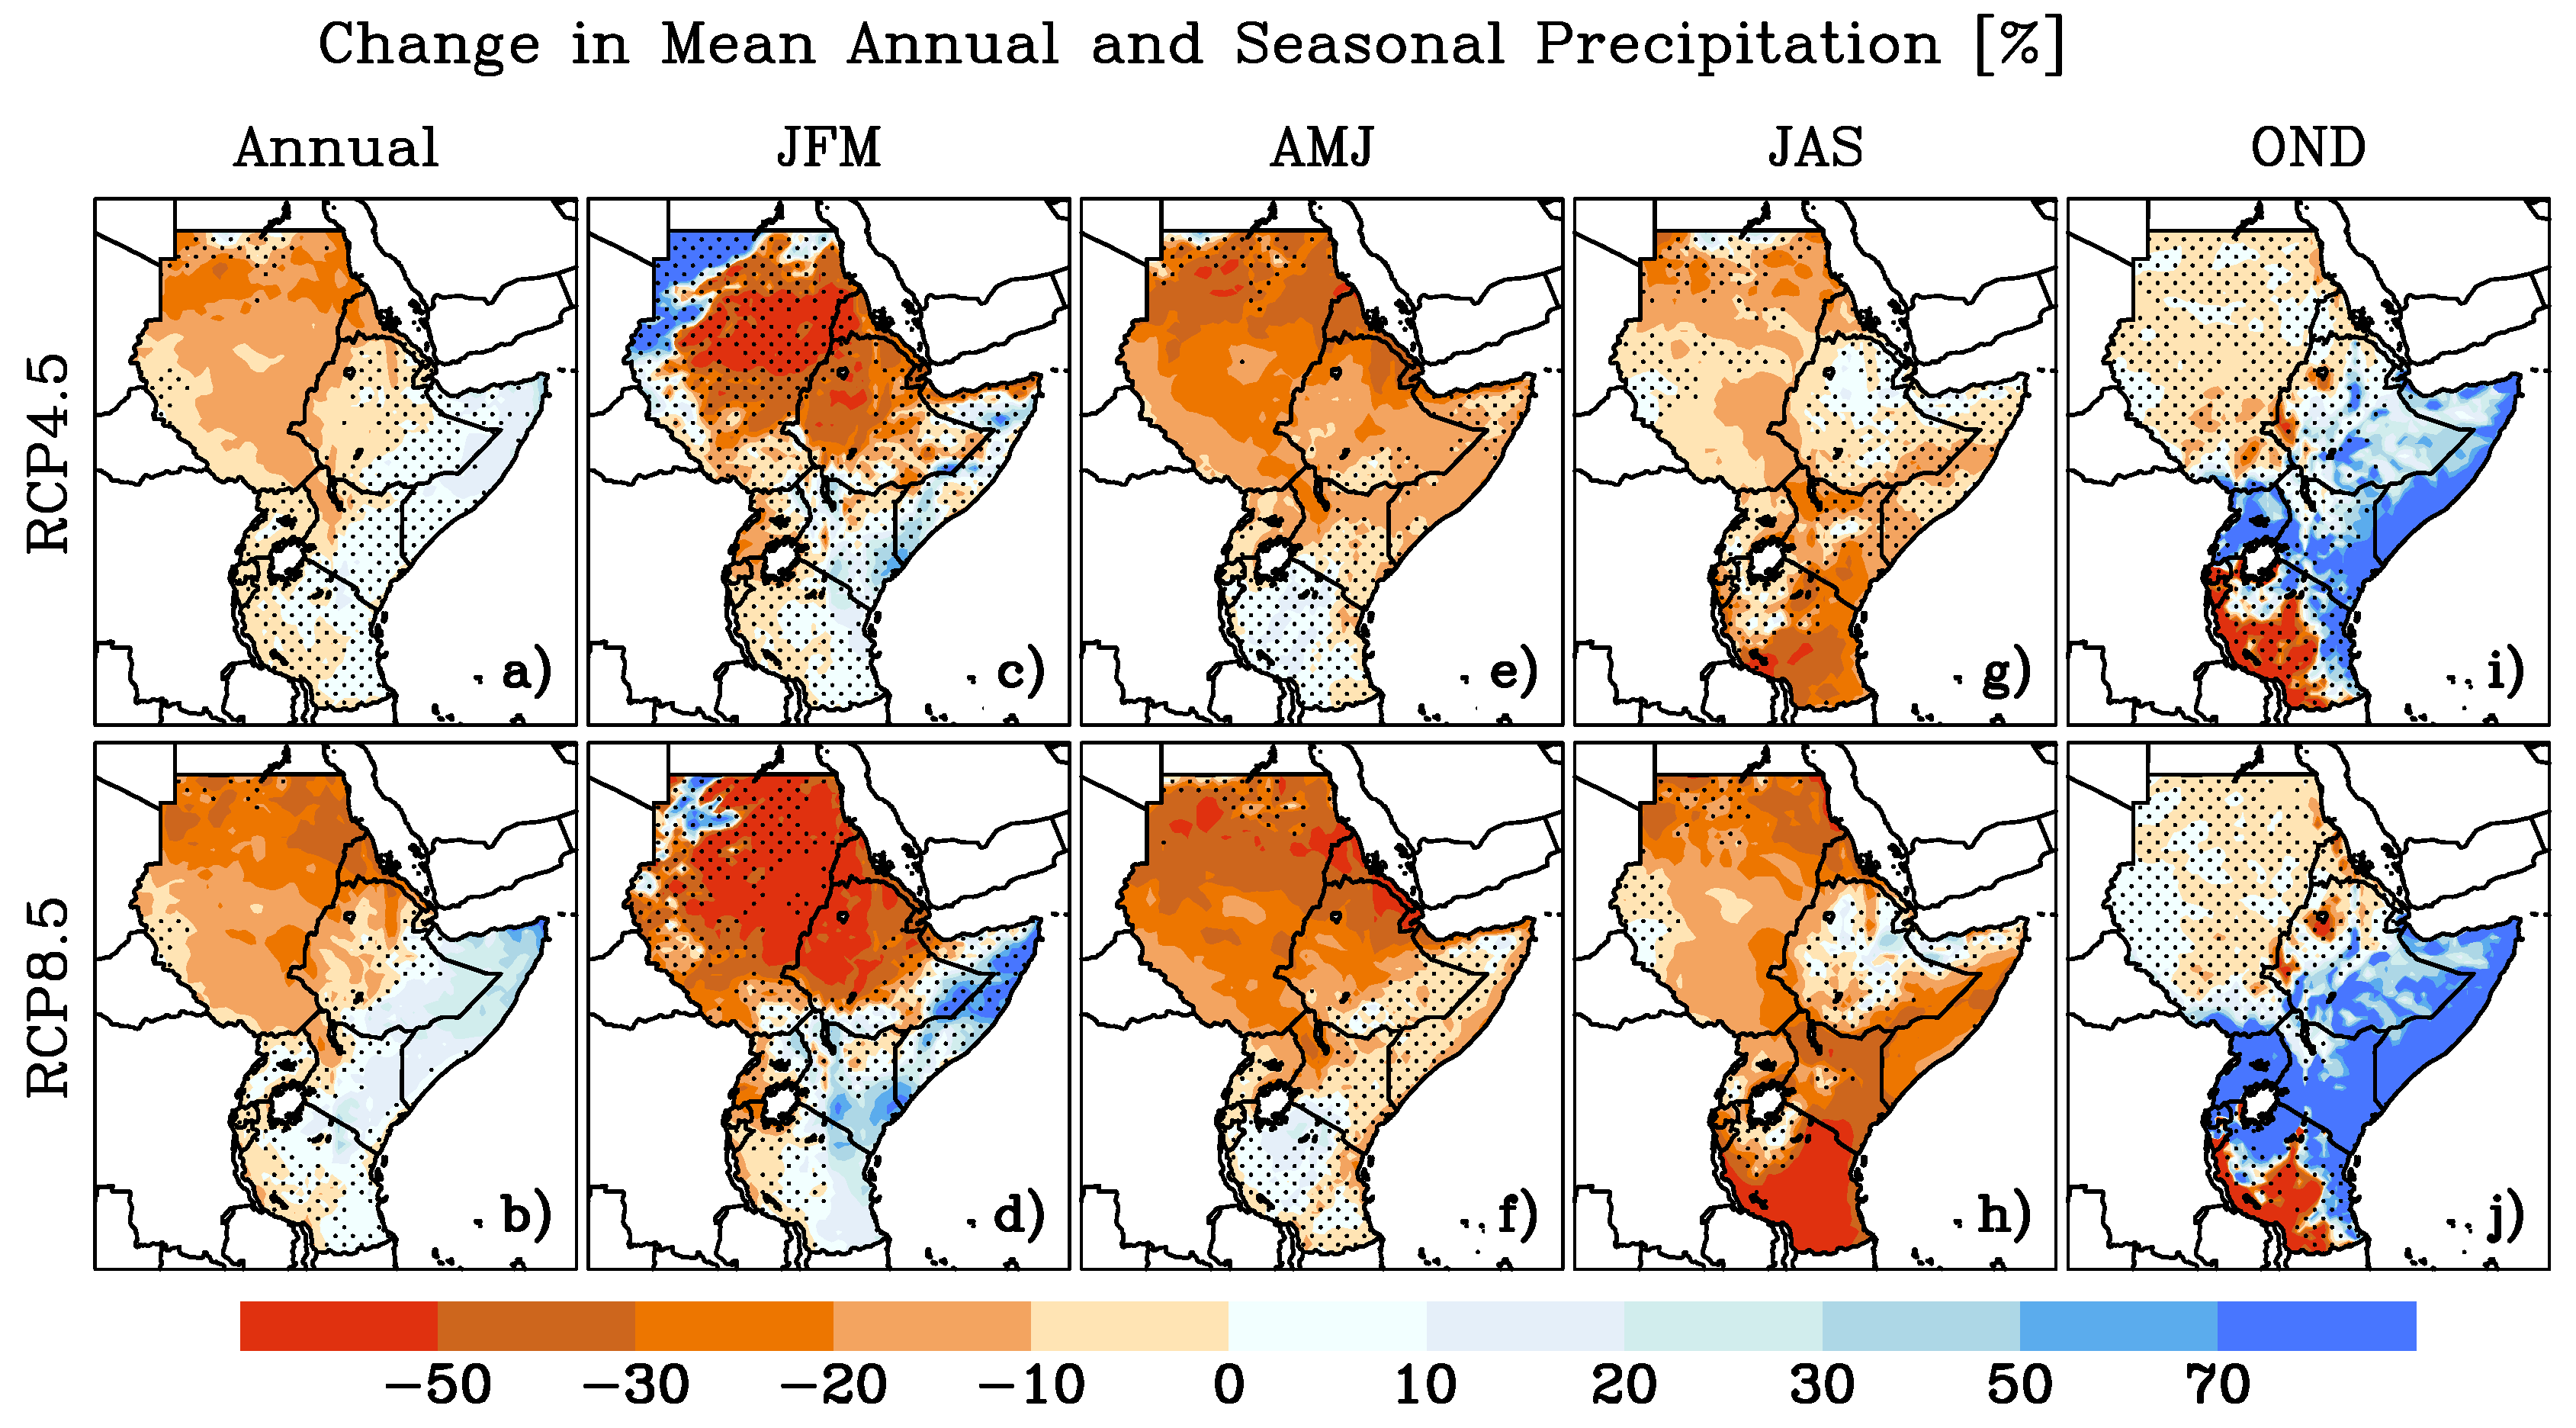
Figure 8.
Projected ensemble mean change in annual simple daily intensity index (SDII) for the period 2069–2098 under RCP4.5 (a) and RCP8.5 (b), relative to the reference period 1976–2005. Stippling indicates grid points with changes that are not significant at the 5% significance level.
Figure 8.
Projected ensemble mean change in annual simple daily intensity index (SDII) for the period 2069–2098 under RCP4.5 (a) and RCP8.5 (b), relative to the reference period 1976–2005. Stippling indicates grid points with changes that are not significant at the 5% significance level.
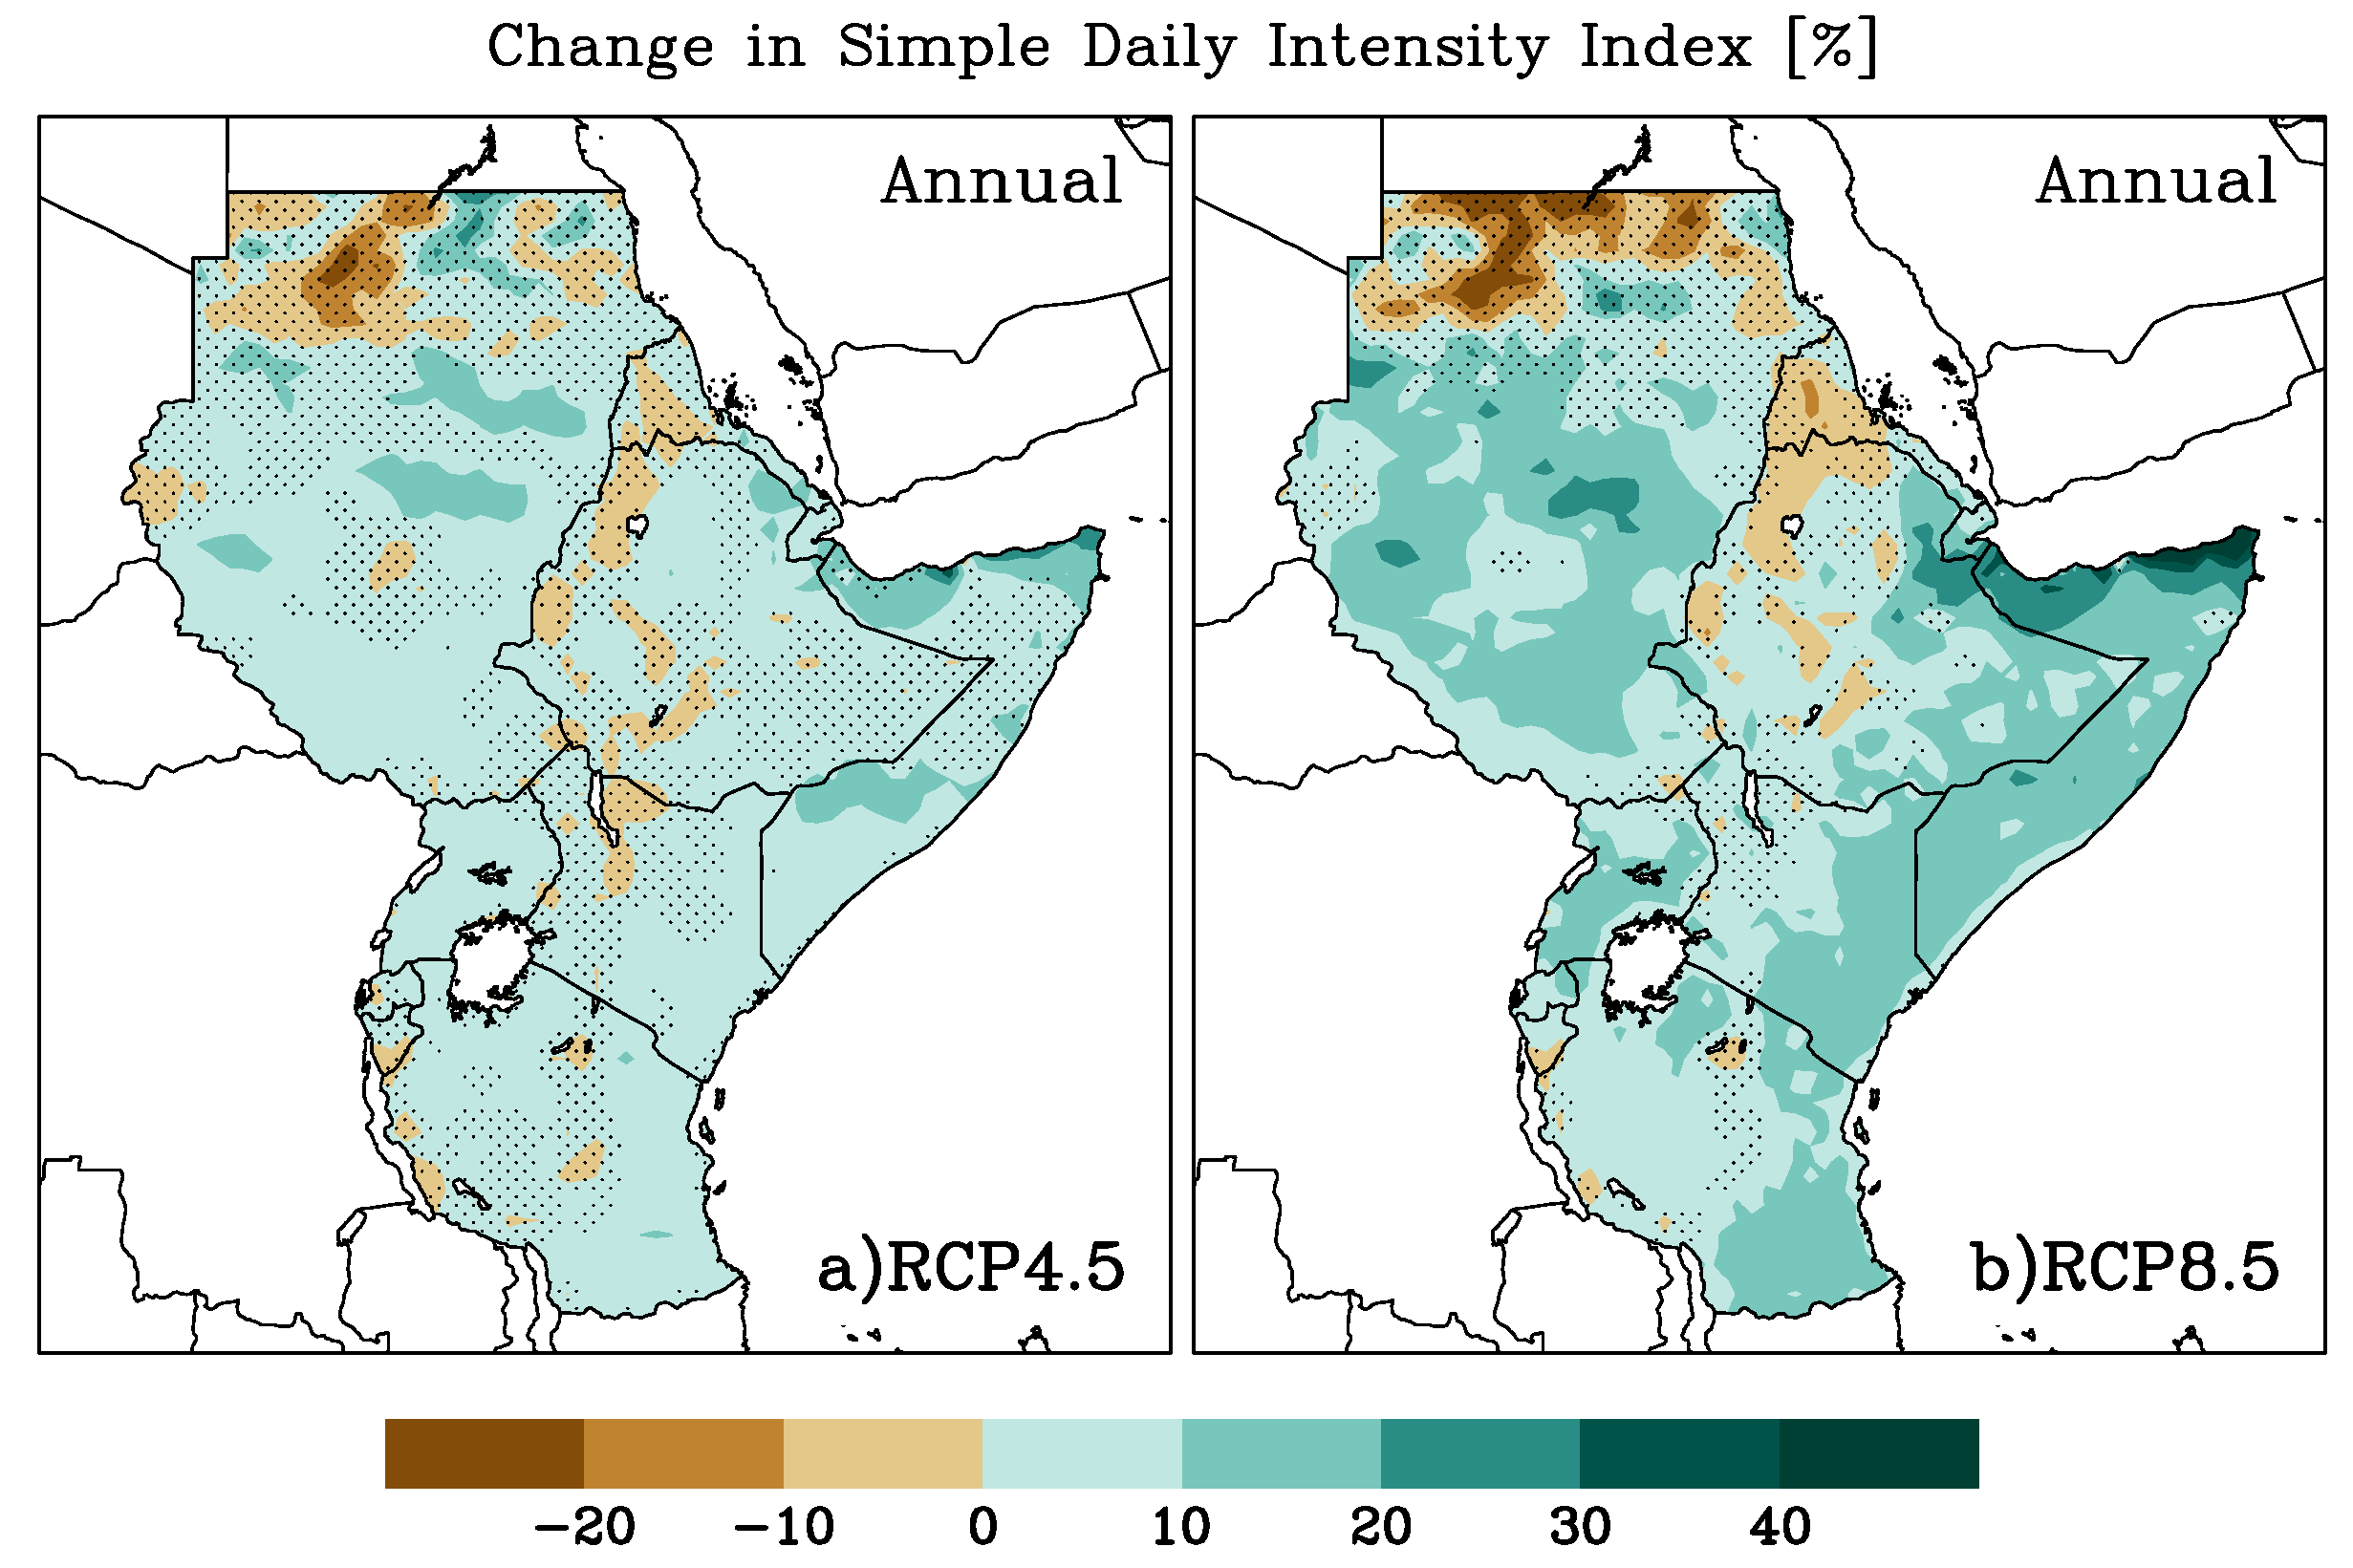
Figure 9.
Projected ensemble mean changes in annual and seasonal maximum one-day precipitation during the 2069–2098 period relative to 1976–2005 for (a) Annual, (c) JFM, (e) AMJ, (g) JAS and (i) OND seasons under the RCP4.5 scenario and (b) Annual, (d) JFM, (f) AMJ, (h) JAS and (j) OND seasons under the RCP8.5 scenario. Stippling indicates grid points with changes that are not significant (5% significance level using the t-test).

Figure 10.
Projected ensemble mean changes in annual and seasonal maximum five-day precipitation during the 2069–2098 period relative to 1976–2005 for (a) Annual, (c) JFM, (e) AMJ, (g) JAS and (i) OND seasons under the RCP4.5 scenario and (b) Annual, (d) JFM, (f) AMJ, (h) JAS and (j) OND seasons under the RCP8.5 scenario. Stippling indicates grid points with changes that are not significant (5% significance level using the t-test).

Figure 11.
Projected ensemble mean changes in annual and seasonal number of days with precipitation greater than 10 mm during the 2069–2098 period relative to 1976–2005 for (a) Annual, (c) JFM, (e) AMJ, (g) JAS and (i) OND seasons under the RCP4.5 scenario and (b) Annual, (d) JFM, (f) AMJ, (h) JAS and (j) OND seasons under the RCP8.5 scenario. Stippling indicates grid points with changes that are not significant (5% significance level using the t-test).
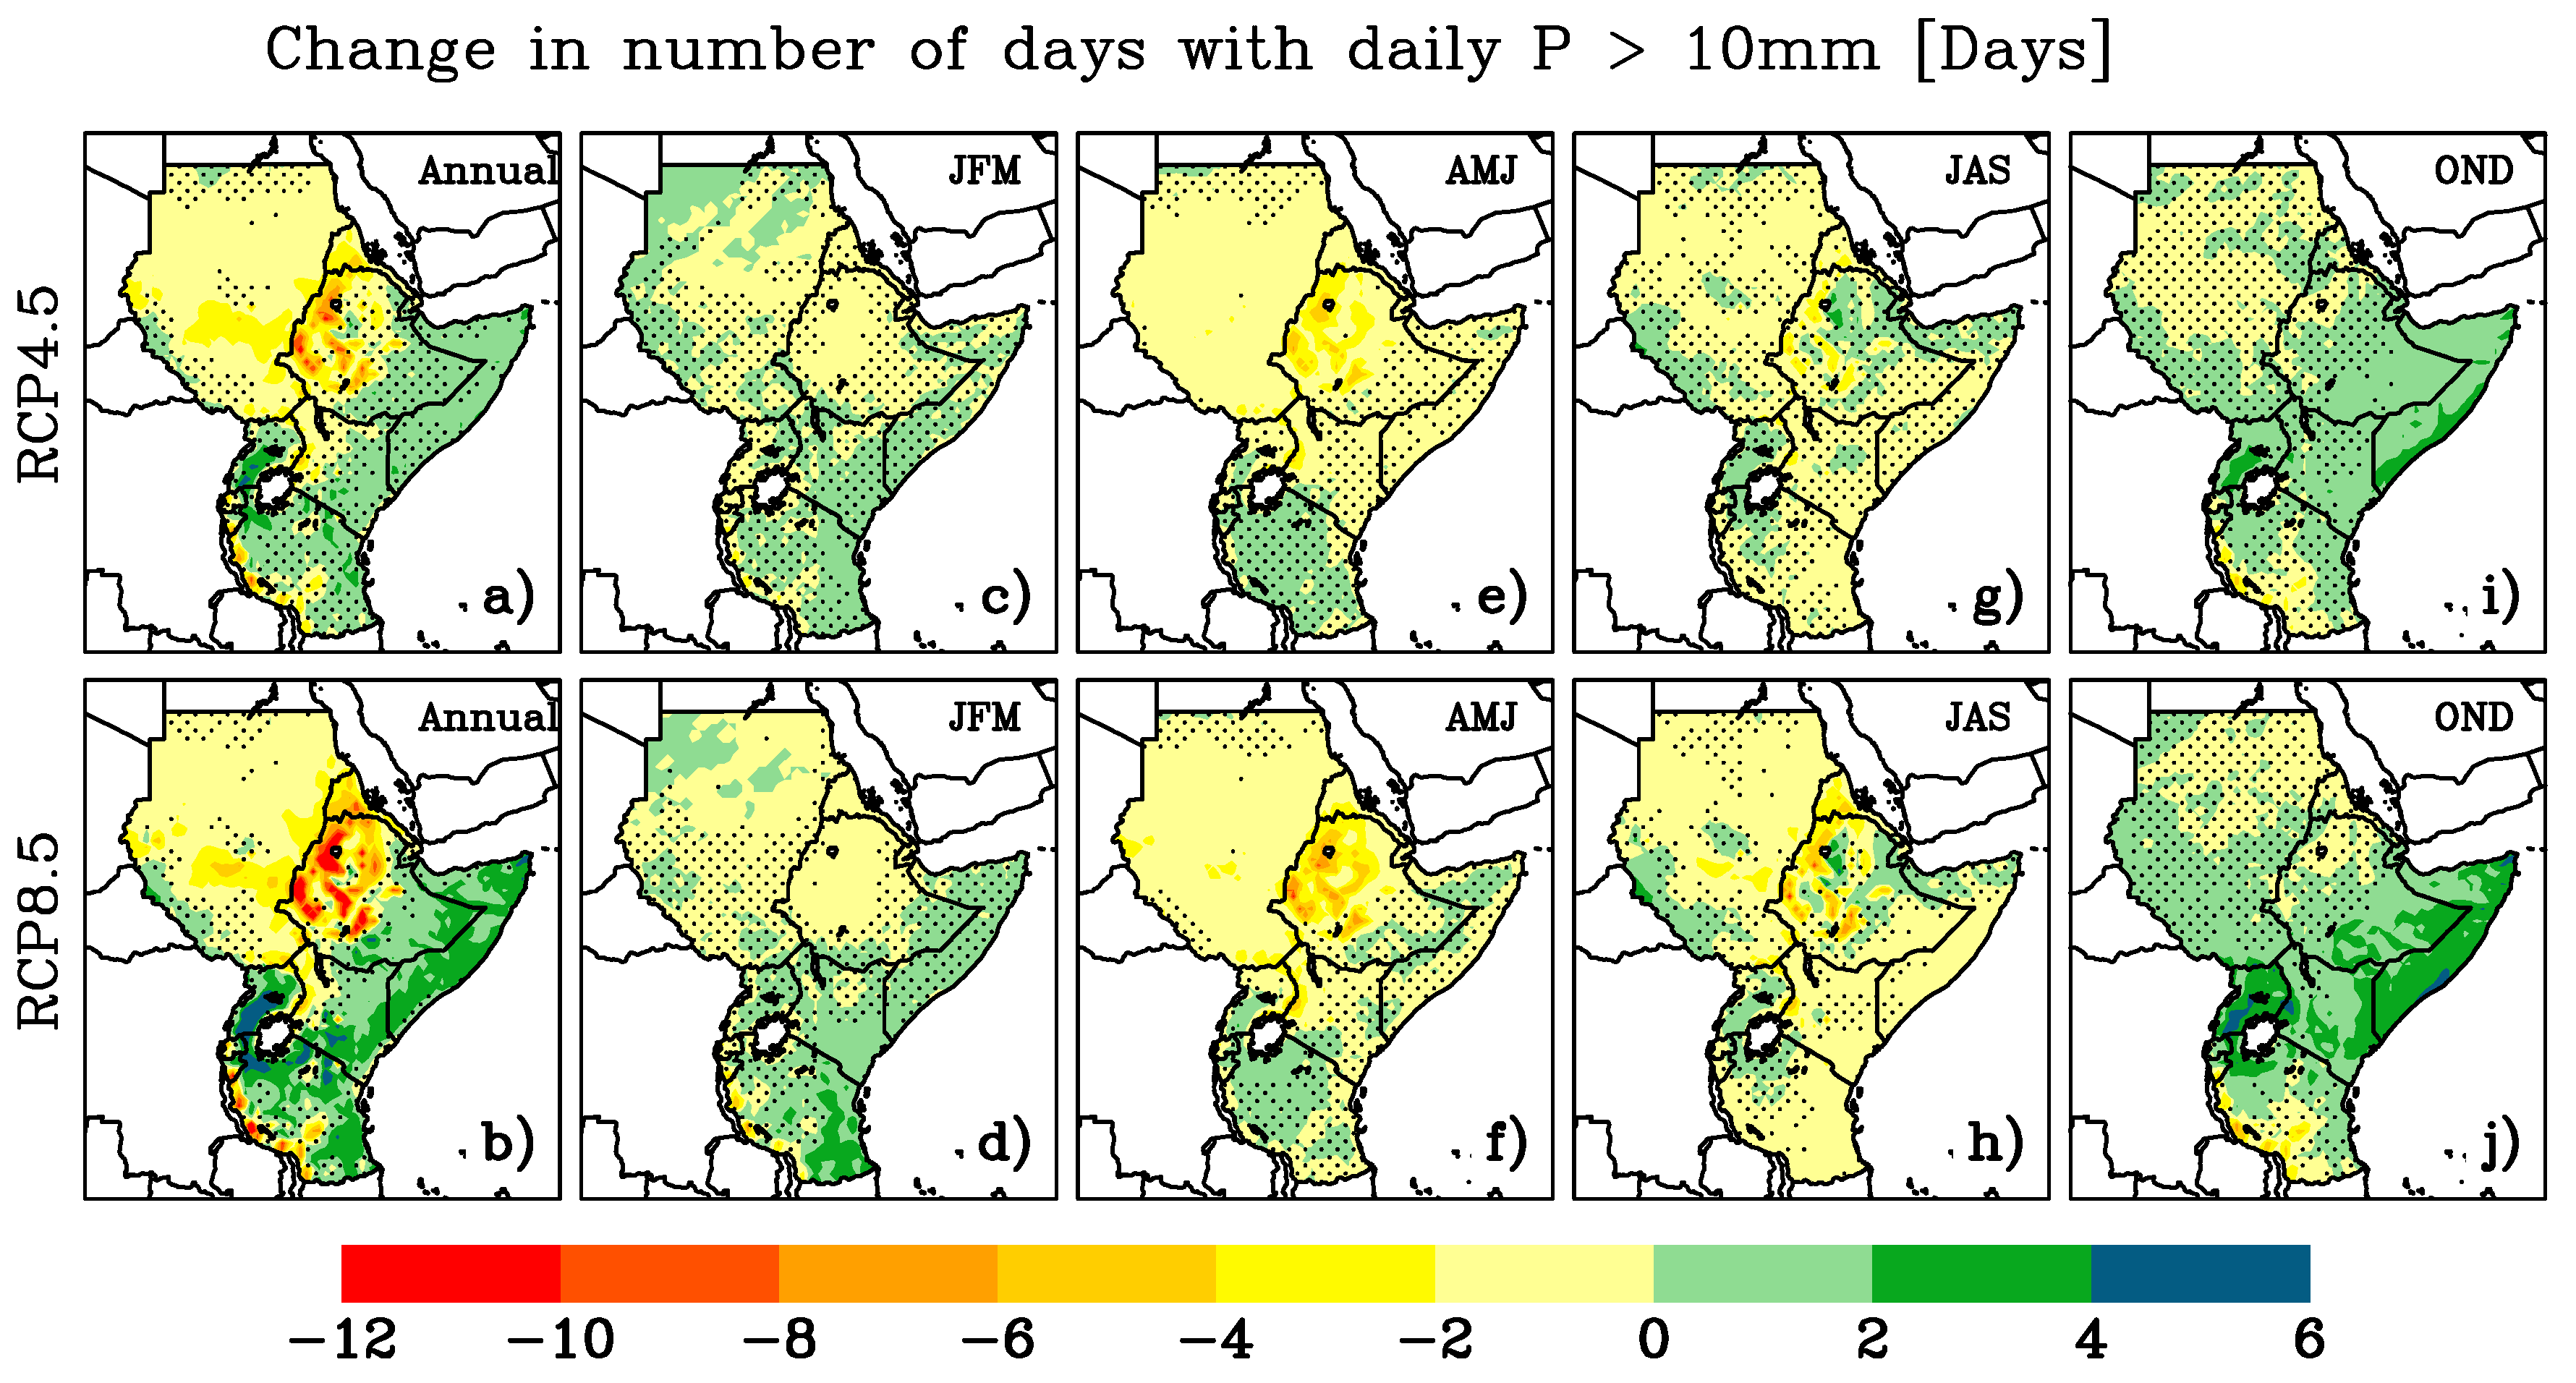
Figure 12.
Projected ensemble mean changes in annual and seasonal number of days with precipitation greater than 20 mm during the 2069–2098 period relative to 1976–2005 for (a) Annual, (c) JFM, (e) AMJ, (g) JAS and (i) OND seasons under the RCP4.5 scenario and (b) Annual, (d) JFM, (f) AMJ, (h) JAS and (j) OND seasons under the RCP8.5 scenario. Stippling indicates grid points with changes that are not significant (5% significance level using the t-test).

Figure 13.
Projected change in ensemble mean R99p (a) and R95p (b) extreme indices for the period 2069–2098 under the RCP4.5 and RCP8.5 emission scenarios, relative to the reference period 1976–2005. Stippling indicates grid points with changes that are not significant at the 5% significance level.
Figure 13.
Projected change in ensemble mean R99p (a) and R95p (b) extreme indices for the period 2069–2098 under the RCP4.5 and RCP8.5 emission scenarios, relative to the reference period 1976–2005. Stippling indicates grid points with changes that are not significant at the 5% significance level.

Figure 14.
Projected ensemble mean changes in annual and seasonal number Consecutive Dry Days (CDD) during the 2069–2098 period relative to 1976–2005 for (a) Annual, (c) JFM, (e) AMJ, (g) JAS and (i)OND seasons under the RCP4.5 scenario and (b) Annual, (d) JFM, (f) AMJ, (h) JAS and (j) OND seasons under the RCP8.5 scenario. Stippling indicates grid points with changes that are not significant (5% significance level using the t-test).

Figure 15.
Projected changes in regionally averaged seasonal (JFM, AMJ, JAS and OND) (a) PRCPTOT, (b) RX1DAY, (c) R10 mm, (d) CDD and (e) R95p over the 2069–2098 period relative to the reference period (1976–2000) for RCP4.5 (blue) and RCP8.5 (orange). Boxes indicate the interquartile model spread (25th and 75th quantiles) of the eight-member ensemble (four for each RCM) with the horizontal line indicating the ensemble median. Changes are displayed in %.

Figure 16.
Interquartile range of projected changes in annual R95p (%) under (a) RCP 4.5 and (b) RCP8.5 scenarios.
Figure 16.
Interquartile range of projected changes in annual R95p (%) under (a) RCP 4.5 and (b) RCP8.5 scenarios.
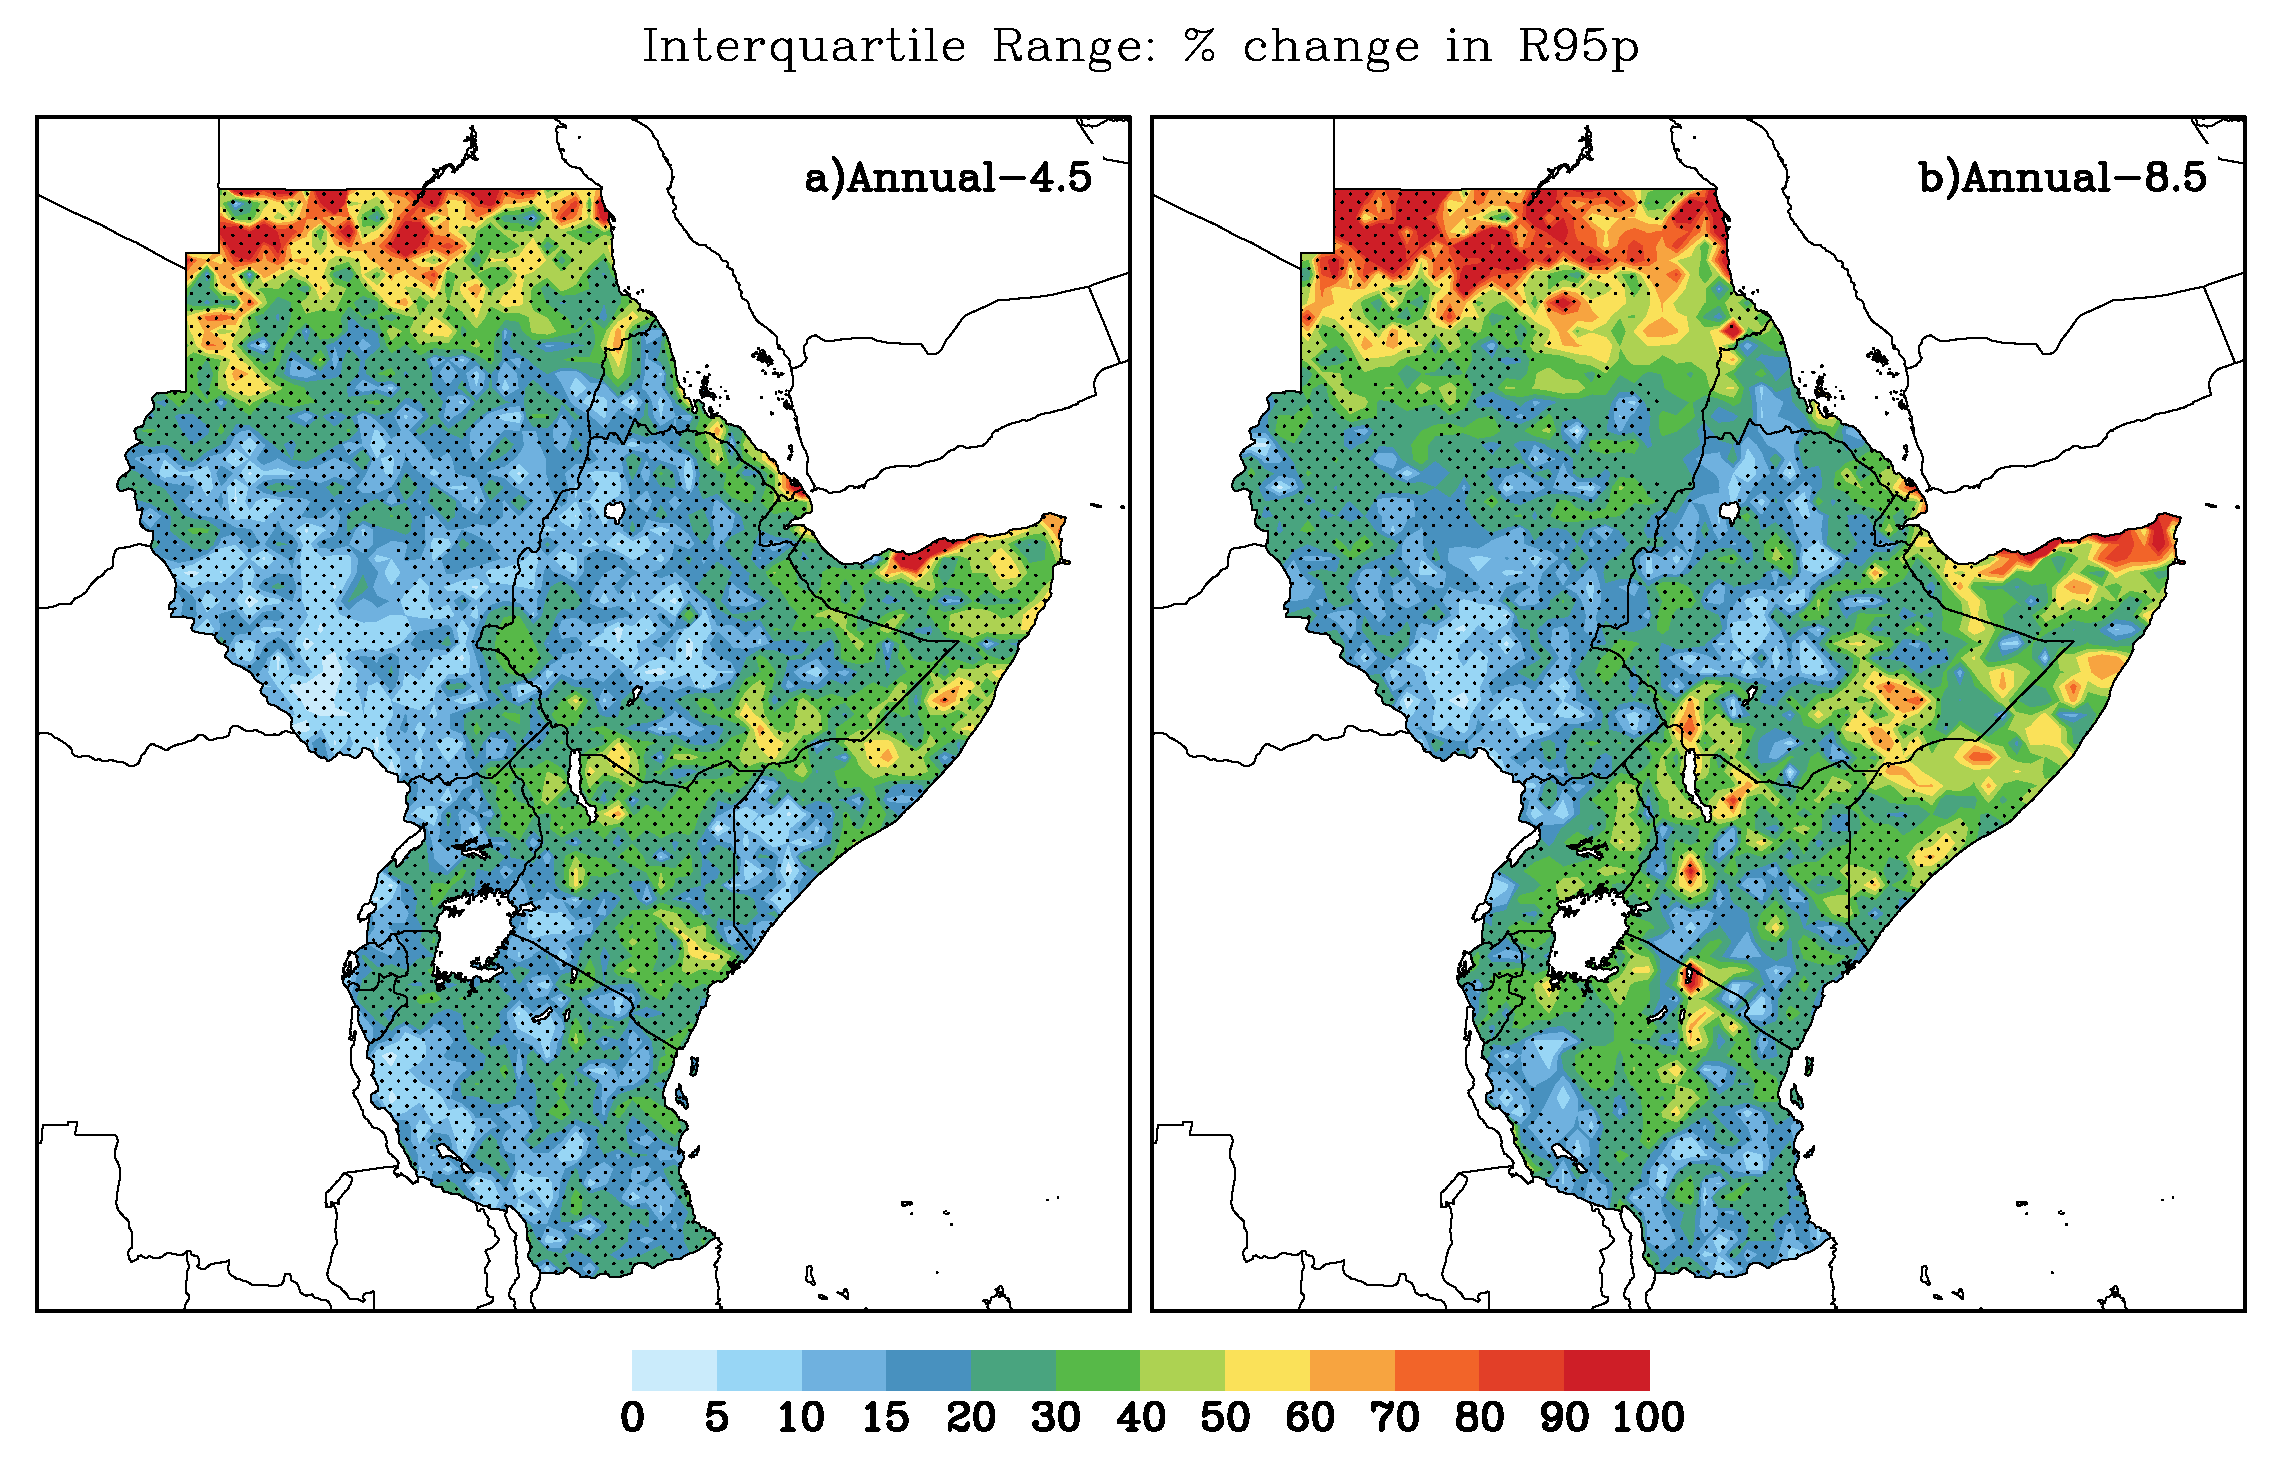
Figure 17.
Interquartile range of projected changes in CDD (%) under RCP 4.5 scenario for (a) JFM , (b) AMJ , (c) JAS and (d) OND seasons; under RCP 8.5 scenario for (e) JFM , (f) AMJ , (g) JAS and (h) OND seasons. The white shade in (a,e) stands for grid points with 0 mm mean precipitation for the 1976–2005 period.


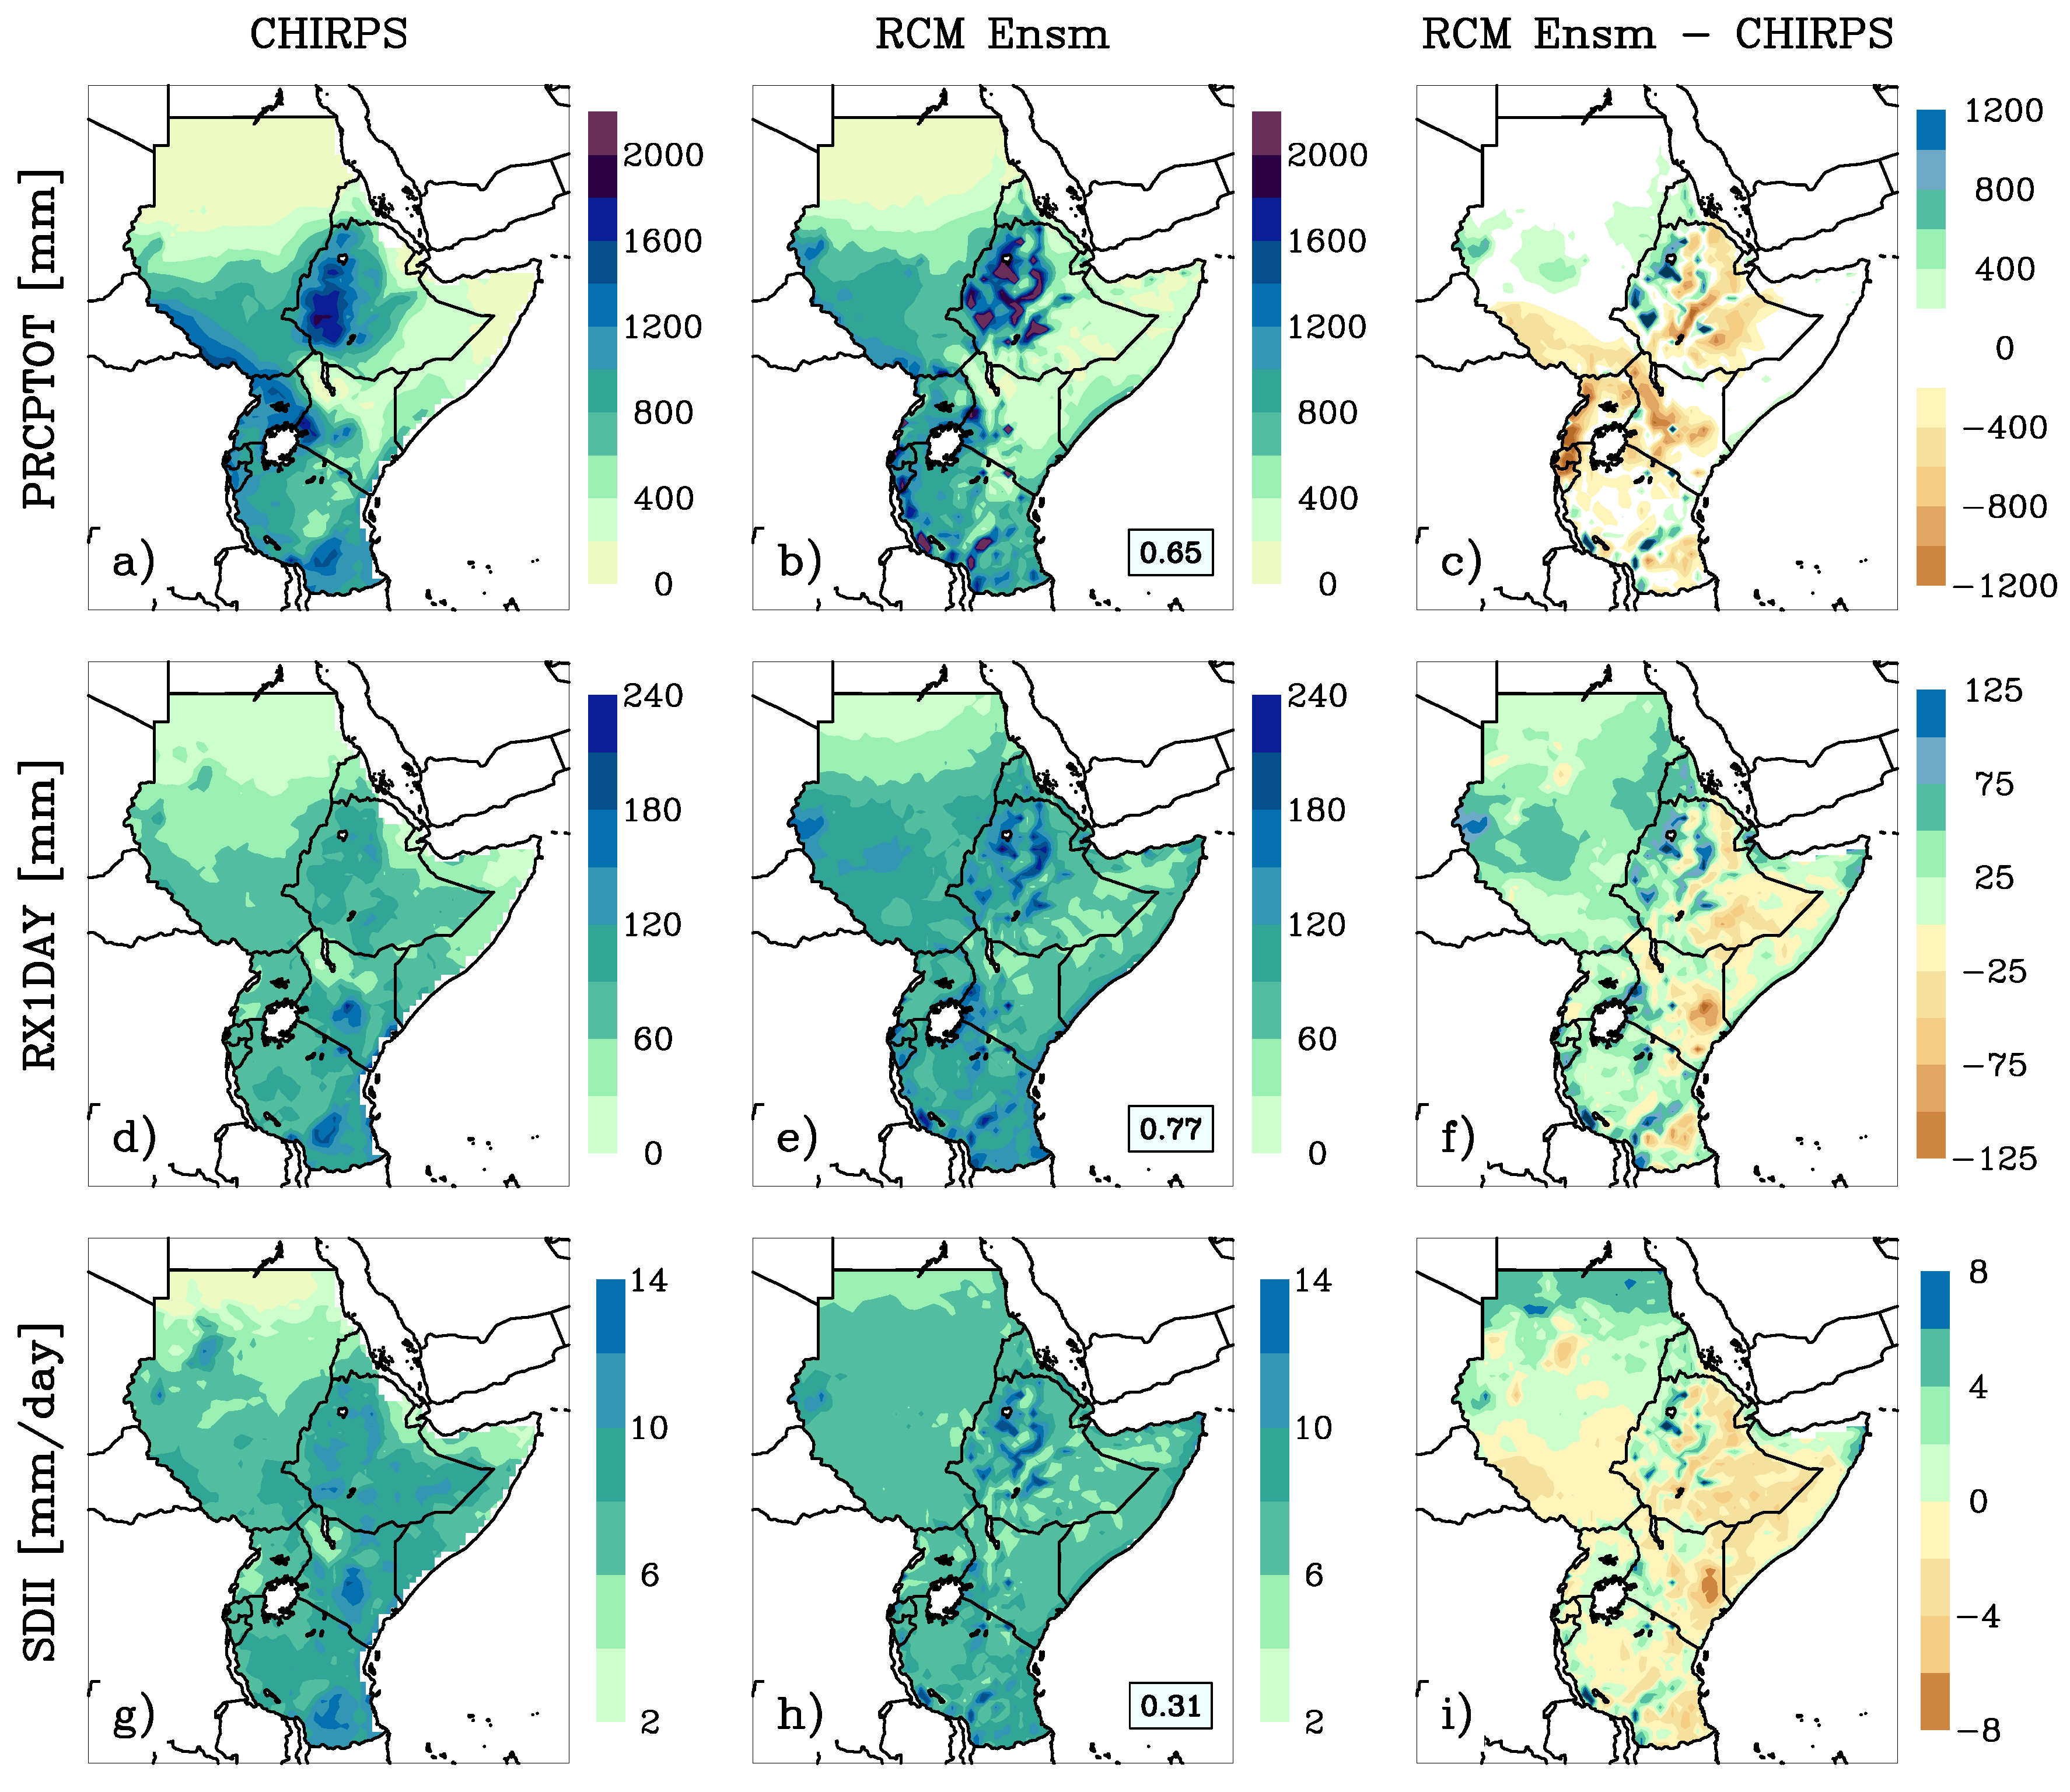
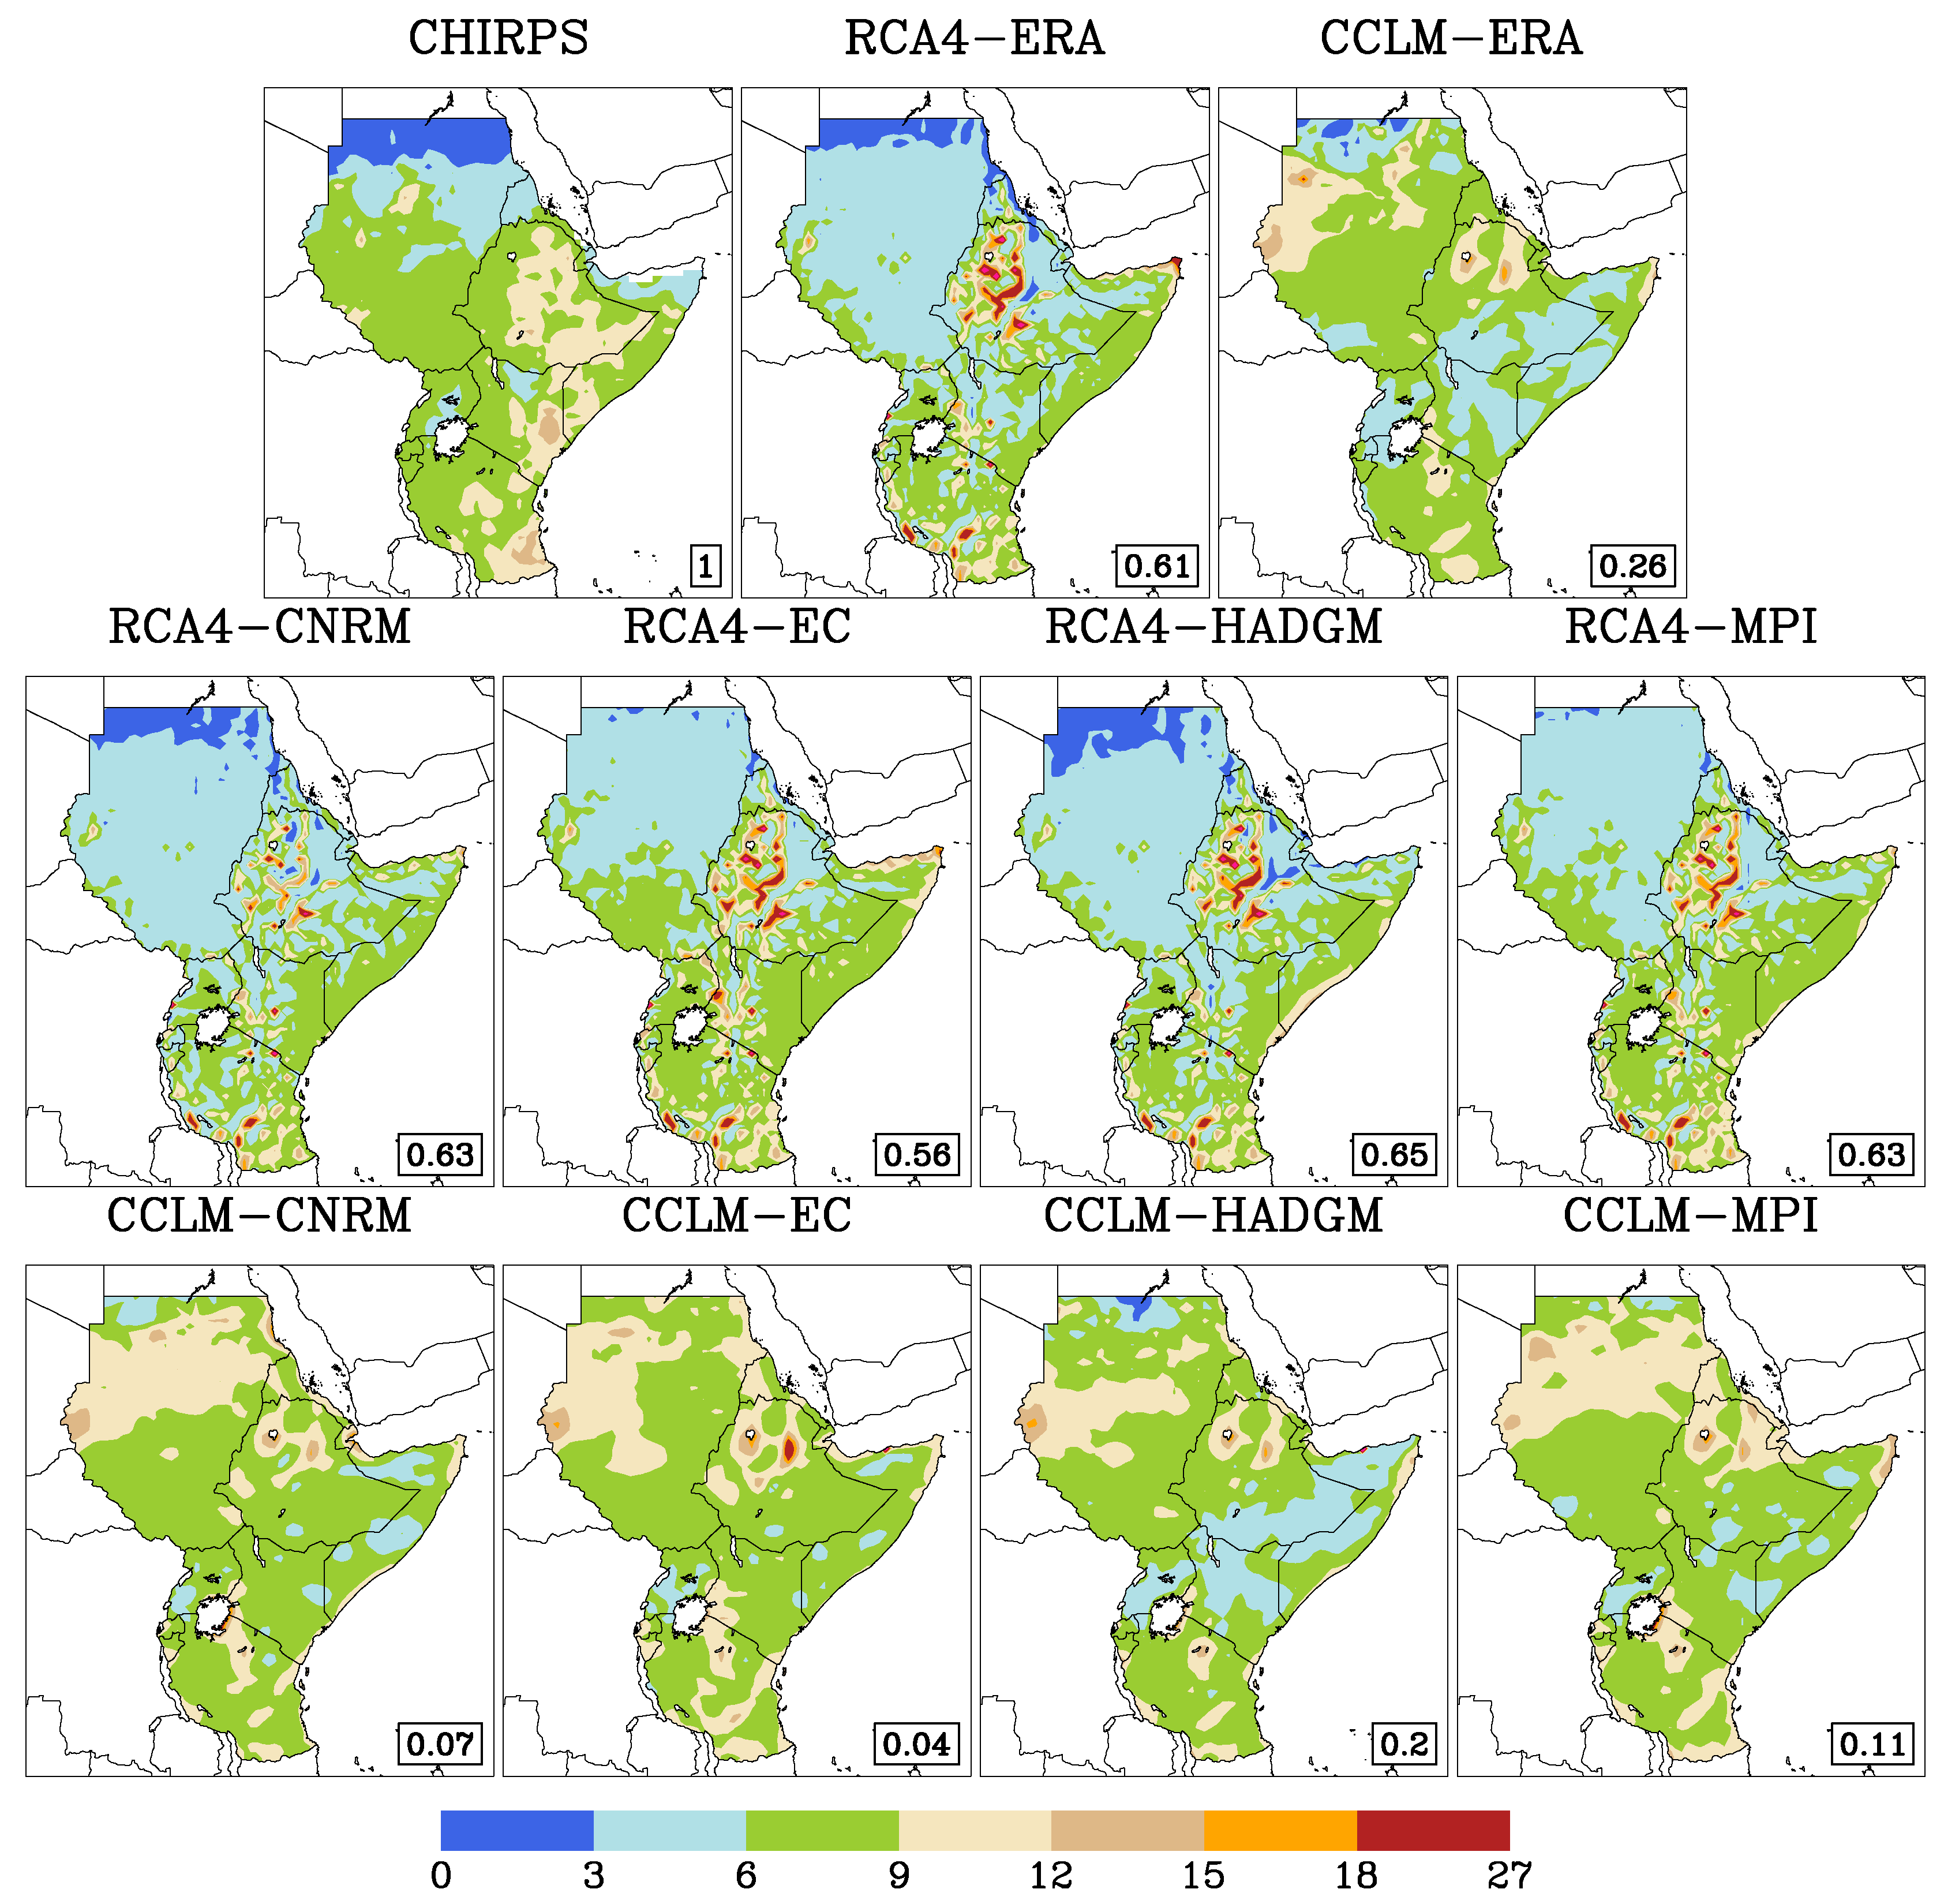
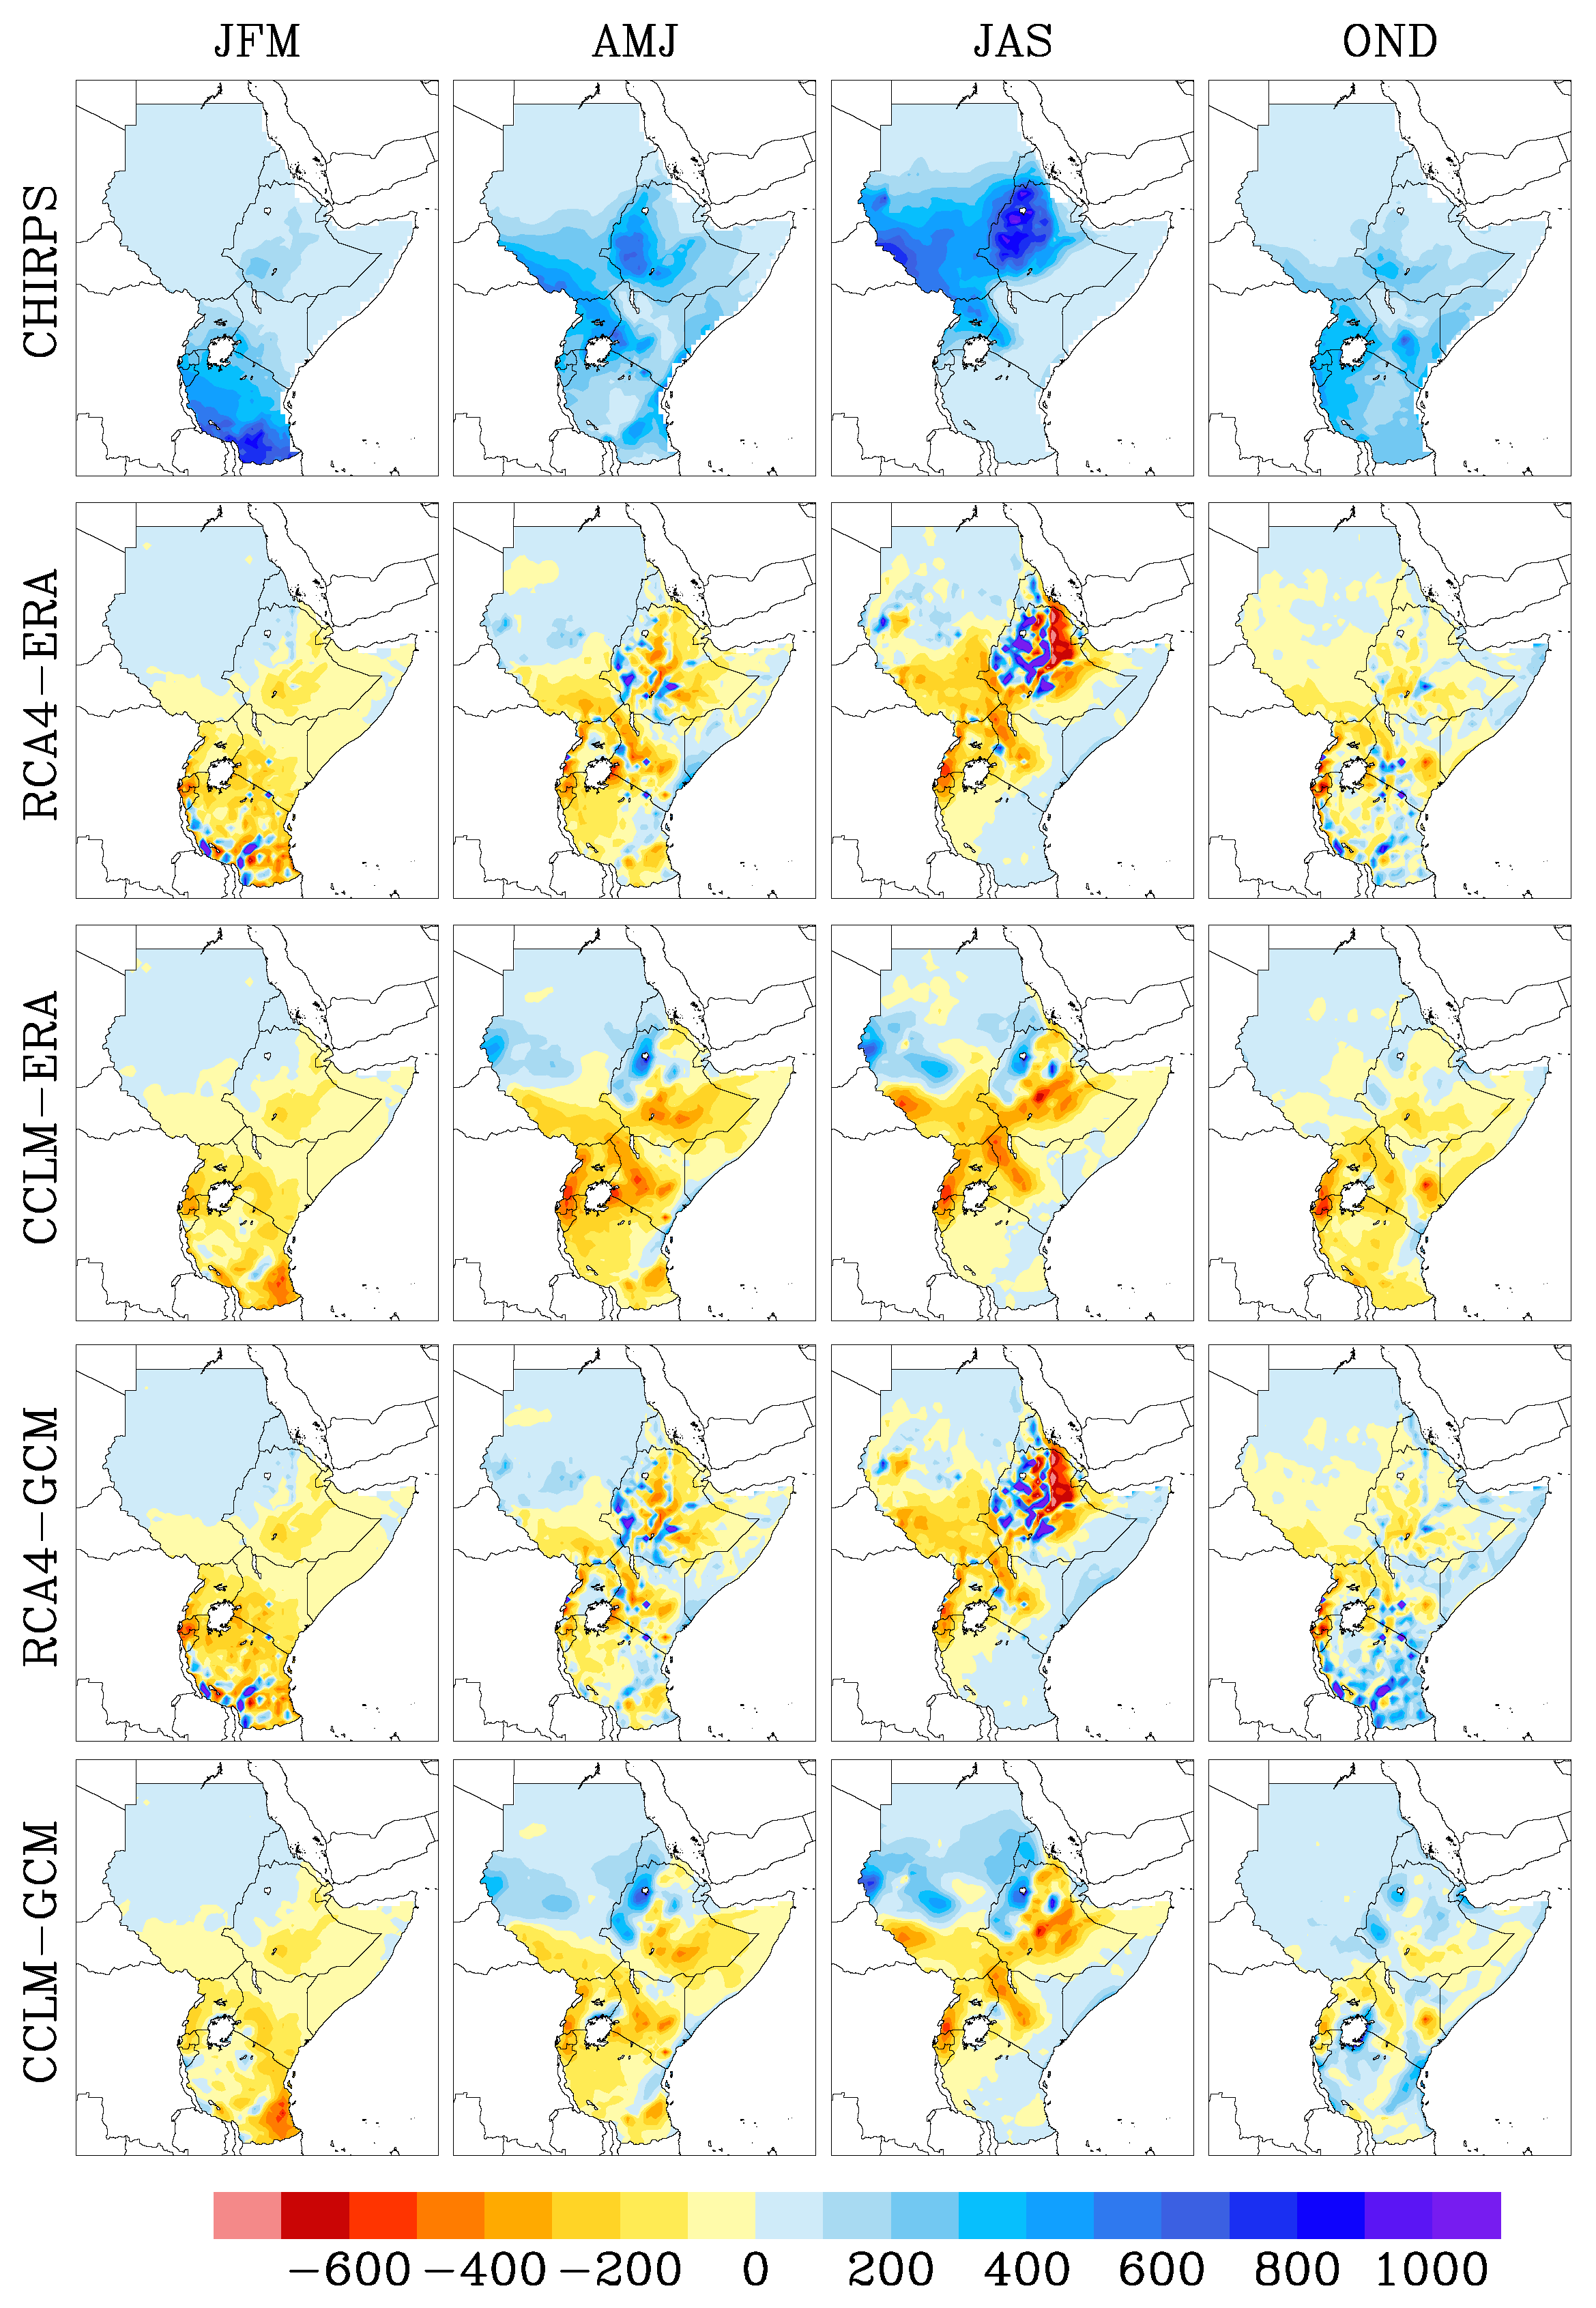
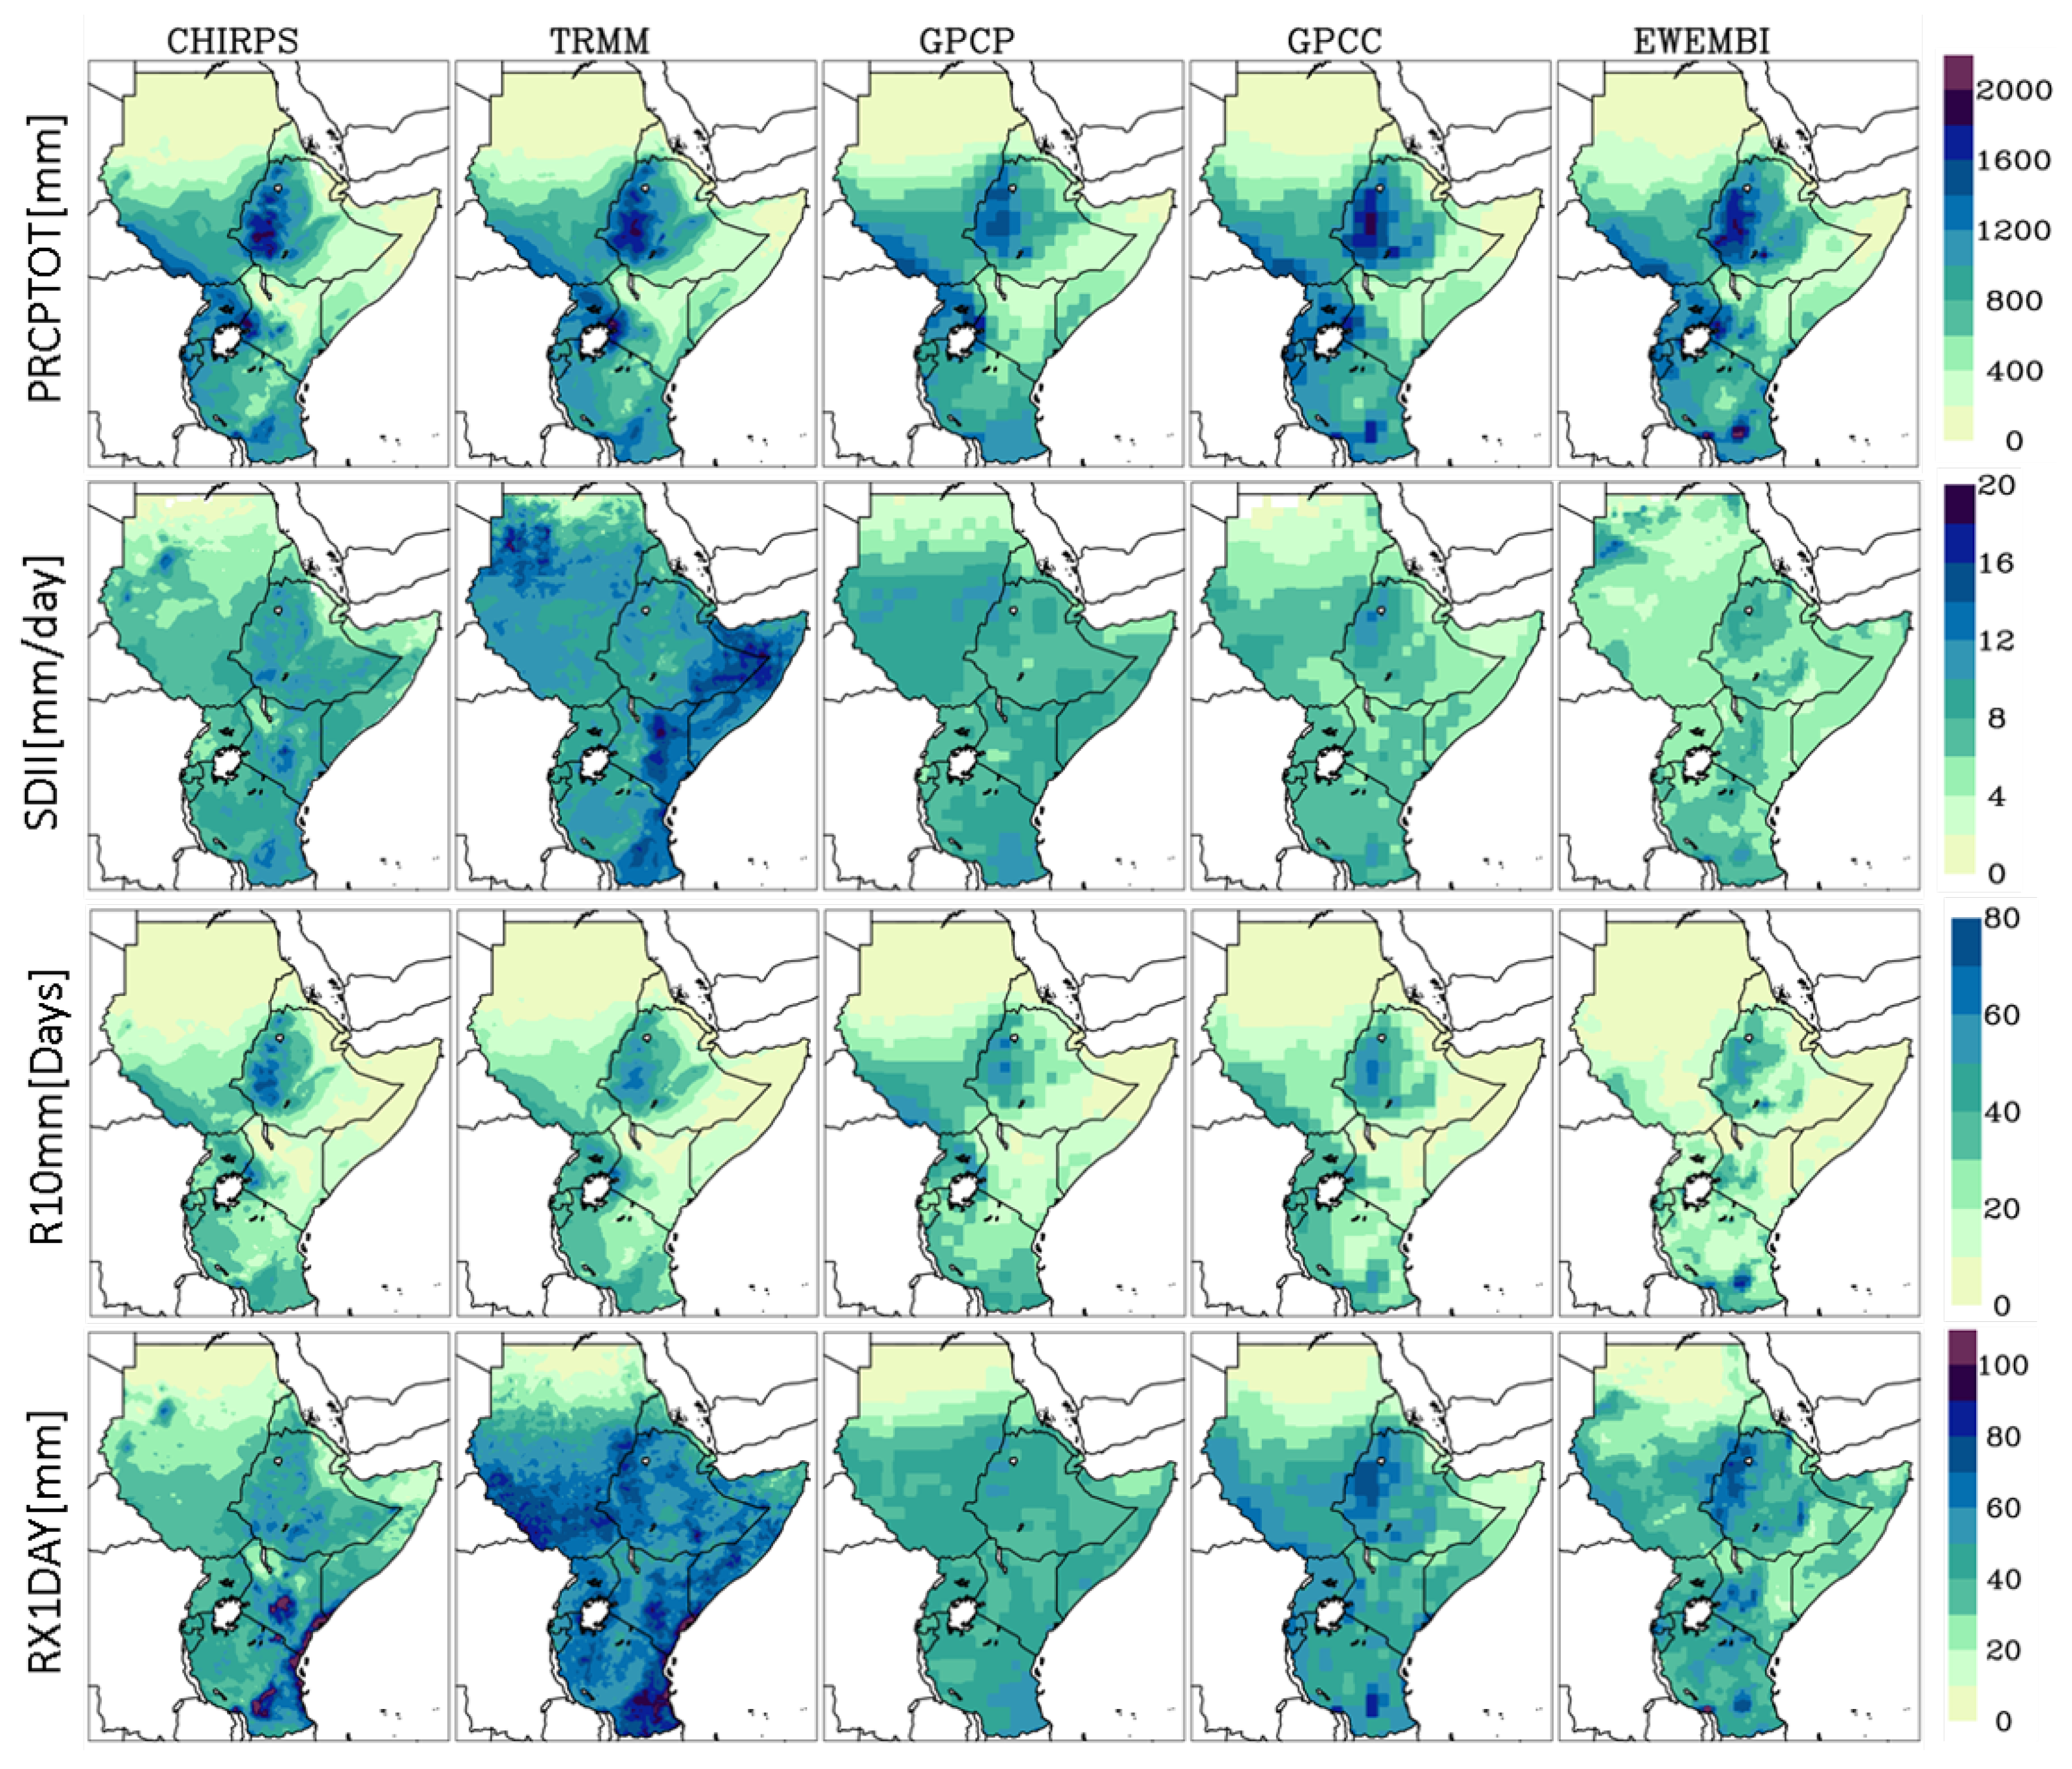
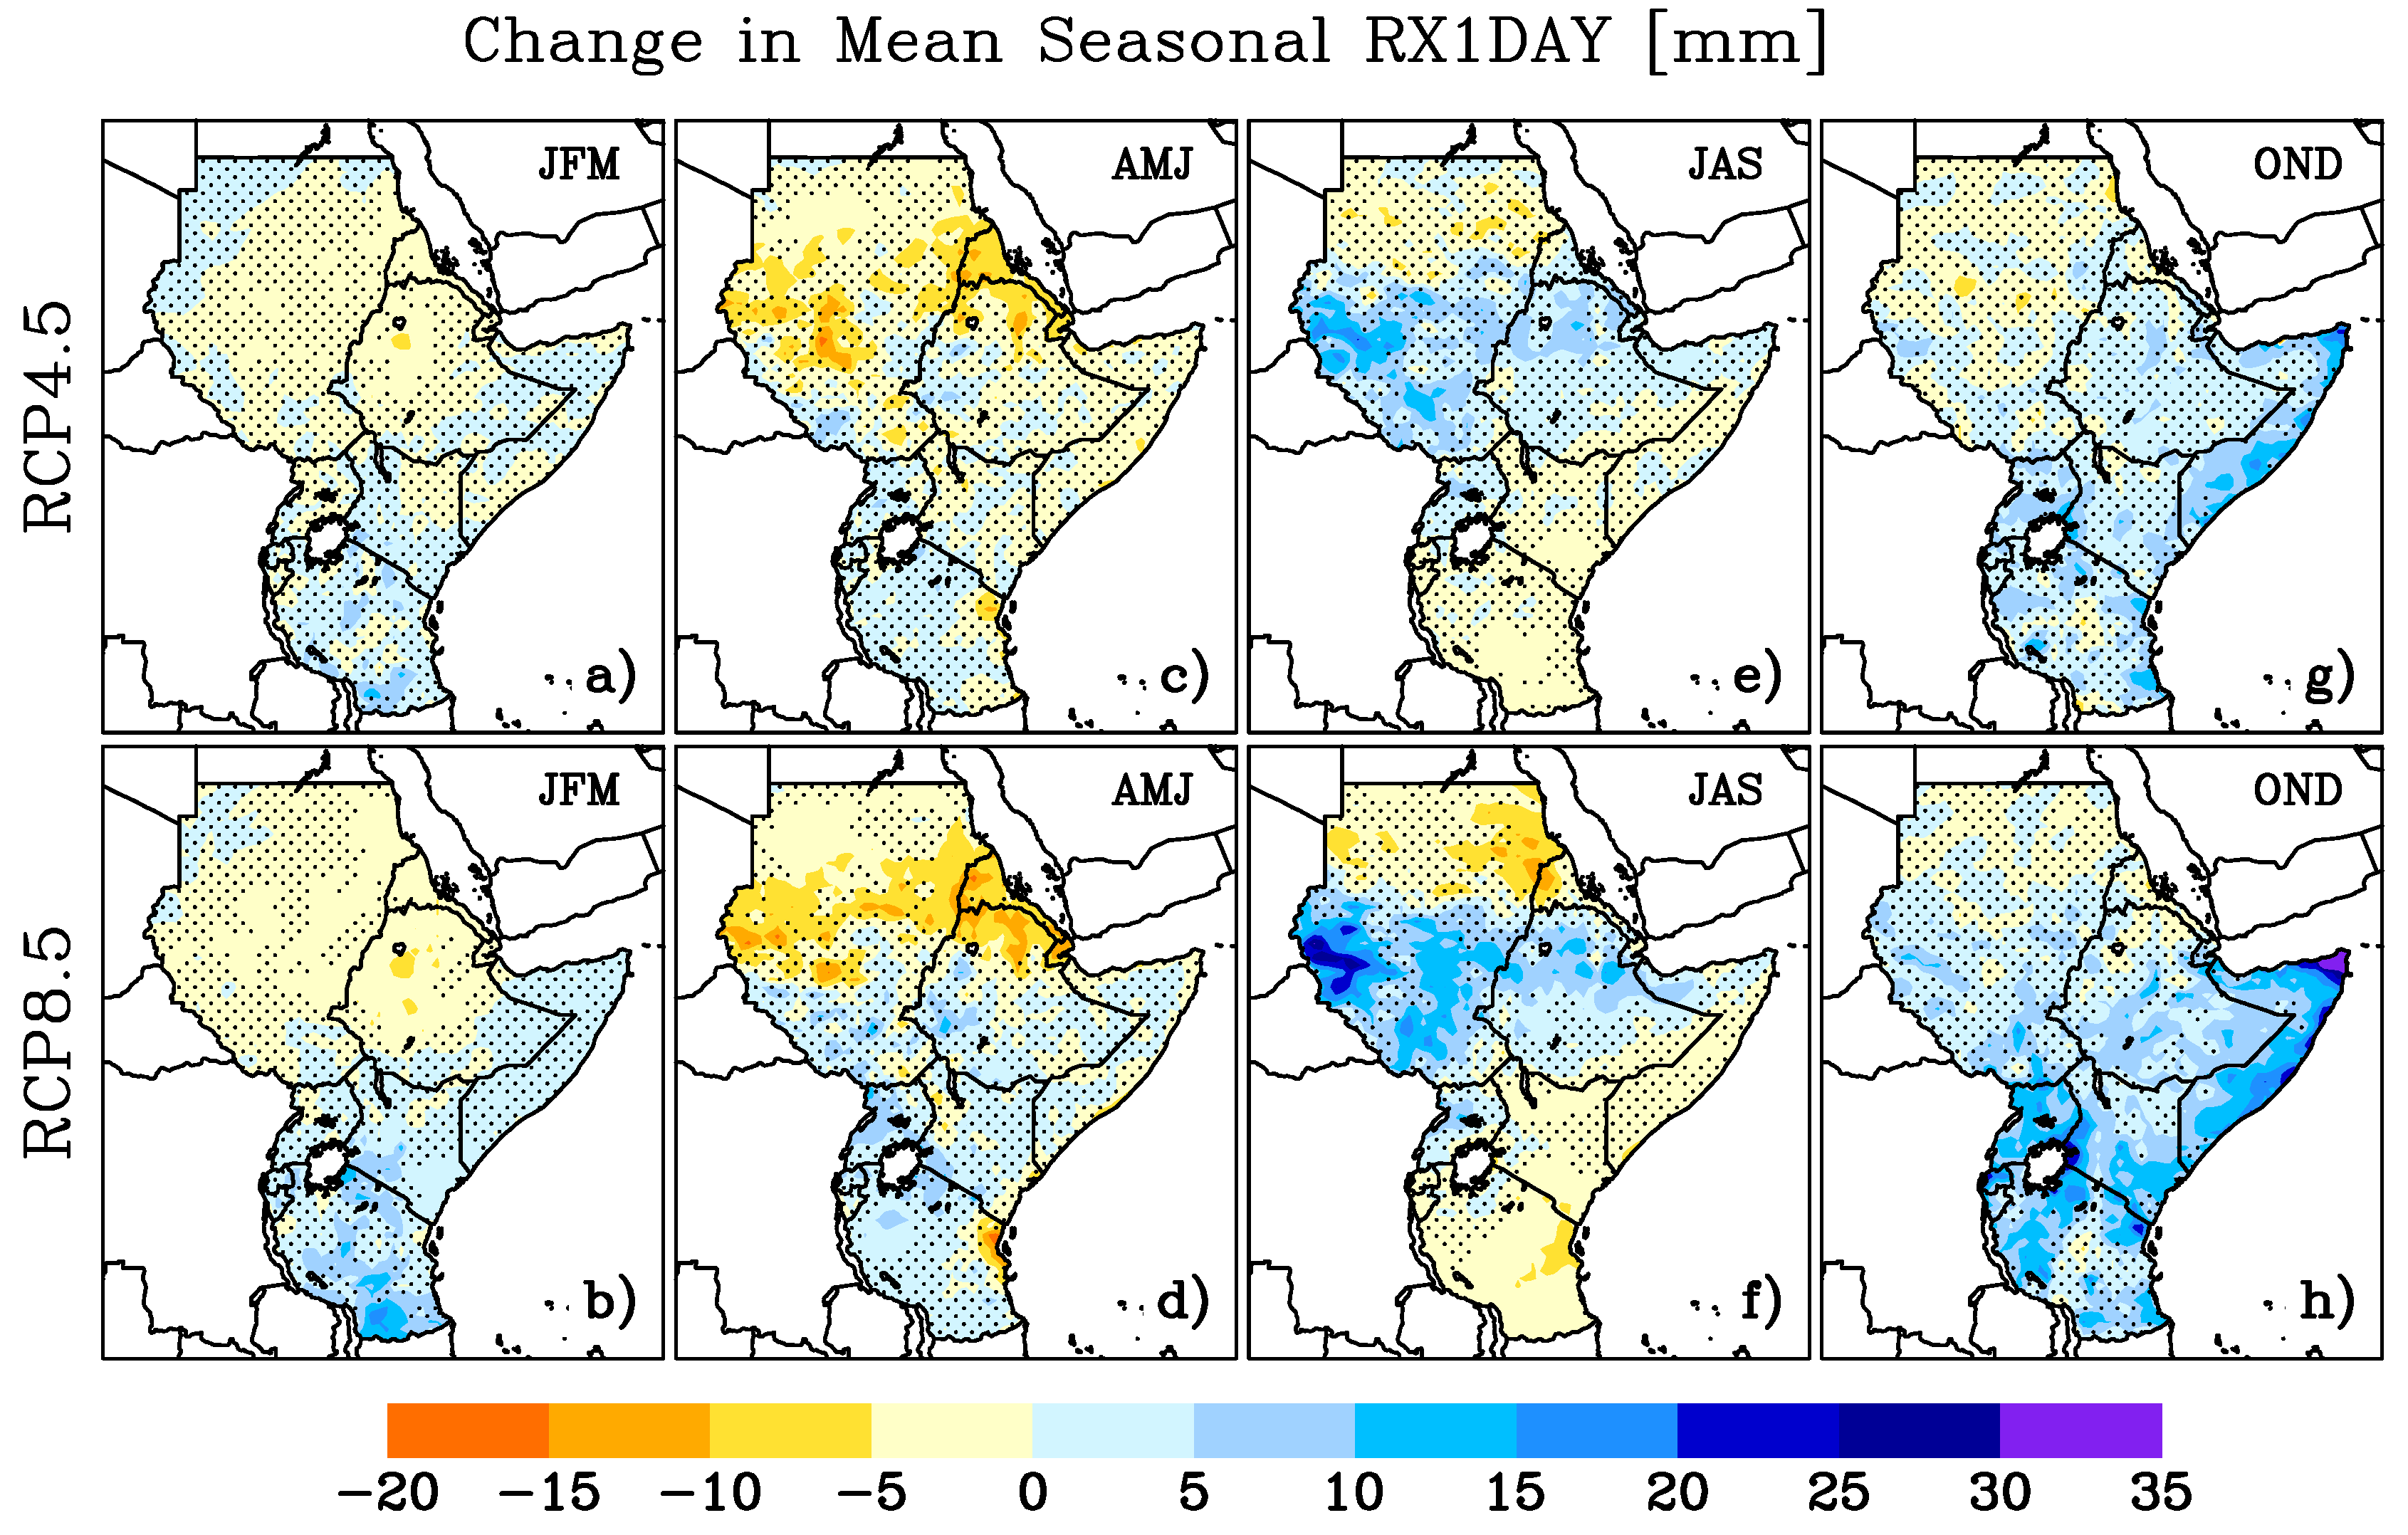
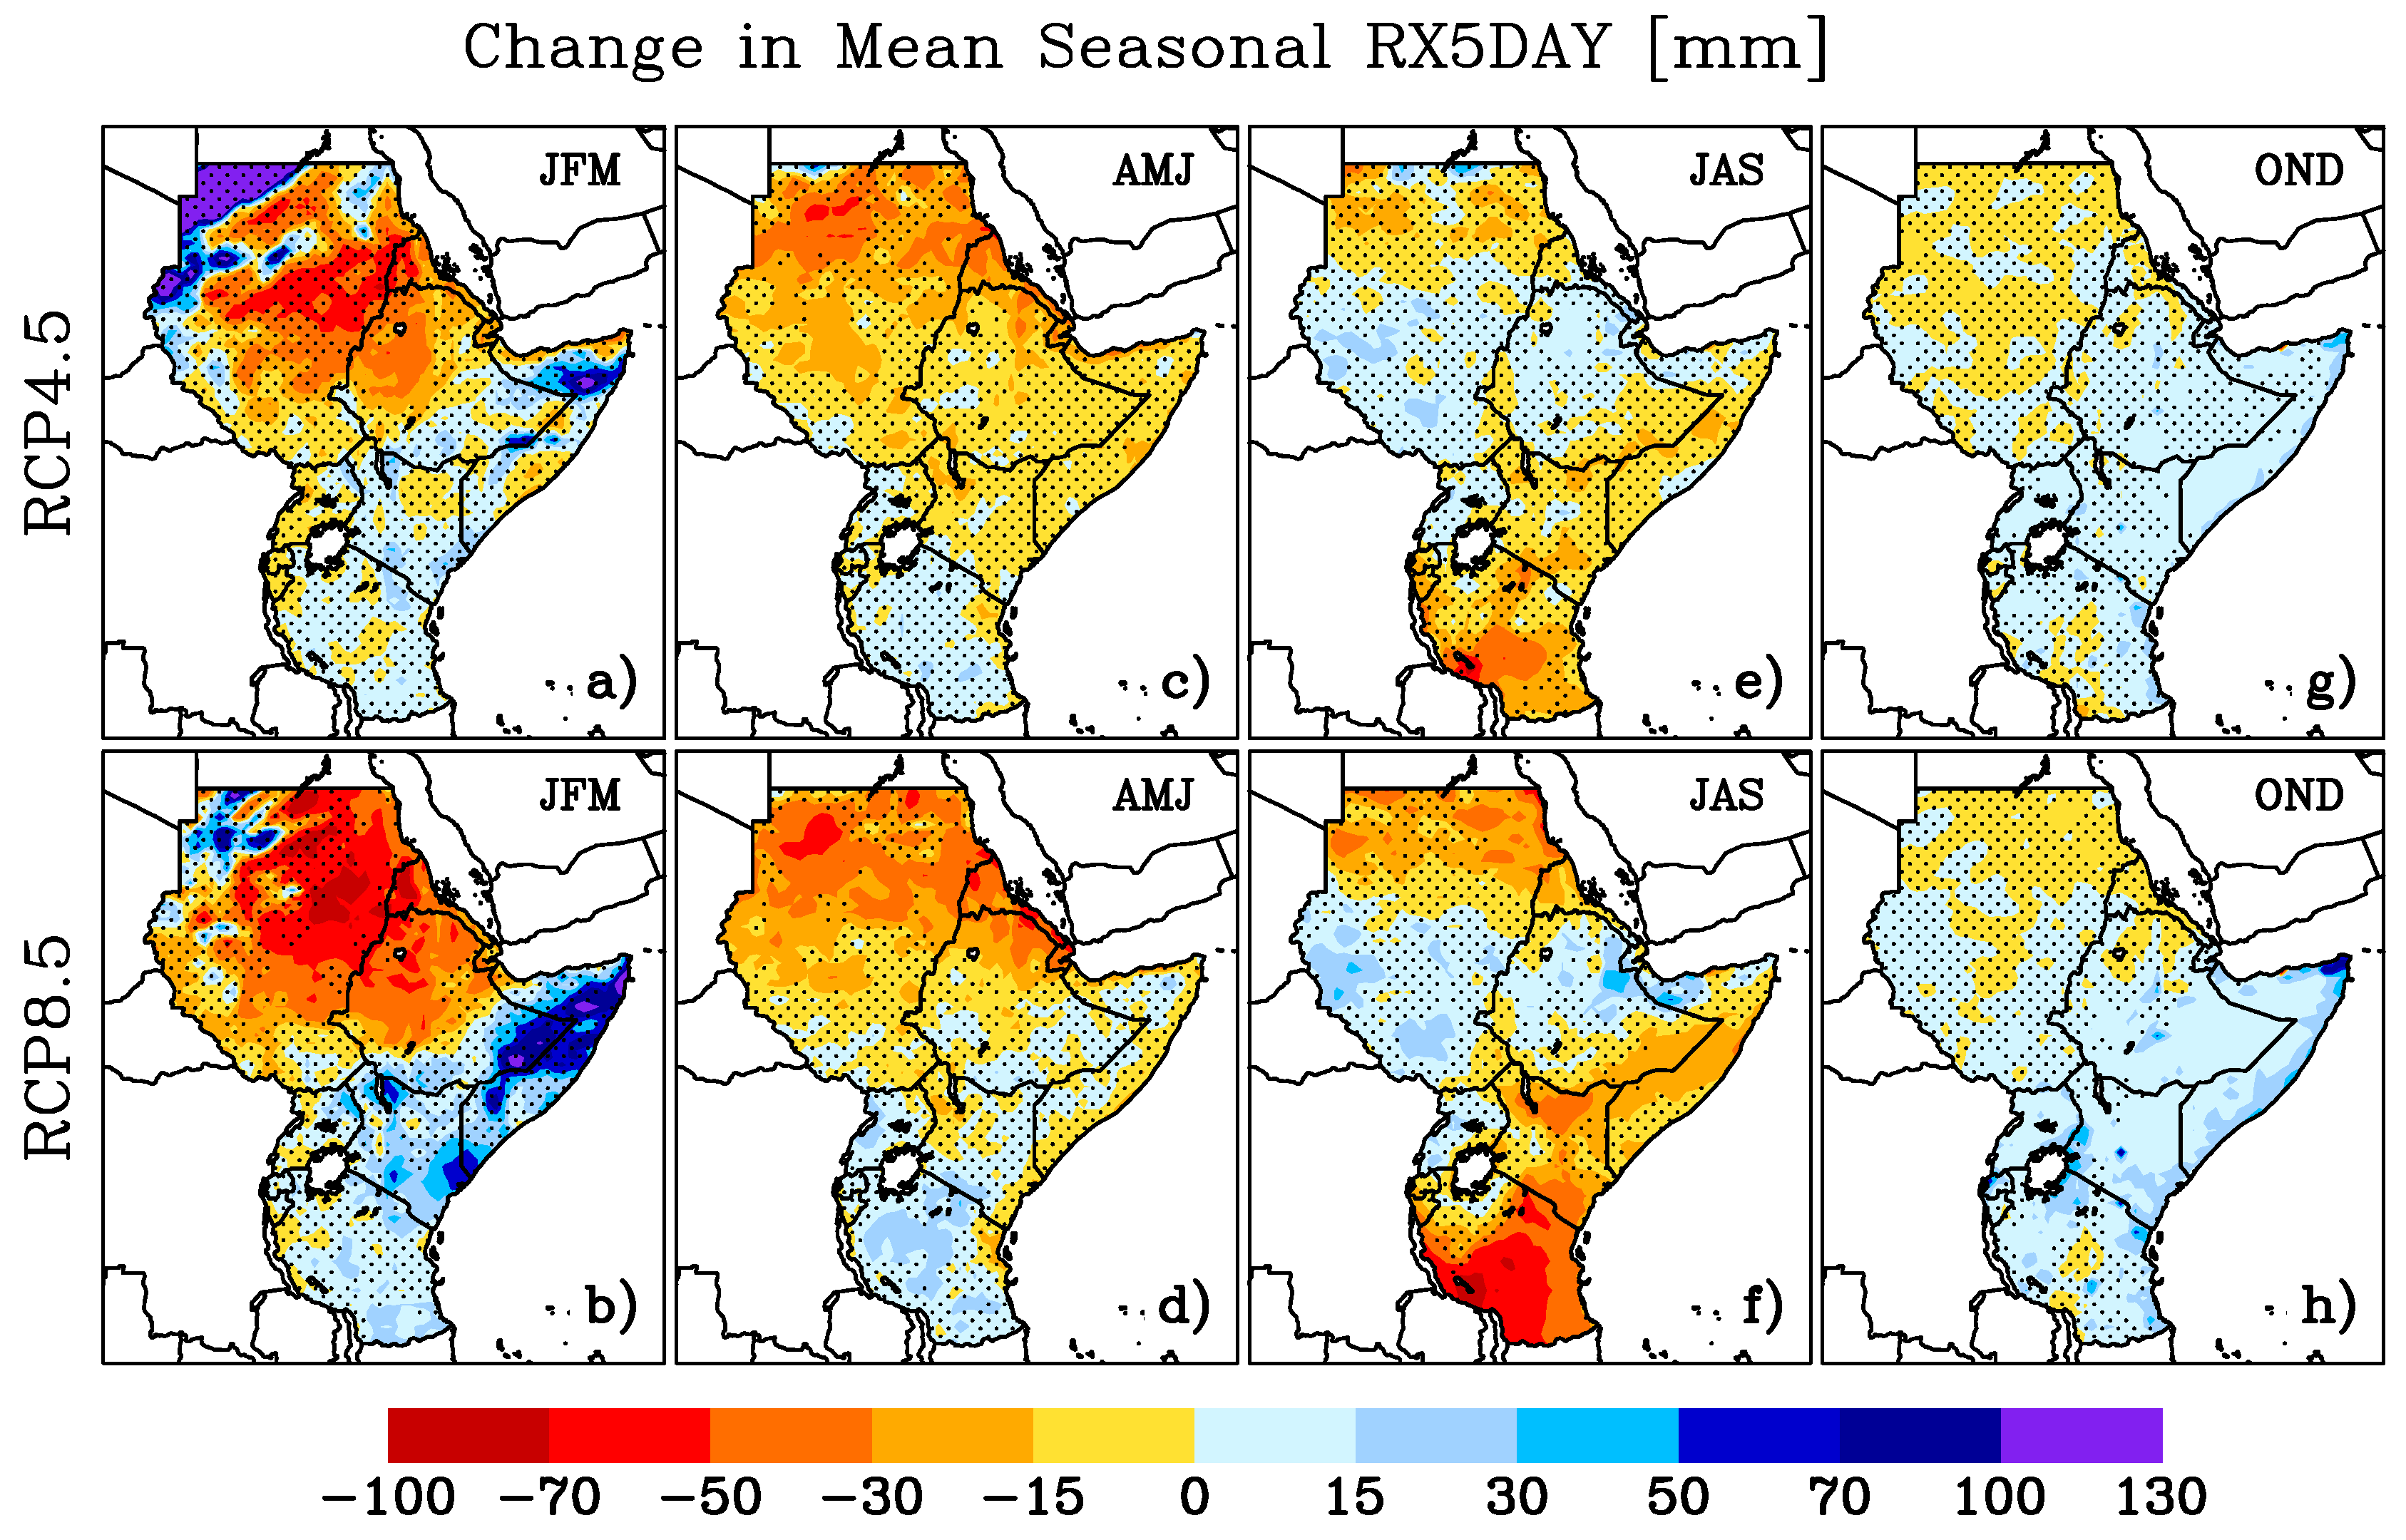
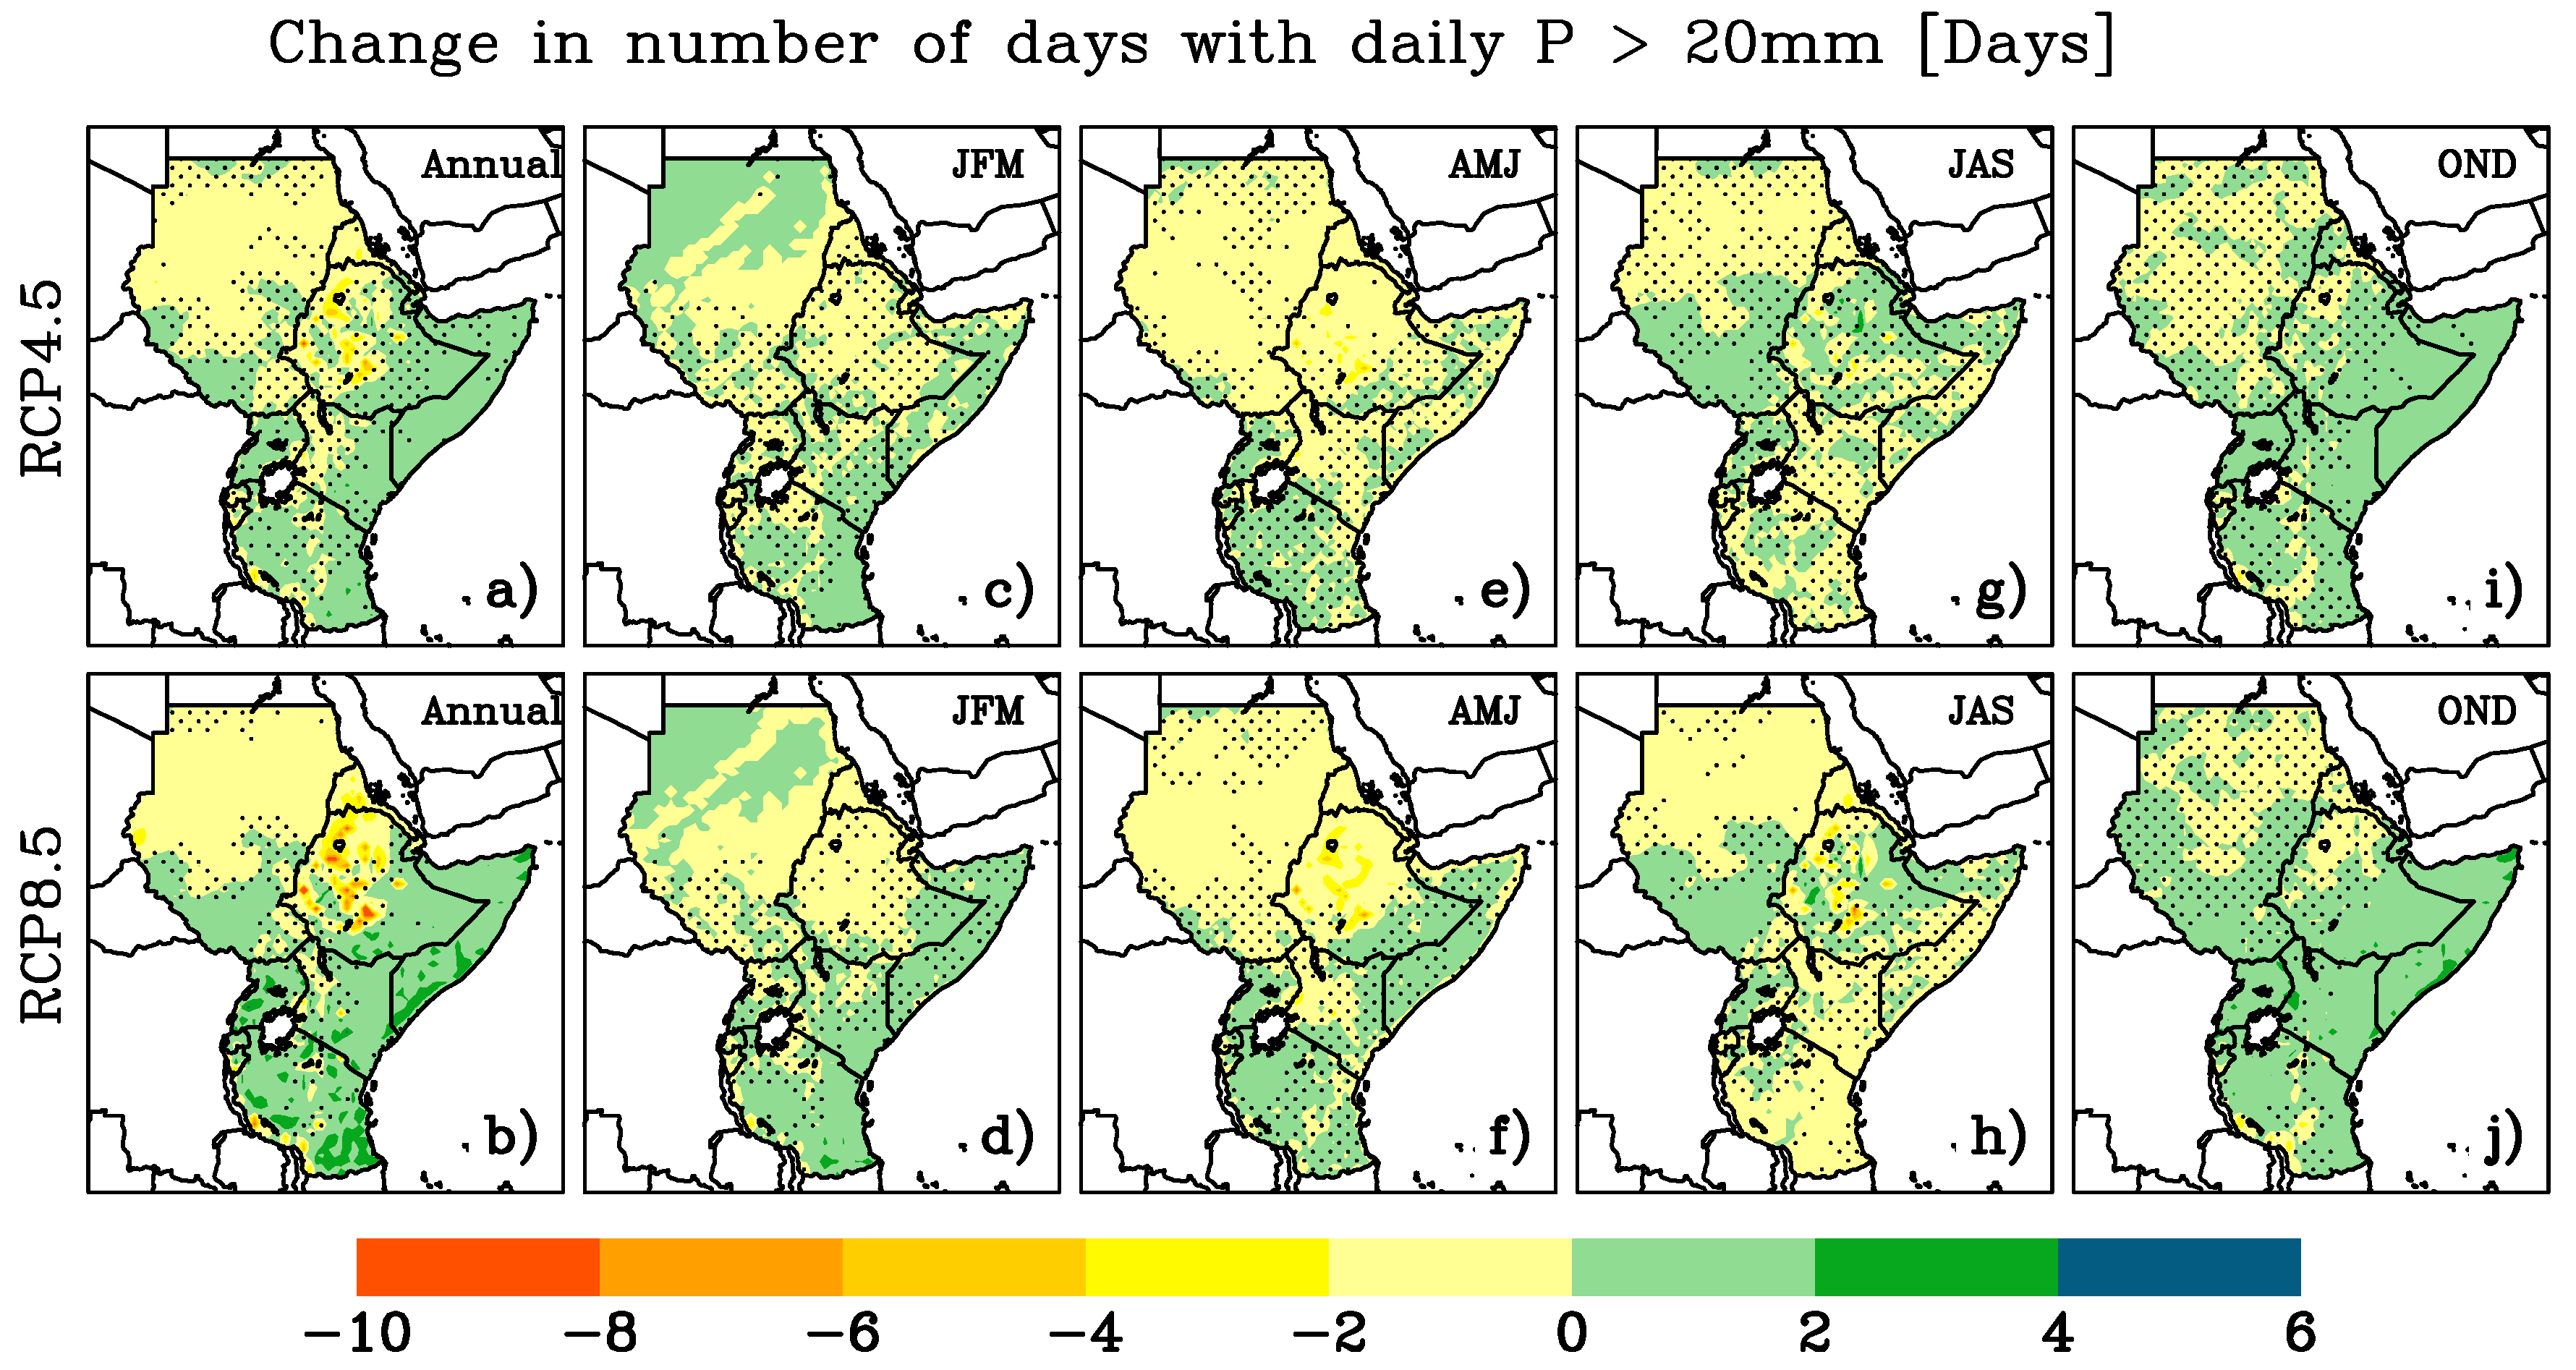
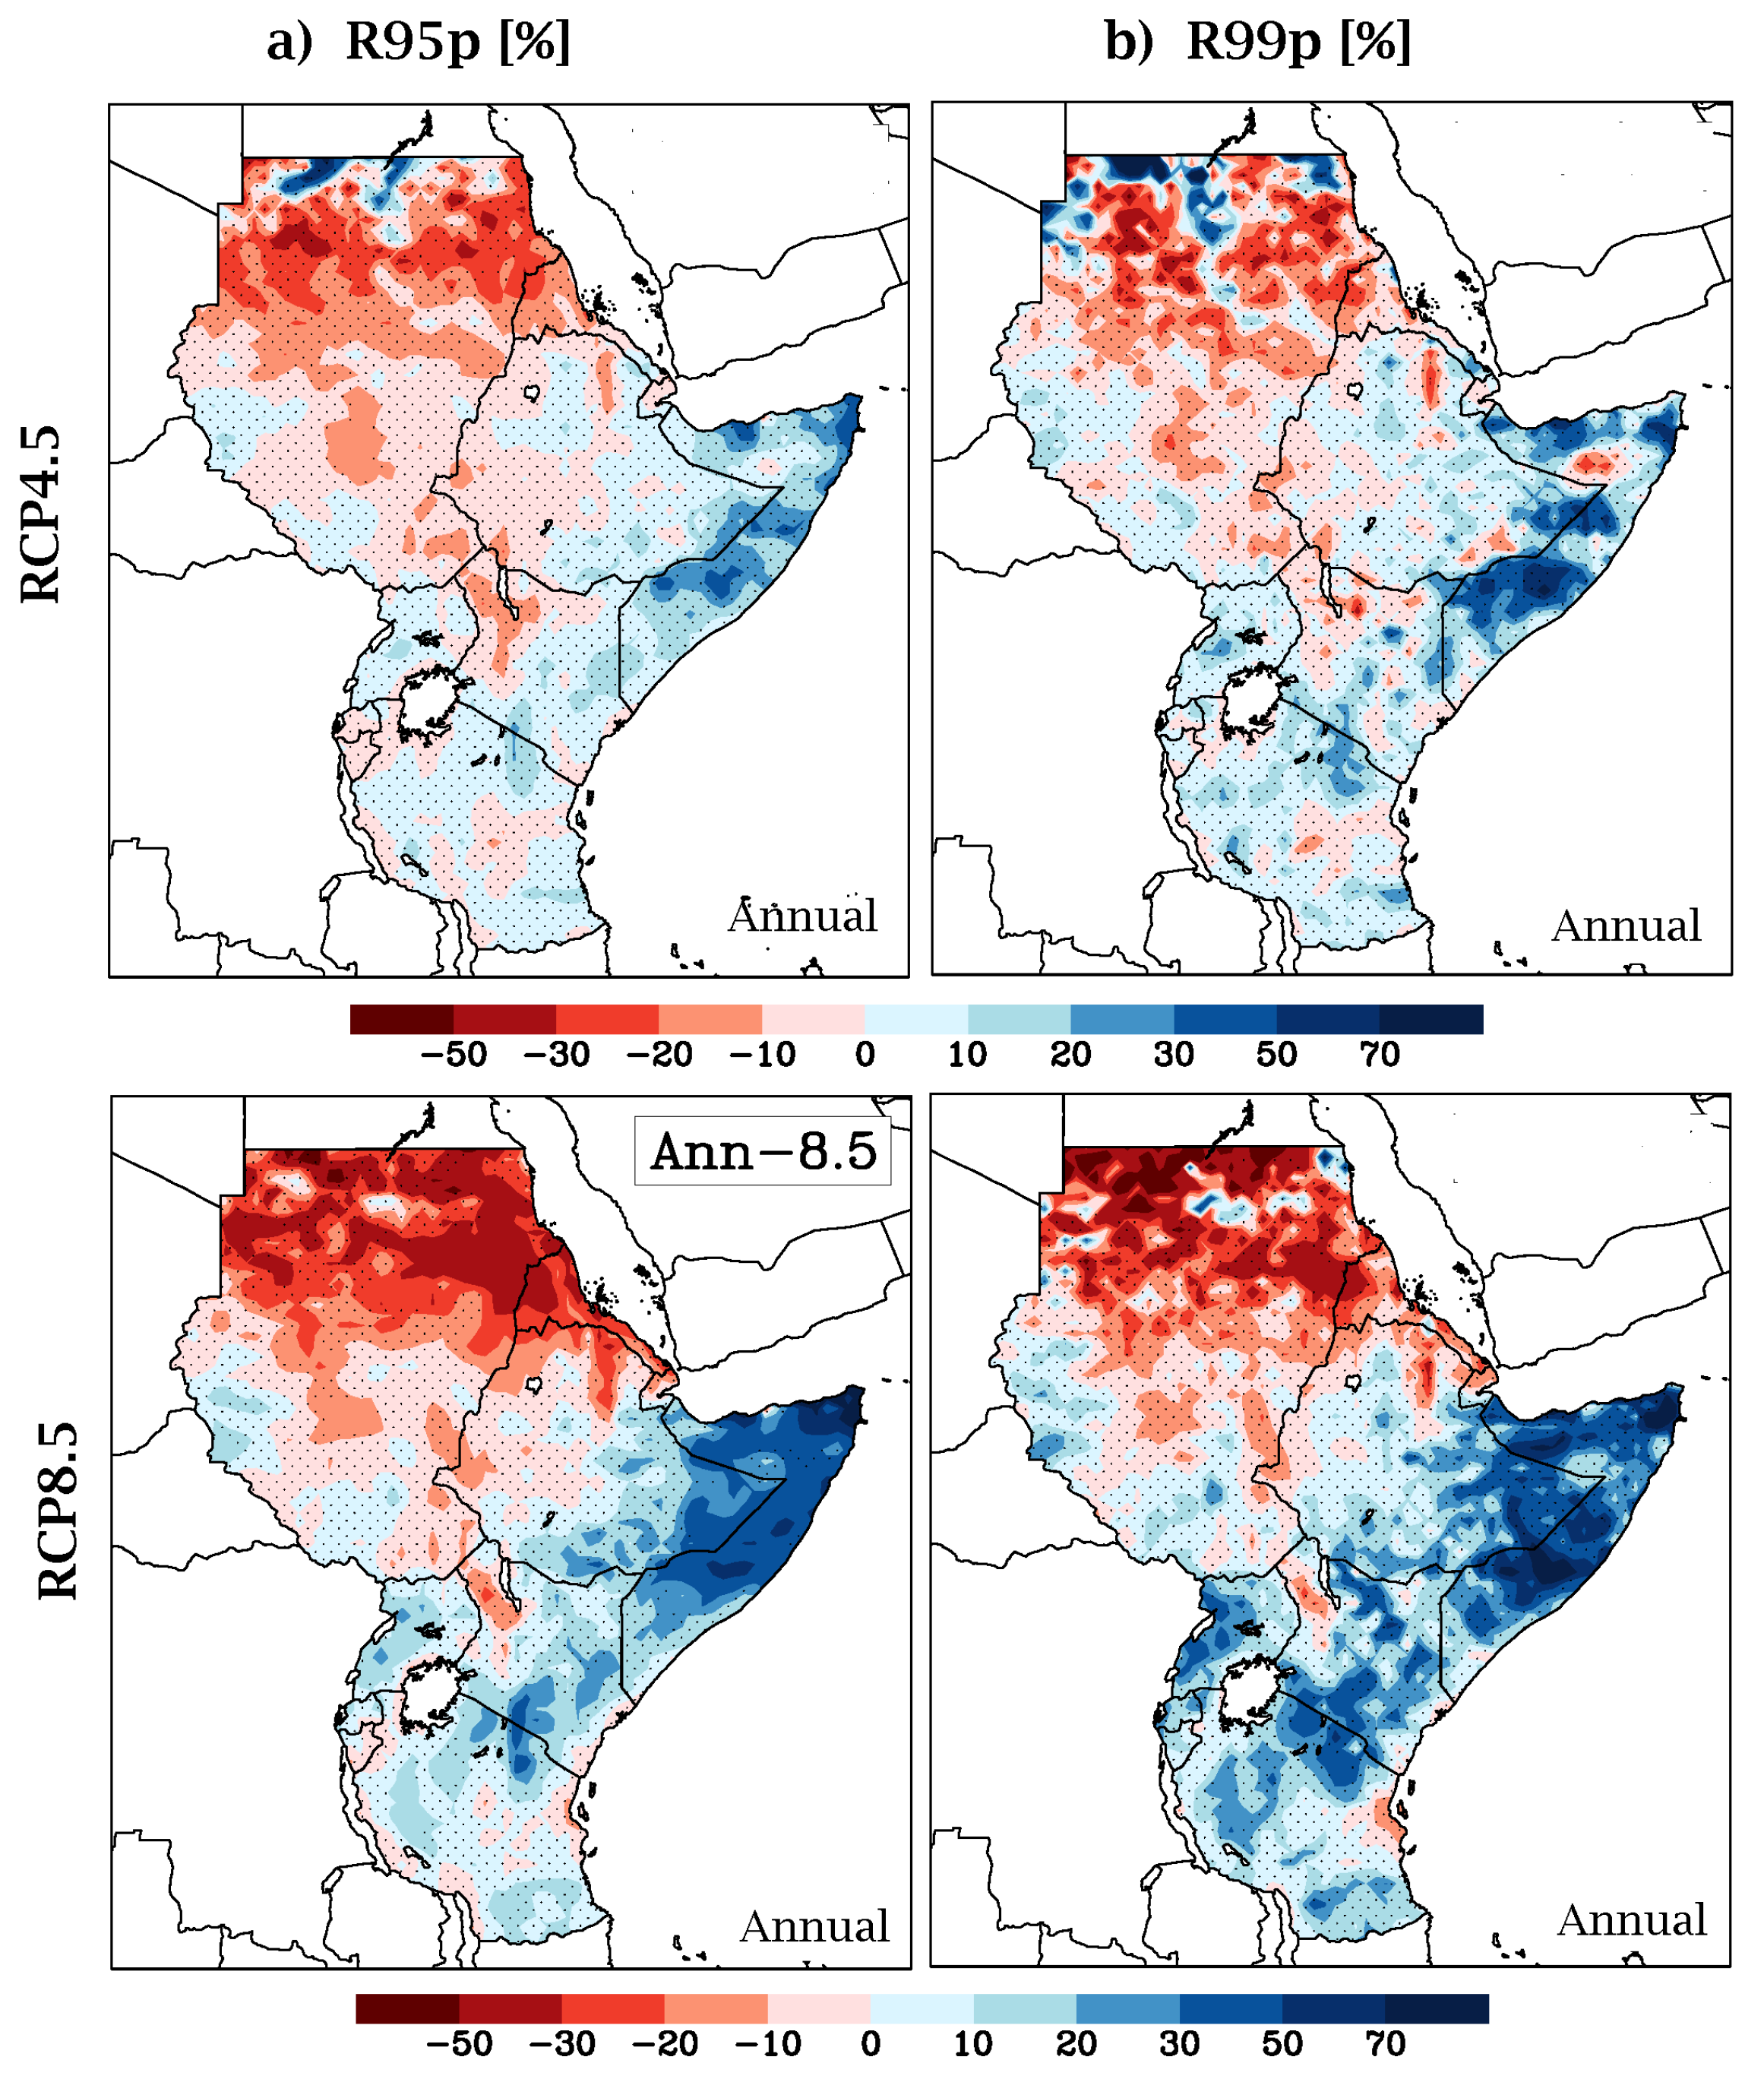
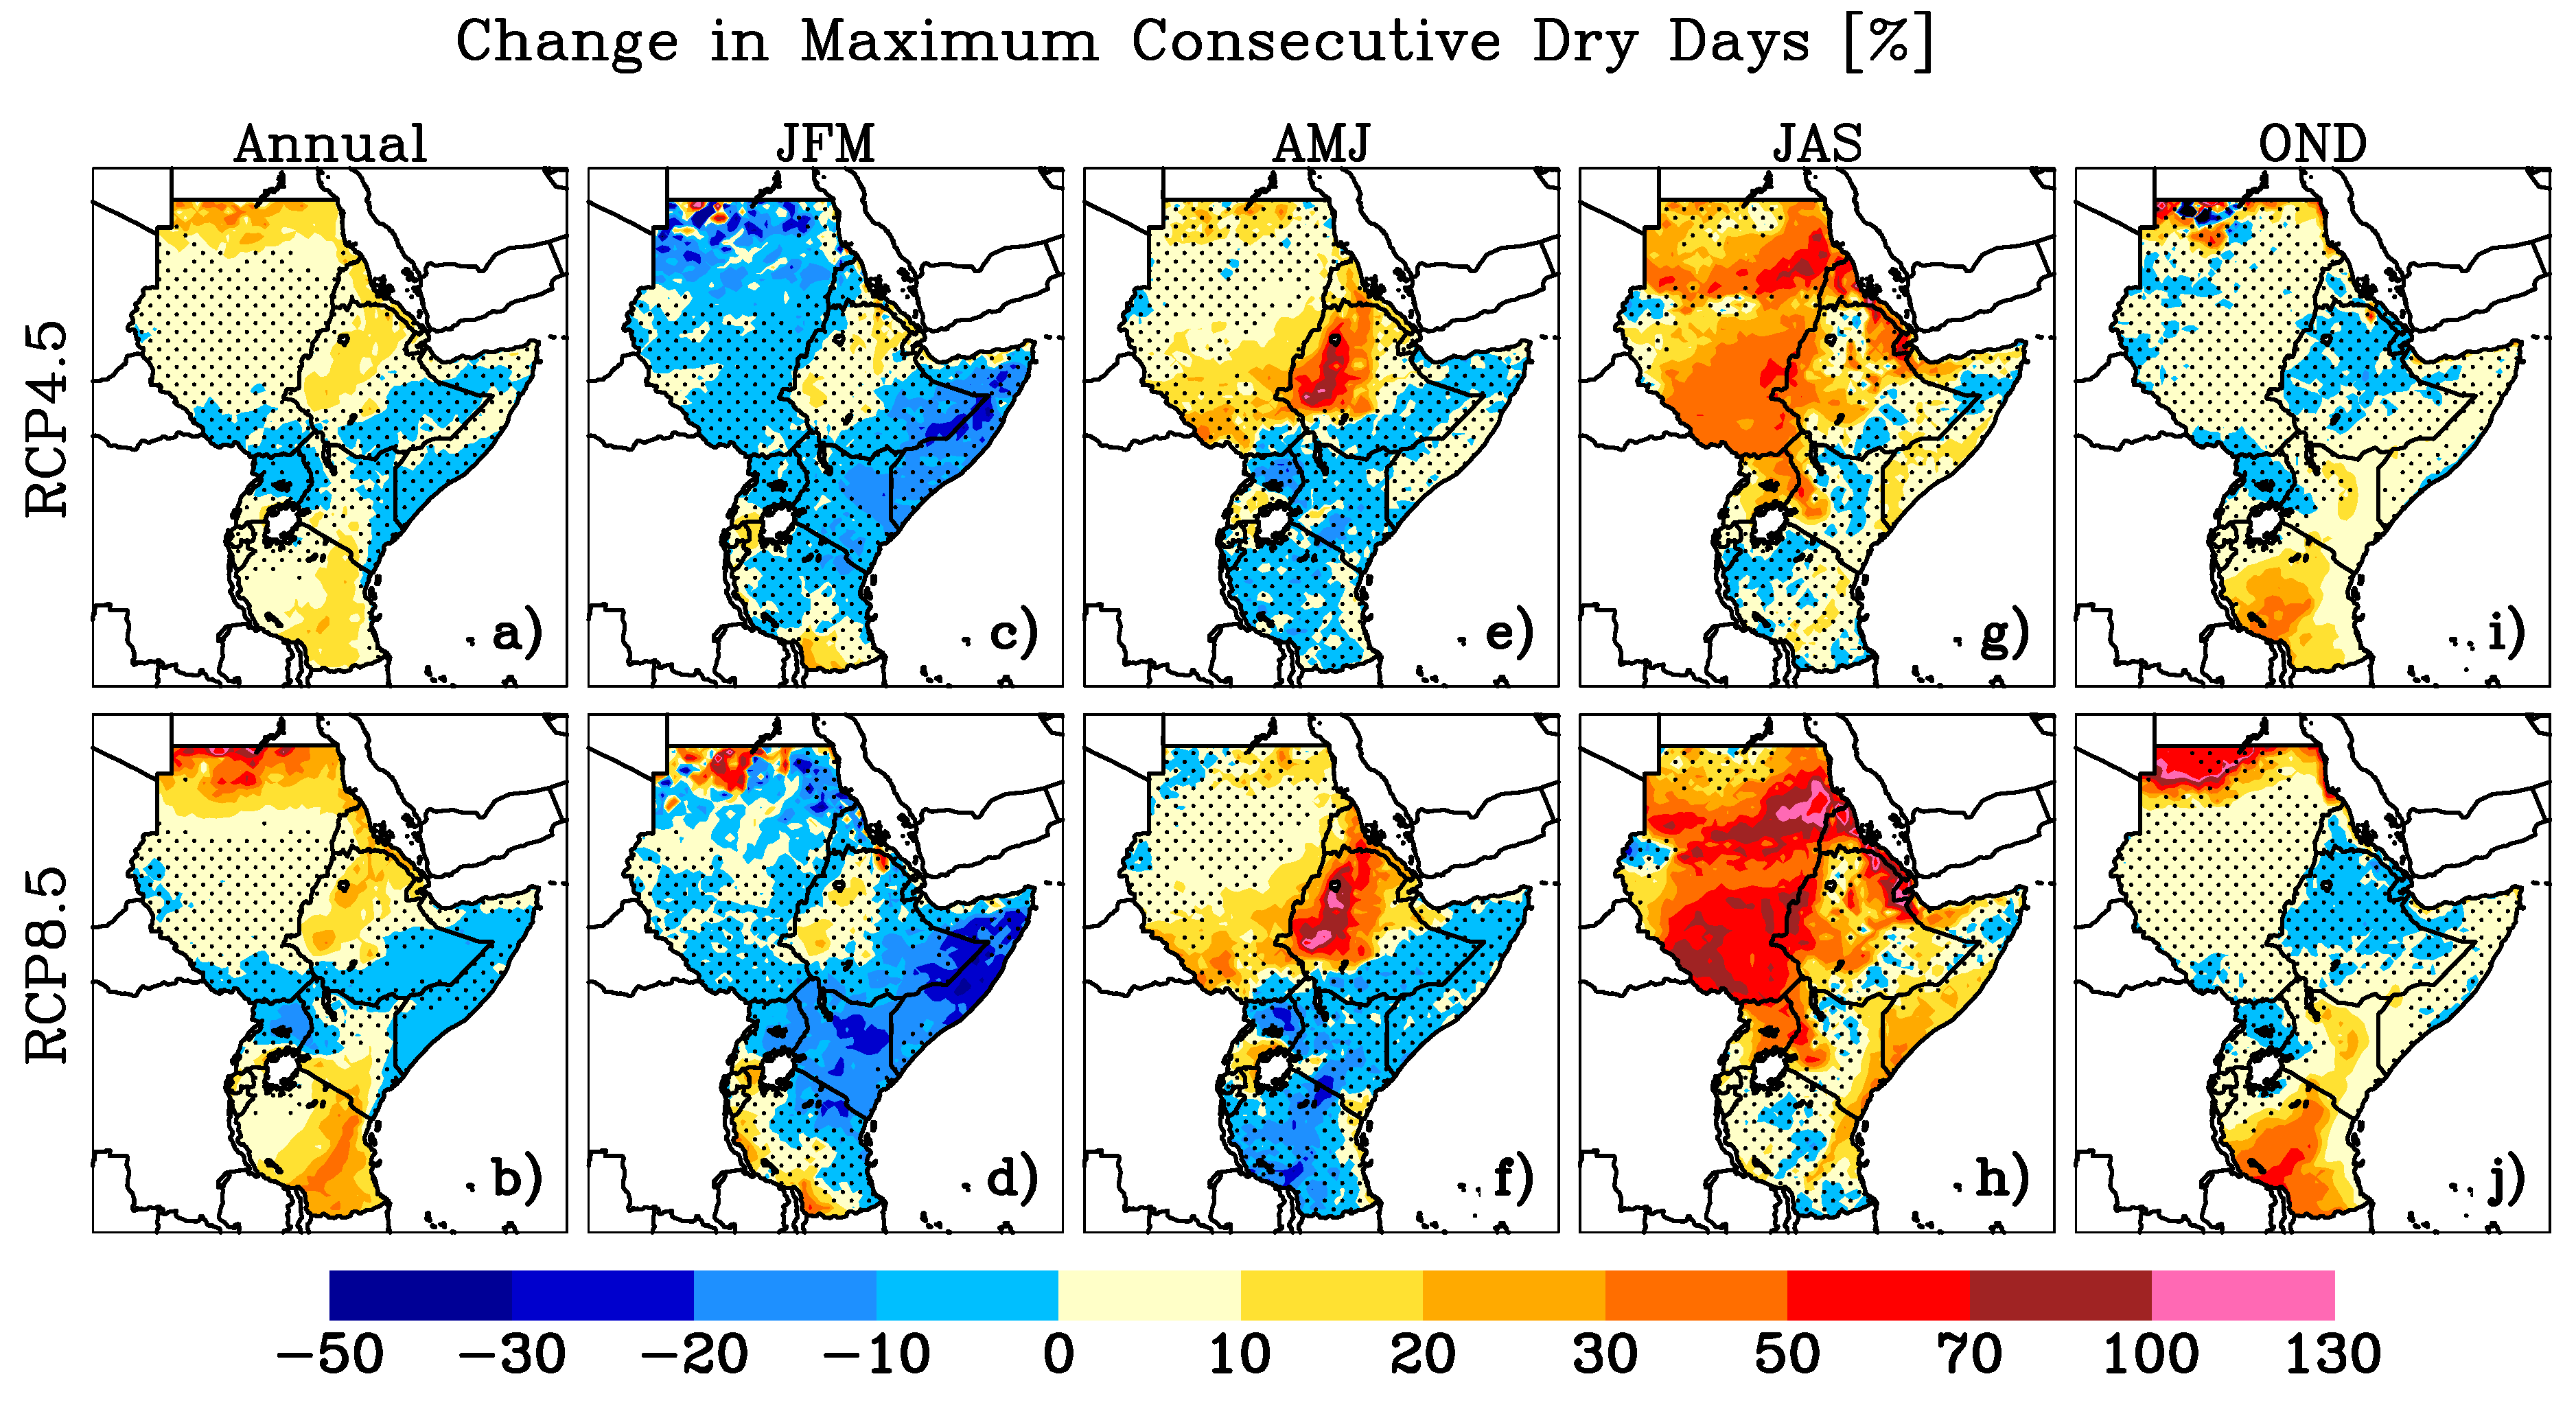
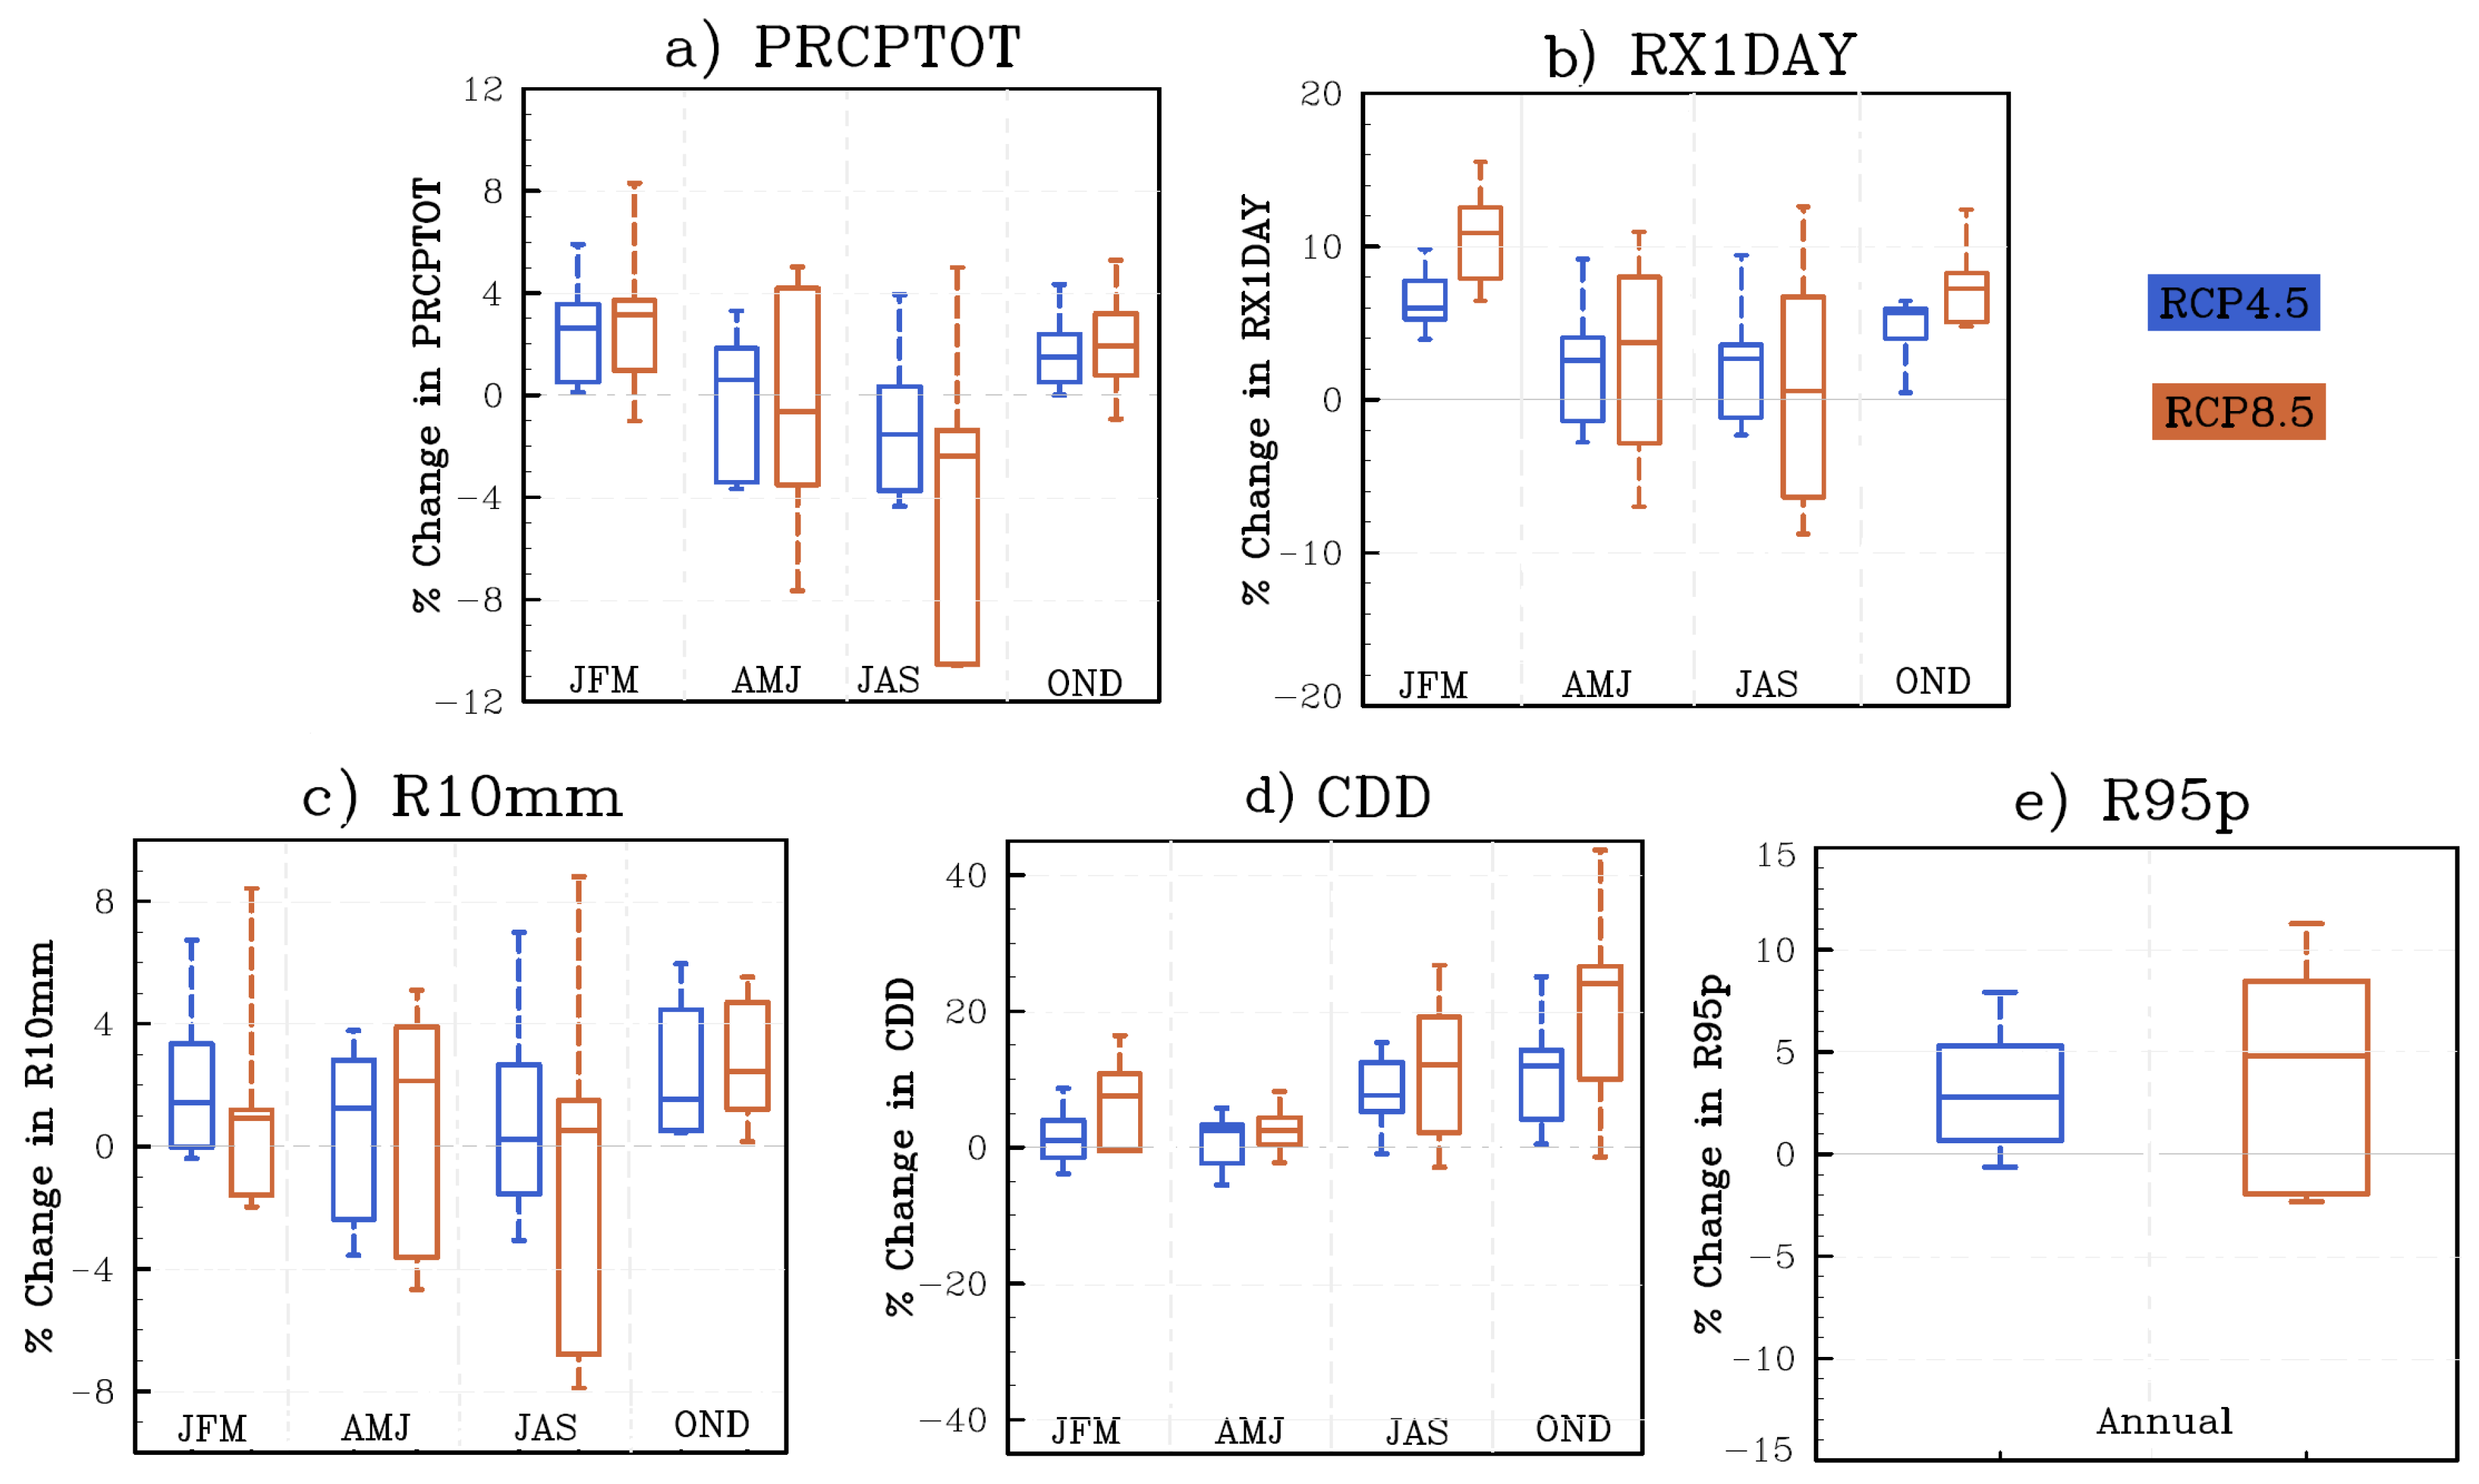
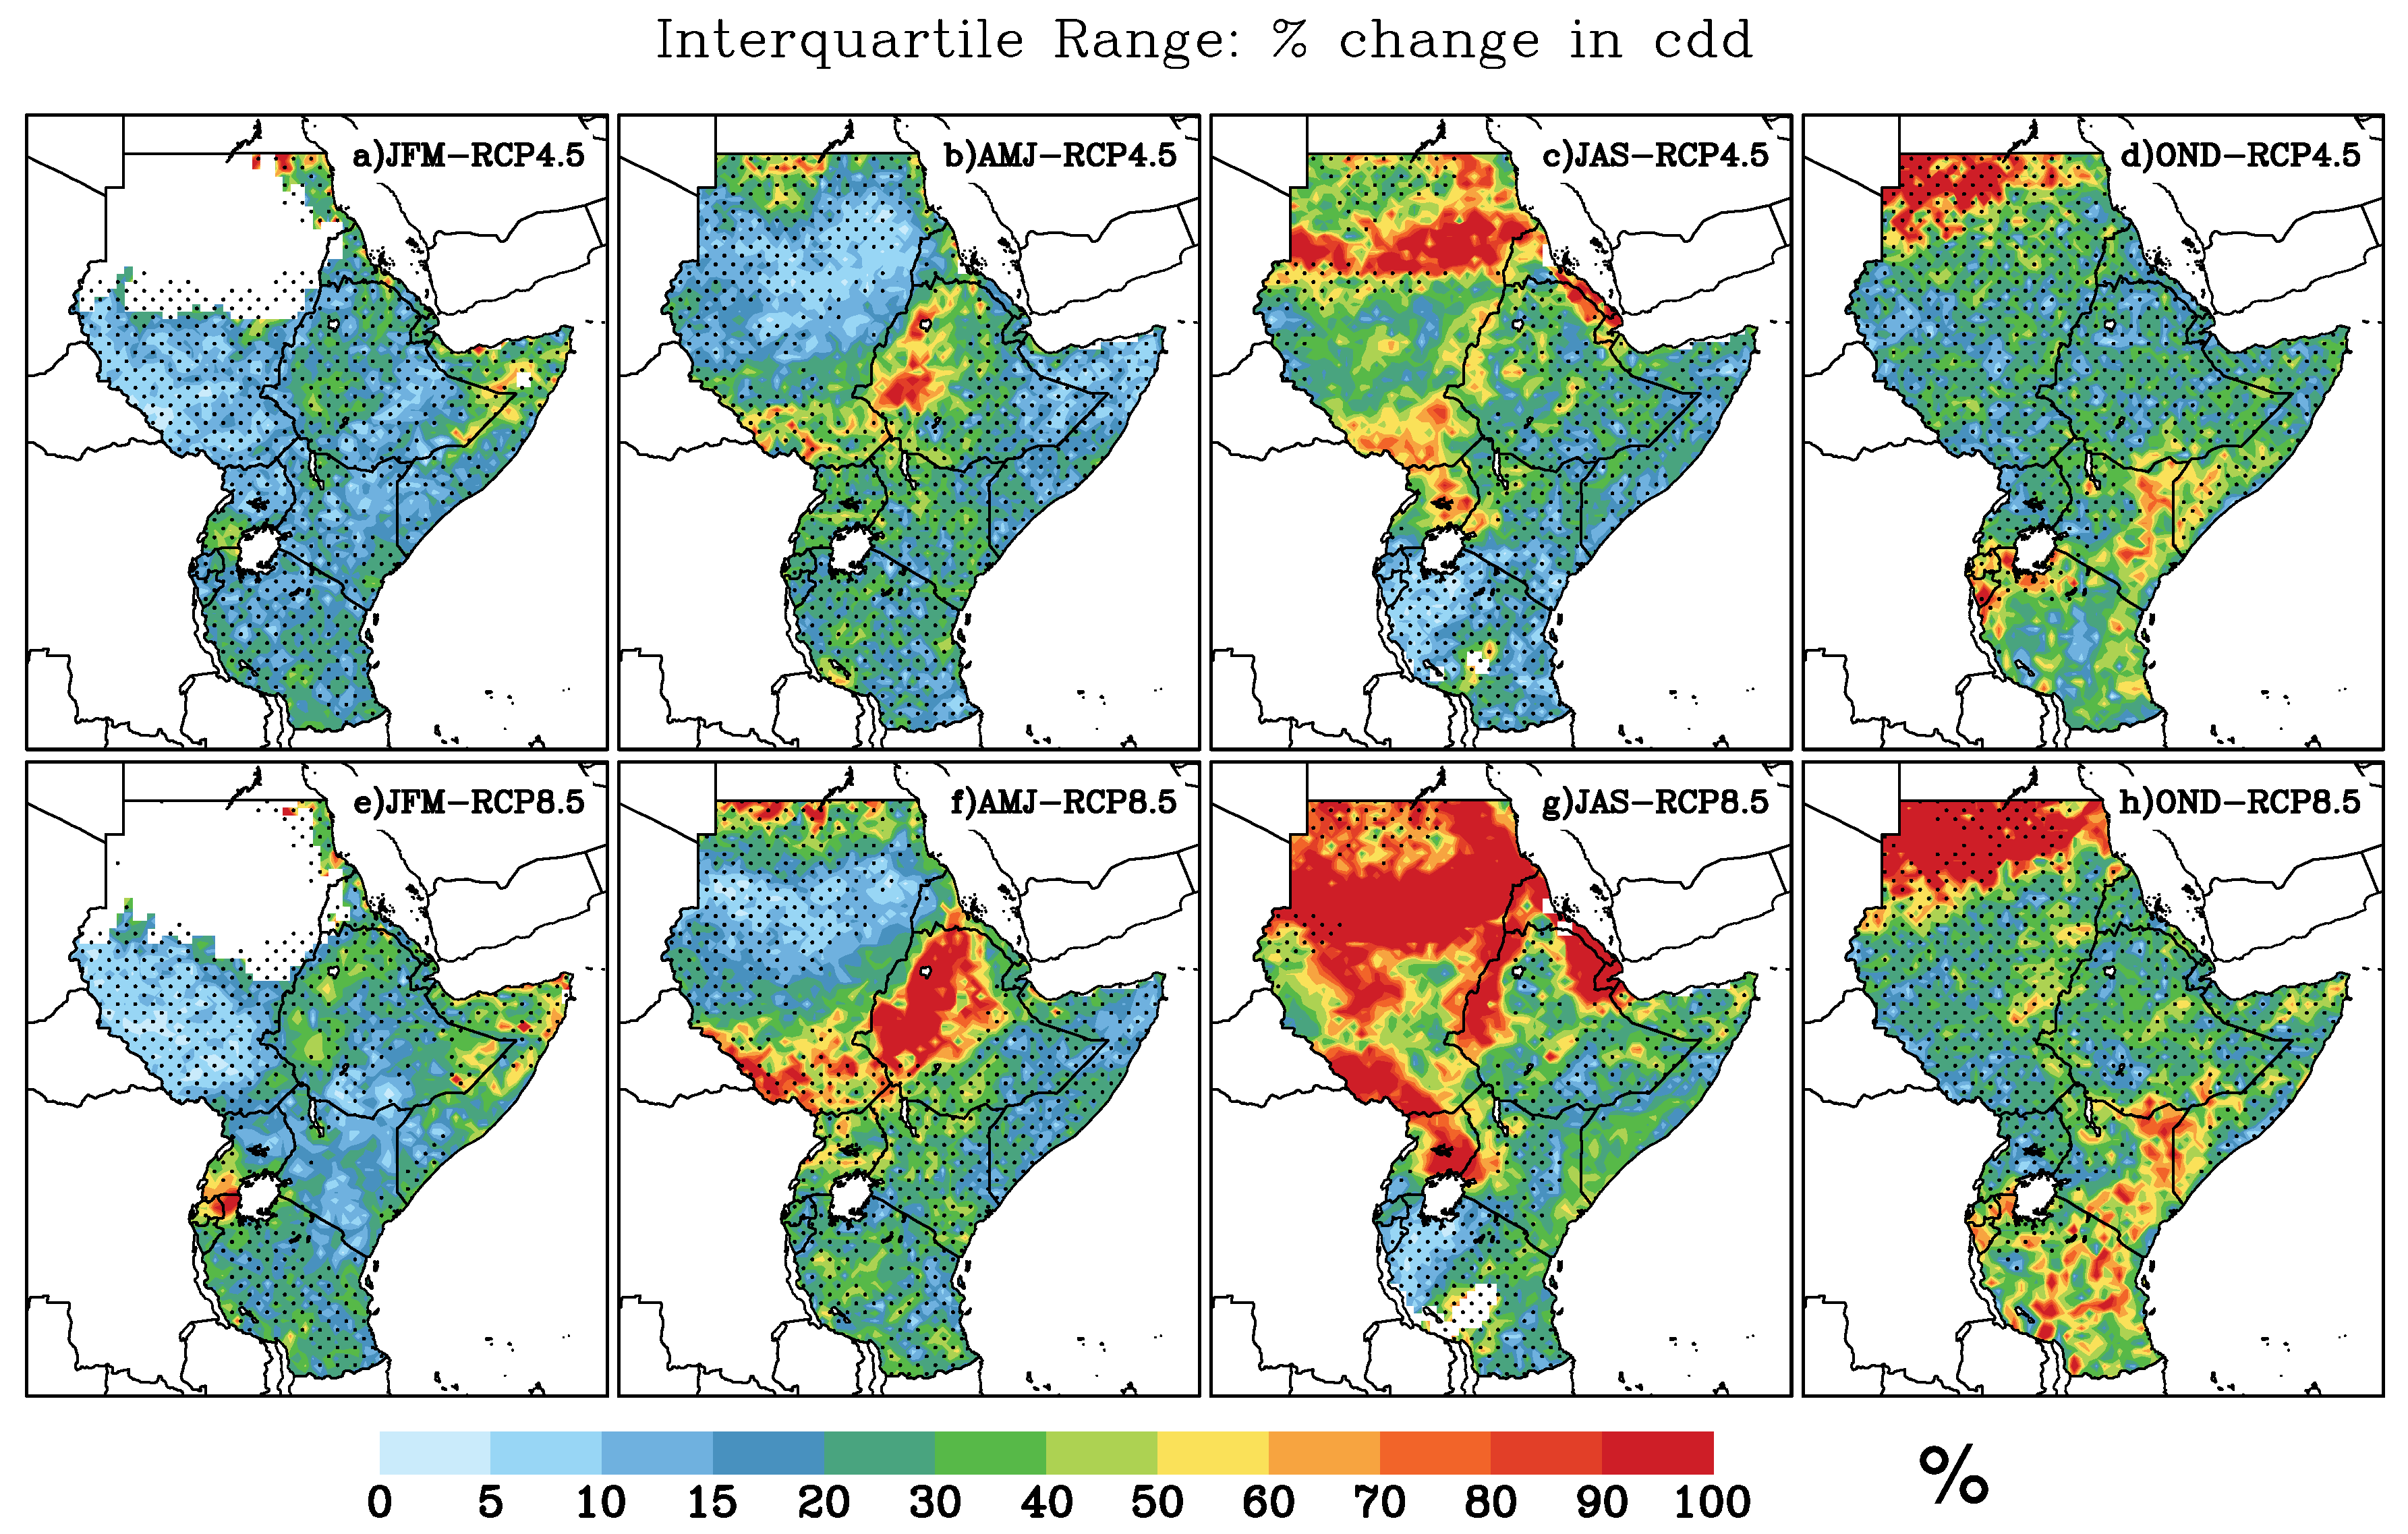
Table 1.
List of RCMs used and their details (source: Nikulin et al. [22]).
Table 1.
List of RCMs used and their details (source: Nikulin et al. [22]).
| CLMcom-CCLM4.8 | SMHI-RCA4 | |
|---|---|---|
| Institute | Climate Limited-Area Modelling Community(CLMcom) | Swedish Meteorological and Hydrological Institute(SMHI), Rossby Centre |
| Model Name | COSMO-Climate Limited-Area Modelling (COSMO-CLM) | Rossby Centre regional atmospheric model v4 (RCA4) |
| Short name | CCLM | RCA4 |
| Projection resolution | Rotated pole 0.44 | Rotated pole 0.44 |
| Vertical coordinate/levels | Terrain following/35 | hybrid/40 |
| Advection | Fifth-order upwind [24] | Semi-Lagrangian |
| Time step (s) | 240 | 1200 |
| Convective scheme | Tiedtke [25] | Kain and Fritsch [26,27] |
| Radiation scheme | Ritter and Geleyn [28] | Savijärvi [29,30] |
| Turbulence vertical | LLM [31] | Meso-NH [32] |
| diffusion | COSMO single column [33] | |
| Cloud microphysics scheme | COSMO [34] LM-DWD [35] | Rasch and Kristjansson [36] |
| Land surface scheme | TerraLib Modeling Language (TERRA-ML) [34] | LSS-RCA3 [37] |
| Latest reference | [20,38] | [39] |
Table 2.
CMIP5 GCMs used in this study.
| Model | Description | Modeling Center |
|---|---|---|
| CNRM-CM5 | Centre National de Météorologiques Coupled Model 5 | Centre National de Recherches Météorologiques/Centre Européen de Recherche et Formation (CERFACS)Avancée en Calcul Scientifique |
| EC-EARTH HadGEM2-ES | EC-EARTH Hadley Global Environmental Earth System Model 2 | EC-EARTH consortium Met Office Hadley Centre(MOHC) |
| MPI-ESM-LR | MPI Earth System Model running on low resolution grid | Max Planck Institute for Meteorology (MPI-M) |
Table 3.
Moderate precipitation extremes used in this study. Detailed descriptions of these and the rest of WMO’S Expert Team on Climate Risk and Sector-specific Climate Indicesindices can be found in Alexander et al. [44].
Table 3.
Moderate precipitation extremes used in this study. Detailed descriptions of these and the rest of WMO’S Expert Team on Climate Risk and Sector-specific Climate Indicesindices can be found in Alexander et al. [44].
| Index | Definition | Unit |
|---|---|---|
| PRCPTOT | Sum of daily precipitation ≥ 1 mm | mm |
| SDII | Annual total PRCP divided by the number of wet days (≥1 mm) | mm/day |
| CDD | Maximum number of Consecutive Dry Days (<1 mm) | mm |
| R10 mm | Number of days when precipitation ≥ 10 mm | days |
| R20 mm | Number of days when precipitation ≥ 20 mm | days |
| RX1DAY | Maximum 1-day precipitation total | mm |
| RX5DAY | Maximum 5-day precipitation total | mm |
| R95p | Annual sum of daily precipitation ≥95th percentile | mm |
| R99p | Annual sum of daily precipitation ≥99th percentile | mm |
Table 4.
Pattern correlation coefficients across the different precipitation products calculated over Greater Horn of Africa Region for the annual mean of the PRCPTOT, SDII, R10 mmm and RX1DAY indices
Table 4.
Pattern correlation coefficients across the different precipitation products calculated over Greater Horn of Africa Region for the annual mean of the PRCPTOT, SDII, R10 mmm and RX1DAY indices
| PRCPTOT | SDII | ||||||||
|---|---|---|---|---|---|---|---|---|---|
| TRMM | GPCP | GPCC | EWEMBI | TRMM | GPCP | GPCC | EWEMBI | ||
| CHIRPS | 0.98 | 0.97 | 0.97 | 0.97 | CHIRPS | 0.55 | 0.71 | 0.71 | 0.40 |
| TRMM | 0.96 | 0.96 | 0.96 | TRMM | 0.62 | 0.37 | 0.41 | ||
| GPCP | 0.95 | 0.94 | GPCP | 0.74 | 0.35 | ||||
| GPCC | 0.97 | GPCC | 0.52 | ||||||
| R10 mm | RX1DAY | ||||||||
| TRMM | GPCP | GPCC | EWEMBI | TRMM | GPCP | GPCC | EWEMBI | ||
| CHIRPS | 0.90 | 0.89 | 0.95 | 0.78 | CHIRPS | 0.33 | 0.55 | 0.78 | 0.62 |
| TRMM | 0.95 | 0.89 | 0.83 | TRMM | 0.85 | 0.47 | 0.68 | ||
| GPCP | 0.89 | 0.77 | GPCP | 0.66 | 0.77 | ||||
| GPCC | 0.83 | GPCC | 0.79 | ||||||
© 2018 by the authors. Licensee MDPI, Basel, Switzerland. This article is an open access article distributed under the terms and conditions of the Creative Commons Attribution (CC BY) license (http://creativecommons.org/licenses/by/4.0/).
Share and Cite
MDPI and ACS Style
Shiferaw, A.; Tadesse, T.; Rowe, C.; Oglesby, R. Precipitation Extremes in Dynamically Downscaled Climate Scenarios over the Greater Horn of Africa. Atmosphere 2018, 9, 112. https://doi.org/10.3390/atmos9030112
AMA Style
Shiferaw A, Tadesse T, Rowe C, Oglesby R. Precipitation Extremes in Dynamically Downscaled Climate Scenarios over the Greater Horn of Africa. Atmosphere. 2018; 9(3):112. https://doi.org/10.3390/atmos9030112
Chicago/Turabian StyleShiferaw, Andualem, Tsegaye Tadesse, Clinton Rowe, and Robert Oglesby. 2018. "Precipitation Extremes in Dynamically Downscaled Climate Scenarios over the Greater Horn of Africa" Atmosphere 9, no. 3: 112. https://doi.org/10.3390/atmos9030112
Note that from the first issue of 2016, this journal uses article numbers instead of page numbers. See further details here.