Immersion Freezing of Total Ambient Aerosols and Ice Residuals

Atmospheric Sciences and Global Change Division, Pacific Northwest National Laboratory, Richland, WA 99352, USA
Atmosphere 2018, 9(2), 55; https://doi.org/10.3390/atmos9020055
Submission received: 17 January 2018
/
Revised: 31 January 2018
/
Accepted: 6 February 2018
/
Published: 9 February 2018
(This article belongs to the Special Issue Morphology and Internal Mixing of Atmospheric Particles)
Abstract
:This laboratory study evaluates an experimental set-up to study the immersion freezing properties of ice residuals (IRs) at a temperature ranging from −26 to −34 °C using two continuous-flow diffusion chamber-style ice nucleation chambers coupled with a virtual impactor and heat exchanger. Ice was nucleated on the total ambient aerosol through an immersion freezing mechanism in an ice nucleation chamber (chamber 1). The larger ice crystals formed in chamber 1 were separated and sublimated to obtain IRs, and the frozen fraction of these IRs was investigated in a second ice nucleation chamber (chamber 2). The ambient aerosol was sampled from a sampling site located in the Columbia Plateau region, WA, USA, which is subjected to frequent windblown dust events, and only particles less than 1.5 μm in diameter were investigated. Single-particle elemental composition analyses of the total ambient aerosols showed that the majority of the particles are dust particles coated with organic matter. This study demonstrated a capability to investigate the ice nucleation properties of IRs to better understand the nature of Ice Nucleating Particles (INPs) in the ambient atmosphere.
1. Introduction
Atmospheric INPs can be airborne particles such as pollen, biological spores, bacteria, plant debris, inorganic dust, volcanic ash, organics, salts, meteoritic particles, and also complex mixtures of organic and inorganic compounds [1,2]. Our understanding of the specific properties that govern the heterogeneous nucleation of ice is limited, and for the same reason, heterogeneous ice nucleation is very difficult to represent adequately in cloud models. Laboratory experiments have been conducted to investigate a wide range of potential INP sources [3,4,5,6,7,8,9,10,11,12,13,14,15]. While these studies have improved our understanding of INP number concentration and freezing temperatures across the range of ice nucleation mechanisms significantly, it is often assumed in cloud models that the history of an individual particle does not influence its ice-nucleating properties [16,17,18,19,20]. However, upon sublimation of ice crystals, IRs (ice residuals) are released and may affect cloud properties, leading to poorly constrained feedback processes such as interactions between clouds and ocean/sea ice surface in current cloud resolving models [21,22]. Recently, it has been demonstrated that these IRs may further induce ice crystal formation through recycling and maintain cloud production [23].
Previously, many ground- and airborne-based studies have collected and characterized the nature of IRs using real-time and offline analysis techniques [24,25,26,27,28,29,30,31,32,33,34,35,36]. For example, DeMott et al. (2003) [35] utilized a ice nucleation chamber to induce ice nucleation at cirrus cloud temperature conditions on ambient aerosols, and these ice crystals were separated to obtain IRs. The nature of IRs was further characterized using the mass spectrometer. Recently, an ice selective inlet was deployed at the Jungfraujoch research site located in the Swiss Alps to sample ice crystals from mixed-phase clouds to characterize the properties of IRs [29]. Previous aircraft studies have used a counterflow virtual impactor (CVI) to separate and evaporate ice crystals to characterize IRs using online mass spectrometry and electron microscopy techniques. Recently, Cziczo et al. (2013) [25] used a CVI inlet to sample ice crystals and IRs. Further, these IRs were characterized using cabin based mass spectrometer and various electron microscopy-based techniques.
These efforts greatly helped to understand the morphological and composition properties of IRs. The studies that investigate the ice nucleation behavior of IRs are also needed, particularly in the immersion freezing mode because it is likely the most common mechanism of formation of ice crystals in the atmosphere [2], to further improve our understanding of the ice nucleating ability of atmospheric aerosols. Such a study was undertaken here with an aim to demonstrate the experimental method that can be used to investigate the ice nucleating properties of IRs using two ice nucleation chambers connected in series via a pumped counterflow virtual impactor (PCVI) [37,38] and a heat exchanger. These experiments were conducted at temperatures between −26 and −34 °C, and each experiment was repeated twice. The chemical and morphological properties of the total aerosols were also analyzed.
2. Experiments
2.1. Sample Collection
The total aerosol particles were sampled from the air inlet located on the rooftop of the Atmospheric Measurements Laboratory building located at the Pacific Northwest National Laboratory (PNNL) site (Richland, WA, USA). The sampling site falls within the Columbia Plateau region, which was covered with basalt lava at one time, but now is covered with a layer of loess. Because of the dryland farming practice and dry climate, windblown dust events are commonly observed. These dust particles may or may not have an organic component depending upon the season and nearby farming practice. Infrequent regional wildfires can add biomass burning aerosol into the atmosphere, although this was not observed in this study. The ambient temperature and relative humidity (RH) conditions during measurements were 26 °C and 34%, respectively. The sampling port height was ~9 m above the ground, and the site was minimally influenced by the local vehicle pollution as measurements were performed on the weekend. The total particles drawn into the inlet are further passed through the cyclone inlet (model: URG-2000-30EH) operated at 30 LPM to sample only particles smaller than 1.5 μm in diameter. Further, this sample flow was passed through two diffusion driers connected in series to dry the ambient aerosol before they are transported to various laboratory instruments. The concentration of these size-selected particles was measured using a condensation particle counter (CPC) and in some cases by an ultra-high sensitivity aerosol spectrometer (UHSAS; Droplet Measurement Technology, Boulder, CO, USA) (see below). The CPC provides a number concentration of the total particles of size above ~10 nm per unit volume of air, whereas the UHSAS provides the number concentration of total particles of size above ~60 nm per unit volume of air.
2.2. INP Measurements of Total Aerosol and IRs
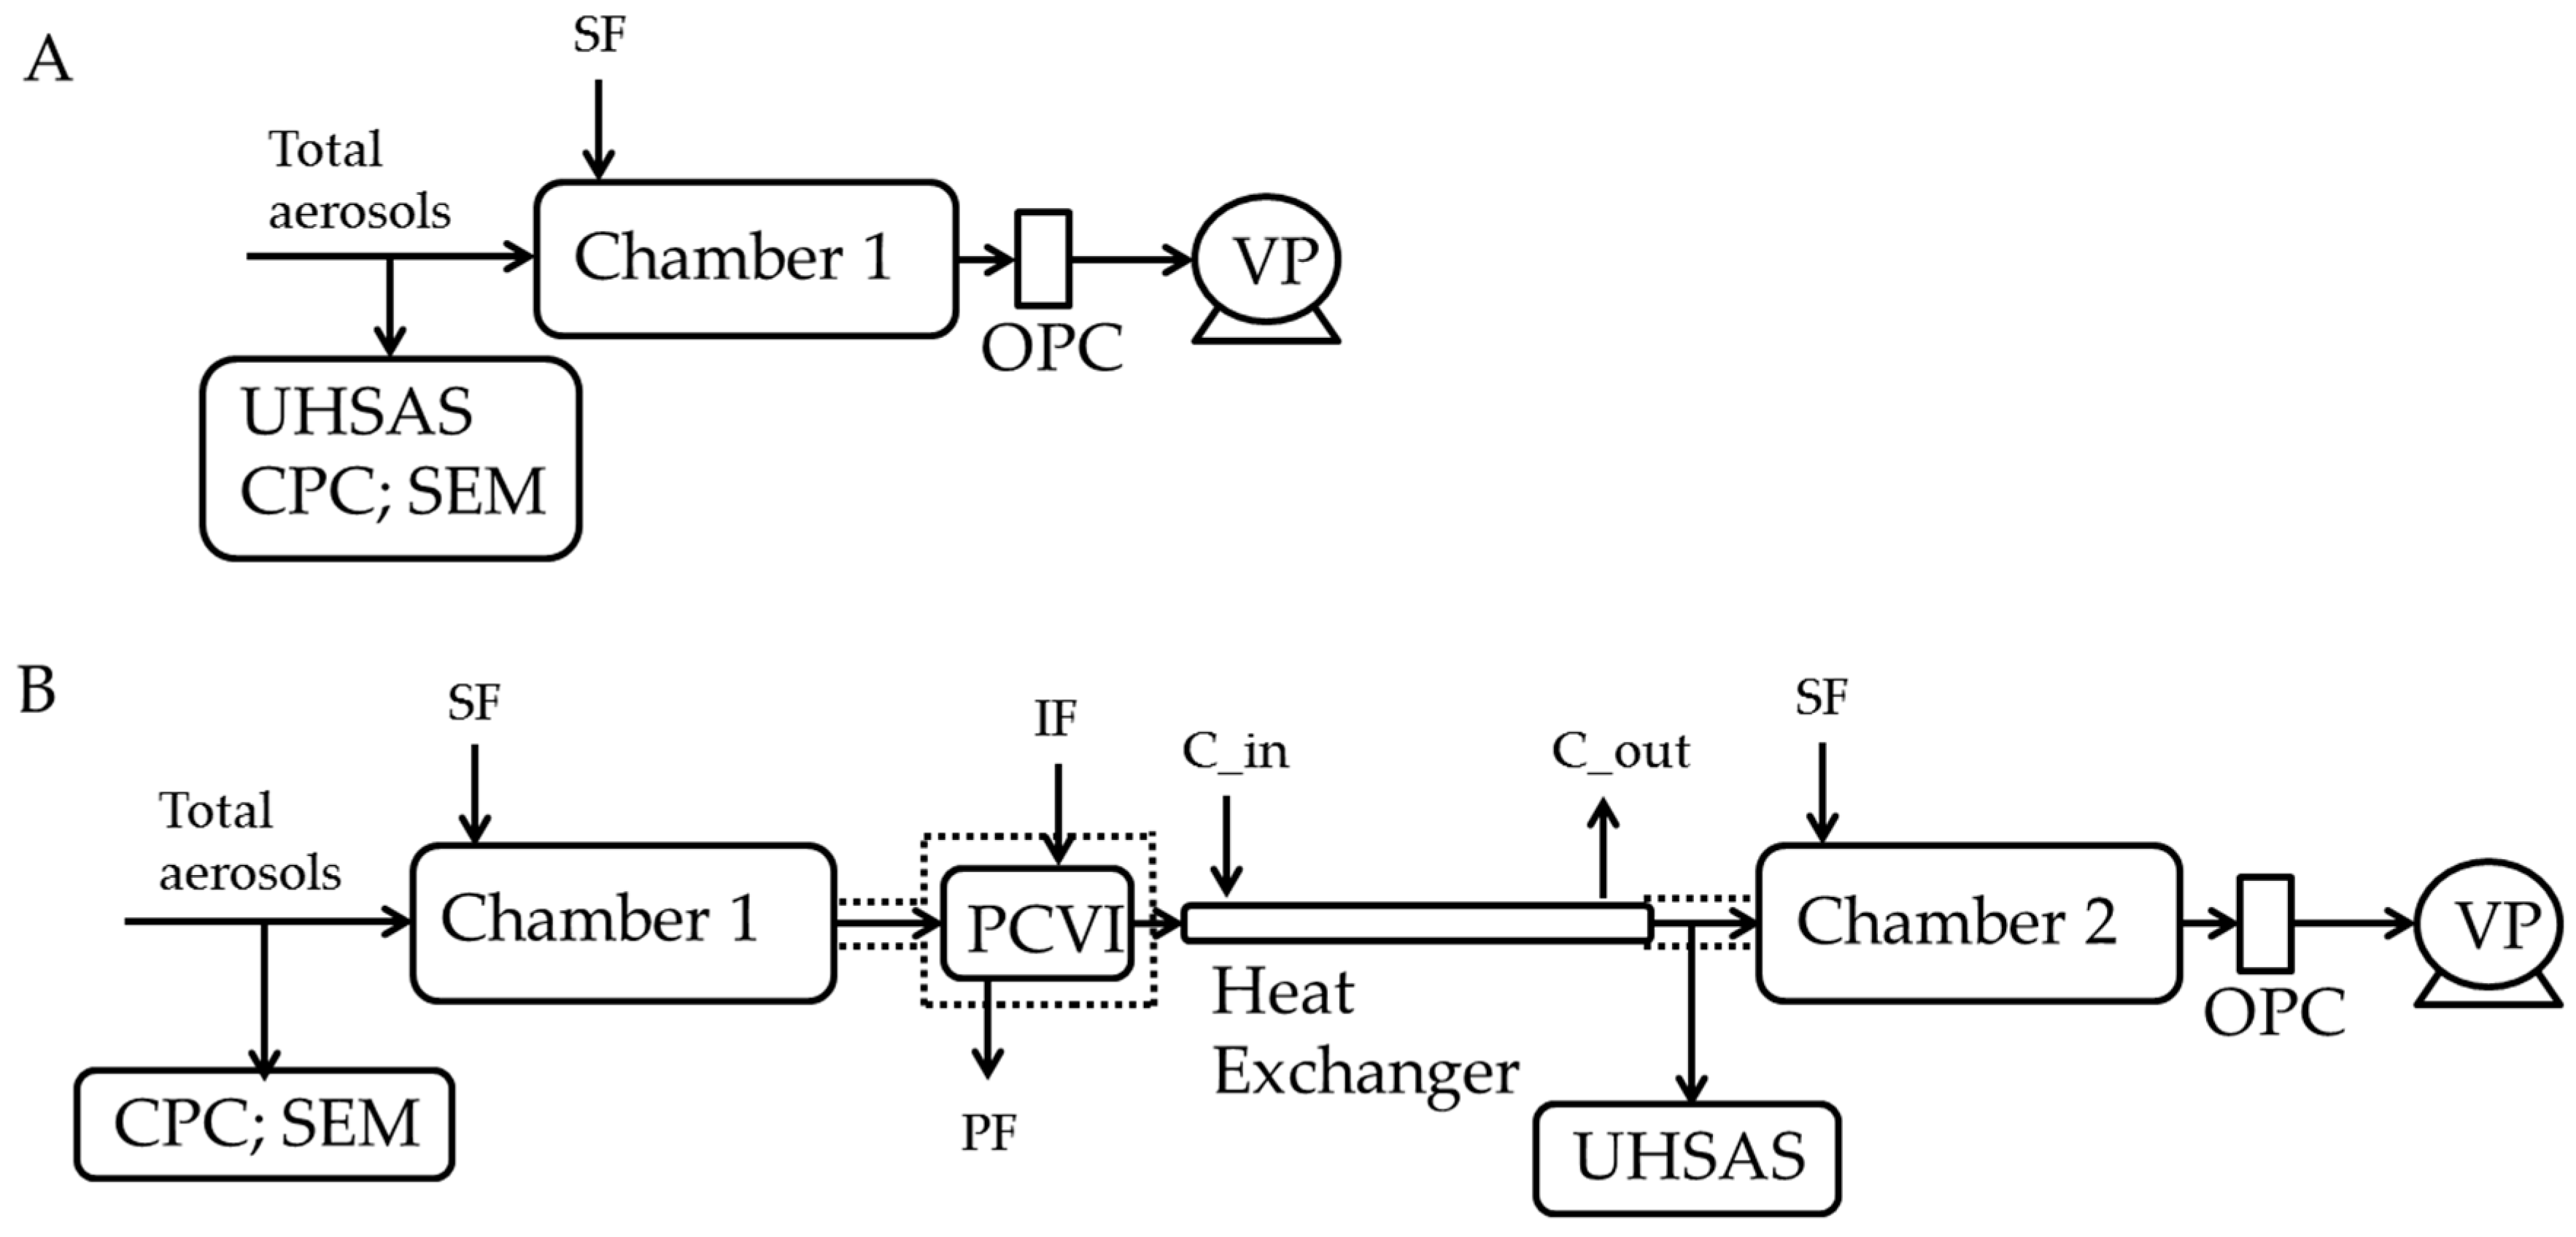
Measurements of INPs were investigated at various temperatures using two PNNL ice nucleation chambers (chamber 1 and chamber 2) as shown in Figure 1. The detailed procedures to operate the ice chambers have been previously described in Kulkarni et al. (2012) [19] and Friedman et al. (2011) [39], and the chamber geometry design is described in Stetzer at al. (2008) [40]. Briefly, the ice chamber consists of two vertical parallel plates with an evaporation section attached at the bottom of the chamber to remove supercooled water droplets. These plates are cooled using independent external cooling baths (Lauda Brinkmann Inc.; New York, NY, USA). To produce the desired ice-supersaturation conditions a linear temperature gradient between the plates is applied, and the corresponding temperature and relative humidities with respect to water (RHw) and ice (RHi) are calculated using the Murphy and Koop (2005) [41] vapor pressure formulations. The sheath and sample flow rates in chamber 1 are 9 and 1 LPM, respectively. These flow conditions limit the particle residence time within this chamber to ~12 s, whereas the flow rates within chamber 2 are 5 and 1 LPM, respectively, and particle residence time is also ~12 s. Although the dimensions of chamber 1 and 2 are slightly different (the length of chamber 2 is exactly half of the chamber 1), the experimental protocol to measure the immersion freezing efficiency of particles is similar. Dissimilarities in terms of dimensions only affect the water droplet breakthrough RHw limit, which is the RHw threshold above which water droplets can co-exist with ice crystals and phase discrimination is not possible. Such limits at temperature −26 °C for chamber 1 and 2 were observed at ~112% and >115%, respectively. The temperature dependent water droplet breakthrough limits at other temperatures are shown in Table S1. Each ice chamber has an in-built diffusion drier (maintained at room temperature) connected permanently to the chamber aerosol inlet port to dry the ambient aerosol before introducing into the chamber. The temperature and RHi uncertainty limits for both chambers are ±1.0 °C and ±3%, respectively. The uncertainties are based on aerosol lamina profile located between the two plates of the chamber at experimental conditions where sheath and sample flows are 9 LPM and 1 LPM, respectively, and the warm and cold plate temperatures are −24 and −40 °C, respectively. The wall temperatures have uncertainties of ~±0.2 K, and this temperature uncertainty translates into RHi = ~±2.5% (slightly higher RHi = ±3% is used in the study). Also, the uncertainty in the aerosol lamina temperature is ±0.5 °C (the temperature difference across the aerosol lamina width is ~1.0 °C). In this study slightly higher uncertainty = ±1.0 °C are used. The optical particle counter (OPC; CLiMET, model: CI-3100) was used to classify the particles as ice crystals if they were greater than 4 μm. The OPC and UHSAS results were further used to determine the frozen fractions using Equation (1):
Frozen fraction = OPC/UHSAS
A blank experiment at the beginning and end of the experiment was performed, which included sampling only filtered air (i.e., particle-free) at each temperature. These experiments provided the background ice fraction (~0.01%), which was subtracted from the frozen fraction measured at each temperature. Both chambers were operated at RHw = ~108%, and the evaporation section of both the chambers was maintained at aerosol lamina temperature. In addition, the PSL particles (2 µm) with known concentration are passed through the OPC, and the fraction of PSL particles that are detected by the OPC are measured. One standard deviation of the fraction of particles detected by the OPC is used as the uncertainty (~±0.1) within the frozen fraction.
Experiments were performed to understand the sensitivity of operational RHw = 108% upon the frozen fraction. Size-selected 200 nm mobility diameter ammonium sulfate particles were transported to the ice nucleation chambers 1 and 2 in succession. The particle concentration was ~4000 (# per cm3), which is nearly similar to ambient particle concentration (see Table 1). The 1st chamber was operated at −20 °C and at either two RHw 108 and 115% conditions. A fraction of sulfate particles would then activate to droplets. These droplets would move to evaporation section maintained at −42 °C to freeze the droplets through homogeneous ice nucleation. Those droplets which activated would freeze and those which did not would remain as solid sulfate particles. The idea here was to calculate the fraction of activated droplets as a function of RHw. The frozen fraction of nearly 1 was observed when the chamber was operated at 115%, but the fraction was ~62% when chamber operated at 108%. This understanding was used to develop the correction factor = ~1.6 (=1/0.62) that was applied to the frozen fraction results (Experiments A and B; Figure 1).
Experiments A and B (see Figure 1) at various temperatures (−26, −28, −30, −32, and −34 °C) were performed on the same day. The aim of experiment A was to determine the immersion freezing efficiency of total ambient aerosols with chamber 1. In experiment B, the immersion freezing efficiency of IRs was investigated using both chambers 1 and 2. Specifically, chamber 1 was used to form ice crystals from INPs present in the total aerosol population. Next, the grown ice crystals were separated using PCVI and transported through the heat exchanger to obtain the IRs. The PCVI output flow and heat exchanger conditions produced efficient sublimation of ice crystals (see below). These IRs are further transported to the UHSAS and chamber 2. Table 1 shows the average UHSAS concentration at different temperature values.
The accuracy of experiment B was validated using well-characterized reference dust particles. K-feldspar (BCS-CRM 376/1; Bureau of Analysed Samples Ltd., Middlesbrough, UK) and illite (NX Nanopowder, Arginotec, Karlsruhe, Germany) dust particles size-selected at 250 nm by a differential mobility analyzer (DMA; TSI, 3080) were transported to the CPC and ice chamber experimental set-up (Figure 1). In this experiment chamber 1 and 2 were operated at RHw = ~115%.
The PCVI cut size or counterflow was determined as follows (Figure S1). First, chamber 1 was operated at RHi = 100% and the counterflow within the PCVI was set to zero, allowing transmission of all ambient particles through the output port of the PCVI. The concentration of these particles was continuously monitored using the CPC. Next, the counterflow was increased in a step pattern (0.2 LPM flow change every 5 min; see Figure S2) until no particles were transmitted, and threshold counterflow at these conditions was ~1.8 LPM, which was then used throughout all the experiments. The theoretical particle cut-size corresponding to these flow conditions was ~2.5 µm [37]. More performance and design details regarding PCVI including particle transmission efficiency and computational fluid dynamics (CFD) simulations were shown in a previous study [37], and the CFD model details are described in the supplementary material. The zero transmission efficiency test of the PCVI was verified once again at the end of the experiment to ensure that no particles are transmitted. These flow settings should separate interstitial and small ice crystals less than ~2.5 µm, but under experimental conditions where larger ice crystals (>2.5 µm) co-exist and because of unknown artifacts (wake capture and flow fluctuations; [42]), interstitial particles may also transmit in addition to large ice crystals. However, based on previous studies using similar PCVI flow conditions and an ice nucleation chamber instrument (e.g., Baustian et al. 2012 [43]; China et al. 2015 [24]) interstitial particles could contribute up to 5% of the hydrometeors separated by the PCVI. Therefore, frozen fraction data from experiment B obtained after applying correction factor 1.6 (discussed above) is further corrected by subtracting 5% to account for the potential transmission of interstitial aerosol. A better estimate of these interstitial particles through CFD simulations was not possible because of unknown artifacts and partial imperfections [37] within the geometry that cannot be simulated.
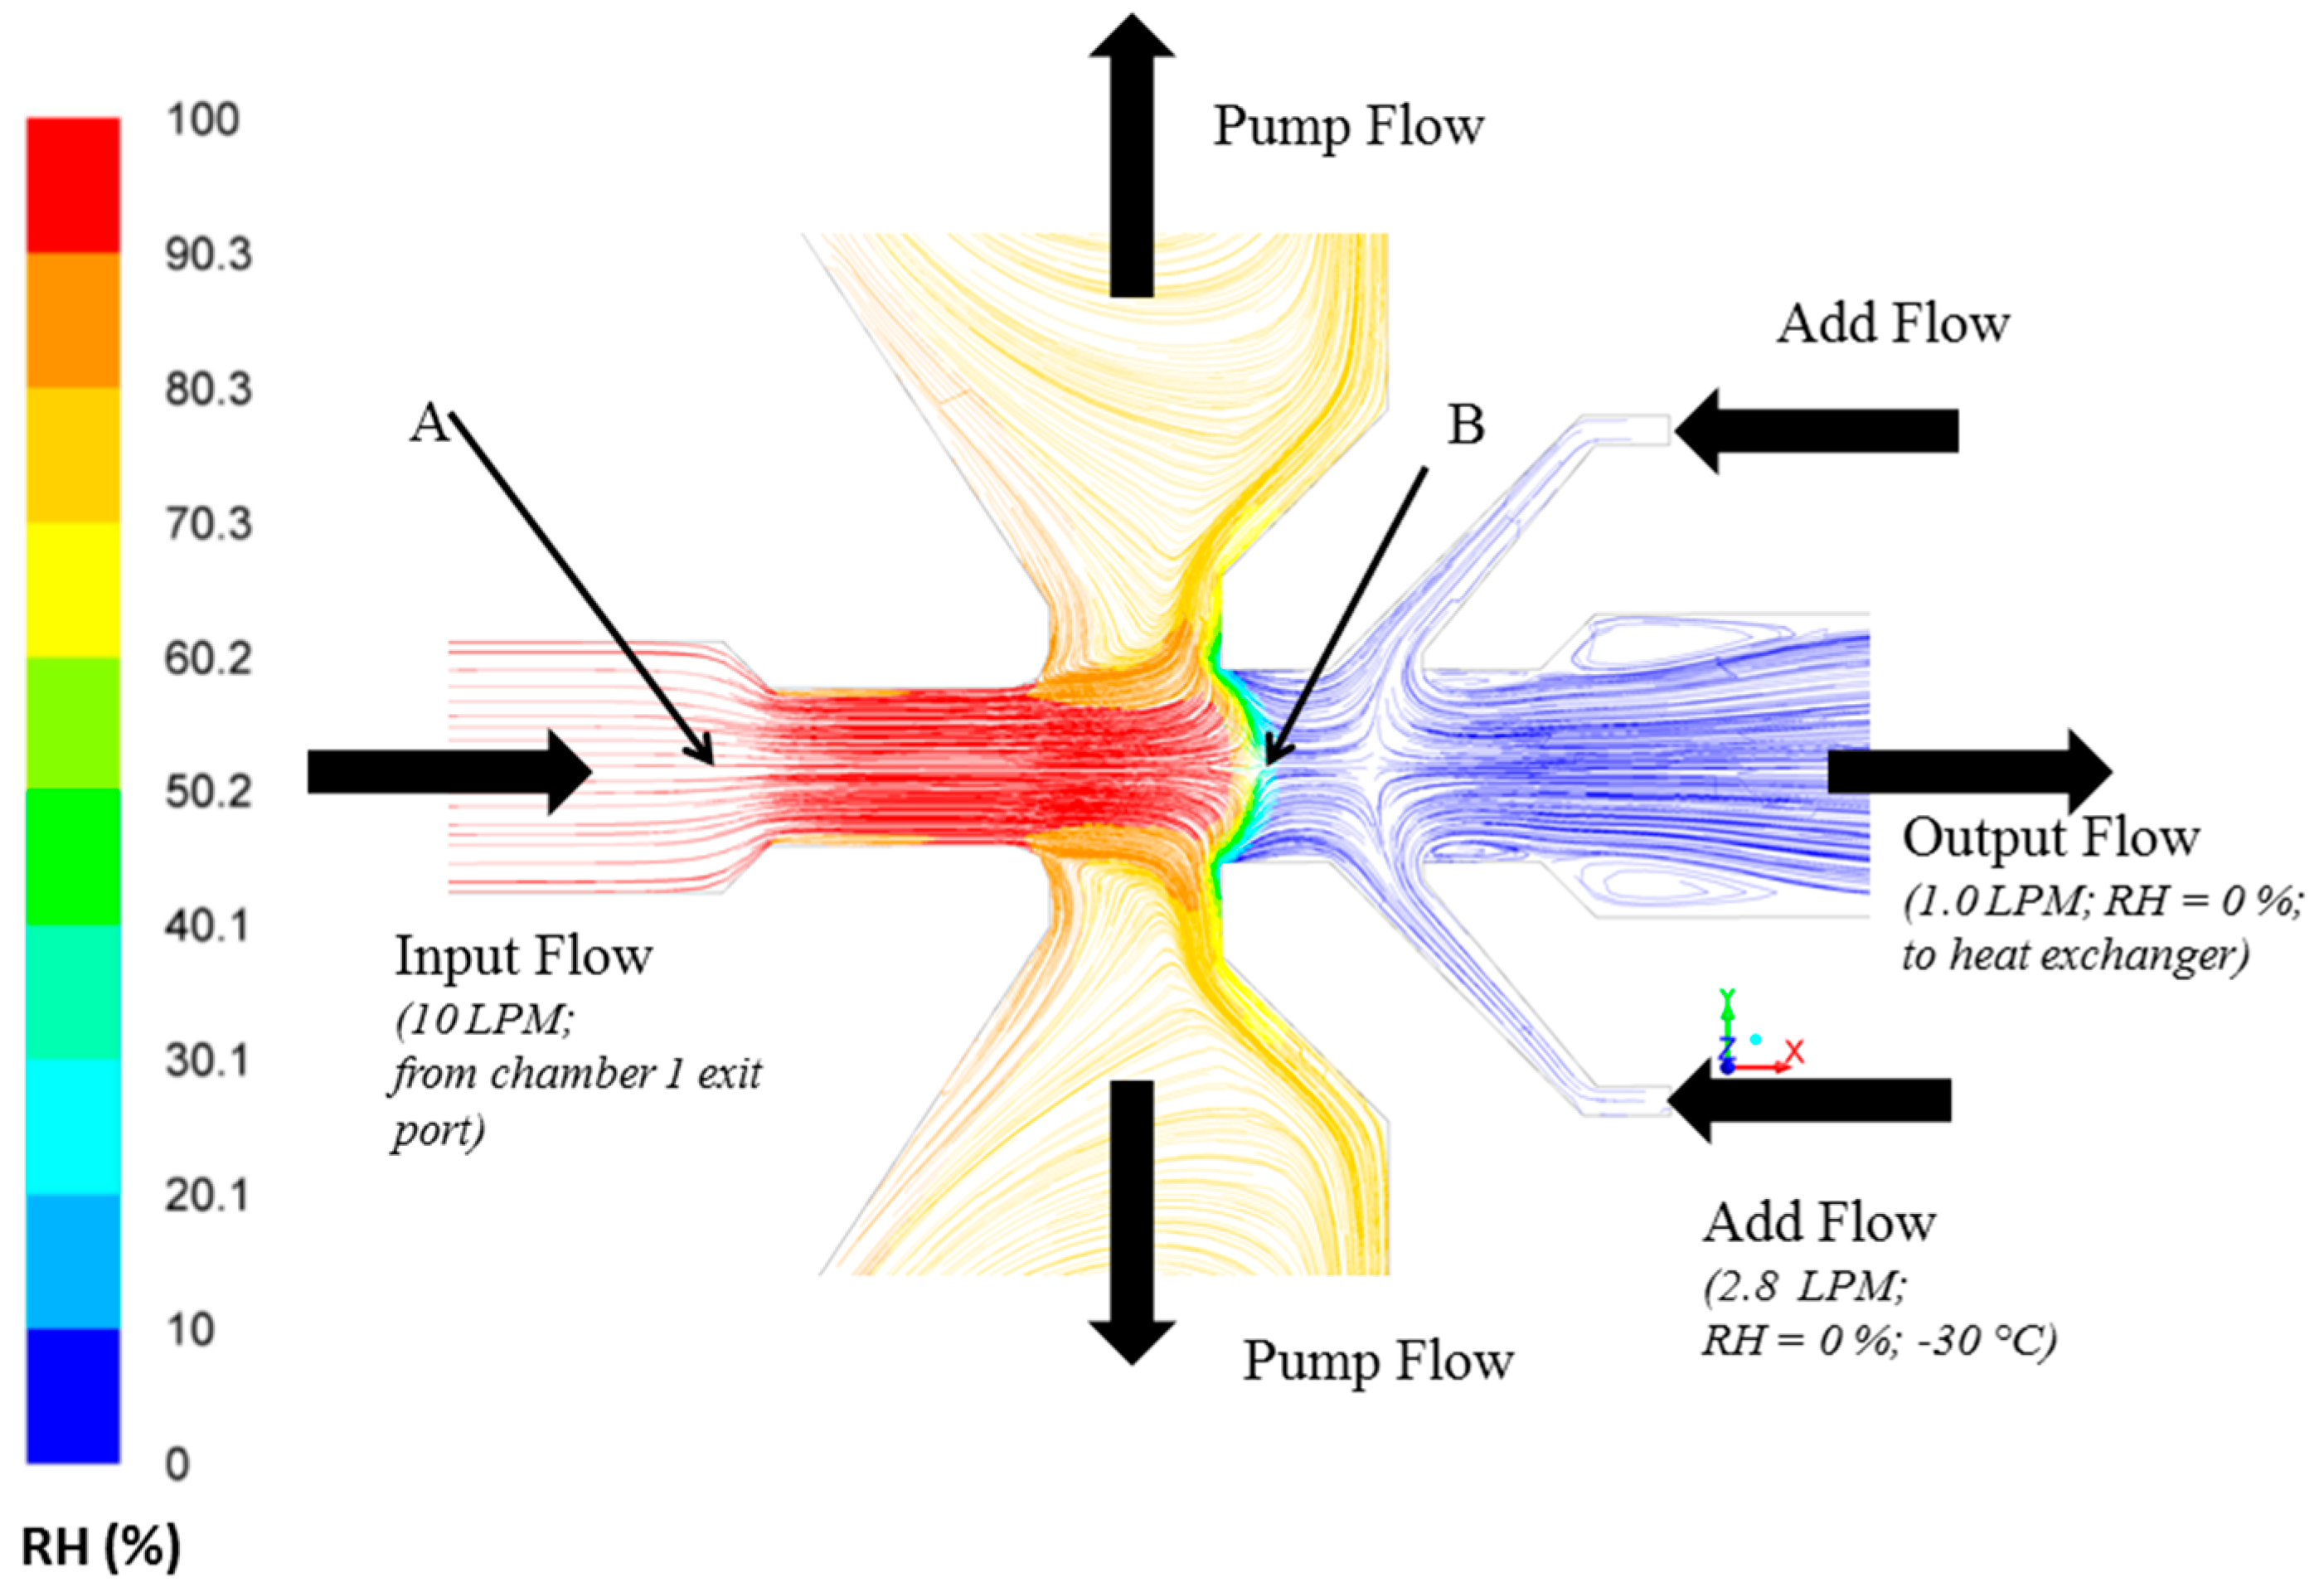
CFD simulations using experimental flow conditions (Figure 1) were performed in this study to confirm that the output flow that carries large ice crystals separated by the PCVI is dry (RH = 0%) (Figure 2). These flow conditions led to the sublimation of ice crystals within the PCVI (output flow) and the heat exchanger. More information regarding velocity vector direction and flow conditions within the PCVI (labels A and B in Figure 2) obtained through simulations are shown in Figures S2 and S3. The notation RH represents RHw henceforth.
The schematic of a heat exchanger is shown in Figure S4. It has two concentric cylinders made from stainless steel material. The ice crystals are sublimated inside the inner cylinder that is maintained at −30 °C through actively cooling the outer cylinder. The choice of this coolant temperature value was arbitrary, but caution was taken such that the coolant temperature is warmer than homogeneous freezing threshold temperature (~−38 °C) and colder than ice crystal melting temperature. The diameter and length of the inner cylinder are 0.007 m and 0.68 m, respectively, and the inner cylinder carries the dry flow of ~1 LPM which limits the residence of particles to ~1.6 s. High precision humidity and temperature inline probe (E+E Elektronik; model: EE08-PFT1V11D6/T02) was intermittently used to confirm the cold and dry air conditions (−30 °C; RH = 0%) at the inlet port of the heat exchanger (or the output flow port of the PCVI). Simulations also show that the temperature (−30 °C) at the output flow port is insensitive to the input flow temperature conditions (Figure S5). This was performed because the PCVI input flow temperature conditions changes as the temperature of evaporation section of the chamber 1 vary (−26 to −34 °C; see below Section 3.2). Theoretical ice crystal sublimation calculations [44] confirmed that ice crystals of 6 µm in diameter (the maximum size of ice crystals from chamber 1) are completely sublimated under 1 s at −30 °C and dry RH = 0% conditions. This ensures ice phase was completely sublimated within the heat exchanger and only IRs are available for downstream UHSAS and chamber 2 measurements. However, as hypothesized previously [45] that ice may persist within the pores of the IRs. Additional drying of IRs that would occur within the long in-built diffusion drier permanently installed to the chamber 2 will melt any ice and evaporate the liquid water.
UHSAS measured the IRs concentration, and the OPC from chamber 2 measured the ice crystal concentration of IRs. The particle losses from the exit of the heat exchanger to the chamber 2 are typically ~2%, and this loss correction factor was applied to the UHSAS measurements. Next, the frozen fraction as per Equation (1) was calculated.
The experimental procedure to determine the frozen fraction was as follows. Experiment A was carried out at a defined temperature for ~15 min. Next, only filtered air was sampled for ~3 min to clear out any particles and hydrometeors. Immediately after, at the same temperature, experiment B was carried out for again ~15 min. Next, this experimental procedure was repeated at various temperatures, and the frozen fraction results (for experiment A and B) as a function of temperature were obtained. This experimental procedure was repeated again, and the second set of frozen fraction results were obtained. Finally, these two sets of frozen fraction results were averaged and analyzed to investigate immersion freezing behavior of total ambient aerosols and IRs.
2.3. Microscopy Analysis
The morphology and elemental analysis of the total aerosols were investigated using computer-controlled scanning electron microscopy (SEM) with energy dispersive X-ray analysis (EDS). The acceleration voltage and magnification used were 20 kV and 20,000×, respectively.
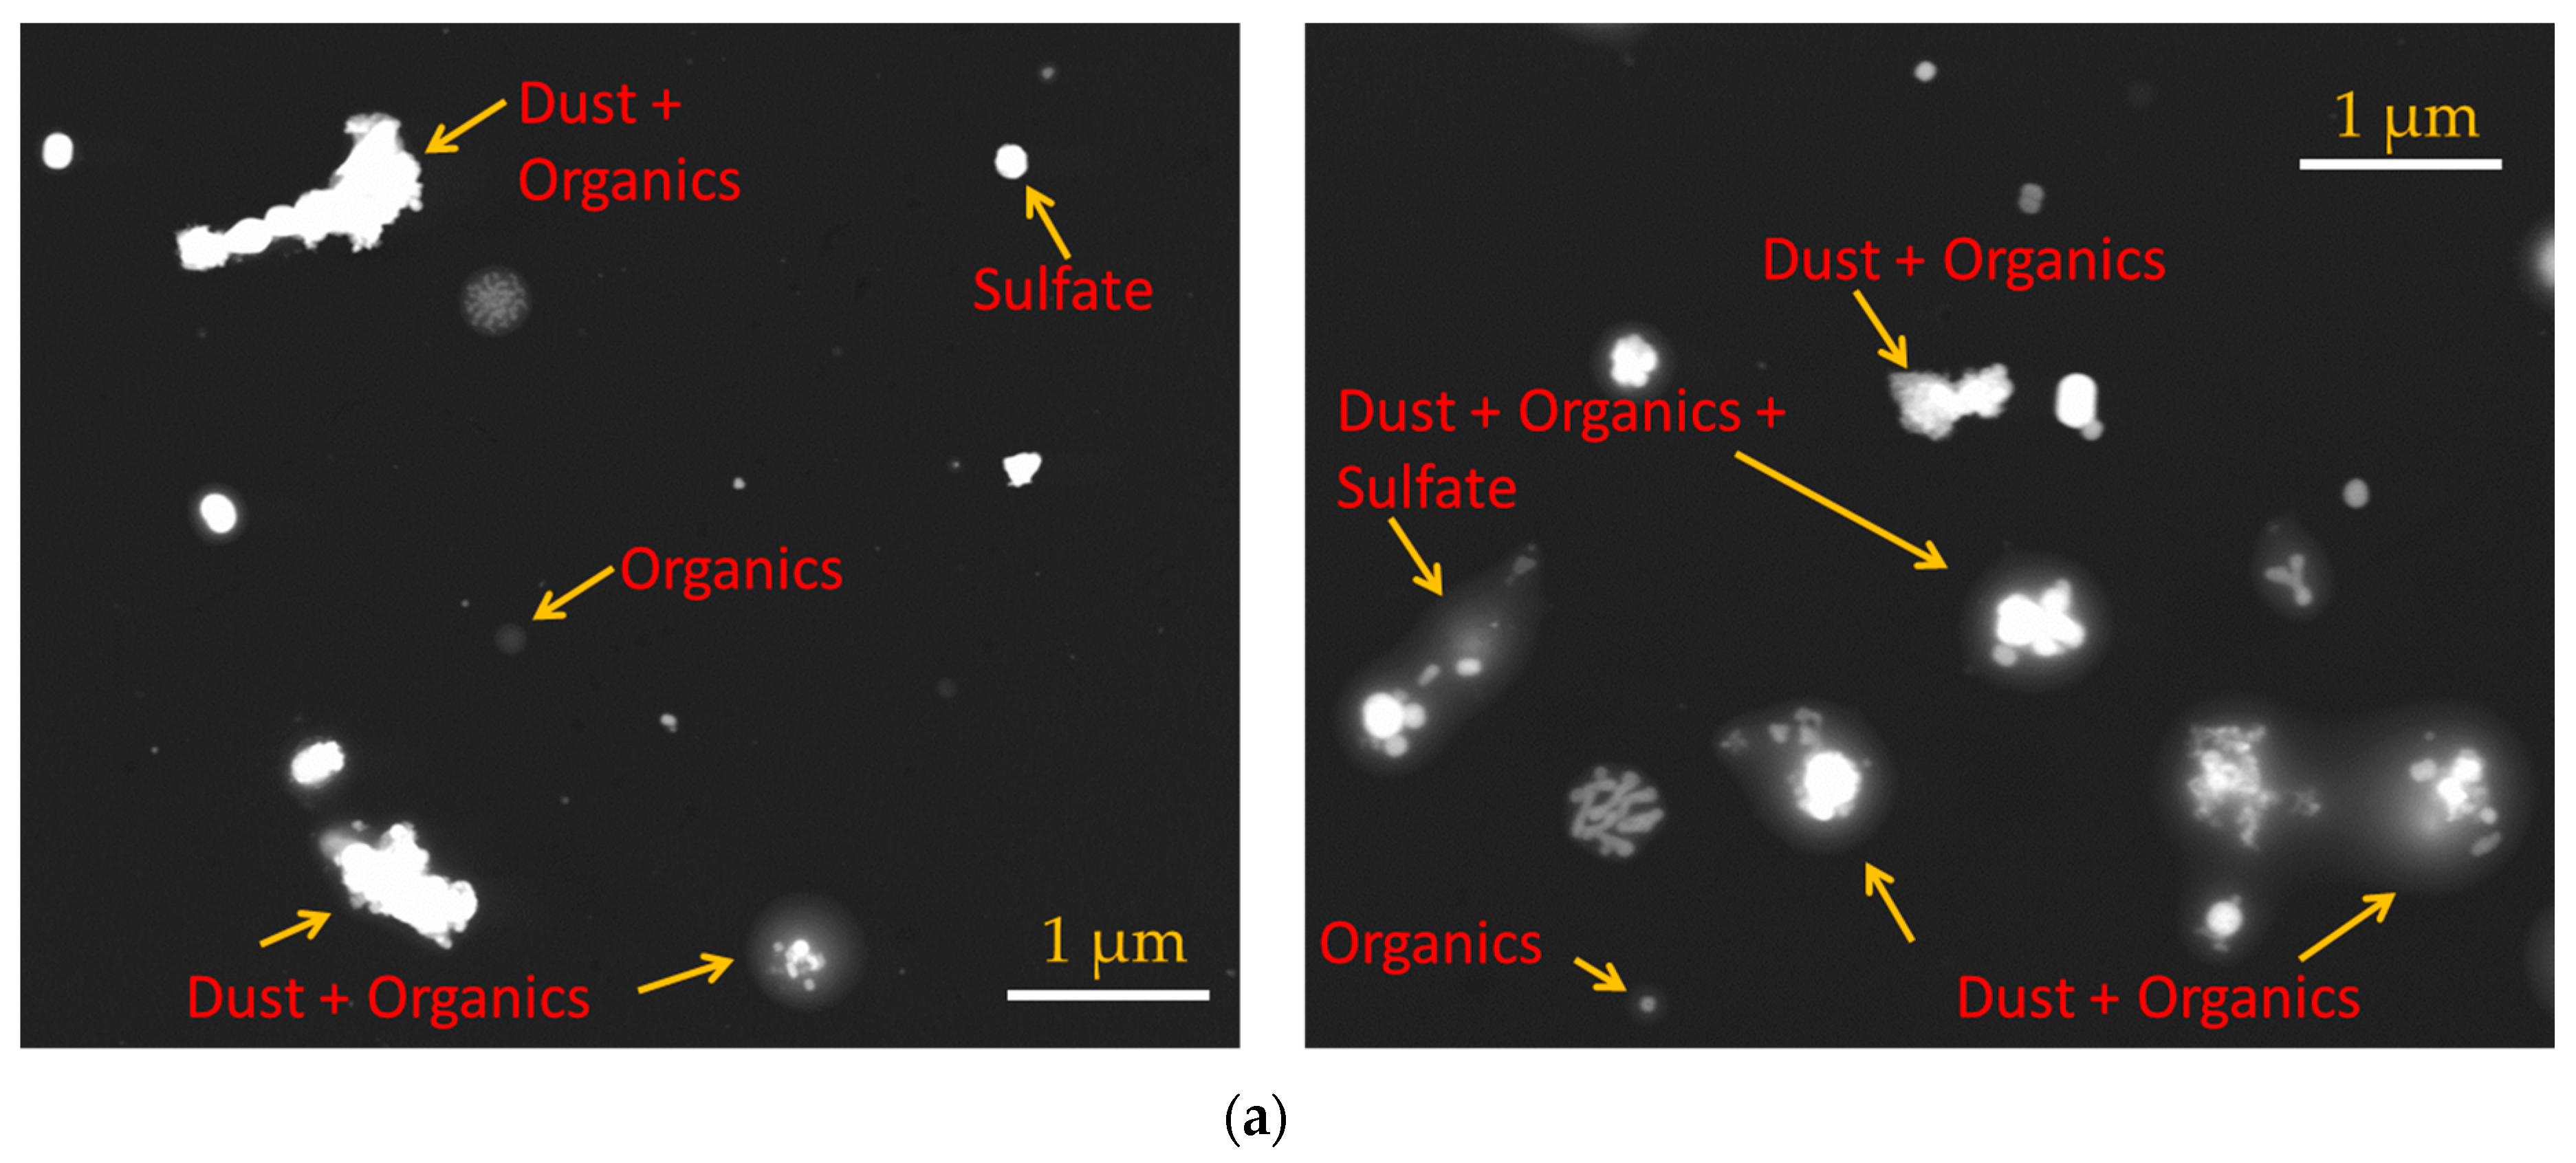
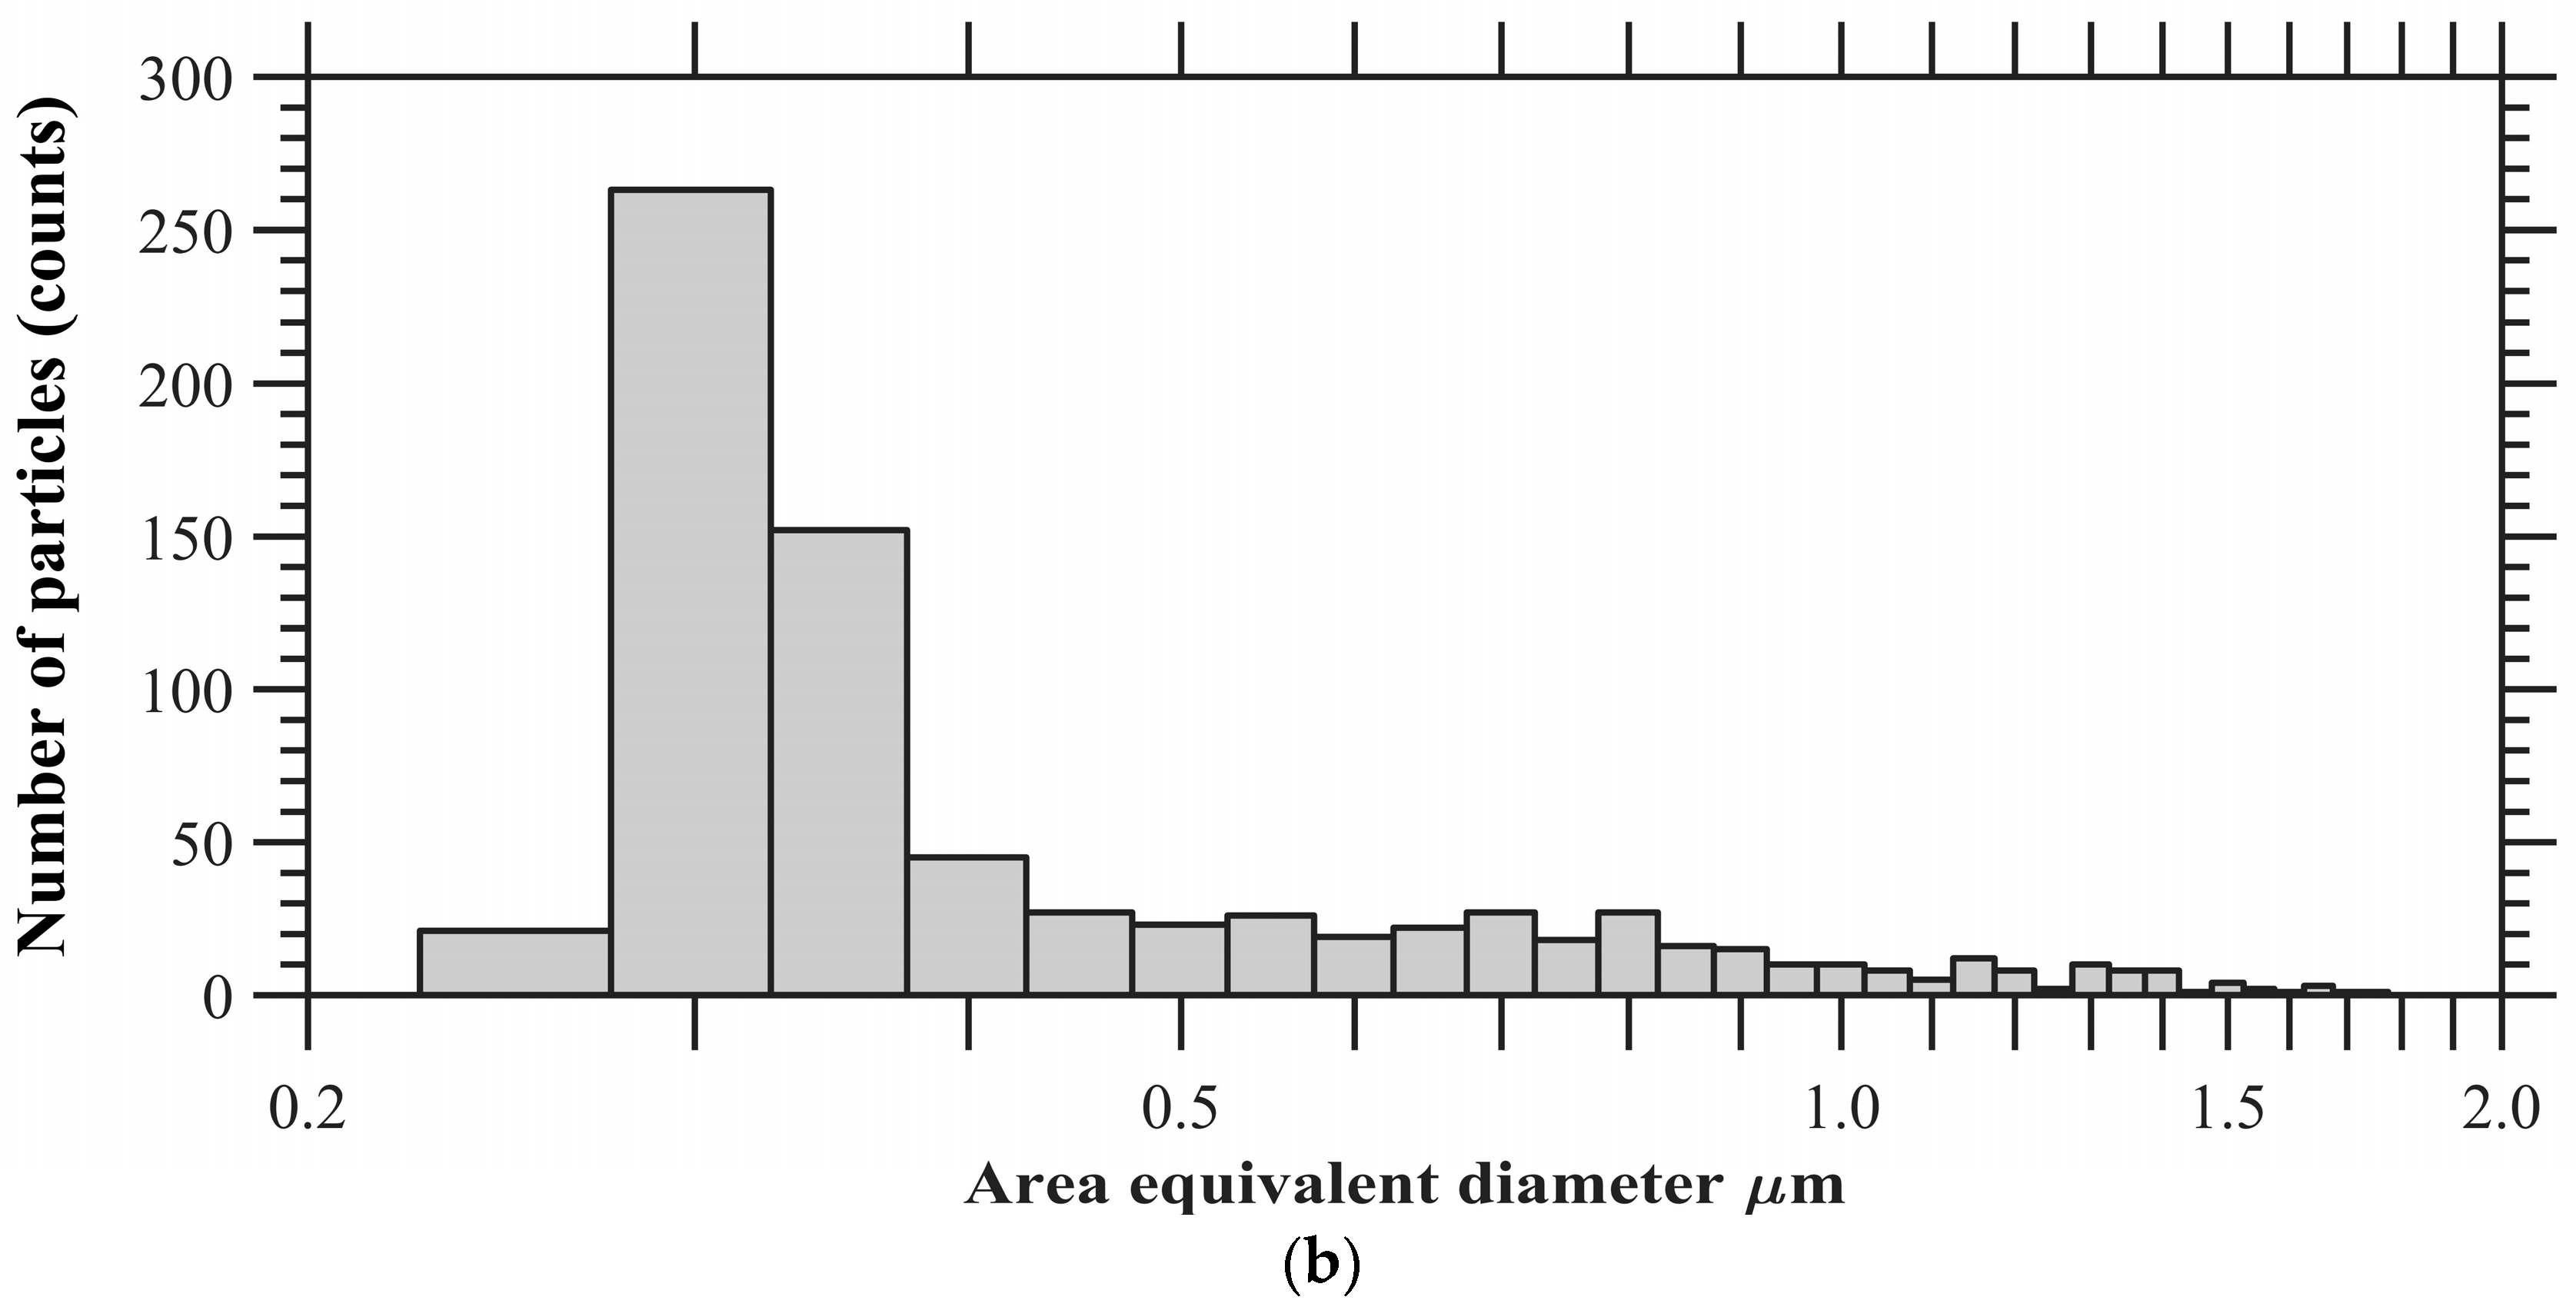
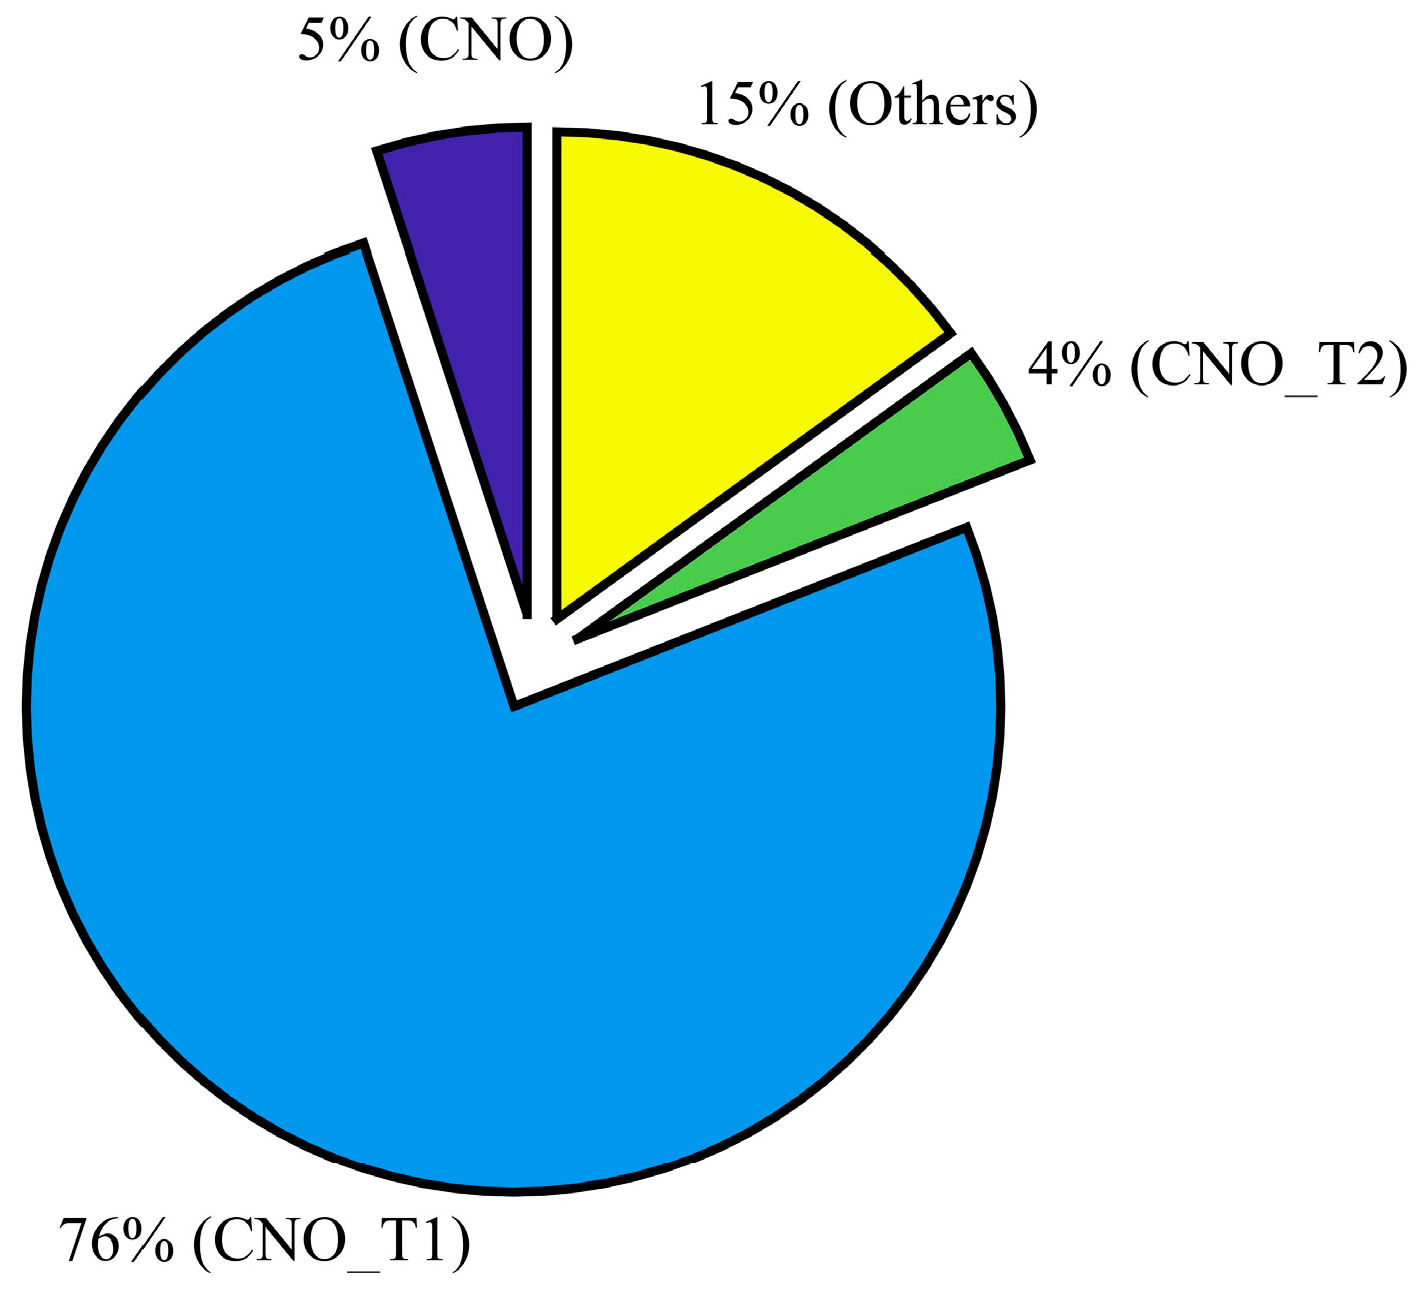
The particles were collected in parallel with ongoing ice nucleation experiments (Figure 1) on a carbon type-B support film (Ted Pella, Inc., Redding, CA, USA; 01814-F). Particles were not coated with electrically-conducting metals (e.g., gold, platinum) to enhance the image quality in this analysis. The mesh grid was located on the C- and D-stage of the SKC Sioutas impactor that had a 50% cutoff diameter of 0.5 and 1.0 μm, respectively. Figure 3a shows the example of SEM images of representative individual particles collected from the C-stage. Approximately 1000 randomly selected particles were used to determine the elemental composition of total aerosol particles, and this atomic wt % data was further analyzed to categorize the particles into various subgroups: CNO, CNO_T1, CNO_T2, and others using the classification scheme (Table 2) that was formulated to understand the general composition of particles in a semi-qualitative manner. Figure 3b shows the size distribution of these selected particles. The particle diameter is based on area equivalent diameter reported by the SEM-EDS instrument.
3. Results and Discussion
3.1. Total Ambient Aerosol Particle Characterization
SEM with the EDS technique provided the elemental composition of the total aerosol particles. The composition results revealed that minerals coated with organics dominated the total aerosol particle population (Figure 4). Pure organic particles were also identified. It was not possible to discern the type of organic substances that were condensed on mineral dust particles, but they could represent a multi-component solution of various organic molecules.
The organic particles that were condensed on the dust particles may have formed in the atmosphere by photochemical oxidation reactions of pre-cursor gas species (e.g., α-pinene, isoprene) [13,46,47,48] or these organics could be soil organic matter that was originally contained with the dust particles. Organic particles without any inorganic inclusions (possibly homogeneously nucleated) were also observed, which could have been emitted directly from the combustion, vegetation, and biomass burning sources.
3.2. INP Measurements
Figure 5 shows the frozen fraction of total ambient aerosols and IRs in the immersion freezing mode as a function of temperature (−26, −28, −30, −32 and −34 °C). In water-saturated conditions, it is assumed that particles are activated in a droplet prior to freezing. The vertical and horizontal error bars show the uncertainty in calculating the frozen fraction and the temperature measurements, respectively. In general, the results show that the magnitude of frozen fraction increased with decreasing temperature, which is in agreement with many previous immersion freezing studies (e.g., [49,50]). The results that verify the experiment B are also shown in Figure 5. It was observed that the frozen fraction of total aerosol and ice residuals was ~0.2 and nearly one, respectively. This shows that all the IRs from chamber 1 induced nucleation of ice in the chamber 2 and suggest that local surface features that were responsible for nucleation of water ice on these particles were unaffected after first ice nucleation event (chamber 1). Recently, Kiselev et al. (2016) [51] through a combination of experimental observations and molecular-level model simulations concluded that surface defects such as steps, cracks, and cavities are the ice nucleating active-site features of the K-feldspar particle surface. This implies such features may be responsible for ice nucleation on the surface of dust particles in the chamber 1, and they were also responsible for ice nucleation in the chamber 2. The ice crystal sublimation and residual drying processes in experiment B (Figure 1) seem do not affect the ice nucleating ability of these surface features. In addition, the size distribution of ice residuals was obtained by collecting residuals after the heat exchanger (Figures S6 and S7). As DMA does not classify monodispersed dust particles, larger (multiple-charged) particles were also transmitted in addition to the 250 nm size particles (Figure S7).
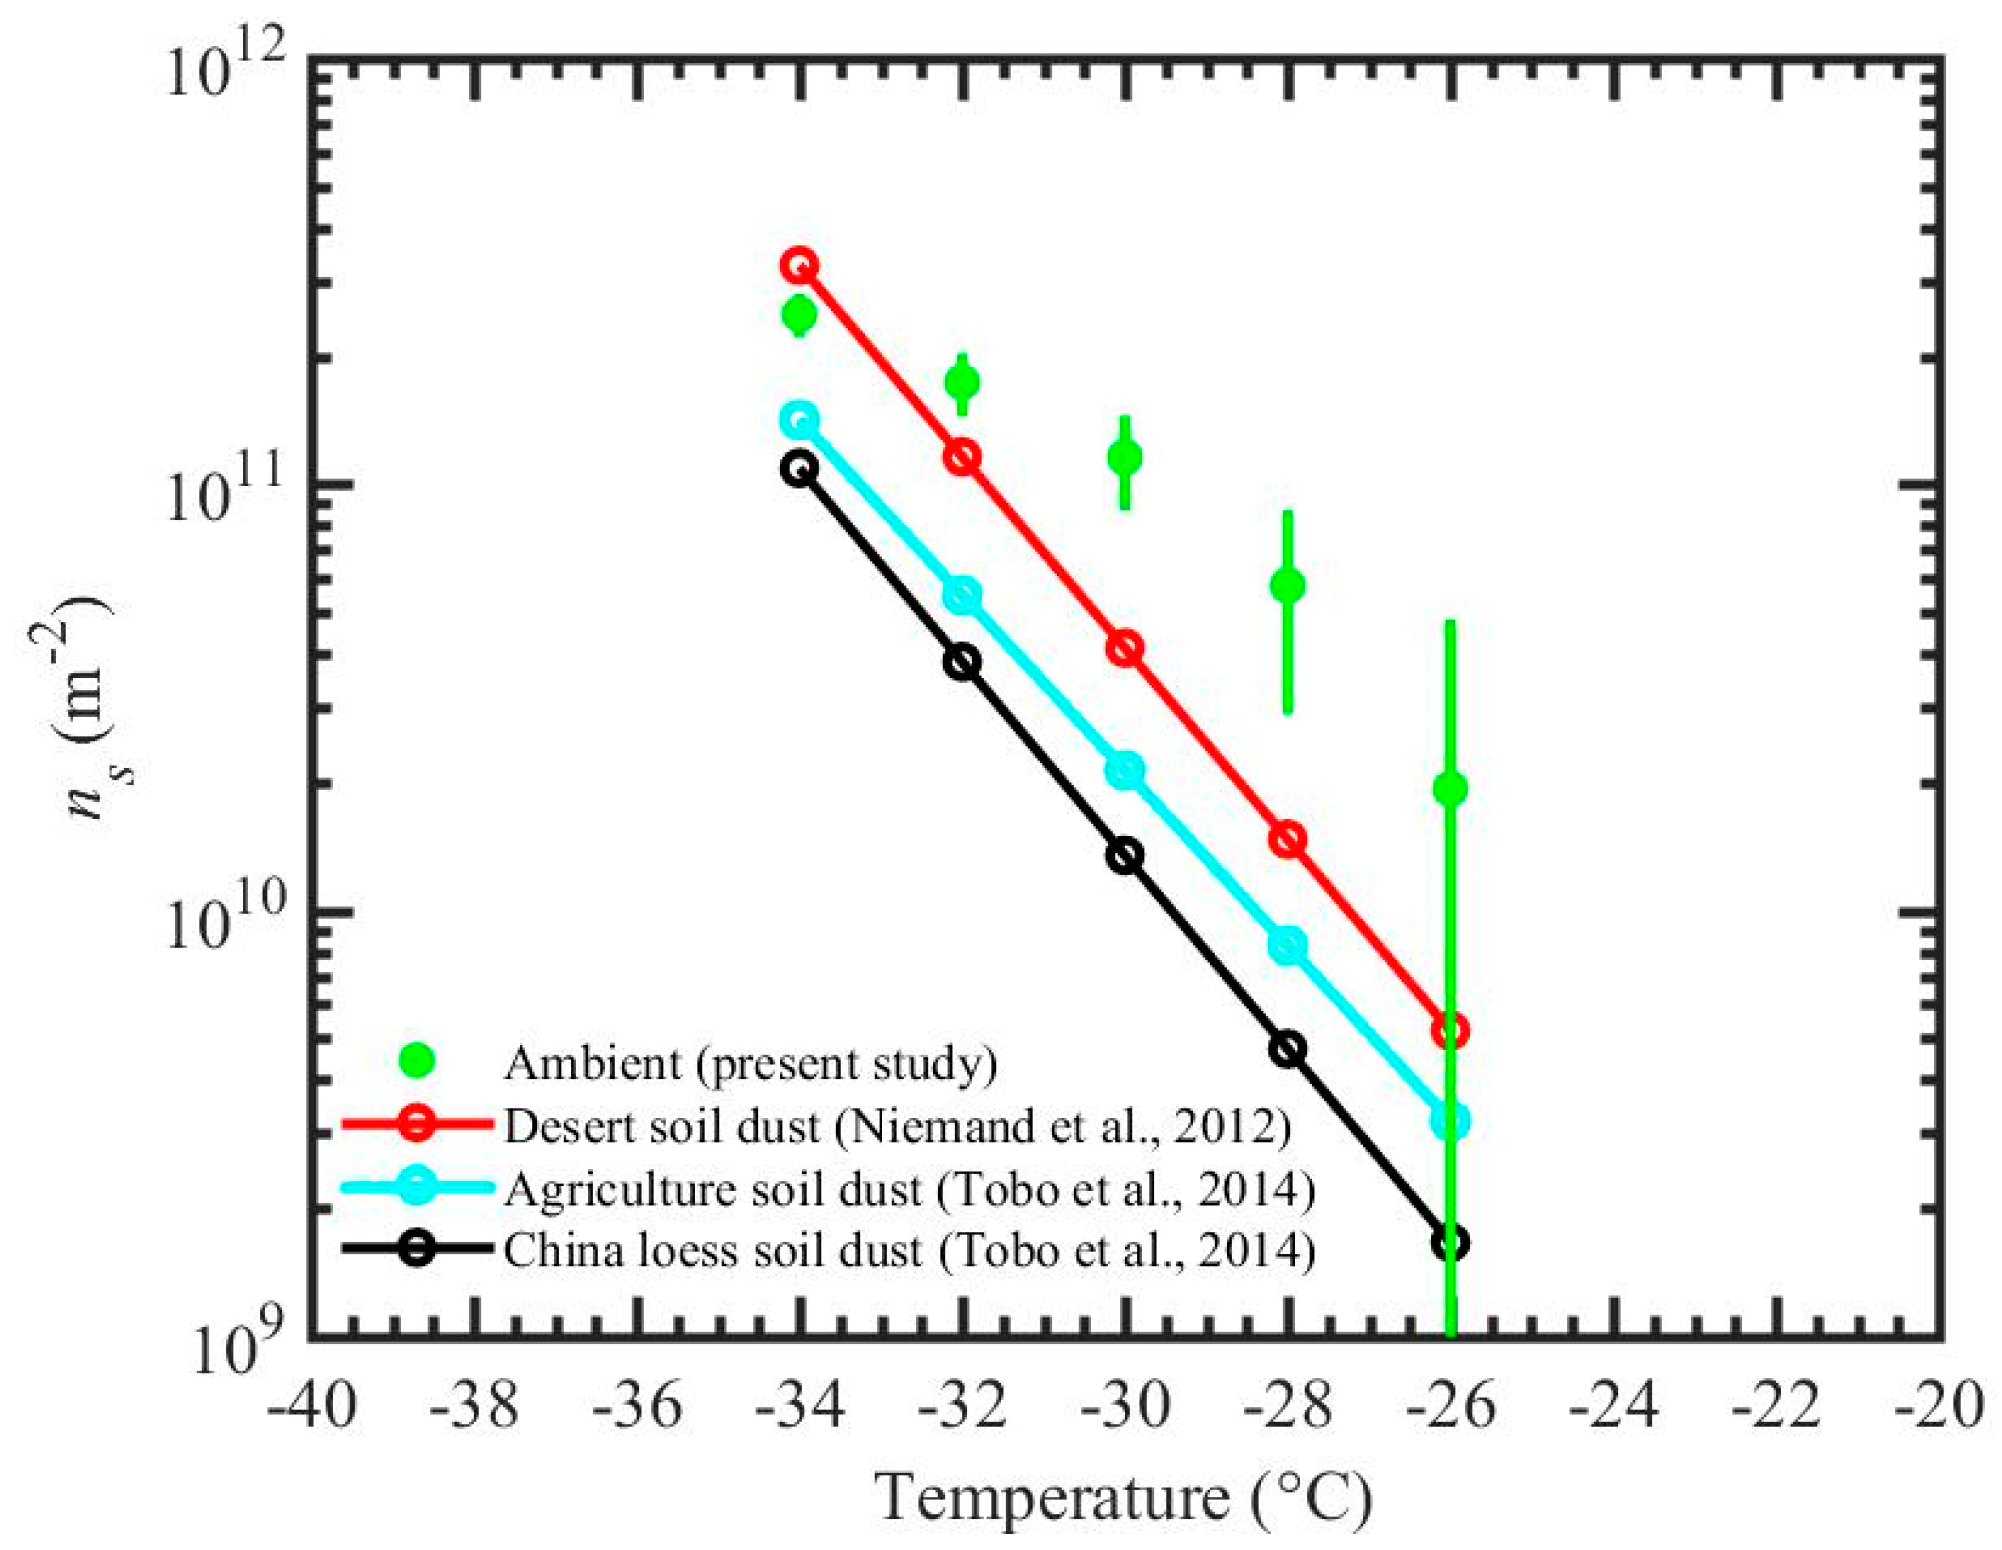
Results from experiment A are compared with the previous studies [52,53,54,55,56] by calculating ice nucleation active surface site density (ns), see Figure 6. The ns approach has been widely used in previous studies to compare the ice nucleation efficiency of aerosol particles. This approach does not take into account the time dependence of the nucleation events but does describe the number of ice nucleation actives sites at a defined temperature and humidity conditions normalized by the particle surface area. The SEM-EDS reported area equivalent diameter is assumed to equal to the diameter of the spherical particle, which is used for the surface area calculations. The sampling site is often dominated by the windblown dust particles (see Section 2.1 for more details), and therefore results are compared against ns values from natural deserts dusts reported by the previous studies [56,57]. ns calculations are performed using total surface area and total number of ice nucleating particles based on 12 s particle residence time and averaged over 15 min, Equation (2),
where “Areatotal” is the total surface area of ambient particles in all size bins (Figure 3b) that enter the chamber 1 for ~15 min, and Nice_total is the total number of ice particles detected by the OPC of the chamber 1 during these ~15 min. The measurement uncertainty of the ns density was determined by the error propagation through Nice_total and Areatotal uncertainties. Additionally, the ns densities are compared with the ns fits based on the various soil dust (Figure 6). Niemand et al. (2012) [56] used various soil dusts from various locations (desert from China and Egypt, soil samples from Canary Island and a dust storm in Israel, and commercially available Arizona Test Dust) to derive a fit. Tobo et al. (2014) [57] used surface agricultural soil dust collected from Wyoming, USA and loess soils collected from a dry area in China. The comparison (Figure 6) shows that present data is within an order of magnitude from the literature data. In general, these results indicate that INP efficiency of ambient particles (Section 3.1) is comparable with the previously reported INP efficiency of natural desert particles.
This study also suggests that dust particles coated with organic particles, which are observed within ~75% of the ambient particles (Figure 4) can nucleate ice (see experiment A results; Figure 5) at water saturation conditions, These findings are consistent with many previous studies which investigated the ice nucleation ability of pure and organic-coated particles [58,59,60,61]. For example, Tobo et al. (2012) [59] observed that at water-saturated conditions only sulfuric acid-coated kaolinite particles showed a reduction in ice nucleation efficiency and that the results were unaffected when these particles were coated with levoglucosan, a water-soluble organic compound. A similar conclusion was also derived from a later study by Wex et al. (2014) [60] who examined kaolinite particles coated with levoglucosan and succinic acid.
Results from experiment B also showed that IRs can induce ice nucleation obtained after sublimation. Similar to experiment A, immersion freezing efficiency of IRs increased with decreasing temperature. The results show that ~25% to 95% IRs induced nucleation of ice at temperatures varying from −26 to −34 °C. This also suggests that the frozen fraction values were not equal to one at temperatures warmer than −34 °C. This indicates some IRs do not induce ice nucleation and could be due to the stochastic nature of IRs that may have limited 100% nucleation of ice [62]. To understand the influence of stochastic freezing the upper limit for the heterogeneous ice nucleation rate coefficient () and maximum ice fraction () was calculated [63,64], see Equations (3) and (4), respectively,
where τ is the total observation time (15 min), Areatotal is the total surface area of ambient particles in all size bins (Figure 3b) that enter the chamber 1 for ~15 min, and x is the confidence level (99.9%). Next, based on , the that can be produced during particle residence time period within the chamber was calculated as follows,
where is the total surface area of particles in all size bins that was available for nucleation of ice over a particle residence time period () within the chamber. The was ~6 s. These calculations produced = 0.0003 or 0.03%, which is less than uncertainty in the frozen fraction (±0.1; see Section 2.2), and therefore stochastic freezing process did not influence the frozen fraction results reported in this study.
It is also possible that the composition and morphology of IRs could be different from total particles that induced nucleation of ice in the chamber 1. Previous studies support this premise; for example, DeMott et al. (2003) [35] showed that aerosol composition of a total ambient aerosol is different than IRs. Recently, Adler et al. (2014) [65] showed that morphology of organic coated particles can change due to phase separation after the freeze-drying process at low temperatures and suggested that such particles could modify the propensity of organic material towards ice nucleation. Future work needs to be carried out to investigate the morphological changes and physio-chemical properties of IRs to better understand the INP efficiency of IRs.
4. Conclusions
The objective of this study was to demonstrate a laboratory-based experimental method to study the immersion freezing properties of IRs. This objective is achieved by measuring the immersion freezing behavior of total ambient aerosol particles and IRs at a temperature ranging from −26 to −34 °C using the two ice nucleation chambers, a PCVI, and a heat exchanger. Total ambient aerosol particles of mostly <~1.5 μm in diameter were sampled from a site located in the Columbia Plateau region in WA, USA, where frequent windblown dust events are observed throughout the year. A UHSAS instrument confirmed that particle concentration remained nearly constant during the measurements. Chemical composition analysis revealed that total ambient aerosols are mostly mixtures containing dust and organic compounds. IRs were obtained by first separating the larger ice crystals using the PCVI and later sublimating them in a heat exchanger that was maintained at dry cold temperature conditions. Sublimation of ice phase was confirmed by performing theoretical ice sublimation calculations using experimental conditions (RH = 0% and −30 °C) and CFD simulations that confirmed RH = 0% conditions within the output flow port of the PCVI. Immersion freezing fractions of ambient aerosol and IRs were compared, and in general, the results indicate that the experimental setup can be utilized to study the INP properties of IRs. Future experiments are required to identify and characterize the physio-chemical properties and size distributions of IRs from chamber 1 and 2.
Supplementary Materials
The following are available online at https://www.mdpi.com/2073-4433/9/2/55/s1; Table S1 provides the droplet breakthrough limits. Figures S1–S9 shows the details of the experimental details including CFD simulation results. Figures S8 and S9 shows the images of the chamber 1 and 2.
Acknowledgments
I would like to thank three anonymous reviewers and editor for comments and discussions that further improved the quality of the manuscript. This work was partially supported by the Quickstarter 2016 program at the PNNL. The work was also supported by the Office of Science of the U.S. Department of Energy (DOE) as part of the Atmospheric System Research Program. The author would like to thank M. Petters and Y. Agalgaonkar for useful discussions. PNNL is operated by the U.S. DOE by the Battelle Memorial Institute under contract DEAC05-76RL0 1830.
Conflicts of Interest
Author declares no conflict of interest.
Abbreviations
The following abbreviations are used in this manuscript.
| SF | sheath flow |
| IF | input flow |
| PF | pump flow |
| C_in | coolant in |
| C_out | coolant out |
| OPC | optical particle counter |
| PCVI | pumped counterflow virtual impactor |
| CPC | condensation particle counter |
| CFD | computational fluid dynamics |
| VP | vacuum pump |
| RHi | relative humidity with respect to ice |
| RHw | relative humidity with respect to water |
| INP | ice-nucleating particle |
| LPM | liters per minute |
References
- Hoose, C.; Mohler, O. Heterogeneous ice nucleation on atmospheric aerosols: A review of results from laboratory experiments. Atmos. Chem. Phys. 2012, 12, 9817–9854. [Google Scholar] [CrossRef]
- Murray, B.J.; O’Sullivan, D.; Atkinson, J.D.; Webb, M.E. Ice nucleation by particles immersed in supercooled cloud droplets. Chem. Soc. Rev. 2012, 41, 6519–6554. [Google Scholar] [CrossRef] [PubMed]
- Alpert, P.A.; Aller, J.Y.; Knopf, D.A. Ice nucleation from aqueous NaCl droplets with and without marine diatoms. Atmos. Chem. Phys. 2011, 11, 5539–5555. [Google Scholar] [CrossRef] [Green Version]
- Baustian, K.J.; Wise, M.E.; Tolbert, M.A. Depositional ice nucleation on solid ammonium sulfate and glutaric acid particles. Atmos. Chem. Phys. 2010, 10, 2307–2317. [Google Scholar] [CrossRef]
- Boose, Y.; Sierau, B.; García, M.I.; Rodríguez, S.; Alastuey, A.; Linke, C.; Schnaiter, M.; Kupiszewski, P.; Kanji, Z.A.; Lohmann, U. Ice nucleating particles in the Saharan Air Layer. Atmos. Chem. Phys. 2016, 16, 9067–9087. [Google Scholar] [CrossRef]
- Cantrell, W.; Bunker, K.; Woodward, X.X. Ice Nucleation in the Contact Mode: Temperature and Size Dependence for Selected Dusts. AIP Conf. Proc. 2013, 1527, 926–929. [Google Scholar]
- Chou, C.; Stetzer, O.; Weingartner, E.; Jurányi, Z.; Kanji, Z.A.; Lohmann, U. Ice nuclei properties within a Saharan dust event at the Jungfraujoch in the Swiss Alps. Atmos. Chem. Phys. 2011, 11, 4725–4738. [Google Scholar] [CrossRef]
- Cziczo, D.J.; Stetzer, O.; Worringen, A.; Ebert, M.; Weinbruch, S.; Kamphus, M.; Gallavardin, S.J.; Curtius, J.; Borrmann, S.; Froyd, K.D.; et al. Inadvertent climate modification due to anthropogenic lead. Nat. Geosci. 2009, 2, 333–336. [Google Scholar] [CrossRef]
- DeMott, P.J.; Petters, M.D.; Prenni, A.J.; Carrico, C.M.; Kreidenweis, S.M.; Collett, J.L.; Moosmuller, H. Ice nucleation behavior of biomass combustion particles at cirrus temperatures. J. Geophys. Res. Atmos. 2009, 114. [Google Scholar] [CrossRef]
- DeMott, P.J.; Sassen, K.; Poellot, M.R.; Baumgardner, D.; Rogers, D.C.; Brooks, S.D.; Prenni, A.J.; Kreidenweis, S.M. African dust aerosols as atmospheric ice nuclei. Geophys. Res. Lett. 2003, 30. [Google Scholar] [CrossRef]
- Hiranuma, N.; Mohler, O.; Yamashita, K.; Tajiri, T.; Saito, A.; Kiselev, A.; Hoffmann, N.; Hoose, C.; Jantsch, E.; Koop, T.; et al. Ice nucleation by cellulose and its potential contribution to ice formation in clouds. Nat. Geosci. 2015, 8, 273–277. [Google Scholar] [CrossRef]
- Knopf, D.A.; Koop, T. Heterogeneous nucleation of ice on surrogates of mineral dust. J. Geophys. Res. Atmos. 2006, 111. [Google Scholar] [CrossRef]
- Prenni, A.J.; Petters, M.D.; Faulhaber, A.; Carrico, C.M.; Ziemann, P.J.; Kreidenweis, S.M.; DeMott, P.J. Heterogeneous ice nucleation measurements of secondary organic aerosol generated from ozonolysis of alkenes. Geophys. Res. Lett. 2009, 36. [Google Scholar] [CrossRef]
- Wang, B.B.; Laskin, A.; Roedel, T.; Gilles, M.K.; Moffet, R.C.; Tivanski, A.V.; Knopf, D.A. Heterogeneous ice nucleation and water uptake by field-collected atmospheric particles below 273 K. J. Geophys. Res. Atmos. 2012, 117. [Google Scholar] [CrossRef]
- Welti, A.; Luond, F.; Stetzer, O.; Lohmann, U. Influence of particle size on the ice nucleating ability of mineral dusts. Atmos. Chem. Phys. 2009, 9, 6705–6715. [Google Scholar] [CrossRef]
- DeMott, P.J.; Prenni, A.J.; Liu, X.; Kreidenweis, S.M.; Petters, M.D.; Twohy, C.H.; Richardson, M.S.; Eidhammer, T.; Rogers, D.C. Predicting global atmospheric ice nuclei distributions and their impacts on climate. Proc. Natl. Acad. Sci. USA 2010, 107, 11217–11222. [Google Scholar] [CrossRef] [PubMed]
- Eidhammer, T.; DeMott, P.J.; Kreidenweis, S.M. A comparison of heterogeneous ice nucleation parameterizations using a parcel model framework. J. Geophys. Res. Atmos. 2009, 114. [Google Scholar] [CrossRef]
- Fan, J.; Leung, L.R.; DeMott, P.J.; Comstock, J.M.; Singh, B.; Rosenfeld, D.; Tomlinson, J.M.; White, A.; Prather, K.A.; Minnis, P.; et al. Aerosol impacts on California winter clouds and precipitation during CalWater 2011: Local pollution versus long-range transported dust. Atmos. Chem. Phys. 2014, 14, 81–101. [Google Scholar] [CrossRef]
- Kulkarni, G.; Fan, J.; Comstock, J.M.; Liu, X.; Ovchinnikov, M. Laboratory measurements and model sensitivity studies of dust deposition ice nucleation. Atmos. Chem. Phys. 2012, 12, 7295–7308. [Google Scholar] [CrossRef] [Green Version]
- Seinfeld, J.H.; Bretherton, C.; Carslaw, K.S.; Coe, H.; DeMott, P.J.; Dunlea, E.J.; Feingold, G.; Ghan, S.; Guenther, A.B.; Kahn, R.; et al. Improving our fundamental understanding of the role of aerosol-cloud interactions in the climate system. Proc. Natl. Acad. Sci. USA 2016, 113, 5781–5790. [Google Scholar] [CrossRef] [PubMed]
- Verlinde, J.; Harrington, J.Y.; McFarquhar, G.M.; Yannuzzi, V.T.; Avramov, A.; Greenberg, S.; Johnson, N.; Zhang, G.; Poellot, M.R.; Mather, J.H.; et al. The mixed-phase Arctic cloud experiment. Bull. Am. Meteorol. Soc. 2007, 88, 205–221. [Google Scholar] [CrossRef]
- Fan, J.W.; Ovtchinnikov, M.; Comstock, J.M.; McFarlane, S.A.; Khain, A. Ice formation in Arctic mixed-phase clouds: Insights from a 3-D cloud-resolving model with size-resolved aerosol and cloud microphysics. J. Geophys. Res. Atmos. 2009, 114. [Google Scholar] [CrossRef]
- Solomon, A.; Feingold, G.; Shupe, M.D. The role of ice nuclei recycling in the maintenance of cloud ice in Arctic mixed-phase stratocumulus. Atmos. Chem. Phys. 2015, 15, 10631–10643. [Google Scholar] [CrossRef]
- China, S.; Kulkarni, G.; Scarnato, B.V.; Sharma, N.; Pekour, M.; Shilling, J.E.; Wilson, J.; Zelenyuk, A.; Chand, D.; Liu, S.; et al. Morphology of diesel soot residuals from supercooled water droplets and ice crystals: Implications for optical properties. Environ. Res. Lett. 2015, 10, 114010. [Google Scholar] [CrossRef]
- Cziczo, D.J.; Froyd, K.D.; Hoose, C.; Jensen, E.J.; Diao, M.H.; Zondlo, M.A.; Smith, J.B.; Twohy, C.H.; Murphy, D.M. Clarifying the Dominant Sources and Mechanisms of Cirrus Cloud Formation. Science 2013, 340, 1320–1324. [Google Scholar] [CrossRef] [PubMed]
- Cziczo, D.J.; Murphy, D.M.; Hudson, P.K.; Thomson, D.S. Single particle measurements of the chemical composition of cirrus ice residue during CRYSTAL-FACE. J. Geophys. Res. Atmos. 2004, 109. [Google Scholar] [CrossRef]
- Froyd, K.D.; Cziczo, D.J.; Hoose, C.; Jensen, E.J.; Diao, M.H.; Zondlo, M.A.; Smith, J.B.; Twohy, C.H.; Murphy, D.M. Cirrus Cloud Formation and the Role of Heterogeneous Ice Nuclei. AIP Conf. Proc. 2013, 1527, 976–978. [Google Scholar]
- Hiranuma, N.; Mohler, O.; Kulkarni, G.; Schnaiter, M.; Vogt, S.; Vochezer, P.; Jarvinen, E.; Wagner, R.; Bell, D.M.; Wilson, J.; et al. Development and characterization of an ice-selecting pumped counterflow virtual impactor (IS-PCVI) to study ice crystal residuals. Atmos. Meas. Tech. 2016, 9, 3817–3836. [Google Scholar] [CrossRef]
- Kupiszewski, P.; Weingartner, E.; Vochezer, P.; Schnaiter, M.; Bigi, A.; Gysel, M.; Rosati, B.; Toprak, E.; Mertes, S.; Baltensperger, U. The Ice Selective Inlet: A novel technique for exclusive extraction of pristine ice crystals in mixed-phase clouds. Atmos. Meas. Tech. 2015, 8, 3087–3106. [Google Scholar] [CrossRef] [Green Version]
- Mertes, S.; Verheggen, B.; Walter, S.; Connolly, P.; Ebert, M.; Schneider, J.; Bower, K.N.; Cozic, J.; Weinbruch, S.; Baltensperger, U.; et al. Counterflow virtual impact or based collection of small ice particles in mixed-phase clouds for the physico-chemical characterization of tropospheric ice nuclei: Sampler description and first case study. Aerosol Sci. Technol. 2007, 41, 848–864. [Google Scholar] [CrossRef]
- Targino, A.C.; Krejci, R.; Noone, K.J.; Glantz, P. Single particle analysis of ice crystal residuals observed in orographic wave clouds over Scandinavia during INTACC experiment. Atmos. Chem. Phys. 2006, 6, 1977–1990. [Google Scholar] [CrossRef]
- Twohy, C.H.; Poellot, M.R. Chemical characteristics of ice residual nuclei in anvil cirrus clouds: Evidence for homogeneous and heterogeneous ice formation. Atmos. Chem. Phys. 2005, 5, 2289–2297. [Google Scholar] [CrossRef]
- Worringen, A.; Kandler, K.; Benker, N.; Dirsch, T.; Mertes, S.; Schenk, L.; Kastner, U.; Frank, F.; Nillius, B.; Bundke, U.; et al. Single-particle characterization of ice-nucleating particles and ice particle residuals sampled by three different techniques. Atmos. Chem. Phys. 2015, 15, 4161–4178. [Google Scholar] [CrossRef] [Green Version]
- Pratt, K.A.; DeMott, P.J.; Twohy, C.H.; Prather, K.A. Insights into cloud ice nucleation from real-time, single-particle aircraft-based measurements of ice crystal residues. In Proceedings of the 242nd American Chemical Society National Meeting, Denver, CO, USA, 28 August–1 September 2011; Volume 242. [Google Scholar]
- DeMott, P.J.; Cziczo, D.J.; Prenni, A.J.; Murphy, D.M.; Kreidenweis, S.M.; Thomson, D.S.; Borys, R.; Rogers, D.C. Measurements of the concentration and composition of nuclei for cirrus formation. Proc. Natl. Acad. Sci. USA 2003, 100, 14655–14660. [Google Scholar] [CrossRef] [PubMed]
- Prenni, A.J.; DeMott, P.J.; Twohy, C.; Poellot, M.R.; Kreidenweis, S.M.; Rogers, D.C.; Brooks, S.D.; Richardson, M.S.; Heymsfield, A.J. Examinations of ice formation processes in Florida cumuli using ice nuclei measurements of anvil ice crystal particle residues. J. Geophys. Res. Atmos. 2007, 112. [Google Scholar] [CrossRef]
- Kulkarni, G.; Pekour, M.; Afchine, A.; Murphy, D.M.; Cziczo, D.J. Comparison of Experimental and Numerical Studies of the Performance Characteristics of a Pumped Counterflow Virtual Impactor. Aerosol Sci. Technol. 2011, 45, 382–392. [Google Scholar] [CrossRef]
- Boulter, J.E.; Cziczo, D.J.; Middlebrook, A.M.; Thomson, D.S.; Murphy, D.M. Design and performance of a pumped counterflow virtual impactor. Aerosol Sci. Technol. 2006, 40, 969–976. [Google Scholar] [CrossRef]
- Friedman, B.; Kulkarni, G.; Beranek, J.; Zelenyuk, A.; Thornton, J.A.; Cziczo, D.J. Ice nucleation and droplet formation by bare and coated soot particles. J. Geophys. Res. Atmos. 2011, 116. [Google Scholar] [CrossRef]
- Stetzer, O.; Baschek, B.; Luond, F.; Lohmann, U. The Zurich Ice Nucleation Chamber (ZINC)—A new instrument to investigate atmospheric ice formation. Aerosol Sci. Technol. 2008, 42, 64–74. [Google Scholar] [CrossRef]
- Murphy, D.M.; Koop, T. Review of the vapour pressures of ice and supercooled water for atmospheric applications. Quart. J. R. Meteorol. Soc. 2005, 131, 1539–1565. [Google Scholar] [CrossRef]
- Pekour, M.S.; Cziczo, D.J. Wake Capture, Particle Breakup, and Other Artifacts Associated with Counterflow Virtual Impaction. Aerosol Sci. Technol. 2011, 45, 758–764. [Google Scholar] [CrossRef] [Green Version]
- Baustian, K.J.; Cziczo, D.J.; Wise, M.E.; Pratt, K.A.; Kulkarni, G.; Hallar, A.G.; Tolbert, M.A. Importance of aerosol composition, mixing state, and morphology for heterogeneous ice nucleation: A combined field and laboratory approach. J. Geophys. Res. Atmos. 2012, 117. [Google Scholar] [CrossRef]
- Curry, J.A.; Webster, P.J. Thermodynamics of Atmospheres and Oceans; Holton, J.R., Ed.; Academic Press: Cambridge, MA, USA, 1999; Volume 65, pp. 129–159. [Google Scholar]
- Marcolli, C. Pre-activation of aerosol particles by ice preserved in pores. Atmos. Chem. Phys. 2017, 17, 1596–1623. [Google Scholar] [CrossRef]
- Ignatius, K.; Kristensen, T.B.; Jarvinen, E.; Nichman, L.; Fuchs, C.; Gordon, H.; Herenz, P.; Hoyle, C.R.; Duplissy, J.; Garimella, S.; et al. Heterogeneous ice nucleation of viscous secondary organic aerosol produced from ozonolysis of α-pinene. Atmos. Chem. Phys. 2016, 16, 6495–6509. [Google Scholar] [CrossRef]
- Jarvinen, E.; Ignatius, K.; Nichman, L.; Kristensen, T.B.; Fuchs, C.; Hoyle, C.R.; Hoppel, N.; Corbin, J.C.; Craven, J.; Duplissy, J.; et al. Observation of viscosity transition in α-pinene secondary organic aerosol. Atmos. Chem. Phys. 2016, 16, 4423–4438. [Google Scholar] [CrossRef]
- Price, H.C.; Mattsson, J.; Zhang, Y.; Bertram, A.K.; Davies, J.F.; Grayson, J.W.; Martin, S.T.; O'Sullivan, D.; Reid, J.P.; Rickards, A.M.J.; et al. Water diffusion in atmospherically relevant α-pinene secondary organic material. Chem. Sci. 2015, 6, 4876–4883. [Google Scholar] [CrossRef] [PubMed]
- Kanji, Z.A.; Welti, A.; Chou, C.; Stetzer, O.; Lohmann, U. Laboratory studies of immersion and deposition mode ice nucleation of ozone aged mineral dust particles. Atmos. Chem. Phys. 2013, 13, 9097–9118. [Google Scholar] [CrossRef]
- Kohn, M.; Lohmann, U.; Welti, A.; Kanji, Z.A. Immersion mode ice nucleation measurements with the new Portable Immersion Mode Cooling chAmber (PIMCA). J. Geophys. Res. Atmos. 2016, 121, 4713–4733. [Google Scholar] [CrossRef]
- Kiselev, A.; Bachmann, F.; Pedevilla, P.; Cox, S.J.; Michaelides, A.; Gerthsen, D.; Leisner, T. Active sites in heterogeneous ice nucleation-the example of K-rich feldspars. Science 2017, 355, 367–371. [Google Scholar] [CrossRef] [PubMed]
- Connolly, P.J.; Mohler, O.; Field, P.R.; Saathoff, H.; Burgess, R.; Choularton, T.; Gallagher, M. Studies of heterogeneous freezing by three different desert dust samples. Atmos. Chem. Phys. 2009, 9, 2805–2824. [Google Scholar] [CrossRef]
- DeMott, P.J.; Mohler, O.; Stetzer, O.; Vali, G.; Levin, Z.; Petters, M.D.; Murakami, M.; Leisner, T.; Bundke, U.; Klein, H.; et al. Resurgence in Ice Nuclei Measurement Research. Bull. Am. Meteorol. Soc. 2011, 92. [Google Scholar] [CrossRef]
- Kanji, Z.A.; DeMott, P.J.; Mohler, O.; Abbatt, J.P.D. Results from the University of Toronto continuous flow diffusion chamber at ICIS 2007: Instrument intercomparison and ice onsets for different aerosol types. Atmos. Chem. Phys. 2011, 11, 31–41. [Google Scholar] [CrossRef]
- Koehler, K.A.; Kreidenweis, S.M.; DeMott, P.J.; Petters, M.D.; Prenni, A.J.; Mohler, O. Laboratory investigations of the impact of mineral dust aerosol on cold cloud formation. Atmos. Chem. Phys. 2010, 10, 11955–11968. [Google Scholar] [CrossRef] [Green Version]
- Niemand, M.; Mohler, O.; Vogel, B.; Vogel, H.; Hoose, C.; Connolly, P.; Klein, H.; Bingemer, H.; DeMott, P.; Skrotzki, J.; et al. A Particle-Surface-Area-Based Parameterization of Immersion Freezing on Desert Dust Particles. J. Atmos. Sci. 2012, 69, 3077–3092. [Google Scholar] [CrossRef]
- Tobo, Y.; DeMott, P.J.; Hill, T.C.J.; Prenni, A.J.; Swoboda-Colberg, N.G.; Franc, G.D.; Kreidenweis, S.M. Organic matter matters for ice nuclei of agricultural soil origin. Atmos. Chem. Phys. 2014, 14, 8521–8531. [Google Scholar] [CrossRef]
- Niedermeier, D.; Hartmann, S.; Clauss, T.; Wex, H.; Kiselev, A.; Sullivan, R.C.; DeMott, P.J.; Petters, M.D.; Reitz, P.; Schneider, J.; et al. Experimental study of the role of physicochemical surface processing on the IN ability of mineral dust particles. Atmos. Chem. Phys. 2011, 11, 11131–11144. [Google Scholar] [CrossRef] [Green Version]
- Tobo, Y.; DeMott, P.J.; Raddatz, M.; Niedermeier, D.; Hartmann, S.; Kreidenweis, S.M.; Stratmann, F.; Wex, H. Impacts of chemical reactivity on ice nucleation of kaolinite particles: A case study of levoglucosan and sulfuric acid. Geophys. Res. Lett. 2012, 39. [Google Scholar] [CrossRef]
- Wex, H.; DeMott, P.J.; Tobo, Y.; Hartmann, S.; Rosch, M.; Clauss, T.; Tomsche, L.; Niedermeier, D.; Stratmann, F. Kaolinite particles as ice nuclei: Learning from the use of different kaolinite samples and different coatings. Atmos. Chem. Phys. 2014, 14, 5529–5546. [Google Scholar] [CrossRef]
- China, S.; Alpert, P.A.; Zhang, B.; Schum, S.; Dzepina, K.; Wright, K.; Owen, R.C.; Fialho, P.; Mazzoleni, L.R.; Mazzoleni, C.; et al. Ice cloud formation potential by free tropospheric particles from long-range transport over the Northern Atlantic Ocean. J. Geophys. Res. Atmos. 2017, 122, 3065–3079. [Google Scholar] [CrossRef]
- Pruppacher, H.R.; Klett, J.D.; Wang, P.K. Microphysics of Clouds and Precipitation; Springer Publications: New York, NY, USA, 1998; Volume 8, pp. 381–382. [Google Scholar]
- Koop, T.; Luo, B.P.; Biermann, U.M.; Crutzen, P.J.; Peter, T. Freezing of HNO3/H2SO4/H2O solutions at stratospheric temperatures: Nucleation statistics and experiments. J. Phys. Chem. A 1997, 101, 1117–1133. [Google Scholar] [CrossRef]
- Dymarska, M.; Murray, B.J.; Sun, L.M.; Eastwood, M.L.; Knopf, D.A.; Bertram, A.K. Deposition ice nucleation on soot at temperatures relevant for the lower troposphere. J. Geophys. Res. Atmos. 2006, 111. [Google Scholar] [CrossRef]
- Adler, G.; Koop, T.; Haspel, C.; Taraniuk, I.; Moise, T.; Koren, I.; Heiblum, R.H.; Rudich, Y. Formation of highly porous aerosol particles by atmospheric freeze-drying in ice clouds. Proc. Natl. Acad. Sci. USA 2013, 110, 20414–20419. [Google Scholar] [CrossRef] [PubMed]
Figure 1.
Experimental setup to investigate the ice nucleation ability of ambient aerosols. A and B show the experimental setup to determine the frozen fraction in immersion mode of only total aerosols and IRs, respectively. In experiment (A,B), a CPC was used to monitor ambient particle concentration. Dashed lines indicate the thermal insulation to prevent warming of the set up above ice melting temperature. The heat exchanger was thermally insulated and kept at a constant temperature (−30 °C) using a liquid circulating bath. See text for more details. SF: sheath flow; IF: input flow; PF: pump flow; C_in: coolant in; C_out: coolant out; OPC: optical particle counter; UHSAS: ultra-high sensitivity aerosol spectrometer; PCVI: pumped counterflow virtual impactor; CPC: condensation particle counter; VP: vacuum pump. PCVI flows were: inlet flow = 10.0 LPM; IF = 2.8 LPM; PF = 11.8 LPM; and output flow was 1.0 LPM.

Figure 2.
Modelled pathlines colored by RH within the PCVI indicating output flow that carries separated large ice crystals is dry (RH = 0%). The input flow (10 LPM) is the exit flow from the chamber 1. Add flow (2.8 LPM; RH = 0%; −30 °C) is divided into counterflow (not shown) and output flow (1 LPM) that joins as an inlet flow for the heat exchanger unit. The velocity vectors again colored by RH are shown in Figure S2. Labels A and B shows the location within the PCVI where input flow begins to increase and the first stagnation plane is observed, respectively. The RH and velocity magnitudes corresponding to these two locations are shown in Figure S3. The RH corresponds to RHw.

Figure 3.
(a) SEM images showing various morphology and mixing state of total aerosol particles. (b) Size distribution of ambient particles. The particle diameter is based on area equivalent diameter reported by the SEM-EDS instrument.
Figure 3.
(a) SEM images showing various morphology and mixing state of total aerosol particles. (b) Size distribution of ambient particles. The particle diameter is based on area equivalent diameter reported by the SEM-EDS instrument.


Figure 4.
The chemical composition of total aerosol collected from the C-stage of the Sioutus impactor based on number fraction. EDS analysis was based on ~1000 particles. The various subdivisions of composition were characterized based on atomic weight percent intensity of various elements. See Table 2 for more details.

Figure 5.
The corrected frozen fraction of total ambient aerosol particles in cyan and IRs in green obtained from the CFDC experiments. The frozen fraction of K-feldspar and illite particles are also shown.
Figure 5.
The corrected frozen fraction of total ambient aerosol particles in cyan and IRs in green obtained from the CFDC experiments. The frozen fraction of K-feldspar and illite particles are also shown.
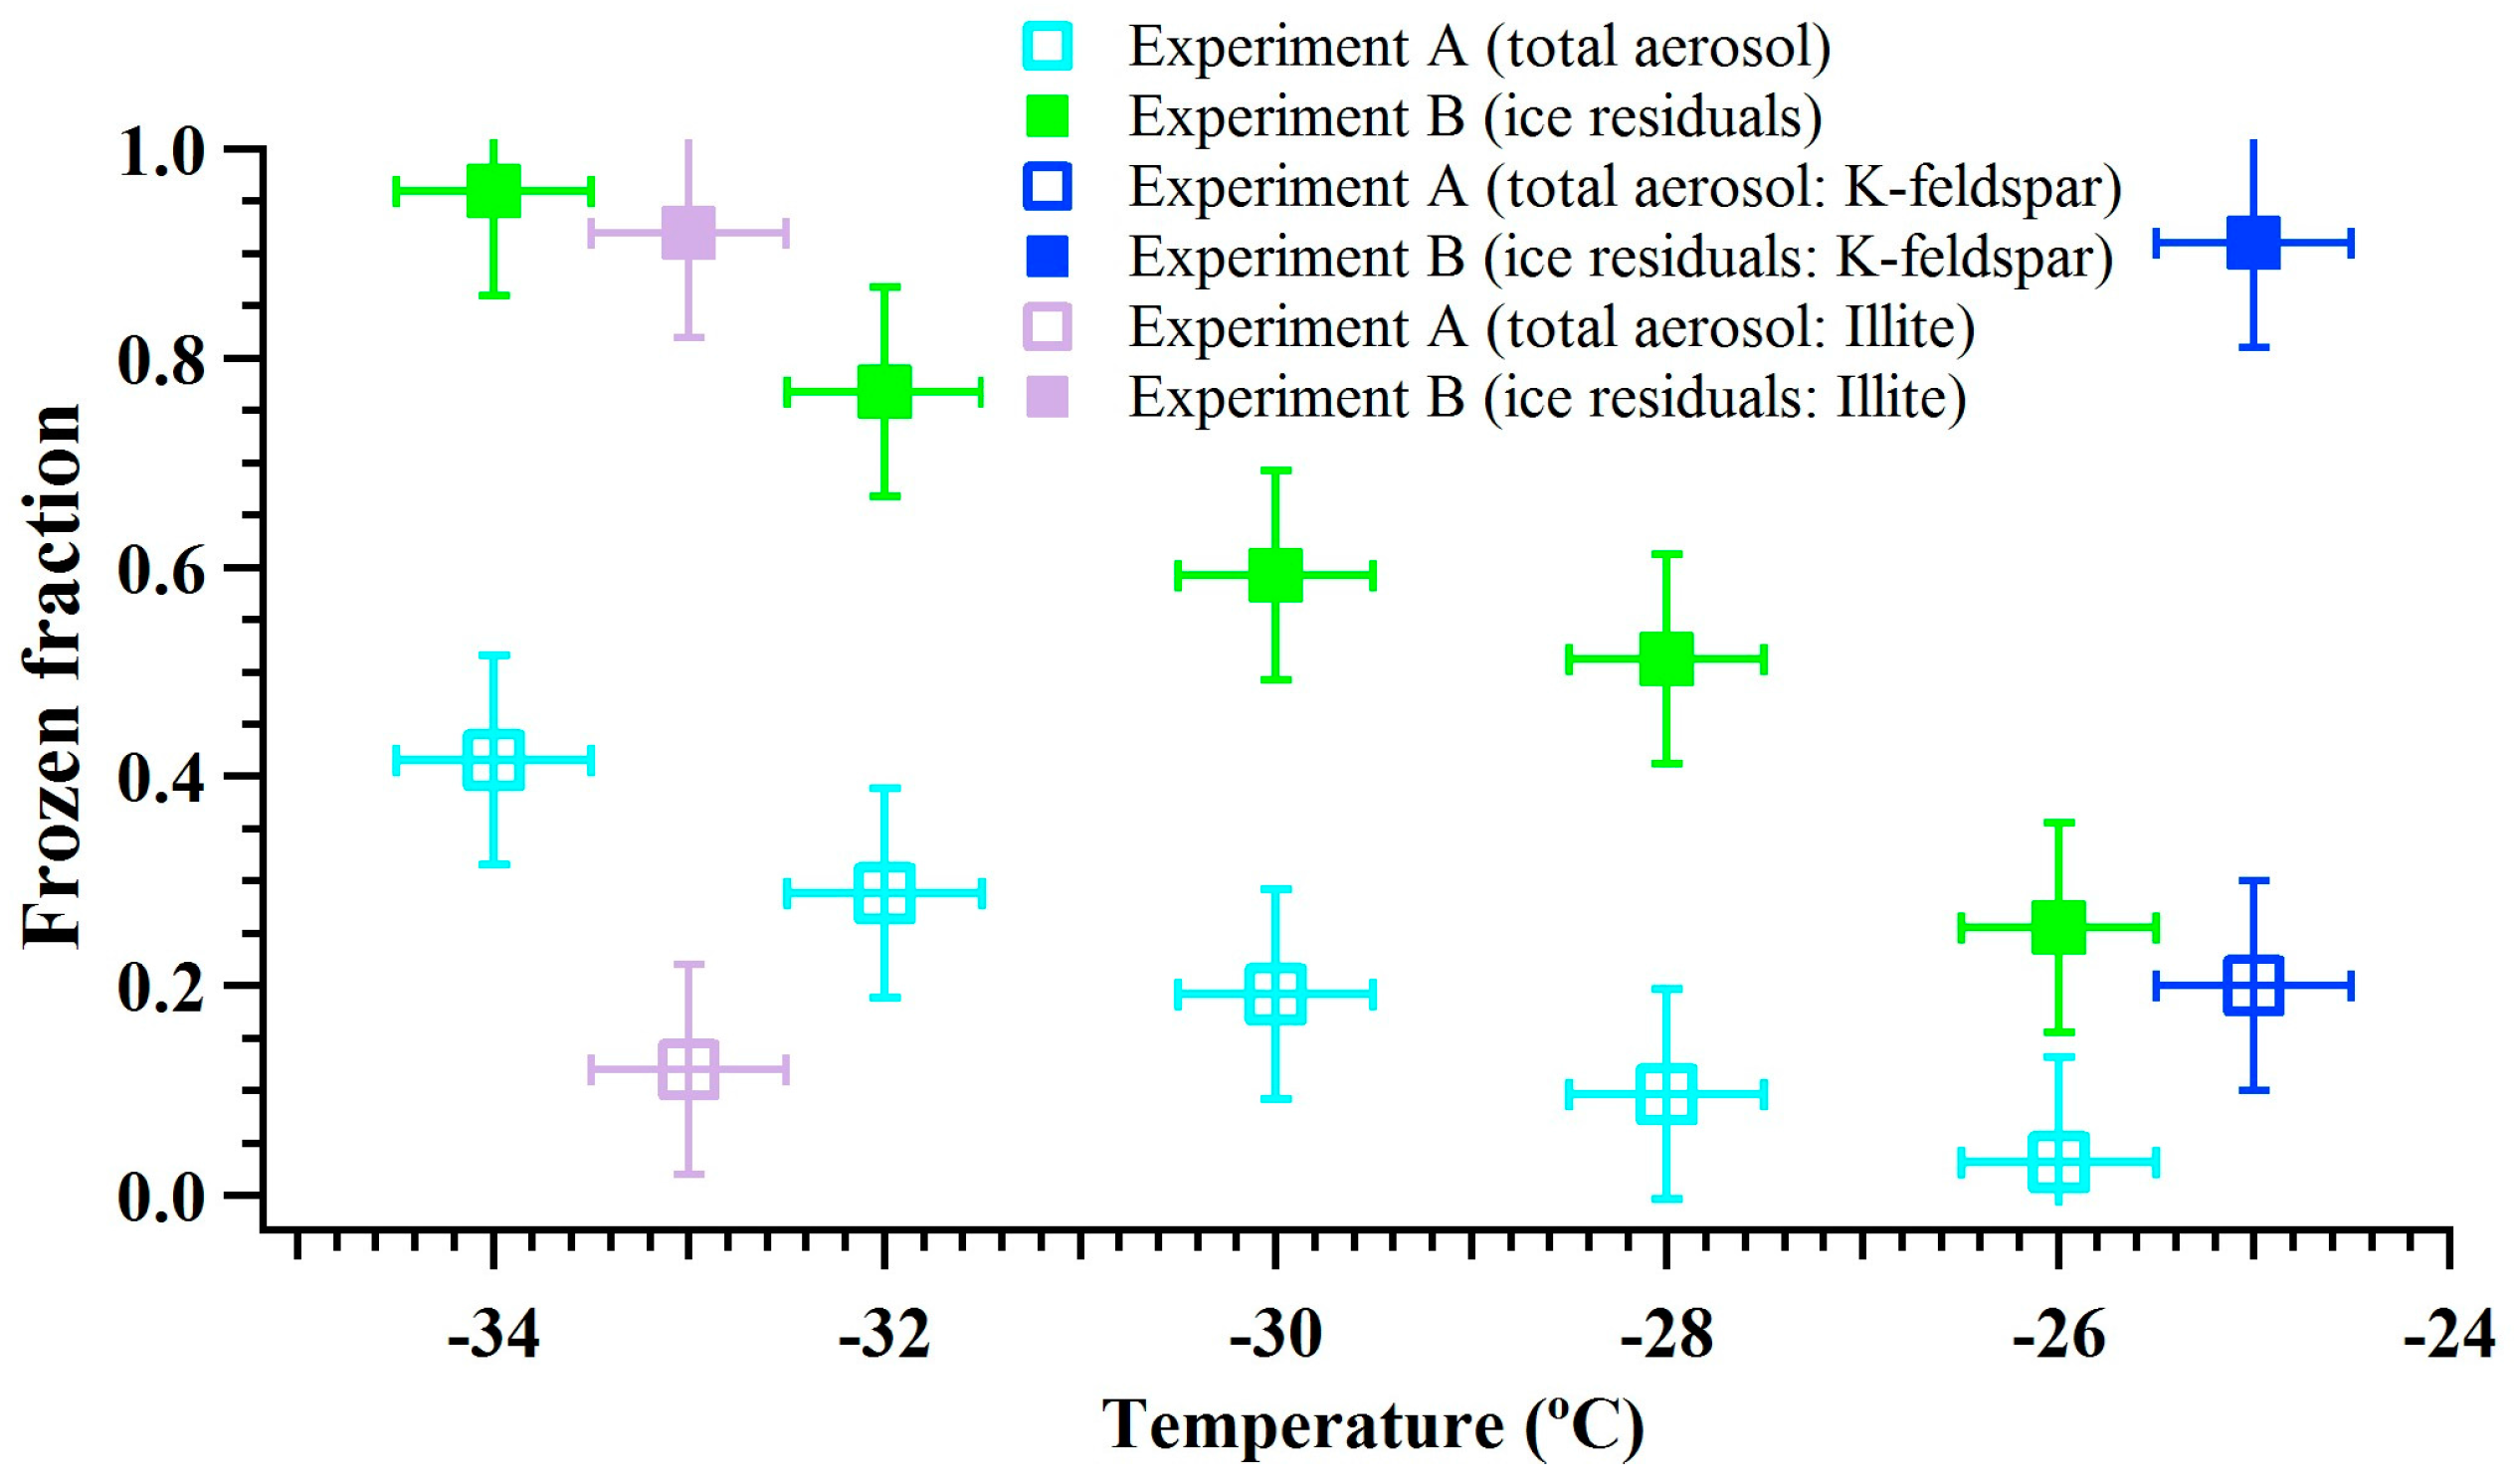
Figure 6.
ns for ambient particles from the present study (experiment A) for immersion freezing. Error bars show the uncertainties propagated through uncertainties within ice particle number concentration and total surface area of particles that enter the chamber 1. The ns fits from previous studies for desert soil dust, agriculture soil dust, and China loess soil dust are also shown.


Table 1.
The average UHSAS concentrations (# per cm3) in experiment A and B at various temperatures. In A and B UHSAS measured particle concentration of total ambient aerosol and IRs, respectively.
Table 1.
The average UHSAS concentrations (# per cm3) in experiment A and B at various temperatures. In A and B UHSAS measured particle concentration of total ambient aerosol and IRs, respectively.
| Experiment | −26 °C | −28 °C | −30 °C | −32 °C | −34 °C |
|---|---|---|---|---|---|
| A | 4000 ± 50 | 4200 ± 40 | 4100 ± 50 | 4150 ± 50 | 4100 ± 50 |
| B | 200 ± 20 | 250 ± 20 | 300 ± 30 | 400 ± 30 | 600 ± 30 |
Table 2.
Single-particle elemental classification scheme implemented to understand the composition of total aerosol particle population.
Table 2.
Single-particle elemental classification scheme implemented to understand the composition of total aerosol particle population.
| Composition Category | Elemental Classification Scheme |
|---|---|
| CNO | Only C, N, O |
| CNO_T1 | C, N, O and trace elements of Al, Si, Ca |
| CNO_T2 | C, N, O and trace elements of Na, Mg, P, K, Cl |
| Others | Mixtures of the above including carbonaceous soot |
© 2018 by the author. Licensee MDPI, Basel, Switzerland. This article is an open access article distributed under the terms and conditions of the Creative Commons Attribution (CC BY) license (http://creativecommons.org/licenses/by/4.0/).
Share and Cite
MDPI and ACS Style
Kulkarni, G. Immersion Freezing of Total Ambient Aerosols and Ice Residuals. Atmosphere 2018, 9, 55. https://doi.org/10.3390/atmos9020055
AMA Style
Kulkarni G. Immersion Freezing of Total Ambient Aerosols and Ice Residuals. Atmosphere. 2018; 9(2):55. https://doi.org/10.3390/atmos9020055
Chicago/Turabian StyleKulkarni, Gourihar. 2018. "Immersion Freezing of Total Ambient Aerosols and Ice Residuals" Atmosphere 9, no. 2: 55. https://doi.org/10.3390/atmos9020055
Note that from the first issue of 2016, this journal uses article numbers instead of page numbers. See further details here.