Analysis of the Spatio-Temporal Patterns of Dry and Wet Conditions in Central Asia


1
State Key Laboratory of Desert and Oasis Ecology, Xinjiang Institute of Ecology and Geography, Chinese Academy of Sciences, Urumqi 830011, China
2
College of Resource and Environment Sciences, Xinjiang University, Urumqi 830046, China
3
University of Chinese Academy of Sciences, Beijing 100049, China
*
Author to whom correspondence should be addressed.
Atmosphere 2018, 9(1), 7; https://doi.org/10.3390/atmos9010007
Submission received: 30 October 2017
/
Revised: 1 December 2017
/
Accepted: 25 December 2017
/
Published: 1 January 2018
(This article belongs to the Section Meteorology)
Abstract
:Drought has become an important threat to industrial and agricultural production and human activities in Central Asia. Using the Standardized Precipitation Evapotranspiration Index (SPEI), we explored the spatial and temporal patterns of dry and wet changes in Central Asia from 1930–2014. The Mann-Kendall trend test and empirical orthogonal function analysis were used to analyze the characteristics of drought in the interannual and seasonal scales. The results showed that the interannual SPEI index in Central Asia presented a distinct phased feature, in the late 1930s, 1970s and 1990s, three consecutive periods of drought occurred. Seasonal SPEI presented different characteristics, with no obvious drying trends in spring and summer. Autumn and winter showed a wet trend. While an obviously wetting tendency has been detected for the winter season, it started in the mid-1950s. Spatially, drought frequency is 42.87% over the entire region of Central Asia from 1930 to 2014. Kyrgyzstan and Tajikistan are wet relative to other countries in Central Asia, with the frequency of drought occurring at 41.6% and 41.9%, respectively; lower than the average frequency of drought in Central Asia. The average frequency of drought in Kazakhstan is 43.1%. Droughts frequently occur in the central and southern parts of Kazakhstan, with the frequency of drought reaching 46.76%. Droughts hardly occur in eastern of Kazakhstan, as well as in the northeastern region. Turkmenistan and Uzbekistan are the two driest countries in Central Asia, especially in the desert region. The frequency of drought was 50.68% and 47.64% respectively.
1. Introduction
Drought is one of most complicated and severe natural disasters. It has a severe impact to human society, causing economic damage, resulting in crop failures, starvation, and land degradation [1,2]. The characteristics of drought are lasting long time, wide scope, and hand to accurately predict the intensity, magnitude, duration, and when it starts and end [3,4,5]. Therefore, quantitative study on the characteristics of the spatial and temporal changes of drought and the mechanisms of their formation are of great significance for industrial and agricultural production, social stability, early warning and prevention of meteorological disaster.
In the past several decades, in order to better understand the spatial and temporal variations of drought, many studies have been working in different countries and regions [6,7,8,9]. The Standardized Precipitation Index (SPI) is a widely accepted drought index. It has the advantages of multi-scale and simple calculation, but it only involves precipitation and does not consider other variables. The Palmer Drought Severity Index (PDSI) is based on the soil water balance and its data requirements are relatively high. It also lacks flexibility to adapt to the intrinsic multi-scalar nature of drought. In addition, several multivariate drought indices have been developed as drought indicator. The aggregate drought index (ADI) combines the physical form of three types of drought (meteorological, hydrological, and agricultural) through input six hydrologic variables of precipitation, stream-flow, reservoir storage, evapotranspiration, and soil moisture and snow water content [10]. Unfortunately only a few stations in Central Asia have a period of observations in the last century. Most stations have records for a relatively short time, and these hydrologic variables data are not sufficient to calculate the ADI. In addition, many meteorological stations in the region practically stopped functioning after the Union of Soviet Socialist Republics (USSR) as a result of severe funding cuts [11]. The Multivariate Standardized Drought Index (MSDI) probabilistically combines the Standardized Precipitation Index (SPI) and the Standardized Soil Moisture Index (SSI) for drought characterization [12]. The MSDI considers information such as precipitation and soil moisture, and has multiple time-scale characteristics. However, the SPI only considers the effect of precipitation, there are some limitations in the drought monitoring, so the application of MSDI is also limited. The multivariate drought index (MDI) based on Principal Component Analysis (PCA) of the precipitation, evapotranspiration, soil moisture and runoff [13]. However, the wide application of a multivariate drought index is limited by the sparseness of observations of hydrological, agricultural, meteorological variables in Central Asia region. It is important that drought indices accurately reflect the impacts being experienced during droughts. The Standardized Precipitation Evapotranspiration Index (SPEI) combines the multi-scalar features and simple calculation of the SPI with the PDSI’s sensitivity to changes in evaporation demand caused by temperature fluctuations and trends. The main advantage of the SPEI is its ability to identify different drought types. This is applicable for monitoring and exploring drought characteristics in a global warming context. In recent years, the SPEI has been used frequently by researchers in monitoring the spatial and temporal variability of drought and changing tendency in a plenty of different regions. Tan et al. used the SPI and SPEI to explore drought characteristics in Ningxia, and found that SPEI is more applicable than SPI for exploring climate change and drought variation in Ningxia [14]. SHI et al. investigated the characteristics of drought changes in Henan province, central China [15]. YU et al. adopted SPEI to investigate drought tendency in China from the 1951 to 2010 [16]. The SPEI was verified to be good at detecting the drought trend under the background of global climate change [17,18].
The Central Asia region is located at the hinterland of the Eurasian continent and far from the oceans, and the humid air is difficult to reach. On the other hand, owing to its complex topography, this region has an arid and semiarid climate. In recent years, previously studies on climate change its impacts in Central Asia have been focused on precipitation, temperature, ecosystems, land use, runoff, water conflict, and vegetation growth. Song et al. pointed that precipitation in winter displayed a significant increase (0.11 mm/year) [19]. Yao et al. investigated trend of temperature and precipitation in the Syr Darya Basin in Central Asia, and found that there was a notable increasing trend in annual temperature of 0.14 °C/decade, precipitation showed a significant rising trend at a rate 4.44 mm/decade [20]. The net primary productivity (NPP) increased in 2000 with the rise of temperature, and the mean actual evapotranspiration (AET) farmland was greatly lower than that of natural vegetation [21]. Thomas et al. found that climate change induced river runoff shifts in Syr Darya basin, and which could lead to water conflicts in Kyrgyzstan and Uzbekistan [22]. However, little research has been done on analysis of spatial and temporal patterns of dry and wet conditions in Central Asia.
The objectives of this study are to: (1) present the characteristics of temporal and spatial variation of drought in Central Asia; and (2) detect trends of drought by the nonparametric Mann-Kendall (M-K) test, and (3) provide reference for the utilization and management of water resources in Central Asia.
2. Materials and Methods
2.1. Study Area
The Central Asia region is located in the Eurasia hinterland (from 55° N, 46° E to 35° N, 85° E). It reaches to Caspian Sea at west, China to the east, Russia to the north, Iran, Afghanistan, and Pakistan to the south. In this paper, our study area includes five Central Asia republics of the Former Soviet Union: Kazakhstan, Kyrgyzstan, Tajikistan, Turkmenistan, and Uzbekistan. This area is regarded as Central Asia (Figure 1). The terrain as a whole is high in the east and low in the west. In the Pamir region of Tajikistan and the western part of the Tianshan Mountains in Kyrgyzstan, the elevation is between 4000 and 5000 m. The Karagiye close to the Caspian Sea, it is the lowest point in Central Asia, with an altitude of 132m below sea level [23]. In the complex terrain region of Central Asia, there is a significant negative correlation between temperature increase rate and elevation [24].
2.2. Data Collection and Preparation
This study attempts to analyze the spatial and temporal variation characteristics of drought from 1930 to 2014 in Central Asia. Thus, in this study we chose SPEI as the drought index, from different time scales to represent characteristics of drought. Using the SPEI, the temporal and spatial distribution characteristics of arid in interannual scale and seasonal scale in Central Asia were analyzed from 1930 to 2014. In this study, we selected the twelve-month time scale of the December SPEI to characterize the Central Asia Region interannual drought, and selected the three-month time scale of the SPEI in May, August, November, and February, respectively, to represent the drought in spring, summer, autumn, and winter.
The analysis is mainly based on the Standardized Precipitation Evapotranspiration Index (SPEI). The SPEI has been obtained from the SPEI global drought monitor. It offers near real time information about drought conditions at the global scale, with a 0.5 degrees spatial resolution and a monthly time resolution. More detailed information of SPEI can be found on this website (from http://spei.csic.es/) [25]. We thank Vicente-Serrano and Beguería for providing SPEI data.
2.3. Calculation of the SPEI
The SPEI calculation process is a combination of the calculation method of PDSI and SPI [26].
The SPEI is the normalized value of the cumulative probability of precipitation and potential evapotranspiration, the difference between precipitation and PET. The difference between precipitation (P) and potential evapotranspiration (PET) in month i can be calculated as
where Pi is monthly precipitation, PETi is monthly potential evapotranspiration. The accumulated difference between P (mm) and PET (mm) in different time scale can be calculated as
where n ≥ k, k is a different time scale, i.e., 1, 3, 6, 12, and 24-months, and n is the number of calculations.
Normalize the difference of the climatic water balance as a log-logistic probability distribution in order to calculate the SPEI series. The probability density function can be expressed as follows
where α, β, γ are parameters representing scale, shape, and origin. The D values are in the range of γ < D < ∞.
Therefore, the probability distribution function can be expressed as follows
The SPEI can be calculated as the standardized F(x) with the approximation of
where , when P ≤ 0.5. P = 1 − F(x), which represents the probability of exceeding the value of D. When P > 0.5, then P will be replaced by 1 − P, the SPEI will be reversed. The coefficients C0, C1, C2, d1, d2, and d3 are the following constants: C0 = 2.515517, C1 = 0.802853, C2 = 0.010328, d1 = 1.432788, d2 = 0.189269, d3 = 0.001308. Drought categories were derived based on Charusombat and Niyogi [27] and are listed in Table 1 [28].
2.4. Statistical Method
2.4.1. Mann-Kendall Test
The Mann-Kendall (MK) test is a non-parametric test [29] and has been widely used in environmental studies for temporal trend analysis [30,31]. MK test determines if a series of observations of a random variable is generally increasing or decreasing with time at different levels of significance. Additionally, this method is simple, robust and can cope with missing values and values below a detection limit. The non-parametric Mann-Kendall test was recommended for identifying significant trends [32], such as precipitation, air temperature, hydrological data, water level, and drought in many regions across the world [33].
The statistic Zc can be estimated as follows, where n > 10:
in which:
where n represents the length of the records; xk and xi represent the sequential records. sgn (θ) is −1, 0, or 1, where θ is less than, equal to, or greater than 0, respectively. t represents the range of any given time. When −Z1−a/2 ≤ Zc ≤ Z1−a/2, it accepts the null hypothesis H0, in which α represents the significance level [34].
In the Mann-Kendall test, the Kendall slope also is useful index, which is an unbiased estimator of monotonic trend magnitude extended by Hirsch et al. [35] from that proposed by Sen, and defined as:
where 1 < j < n and β is the median over all combinations of record pairs for the whole dataset. A positive value of β indicates an upward trend, and a negative value of β indicates a downward trend. H0 represents a null hypothesis that β is equal to 0, it means there is no monotonic trend for variables. When |Zc| > Z(1−α)/2, it indicates a rejection of the null hypothesis at the alpha significance level.
The advantage of this method is not only the simple calculation, can also make clear when the climate began to change.
2.4.2. Empirical Orthogonal Function Analysis
Climate variables are often composed of many pieces of observing data and grid data, making it difficult to directly study their temporal and spatial characteristics. A challenging task is to find method to reduce the dimensionality of the system to as few modes as possible [36]. Empirical orthogonal function (EOF) is an application of principal component analysis (PCA) in meteorological and marine data processing. It is often used to analyze various meteorological elements. In statistics, empirical orthogonal function analysis is known as principal component analysis. As such, EOF analysis is sometimes classified as a multivariate statistical technique. Therefore, EOF analysis is used to analyze the spatial and temporal characteristics of drought. EOF analysis is not based on physical principles. Rather, a field is partitioned into mathematically orthogonal modes which may sometimes be interpreted as atmospheric and oceanographic modes. Typically, the EOFs are found by computing the eigenvalues and eigenvectors of a spatially weighted anomaly covariance matrix of a field. Eigenvectors are the set of basic functions that are the most efficient set to describe data variability. The results of the principal component analysis are used to identify spatial distribution characteristics of drought conditions. This information can help provide a way to further understand the drought of the whole area, while taking into account the internal spatial changes.
2.4.3. Drought Frequency
Drought Frequency (Fs) was used to assess the drought liability during a study period [37]. It is calculated by:
where ns is number of drought events (SPEI < 0.5), NS is total of the months for the study period, and s is a grid cells.
3. Results
3.1. Time Distribution Features of SPEI
3.1.1. Annual Variation Characteristics of SPEI
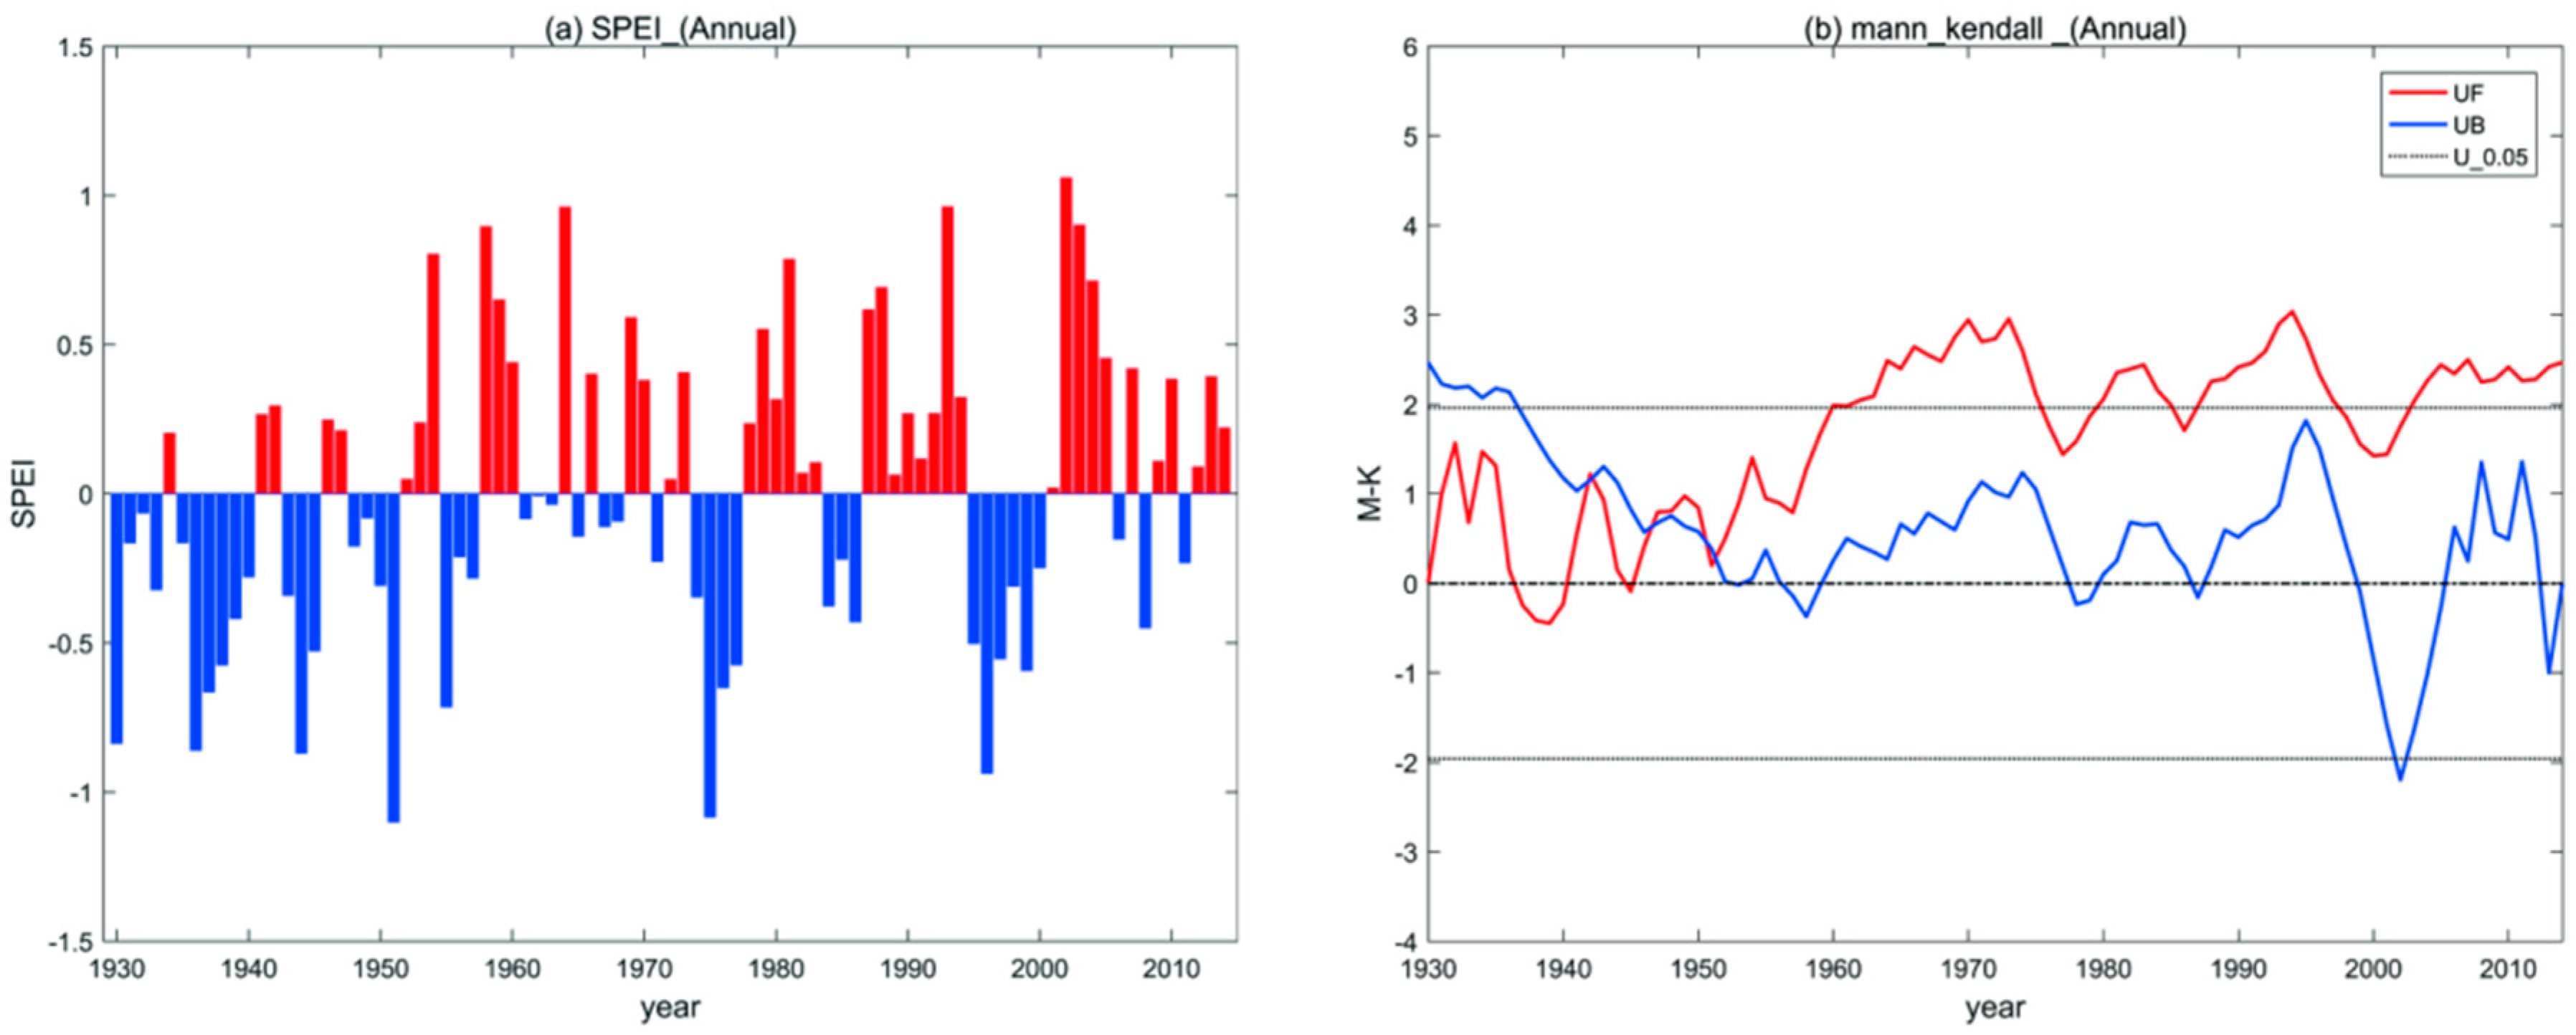
The results of interannual variation are shown in Figure 2a,b. There were three consecutive periods of drought in Central Asia, in the late 1930s, the late 1970s, and the late 1990s. The most severe years of drought were in 1951 and 1975, reaching moderate drought. From the 1960s to the early 1970s, from the 1980s to the mid-1900s, and in the beginning of the 21st century, the Central Asia region was in a period of non-drought. This result is consistent with previous study by Xu et al. [38], who reconstructed a 300-year (1710–2010) SPEI based on tree ring δ18O chronology in Central Asia. The relatively wet years are 1958, 1964, 1993 and 2002. As can be seen from the UF curve (Figure 2b), since the 1950s, the climate in Central Asia has shown a significant wetting trend. From 1960 to 2014, not including the late 1970s and early 21st century, this trend of wetting significantly exceeded the significance level of 0.05. From 1965 to 1975, UF values even exceeded the significance level of 0.001(u0.001 = 2.56), showing that the wetting trend in Central Asia is significant. According to the location of the intersection of the UF and UB curves, the trend of the Central Asia climate becoming wetter since the 1950s is an abrupt climate change, starting in 1951.
3.1.2. Seasonal Variation Characteristics of SPEI
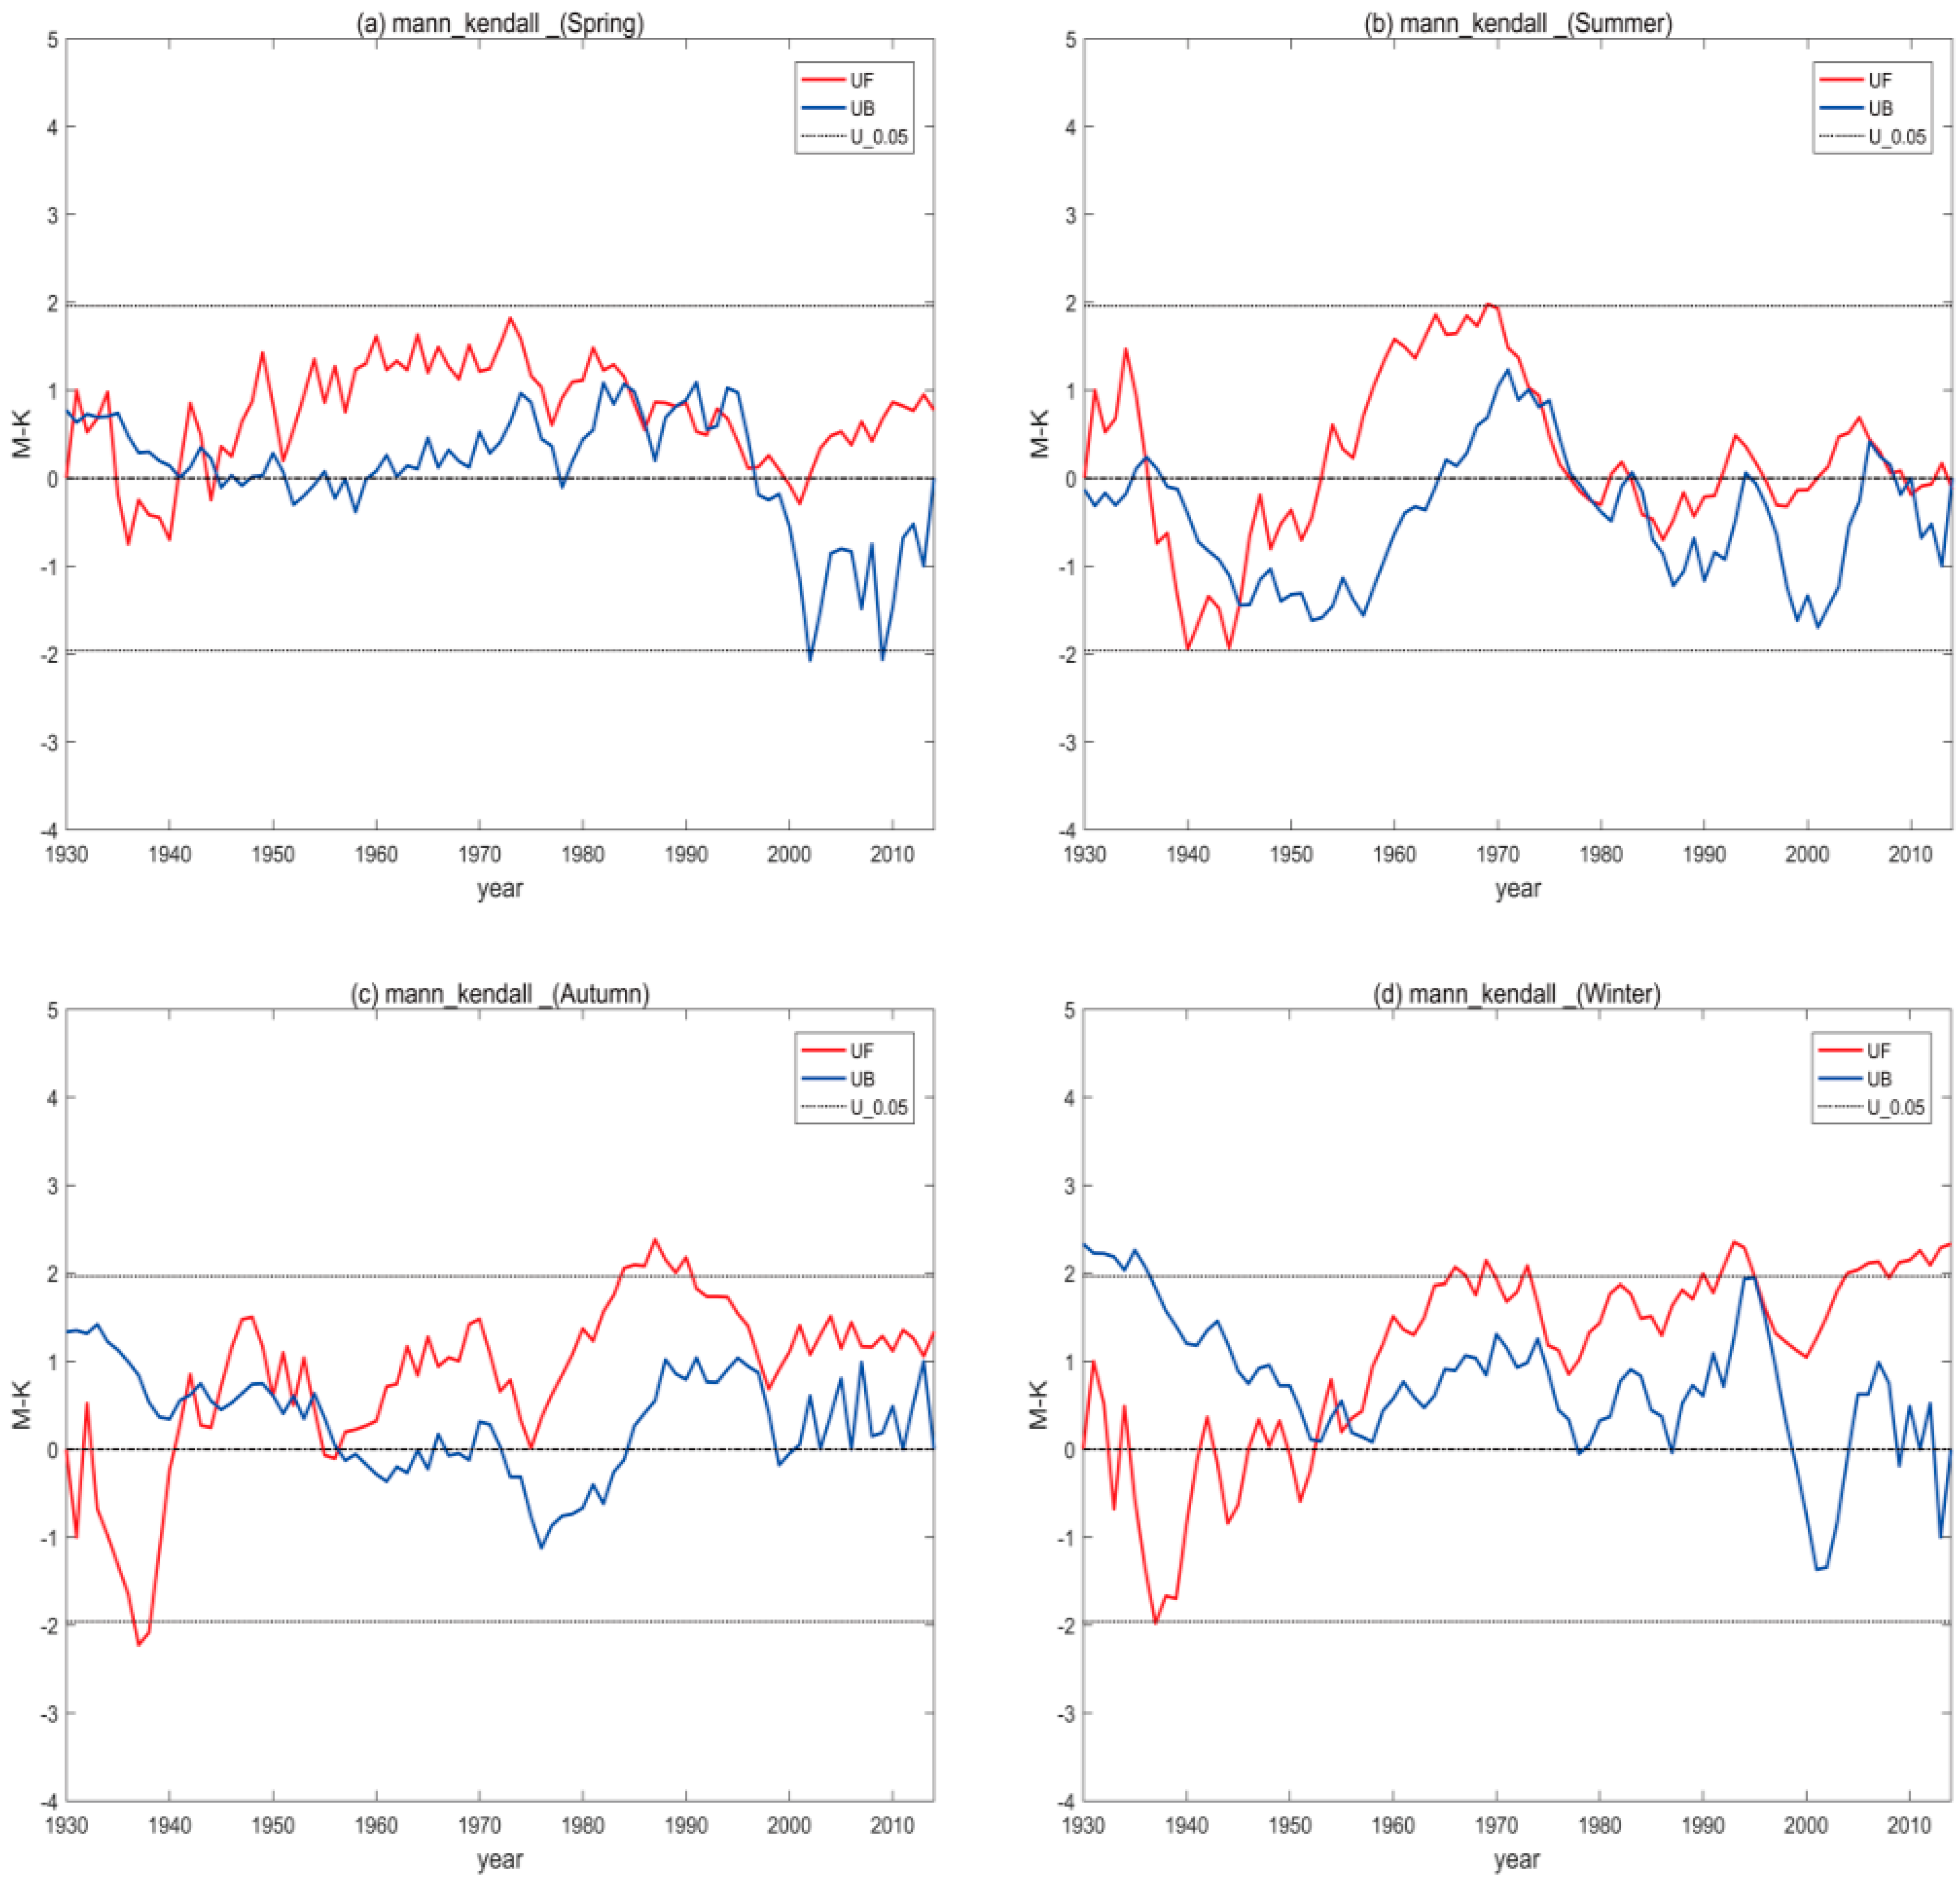
The result of variation of the seasonal SPEI and Mann-Kendall test are shown in Figure 3. From the 1930s to the early 21st century, spring SPEI fluctuates frequently, and the change trend is not significant. Since 2002, the spring SPEI has risen and there has been a wetting trend (Figure 4a). In the early 1930s, 1952–1969, and at the beginning of the 21st century, the Central Asia region showed a relatively humid period during summer (Figure 3b). The summer climate in this region experienced a transition from wet to dry in 1937, 1971 and 2006. The year 1975 saw the most severe drought in the summer climate history of this region. In the 1930s, the autumn climate of the region was in a period of mild drought (Figure 3c). The condition of autumn climate changes shows an obvious characteristic of alternating dry and wet fluctuations. From the 1930s to the 1970s, the winter climate showed a trend of mild drought (Figure 3d), in 1975, the regional winter climate change from dry to wet. From the UF curve can be seen in the mid-1950s, the regional winter climate appears to become a wet trend (Figure 4d). This trend of wetting exceeds the significance level of 0.001, indicating the climate of this region has become wetter in the winter. According to the UF and UB curve intersection of the position, the regional winter climate gets wet is an abrupt phenomenon, with the specific time starting in 1952.
3.2. Spatial Distribution Characteristics of SPEI in Central Asia
3.2.1. Interannual Variation Characteristics of SPEI in Central Asia
The results show that the contribution of the variance of the four leading EOFs is 58.76%. After EOF4, the contribution of the variance of the vector is small. The first four eigenvectors basically include the spatial distribution of drought in Central Asia. Therefore, the four leading EOFs are selected to analyze the spatial distribution of SPEI in Central Asia (Figure 5). The proportion of the EOF1 is the largest, and the variance contribution rate is 32.7%, which is the main form of the spatial distribution of drought in Central Asia. Its spatial coefficients have the same sign in Central Asia. This shows that the characteristics of drought change in Central Asia are consistent, and the whole area has the same dry and wet changes. The maximum value of the first eigenvector is located in the Pamir plateau region of Tajikistan. The values of eigenvectors in central and Western Kazakhstan are smaller than those in other regions. These results indicate that moisture variability quantified by the SPEI is influence by large-scale factors, and the contribution of drought in the central and Western regions is greater than that in other regions. It is also a sensitive area where drought occurs frequently (Figure 5a). The variance contribution rate of the EOF2, EOF3 and EOF4 is 12.7%, 7.9%, and 5.4%, respectively. It reflects the spatial changes of drought, and the changes are mainly influenced by local environmental factors. The north of the EOF2 eigenvector is negative value; the south shows a positive value and reflects the reverse characteristics of the north and south (Figure 5b). Central Asia shows such a pattern of drought distribution as a result of a combination of geographical and structural factors, and some characteristics may vary between five countries. The EOF3 is a negative value area in the east, and the west is a positive value region, which reflects the opposite characteristics of the east and west (Figure 5c). This is due to the effects of the Mediterranean climate, and the total precipitation of the five central Asian countries is gradually decreasing from west to east. The central region of the EOF4 is negative value, and the east and west are positive value, the central region exhibits a characteristic change opposite to the eastern and western regions (Figure 5d). Altai Mountains, Tianshan Mountains, and the Pamirs block a large amount of moisture from the westerly air flow and form a rich precipitation. The frontal clouds disappeared when they cross the mountains, and the precipitation of the leeward slope, valley, basin and other areas greatly reduced. The drought degree is obvious, and some valleys and basins are even known for arid climates.
3.2.2. Seasonal Variation Characteristics of SPEI in Central Asia
Precipitation and temperature in Central Asia show the characteristics of integrity and independence in spatial distribution and temporal evolution. Precipitation in the Central Asia region is affected by monsoon circulation and topography, the precipitation is very different, and seasonal precipitation is not evenly distributed. Therefore, the drought conditions in Central Asia are assessed at the seasonal scale, for the drought analysis in Central Asia region has a certain practical significance.
The EOF1 of SPEI in the spring of Central Asia show a negative value (Figure 6a). This indicates that the dry and wet changes in the spring of Central Asia show a consistent trend in general, because the climate in Central Asia is affected mainly by the west wind circulation and the north Atlantic oscillation. High-value areas are located in central and western regions of Central Asia, with low-value areas in Tajikistan and northern part of Kazakhstan. The EOF2 is between −0.04 and 0.04, and the positive-value region is distributed in the north. The negative-value area is in the south, and the zonal distribution from north to south is shown, which shows the opposite drought characteristics in the north and south (Figure 6b). The EOF1 of SPEI in summer was negative, and the summer climate of this region showed a consistent pattern of change (Figure 6c). High value areas are distributed in the central and eastern regions, this shows that Kazakhstan’s central and eastern regions are the driest areas of the summer in Central Asia. The value of the EOF2 is between −0.042 and 0.041, the positive-value area is in the south and the negative-value area is in the north, and shows the belt distribution characteristics from northeast to southwest (Figure 6d). This shows that the northeast and southwest regions of Central Asia show the opposite drought distribution characteristics in the summer. The variance contribution rate of the EOF1 of SPEI in the autumn of Central Asia is 34.2%, and the eigenvector is basically positive (Figure 6e). The area of dry and wet changes in the whole area is consistent, and the high value area is located in central Kazakhstan. This area is the region with the largest increase in drought intensity in the autumn of Central Asia. The range of the EOF2 is −0.045 to −0.043, the positive center is located in the northwest of Kazakhstan; the negative center is located in western Tajikistan and eastern Uzbekistan. This shows that the climate in Tajikistan has a wetting trend, contrary to the northwest of Kazakhstan (Figure 6e). The EOF1 of the regional SPEI is positive in winter, and the high-value area is located in central Kazakhstan. This indicates that the dry and wet changes in this area are most obvious in Central Asia (Figure 6g). The EOF2 is between −0.043 and 0.041, positive-value area is in the north, and the negative value area is in the west (Figure 6h). This indicates that the dry and wet trends in the north and south of the Central Asia region are opposite. This means that with respect to the climate in the Central Asian region, compared with the north, the south showed a trend of wet. In conclusion, the drought situation in Central Asia is both holistic and unique in spatial distribution. Continental climatic conditions, with highly variable temperature and high evaporation, prevail throughout whole region. Summer is very hot and dry, winter is very cold. Especially in summer, five countries also have different characteristics of drought distribution, because they have different topography, geographical location, and climate. Turkmenistan and Uzbekistan and the south of Kazakhstan desert areas, are the driest areas of Central Asia, especially in the summer, with high temperatures and high they are located on the west side of the Tibetan Plateau and are influenced by the dynamic and thermal effects of the Qinghai-Tibet Plateau, making the winter and spring relatively moist.
3.3. Frequency of Drought Events
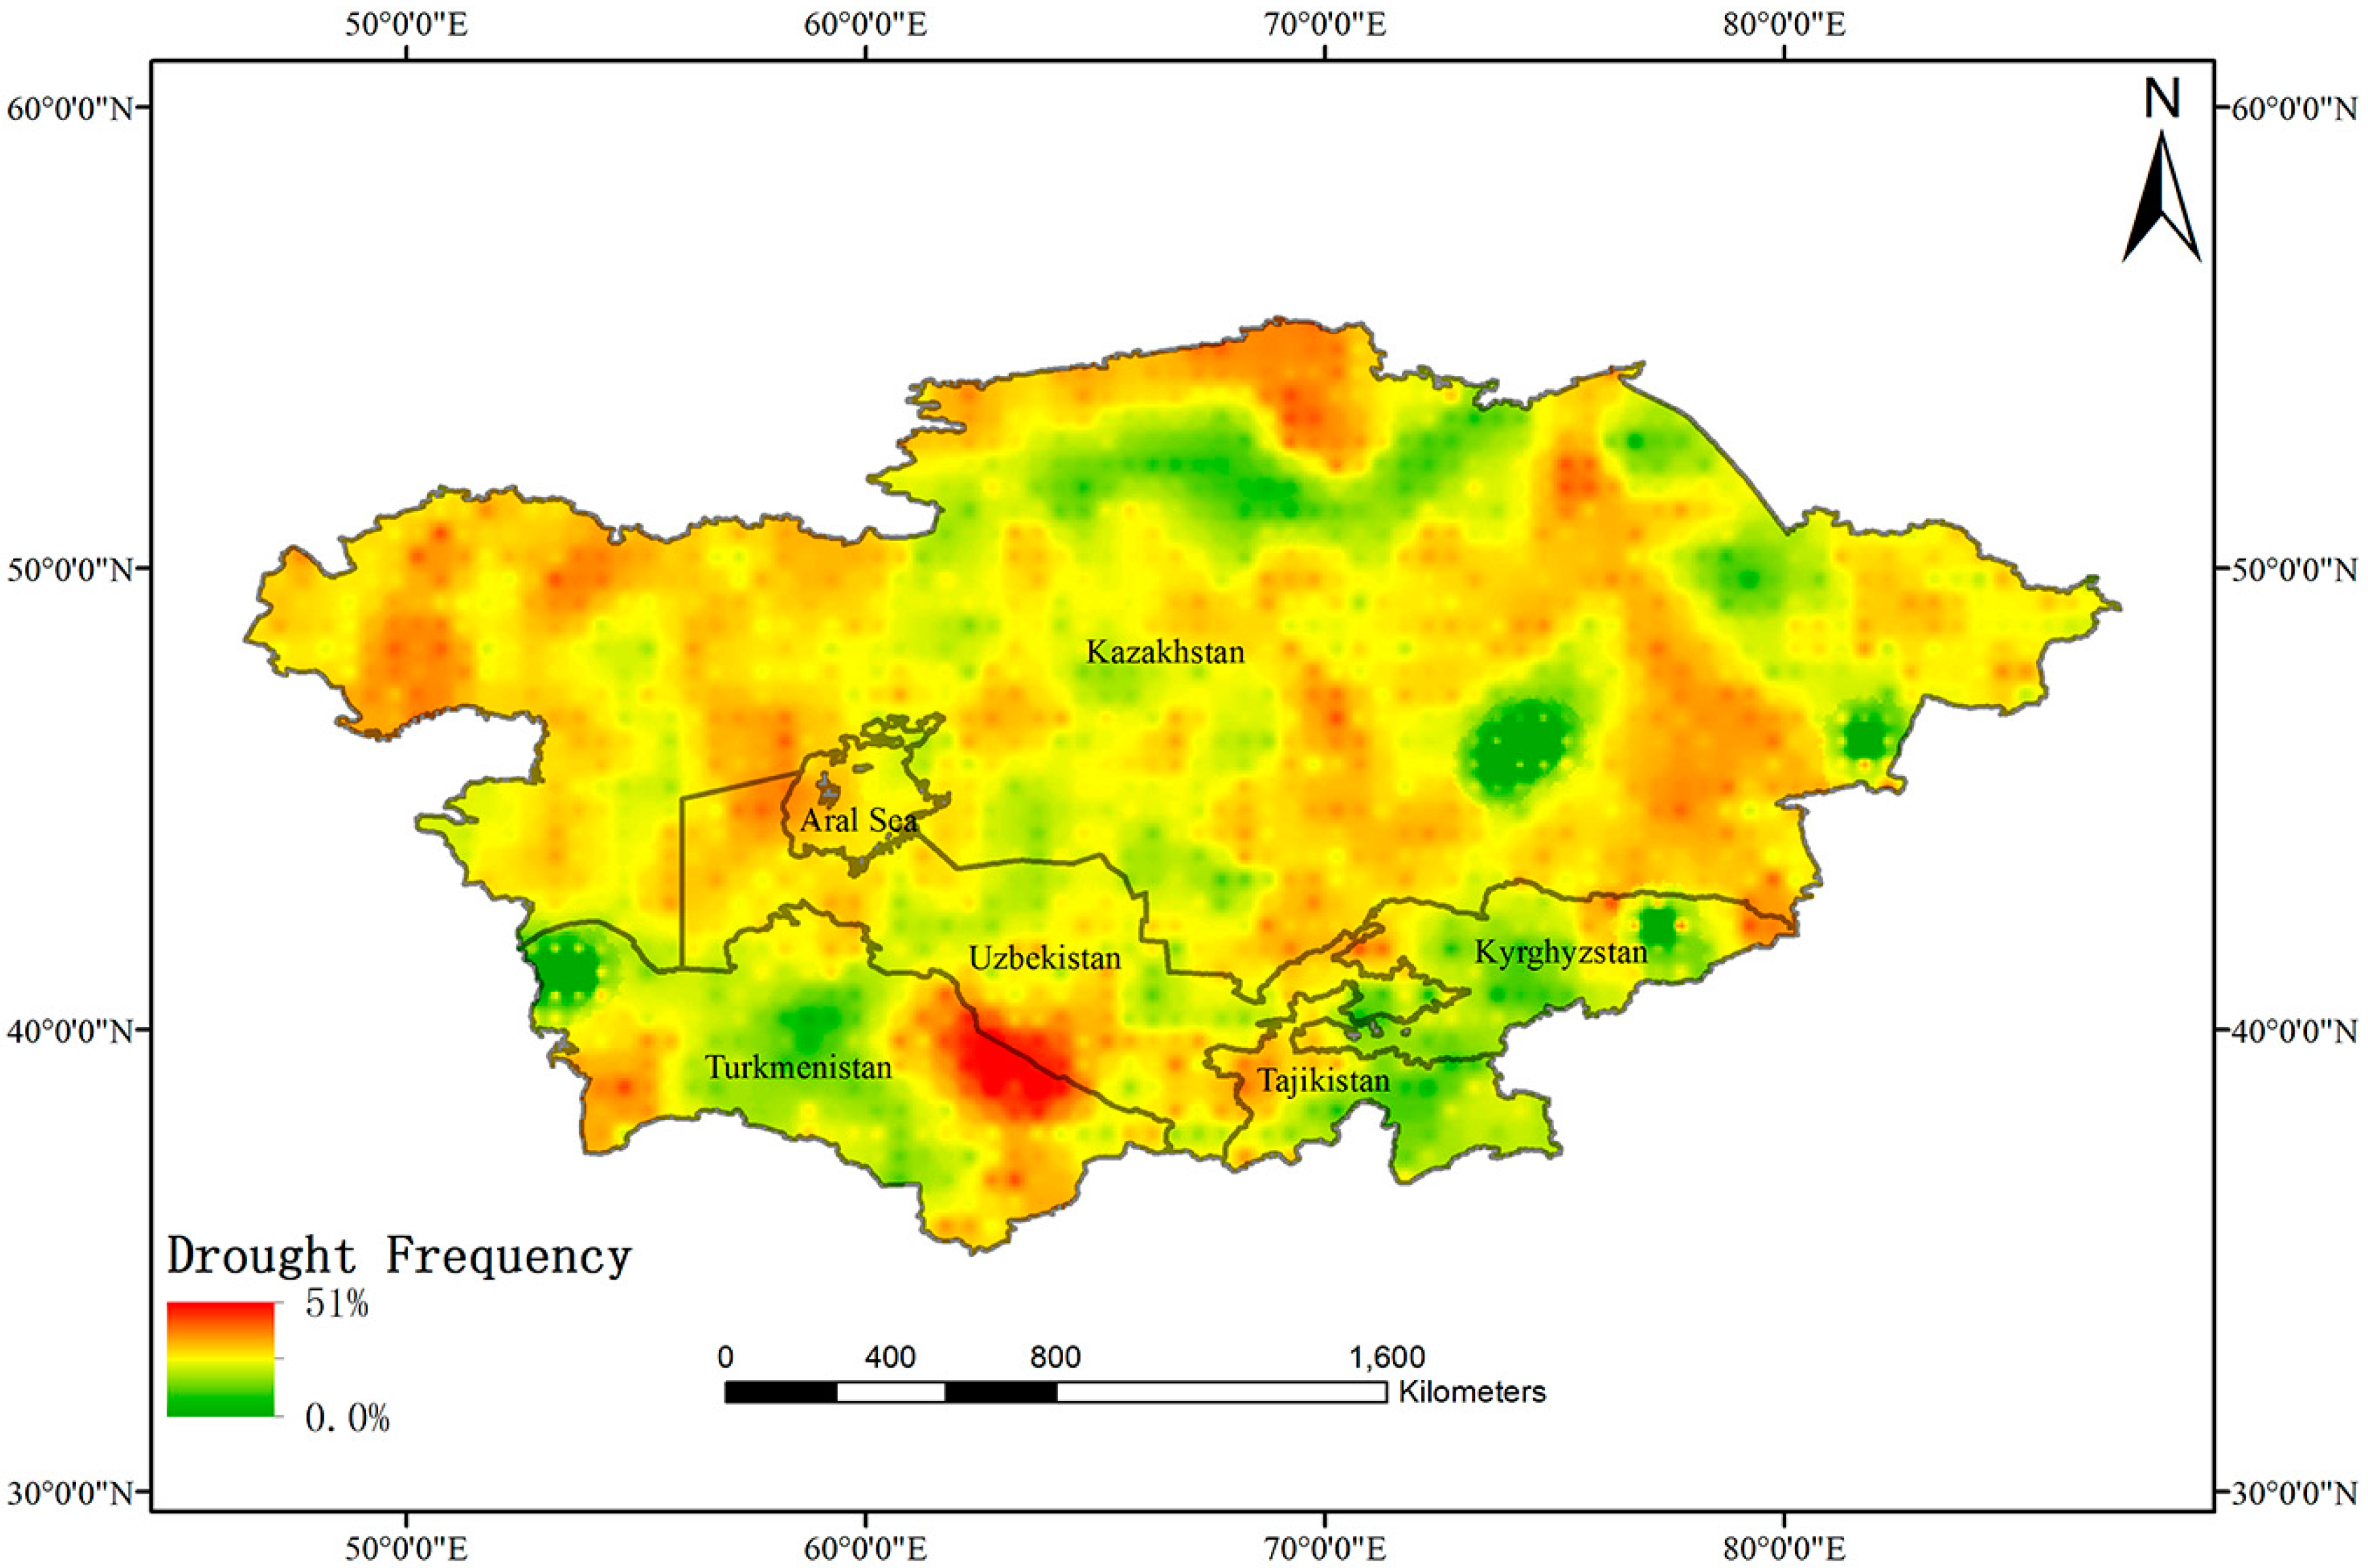
Figure 7 shows the frequency of drought events occurred over the entire Central Asia region. The regional average drought frequency calculated from SPEI was 42.87% for the Central Asia from the 1930 to 2014. Tajikistan and Kyrgyzstan have the lowest frequency of droughts in Central Asia region. The frequency of drought in Tajikistan and Kyrgyzstan were 41.9% and 41.6%, respectively. Turkmenistan was the driest countries in Central Asia, especially in the desert regions. The second one is Uzbekistan. The frequency of drought in Turkmenistan and Uzbekistan were 50.68% and 47.64%, respectively. In northern and northeastern Kazakhstan, the frequency of drought was lower than that in the central and western Kazakhstan. The regional average drought frequency was 43.1% over the entire region of Kazakhstan during the years 1930–2014.
4. Discussion and Conclusions
According to the average interannual SPEI of the Central Asia region from 1930 to 2014, it can be found that the dry and wet al.ternation occurred between 1930 and 2000 in Central Asia. Since 2000, there has been a wetting trend. The seasonal variation of dry and wet conditions in Central Asia has the following characteristics: from 1930 to 2001, the interannual wet and dry changes in the spring fluctuated frequently, but the trend was not significant. Since 2002, the Central Asia region had been in a wetting stage. The interannual wet and dry changes in summer experienced three historical changes in wet and dry alternation, from 1930 to 2014. In the same way, the dry and wet conditions also show a pattern of alternation in autumn. Since 1951, the dry and wet conditions of winter in the Central Asia region have mutated, showing the characteristics from dry to wet.
From the spatial distribution, the Central Asia region has consistent characteristics of wet and dry changes, the eastern part of Kazakhstan’s Balkhash Lake, Midwest Turan Plain and Caspian Sea Plain area are sensitive areas of drought abnormalities. In the past 85 years, the spatial distribution of dry and wet seasonal changes had the same trend and the trend of wet and dry showed the zonal distribution in the direction of latitude.
The results of the MK trend test of SPEI indicate that the interannual and seasonal dry and wet changes in the Central Asia region have a wetting trend but exclude the summer. Since the 1950s, the winter began to show a wetting trend. From the 1960s to the early 21st century, in some of these years the winter climate wetting trend was significantly higher, indicating that the trend of winter wetting was significant in Central Asia.
Water is important and scarce resource in Central Asia. The problem of water resources management in Central Asia is related to the economic, social development and security and stability of Central Asian countries. Water scarcity, mismanagement and conflicting interests in the states across the region are potential sources of conflict. From the characteristics of the spatial distribution of drought, the imbalance and transboundary distribution of water resources in Central Asia, it is inevitable that five countries have a strong completion for water resources what can be strengthening in the future. Ours suggestions are as follows: (1) the five states should establish cooperative countermeasures for water resources exploitation and utilization, and establish a scientific and reasonable water resource allocation plan; (2) Improving irrigation technology, developing water-saving agriculture, reducing waste of water and evaporation in the process of irrigation; (3) Central Asian countries are developing countries with scarce financial possibility to repair, improve and develop public water conservancy facilities. Governments with narrow cooperation of international and regional organizations have to work for the construction of water supply facilities in Central Asia, the maintenance of transboundary water transport facilities, to improve water transmission efficiency, and save the water resources.
Acknowledgments
This study was supported by NSFC-UNEP, project (No. 41361140361), the Chinese Academy of Sciences (No. 134111KYSB20160010), the fund of CAS “Light of West China” Program (No. 2015-XBQN-B-22), and the Joint Funds of the National Natural Science Foundation of China (Grant No. U1603342 & U1603113). We thank Vicente-Serrano and Beguería for providing SPEI data.
Author Contributions
Zhijie Ta conceived of the presented idea and verified the analytical methods. Ruide Yu, Xi Chen and Guijin Mu supervised the findings of this work. All authors discussed the results and contributed to the manuscript.
Conflicts of Interest
The authors declare no conflict of interest.
References
- Lobell, D.B.; Roberts, M.J.; Schlenker, W.; Braun, N.; Little, B.B.; Rejesus, R.M.; Hammer, G.L. Greater sensitivity to drought accompanies maize yield increase in the US Midwest. Science 2014, 344, 516–519. [Google Scholar] [CrossRef] [PubMed]
- Piao, S.L.; Ciais, P.; Huang, Y.; Shen, Z.H.; Peng, S.S.; Li, J.S.; Zhou, L.P.; Liu, H.Y.; Ma, Y.C.; Ding, Y.H.; et al. The impacts of climate change on water resources and agriculture in China. Nature 2010, 467, 43–51. [Google Scholar] [CrossRef] [PubMed]
- Mirabbasi, R.; Fakheri-Fard, A.; Dinpashoh, Y. Bivariate drought frequency analysis using the copula method. Theor. Appl. Climatol. 2012, 108, 191–206. [Google Scholar] [CrossRef]
- Huang, S.; Chang, J.; Huang, Q.; Chen, Y. Spatio-temporal changes and frequency analysis of drought in the wei river basin, China. Water Resour. Manag. 2014, 28, 3095–3110. [Google Scholar] [CrossRef]
- Shiau, J.T.; Modarres, R. Copula-based drought severity-duration-frequency analysis in Iran. Meteorol. Appl. 2009, 16, 481–489. [Google Scholar] [CrossRef]
- Tao, H.; Borth, H.; Fraedrich, K.; Schneidereit, A.; Zhu, X. Hydrological extremes in the Aksu-tarim river basin: Mid-latitude dynamics. Clim. Dyn. 2015, 46, 2039–2050. [Google Scholar]
- Ionita, M.; Scholz, P.; Chelcea, S. Spatio-temporal variability of dryness/wetness in the Danube river basin. Hydrol. Processes 2015, 29, 4483–4497. [Google Scholar] [CrossRef]
- Liu, Z.; Wang, Y.; Shao, M.; Jia, X.; Li, X. Spatiotemporal analysis of multiscalar drought characteristics across the loess plateau of China. J. Hydrol. 2016, 534, 281–299. [Google Scholar] [CrossRef]
- Zhai, J.; Su, B.; Krysanova, V.; Vetter, T.; Gao, C.; Jiang, T. Spatial variation and trends in PDSI and SPI indices and their relation to Streamflow in 10 large regions of China. J. Clim. 2010, 23, 649–663. [Google Scholar] [CrossRef]
- Akbar, N.; Ahmad, N.; Ardavan, G. Comparison of the suitability of standardized precipitation index (SPI) and aggregated drought index (ADI) in minab watershed (Hormozgan Province/South of Iran). Afr. J. Agric. Res. 2012, 7, 5905–5911. [Google Scholar] [CrossRef]
- Chub, V.E. Climate Change and Its Impact on the Natural Resources Potential of the Republic of Uzbekistan; Main Administration on Hydrometeorology under the Cabinet of Ministers of the Republic of Uzbekistan: Tashkent, Uzbekistan, 2000. [Google Scholar]
- Hao, Z.; AghaKouchak, A. Multivariate standardized drought index: A parametric multi-index model. Adv. Water Resour. 2013, 57, 12–18. [Google Scholar] [CrossRef]
- Rajsekhar, D.; Singh, V.P.; Mishra, A.K. Multivariate drought index: An information theory based approach for integrated drought assessment. J. Hydrol. 2015, 526, 164–182. [Google Scholar] [CrossRef]
- Tan, C.P.; Yang, J.P.; Li, M. Temporal-spatial variation of drought indicated by spi and spei in ningxia hui autonomous region, China. Atmosphere (Basel) 2015, 6, 1399–1421. [Google Scholar] [CrossRef]
- Shi, B.L.; Zhu, X.Y.; Hu, Y.C.; Yang, Y.Y. Drought characteristics of Henan province in 1961–2013 based on standardized precipitation evapotranspiration index. J. Geogr. Sci. 2017, 27, 311–325. [Google Scholar] [CrossRef]
- Yu, M.; Li, Q.; Hayes, M.J.; Svoboda, M.D.; Heim, R.R. Are droughts becoming more frequent or severe in china based on the standardized precipitation evapotranspiration index: 1951–2010? Int. J. Climatol. 2014, 34, 545–558. [Google Scholar] [CrossRef]
- Vicente-Serrano, S.M.; Beguería, S.; López-Moreno, J.I. Comment on “characteristics and trends in various forms of the palmer drought severity index (pdsi) during 1900–2008” by Aiguo Dai. J. Geophys. Res. 2011, 116. [Google Scholar] [CrossRef]
- Begueria, S.; Vicente-Serrano, S.M.; Reig, F.; Latorre, B. Standardized precipitation evapotranspiration index (spei) revisited: Parameter fitting, evapotranspiration models, tools, datasets and drought monitoring. Int. J. Climatol. 2014, 34, 3001–3023. [Google Scholar] [CrossRef]
- Song, S.; Bai, J. Increasing winter precipitation over arid central Asia under global warming. Atmosphere 2016, 7, 139. [Google Scholar] [CrossRef]
- Yao, J.; Chen, Y. Trend analysis of temperature and precipitation in the Syr Darya basin in Central Asia. Theor. Appl. Climatol. 2014, 120, 521–531. [Google Scholar] [CrossRef]
- Chen, X.; Bai, J.; Li, X.; Luo, G.; Li, J.; Li, B.L. Changes in land use/land cover and ecosystem services in Central Asia during 1990–2009. Curr. Opin. Environ. Sustain. 2013, 5, 116–127. [Google Scholar] [CrossRef]
- Bernauer, T.; Siegfried, T. Climate change and international water conflict in Central Asia. JPR 2012, 49, 227–239. [Google Scholar] [CrossRef]
- Badescu, V.; Cathcart, R.B. Aral sea partial restoration. Ii. Simulation of time-dependent processes. IJEWM 2011, 7, 164–174. [Google Scholar] [CrossRef]
- Hu, Z.Y.; Zhang, C.; Hu, Q.; Tian, H.Q. Temperature changes in central Asia from 1979 to 2011 based on multiple datasets. J. Clim. 2014, 27, 1143–1167. [Google Scholar] [CrossRef]
- The Standardized Precipitation-Evapotranspiration Index. Available online: http://spei.csic.es/ (accessed on 1 December 2016).
- Vicente-Serrano, S.M.; Begueria, S.; Lopez-Moreno, J.I. A multiscalar drought index sensitive to global warming: The standardized precipitation evapotranspiration index. J. Clim. 2010, 23, 1696–1718. [Google Scholar] [CrossRef]
- Charusombat, U.; Niyogi, D. A hydroclimatological assessment of regional drought vulnerability: A case study of indiana droughts. Earth Interact. 2011, 15, 1–65. [Google Scholar] [CrossRef]
- Mitra, S.; Srivastava, P. Spatiotemporal variability of meteorological droughts in Southeastern USA. Nat. Hazards 2017, 86, 1007–1038. [Google Scholar] [CrossRef]
- Mann, H.B. Nonparametric tests against trend. Econometrica 1945, 13, 245–259. [Google Scholar] [CrossRef]
- Tabari, H.; Hosseinzadeh Talaee, P.; Mousavi Nadoushani, S.S.; Willems, P.; Marchetto, A. A survey of temperature and precipitation based aridity indices in Iran. Quat. Int. 2014, 345, 158–166. [Google Scholar] [CrossRef]
- Gocic, M.; Trajkovic, S. Analysis of precipitation and drought data in Serbia over the period 1980–2010. J. Hydrol. 2013, 494, 32–42. [Google Scholar] [CrossRef]
- Chowdhury, R.K.; Beecham, S. Australian rainfall trends and their relation to the southern oscillation index. Hydrol. Processes 2010, 24, 504–514. [Google Scholar] [CrossRef]
- Hamed, K.H. Trend detection in hydrologic data: The Mann-Kendall trend test under the scaling hypothesis. J. Hydrol. 2008, 349, 350–363. [Google Scholar] [CrossRef]
- Xu, C.Y.; Singh, V.P. Evaluation of three complementary relationship evapotranspiration models by water balance approach to estimate actual regional evapotranspiration in different climatic regions. J. Hydrol. 2005, 308, 105–121. [Google Scholar] [CrossRef]
- Hirsch, R.M.; Slack, J.R. A nonparametric trend test for seasonal data with serial dependence. Water Resour. Res. 1984, 20, 727–732. [Google Scholar] [CrossRef]
- Hannachi, A.; Jolliffe, I.T.; Stephenson, D.B. Empirical orthogonal functions and related techniques in atmospheric science: A review. Int. J. Climatol. 2007, 27, 1119–1152. [Google Scholar] [CrossRef]
- Wang, Q.; Wu, J.; Lei, T.; He, B.; Wu, Z.; Liu, M.; Mo, X.; Geng, G.; Li, X.; Zhou, H. Temporal-spatial characteristics of severe drought events and their impact on agriculture on a global scale. Quat. Int. 2014, 349, 10–21. [Google Scholar] [CrossRef]
- Xu, G.; Liu, X.; Wu, G.; Chen, T.; Wang, W.; Zhang, Q.; Zhang, Y.; Zeng, X.; Qin, D.; Sun, W.; et al. Tree ringδ18o’s indication of a shift to a wetter climate since the 1880s in the Western TianShan Mountains of Northwestern China. J. Geophys. Res. Atmos. 2015, 120, 6409–6425. [Google Scholar] [CrossRef]
Figure 1.
Location and digital elevation map of the Central Asia.
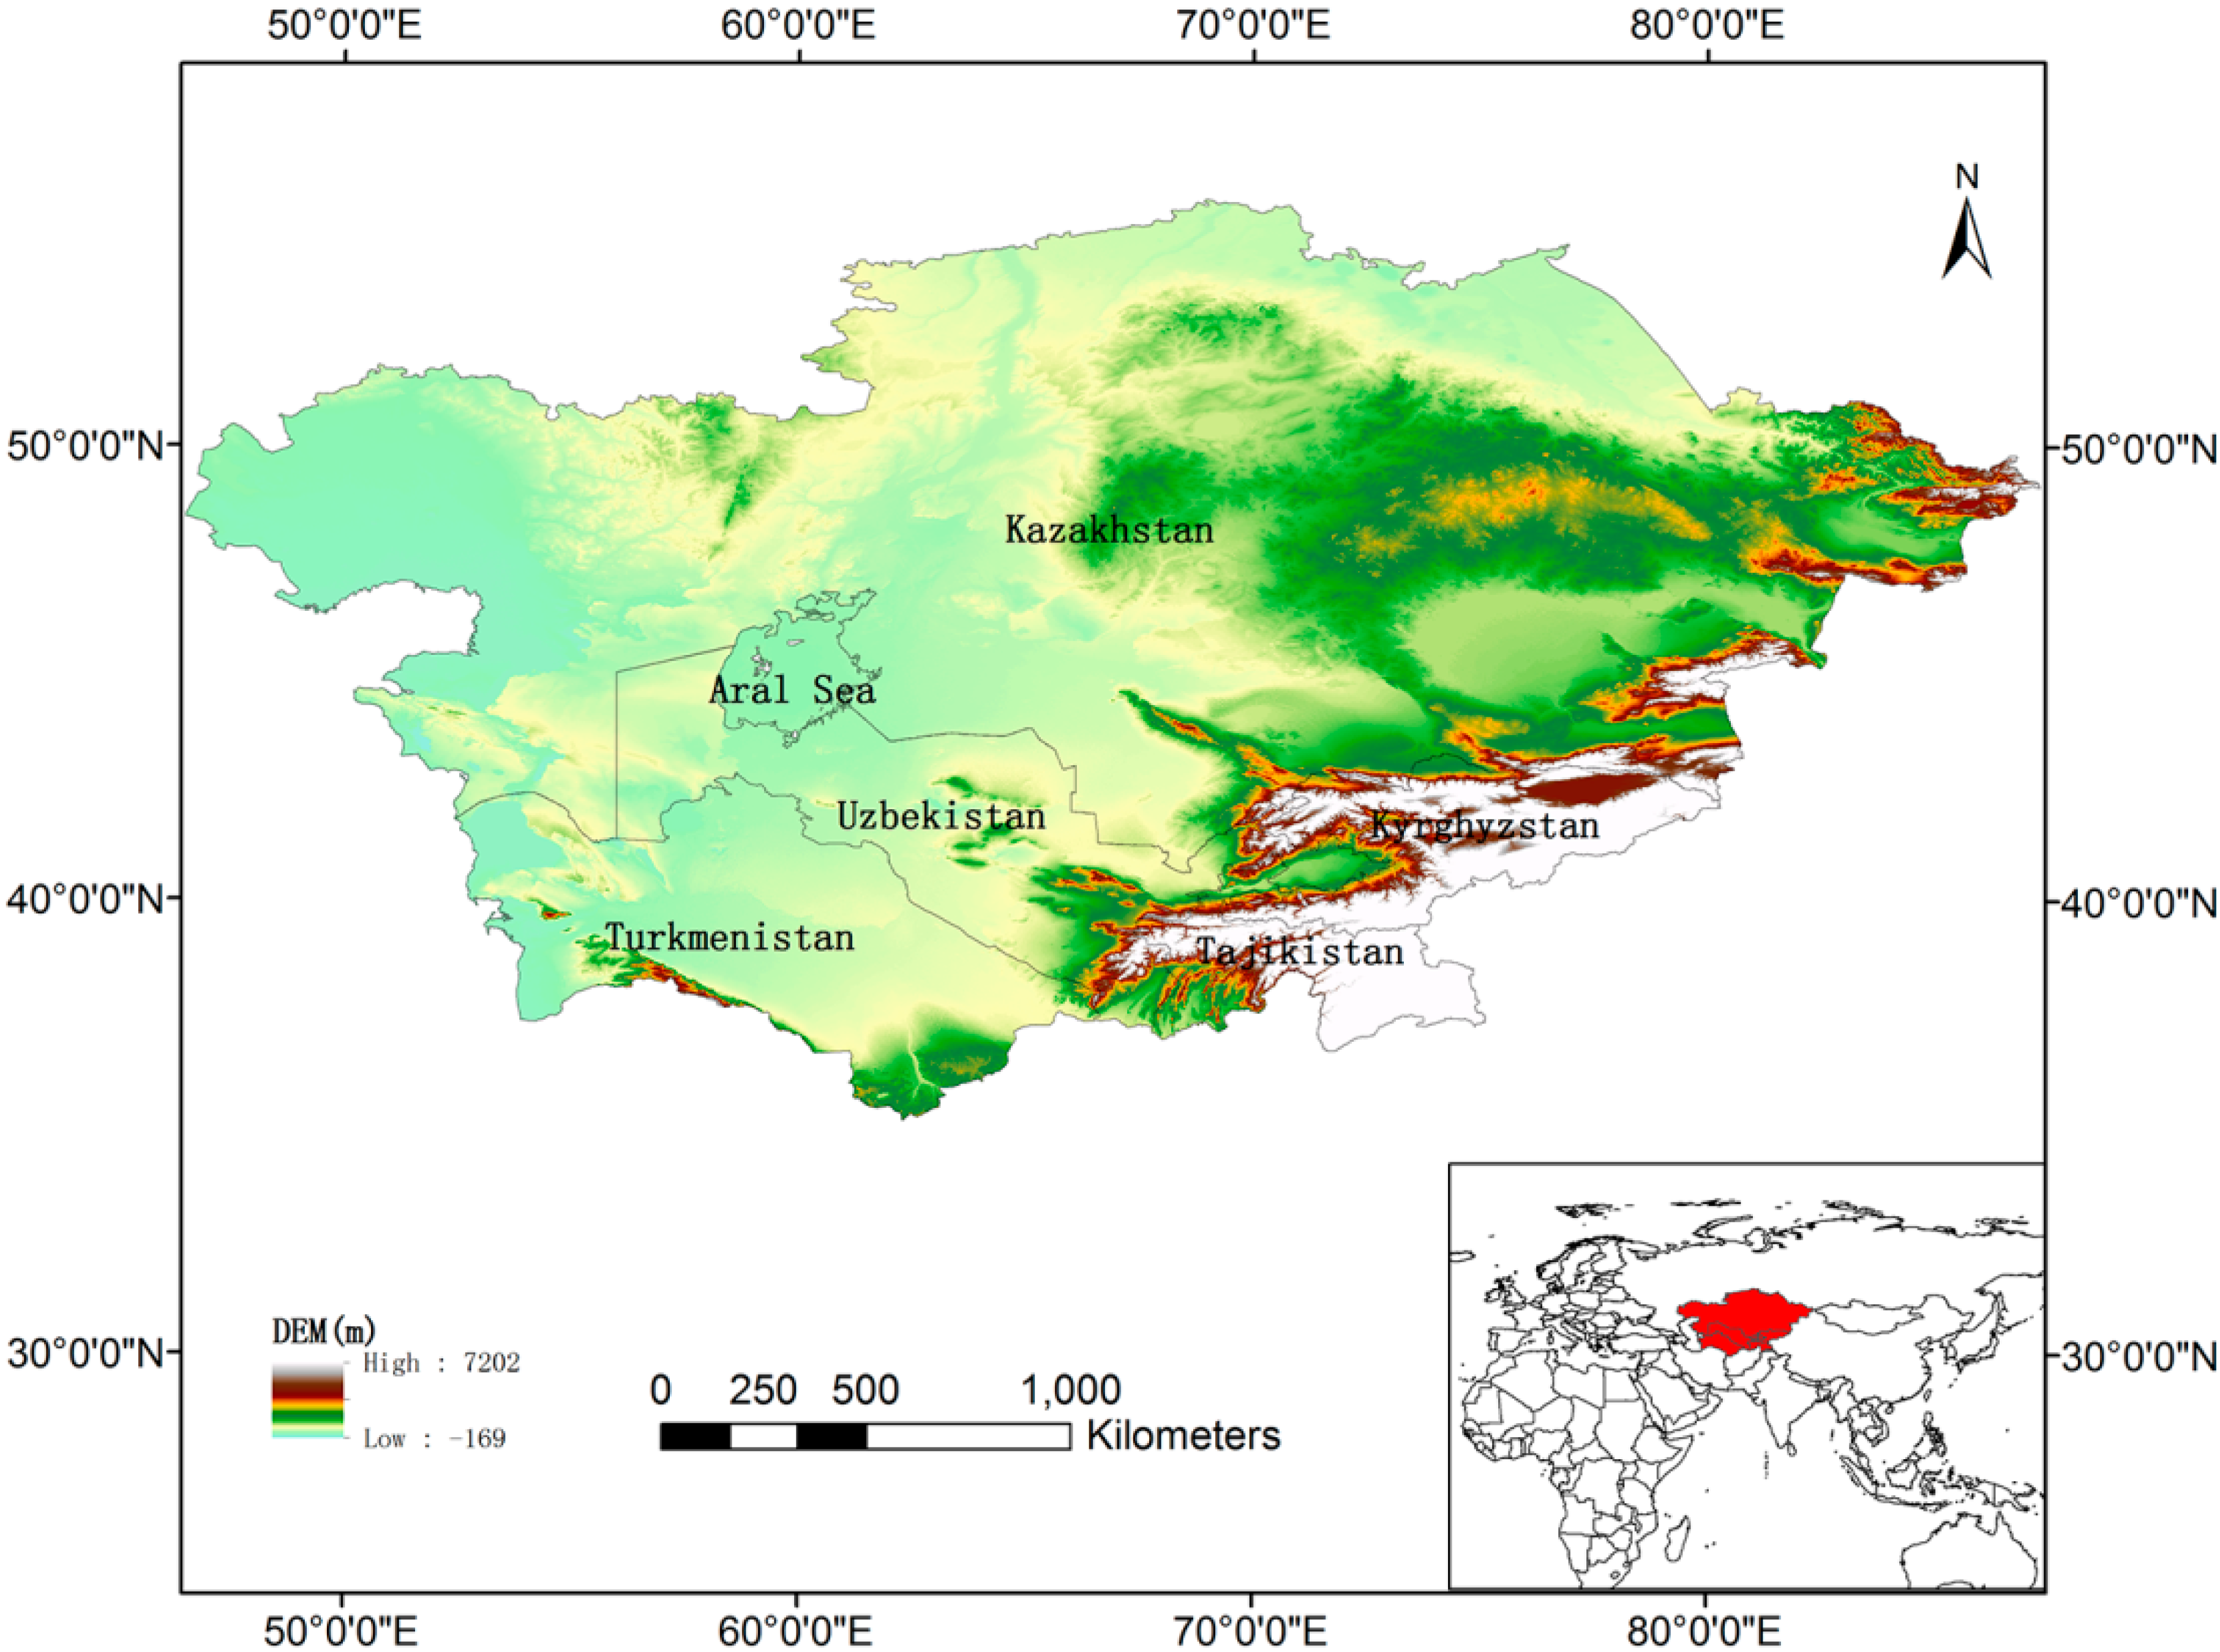
Figure 2.
Interannual SPEI series (a) and its Mann-Kendall abrupt test curve (b), 1930–2014.

Figure 3.
Variation of the seasonal SPEI of spring (a); summer (b); autumn(c); and winter (d) in Central Asia, 1930–2014.
Figure 3.
Variation of the seasonal SPEI of spring (a); summer (b); autumn(c); and winter (d) in Central Asia, 1930–2014.
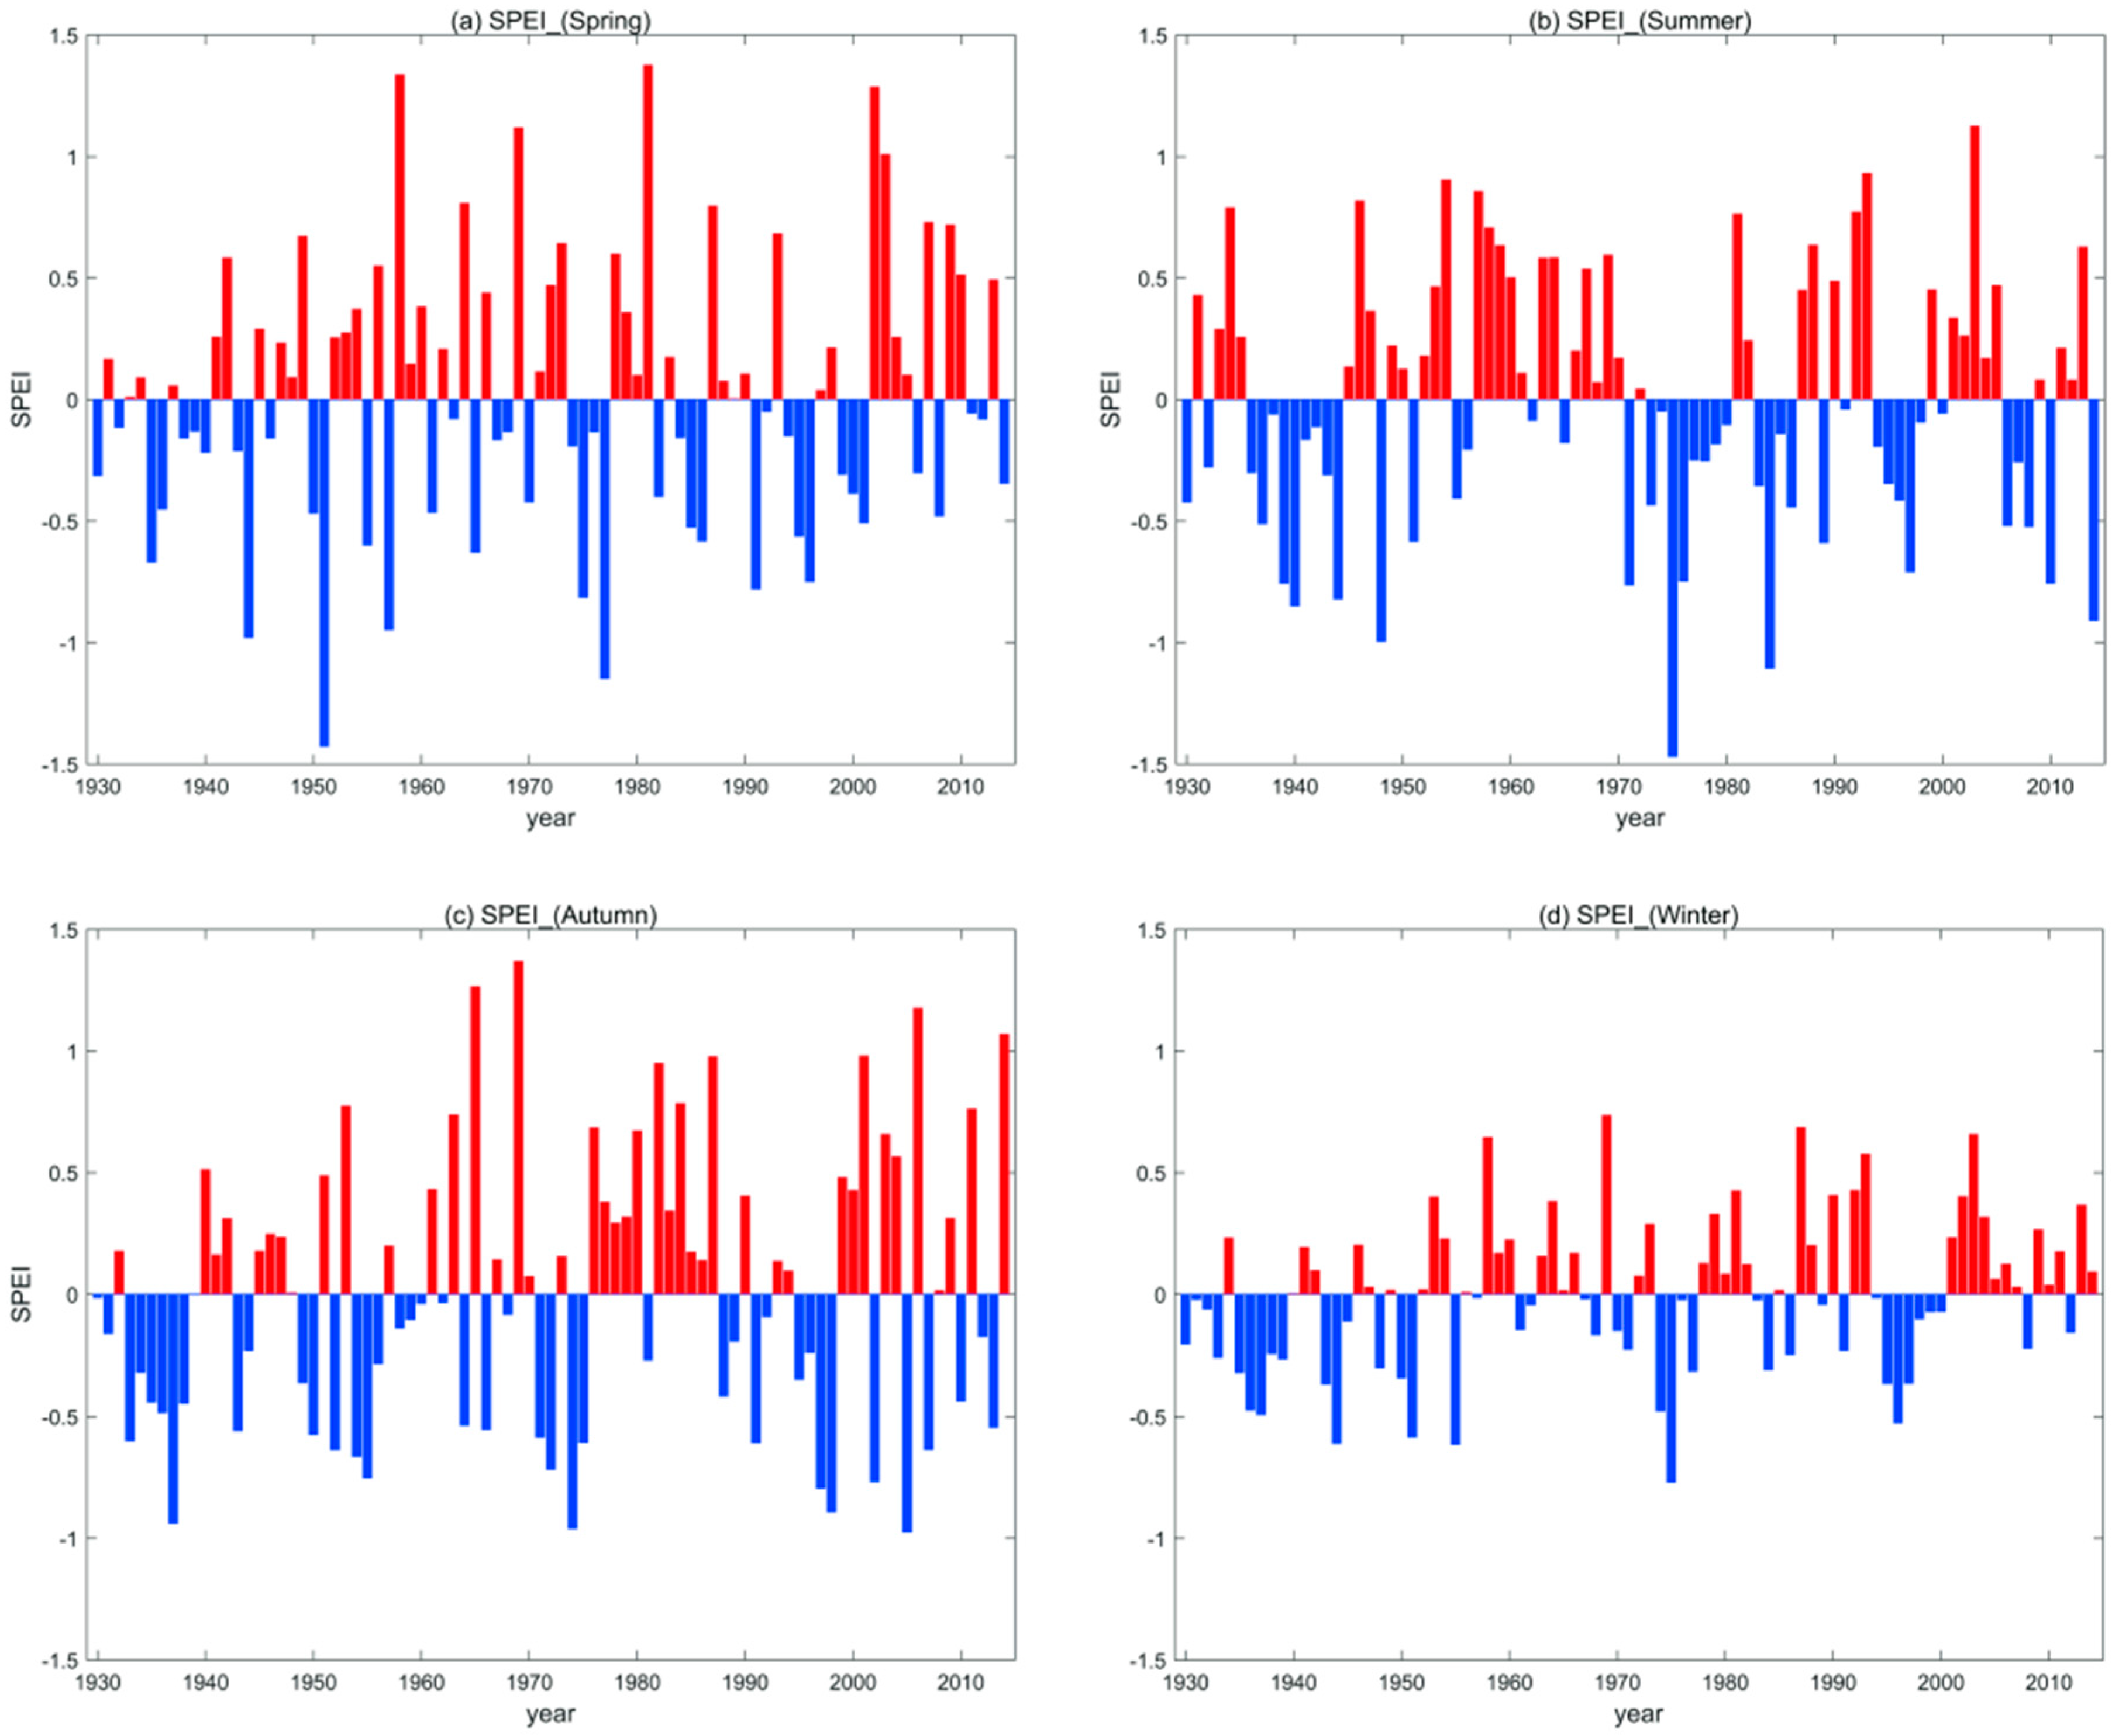
Figure 4.
Mann-Kendall statistic curves based on seasonal SPEI of spring (a); summer (b); autumn (c); and winter (d) in Central Asia, 1930–2014.
Figure 4.
Mann-Kendall statistic curves based on seasonal SPEI of spring (a); summer (b); autumn (c); and winter (d) in Central Asia, 1930–2014.

Figure 5.
Spatial distribution of the first four feature vectors of interannual SPEI expanded by PCA (the first EOF mode (a); the second EOF mode (b); the third EOF mode (c); and the fourth EOF mode (d)).
Figure 5.
Spatial distribution of the first four feature vectors of interannual SPEI expanded by PCA (the first EOF mode (a); the second EOF mode (b); the third EOF mode (c); and the fourth EOF mode (d)).
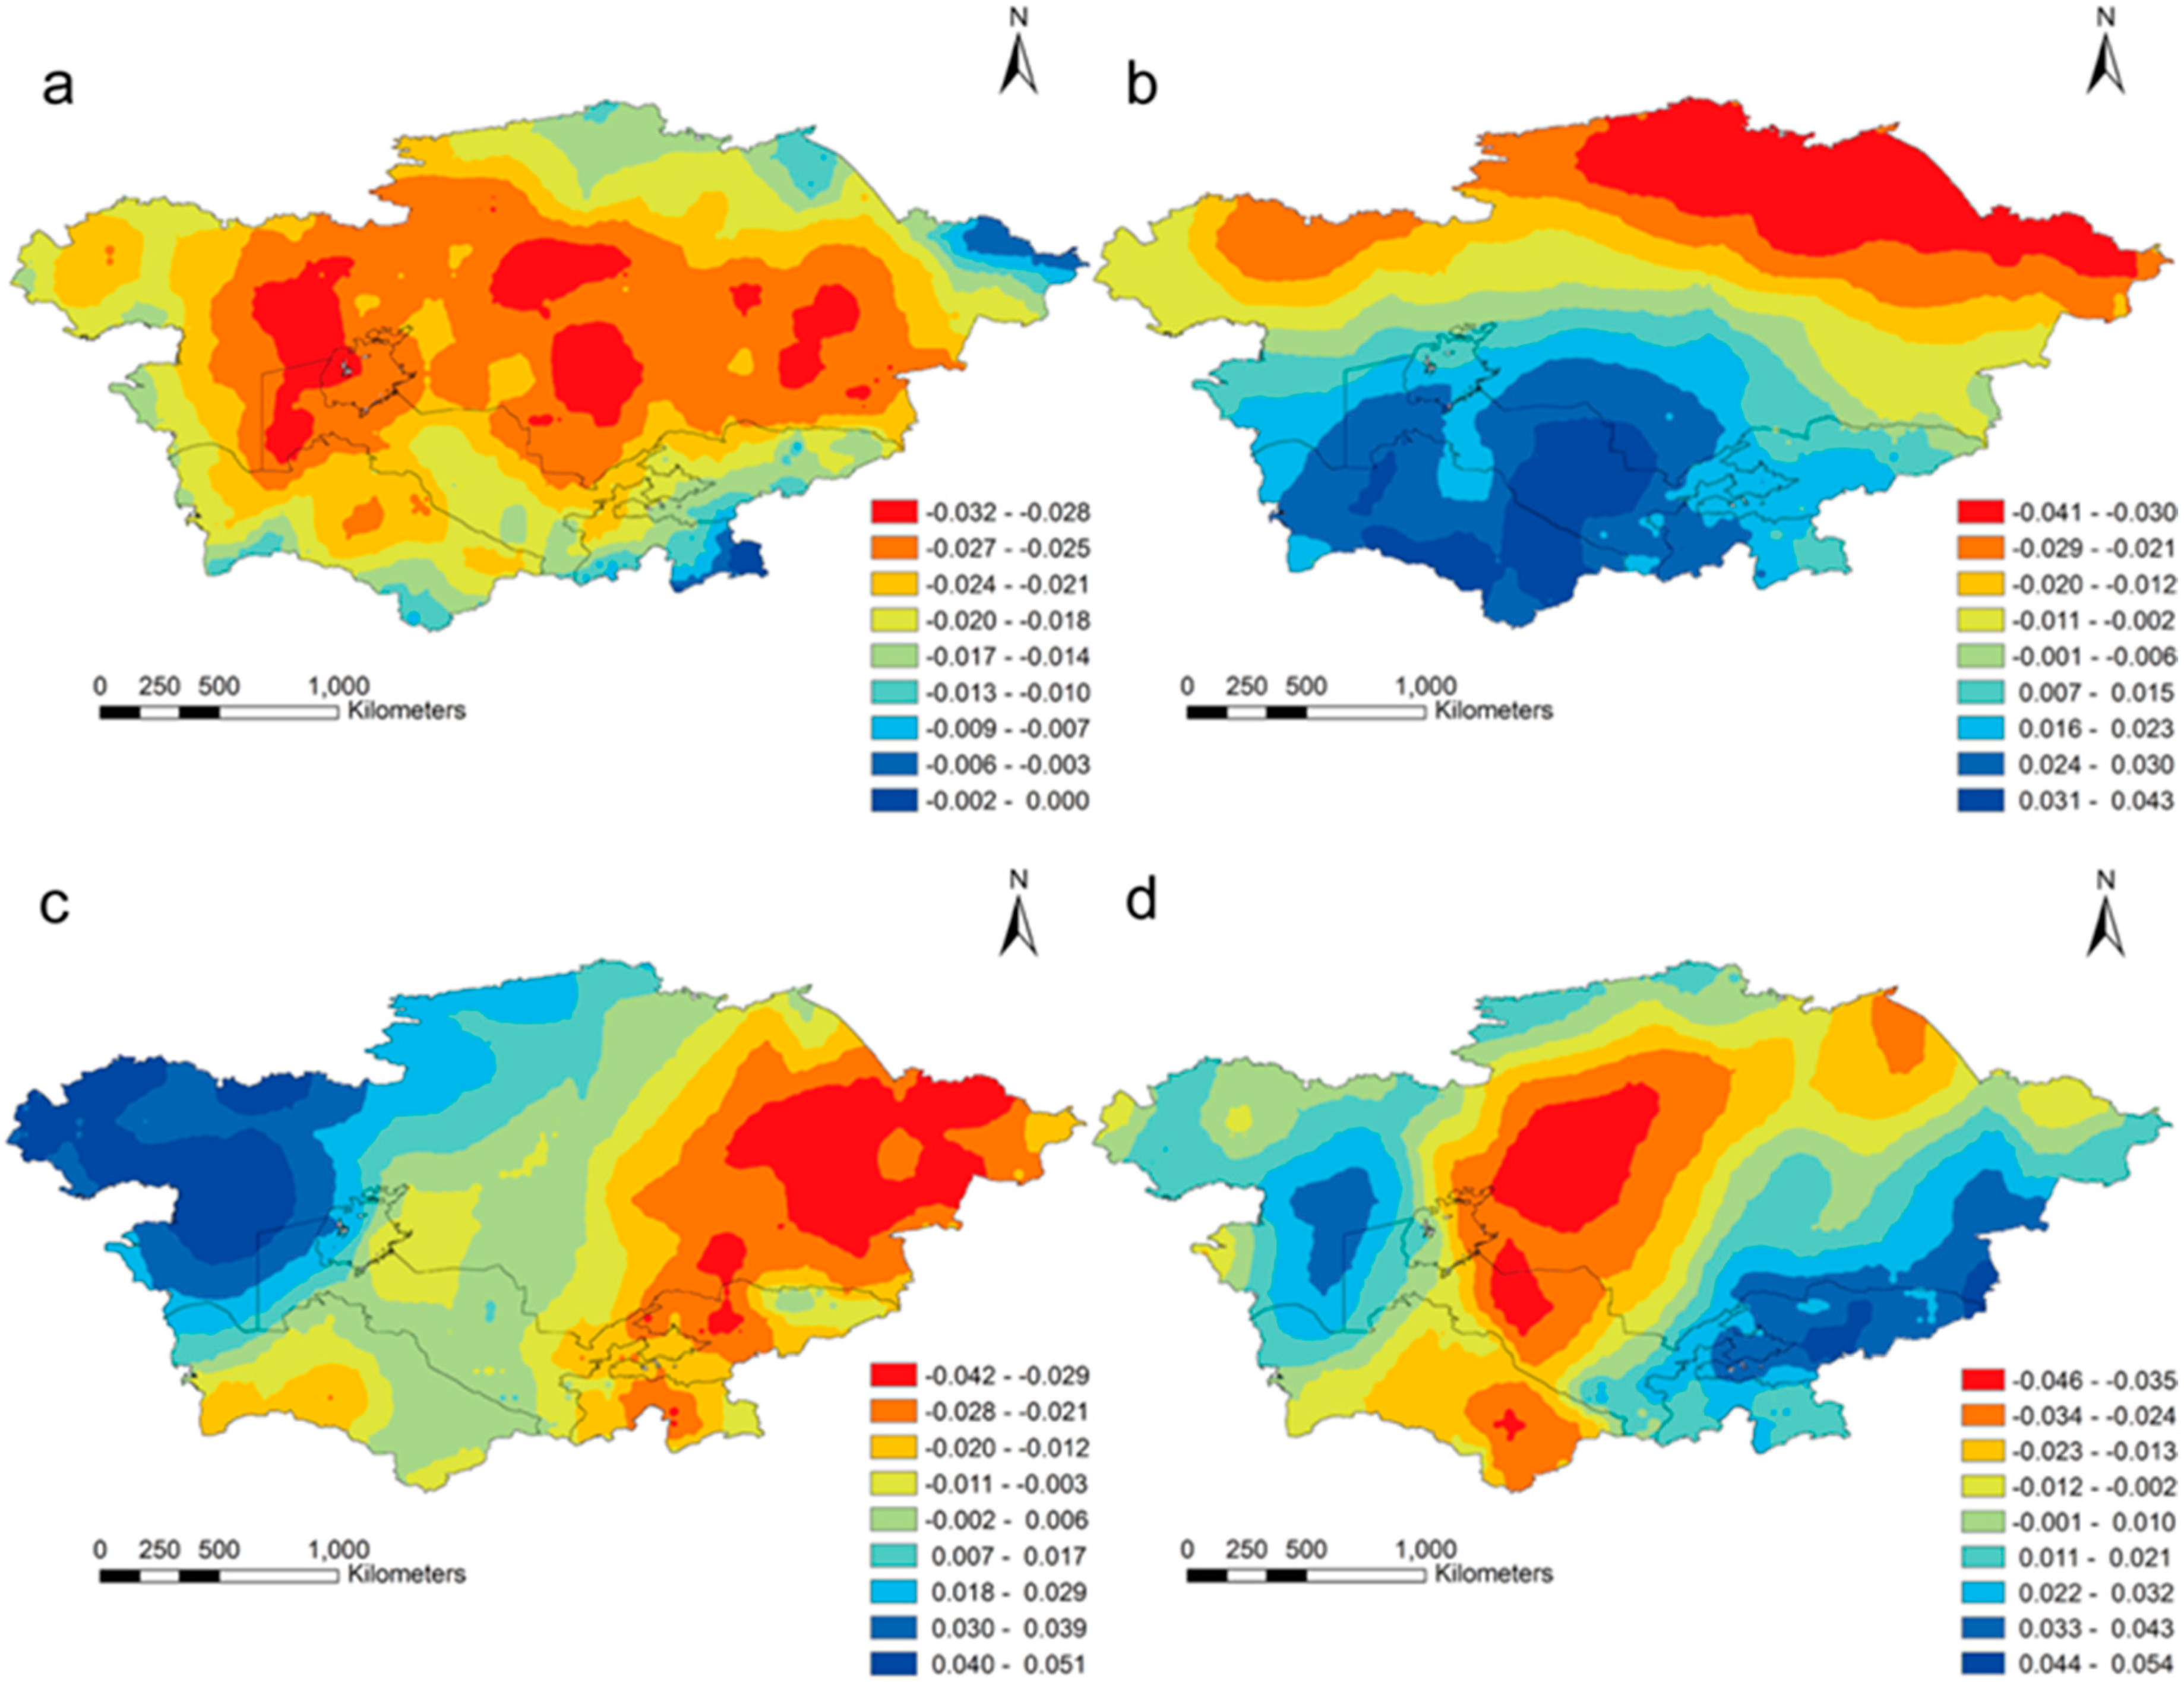
Figure 6.
Spatial distribution of the first two feature vectors of seasonal SPEI expanded by PCA (the first EOF mode of spring (a), summer (c), autumn (e), and winter (g); and the second EOF mode of spring (b), summer (d), autumn (f), and winter (h)).
Figure 6.
Spatial distribution of the first two feature vectors of seasonal SPEI expanded by PCA (the first EOF mode of spring (a), summer (c), autumn (e), and winter (g); and the second EOF mode of spring (b), summer (d), autumn (f), and winter (h)).
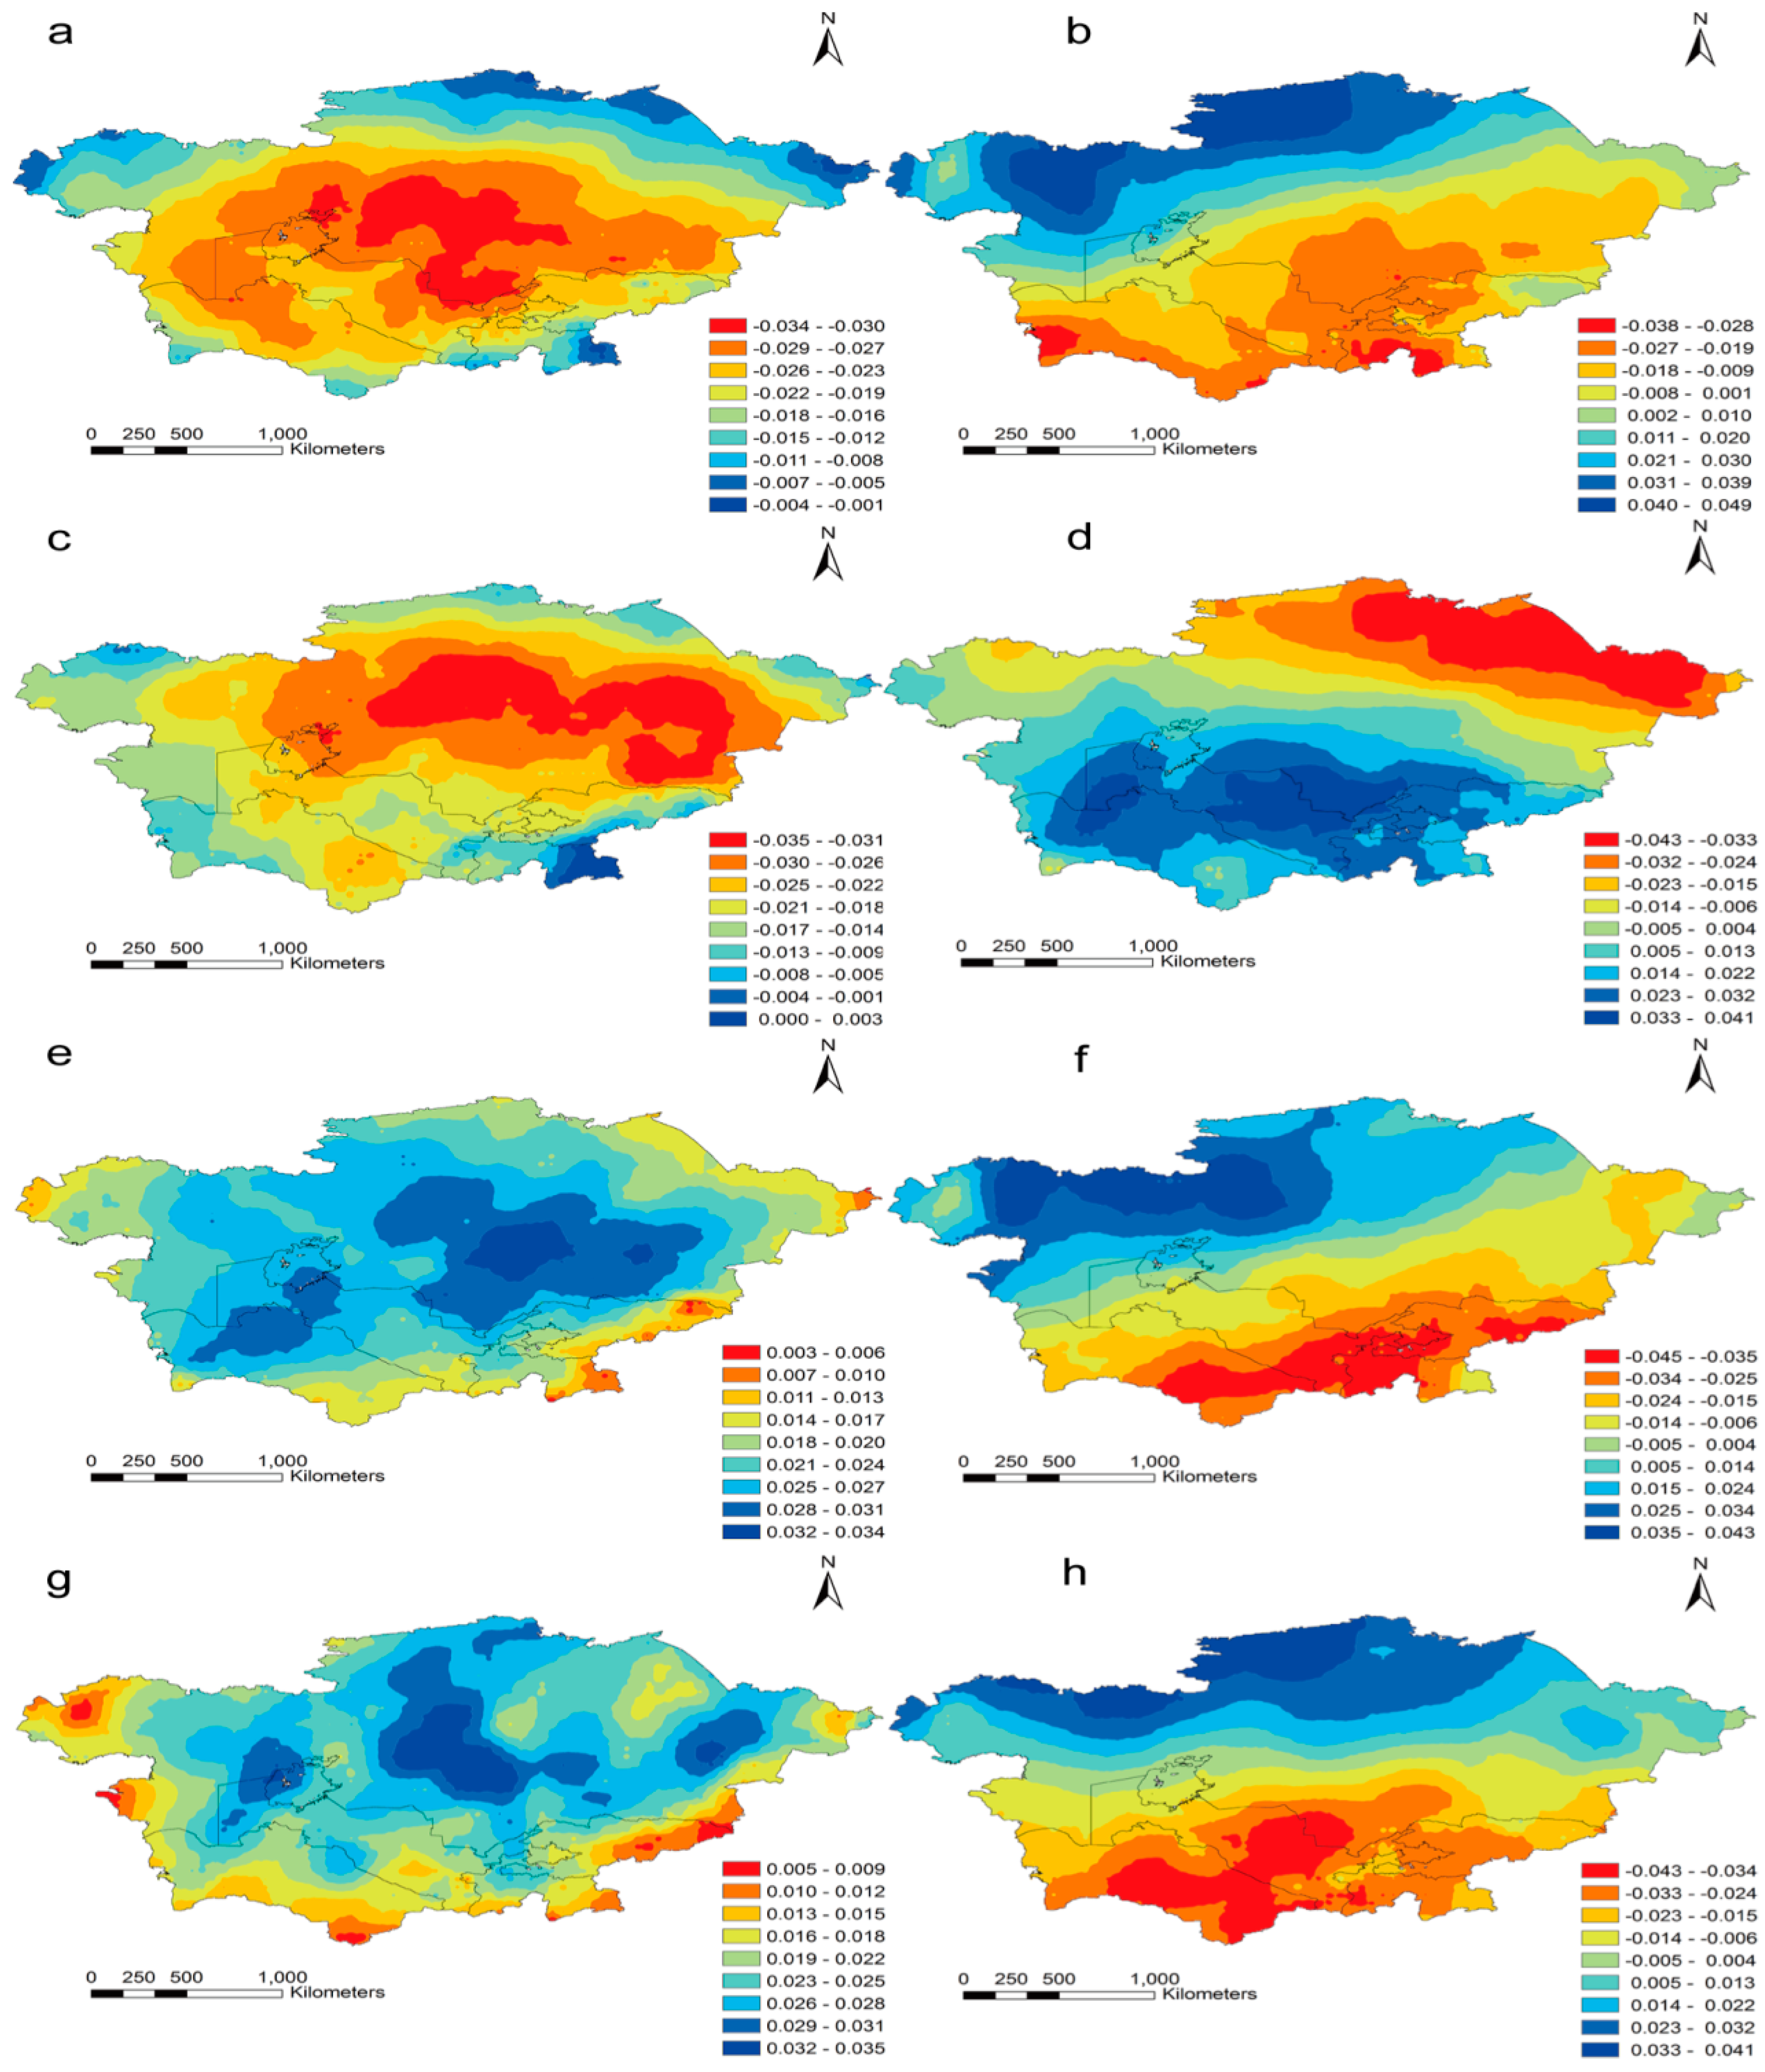
Figure 7.
Drought frequency calculated from monthly SPEI values at the 12-month time scale during the years 1930–2014 in Central Asia.
Figure 7.
Drought frequency calculated from monthly SPEI values at the 12-month time scale during the years 1930–2014 in Central Asia.


Table 1.
Classification of drought calculated by the SPEI.
| Categories of Drought | SPEI |
|---|---|
| Extreme drought | SPEI ≤ −2.0 |
| Severe drought | −1.99 < SPEI < −1.5 |
| Moderate drought | −1.49 < SPEI ≤ −1.0 |
| Mild drought | −0.99 < SPEI ≤ −0.5 |
| Non-drought | SPEI ≥ −0 |
© 2018 by the authors. Licensee MDPI, Basel, Switzerland. This article is an open access article distributed under the terms and conditions of the Creative Commons Attribution (CC BY) license (http://creativecommons.org/licenses/by/4.0/).
Share and Cite
MDPI and ACS Style
Ta, Z.; Yu, R.; Chen, X.; Mu, G.; Guo, Y. Analysis of the Spatio-Temporal Patterns of Dry and Wet Conditions in Central Asia. Atmosphere 2018, 9, 7. https://doi.org/10.3390/atmos9010007
AMA Style
Ta Z, Yu R, Chen X, Mu G, Guo Y. Analysis of the Spatio-Temporal Patterns of Dry and Wet Conditions in Central Asia. Atmosphere. 2018; 9(1):7. https://doi.org/10.3390/atmos9010007
Chicago/Turabian StyleTa, Zhijie, Ruide Yu, Xi Chen, Guijin Mu, and Yanfei Guo. 2018. "Analysis of the Spatio-Temporal Patterns of Dry and Wet Conditions in Central Asia" Atmosphere 9, no. 1: 7. https://doi.org/10.3390/atmos9010007
Note that from the first issue of 2016, this journal uses article numbers instead of page numbers. See further details here.