A Two-Year Study on Mercury Fluxes from the Soil under Different Vegetation Cover in a Subtropical Region, South China


1
College of Resources and Environment, Southwest University, Chongqing 400715, China
2
School of Environment, Jinan University, Guangzhou 510632, China
3
Chongqing Key Laboratory of Agricultural Resources and Environment, Chongqing 400715, China
4
Research Center of Bioenergy and Bioremediation, Southwest University, Chongqing 400715, China
*
Author to whom correspondence should be addressed.
Atmosphere 2018, 9(1), 30; https://doi.org/10.3390/atmos9010030
Submission received: 28 October 2017
/
Revised: 12 January 2018
/
Accepted: 15 January 2018
/
Published: 19 January 2018
(This article belongs to the Special Issue Atmospheric Metal Pollution)
Abstract
:In order to reveal the mercury (Hg) emission and exchange characteristics at the soil–air interface under different vegetation cover types, the evergreen broad-leaf forest, shrub forest, grass, and bare lands of Simian Mountain National Nature Reserve were selected as the sampling sites. The gaseous elementary mercury (GEM) fluxes at the soil–air interface under the four vegetation covers were continuously monitored for two years, and the effect of temperature and solar radiation on GEM fluxes were also investigated. Results showed that the GEM fluxes at the soil–air interface under different vegetation cover types had significant difference (p < 0.05). The bare land had the maximum GEM flux (15.32 ± 10.44 ng·m−2·h−1), followed by grass land (14.73 ± 18.84 ng·m−2·h−1), and shrub forest (12.83 ± 10.22 ng·m−2·h−1), and the evergreen broad-leaf forest had the lowest value (11.23 ± 11.13 ng·m−2·h−1). The GEM fluxes at the soil–air interface under different vegetation cover types showed similar regularity in seasonal variation, which mean that the GEM fluxes in summer were higher than that in winter. In addition, the GEM fluxes at the soil–air interface under the four vegetation covers in Mt. Simian had obvious diurnal variations.
1. Introduction
Mercury (Hg) is a highly toxic environmental pollutant that can be absorbed directly through the human body, or through a series of biological enrichment into the human body indirectly through the food chain, constituting a hazard to humans [1]. Mercury can reside in the atmosphere for up to one year [2,3], and can travel for a long distance along with atmospheric circulation, resulting in global Hg contamination [4,5]. Therefore, research on the sources of Hg is essential for understanding the biogeochemical cycle of Hg globally [6,7]. The terrestrial ecosystem is an important site for the biogeochemical cycle of Hg, among which the forest ecosystem is the largest one. The forest ecosystem is generally regarded as the active sink of Hg. It is known that forest soil is the main place for Hg storage in forest ecosystems. On one hand, forest soil can emit Hg to the atmosphere by diffusion. On the other hand, the Hg discharged from the soil can be returned back to the soil by the atmospheric dry and wet deposition [8,9]. The diffusion of Hg from the soil and canopy are less than the amount of Hg deposition, which is why forests are considered a sink for Hg. Therefore, the environmental behavior of Hg in the forest ecosystem is an important component of the global Hg cycle [10,11,12].
Southwest China has the second largest forest coverage in China, among which the subtropical forest, the most representative forest type in southwest china, accounts for 75 percent. A number of studies have been done on Hg pollution in the forest ecosystem [13,14,15,16,17]; however, research on the gaseous elemental mercury (GEM) fluxes at the soil–air interface under different vegetation cover types in the same climatic belt is rare. The final fate and release amount of atmospheric Hg in the forest soils under different vegetation cover types have not been well quantified since their physicochemical properties and coverage rates are different. Therefore, it is indispensable to research GEM fluxes in a complete ecosystem so as to better understand the long-term retention, delay, or release processes of Hg in the terrestrial ecosystem. Therefore, the main objectives of this research are: (1) to analyze the GEM fluxes at the soil–air interface under four different vegetation cover types in a subtropical forest, south China, which is helpful to understand the regional interception effect of different vegetation on atmospheric Hg; and (2) to measure and interpret the bi-directional fluxes of GEM from the soil under different vegetation cover types in four seasons.
2. Materials and Methods
2.1. Site Description
The sampling site (106°4′ E, 28°6′ N) is located on Luosi Island, the central region of Da Honghai, Simian Mountain National Nature Reserve, Jiangjin district, Chongqing. Mt. Simian is dominated by the humid monsoon climate, with an altitude of 1440 m. The annual rainfall is 1112–1522 mm, with the rain season from June to September. The annual average temperature is around 13.7 °C, with maximum and minimum values occurring in August (31.5 °C) and January (−5.5 °C) respectively. The dominant vegetation in the sampling site includes Pinus massoniana, Gordonia acuminata, Cryptomeria fortune, and Castanopsis fargesii, with the forest canopy density of around 0.91. Various vegetation in the sampling site is well-preserved, without being substantially altered from a natural state by human activity. The bare stratum in the sampling site is a huge primitive layer composed of brick red fine sandstone and siltstone, and the soil is yellow brown soil.
2.2. Measurement of GEM Fluxes
GEM fluxes and concentrations at the soil–air interface were measured by the dynamic flux chamber (DFC) coupled with an automated Hg vapor analyzer Tekran 2537X (Tekran Instruments Corporation, Toronto, ON, Canada) [18].
Monitoring was conducted every quarter at the soils under four typical subtropical vegetation covers for continuous two years from 2013 to 2015. Each time, the monitoring was seven days for each type of vegetable cover. The DFC is made of quartz glass with a thickness of 5 mm due to its transparency to light and potential to achieve low chamber blanks. The bottom size of the DFC is 20 × 40 cm, bottom area is 0.08 m2, and volume is 0.00628 m3.
For the installation of the DFC, a proper site was selected in each land use pattern and the DFC was sealed slightly by the monitoring soils. Before the measurement, the outlet was connected directly with the Tekran 2537X mercury analyzer (Tekran Instruments Corporation, Toronto, ON, Canada) by Teflon tube (Figure S1). Three inlets (radius 0.1 cm) on the other side of the analyzer connected directly with the air. The air is pumped into the DFC through the inlets, and then goes into the Tekran 2537X mercury analyzer through the outlet. During sampling, the flow rate was 5 L·min−1. The flux was alternately detected every 10 min in and outside of the DFC. The average flux was calculated by Equation (1) [19,20]
where F is the GEM flux (ng·m−2·h−1), and Cin, Cout, and C0 are GEM concentrations of the DFC inlet, outlet and blank value in ng·m−3 respectively. Q is the flushing flow rate through the chamber in L·min−1. A is the bottom area of the DFC (m2). The positive and negative F calculated from Equation (1) represent the GEM flux.
F = (Cout − Cin − C0)·Q/A
2.3. Measurement of the Blank
A series of treatments to the DFC were conducted before use each time. The DFC was first immersed into 0.1 mol·L−1 HNO3 solution for at least 24 h, washed by large amounts of running water, rinsed by deionized water, and then dried with an air blower. The blank of the DFC was obtained by measuring GEM flux over a clean Teflon™ sheet in the field at both the beginning and end of each measurement date at each site. The calibration of Tekran 2537X mercury analyzer was done by the self-inspection procedure of the equipment at an interval of 25 h (1 h for system self-inspection) with relative standard deviation lower than 5%.
2.4. Measurement of Atmospheric Parameters
The GEM concentrations were measured in the field by the Tekran 2537X mercury analyzer. The intensity of illumination was measured by TES digital illuminance meter (TES Electrical Electronic Corp., Taipei, Taiwan). The temperature of soils was measured by DeltaTRAK® FlashCheck Portable Thermometer (DeltaTRAK, Pleasanton, CA, USA). Atmospheric pressure, air humidity, wind speed, and air temperature were measured by Kestrel® 4000 Pocket Weather tracker (Nielsen-Kellerman, Boothwyn, PA, USA).
2.5. Statistical Analysis
One-way analysis of variance (ANOVA) was used to assess the statistical significance of the data, with p-values of <0.05 being considered statistically significant. Integrated correlation coefficient analysis between environmental parameters (temperature and solar radiation) and the GEM fluxes were conducted, with a statistical probability of p < 0.05. Origin 8.0 was used for drawing.
3. Results and Discussion
3.1. Seasonal Dynamics of GEM Fluxes at the Soil–Air Interface under Different Vegetation Cover Types
The GEM fluxes at the soil–air interface under different vegetation cover types in Mt. Simian had significant difference (p < 0.05). It was highest in bare soil (15.32 ± 10.44 ng·m−2·h−1), followed by grass land (14.73 ± 18.84 ng·m−2·h−1), and shrub forest (12.83 ± 10.22 ng·m−2·h−1), and lowest in the evergreen broad-leaf forest (11.23 ± 11.13 ng·m−2·h−1) (Table 1, Figure 1). Generally speaking, the GEM fluxes were all highest in summer, and lowest in winter for the four vegetation covers. The possible reasons were analyzed as follows. On one hand, the relatively higher temperatures (air and soil temperatures: 24.3 °C, 23.96 °C) and illumination intensities (8.00 Klux) in summer might lead to stronger photo-reduction reactions, resulting in increased release quantities of Hg accumulated in the forest soils. The increased accumulated Hg, together with the Hg released from the soil itself, were speculated to contribute to the high GEM fluxes [21,22]. While between December and February, the air and soil temperatures (5.34 °C, 5.70 °C) and solar radiation (2.89 Klux) reached a minimum, leading to weakened reduction process of inorganic Hg. In addition, Hg deposition was stronger in these months. The GEM flux at the soil–air interface was minimum in winter, and the accumulation of atmospheric Hg in the forest soil at this time was remarkably more obvious than the other three seasons. On the other hand, Hg emission was weakened in winter, and the Hg deposited into the soil surface increased probably due to human activities such as coal combustion [23]. In early spring, the temperature began to increase. The lower canopy densities and stronger photo-reduction activities in the early spring (16.62 ng·m−2·h−1) were presumed to be the main reasons for higher GEM fluxes in spring than that in fall and winter.
Comparing with the other forest stands worldwide, the GEM fluxes in the forest soils under the four vegetation covers in Mt. Simian were all higher than those non-polluted primordial forests (Table 2). The GEM fluxes at the soil–air interface of evergreen broad-leaf forest of Mt. Simian (11.23 ± 11.13 ng·m−2·h−1) was higher than that in the virgin forest of the Amazon basin (0.5–2 ng·m−2·h−1) [24], Rondônia, Brazil (0.8 ± 0.2 ng·m−2·h−1) [25], Adirondacks, USA (between −2.5 and 27.2 ng·m−2·h−1) [26], and Mt. Changbai, China (4.4 ± 28.74 ng·m−2·h−1) [27]. One of the reasons perhaps is that Mt. Simian is located in the southwest of China, belonging to a subtropical climate. The temperature is at a high level all the year round, causing strong photo reduction of Hg in the soil surface. Another possible reason might be from the elevated re-deposition of Hg emitted from cement production, metal smelting, as well as coal burning, etc. In addition, Chongqing’s special geographical and climate characteristics makes Hg in the atmosphere difficult to migrate and diffuse. In contrast, this part of GEM is easy to deposit into the forest soil due to a series of wet and dry deposition processes. If comparing with cities and Hg-polluted areas, the GEM fluxes in the forest soils under the four vegetation covers in Mt. Simian were remarkably lower than that in Hg-mining areas (33–3638 ng·m−2·h−1) [28] and grassland (between 718 ± 1517 ng·m−2·h−1 and 4115 ± 1512 ng·m−2·h−1) [29] of Guiyang. The reason perhaps is due to human activities of production and livelihood, such as coal combustion and metallurgy, which contribute to elevated GEM concentrations in the Hg-polluted areas [2,23,30]. Comparing it with our previous research at Mt. Simian, we found that GEM fluxes at the soil–air interface under the evergreen broad-leaf forest was similar with that under mixed broad-leaf and conifer forest at Mt. Simian [31]. The GEM fluxes at the soil–air interface under the other three vegetation covers were higher than those under the evergreen broad-leaf forest, but they were significantly lower than those reports from Hg-polluted areas (p < 0.05) [32,33].
3.2. Effect of Temperature and Solar Radiation on the GEM Flux under Different Vegetation Cover Types
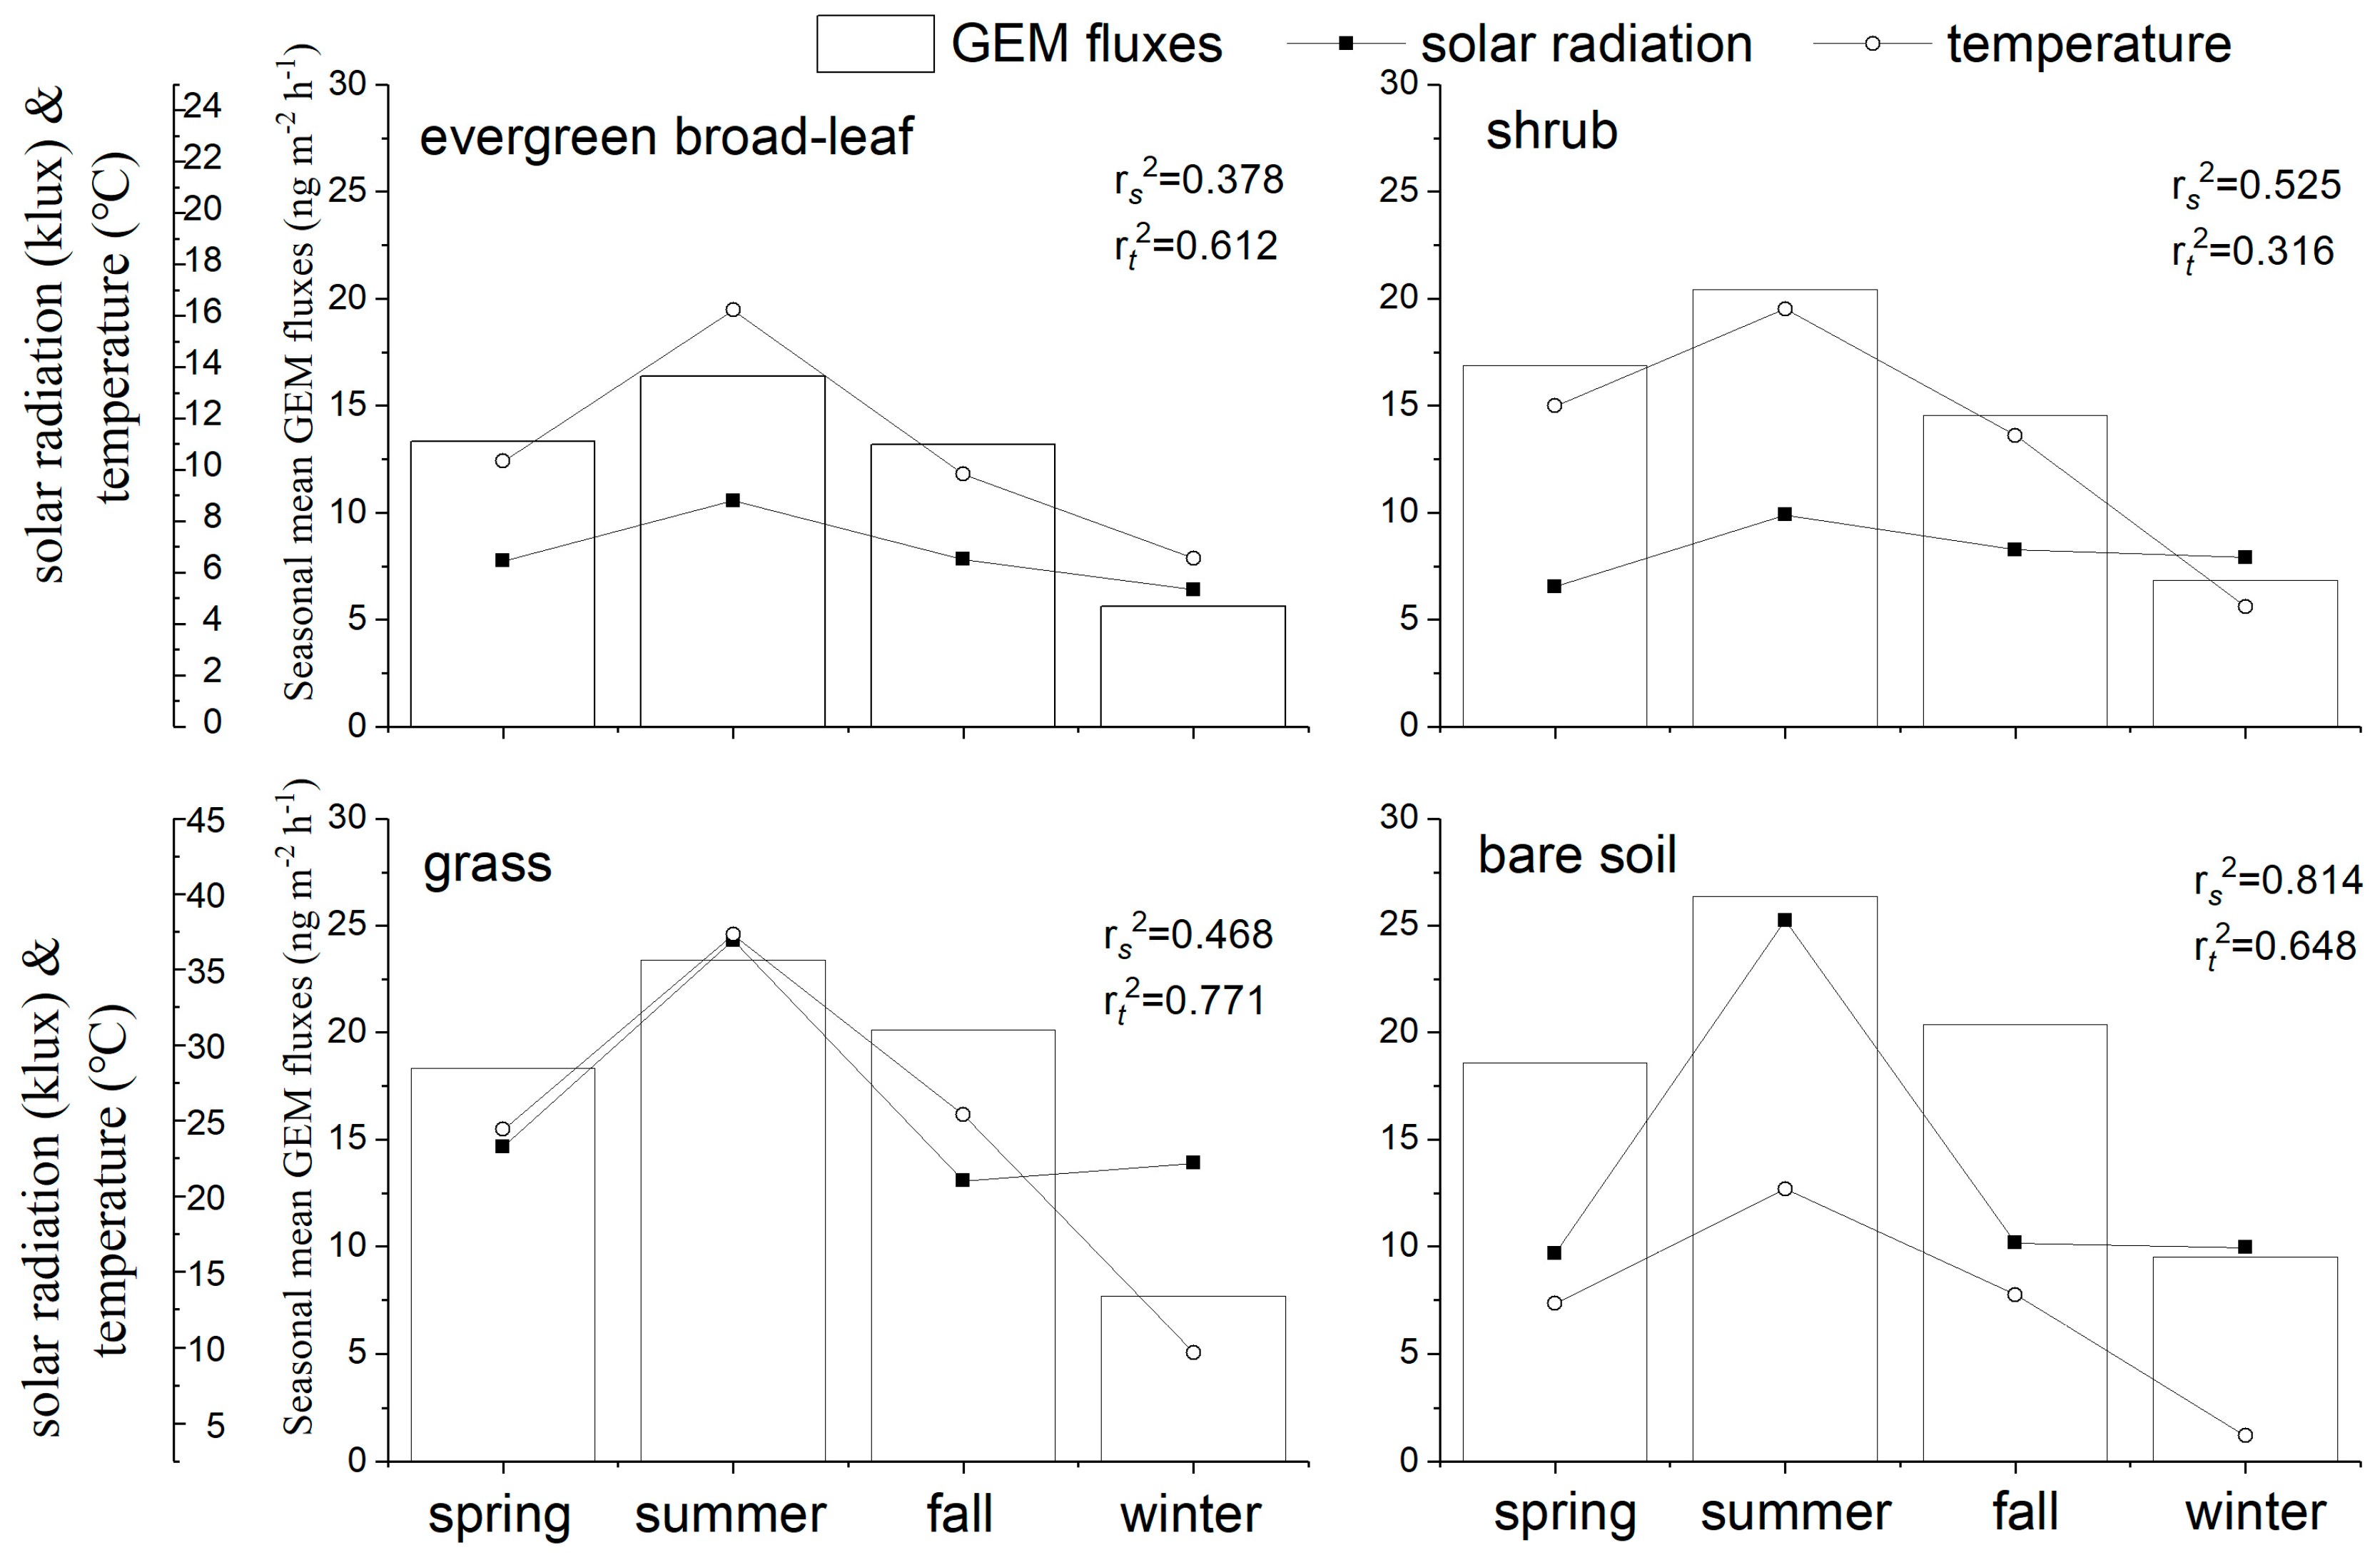
Figure 2 showed the effect of temperature and solar radiation on seasonal dynamics of GEM flux at the soil–air interface under different vegetation cover types of Mt. Simian. As we mentioned above, the GEM flux was highest in summer and lowest in winter for the four vegetation covers. Generally speaking, the soil under evergreen broad-leaf, shrub and grass were characterized by Hg release to the atmosphere. Negative values of the GEM flux occurred at low temperature, which indicated that the deposition of Hg overpassed its emission at several time periods. Correlation analysis showed that the GEM fluxes were significantly (p < 0.01 or p < 0.05) and positively related to temperature and solar radiation [38,39]. As we know that temperature controlled GEM fluxes, which was well confirmed by GEM fluxes in the bare soil (rt2 = 0.648). Moreover, the GEM flux in the bare soil was also effected by solar radiation (rs2 = 0.814). It was noted that the correlation between GEM fluxes and temperature in the evergreen broad-leaf forest field (rt2 = 0.612) was not as obvious as that in the bare soil (rt2 = 0.648) or the grassland (rt2 = 0.771), which indicated that there might be other reasons controlling GEM fluxes in the evergreen broad-leaf forest field. The effect of temperature on GEM fluxes in the four seasons was similar to solar radiation. This was probably affected by three factors. First, the daily average temperature in summer of the sampling site were as high as 26.1–30.5 °C, and the solar radiation in summer were as large as 17.94–1.53 Klux. Mercury in the soil was more likely to evaporate into the air in the summer than in winter. Secondly, the higher temperature and solar radiation led to higher soil temperature, which enhanced the activities and Hg reduction capacities of microorganisms in the soil. Therefore, more Hg2+ could probably be reduced into Hg (0) and enter into the atmosphere. Finally, the deposition of Hg to the soil in winter was very clear. This part of Hg was mainly released to the air in the next spring due to the smaller canopy density and warmer temperature in spring. So the GEM flux in spring was higher than those in fall and winter, especially in the soils under evergreen broad-leaf, shrub, and grass.
Among the four different vegetation cover types, the bare soil in summer had the highest GEM flux (22.48 ± 8.72 ng·m−2·h−1) (Figure 2). The reason perhaps was that vegetation cover in the bare soil was very low, so the soil was exposed directly to the sunlight in summer, which made Hg2+ easier to reduce into Hg (0) and then release from the expensed air space into the air [40]. While for the soils under evergreen broad-leaf, shrub, and grass, the vegetation cover weakened photo-reduction and biological reduction reactions caused by the direct transmission of sunlight to the soil, and slowed down the formation and release rates of Hg (0) [41,42]. For the evergreen broad-leaf forest, the soil was covered by litterfall in winter, which could directly absorb Hg emitted from the soil, or fixed Hg by forming complexes with the humus in the decaying litterfall [18,43,44]. In this way, Hg emission from the soil was prevented, and the soil–air interface under the evergreen broad-leaf forest reached minimum in winter. In addition, the increased microbial activities or abiotic reaction rates, etc. due to the warmer conditions in summer might also contribute to the higher GEM fluxes in warm season, which needs to be researched in the future.
3.3. Diurnal Variation Characteristics of GEM Flux under Different Vegetation Cover Types
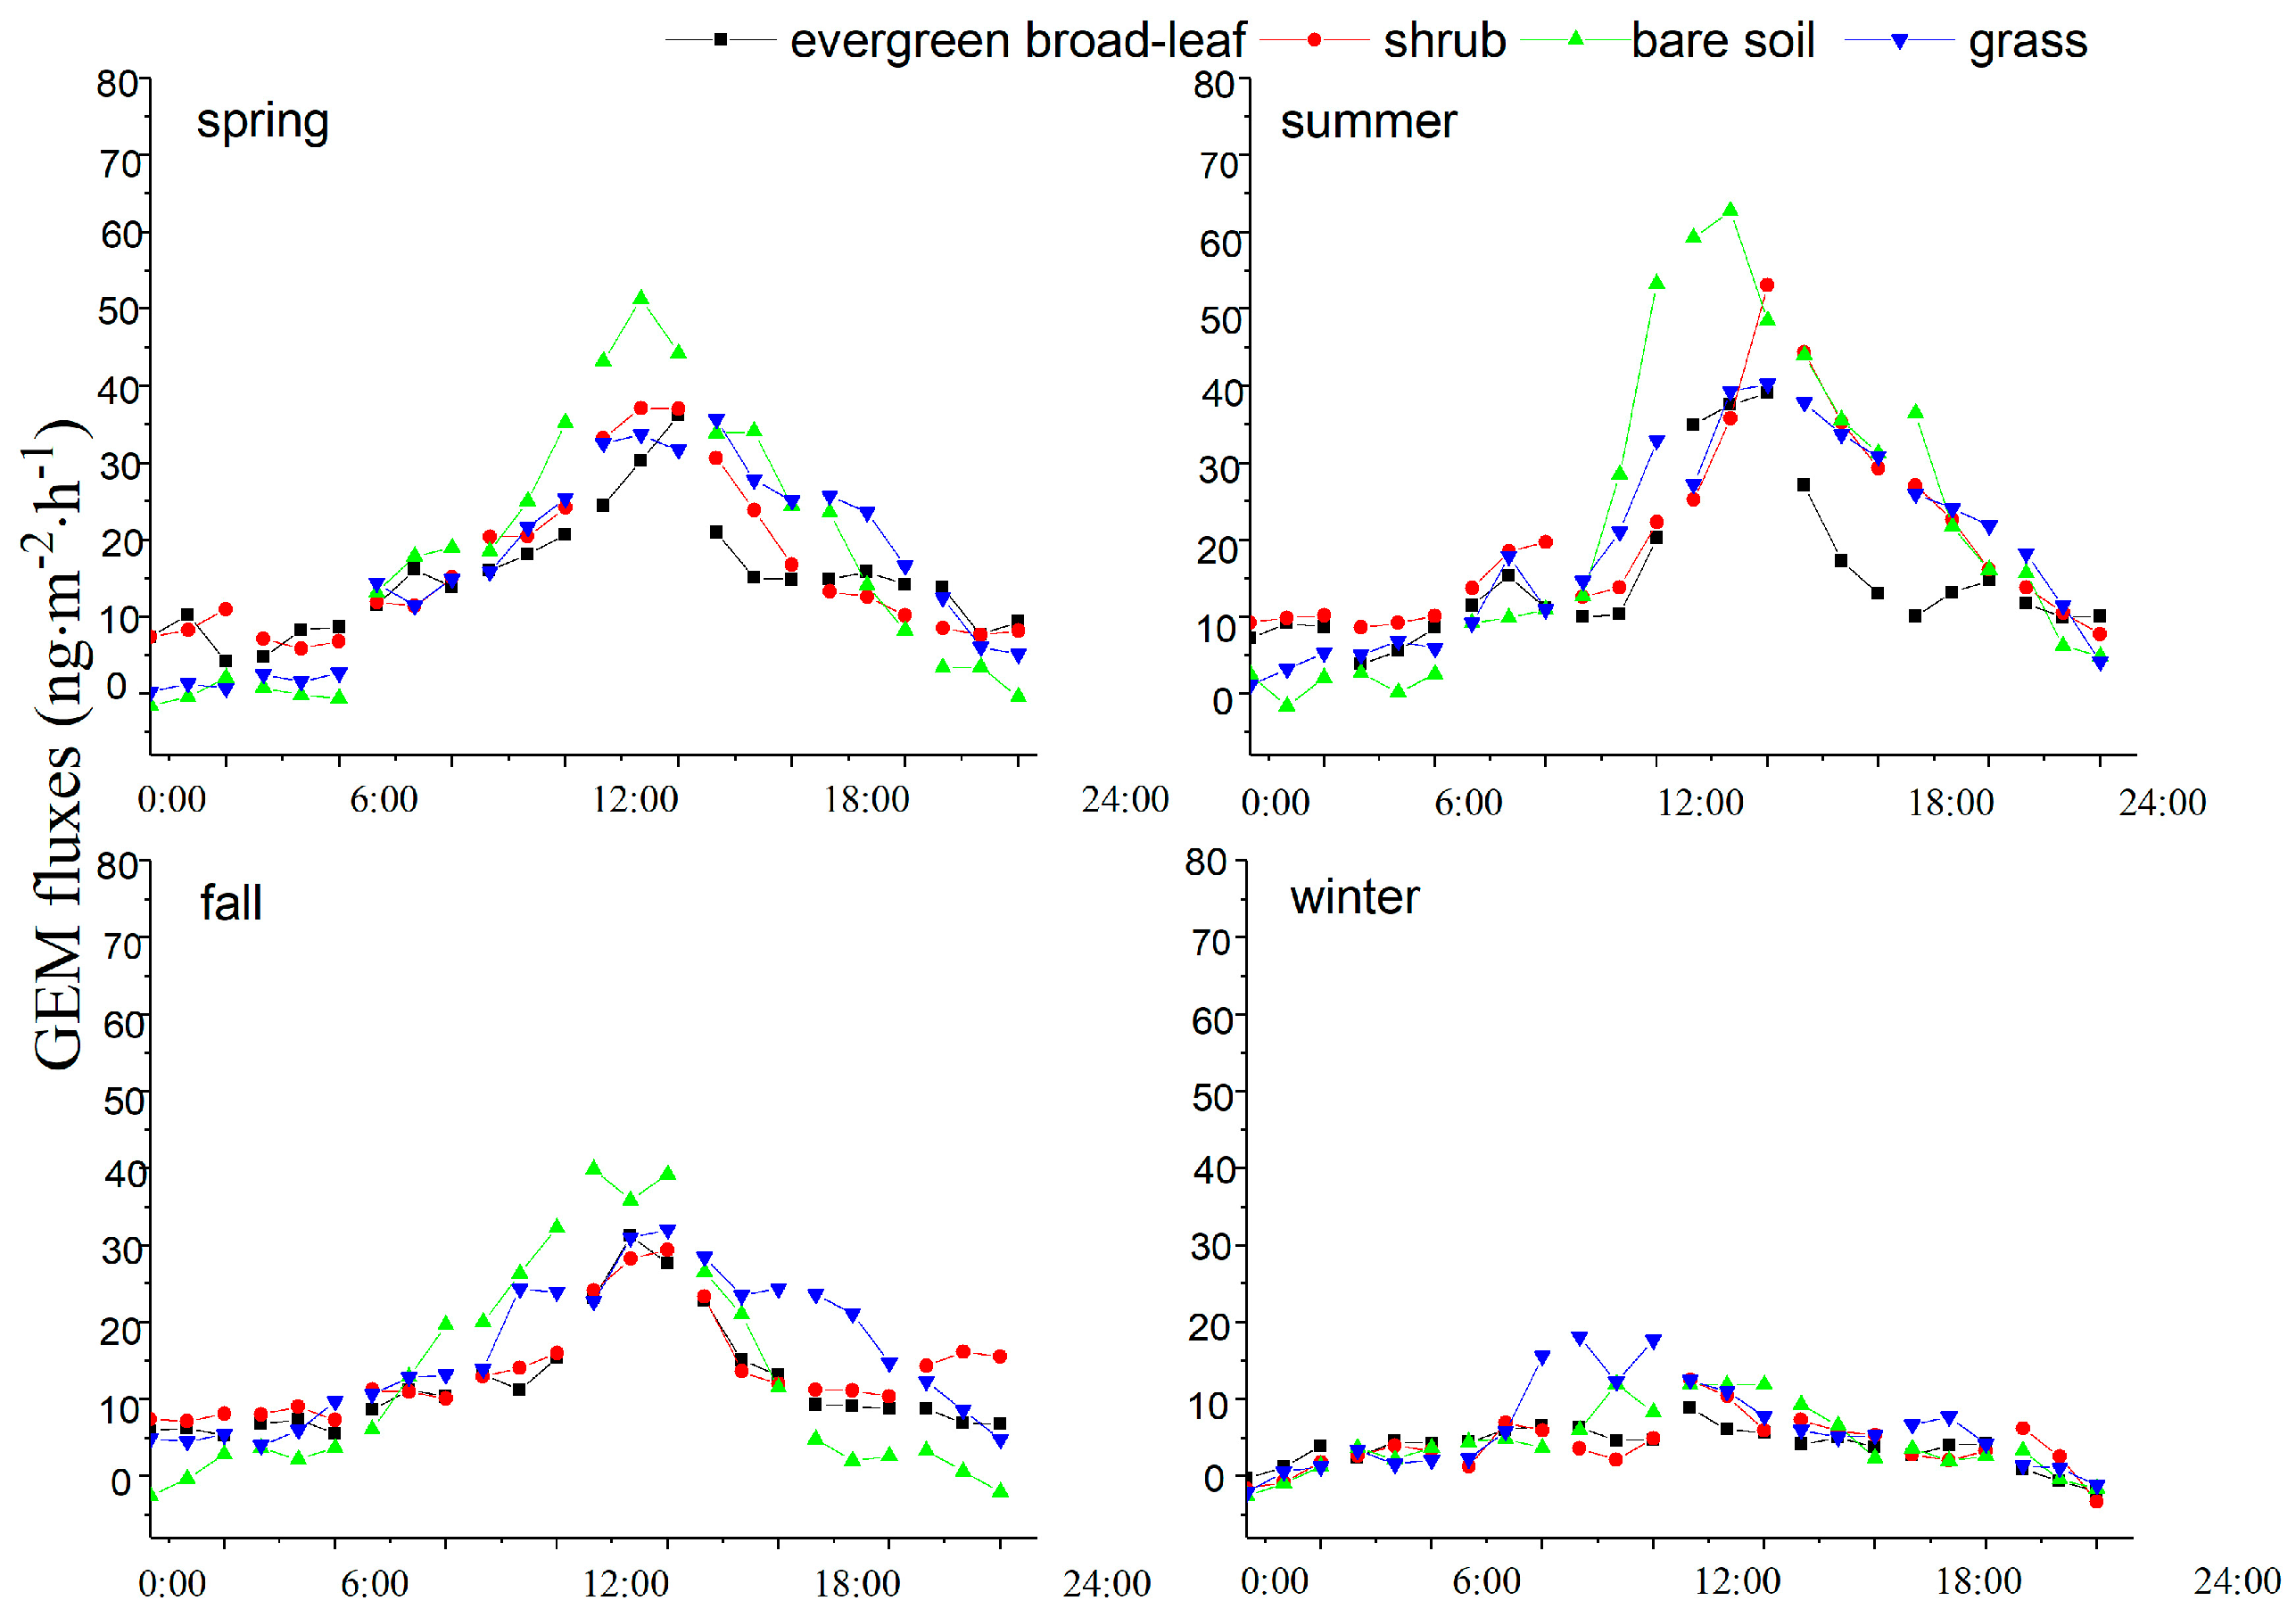
The diurnal variation of GEM fluxes at the soil–air interface under the four vegetation covers was shown in Figure 3. Results showed that the GEM flux under the four vegetation covers began to sharply increase after sunrise. The maximum values appeared at noon (12 p.m. to 2 p.m.), and the minimum values occurred at night before sunrise (11 p.m. to 3 a.m.) (Figure 3). The GEM flux at the soil–air interface of the four vegetation covers at daytime were higher than those at night. The GEM flux at the soil–air interface of the four vegetation covers in the whole seasons were assumed to release Hg from the soil, with Hg deposition only occurring in several time periods of winter. The maximum value of GEM flux happened after noon in the bare soil in spring, summer and fall. While in winter, the highest value of GEM flux under the grass (17.56 ng·m−2·h−1) occurred in the morning (6 a.m. to 12 p.m.). The lowest values at the soil–air interface under the four vegetation covers all occurred around 12 a.m., and the release rates were similar among the four vegetation covers. The regression analysis showed that GEM fluxes had a strong relationship with solar radiation (R2 = 0.90 for bare soil and R2 = 0.84 for grass land). It was found that there was a direct relationship between the diurnal variation of GEM flux at the soil–air interface and vegetation types in the four seasons.
When comparing the daily variation of GEM fluxes in soils under the four vegetation covers in the four seasons, GEM fluxes of the bare land increased sharply in spring and summer (Figure 3), with maximum values occurring at 12 p.m. to 1 a.m. While the GEM fluxes of the other three vegetation covers subsequently reached similar maximum values. The GEM fluxes in the bare land firstly began to decrease at the afternoon, throughout the night until the wee hours. Negative values of the GEM fluxes occurred in the bare land (spring and summer) and grass land (spring), which might because of the hysteresis of sunlight. When the light appeared for a period of time, the ambient temperature gradually increased, which led to the enhancement of photo reduction and microbial activities. At this time, the GEM flux began to increase. The light lag phenomenon in the grass land was not obvious because of the low vegetation coverage of the grass land. The temperature became the decisive factor for GEM flux after sunset under this condition. The GEM flux at the soil with less vegetation cover was negative, because the interception from the vegetation and heat preservation effect from the litter were almost absent [26].
4. Conclusions
The GEM flux at the soil–air interface was highest in the bare soil, and lowest in the evergreen broad-leaf forest. The GEM flux at the soil–air interface under different vegetation cover types were all significantly higher than the natural emission from remote areas of North America [24]. Both Hg release and deposition existed at the soil–air interface under the four vegetation covers, but Hg release from the soil was the dominant feature. The GEM flux at the soil–air interface had remarkable seasonal variations among the four vegetation covers of Mt. Simian, namely it was mainly higher in summer than that in winter. This might result from the effect of illumination intensity, temperature, and different characteristics of the four vegetation covers. Moreover, there was a significant diurnal variation of GEM flux at the soil–air interface under different vegetation cover types of Mt. Simian. Namely, the GEM fluxes were quickly enhanced after sunrise in one day due to the increase of illumination density and ambient temperature. Subsequently, the GEM fluxes decreased slowly in the afternoon with the mitigation of illumination density and temperature, reaching minimum in early morning. The daily variation coefficient of GEM fluxes was highest in the bare land and lowest in the evergreen broad-leaf forest, which was probably due to the different buffering capacities of the four vegetation covers to environmental changes. The blocking of sunlight by vegetation at daytime and the cover of foliage and litterfall at night could contribute to the preservation of temperature and humidity. Various environmental factors changed slightly for the evergreen broad-leaf forest, which meant that it was less affected by the environment. So the GEM fluxes at the soil–air interface under the evergreen broad-leaf forest had little changes, while the GEM fluxes at the soil–air interface in the bare land and grass land had greater changes.
There were seasonal and diurnal variations of the GEM fluxes at the soil–air interface under different vegetation cover types, which might closely relate to different environmental factors resulting from vegetation cover types, forest structure, as well as the growth characteristics of the vegetation. The fluctuation of GEM fluxes in the less covered soil (p < 0.01 for bare soil and grass land) were generally higher than those under luxuriant vegetation (p < 0.05 for evergreen broad-leaf and shrub forest), which indicated that once the vegetation was destroyed, the release and deposition of Hg at the soil–air interface lacked the inhibition and interception effect. Under this condition, the emission of Hg in the soil occurred more easily in this kind of soil.
Supplementary Materials
The following are available online at www.mdpi.com/2073-4433/9/1/30/s1, Figure S1: A diagram of GEM fluxes between soil-air interface.
Acknowledgments
This work was supported by the National Natural Science Foundation of China (no. 41573105, 41671469, and 41603098), National Basic Research Program of China (973 Program, no. 2013CB430000), Guangzhou Key Laboratory of Environmental Exposure and Health (no. GZKLEEHXX), and the Natural Science Foundation of Chongqing City (no. cstc2016jcyjA0461).
Author Contributions
Ming Ma and Dingyong Wang conceived and designed the experiments; Tao Sun and Ming Ma performed the experiments; Ming Ma analyzed the data; Ming Ma and Hongxia Du wrote the paper.
Conflicts of Interest
The authors declare no conflict of interest.
References
- Mergler, D.; Anderson, H.A.; Chan, L.H.M.; Mahaffey, K.R.; Murray, M.; Sakamoto, M.; Stern, A.H. Methylmercury exposure and health effects in humans—A worldwide concern. Ambio 2007, 36, 3–11. [Google Scholar] [CrossRef]
- Eckley, C.S.; Blanchard, P.; Mclennan, D.; Mintz, R.; Sekela, M. Soil–Air mercury flux near a large industrial emission source before and after closure (Flin Flon, Manitoba, Canada). Environ. Sci. Technol. 2015, 49, 9750–9757. [Google Scholar] [CrossRef] [PubMed]
- Driscoll, C.T.; Mason, R.P.; Chan, H.M.; Jacob, D.J.; Pirrone, N. Mercury as a global pollutant: Sources, pathways, and effects. Environ. Sci. Technol. 2013, 47, 4967–4983. [Google Scholar] [CrossRef] [PubMed]
- Poissant, L.; Pilote, M.; Constant, P.; Zhang, H. A year of continuous measurements of three atmospheric mercury species (GEM, RGM and HGP) in southern Québec, Canada. Atmos. Environ. 2005, 39, 1275–1287. [Google Scholar] [CrossRef]
- Bergan, T.; Gallardo, L.; Rodhe, H. Mercury in the global troposphere: A three-dimensional model study. Atmos. Environ. 1999, 33, 1575–1585. [Google Scholar] [CrossRef]
- Schroeder, W.H.; Munthe, J. Atmospheric mercury an overview. Atmos. Environ. 1998, 32, 809–822. [Google Scholar] [CrossRef]
- Agnan, Y.; Le Dantec, T.; Moore, C.W.; Edwards, G.C.; Obrist, D. New constraints on terrestrial surface-atmosphere fluxes of gaseous elemental mercury using a global database. Environ. Sci. Technol. 2016, 50, 507–524. [Google Scholar] [CrossRef] [PubMed]
- Silva-Filho, E.V.; Machado, W.; Oliveira, R.R.; Sella, S.M.; Lacerda, L.D. Mercury deposition through litterfall in an Atlantic forest at Ilha Grande, southeast Brazil. Chemosphere 2006, 65, 2477–2484. [Google Scholar] [CrossRef] [PubMed]
- Blackwell, B.D.; Driscoll, C.T.; Maxwell, J.A.; Holsen, T.M. Changing climate alters inputs and pathways of mercury deposition to forested ecosystems. Biogeochemistry 2014, 119, 215–228. [Google Scholar] [CrossRef]
- Smith, W.H. Air pollution and forests: Interactions between air contaminants and forest ecosystems. For. Ecol. Manag. 1983, 9, 410–412. [Google Scholar]
- Jiskra, M.; Wiederhold, J.G.; Skyllberg, U.; Kronberg, R.M.; Hajdas, I.; Kretzschmar, R. Mercury deposition and re-emission pathways in boreal forest soils investigated with Hg isotope signatures. Environ. Sci. Technol. 2015, 49, 7188–7196. [Google Scholar] [CrossRef] [PubMed]
- Zhang, L.M.; Wright, L.P.; Blanchard, P. A review of current knowledge concerning dry deposition of atmospheric mercury. Atmos. Environ. 2009, 43, 5853–5864. [Google Scholar] [CrossRef]
- Zhang, L.; Blanchard, P.; Gay, D.A.; Prestbo, E.M.; Risch, M.R.; Johnson, D.; Narayan, J.; Zsolway, R.; Holsen, T.M.; Miller, E.K.; et al. Estimation of speciated and total mercury dry deposition at monitoring locations in eastern and central North America. Atmos. Chem. Phys. 2012, 12, 4327–4340. [Google Scholar] [CrossRef] [Green Version]
- Wan, Q.; Feng, X.; Zheng, W.; Lu, Y.J.; Han, S.; Xu, H. Seasonal variation of total gaseous mercury in changbai mountain area. Environ. Sci. 2008, 29, 296–299. (In Chinese) [Google Scholar]
- Demers, J.D.; Blum, J.D.; Zak, D.R. Mercury isotopes in a forested ecosystem: Implications for air-surface exchange dynamics and the global mercury cycle. Glob. Biogeochem. Cycles 2013, 27, 222–238. [Google Scholar] [CrossRef]
- Fu, X.W.; Feng, X.; Dong, Z.Q.; Yin, R.S.; Wang, J.X.; Yang, Z.R.; Zhang, H. Atmospheric gaseous elemental mercury (GEM) concentrations and mercury depositions at a high-altitude mountain peak in south China. Atmos. Chem. Phys. 2010, 10, 2425–2437. [Google Scholar] [CrossRef]
- Lu, Z.; Wang, X.; Zhang, Y.; Zhang, Y.J.; Luo, K.; Sha, L. High mercury accumulation in two subtropical evergreen forests in South China and potential determinants. J. Environ. Manag. 2016, 183, 488–496. [Google Scholar] [CrossRef] [PubMed]
- Eckley, C.S.; Tate, M.T.; Lin, C.J.; Gustin, M.; Dent, S.; Eagles-Smith, C.; Lutz, M.A.; Wickland, K.P.; Wang, B.; Gray, J.E.; et al. Surface-air mercury fluxes across western north America: A synthesis of spatial trends and controlling variables. Sci. Total Environ. 2016, 568, 651–665. [Google Scholar] [CrossRef] [PubMed]
- Lindberg, S.E.; Price, J.L. Airborne emissions of mercury from municipal landfill Operations: A short-term measurement study in Florida. J. Air Waste Manag. 1999, 49, 520–532. [Google Scholar] [CrossRef] [PubMed]
- Zhang, H.; Lindberg, S.E.; Marsik, F.J. Mercury air/surface exchange kinetics of background soils of the Tahquamenon river in the Michigan upper peninsula. Water Air Soil Pollut. 2001, 126, 151–169. [Google Scholar] [CrossRef]
- Carpi, A.; Lindberg, S.E. Application of a TeflonTM dynamic flux chamber for quantifying soil mercury flux: Tests and results over background soil. Atmos. Environ. 1998, 32, 873–882. [Google Scholar] [CrossRef]
- Gustin, M.S.; Biester, H.; Kim, C.S. Investigation of the light-enhanced emission of mercury from naturally enriched substrates. Atmos. Environ. 2002, 36, 3241–3254. [Google Scholar] [CrossRef]
- Zhang, L.; Wang, S.; Meng, Y.; Hao, J. Influence of mercury and chlorine content of coal on mercury emissions from coal-fired power plants in China. Environ. Sci. Technol. 2012, 46, 6385–6392. [Google Scholar] [CrossRef] [PubMed]
- Pacyna, E.G.; Pacyna, J.M.; Steenhuisen, F.; Wilson, S. Global anthropogenic mercury emission inventory for 2000. Atmos. Environ. 2006, 40, 4048–4063. [Google Scholar] [CrossRef]
- Almeida, M.D.; Marins, R.V.; Paraquetti, H.H.M.; Bastos, W.R.; Lacerda, L.D. Mercury degassing from forested and open field soils in Rondônia, Western Amazon, Brazil. Chemosphere 2009, 77, 60–66. [Google Scholar] [CrossRef] [PubMed]
- Choi, H.; Thomas, M.H. Gaseous mercury fluxes from the forest floor of the Adirondacks. Environ. Pollut. 2009, 157, 592–600. [Google Scholar] [CrossRef] [PubMed]
- Wang, D.; He, L.; Shi, X.; Wei, S.; Feng, X. Release flux of mercury from different environmental surfaces in Chongqing, China. Chemosphere 2006, 64, 1845–1854. [Google Scholar] [CrossRef] [PubMed]
- Wang, S.; Feng, X.; Qiu, G.; Shang, L.; Li, P.; Wei, Z. Mercury concentrations and air/soil fluxes in Wuchuan mercury mining district, Guizhou province, China. Atmos. Environ. 2007, 41, 5984–5993. [Google Scholar] [CrossRef]
- Fu, X.; Feng, X.; Wang, S.; Qiu, G.; Li, P. Mercury flux rate of two types of grasslands in Guiyang. Res. Environ. Sci. 2007, 20, 33–37. (In Chinese) [Google Scholar]
- Wang, Y.; Peng, Y.; Wang, D.; Zhang, C. Wet deposition fluxes of total mercury and methylmercury in core urban areas, Chongqing, China. Atmos. Environ. 2014, 92, 87–96. [Google Scholar] [CrossRef]
- Ma, M.; Wang, D.; Shen, Y.; Sun, R.; Huang, L. Mercury fluxes from conifer-broadleaf forested field in central subtropical forest zone. Environ. Sci. 2014, 35, 85–92. (In Chinese) [Google Scholar]
- Wang, S.; Feng, X.; Qiu, G.; Fu, X.; Wei, Z. Characteristics of mercury exchange flux between soil and air in the heavily air-polluted area, eastern Guizhou, China. Atmos. Environ. 2007, 41, 5584–5594. [Google Scholar] [CrossRef]
- Walters, N.E.; Glassford, S.M.; Heyst, B.J.V. Mercury flux from naturally enriched bare soils during simulated cold weather cycling. Atmos. Environ. 2016, 129, 134–141. [Google Scholar] [CrossRef]
- Artaxo, P.; de Campos, R.C.; Fernandes, E.T.; Martins, J.V.; Xiao, Z.F.; Lindqvist, O.; Fernandez-Jimenez, M.T. Large scale mercury and trace element measurements in the Amazon basin. Atmos. Environ. 2000, 34, 4085–4096. [Google Scholar] [CrossRef]
- Lindberg, S.E.; Stratton, W.J. Atmospheric mercury speciation: Concentrations and behavior of reactive gaseous mercury in ambient air. Environ. Sci. Technol. 1998, 32, 49–57. [Google Scholar] [CrossRef]
- Ferrara, R.; Maserti, B.E.; Andersson, M.; Edner, H.; Ragnarson, P.; Svanberg, S. Mercury degassing rate from mineralized areas in the Mediterranean Basin. Water Air Soil Pollut. 1997, 93, 59–66. [Google Scholar] [CrossRef]
- Rinklebe, J.; During, A.; Overesch, M.; Du, L.G.; Wennrich, R.; Stärk, H.J.; Mothes, S. Dynamics of mercury fluxes and their controlling factors in large Hg-polluted floodplain areas. Environ. Pollut. 2010, 158, 308–318. [Google Scholar] [CrossRef] [PubMed]
- Sizmur, T.; Mcarthur, G.; Risk, D.; Tordon, R.; O’Driscoll, N.J. Gaseous mercury flux from salt marshes is mediated by solar radiation and temperature. Atmos. Environ. 2017, 153, 117–125. [Google Scholar] [CrossRef]
- Ma, M.; Wang, D.; Sun, R.; Shen, Y.; Huang, L. Gaseous mercury emissions from subtropical forested and open field soils in a national nature reserve, southwest china. Atmos. Environ. 2013, 64, 116–123. [Google Scholar] [CrossRef]
- Fu, X.; Feng, X.; Zhu, W.; Rothenberg, S.; Yao, H.; Zhang, H. Elevated atmospheric deposition and dynamics of mercury in a remote upland forest of southwestern china. Environ. Pollut. 2010, 158, 2324–2333. [Google Scholar] [CrossRef] [PubMed]
- Wang, Z.; Zhang, X.; Xiao, J.; Ci, Z.; Yu, P. Mercury fluxes and pools in three subtropical forested catchments, southwest China. Environ. Pollut. 2009, 157, 801–808. [Google Scholar] [CrossRef] [PubMed]
- Howard, D.; Edwards, G.C. Mercury fluxes over an Australian alpine grassland and observation of nocturnal atmospheric mercury depletion events. Atmos. Chem. Phys. 2017, 1–24. [Google Scholar] [CrossRef]
- Niu, Z.; Zhang, X.; Wang, Z.; Ci, Z. Mercury in leaf litter in typical suburban and urban broadleaf forests in China. J. Environ. Sci. 2011, 23, 2042–2048. [Google Scholar] [CrossRef]
- Sheehan, K.D.; Feranadez, I.J.; Kahl, J.S.; Amirbahman, A. Litterfall mercury in two forested watersheds at Acadia National Park, Maine, USA. Water Air Soil Pollut. 2006, 170, 249–264. [Google Scholar] [CrossRef]
Figure 1.
Seasonal variation of GEM fluxes at the soil–air interface of the four vegetation covers.
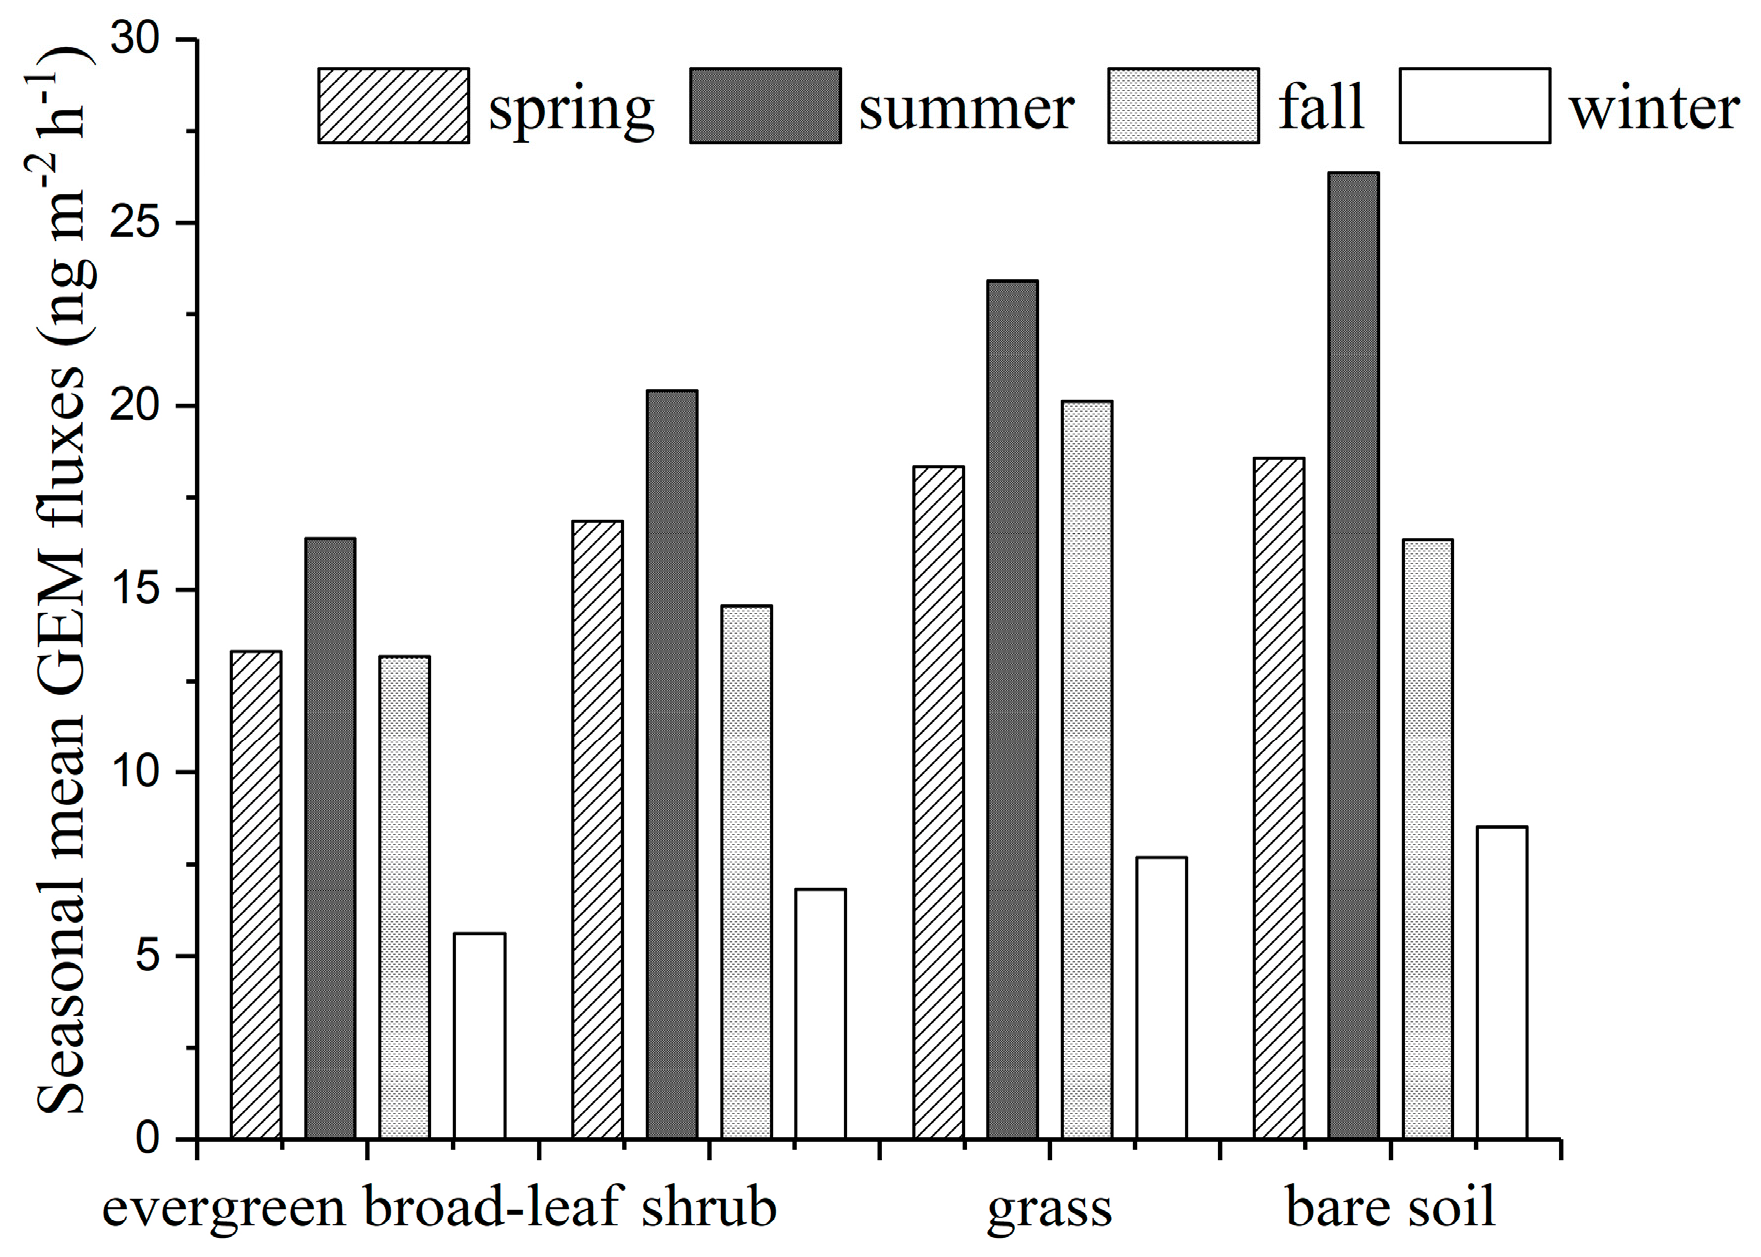
Figure 2.
Effect of air temperature and solar radiation on GEM fluxes at the soil–air interface of the four vegetation covers during four seasons. The “rs” and “rt” means the statistical r values for solar radiation and temperature respectively.
Figure 2.
Effect of air temperature and solar radiation on GEM fluxes at the soil–air interface of the four vegetation covers during four seasons. The “rs” and “rt” means the statistical r values for solar radiation and temperature respectively.

Figure 3.
Comparison of daily variation of GEM fluxes in soils under the four vegetation covers in the four seasons. This figure was based on the average data of each season (seven days) for two years.
Figure 3.
Comparison of daily variation of GEM fluxes in soils under the four vegetation covers in the four seasons. This figure was based on the average data of each season (seven days) for two years.


Table 1.
Statistical analysis of the GEM (gaseous elementary mercury) fluxes at the soil–air interface under different vegetation covers for two years.
Table 1.
Statistical analysis of the GEM (gaseous elementary mercury) fluxes at the soil–air interface under different vegetation covers for two years.
| Vegetation Covers | GEM Fluxes (ng·m−2·h−1) | |||||
|---|---|---|---|---|---|---|
| Mean | Median | Max | Min | SD | N | |
| Evergreen broad-leaf | 11.23 | 10.25 | 42.12 | −3.18 | 11.13 | 4048 |
| Shrub | 12.83 | 11.46 | 55.31 | −2.68 | 10.22 | 4022 |
| Grass | 14.73 | 18.20 | 82.01 | −4.02 | 18.84 | 4018 |
| Bare soil | 15.32 | 12.68 | 49.65 | −4.15 | 10.44 | 4057 |
Table 2.
The GEM fluxes at the soil–air interface reported in the literature.
| Location | Vegetation Covers | Hg Flux (ng m−3) | Literature |
|---|---|---|---|
| Global | natural emission | 0.7–1.1 | [34] |
| Sweden | forest field | −1.30–1.40 | [35] |
| Adirondacks, USA | temperate forest | −2.5–27.2 | [26] |
| Amazon Basin | primeval forest | 0.5–2 | [24] |
| Italy | forest field | −0.5–6 | [36] |
| Rondnia | forest field | 0.8 ± 0.2 | [25] |
| Elbe region | flood plain | 30.97 ± 30.77 | [37] |
| Wanshan China | mercury mine | 33–3638 | [28] |
| Guiyang China | glass land | (718 ± 1517)–(4115 ± 1512) | [29] |
| Changbai Mountain | temperate forest | 4.4 ± 28.74 | [27] |
| Mt. Simian | evergreen broad-leaf | 11.23 ±11.13 | this study |
| Mt. Simian | shrub | 12.83 ±10.22 | this study |
| Mt. Simian | grass | 14.73 ± 18.84 | this study |
| Mt. Simian | bare soil | 15.32 ± 10.44 | this study |
© 2018 by the authors. Licensee MDPI, Basel, Switzerland. This article is an open access article distributed under the terms and conditions of the Creative Commons Attribution (CC BY) license (http://creativecommons.org/licenses/by/4.0/).
Share and Cite
MDPI and ACS Style
Ma, M.; Sun, T.; Du, H.; Wang, D. A Two-Year Study on Mercury Fluxes from the Soil under Different Vegetation Cover in a Subtropical Region, South China. Atmosphere 2018, 9, 30. https://doi.org/10.3390/atmos9010030
AMA Style
Ma M, Sun T, Du H, Wang D. A Two-Year Study on Mercury Fluxes from the Soil under Different Vegetation Cover in a Subtropical Region, South China. Atmosphere. 2018; 9(1):30. https://doi.org/10.3390/atmos9010030
Chicago/Turabian StyleMa, Ming, Tao Sun, Hongxia Du, and Dingyong Wang. 2018. "A Two-Year Study on Mercury Fluxes from the Soil under Different Vegetation Cover in a Subtropical Region, South China" Atmosphere 9, no. 1: 30. https://doi.org/10.3390/atmos9010030
Note that from the first issue of 2016, this journal uses article numbers instead of page numbers. See further details here.