X-ray Observations at Gaisberg Tower
by
 , ,
, ,
Pasan Hettiarachchi
1,* ,
,
Vernon Cooray
1,*, 
Gerhard Diendorfer
2,
Hannes Pichler
2,
Joseph Dwyer
3 and
Mahbubur Rahman
1 1
Ångstrom Laboratory, Division of Electricity, Department of Engineering Sciences, Uppsala University, 534, SE-75121 Uppsala, Sweden
2
OVE Service GmbH, Kahlenberger Straße 2A, 1190 Vienna, Austria
3
Institute for the Study of Earth, Oceans, and Space, University of New Hampshire, Morse Hall 309, 8 College Road, Durham, NH 03824, USA
*
Authors to whom correspondence should be addressed.
Atmosphere 2018, 9(1), 20; https://doi.org/10.3390/atmos9010020
Submission received: 20 December 2017
/
Revised: 10 January 2018
/
Accepted: 11 January 2018
/
Published: 13 January 2018
Abstract
:We report the occurrence of X-rays at ground level due to cloud-to-ground flashes of upward-initiated lightning from Gaisberg Tower, in Austria, which is located at an altitude of 1300 m. This is the first observation of X-ray emissions from upward lightning from a tower top located at high altitude. Measurements were carried out using scintillation detectors installed close to the tower top in two phases from 2011 to 2015. X-rays were recorded in three subsequent strokes of three flashes out of the total of 108 flashes recorded in the system during both phases. In contrast to the observations from downward natural or triggered lightning, X-rays were observed only within 10 µs before the subsequent return stroke. This shows that X-rays were emitted when the dart leader was in the vicinity of the tower top, hence during the most intense phase of the dart leader. Both the detected energy and the fluence of X-rays are far lower compared to X-rays from downward natural or rocket-triggered lightning. In addition to the above 108 flashes, an interesting observation of X-rays produced by a nearby downward flash is also presented. The shorter length of dart-leader channels in Gaisberg is suggested as a possible cause of this apparently weaker X-ray production.
1. Introduction
If the electric field in air exceeds about 2.6 × 10⁷ V/m at atmospheric pressure (this critical field decreases with decreasing pressure), the energy gain per unit length from the electric field could become more significant than the energy loss over that length, in which case, the electrons continue to accelerate, gaining increasing amounts of energy [1]. Such electrons are called runaway electrons, and this mechanism is called cold-runaway or thermal-runaway in current literature. However, if seed electrons with energies in the order of a few tens of eV are available, an electric field of about 2.8 × 10⁵ V/m is sufficient to initiate the runaway condition [2]. Runaway electrons can reach relativistic speeds and, during collisions with atoms, they can generate more relativistic electrons, giving rise to an avalanche of them [3]. When these runaway electrons collide with air, they produce X-rays. C. R. T. Wilson, the Nobel laureate, hypothesised that the runaway mechanism may take place in thunderstorms where large electric fields that are capable of generating runaway electrons exist over a vast region of space [4].
In 1994, BATSE (Burst and Transient Source Experiment) onboard the Compton Gamma-ray Observatory detected bursts of X-ray flashes generated by thunderstorms [5]. They were called Terrestrial Gamma Ray Flashes (TGFs; in fact, being generated by accelerating electrons, they could also be called as X-rays). TGFs are intense bursts of X-rays lasting a few milliseconds or less [6]. The energy of the photons in these TGFs may extend up to about 100 MeV [7]. The only mechanism that can produce such radiation is the bremsstrahlung interaction of electrons with air. Theory (as put forward in [8]) has also been developed based on the electron runaway mechanism [9] to explain the production of X-rays by thunderstorms. Recently, satellite observations have even observed beams of positrons emanating from thunderclouds [10].
In 2004, Dwyer et al. [11] observed an X-ray flash generated by a thundercloud with photon energies as high as 10 MeV at ground level. The fluence of the photons with energies up to about 10 MeV in the flash was about one photon per cm2. Then, in 2009, Dwyer et al. [12] observed a TGF-like event with energy exceeding 20 MeV, which could be associated to a natural cloud to ground flash. Thundercloud-generated X-ray flashes have also been observed by other scientists at other geographical locations [13,14]. However, these can be categorised as long-duration-events as they can take the form of surges, and last up to many seconds.
The cloud-to-ground lightning flashes can be divided into three categories: natural downward lightning, artificially triggered lightning, and upward-initiated lightning. The first unambiguous observation of X-ray generation from lightning flashes was made by Moore [15], who recorded X-ray bursts associated with the stepped leaders of natural downward lightning flashes. Since then, X-ray bursts have been measured from natural cloud to ground lightning and triggered lightning in a series of experiments conducted at Camp Blanding in Florida since 2002 [16,17,18]. The bursts of X-rays observed at Camp Blanding appear to coincide with the stepping phase of the stepped leaders in natural lightning and the dart leader phase of both natural and triggered lightning. In a similar study carried out in Gainesville, Florida, since 2010, X-rays associated with subsequent-stroke leaders were found to be more intense compared to X-rays associated with first-stroke leaders [19]. X-rays appear in bursts of the order of a microsecond, with a typical total duration of about 1 ms or less, and carry energy up to the region of MeV. On the other hand, measurements of X-ray emissions from natural upward lightning are scarce. In a recent experiment, Montanyá et al. [20] took measurements of X-ray emissions from several upward lightning flashes from a tower located at 2500 m altitude. They could not detect X-ray emissions from the 12 upward-initiated negative ground flashes. However, in an experiment conducted in Japan in 2006, Yoshida et al. [21] reported the increase of radiation count rates of scintillation detectors, associated to upward lightning flashes striking a wind turbine. The increased count-rates of detectors appeared to coincide with upward leaders in this study.
From June 2011 to June 2015, we have been taking measurements of X-ray emissions associated with upward-initiated lightning from Gaisberg Tower at an altitude of about 1300 m in Austria. The results obtained show that the emission of X-rays is absent in the upward leader phase while it is scarce in the downward dart and dart-stepped leaders associated with upward lightning flashes. The details are presented below.
2. Experiment
The X-ray detection system was installed next to the 100 m tall Gaisberg radio transmission tower (GBT) at a small mountaintop called Gaisberg (1287 m above sea level) in Salzburg, Austria, and integrated with the Austrian Lightning Detection and Information System (ALDIS). The lightning current was measured by a shunt located at the air terminal on the top of GBT and was primarily used together with the X-ray detection system. Two separate fibre-optic links with different input ranges corresponding to low and high current thresholds (±2 kA and ±40 kA) were used to transmit the electrical output signal from the shunt to a measuring system in the nearby office building. This measuring system, once triggered by a minimum current flow, also sent a trigger signal to the X-ray measuring system.
The X-ray detector was located at a distance of 200 m from the top of the GBT on the rooftop of a structure containing a shielded EMC cabinet with the measurement equipment, as shown in Figure 1. The X-ray detector contained two NaI (Tl) scintillated detectors with one detector covered by a 2 mm lead attenuator housed inside an aluminium box of thickness 3.1 mm. The detector used is similar to the detector described in more detail in [18] by Saleh et al. Two fibre-optic links (of type Terahertz Technologies V-250, with a bandwidth of 10 MHz, and input voltage peak-to-peak threshold of 1 V) carried the detector signal to a transient recorder inside the EMC cabinet. The X-ray detection system (the detectors and fibre-optic transmitters) was powered by two 12 V batteries also housed inside the same aluminium box as the detectors. Because the system was completely unmanned, two batteries were used in such a way that while one battery was being charged by a battery charger, the other battery supplied the power to the system. Because of this arrangement, the detector system’s noise immunity was poor compared to a completely isolated detector system. X-ray detectors were calibrated using a 137Cs source prior to installations in each phase and a few more times during the measurements. X-ray measurement was carried out in two phases conducted from May 2011 to July 2012 and from December 2014 to May 2015. During phase 1, an 8-bit transient recorder of the type Yokogawa DL1640 was used to record the X-ray detector signals. During phase 2, a 12-bit isolated input transient recorder of the type Yokogawa SL1000 was used. This change of transient recorder, and also the changes carried out during phase 2 to reduce noise caused by the detector battery charging mechanism, improved the signal-to-noise ratio of the whole X-ray detection system. During both phases, a 20 MS/s sample rate was utilised in X-ray measurements. The propagation delays of fibre-optic cables and transceivers, and known instrument delays are taken into account in the results.
In addition to the current measurement at GBT, the vertical electric field, measured by a fast flat-plate antenna located at the same rooftop as the X-ray detector, was also used in some cases of this study.
3. Results
3.1. Identification Criteria of Ground-Level X-ray Pulse/Burst Due to Lightning Activity
In order to determine whether a ground level detection of X-rays is associated with lightning, several identification criteria could be utilised. This is necessary because a ground level X-ray detector also records X-rays and gamma-rays due to cosmic background radiation and also emissions from any other radioactive sources in the vicinity. In this study, the following criteria were considered.
- X-ray peaks within a few hundreds of microseconds before a tower recorded the return stroke (always utilised)
- X-ray peaks that correlate with the stepped, dart or dart-stepped leader process from E-field signatures (not utilised in some cases due to a lack of E-field data)
- X-ray bursts that coincide with other current peaks (always utilised)
- X-ray bursts that have multiple consecutive peaks, but do not coincide with E-field or current peaks (no such X-ray bursts were found).
3.2. Estimating Photon Energy from X-ray Waveforms
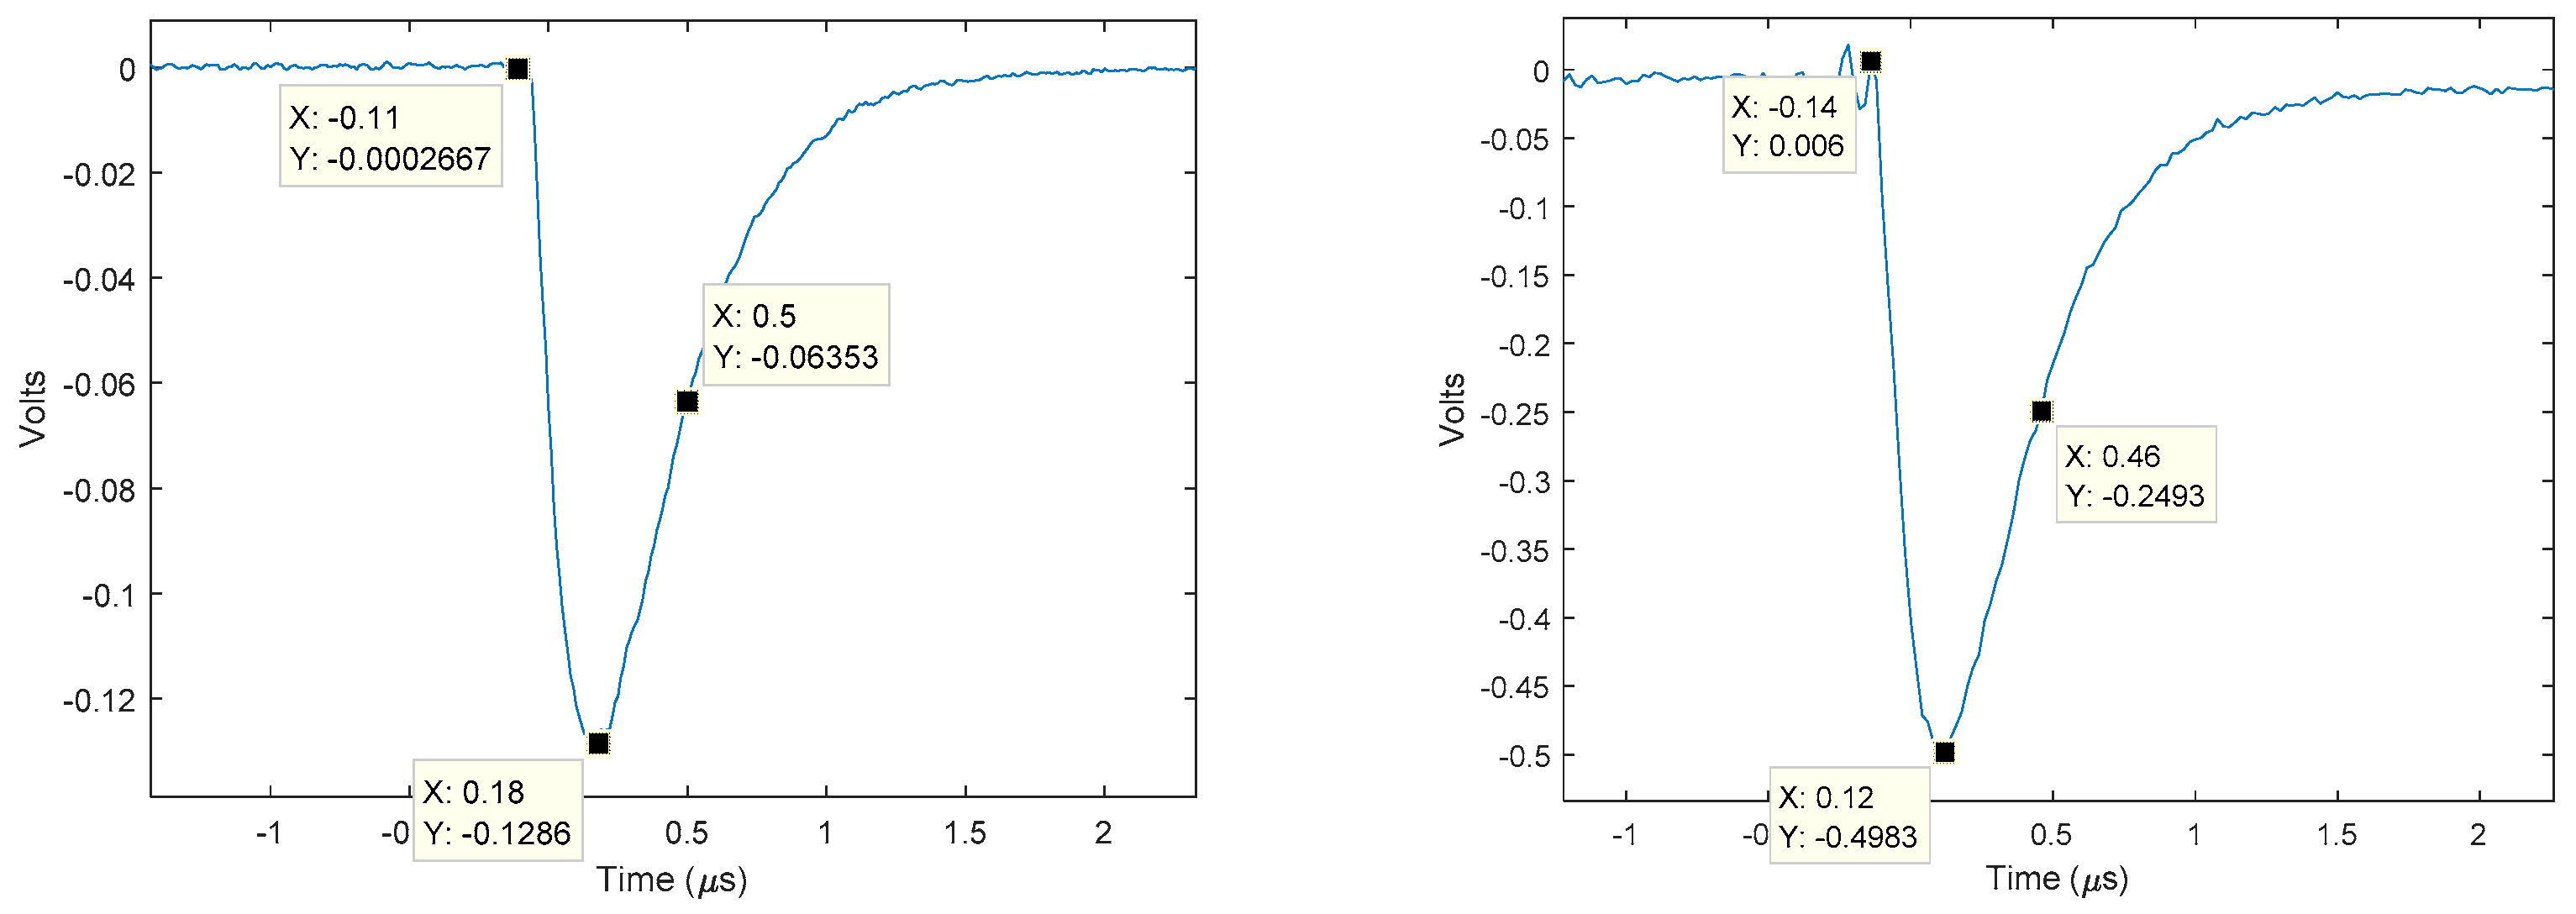
The energy of an X-ray event (single or multi-photon) was estimated by simply multiplying the peak voltage of each corresponding X-ray pulse by the calibration factor. It is important to mention that because of the limited 10 Mhz bandwidth of the fibre-optic links, the rise-time of NaI(Tl) detectors is prolonged. The response of such a detector setup to a multi-photon pile-up could be indistinguishable from a single photon response. Our experience of NaI(Tl) detector response in the laboratory [22,23], and other independent laboratory experiments using even much faster LaBr3 detectors [24] confirm that scintillator response for multi-photon pile-ups is difficult to detect just by observing detector response. Because of these reasons, energy obtained in this study from waveforms could be over-estimated. A calibration waveform (a single-photon event) and the detector response to a laboratory discharge (a multi-photon event) are shown in Figure 2.
3.3. Results of Phase 1
During this phase, a total of 85 flashes were recorded at Gaisberg Tower and current measurements are available from the GBT database at the ALDIS. There was only one flash identified as a downward flash. Out of the remaining 84 flashes, 65 flashes were of the type “initial continuing current (ICC) without return strokes”, called ICCOnly. Nineteen flashes were of the type “ICC pulses followed by return strokes (RSs)”, called ICCRS. There was a total of 79 negative flashes (including the one downward flash recorded), 4 bipolar flashes, and 2 positive flashes.
These total 85 flashes recorded contained a total of 389 pulses or strokes (ICC pulses, RSs, and M-component pulses). The 19 flashes with RSs (all negative) contained a total of 79 RS pulses. There were no X-ray detections associated with any of these ICC pulses, RS pulses or M-component pulses (i.e., X-ray peaks within about a hundred microseconds before a pulse). It is important to mention that, as also described previously (Section 2. Experiment), the signal-to-noise ratio of the X-ray detector system during phase 1 was such that, only X-ray peaks higher than 60 keV could be successfully detected. The classification of the type of flashes, strokes, and current pulses used above is discussed in more detail in [25,26].
X-rays from a Possible Nearby Downward Lightning
Even though we could not detect any X-ray bursts directly associated with the leader process of a RS or associated to other current pulses from GBT measurements, there was one very interesting case, where X-ray bursts were recorded by both un-attenuated and attenuated detectors, related to a close by flash. This negative downward lightning flash occurred on 13 July, 2011. In this case, no lightning flash directly struck the tower, but the measurement systems were triggered because of a possible unconnected leader from the tower or electromagnetic interference. As shown in Figure 3, Figure 4 and Figure 5, two sets of X-ray bursts, associated with the third and fourth subsequent strokes, were recorded. Since none of the RSs were directly connected to the tower, the timing of the small current peaks visible in the waveforms, as measured at GBT, could be different from the RS currents at the point of strike. The electric field recordings from fast E-field antenna are saturated in both RSs. However, from Figure 3, one can estimate that the X-ray bursts started within about 40 µs before the corresponding subsequent RS. The distances from GBT to the strokes, corresponding to the X-ray observations were 400 m and 500 m respectively, as recorded by the ALDIS lighting location system.
3.4. Results of Phase 2
In 2014, phase 2 of the experiment was started primarily with modification to the X-ray detector by improving the detector signal-to-noise ratio where X-ray peaks higher than 20 keV could be detected (which was very close to the sensitivity of the detector). In addition, the noise immunity of the fibre-optic link and detector power supply was improved. The data acquisition system was also upgraded to a 12-bit system. The overall result was such that, after the improvements, much smaller X-ray peaks could be detected.
During this phase, 23 flashes were recorded at Gaisberg and included in the current measurement database. Out of these 23 flashes, nine were ICC type discharges without return strokes and 14 were of the type ICC followed by RSs. Twenty-one flashes were of negative polarity while two were bipolar. These 23 flashes contained a total of 278 pulses/strokes. The 14 flashes with RSs (all negative) contained a total of 76 RSs.
As shown in Figure 6, Figure 7, Figure 8 and Figure 9, X-rays were detected for the first time in three flashes which could be associated to the dart or dart-stepped leader process (X-ray peaks detected before the RS). However, both the fluence and the amplitude of the X-ray peaks were much smaller compared to previous X-ray detection from natural or rocket-triggered lightning. The detected peaks were not typical X-ray bursts, with many consecutive peaks with an energy in the order of several hundred keV or MeV, but single or two peaks, with an energy of a few tens of keV to about 700 keV. Furthermore, X-rays were only detected in the un-attenuated detector, implying that the detected X-rays had lower energy. E-field data is not available for these three flashes. In all three cases, X-rays occurred a few microseconds before the current peaks associated to return strokes. The hundreds of ICC pulses and few M-component type current peaks did not produce any X-rays. This indicates that the detected X-ray peaks are associated with the RSs or events immediately prior to RSs and are not random events that occurred due to background radiation. Apart from the presented observations, no other high energetic radiation related to lightning or other atmospheric activity was detected during the two phases of the experiment.
4. Discussion
X-ray emissions have been measured successfully over a span of about ten years from triggered lightning and natural lightning in Florida at distances up to about a kilometre from the lightning channel [16,17,18,19]. According to experiments carried out in Gainesville, Florida, the maximum source height of X-rays corresponding to first-stroke stepped leaders and dart-stepped leaders of natural lightning are 800 m and 3.6 km respectively [19]. In the case of triggered lightning, the X-ray emissions are produced by the dart and dart-stepped leaders associated with the upward-initiated negative ground flashes. The emissions occur within about 100 µs before the beginning of the return stroke. Since the dart leader speed is about 107 m/s, at the beginning of the X-ray emissions, the tips of dart leaders or dart-stepped leaders are located at a height of about 1 km from the ground [15,16,17].
On the other hand, the results presented earlier show that the X-ray emissions from dart and dart-stepped leaders from upward-initiated lightning flashes from Gaisberg Tower are either very weak, so the amplitudes are below the threshold caused by the noise level, or rare. One can rule out the attenuation of the X-rays with distance as the cause, because of the following reasons.
As mentioned earlier, strong X-ray emissions from triggered lightning in Florida have been observed at comparable distances. The distance to the tower tip from the detector is no more than 200 m. The noise level of the X-ray detector located at the site is much smaller than the amplitude of the X-ray emissions at comparable distances in Florida and we can rule out the measurement threshold as the cause. Of course, it is possible that the down-coming dart leader is met by a connecting leader and if the connecting leader is very large, the tip of the dart leader would be located at a longer distance just before the return stroke. The results obtained from triggered lightning show that the connecting leaders in dart leaders are not more than a few meters in height [27,28]. However, in our case, the field enhancement caused by the tower may lead to longer connecting leaders. Information concerning the length of connecting leaders associated with dart or dart-stepped leaders is not available in the literature. Fortunately, in a recent study, Mengni et al. [29] made a theoretical estimation of the length of connecting leaders associated with dart leaders striking wind turbines. They have considered in their analysis a wind turbine whose hub is located at a height of 80 m having a blade length of 45 m. This makes the total height of the structure, with a fully upward extended blade, equal to about 125 m. For this structure, they estimated that the length of connecting leaders associated with typical dart leaders having a prospective return stroke current of 12 kA is no more than a few tens of meters. This shows that, in our case, the tip of the dart leader just before the return stroke is located at a distance not much greater than the 200 m distance from our measuring equipment to the tower top. Based on these considerations, we can rule out the possibility that the X-ray emissions are weak because the distance to the emission source is larger than that of the cases studied in Florida.
Based on these observations, we conclude that the X-ray emissions are weak in dart and dart-stepped leaders of upward-initiated flashes striking Gaisberg Tower. The reason for this is unknown at present. One possibility is that the long continuing currents associated with the upward leader stage precondition the channel in such a way that the conditions necessary for the emission of X-rays are removed from the dart and dart-stepped leaders. For example, when the current duration is long, ample time is available for the mixing of cold air into the discharge channel while the current is still flowing in the channel. Thus, the energy dissipated in the channel is continuously being utilised to heat cold air entering the channel. This may lead to a significant heating of air located around the channel. This fact was used previously by Cooray et al. [30] to explain the copious quantities of NOx generated by lightning flashes with long continuing currents. This continuous heating of the channel during the continuing current stage could modify the propagation characteristics of the dart leaders along the channel. However, similar continuing currents also exist in triggered lightning. Unless the metal vapours present in the triggered lightning channel in some way enhance the X-ray emissions in comparison to that of upward-initiated lightning striking Gaisberg Tower, it is difficult to prove that the difference is due to the continuing current. In this respect, it is important to point out that the observations of Idone and Orville [31] show that when continuously propagating dart leaders of triggered lightning entered into the channel section polluted by metal vapour, they transformed themselves to dart-stepped leaders. In general, dart leaders transform themselves to dart-stepped leaders when the conductivity of the residual return stroke channel is low [32]. Since the stepping process is a strong source of X-rays, such channel modifications by metal vapours may also explain why the X-ray emissions are strong in triggered lightning while they are absent in upward lightning flashes.
Another possible reason for the low X-ray emission from upward-initiated flashes could be the following. Theoretical work conducted by Cooray et al. [33] shows that it is the transient electric field that exists at the tip of the dart leader that is responsible for driving the electrons to runaway energies, resulting in X-ray emissions. This electric field is related to the current at the tip of the dart leader which, in turn, is determined by the charge deposited by the dart leader at its tip as it elongates towards the ground. The magnitude of this charge depends on the length of the dart leader [34]. As the dart leader elongates, this charge increases and the electric field at its tip also increases for the same reason. In the case of triggered lightning, the dart leader comes close to sea level; at the negative charge centre in Florida, thunderstorms are located at a height of about 6 km [35]. Thus, in triggered lightning, X-ray emissions are observed when the dart leader has extended to a length of about 5–6 km. On the other hand, in Austria, the charge centres in thunderclouds are located at a height of about 3–4 km above sea level and the maximum extension of the dart leaders that are associated with upward lightning from Gaisberg Tower is no longer than 2–3 km. This makes the charge accumulated at the tip of dart leaders striking Gaisberg Tower significantly lower than the charge that will be accumulated at the end of dart leaders in the case of triggered lightning. This could be the reason for insignificant X-ray emissions from dart and dart-stepped leaders striking Gaisberg Tower. This is supported by the fact that the few X-ray emissions we observed from lightning flashes striking Gaisberg Tower took place just before the return stroke when the dart leader was extended to its maximum value and when the accumulated charge at its tip was at its maximum value. However, if this hypothesis is correct, it is not possible for us to explain the X-ray emissions from the lightning flash that struck in the vicinity of the tower. The length of the dart or dart-stepped leaders associated with this lightning flash could not be much longer than those that struck the tower; unless, of course, the X-ray emissions of that lightning flash are related to events taking place inside the cloud and not to the dart or dart-stepped leaders of that lightning flash. Of course, more theoretical and experimental data, especially from towers located at sea level, are needed to make firm conclusions concerning the X-ray emissions from upward lightning.
5. Conclusions
In this paper, we investigated the occurrence of X-rays at ground level due to subsequent return strokes of upward-initiated lightning from Gaisberg Tower, in Austria, which is located at about 1300 m altitude. Out of 155 dart or dart-stepped leaders associated with subsequent return strokes in these flashes (associated with 79 and 76 RS pulses in each phase), X-ray emissions were observed in only three cases. In these three cases, the X-ray emissions occurred immediately before the subsequent stroke or during the very last stage of the dart leader. This is in contrast to the observations made in triggered lightning where X-ray emissions during the dart leader stage were easily detected at distances comparable to the distances pertinent to this study. This shows that the X-ray emissions are rare in the dart leader stage of subsequent return strokes of upward-initiated lightning flashes at Gaisberg Tower. Previous studies have shown that the X-ray emissions are controlled by the electric field at the tip of the dart leaders which, in turn, are controlled by the charge accumulated at the tip of the dart leader. Since the charge accumulated at the tip of the dart leader increases with increasing length of the dart leader channel, it is suggested that the weak X-ray emissions are either due to the modification of the lightning channel by long continuing leaders or due to the shorter dart leader channels associated with the lightning flashes striking Gaisberg Tower.
Acknowledgments
This work was supported by Swedish Research Council grant VR-2015-05026 and partly by the fund from the B. John F. and Svea Andersson donation at Uppsala University.
Author Contributions
Pasan Hettiarachchi prepared the experiment, assembled X-ray detectors and conducted the experiment, collected and analysed the data and wrote the manuscript. Vernon Cooray devised the original idea, and wrote of the manuscript with major contributions to the introduction, discussion, and conclusion. Gerhard Diendorfer and Hannes Pichler contributed by sharing their knowledge and expertise on integrating the X-ray measurement system with the Gaisberg current and E-field measuring system and also on the integration with the ALDIS lightning location system. Joseph Dwyer provided us with X-ray detectors and contributed with many discussions, and Mahbubur Rahman contributed by sharing his expertise on X-ray measurements by means of discussions.
Conflicts of Interest
The authors declare no conflict of interest.
References
- Moss, G.D.; Pasko, V.P.; Liu, N.; Veronis, G. Monte Carlo model for analysis of thermal runaway electrons in streamer tips in transient luminous events and streamer zones of lightning leaders. J. Geophys. Res. 2006, 111. [Google Scholar] [CrossRef]
- Dwyer, J.R. The relativistic feedback discharge model of terrestrial gamma ray flashes. J. Geophys. Res. Space Phys. 2012, 117. [Google Scholar] [CrossRef]
- Gurevich, A.V.; Gurevich, A.V.; Milikh, G.M.; Roussel-Dupre, R. Runaway electron mechanism of air breakdown and preconditioning during a thunderstorm. Phys. Lett. A 1992, 165, 463–468. [Google Scholar] [CrossRef]
- Wilson, C.T.R. The Acceleration of β-particles in Strong Electric Fields such as those of Thunderclouds. In Mathematical Proceedings of the Cambridge Philosophical Society; Cambridge University Press: Cambridge, UK, 1925; Volume 22, pp. 534–538. [Google Scholar]
- Fishman, G.J.; Bhat, P.N.; Mallozzi, R.; Horack, J.M.; Koshut, T.; Kouveliotou, C.; Pendleton, G.N.; Meegan, C.A.; Wilson, R.B.; Paciesas, W.S.; et al. Discovery of Intense Gamma-Ray Flashes of Atmospheric Origin. Science 1994, 264, 1313–1316. [Google Scholar] [CrossRef] [PubMed]
- Briggs, M.S.; Fishman, G.J.; Connaughton, V.; Bhat, P.N.; Paciesas, W.S.; Preece, R.D.; Wilson-Hodge, C.; Chaplin, V.L.; Kippen, R.M.; von Kienlin, A.; et al. First results on terrestrial gamma ray flashes from the Fermi Gamma-ray Burst Monitor. J. Geophys. Res. Space Phys. 2010, 115. [Google Scholar] [CrossRef]
- Tavani, M.; Marisaldi, M.; Labanti, C.; Fuschino, F.; Argan, A.; Trois, A.; Giommi, P.; Colafrancesco, S.; Pittori, C.; Palma, F.; et al. Terrestrial Gamma-Ray Flashes as Powerful Particle Accelerators. Phys. Rev. Lett. 2011, 106, 018501. [Google Scholar] [CrossRef] [PubMed]
- Chanrion, O.; Neubert, T. Production of runaway electrons by negative streamer discharges. J. Geophys. Res. Space Phys. 2010, 115. [Google Scholar] [CrossRef] [Green Version]
- Gurevich, A.V. On the Theory of Runaway Electrons. Sov. Phys. JETP 1961, 12, 904–912. [Google Scholar]
- Briggs, M.S.; Connaughton, V.; Wilson-Hodge, C.; Preece, R.D.; Fishman, G.J.; Kippen, R.M.; Bhat, P.N.; Paciesas, W.S.; Chaplin, V.L.; Meegan, C.A.; et al. Electron-positron beams from terrestrial lightning observed with Fermi GBM. Geophys. Res. Lett. 2011, 38. [Google Scholar] [CrossRef]
- Dwyer, J.R.; Rassoul, H.K.; Al-Dayeh, M.; Caraway, L.; Wright, B.; Chrest, A.; Uman, M.A.; Rakov, V.A.; Rambo, K.J.; Jordan, D.M.; et al. A ground level gamma-ray burst observed in association with rocket-triggered lightning. Geophys. Res. Lett. 2004, 31. [Google Scholar] [CrossRef]
- Dwyer, J.R.; Schaal, M.M.; Cramer, E.; Arabshahi, S.; Liu, N.; Rassoul, H.K.; Hill, J.D.; Jordan, D.M.; Uman, M.A. Observation of a gamma-ray flash at ground level in association with a cloud-to-ground lightning return stroke. J. Geophys. Res. Space Phys. 2012, 117. [Google Scholar] [CrossRef]
- Eack, K.B.; Suszcynsky, D.M.; Beasley, W.H.; Roussel-Dupre, R.; Symbalisty, E. Gamma-ray emissions observed in a thunderstorm anvil. Geophys. Res. Lett. 2000, 27, 185–188. [Google Scholar] [CrossRef]
- Alexeenko, V.V.V.; Khaerdinov, N.S.S.; Lidvansky, A.S.S.; Petkov, V.B.B. Transient variations of secondary cosmic rays due to atmospheric electric field and evidence for pre-lightning particle acceleration. Phys. Lett. A 2002, 301, 299–306. [Google Scholar] [CrossRef]
- Moore, C.B.; Eack, K.B.; Aulich, G.D.; Rison, W. Energetic radiation associated with lightning stepped-leaders. Geophys. Res. Lett. 2001, 28, 2141–2144. [Google Scholar] [CrossRef]
- Dwyer, J.R. Energetic Radiation Produced During Rocket-Triggered Lightning. Science 2003, 299, 694–697. [Google Scholar] [CrossRef] [PubMed]
- Dwyer, J.R.; Rassoul, H.K.; Al-Dayeh, M.; Caraway, L.; Chrest, A.; Wright, B.; Kozak, E.; Jerauld, J.; Uman, M.A.; Rakov, V.A.; et al. X-ray bursts associated with leader steps in cloud-to-ground lightning. Geophys. Res. Lett. 2005, 32. [Google Scholar] [CrossRef]
- Saleh, Z.; Dwyer, J.; Howard, J.; Uman, M.; Bakhtiari, M.; Concha, D.; Stapleton, M.; Hill, D.; Biagi, C.; Rassoul, H. Properties of the X-ray emission from rocket-triggered lightning as measured by the Thunderstorm Energetic Radiation Array (TERA). J. Geophys. Res. 2009, 114. [Google Scholar] [CrossRef]
- Mallick, S.; Rakov, V.A.; Dwyer, J.R. A study of X-ray emissions from thunderstorms with emphasis on subsequent strokes in natural lightning. J. Geophys. Res. Atmos. 2012, 117. [Google Scholar] [CrossRef]
- Montanyà, J.; Fabró, F.; van der Velde, O.; Romero, D.; Solà, G.; Hermoso, J.R.; Soula, S.; Williams, E.R.; Pineda, N. Registration of X-rays at 2500 m altitude in association with lightning flashes and thunderstorms. J. Geophys. Res. Atmos. 2014, 119, 1492–1503. [Google Scholar] [CrossRef] [Green Version]
- Yoshida, S.; Morimoto, T.; Ushio, T.; Kawasaki, Z.-I.; Torii, T.; Wang, D.; Takagi, N.; Watanabe, T. High energy photon and electron bursts associated with upward lightning strokes. Geophys. Res. Lett. 2008, 35. [Google Scholar] [CrossRef]
- Hettiarachchi, P.; Rahman, M.; Cooray, V.; Dwyer, J. X-rays from negative laboratory sparks in air: Influence of the anode geometry. J. Atmos. Sol.-Terr. Phys. 2017, 154, 190–194. [Google Scholar] [CrossRef]
- Hettiarachchi, P.; Cooray, V.; Rahman, M.; Dwyer, J. Energy Distribution of X-rays Produced by Meter-Long Negative Discharges in Air. Atmosphere 2017, 8, 244. [Google Scholar] [CrossRef]
- Carlson, B.E.; Østgaard, N.; Kochkin, P.; Grondahl, Ø.; Nisi, R.; Weber, K.; Scherrer, Z.; Lecaptain, K. Meter-scale spark X-ray spectrum statistics. J. Geophys. Res. Atmos. 2015, 120, 11191–11202. [Google Scholar] [CrossRef] [PubMed]
- Diendorfer, G.; Pichler, H.; Mair, M. Some Parameters of Negative Upward-Initiated Lightning to the Gaisberg Tower (2000–2007). IEEE Trans. Electromagn. Compat. 2009, 51, 443–452. [Google Scholar] [CrossRef]
- Zhou, H.; Diendorfer, G.; Thottappillil, R.; Pichler, H.; Mair, M. Characteristics of upward bipolar lightning flashes observed at the Gaisberg Tower. J. Geophys. Res. 2011, 116. [Google Scholar] [CrossRef]
- Wang, D.; Gamerota, W.R.; Uman, M.A.; Takagi, N.; Hill, J.D.; Pilkey, J.; Ngin, T.; Jordan, D.M.; Mallick, S.; Rakov, V.A. Lightning attachment processes of an “anomalous” triggered lightning discharge. J. Geophys. Res. Atmos. 2014, 119, 1524–1533. [Google Scholar] [CrossRef]
- Wang, D.; Takagi, N.; Gamerota, W.R.; Uman, M.A.; Hill, J.D.; Jordan, D.M. Initiation processes of return strokes in rocket-triggered lightning. J. Geophys. Res. Atmos. 2013, 118, 9880–9888. [Google Scholar] [CrossRef]
- Long, M.; Becerra, M.; Thottappillil, R. On the attachment of dart lightning leaders to wind turbines. Electr. Power Syst. Res. 2017, 151, 432–439. [Google Scholar] [CrossRef]
- Cooray, V.; Rahman, M.; Rakov, V. On the NOx production by laboratory electrical discharges and lightning. J. Atmos. Sol.-Terr. Phys. 2009, 71, 1877–1889. [Google Scholar] [CrossRef]
- Idone, V.P.; Orville, R.E. Three unusual strokes in a triggered lightning flash. J. Geophys. Res. 1984, 89, 7311–7316. [Google Scholar] [CrossRef]
- Cooray, V. Mechanism of the lightning flash. In The Lightning Flash; Cooray, V., Ed.; Institution of Engineering and Technology: Stevenage, UK, 2014; pp. 119–229. ISBN 9781849196925. [Google Scholar]
- Cooray, V.; Dwyer, J.; Rakov, V.; Rahman, M. On the mechanism of X-ray production by dart leaders of lightning flashes. J. Atmos. Sol.-Terr. Phys. 2010, 72, 848–855. [Google Scholar] [CrossRef]
- Cooray, V.; Rakov, V.; Theethayi, N. The lightning striking distance—Revisited. J. Electrostat. 2007, 65, 296–306. [Google Scholar] [CrossRef]
- Krehebiel, P.R. The Electrical Structure of Thunderstorms. In The Earth’s Electrical Environment; The National Academy Press: Washington, DC, USA, 1986; pp. 90–113. [Google Scholar]
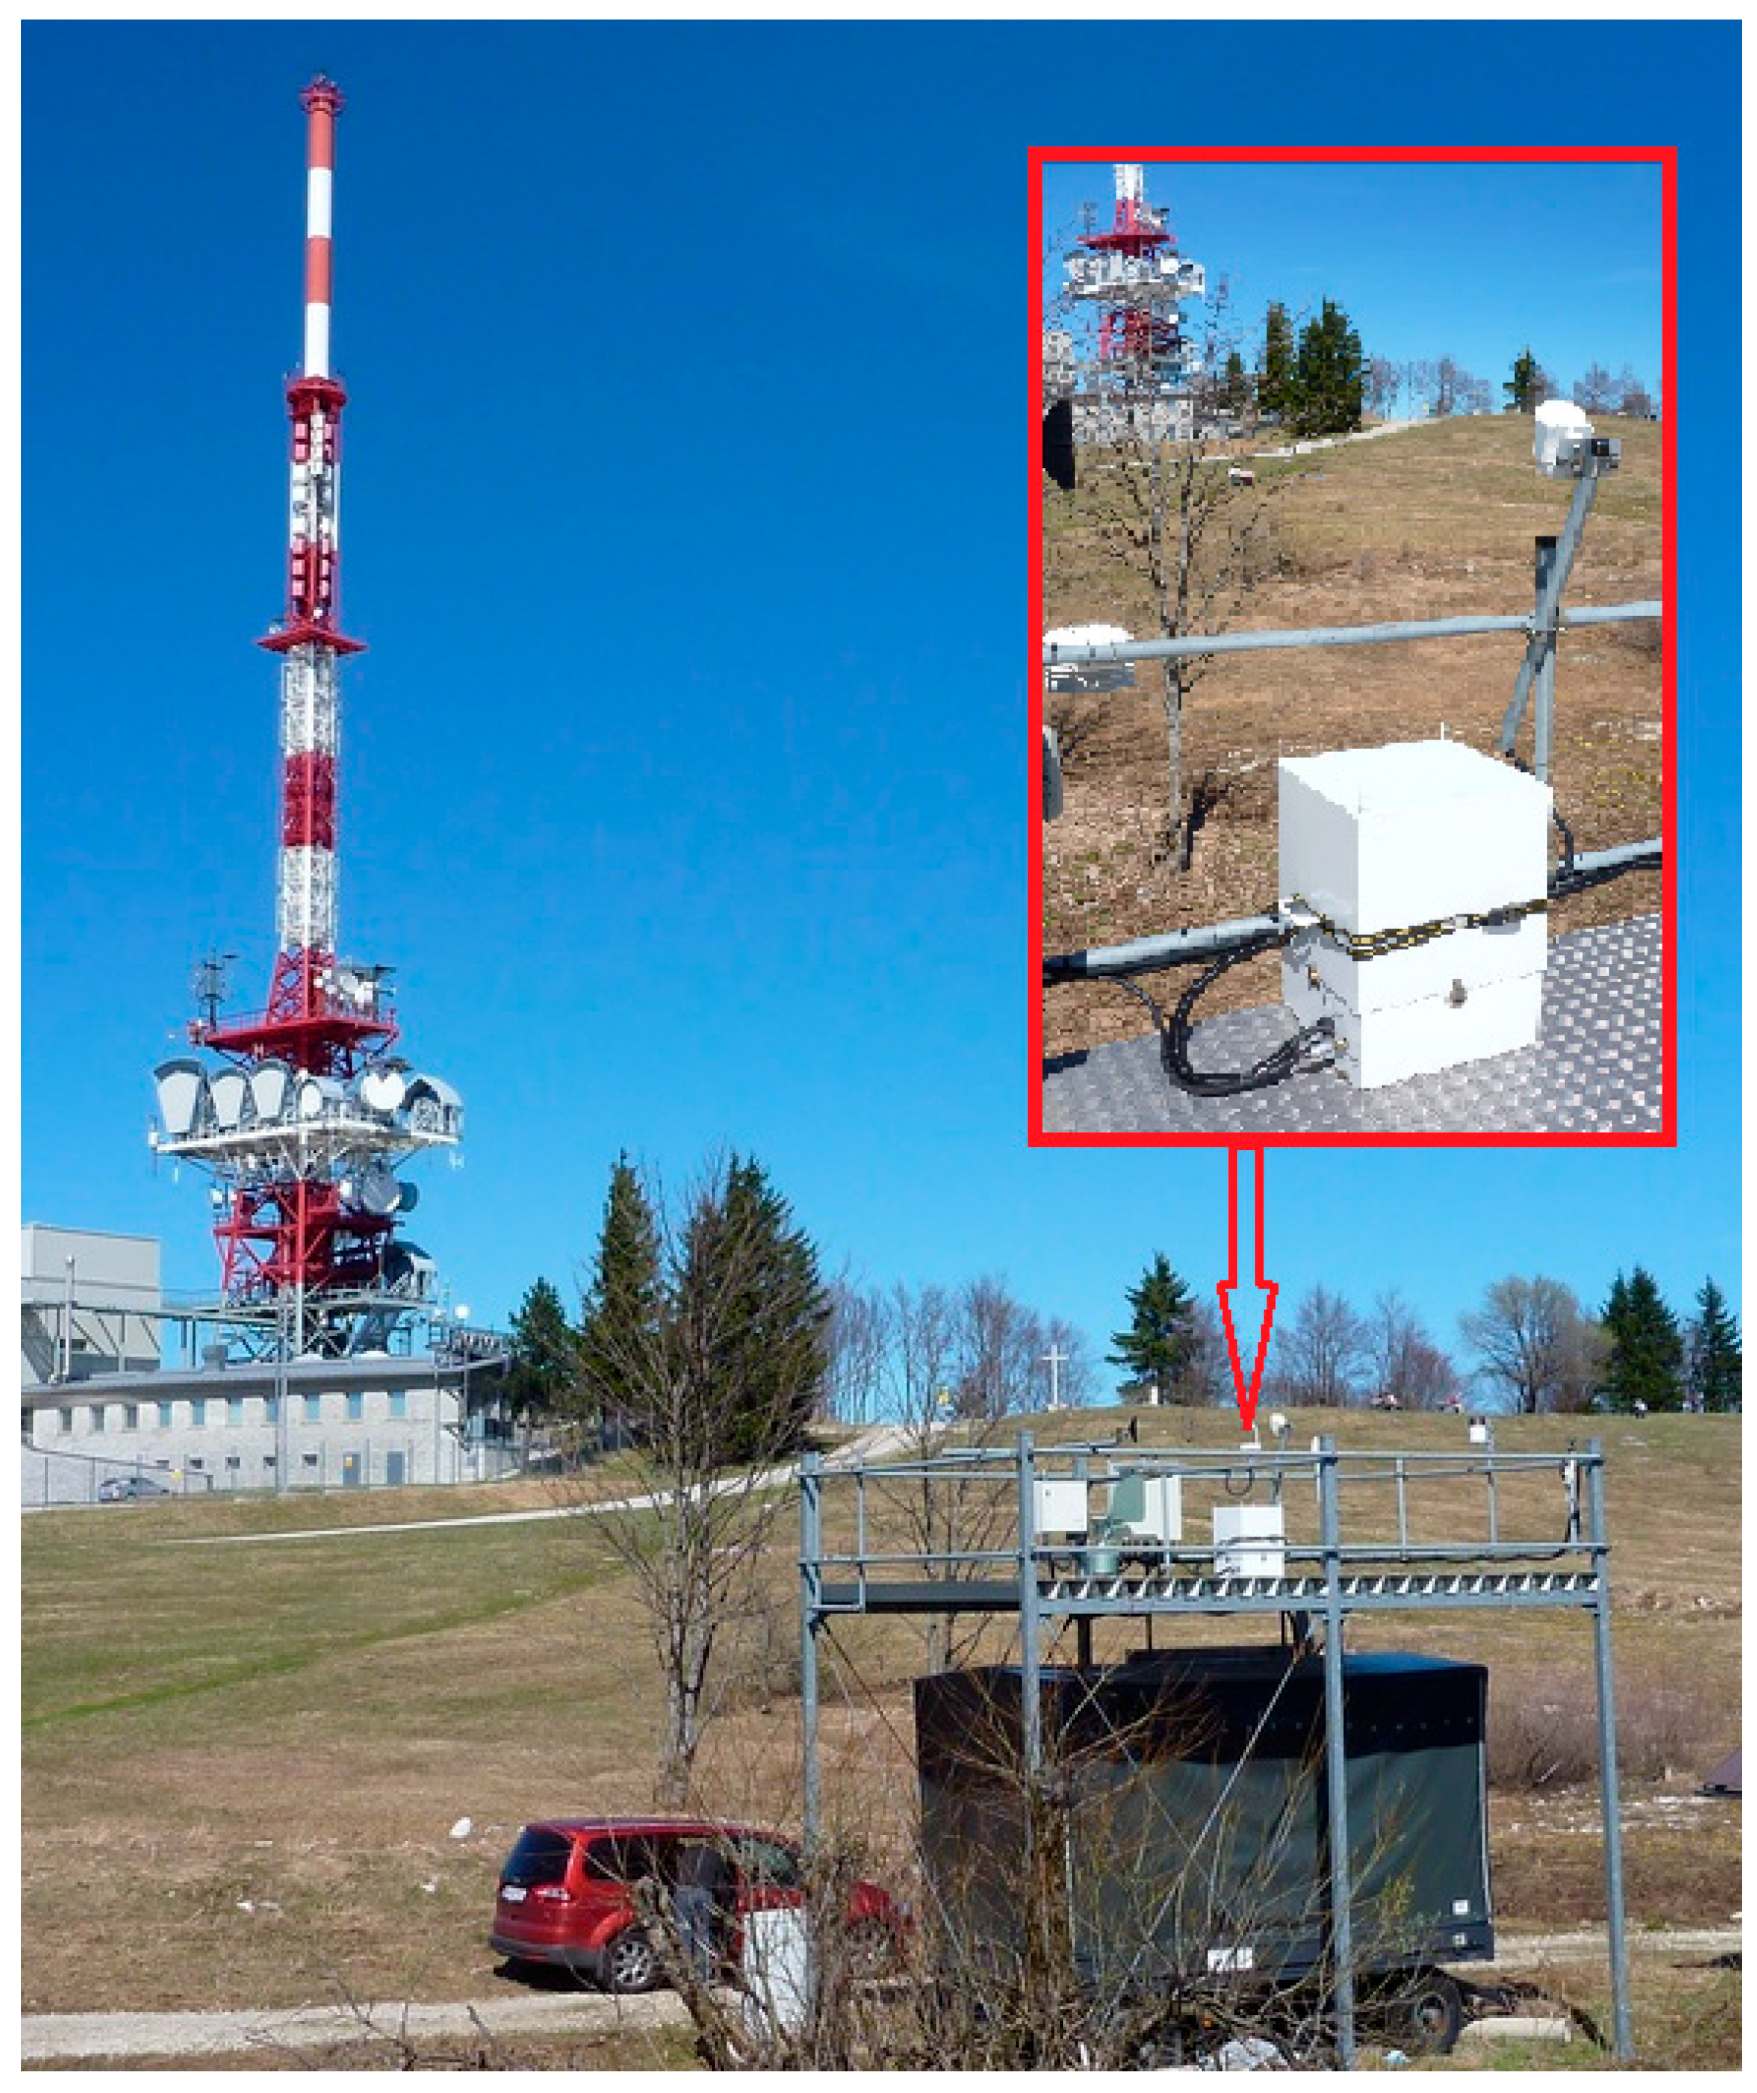
Figure 1.
Gaisberg Tower and the X-ray measurement system are shown in the picture. In addition to the X-ray detector (also shown in the zoomed-in box), vertical fast E-field antenna, the field mill, and other meteorological instruments are located on the roof of the structure shown. The EMC cabinet containing the measuring equipment is also visible inside the structure. The shunts, measuring the current, are located at the tower top.

Figure 2.
The response of NaI(Tl) detectors coupled to a fibre-optic link with low bandwidth. The response to a single photon emission of a 137Cs calibration source (left) and the typical response to a laboratory discharge of a standard lightning impulse of 900 kV (right) are shown. This detector configuration is not capable of resolving multi-photon pile-ups for photon bursts occurring within the response time of the system (as evident from the response to a multi-photon burst of the detector shown on the right). The seemingly lower rise-time as can be clearly seen from both plots is caused by the limited bandwidth of the fibre-optic link. The fall-time of the waveforms is primarily determined by the typical scintillation decay-time of Nai(Tl). The calibration constant is calculated by assuming a simple linear relationship of the peak amplitude of the detected signal to the total-deposited energy at the detector. Such calibration, based only on the amplitude, is especially applicable to NaI(Tl) detectors coupled to fibre-optic links with a limited bandwidth. Please note that the calibration waveform shown above (left), is taken from another experiment with different calibrations, but it is still applicable for the measurement in this work in terms of the wave-shape.

Figure 3.
X-ray burst associated with the third (second subsequent) return stroke. The time t = 0 corresponds to 16:09:36.072213 UTC. X-rays are detected in both attenuated (detector 2) and unattenuated (detector 1) detectors. According to the Austrian Lightning Detection and Information System (ALDIS), this 36-kA stroke occurred at a distance of 400 m from the tower. Peak energy of the burst, derived from roughly −800 mV peak in the un-attenuated detector, is about 4.3 MeV (this could be due to a multi-photon accumulation). The two cursor positions indicate the first and the last occurrence of X-ray peaks. This last occurrence, also shown in the black vertical cursor, happens roughly 1.4 µs before the return stroke (RS) time of 16:09:36.145867 UTC as recorded by the ALDIS. The total duration of bursts is about 40 µs. The seemingly continuous nature of bursts (in detector 1) could be resulting from the slow detector response. The small current peak of about 125 A (measured at the top of Gaisberg radio transmission tower (GBT)) could be due to an unconnected leader.
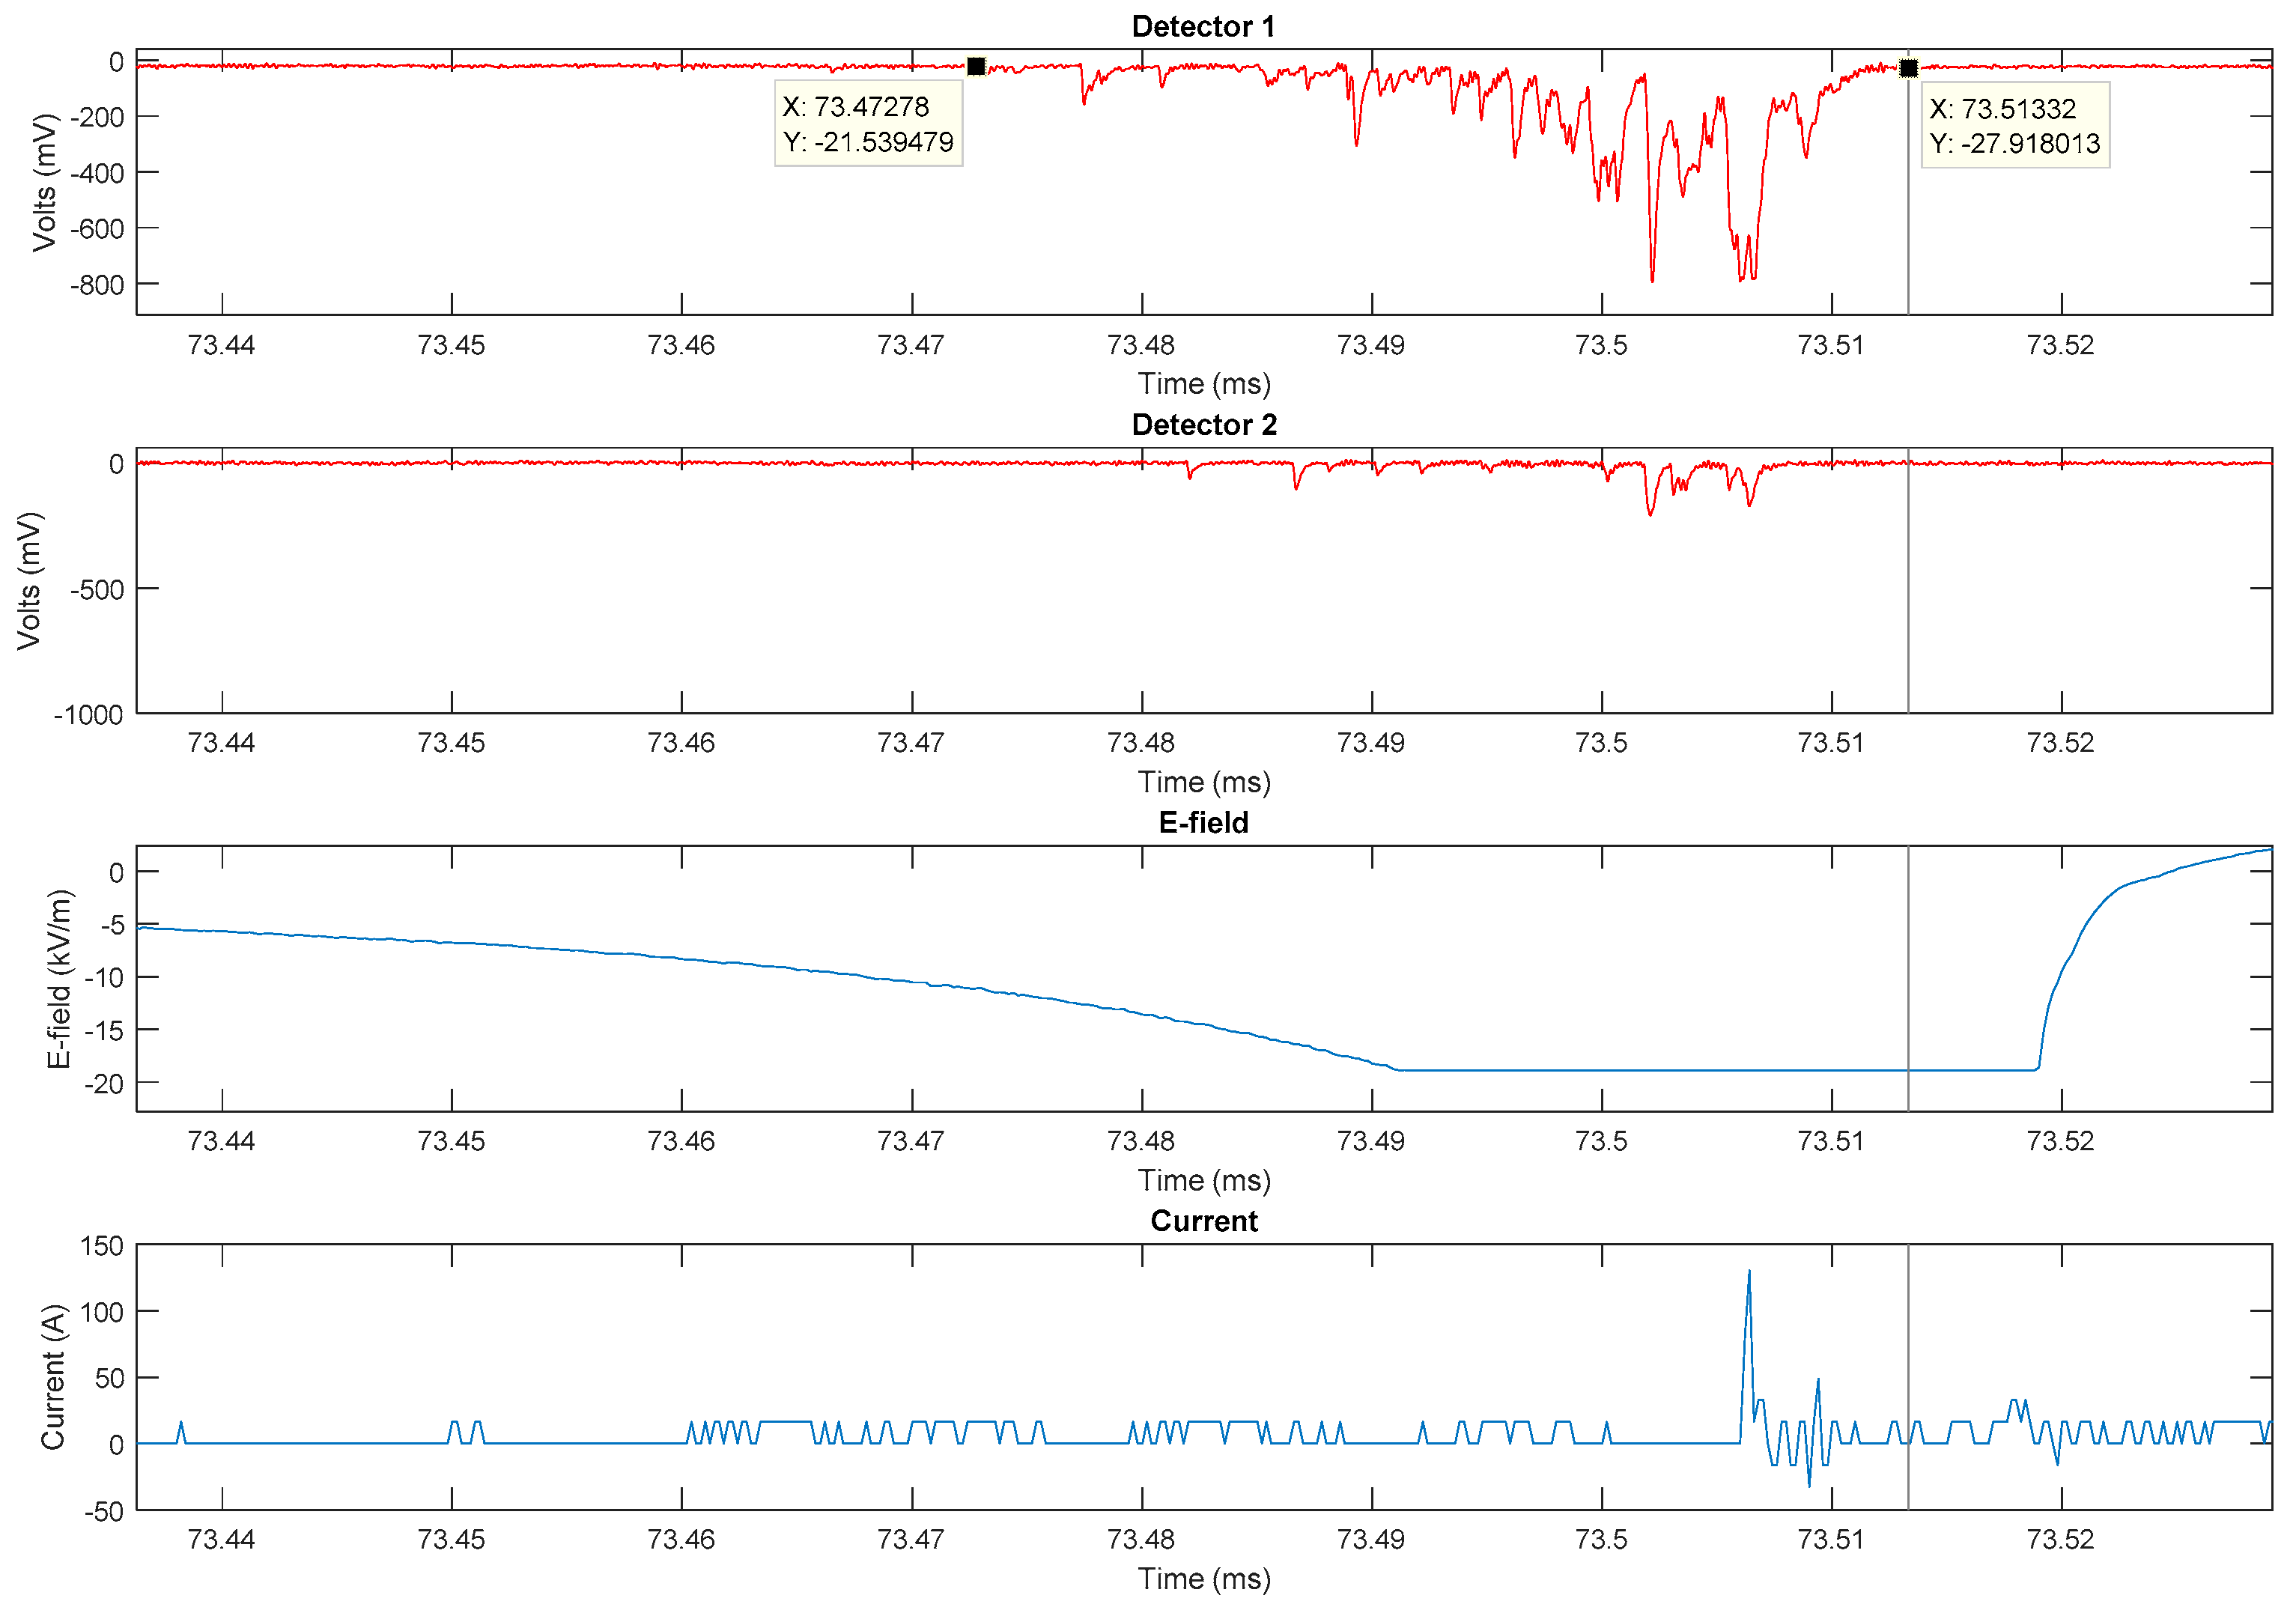
Figure 4.
X-ray burst associated with the fourth (third subsequent) return stroke. The time t = 0 corresponds to 16:09:36.072213 UTC. X-rays are only detected in the un-attenuated detector. According to ALDIS, this 22-kA stroke occurred at a distance of 500 m from the tower. Peak energy of the burst is about 650 keV. The timestamp of the RS is 16:09:36.665124 UTC.
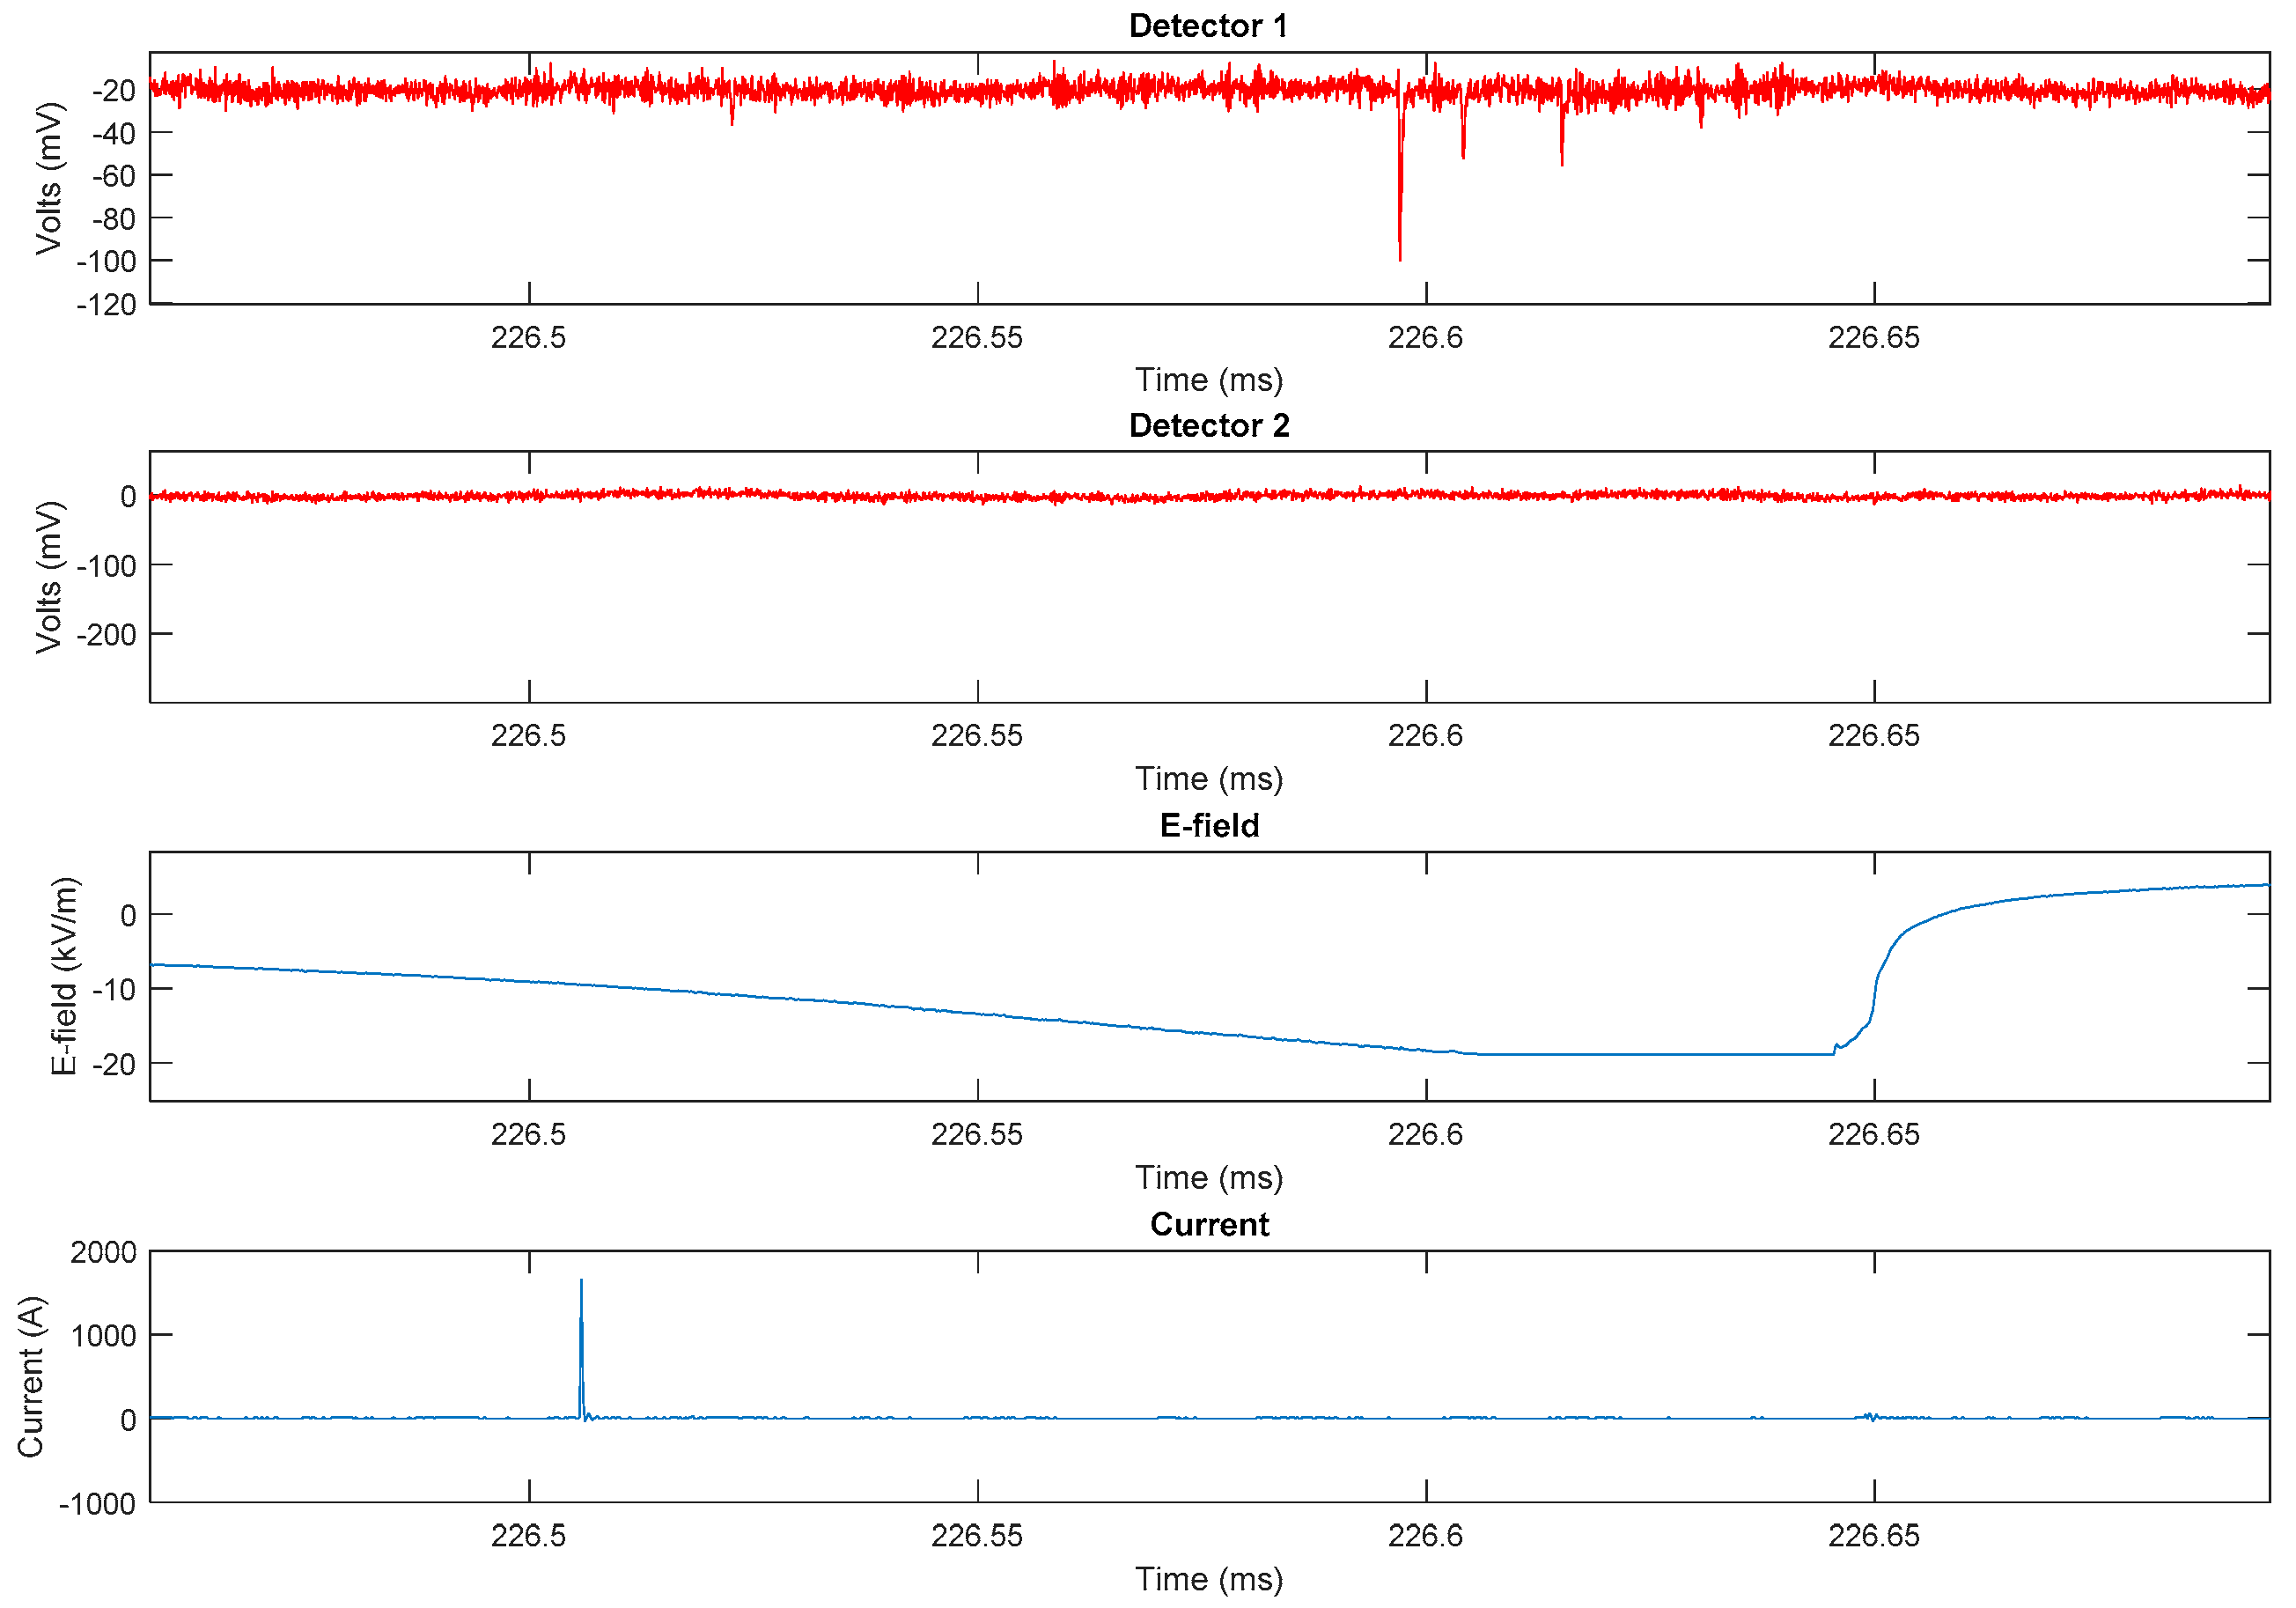
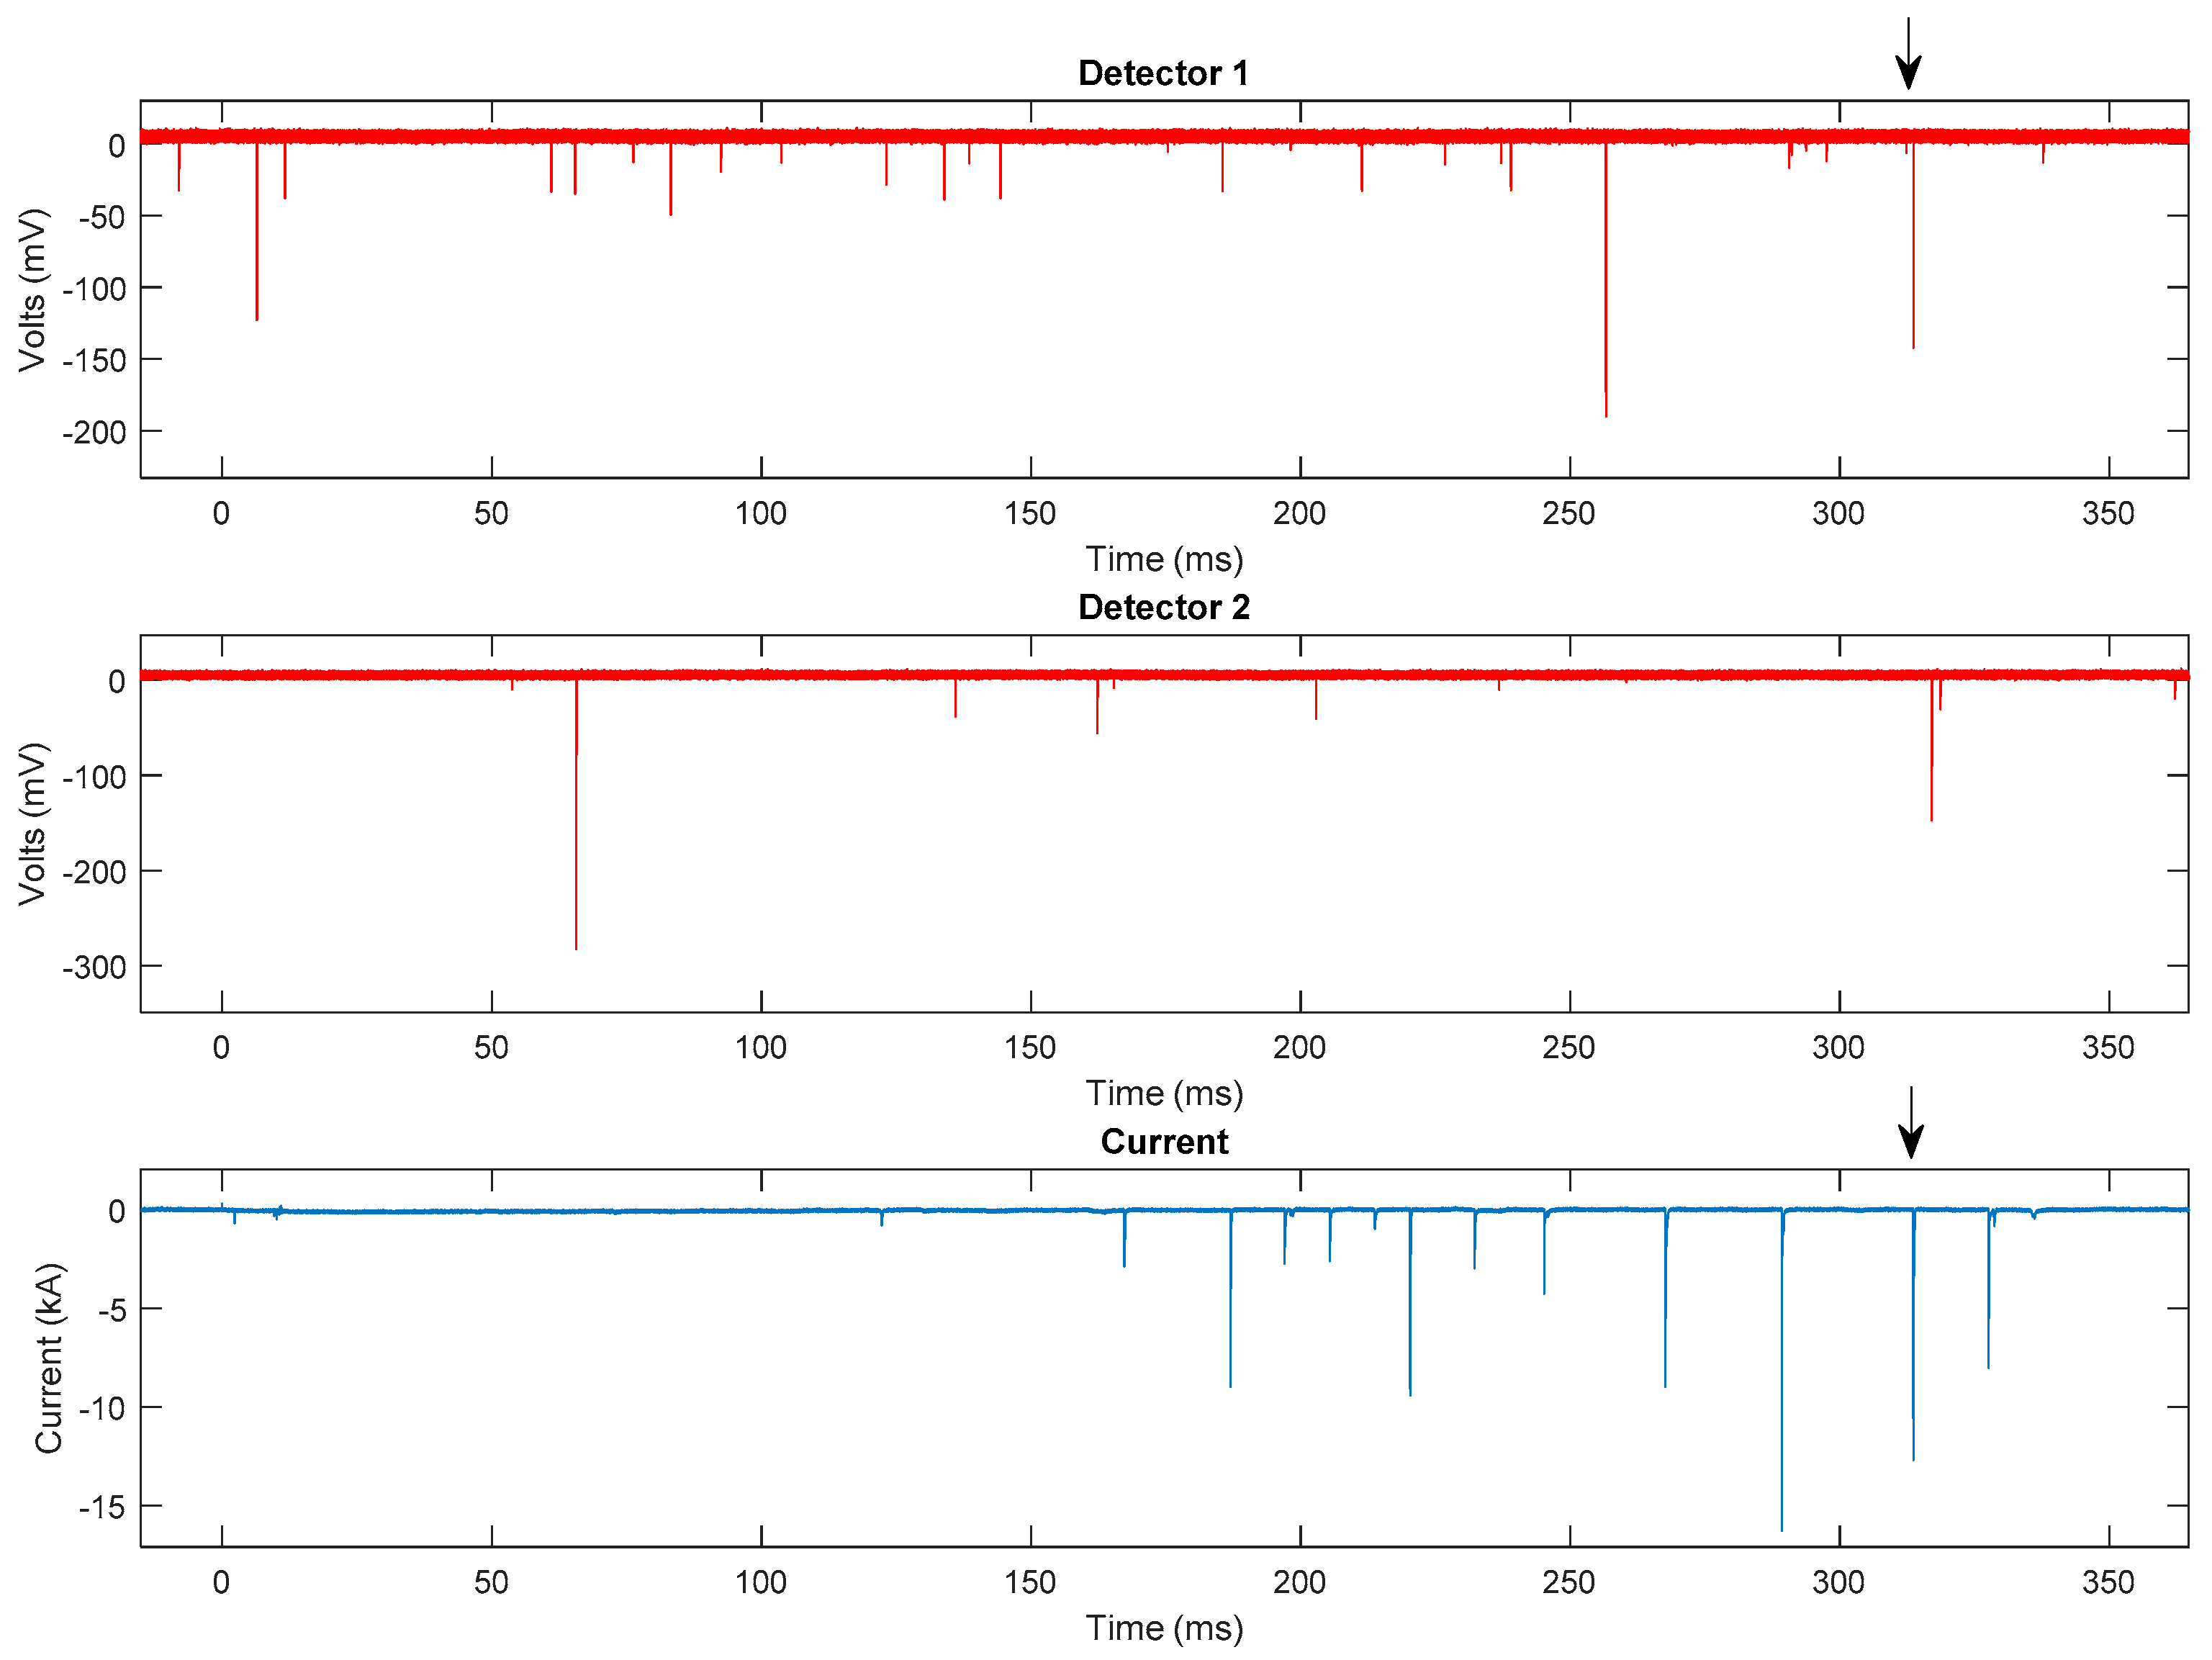
Figure 5.
Full X-ray record of the flash containing the strokes shown in Figure 2 and Figure 3. The time t = 0 corresponds to 16:09:36.072213 UTC. X-rays were recorded with a 300-ms time window. The RSs described in Figure 2 and Figure 3 are indicated by the two arrows in the E-field waveform. Two more subsequent RSs occurred later in time are not captured.
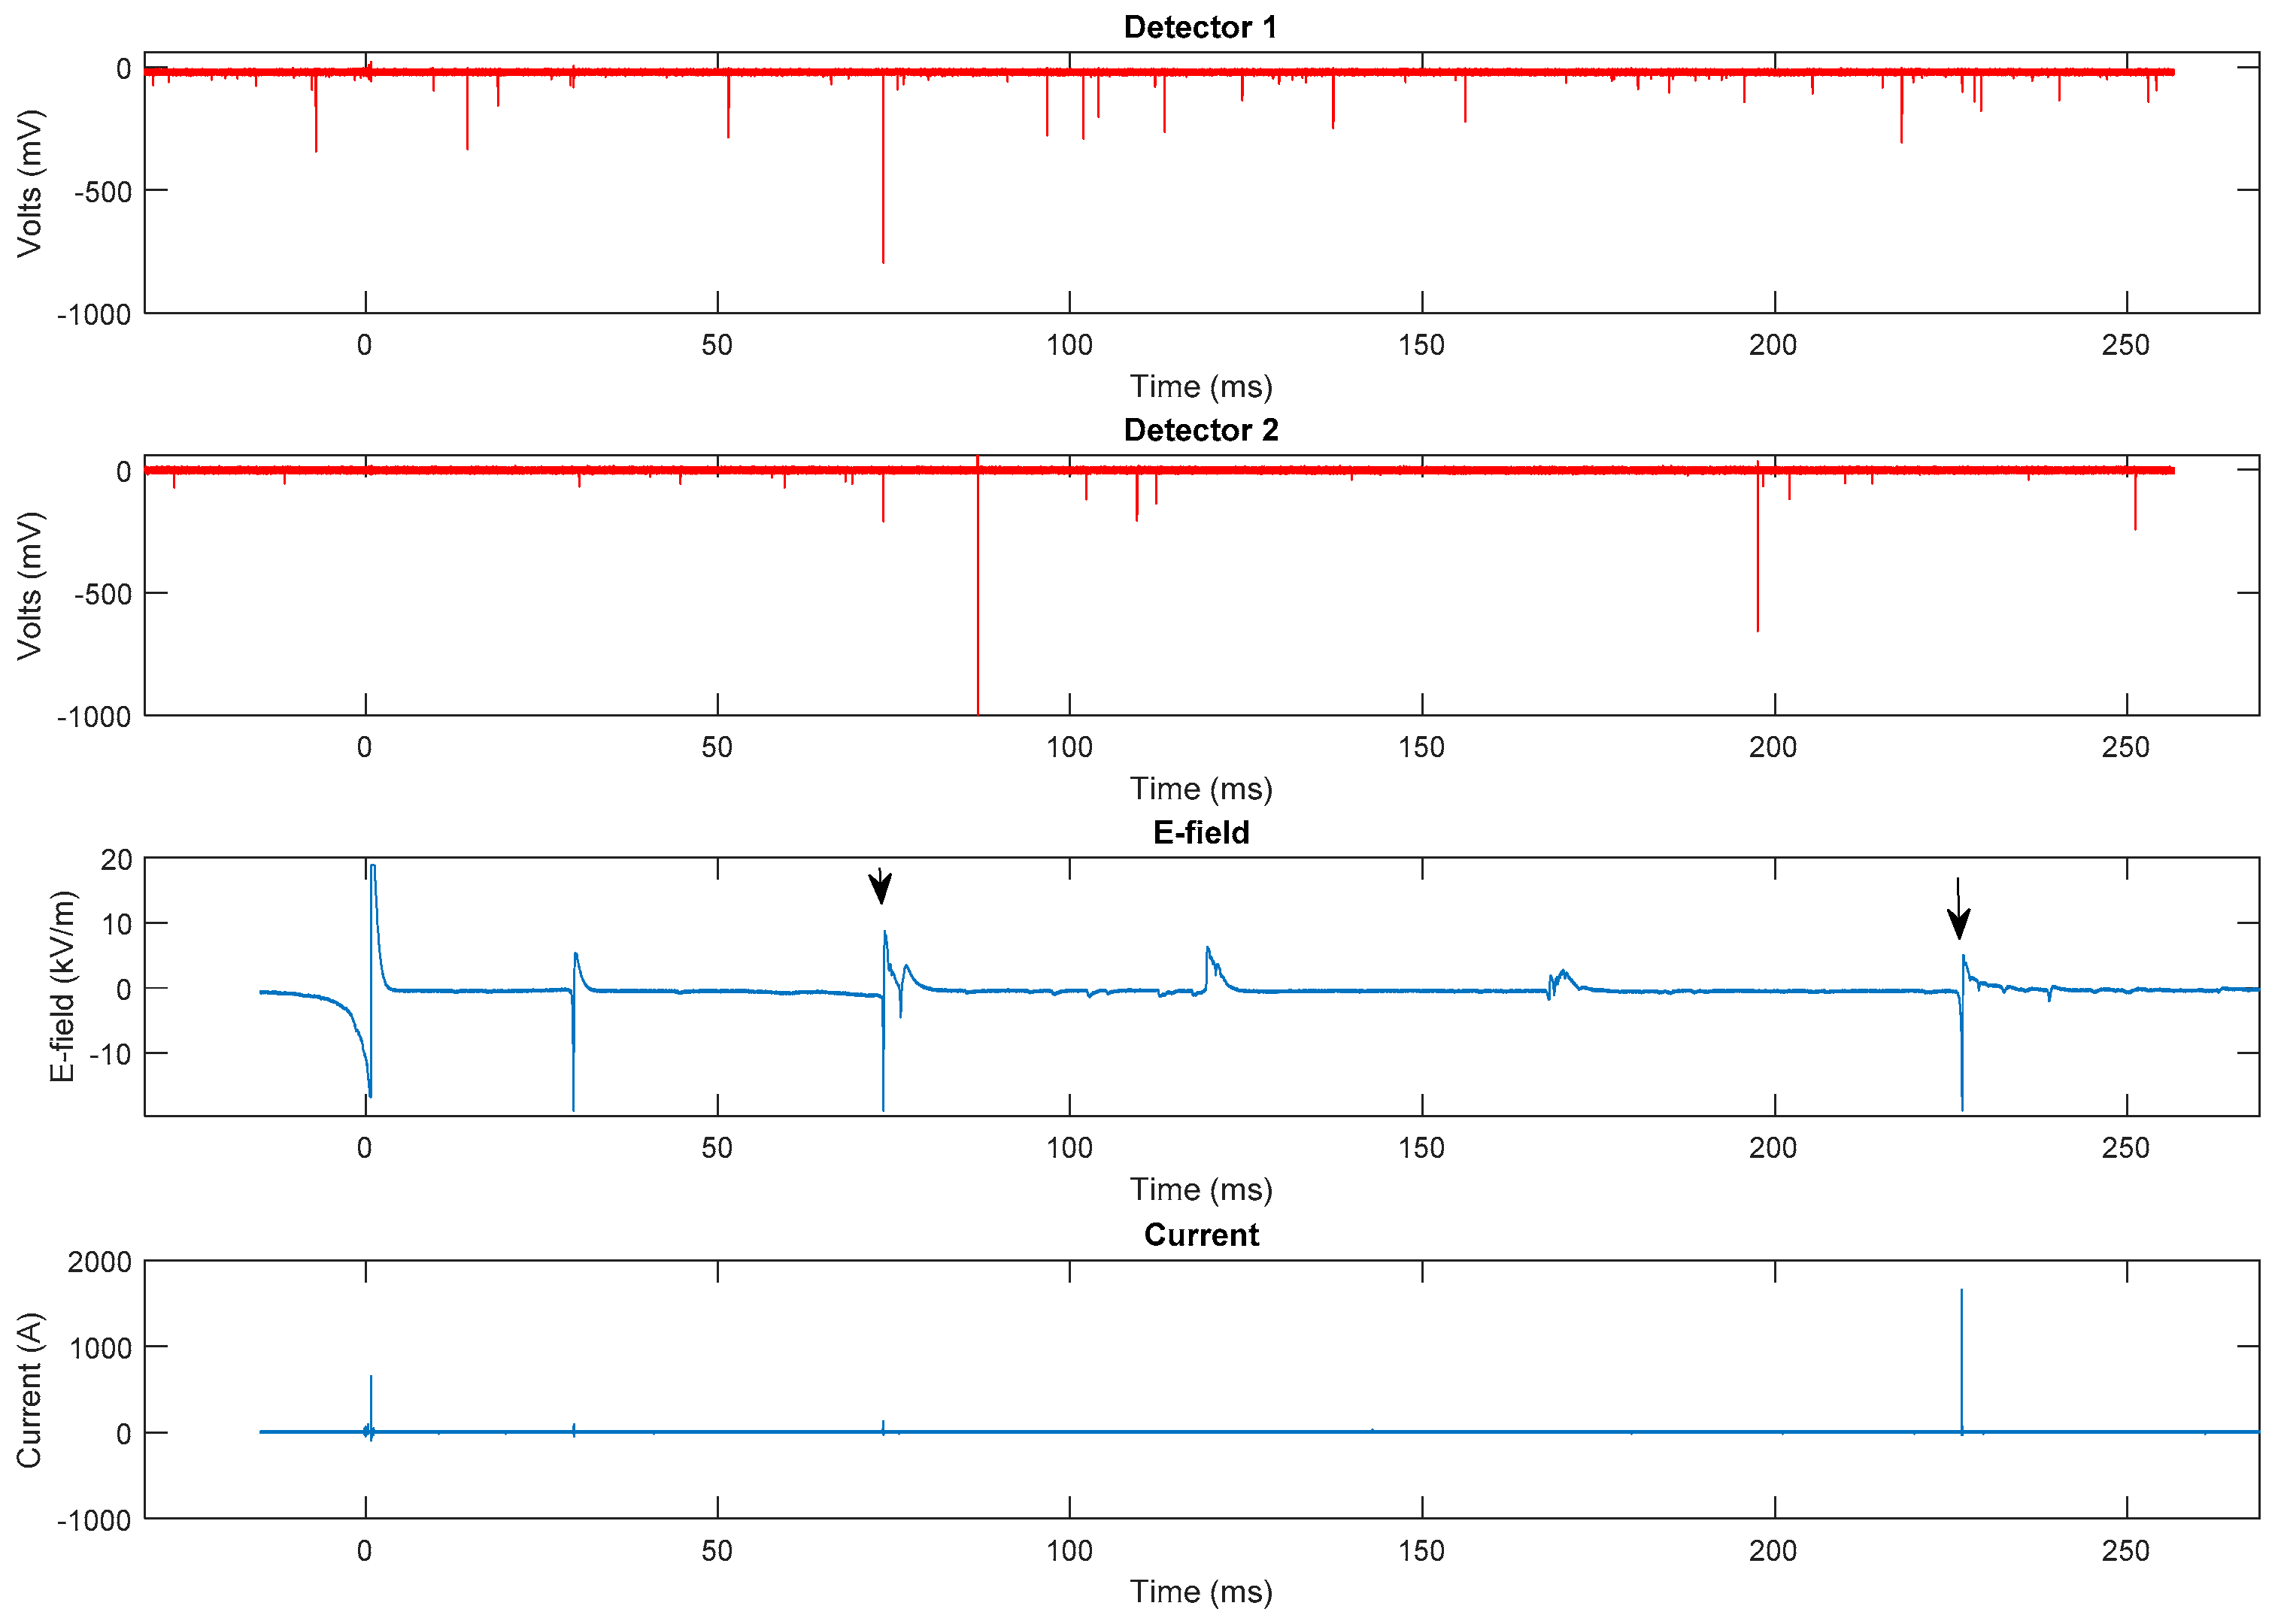
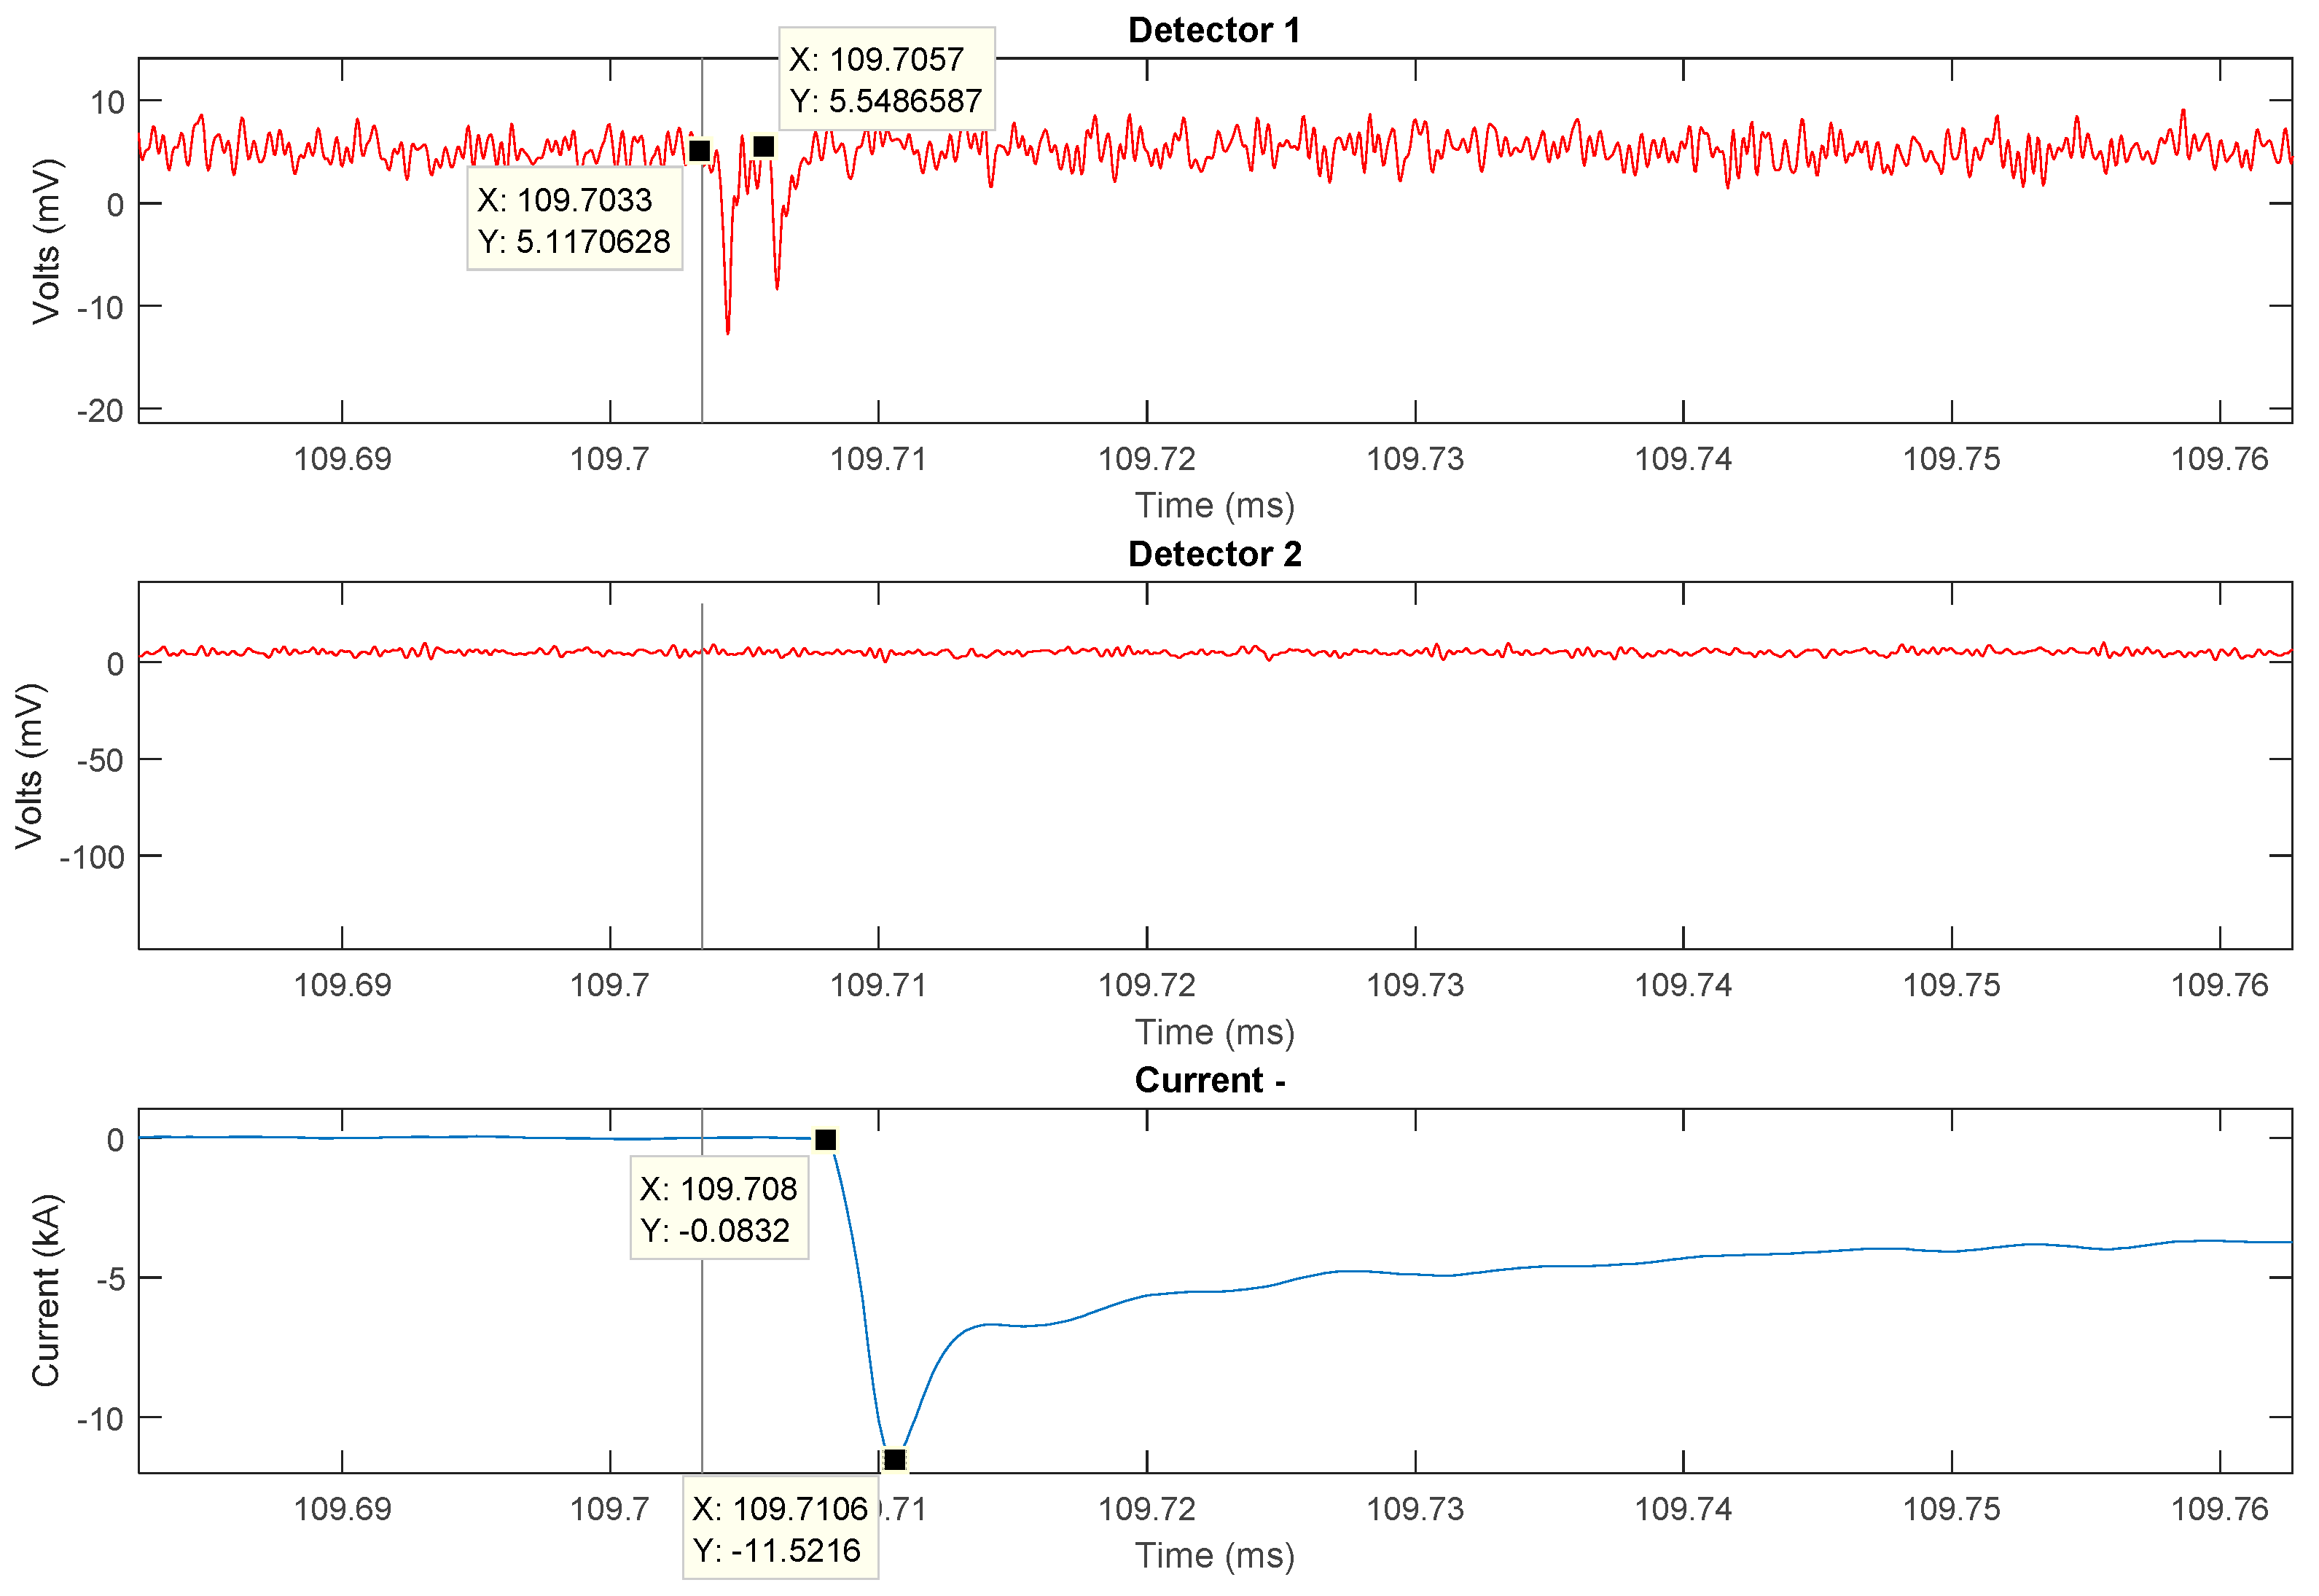
Figure 6.
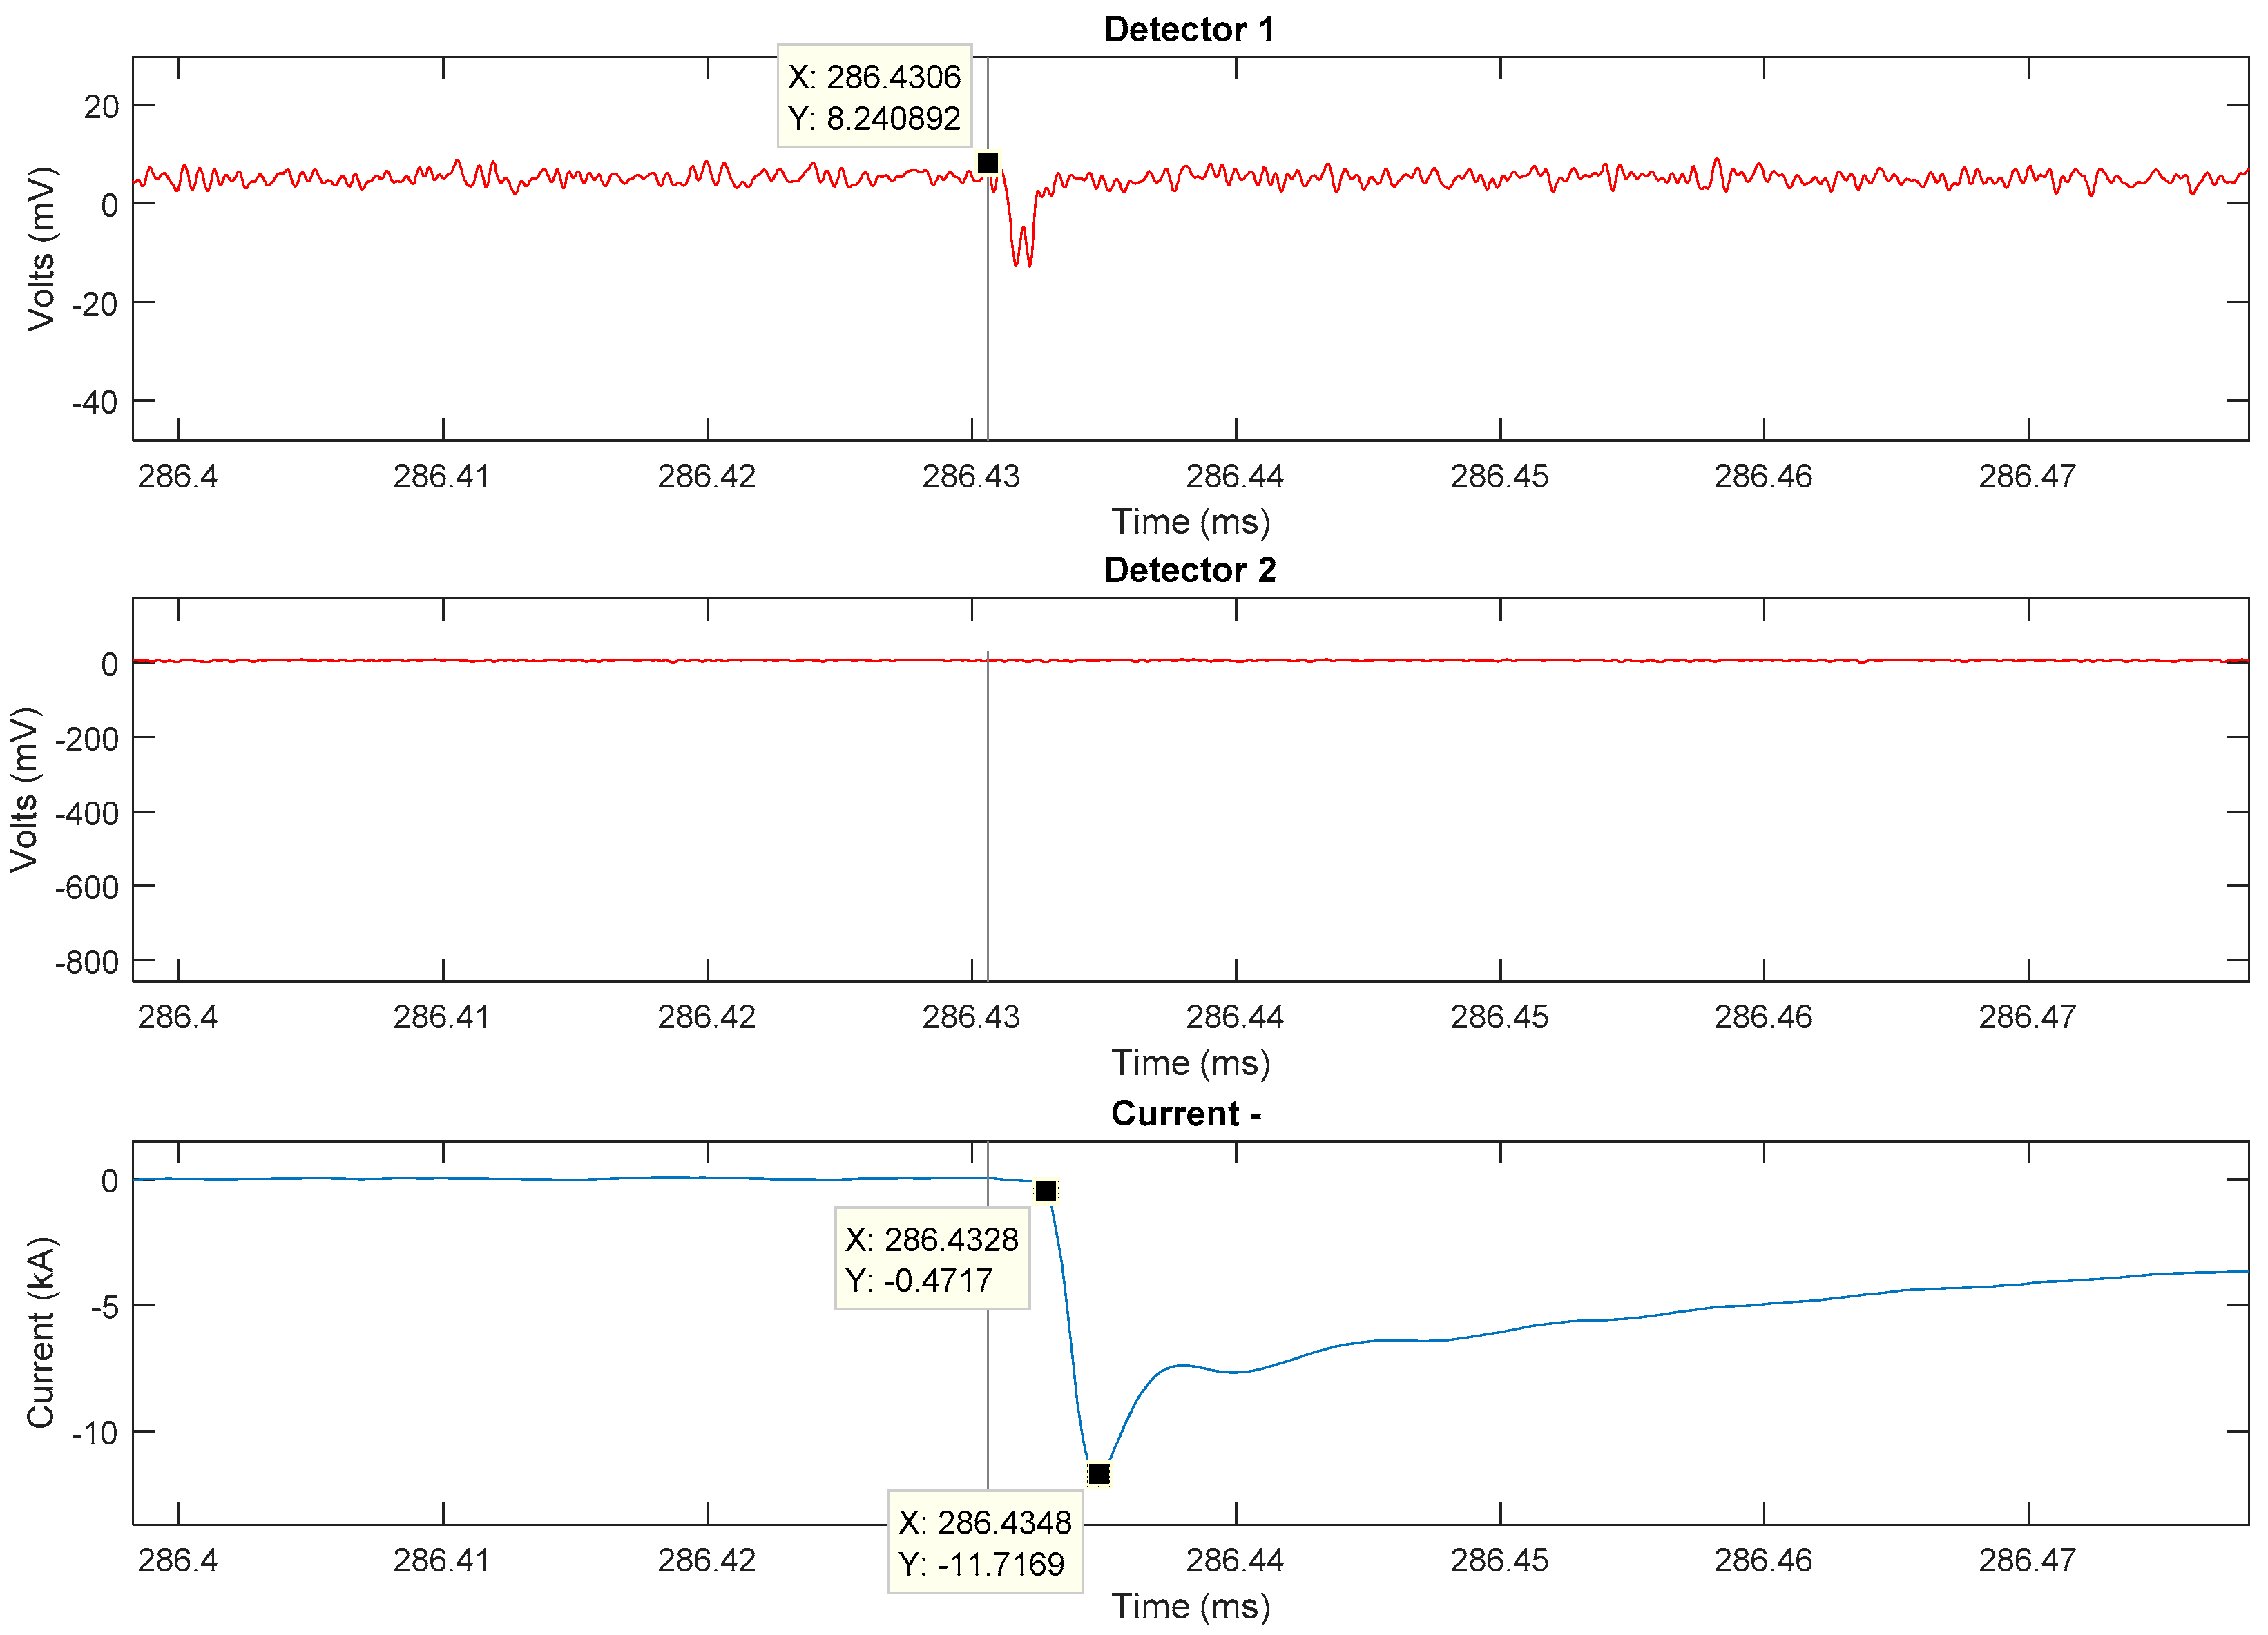
X-rays from a subsequent stroke of a flash that occurred on 02 March, 2015, of the type ICCRS. The time t = 0 corresponds to 20:54:37.247308 UTC. The flash contains nine initial continuing current (ICC) pulses followed by four RSs. The occurrence of the X-ray is about 3 µs prior to the current peak of the third RS. The X-ray peak, appearing in the un-attenuated detector, could be an accumulation of multiple photons. The energy of the peak (calculated by simply multiplying the peak voltage of the burst by the calibration factor) is about 700 keV. The timestamp of the RS is 20:54:37.560928 UTC.
Figure 6.
X-rays from a subsequent stroke of a flash that occurred on 02 March, 2015, of the type ICCRS. The time t = 0 corresponds to 20:54:37.247308 UTC. The flash contains nine initial continuing current (ICC) pulses followed by four RSs. The occurrence of the X-ray is about 3 µs prior to the current peak of the third RS. The X-ray peak, appearing in the un-attenuated detector, could be an accumulation of multiple photons. The energy of the peak (calculated by simply multiplying the peak voltage of the burst by the calibration factor) is about 700 keV. The timestamp of the RS is 20:54:37.560928 UTC.
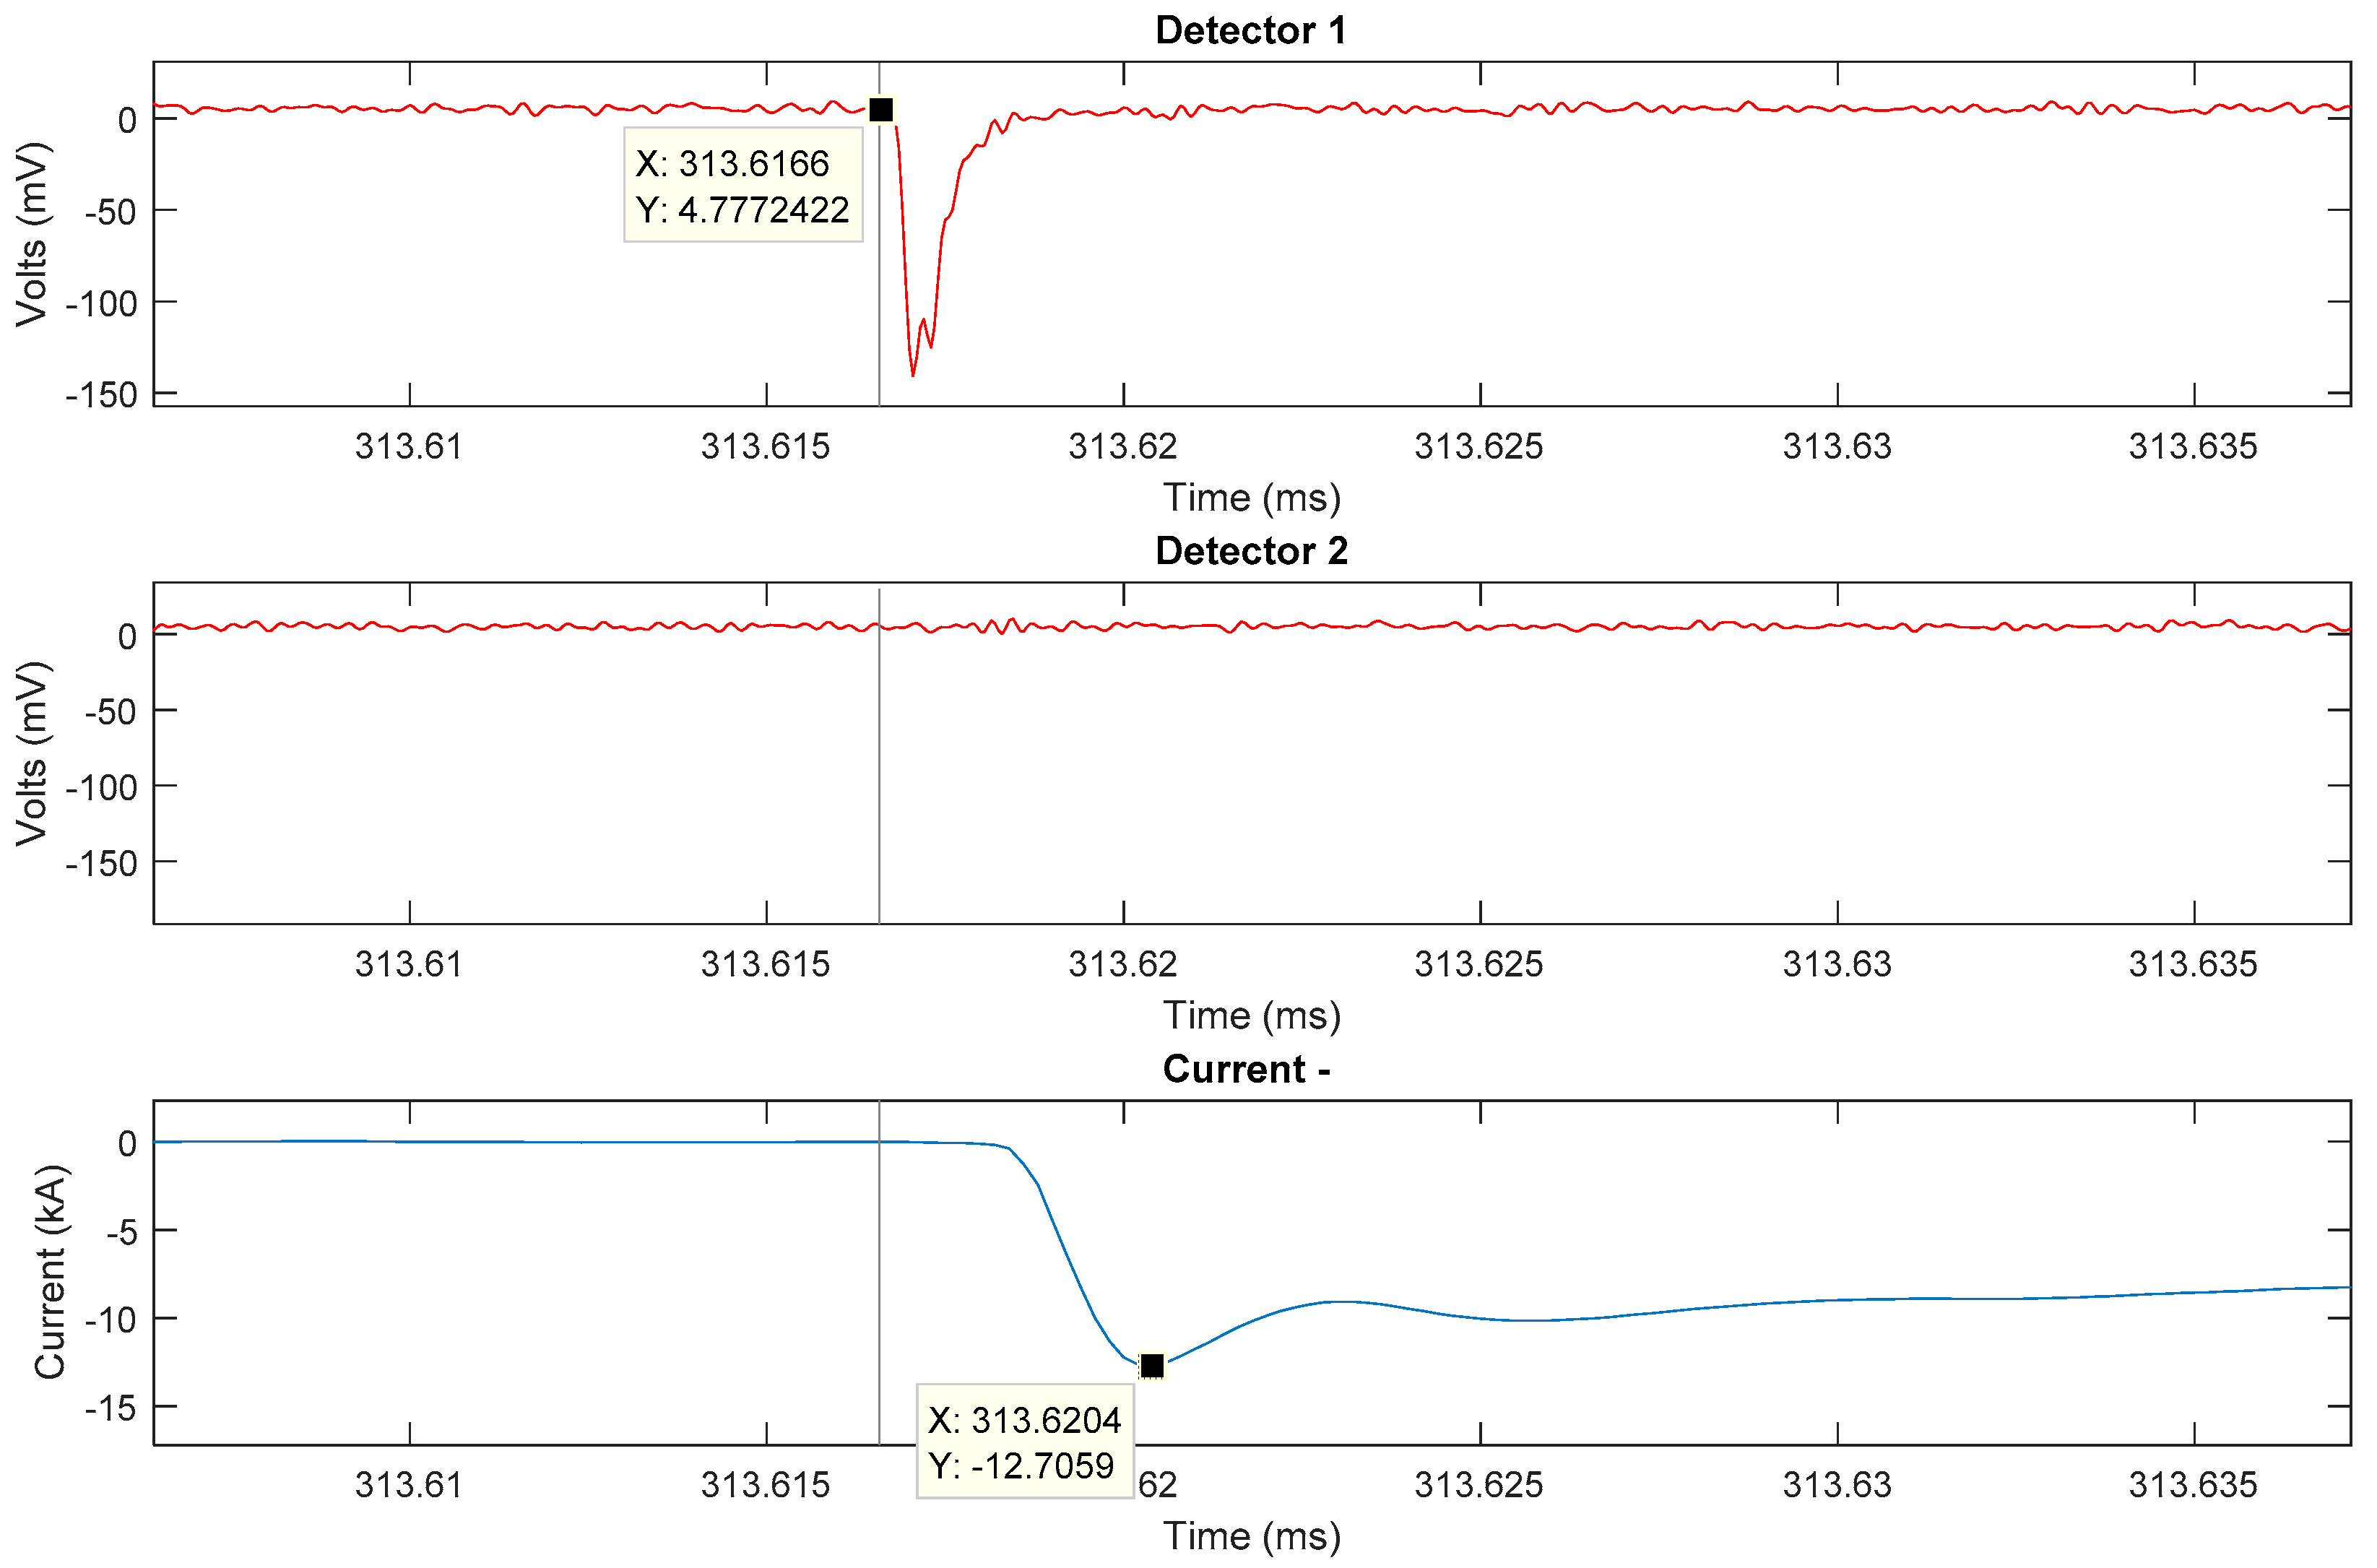
Figure 7.
The complete time window of the flash occurred on 02 March, 2015 corresponding to the RS shown in Figure 6. The time t = 0 corresponds to 20:54:37.247308 UTC. The current peak and the X-ray burst shown in Figure 6 are indicated by black vertical arrows.

Figure 8.
X-rays from a subsequent stroke of another flash occurred on 02 March, 2015. Time (ms) starting from 20:56:29.879192 UTC is given in the x-axis. Two distinct X-ray peaks are visible in the un-attenuated detector. The occurrence of first (also marked in the black vertical cursor) and second X-ray pulses are about 4.7 and 2.3 µs prior to the onset of the current peak of the only RS. Because of the limited bandwidth of the fibre-optic link, and electromagnetic interference, the shape of the peaks could also be distorted. The vertical cursor is fixed at the first X-ray peak. The flash contained 17 ICC pulses before this RS. Peak energy of the burst is around 70 keV (calculated by multiplying the peak voltage by the calibration factor). The timestamp of the RS is 20:56:29.988903 UTC.

Figure 9.
X-rays from a subsequent stroke of another flash occurred on 01 April, 2015. Time (ms) starting from 01:23:27.482779 UTC is given in the x-axis. The occurrence of the X-ray is about 2.2 µs prior to the onset of the current peak of the third and last RS. Flash contained two ICC pulses before the RSs. Two X-ray peaks are visible in the un-attenuated detector. The time of occurrence of the X-ray pulse is marked by the black vertical cursor. Because of the limited bandwidth of the fibre-optic link, the shape of this very small peak could be distorted. The vertical cursor is fixed at the X-ray peak. Peak energy is around 60 keV (calculated by multiplying the peak voltage by the calibration factor). The timestamp of the RS is 01:23:27.769214 UTC.

© 2018 by the authors. Licensee MDPI, Basel, Switzerland. This article is an open access article distributed under the terms and conditions of the Creative Commons Attribution (CC BY) license (http://creativecommons.org/licenses/by/4.0/).
Share and Cite
MDPI and ACS Style
Hettiarachchi, P.; Cooray, V.; Diendorfer, G.; Pichler, H.; Dwyer, J.; Rahman, M. X-ray Observations at Gaisberg Tower. Atmosphere 2018, 9, 20. https://doi.org/10.3390/atmos9010020
AMA Style
Hettiarachchi P, Cooray V, Diendorfer G, Pichler H, Dwyer J, Rahman M. X-ray Observations at Gaisberg Tower. Atmosphere. 2018; 9(1):20. https://doi.org/10.3390/atmos9010020
Chicago/Turabian StyleHettiarachchi, Pasan, Vernon Cooray, Gerhard Diendorfer, Hannes Pichler, Joseph Dwyer, and Mahbubur Rahman. 2018. "X-ray Observations at Gaisberg Tower" Atmosphere 9, no. 1: 20. https://doi.org/10.3390/atmos9010020
Note that from the first issue of 2016, this journal uses article numbers instead of page numbers. See further details here.