Article

Characteristics and Sources of Heavy Metals in PM2.5 during a Typical Haze Episode in Rural and Urban Areas in Taiyuan, China

1
School of Environment and Safety Engineering, North University of China, Taiyuan 030051, China
2
School of Materials Science and Engineering, North University of China, Taiyuan 030051, China
3
Departments of Food & Chemical Engineering, Gansu Agricultural Technology College, Lanzhou 730000, China
4
Environmental Monitoring Center of Taiyuan, Taiyuan 030002, China
*
Authors to whom correspondence should be addressed.
Atmosphere 2018, 9(1), 2; https://doi.org/10.3390/atmos9010002
Submission received: 16 November 2017 / Revised: 17 December 2017 / Accepted: 19 December 2017 / Published: 21 December 2017
(This article belongs to the Section Air Quality)

Abstract

:
PM2.5 samples were collected in the rural and urban areas of Taiyuan, China during a typical haze episode and the heavy metals (Cr, Mn, Ni, Cu, Zn, As, Cd and Pb) in PM2.5 were analyzed. The haze was characterized by start-up stage with a daily mean PM2.5 of 149.34 ± 52.33 and 146.73 ± 18.96 μg m−3 in the rural and urban sites, respectively, a peak stage (288.20 ± 12.43 and 323.44 ± 5.23 μg m−3), and a weakening stage (226.59 ± 12.43 and 195.60 ± 2.93 μg m−3). The concentrations of PM2.5 in the rural and urban sites in the peak stage were 5.9 and 5.5 times higher than those in the normal stage, respectively. The order of concentrations of heavy metals in PM2.5 at the rural and urban sites were the same and are listed as follows: Zn > Pb > Mn > Cr > Cu > Ni > Cd > As. Pb at the rural site, As at the urban site, and Cd at the both sites failed to meet the air quality standard. The concentrations of Pb and Zn were higher at the rural site than those at the urban site. Principal component analysis indicated that the main sources of heavy metals for the rural area were raw coal combustion and soil/road dust, and for the urban area were coal combustion/industrial emissions, road/soil dust, and vehicle emissions/oil combustion.

1. Introduction

Currently, large-scale regions in North China are suffering from severe haze episodes [1,2,3,4,5], which are essentially caused by fine particles with aerodynamic diameter less than 2.5 μm (PM2.5) [3,6,7]. This has attracted great scientific and public attention [8,9,10,11,12,13]. PM2.5 can directly reduce atmospheric visibility by scattering and absorbing the sunlight [14,15]. In addition, PM2.5 can affect the amount of solar ultraviolet radiation reaching the Earth’s surface [16,17,18], the nutrient balance and acidity of soil [19,20], and climate change [21]. Chronic exposure to PM2.5 is associated with a wide range of diseases [4,10], mainly since atmospheric PM2.5 can carry varieties of pathogenic components, such as heavy metals, viruses, and bacteria. Previous studies have demonstrated the adverse health effect relationship between particulate matter exposure and toxic heavy metal elements [22,23,24,25]. Epidemiological studies carried out over the last decades have also demonstrated a strong relationship between exposure to elevated toxic heavy metal elements in ambient air and increased mortality and morbidity [23,26,27,28]. Heavy metals, such as class I carcinogenic contaminants (such as As (regarded as metal here), Ni, Cd, and Cr), class II(B) carcinogenic (such as Pb inorganics), and non-carcinogenic contaminants (such as Cu, Zn, and Mn) [29], in atmospheric PM2.5 can be enriched in the human body via inhalation, dermal absorption, and ingestion [30,31,32]. For example, to evaluate the exposure to heavy metals in the industrial area of Taranto, Southern Italy, Vimercati et al. [33,34] found high urinary concentrations of heavy metals (As, Cr, Mn, Hg, and Pb), which could be related to the presence of industrial plants. Subsequently, heavy metals in the human body would result in serious allergic respiratory disease and have a higher excess cancer risk to the exposed population [35,36]. For example, Pb, As, and Ni are considered to play etiological roles in some diseases, especially heart disease, stroke, kidney disease, and several blood diseases [37]. As and Cd may play a role in the development of dysglycemia (elevated fasting plasma glucose, impaired fasting glucose, and diabetes) [23].
Many studies on PM2.5 have been conducted, and most studies in China have focused on emissions from traffic and industry in megacities and developed economic areas (e.g., the Beijing-Tianjin-Hebei community, the delta region of Yangtze River and Pearl River, etc.) [3,7,8,12,15,22,38,39,40,41,42,43,44,45,46,47]. However, the pollution by heavy metals in PM2.5 in China’s rural areas have rarely been reported. Liu et al. [3] recently reported that the periodic emissions from farmers’ activities in the North China Plain possibly contributed to atmospheric water-soluble ions in Beijing. With the enhancement of farmers’ incomes in recent years, coal (especially raw coal) consumption by farmers in the north China is rapidly increasing to keep their houses warm in cold seasons [48], and hence the serious air pollution in rural areas of the north China should be paid great attention.
In the present study, filter samples of PM2.5 were collected simultaneously during a typical haze episode in both rural and urban areas in Taiyuan, which was ranked as the most air-polluted city in China. The concentrations of Cr, Mn, Ni, Cu, Zn, As, Cd, and Pb in PM2.5 were quantified and source-identified. This study will be helpful for future control measures in reducing pollutant emissions from rural areas.

2. Experiments

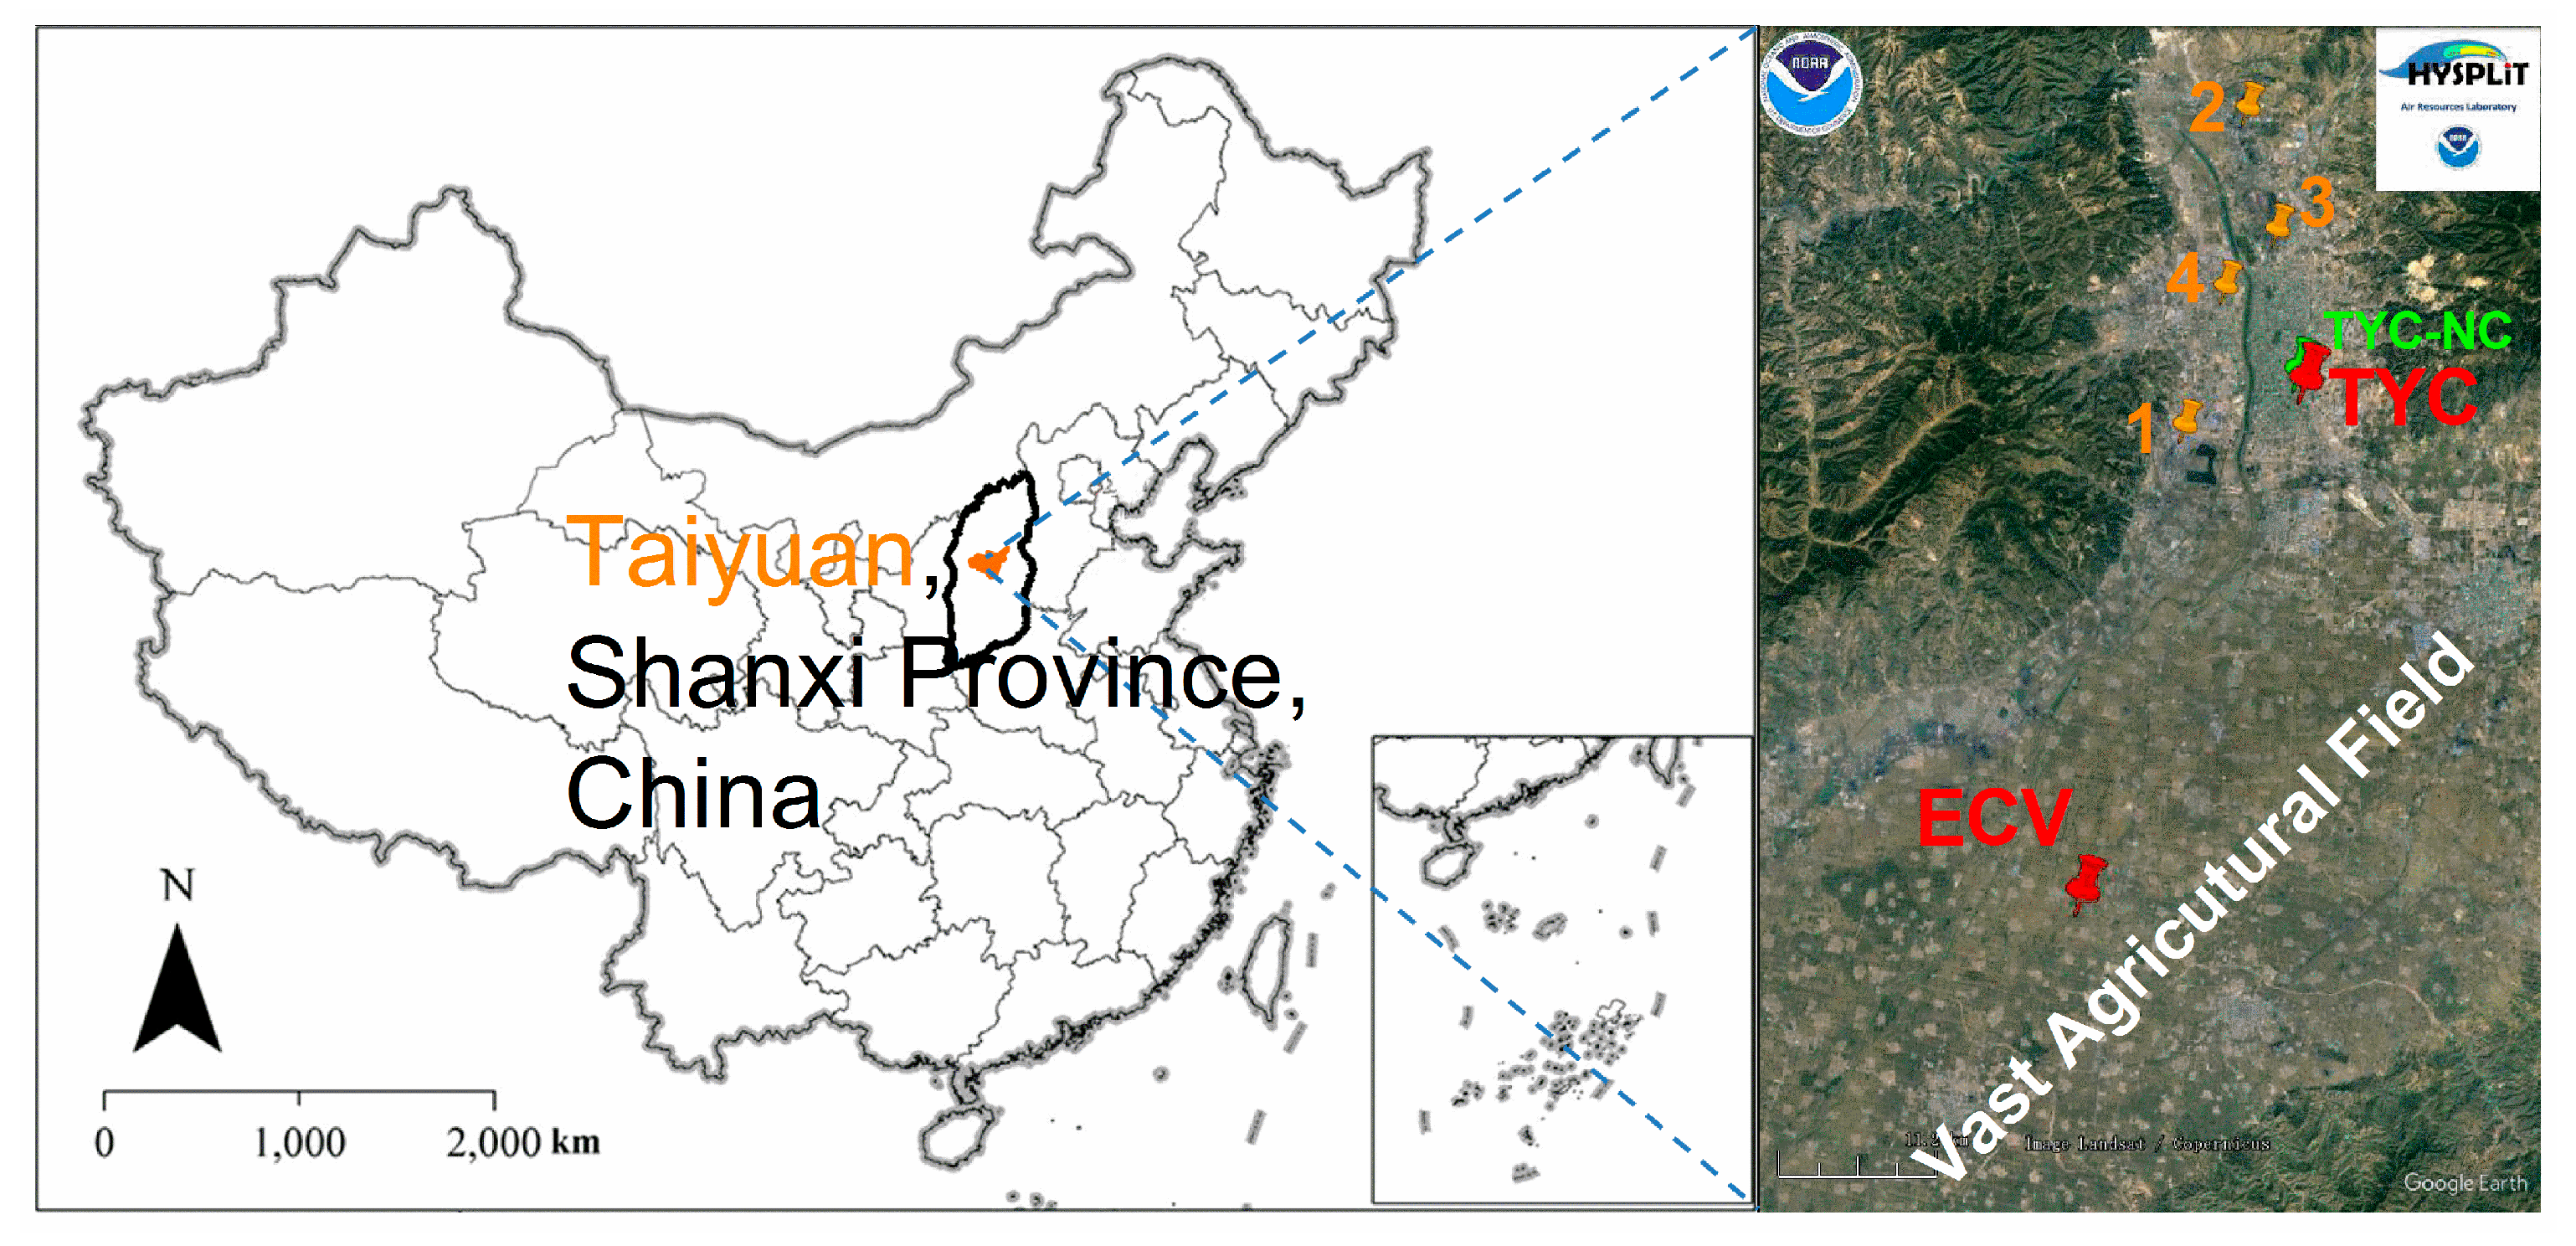
2.1. Description of the Study Area

Taiyuan, a typical city of heavy reliance on coal as a primary source of heat and power, is located in North China with a population of approximately 4.2 million. Its rural and urban land areas are respectively ~5500 km2 and ~1500 km2, and the terrain resembles a bowl surrounded by hills in its west, north, and east directions [49,50]. The southern plain of Taiyuan is a vast agricultural field where corn and wheat are mainly planted. The heating period in the urban region is usually five months (from November to March), while the raw-coal (even peat) burning in rural areas routinely lasts more than six months for heating and almost the whole year for cooking.
The rural sampling site in this work was selected on the rooftop of a field station (~5 m above ground) which is located in the vast agricultural field of Echi village (here referred to as ECV, 37.48° N, 112.41° E) in the south of Taiyuan. The ECV site is far away from industries, traffic, and other commercial emissions and represents the agricultural countryside. The urban sampling site in Taiyuan city (here referred to as TYC, 37.81° N 112.575° E) was on the rooftop (~27 m above ground) of a residential building, which stands in central urban area of Taiyuan and is about 0.9 km away from a national controlling air sampling site (TYC-NC, 37.8195° N, 112.57° E, ~25 m). There are two power plants and two large industrial facilities upstream of the urban site (TYC), such as the First and Second Power Stations, Taiyuan Iron and Steel Factory, and Taiyuan Heavy Machinery Factory, respectively. The detailed locations are presented in Figure 1.

2.2. Sampling

PM2.5 samples were collected on prebaked (600 °C, 4 h) quartz microfiber filters (90 mm, Munktell Ahlstrom, Falun, Sweden) for 24 h (starting at approximately 07:00 a.m.) by a PM2.5 sampler (KC-6120) at a flow rate of 100 L min−1. Before and after sampling, the filters were equilibrated for 24 h in a chamber with a constant temperature (~23 °C) and relative humidity (~50%) and then weighed by electronic microbalance (FA1004, Lichen, China). Each sample was finally stored in a dedicated filter container (100 mm) and preserved in a refrigerator (−10 °C) until analysis. Samples were collected from 7 to 22 November 2016. The wind speed and direction data were monitored at the TYC site by an anemometer (ZCF-5, Sipeik, China). The hourly PM2.5 concentrations at TYC-NC were obtained from https://data.epmap.org/.

2.3. Analysis of Heavy Metals

A quarter of the sample filter was cut into pieces and then dissolved in the mixtures of HNO3 (9 mL, 65%) and HClO4 (3 mL, 70%). After standing for 24 h, the solution was heated with a hotplate to a boil and the temperature was maintained until the solution had nearly evaporated. After cooling to room temperature, the residue was dissolved with 10 mL of 6.5% HNO3 and diluted in a 25-mL flask with ultrapure water. Then, the diluted solutions were transferred to numbered polyethylene vials and stored in a refrigerator (4 °C) for later analysis. Cr, Mn, Ni, Cu, Zn, As, Cd, and Pb were measured using an inductively coupled plasma optical emission spectrometer (ICP-OES, Agilent 5100). One blank filter (unexposed) was analyzed similarly for nine filter samples; the blank level was below the detection limits and therefore ignored.

3. Results and Discussion

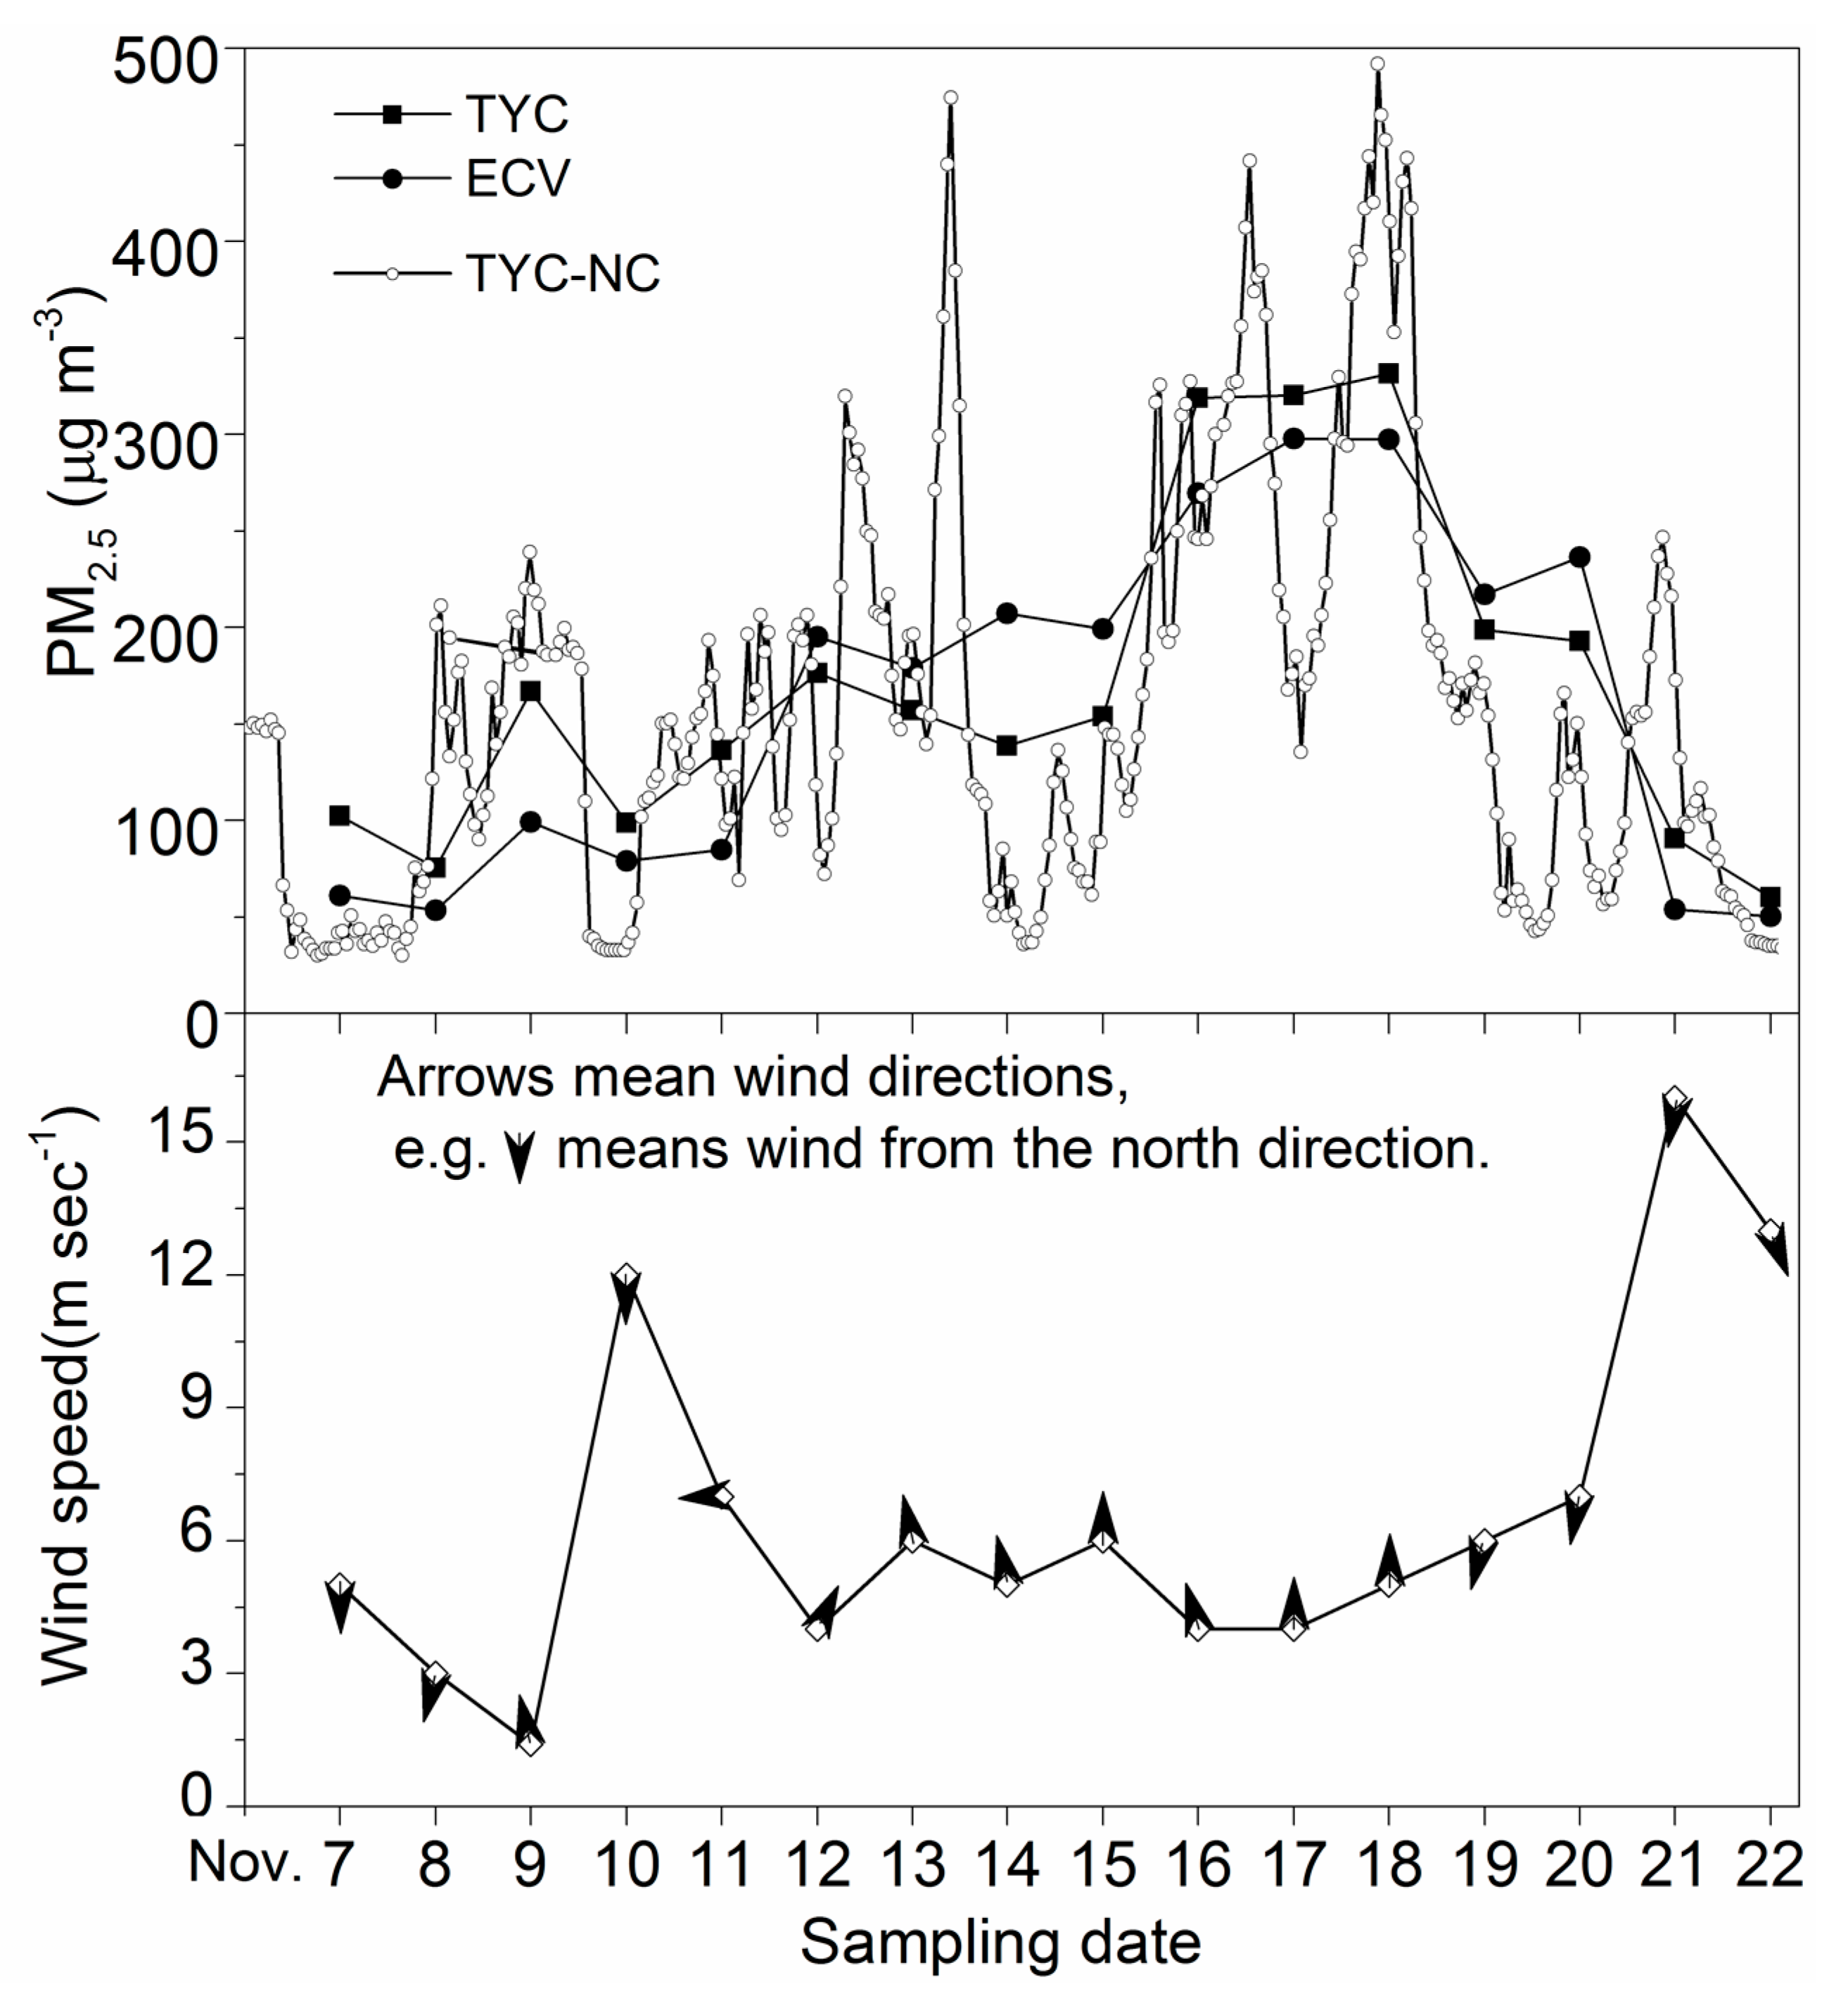
3.1. Levels of PM2.5

The levels of PM2.5 concentrations at the two sampling sites (ECV and TYC) and the hourly PM2.5 concentrations at TYC-NC were integrated into Figure 2 with wind speeds and directions. It is evident that the daily variation of PM2.5 at the rural and urban sites exhibited similar trends, but was roughly opposite to wind speed. Although some dissimilar values existed, such as those recorded on 14, 19, and 20 November, the temporal variation of PM2.5 at TYC was consistent with TYC-NC. All of the daily PM2.5 levels both in the rural and urban sites failed to meet the air quality limits (35 μg m−3 in standard I) set by the Ministry of Environmental Protection of China (MEPC). The haze episode can be divided into the normal stage and three haze stages (i.e., start-up stage, peak stage, and weakening stage). In the normal stage (i.e., from 7 to 8 November), the daily concentration ranges were 53.23~61.17 μg m−3 and 75.55~102.43 μg m−3 at the rural and urban sites, respectively. The concentrations of PM2.5 at the urban site were markedly higher than those at the rural site. In the start-up stage (i.e., from 9 to 15 November), the concentration ranges were 78.81~207.01 μg m−3 and 98.79~176.01 μg m−3 at the rural and urban sites with the mean staged concentrations of 149.34 ± 52.33 μg m−3 and 146.73 ± 18.96 μg m−3, respectively. Comparing the mean concentrations at the two sites during the start-up stage, there is no significant difference. However, as shown in Figure 2, the concentrations of PM2.5 were lower at the rural site than at the urban site from 9 to 11 November, and the opposite phenomena were observed from 12 to 15 November, which suggested that local emissions of PM2.5 were the main sources. Wind with a speed of 5.9 ± 2.0 m sec−1 was frequently from the south. The peak stage was from 16 to 18 November and the daily PM2.5 concentrations were 269.55–297.71 μg m−3 and 318.66–331.29 μg m−3 at the rural and the urban sites, respectively. Especially from the data monitored at the national controlling air sampling site of China, the hourly PM2.5 concentration at the urban area was as high as 492 μg m−3 in 18 November when Taiyuan was ranked as the most air-polluted city in China. Wind with a speed of 4.3 ± 0.4 m sec−1 was still from south. In the weakening stage (i.e., from 19 to 20 November), the daily concentrations were 217.02–236.15 μg m−3 and 192.67–198.53 μg m−3 at the rural and urban sites, respectively. Then, the PM2.5 concentrations returned to the normal levels from 21 to 22 November, and the daily concentrations were in the ranges of 50.39–53.97 μg m−3 and 60.31–90.58 μg m−3 at the rural and urban sites. The concentrations of PM2.5 at the rural and urban sites in the peak stage were about 5.9 and 5.5 times higher than those in the normal stages. The PM2.5 levels at the rural area were lower than those at the urban area in the normal stages and the peak stage, while the former were higher than the latter in the start-up stage and weakening stage, which suggested that, except for the contribution of industrial and traffic emissions, the emissions of PM2.5 from the rural area were also suspected to contribute to the atmospheric PM2.5 in Taiyuan city when wind came from the south. To reveal the influence of the air mass transport on PM2.5 in Taiyuan city, 24-h backward trajectories for clusters in the peak stage (18 November) and the normal stage (22 November) in Taiyuan were analyzed, and the results are illustrated in Figure 3. PM2.5 concentrations were accumulated when winds were from the south with a low speed, while wind from north diluted the pollution. As shown in Figure 3, in the start-up and the peak stages, winds from south swept through the southern plain and blew pollutants to the north, where the mountains in its west, north, and east directions slowed down their spreads, causing pollutants to descend upon the urban area. In the normal stage (e.g., 22 November), the concentration of PM2.5 declined sharply due to the winds from the north. Except for the weather and geographical conditions, the extremely high levels of PM2.5 during the haze episodes revealed strong sources of the pollutants around Taiyuan. According to Figure 2, in the start-up and peak stages, the daily concentrations of PM2.5 varied greatly while the wind direction with a low speed did not change rapidly during 13 to 18 November, which suggested that the local emissions of PM2.5 at the two sites played a pivotal role. In addition, there is no lag between ECV and TYC sites in terms of PM2.5, suggesting that the local emissions of PM2.5 at both sites are main sources. The residents in the rural area frequently and randomly increased coal burning for heating due to colder weather, while the burning amount of coal for central-heating and industries in the urban area remained stable during the short period, which was suspected to be the main reason for the significant differences between the two sites during the start-up and peak stages. Although residential coal consumption in the rural area only accounts for a small fraction of the total (e.g., ~4 tons raw coal per year used for cooking and heating in each household according to our previous survey), the emission factor of PM2.5 from farmers’ coal stoves (about 1054–12,910 mg kg−1) are usually about 1~3 orders of magnitude greater than those from coal power plants or industry boilers (about 16–100 mg kg−1) [3]. The activities of humans, such as coal burning for heating and cooking, were also suspected to make a significant contribution to the deterioration of the regional air quality in winter in other rural areas in the North China Plain [3]. The most serious pollution events (or haze days) in the North China Plain have usually been coincident with the activities of farmers in recent years [3,39,41].

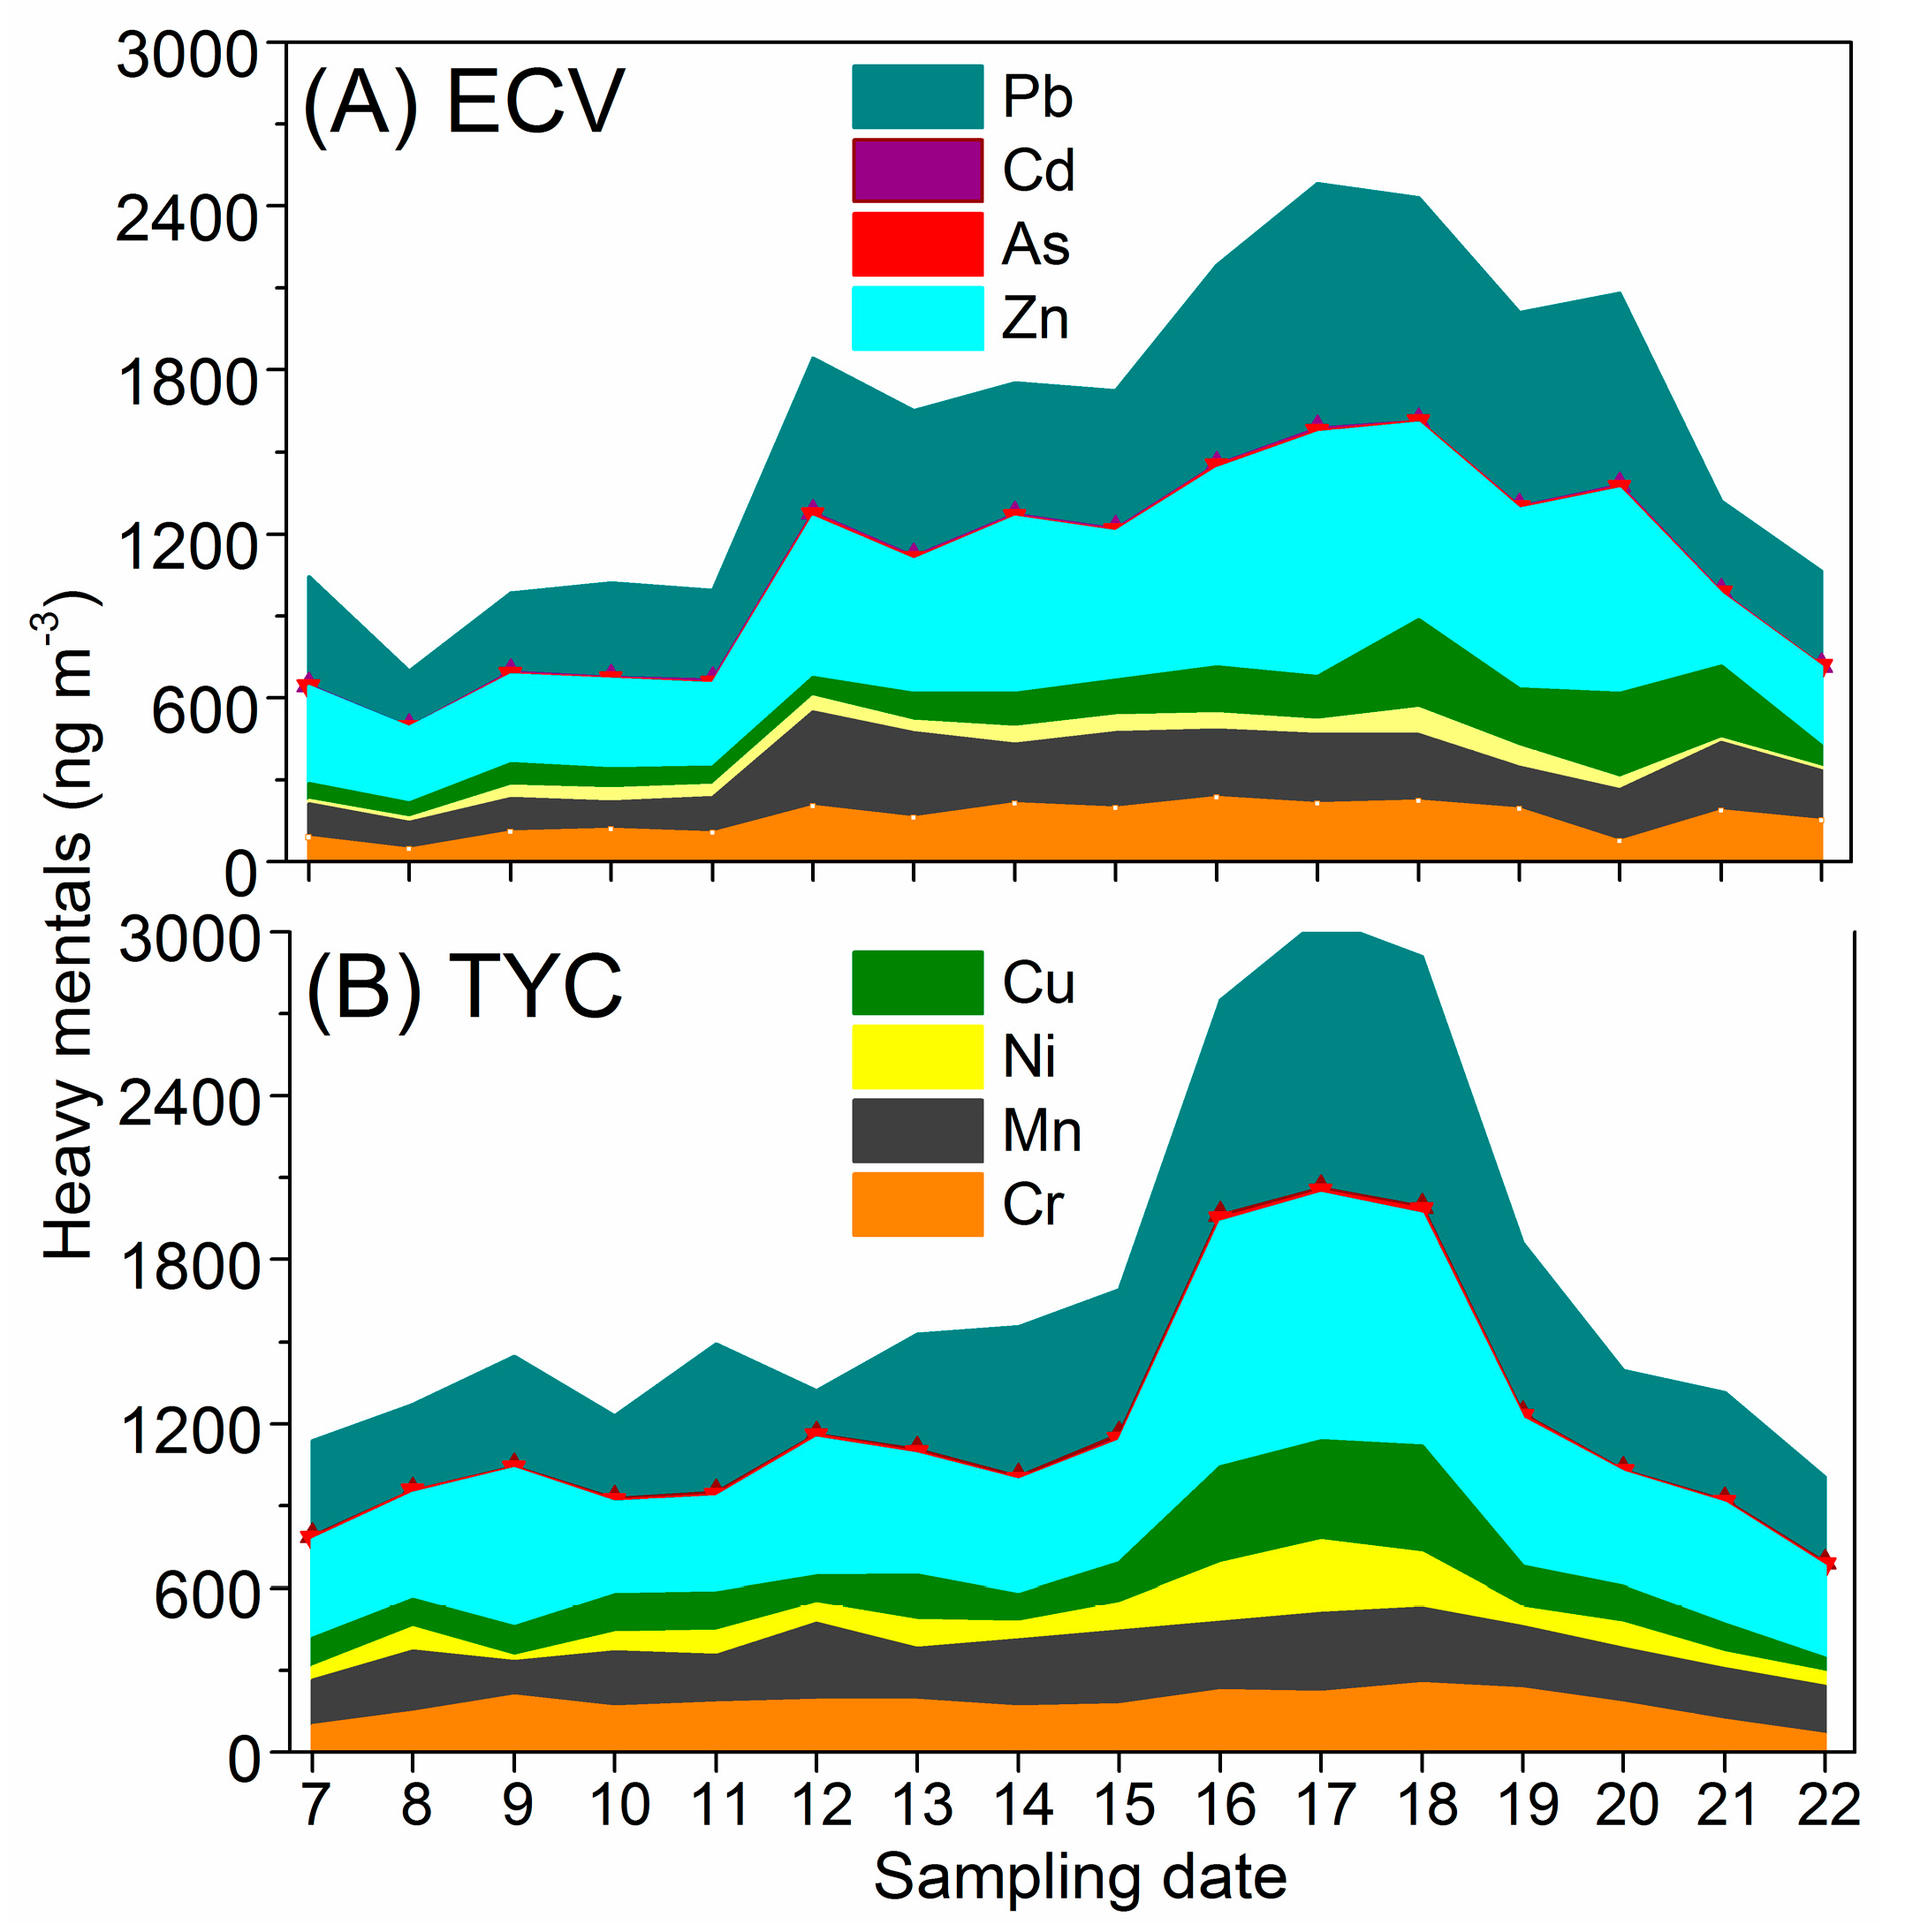
3.2. Levels of Heavy Metals in PM2.5

The daily variation of heavy metals in PM2.5 at the ECV and TYC during the sampling period is illustrated in Figure 4. It is evident that the concentrations of the heavy metals in PM2.5 also varied greatly during the sampling period. Comparing Figure 4 to Figure 2, the temporal variation of heavy metals was similar to that of PM2.5 with correlation coefficients (R2) of 0.925 at the rural site and 0.885 at the urban site (Figure 5), respectively, indicating that the concentration of heavy metals in PM2.5 measured could be used as an indicator of the pollution level in the rural and urban areas.
The mean concentrations of heavy metals in different stages determined in this study and those reported in other cities in China are summarized in Table 1. Although some essential directives mitigating the effects of traffic and industrial pollutants were announced and implemented in megacities and industrial areas in the past decade [10], heavy metals pollution in PM2.5 in this work was still found to be very serious during the sampling days. As shown in Table 1, it is evident that the levels of most heavy metals in PM2.5 in the present study were consistent with those reported in Taiyuan by other researchers [51,52], but much higher than most of those reported in other cities of China [38,42,45,53,54,55,56]. In particular, the concentrations of some carcinogenic contaminants were much higher than those reported in other cities. For example, the concentrations of Cr in this work were 1~3 orders of magnitude greater than those reported in other cities. However, the concentrations of Zn, As, and Cd in PM2.5 in the present study were lower than those in Guangzhou city [46] and the concentration of each heavy metal in this study was significantly lower than that in Foshan city [47].
In this study, Pb in the rural area, As in the urban area, and Cd in both the rural and urban areas failed to meet the air quality standard (500 ng m−3, 5 ng m−3, and 6 ng m−3, respectively) set by MEPC. As shown in Table 1, Zn and Pb were the most abundant metals in PM2.5 in both the rural and urban areas. The orders of concentrations of heavy metals in PM2.5 at the rural and urban sites were the same and are listed as follows: Zn > Pb > Mn > Cr > Cu > Ni > Cd > As. The concentration of Ni in the rural area was less than half of that in the urban region. Zn and Pb were slightly higher in the rural area than those in the urban region and the others in the rural area were slightly less than those in the urban area. These may have been ascribed to several factors, including topography and meteorological conditions as well as pollution sources. The sources of heavy metals will be discussed in the next section.

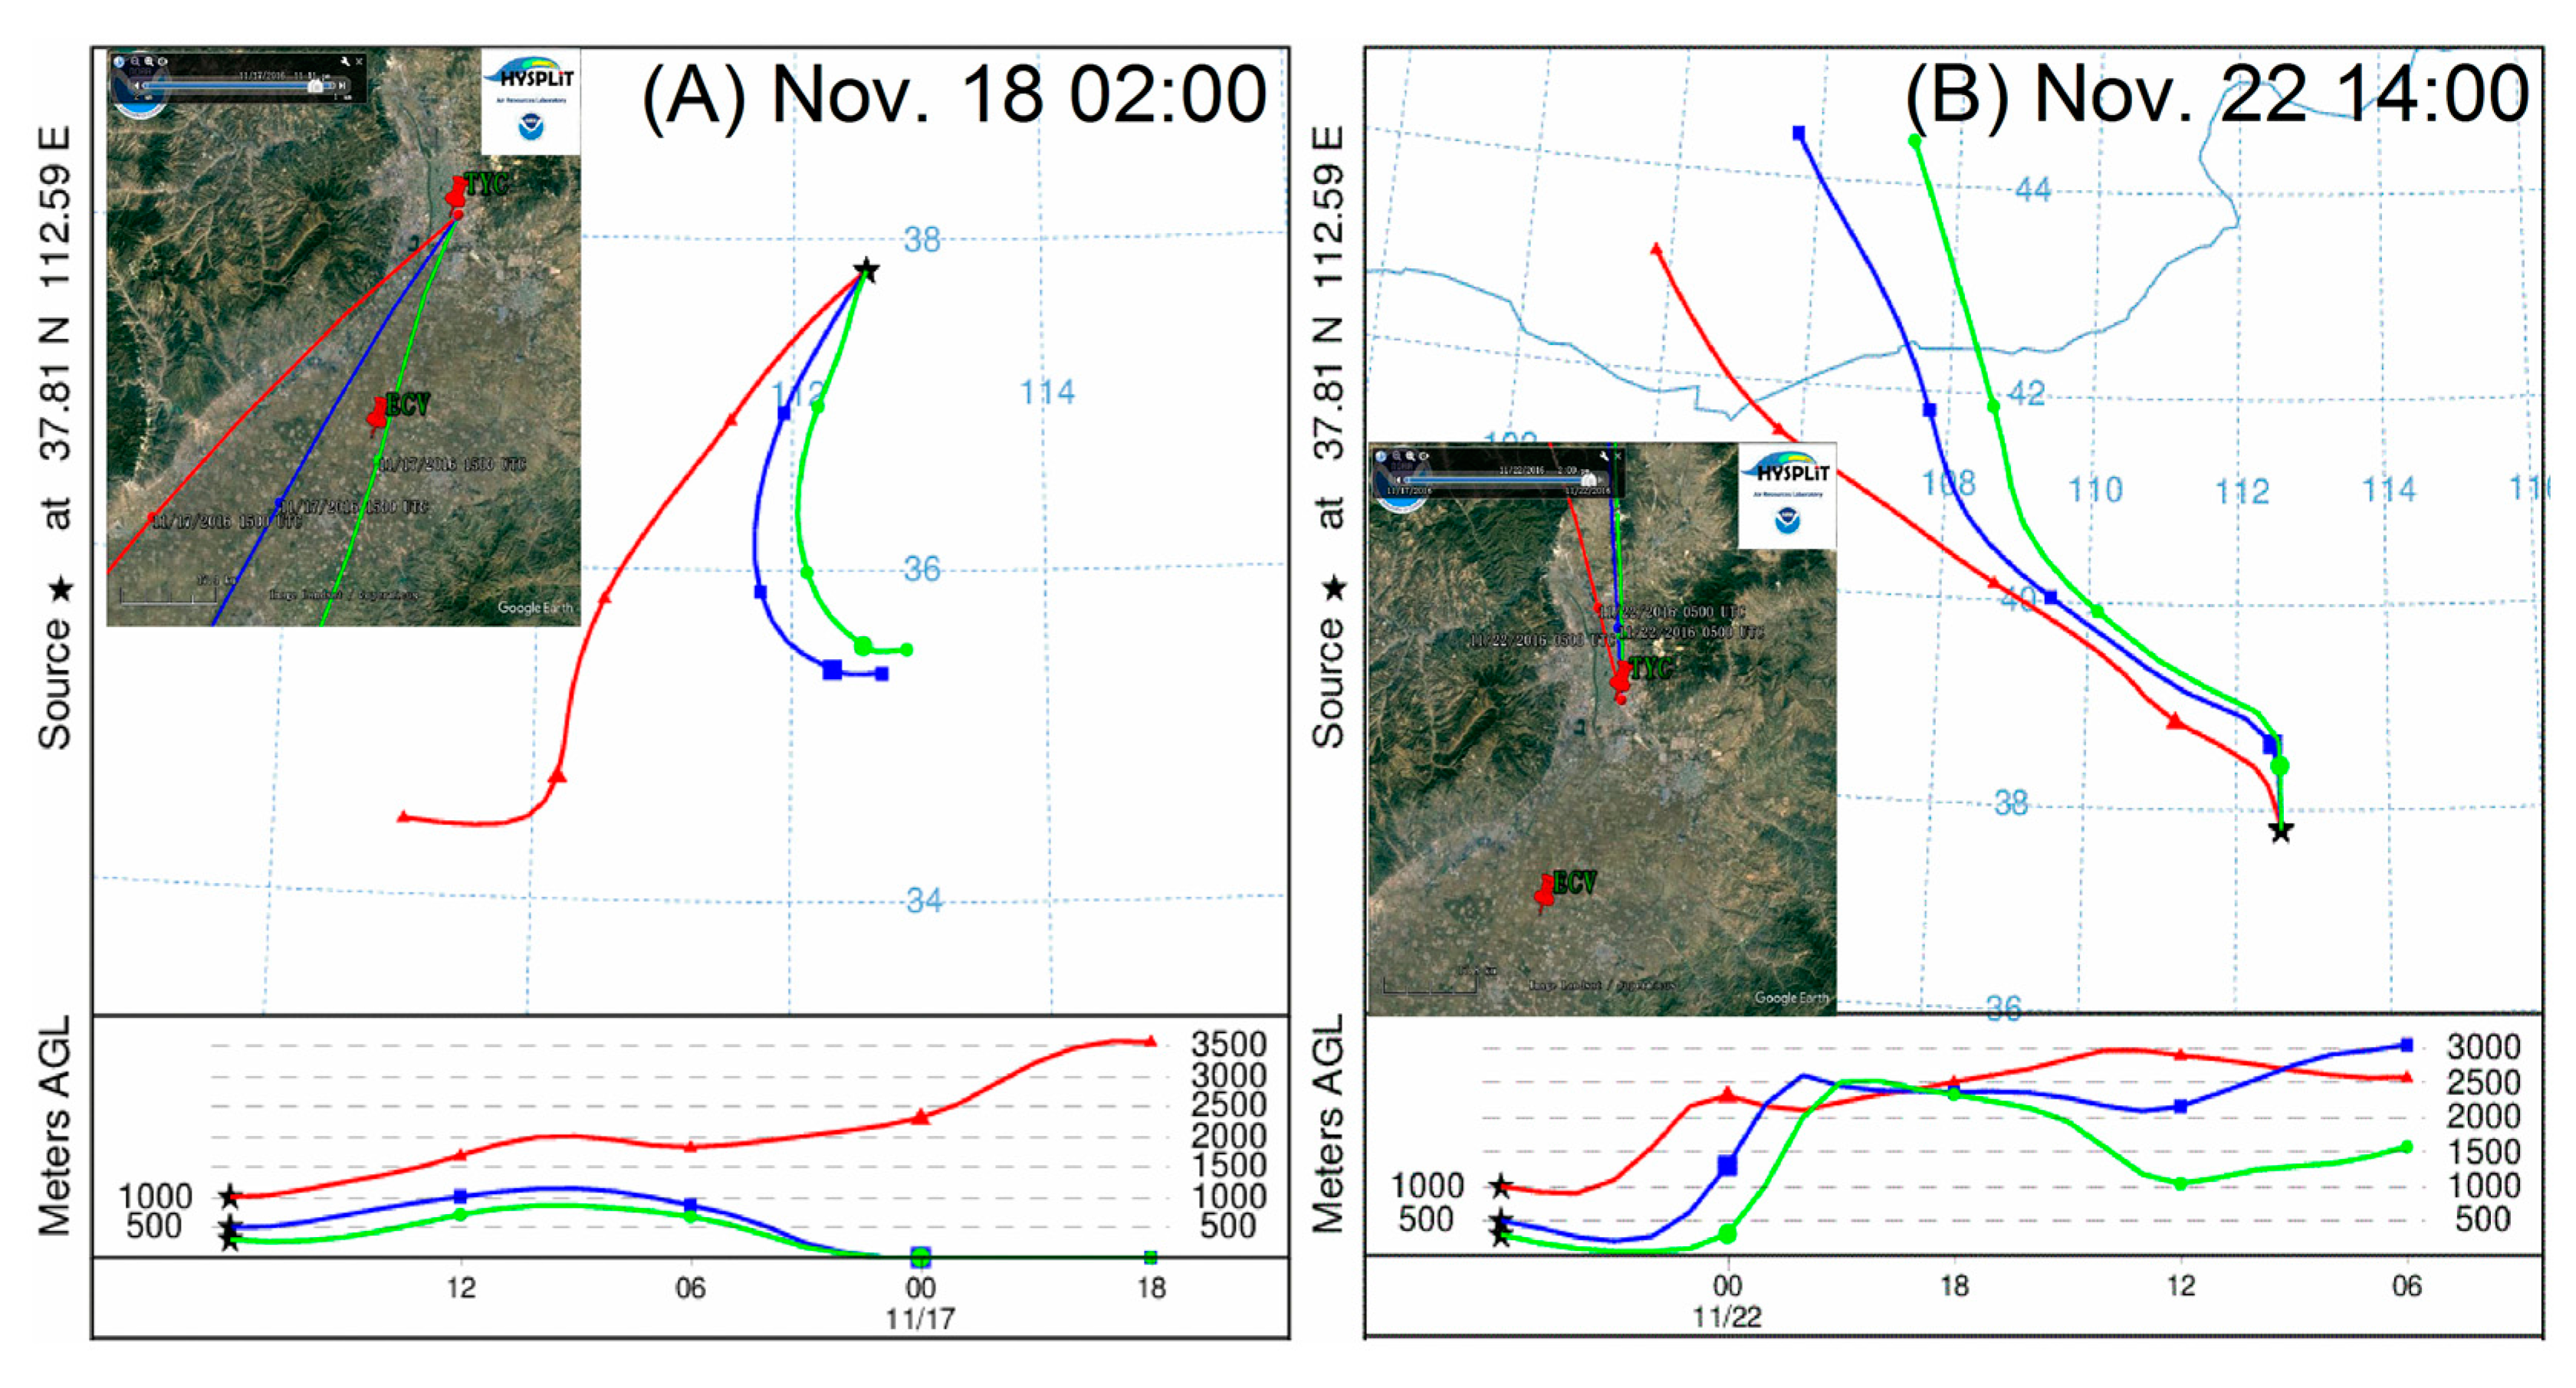
3.3. Source Identification

Principal component analysis (PCA) has been widely used to identify the major sources of air pollutant emissions [1,42,43,57,58]. PCA applies projection dimension reduction methods to convert several indicators into significant representative indicators without the damage of the original data [57,58]. In this study, source identification of heavy metals in PM2.5 was performed by using PCA (IBM SPSS, version 22). Only components with an eigenvalue greater than 1 were retained. The PCA results of heavy metals in daily PM2.5 during the sampling period are presented in Table 2.
At the ECV site, two principal components accounted for 88.13% of the total variance in the dataset. The first factor with an eigenvalue of 5.47 can explain 68.38% of the total variance of the data, with high loadings of Pb, Zn, Cu, Cr, Ni, and As. Zhang et al. [59] reported that coal combustion was the major emission source of Pb in airborne particulate matters. In this study, the concentration of Pb was slightly higher in the rural site than in the urban site (Table 1), suggesting that local sources in rural area emitted certain amounts of Pb into the local ambient atmosphere. Considering that leaded gasoline was phased out in China in 1997, vehicular emissions should no longer be one of the main sources of Pb. In the rural area, approximately 4 tons raw coal per household has been burned in a year, according to our previous survey, and heavy smoke from chimneys of the farmers’ coal stoves has been discharged directly into the atmosphere. According to the results reported by Zhang [44], the average content of Pb in coal produced in Shanxi province (62.56 ± 93.44 µg g−1) is far higher than the national average value (15.55 µg g−1 [60]) in China. Similarly, the others (As, Zn, Cu, Cr, and Ni) could be also related to raw coal combustion [30,43,61,62,63,64]. In addition, the ECV site is far away from industries, main traffic, and commercial emissions. Therefore, this factor should be identified as raw coal combustion. The second factor accounted for 19.75% of the total variance with an eigenvalue of 1.58 and had high loadings of Cd, Mn, As, Ni, Cr, and Cu. Natural soil dust such as Asian dust has high loadings of Mn and Cr [63,65,66]. Previous studies have shown that Mn, Ni, and Cr were the main pollutants in soil and street dust [63,67]. Lim et al. [68] reported that Mn is a marker for soil and re-suspension dust. Manoli et al. [69] also reported that road dust had high loadings of Mn and Cr. Therefore, the second factor can be identified as mixed sources of soil and road dust.
At the TYC site, the PCA results of heavy metals in PM2.5 showed three factors, accounting for 91.39% of the total variance. Moreover, 60.66% of the total variance with an eigenvalue of 4.85 was dominated by the first factor, which had high loadings of Pb, Cd, Ni, As, Zn, and Cu. This factor should be well associated with coal combustion (Pb, As, Zn) for industry, central-heating, as well as domestic coal-stove-heating and cooking and industrial emissions (As, Ni, Cd, Cu) [30,62,63,64,67,69,70,71]. Metallurgical industry, boiler factories, thermal power plants, etc. could generate huge amounts of hazardous waste and have the potential of releasing potentially toxic trace metals, such as Ni, Cd, Mn, As, Pb, Zn, and Cu, into the atmosphere [30,72]. The second component was mostly dependent upon Mn, Cr, As, and Cd, and accounted for 17.32% of the total variance with an eigenvalue of 1.39. This factor is associated with road and soil dust (Mn, Cr) [30,63,68,69]. The third factor, which explains 13.41% of the total variance with an eigenvalue of 1.07, was strongly correlated with the elements Cu, Zn, and Ni. This factor originated from vehicle emissions/oil combustion [65,70,71,72,73].

4. Conclusions

Based on the analysis of PM2.5 during the haze episode collected from rural and urban areas of Taiyuan in China, PM2.5 concentrations in both the rural and urban areas were extremely high. All of the daily PM2.5 levels both in the rural and urban sites failed to meet the air quality limits (35 μg m−3 in standard I) set by MEPC. During the haze episode, the concentrations of PM2.5 at the rural and urban sites in the peak stage were about 5.9 and 5.5 times higher than those in the normal stages. Wind from the south with a low speed showed an obvious accumulative effect on PM2.5, while wind from the north diluted the pollutants.
Pollution of heavy metals in PM2.5 during the haze episode was also very serious, e.g., Pb in the rural area, As in the urban area, and Cd in both the rural and urban areas failed to meet the air quality standard. The orders of concentrations of heavy metals in PM2.5 at the rural and urban sites were the same and are listed as follows: Zn > Pb > Mn > Cr > Cu > Ni > Cd > As.
According to the results of PCA, the major sources of heavy metals in PM2.5 at the rural site were raw coal combustion (Pb, Zn, Cu, Ni, and Cr) and soil and road dust (Mn and Cd). At the urban site, the major contributions to the heavy metals were from coal combustion (Pb, Zn, and As), industrial emissions (As, Ni, Cd, Cu), road and soil dust (Mn and Cr), and traffic emissions (Cu and Zn).

Acknowledgments

This work was financially supported by the Natural Science Foundation of Shanxi (201601D021135) and the Chinese National Natural Science Foundation (21707125).

Author Contributions

Kankan Liu, Qingmin Shang, and Liyuan Cao conceived and designed the experiments. Kankan Liu and Qingmin Shang wrote the paper; Changyuan Wan and Ping Song performed the experiments; Chanyuan Ma analyzed the data.

Conflicts of Interest

The authors declare no conflict of interest.

References

  1. Zhai, Y.; Liu, X.; Chen, H.; Xu, B.; Zhu, L.; Li, C.; Zeng, G. Source identification and potential ecological risk assessment of heavy metals in PM2.5 from Changsha. Sci. Total Environ. 2014, 493, 109–115. [Google Scholar] [CrossRef] [PubMed]
  2. Liang, C.S.; Duan, F.K.; He, K.B.; Ma, Y.L. Review on recent progress in observations, source identifications and countermeasures of PM2.5. Environ. Int. 2016, 86, 150–170. [Google Scholar] [CrossRef] [PubMed]
  3. Liu, P.; Zhang, C.; Mu, Y.; Liu, C.; Xue, C.; Ye, C. The possible contribution of the periodic emissions from farmers’ activities in the North China Plain to atmospheric water-soluble ions in Beijing. Atmos. Chem. Phys. 2016, 16, 10097–10109. [Google Scholar] [CrossRef]
  4. Chen, G.; Zhang, W.; Li, S.; Zhang, Y.; Williams, G.; Huxleyd, R. The impact of ambient fine particles on influenza transmission and the modification effects of temperature in China: A multi-city study. Environ. Int. 2017, 98, 82–88. [Google Scholar] [CrossRef] [PubMed]
  5. Yang, Y.; Zhou, R.; Yan, Y.; Yu, Y.; Liu, J.; Di, Y.; Du, Z.; Wu, D. Seasonal variations and size distributions of water-soluble ions of atmospheric particulate matter at Shigatse, Tibetan Plateau. Chemosphere 2016, 145, 560–567. [Google Scholar] [CrossRef] [PubMed]
  6. Guo, S.; Hu, M.; Zamora, M.L.; Peng, J.; Shang, D.; Zheng, J. Elucidating severe urban haze formation in China. Proc. Natl. Acad. Sci. USA 2014, 111, 17373–17378. [Google Scholar] [CrossRef] [PubMed]
  7. Huang, R.; Zhang, Y.; Bozzetti, C.; Ho, K.F.; Cao, J.; Han, Y. High secondary aerosol contribution to particulate pollution during haze events in China. Nature 2014, 514, 218–222. [Google Scholar] [CrossRef] [PubMed] [Green Version]
  8. Zhang, R.; Jing, J.; Tao, J.; Hsu, S.C.; Wang, G.; Cao, J. Chemical characterization and source apportionment of PM2.5 in Beijing: Seasonal perspective. Atmos. Chem. Phys. 2013, 13, 7053–7074. [Google Scholar] [CrossRef]
  9. Pui, D.Y.H.; Chen, S.C.; Zuo, Z. PM2.5 in China: Measurements, sources, visibility and health effects, and mitigation. Particuology 2014, 13, 1–26. [Google Scholar] [CrossRef]
  10. Tang, D.; Wang, C.; Nie, J.; Chen, R.; Niu, Q.; Kan, H. Health benefits of improving air quality in Taiyuan, China. Environ. Int. 2014, 73, 235–242. [Google Scholar] [CrossRef] [PubMed]
  11. Uno, I.; Sugimoto, N.; Shimizu, A.; Yumimoto, K.; Hara, Y.; Wang, Z. Record heavy PM2.5 air pollution over China in January 2013: Vertical and horizontal dimensions. Sola 2014, 10, 136–140. [Google Scholar] [CrossRef]
  12. Zheng, G.J.; Duan, F.K.; Su, H.; Ma, Y.L.; Cheng, Y.; Zheng, B. Exploring the severe winter haze in Beijing: The impact of synoptic weather, regional transport and heterogeneous reactions. Atmos. Chem. Phys. 2015, 15, 2969–2983. [Google Scholar] [CrossRef]
  13. Liu, M.; Huang, Y.; Ma, Z.; Jin, Z.; Liu, X.; Wang, H. Spatial and temporal trends in the mortality burden of air pollution in China: 2004–2012. Environ. Int. 2017, 98, 75–81. [Google Scholar] [CrossRef] [PubMed]
  14. Buseck, P.R.; Pósfai, M. Airborne minerals and related aerosol particles: Effects on climate and the environment. Proc. Natl. Acad. Sci. USA 1999, 96, 3372–3379. [Google Scholar] [CrossRef] [PubMed]
  15. Cheng, Y.; Eichler, E.; Wiedensohler, A.; Heintzenberg, J.; Zhang, Y.; Hu, M. Mixing state of elemental carbon and non-light-absorbing aerosol components derived from in situ particle optical properties at Xinken in Pearl River Delta of China. J. Geophys. Res. 2006, 111, D20204. [Google Scholar] [CrossRef]
  16. Chubarova, N.E. Influence of aerosol and atmospheric gases on ultraviolet radiation in different optical conditions including smoky mist of 2002. Dokl. Earth Sci. 2004, 394, 62–67. [Google Scholar]
  17. Tzanis, C.; Tsivola, E.; Efstathiou, M.; Varotsos, C. Forest fires pollution impact on the solar UV irradiance at the ground. Fresenius Environ. Bull. 2009, 18, 2151–2158. [Google Scholar]
  18. Varotsos, C.; Efstathiou, M.; Tzanis, C.; Deligiorgi, D. On the limits of the air pollution predictability: The case of the surface ozone at Athens, Greece. Environ. Sci. Pollut. Res. 2012, 19, 295–300. [Google Scholar] [CrossRef] [PubMed]
  19. Yun, H.J.; Yi, S.M.; Kim, Y.P. Dry deposition fluxes of ambient particulate heavy metals in a small city, Korea. Atmos. Environ. 2002, 36, 5449–5458. [Google Scholar] [CrossRef]
  20. Amanollahi, J.; Tzanis, C.; Abdullah, A.M.; Ramli, M.F.; Pirasteh, S. Development of the models to estimate particulate matter from thermal infrared band of Landsat Enhanced Thematic Mapper. Int. J. Environ. Sci. Technol. 2013, 10, 1245–1254. [Google Scholar] [CrossRef]
  21. Haywood, J.; Boucher, O. Estimates of the direct and indirect radiative forcing due to tropospheric aerosols: A review. Rev. Geophys. 2000, 38, 513–543. [Google Scholar] [CrossRef]
  22. Zhang, N.; Han, B.; He, F.; Xu, J.; Niu, C.; Zhou, J.; Kong, S.; Bai, Z.; Xu, H. Characterization, health risk of heavy metals, and source apportionment of atmospheric PM2.5 to children in summer and winter: An exposure panel study in Tianjin, China. Air Qual. Atmos. Health 2015, 8, 347–357. [Google Scholar] [CrossRef]
  23. Lai, C.H.; Lin, C.H.; Liao, C.C. Respiratory deposition and health risk of inhalation of particle-bound heavy metals in the carbon black feeding area of a tire manufacturer. Air. Qual. Atmos. Health. 2017. [Google Scholar] [CrossRef]
  24. Heys, K.A.; Shore, R.F.; Pereira, M.G.; Jones, K.C.; Martin, F.L. Risk assessment of environmental mixture effects. RSC Adv. 2016, 6, 47844–47857. [Google Scholar]
  25. Rodriguez-Espinosa, P.F.; Flores-Rangel, R.M.; Mugica-Alvarez, V.; Morales-Garcia, S.S. Sources of trace metals in PM10 from a petrochemical industrial complex in Northern Mexico. Air Qual. Atmos. Health 2017, 10, 69–84. [Google Scholar] [CrossRef]
  26. Pope, C.A.; Burnett, R.T.; Thun, M.J.; Calle, E.E.; Krewski, D.; Ito, K.; Thurston, G.D. Lung cancer, cardiopulmonary mortality, and long-term exposure to fine particulate air pollution. JAMA 2002, 287, 1132–1141. [Google Scholar] [CrossRef] [PubMed]
  27. Dockery, D.W.; Pope, C.A. Acute respiratory effects of particulate air pollution. Annu. Rev. Public Health 1994, 15, 107–132. [Google Scholar] [CrossRef] [PubMed]
  28. Pope, C.A.; Dockery, D.W. Health effects of fine particulate air pollution: Lines that connect. J. Air Waste Manag. Assoc. 2006, 56, 709–742. [Google Scholar] [CrossRef] [PubMed]
  29. International Agency for Research on Cancer (IARC). Agents Classified by the IARC Monographs, Vol. 1–120. Available online: http://monographs.iarc.fr/ENG/Classification/ClassificationsAlphaOrder.pdf (assessed on 27 October 2017).
  30. Cheng, X.; Huang, Y.; Long, Z.; Ni, S.; Shi, Z.; Zhang, C. Characteristics, Sources and Health Risk Assessment of Trace Metals in PM10 in Panzhihua, China. Bull. Environ. Contam. Tox. 2016, 98, 76–83. [Google Scholar] [CrossRef] [PubMed]
  31. Xue, M.; Yang, Y.; Ruan, J.; Xu, Z. Assessment of Noise and Heavy Metals (Cr, Cu, Cd, Pb) in the Ambience of the Production Line for Recycling Waste Printed Circuit Boards. Environ. Sci. Technol. 2012, 46, 494–499. [Google Scholar] [CrossRef] [PubMed]
  32. Ferreira-Baptista, L.; De Miguel, E. Geochemistry and risk assessment of street dust in Luanda, Angola: A tropical urban environment. Atmos. Environ. 2005, 38, 4501–4512. [Google Scholar] [CrossRef] [Green Version]
  33. Vimercati, L.; Baldassarre, A.; Gatti, M.F.; Gagliardi, T.; Serinelli, M.; De Maria, L.; Caputi, A.; Dirodi, A.A.; Galise, I.; Cuccaro, F.; et al. Non-occupational exposure to heavy metals of the residents of an industrial area and biomonitoring. Environ. Monit. Assess. 2016, 188, 673. [Google Scholar] [CrossRef] [PubMed]
  34. Vimercati, L.; Gatti, M.F.; Gagliardi, T.; Cuccaro, F.; De Maria, L.; Caputi, A.; Quarato, M.; Baldassarre, A. Environmental exposure to arsenic and chromium in an industrial area. Environ. Sci. Pollut. Res. 2017, 24, 11528–11535. [Google Scholar] [CrossRef] [PubMed]
  35. Peled, R. Air pollution exposure: Who is at high risk? Atmos. Environ. 2011, 45, 1781–1785. [Google Scholar] [CrossRef]
  36. Taner, S.; Pekey, B.; Pekey, H. Fine particulate matter in the indoor air of barbeque restaurants: Elemental compositions, sources and health risks. Sci. Total Environ. 2013, 454–455, 79–87. [Google Scholar] [CrossRef] [PubMed]
  37. Järup, L. Hazards of heavy metal contamination. Br. Med. Bull. 2003, 68, 167–182. [Google Scholar] [CrossRef] [PubMed]
  38. Wang, J.; Hu, Z.; Chen, Y.; Chen, Z.; Xu, S. Contamination characteristics and possible sources of PM10 and PM2.5 in different functional areas of Shanghai. China. Atmos. Environ. 2013, 68, 221–229. [Google Scholar] [CrossRef]
  39. Li, W.; Zhou, S.; Wang, X.; Xu, Z.; Yuan, C.; Yu, Y.; Zhang, Q.; Wang, W. Integrated evaluation of aerosols from regional brown hazes over northern China in winter: Concentrations, sources, transformation, and mixing states. J. Geophys. Res. 2011, 116, D09301. [Google Scholar] [CrossRef]
  40. Wang, Q.; Bi, X.; Wu, J.; Zhang, Y.; Feng, Y. Heavy metals in urban ambient PM10 and soil background in eight cities around China. Environ. Monit. Assess. 2013, 185, 1473–1482. [Google Scholar] [CrossRef] [PubMed]
  41. Yang, Y.R.; Liu, X.G.; Qu, Y.; An, J.L.; Jiang, R.; Zhang, Y.H.; Sun, Y.L.; Wu, Z.J.; Zhang, F.; Xu, W.Q.; et al. Characteristics and formation mechanism of continuous hazes in China: A case study during the autumn of 2014 in the North China Plain. Atmos. Chem. Phys. 2015, 15, 8165–8178. [Google Scholar] [CrossRef]
  42. Hu, X.; Zhang, Y.; Ding, Z.; Wang, T.; Lian, H.; Sun, Y.; Wu, J. Bioaccessibility and health risk of arsenic and heavy metals (Cd, Co., Cr, Cu, Ni, Pb, Zn and Mn) in TSP and PM2.5 in Nanjing, China. Atmos. Environ. 2012, 57, 146–152. [Google Scholar] [CrossRef]
  43. Chen, P.; Bi, X.; Zhang, J.; Wu, J.; Feng, Y. Assessment of heavy metal pollution characteristics and human health risk of exposure to ambient PM2.5 in Tianjin, China. Particuology 2015, 20, 104–109. [Google Scholar] [CrossRef]
  44. Li, H.; Wu, H.; Wang, Q.; Yang, M.; Li, F.; Sun, Y.; Qian, X.; Wang, J.; Wang, C. Chemical partitioning of fine particle-bound metals on haze–fog and non-haze–fog days in Nanjing, China and its contribution to human health risks. Atmos. Res. 2017, 183, 142–150. [Google Scholar] [CrossRef]
  45. Gao, J.; Wang, K.; Wang, Y.; Liu, S.; Zhu, C.; Hao, J.; Liu, H.; Hua, S.; Tian, H. Temporal-spatial characteristics and source apportionment of PM2.5 as well as its associated chemical species in the Beijing-Tianjin-Hebei region of China. Environ. Pollute. 2017, 233, 714–724. [Google Scholar] [CrossRef] [PubMed]
  46. Wang, X.; Bi, X.; Sheng, G.; Fu, J.M. Chemical composition and sources of PM10 and PM2.5 aerosols in Guangzhou, China. Environ. Monit. Assess. 2006, 119, 425–439. [Google Scholar] [CrossRef] [PubMed]
  47. Tan, J.; Duan, J.; Ma, Y.; Yang, F.M.; Cheng, Y.; He, K.B.; Yu, Y.C.; Wang, J.W. Source of atmospheric heavy metals in winter in Foshan, China. Sci. Total Environ. 2014, 493, 262–270. [Google Scholar] [CrossRef] [PubMed]
  48. Liu, K.; Zhang, C.; Cheng, Y.; Liu, C.; Zhang, H.; Zhang, G. Serious BTEX pollution in rural area of the North China Plain during winter season. J. Environ. Sci. 2015, 30, 186–190. [Google Scholar] [CrossRef] [PubMed]
  49. Meng, Z.Y.; Jiang, X.M.; Yan, P.; Lin, W.L.; Zhang, H.D.; Wang, Y. Characteristics and sources of PM2.5 and carbonaceous species during winter in Taiyuan, China. Atmos. Environ. 2007, 41, 6901–6908. [Google Scholar] [CrossRef]
  50. He, Q.; Yan, Y.; Guo, L.; Zhang, Y.; Zhang, G.; Wang, X. Characterization and source analysis of water-soluble inorganic ionic species in PM2.5 in Taiyuan city, China. Atmos. Res. 2017, 184, 48–55. [Google Scholar] [CrossRef]
  51. Yang, H.; Zhang, J.; Wang, W.; Wang, Y.; Zhang, Y. The Elemental Pollution Characteristics and Source Apportionment of Atmospheric Particulate in Taiyuan. Environ. Monit. China 2015, 31, 24–28. (In Chinese) [Google Scholar]
  52. Cui, J.; Zhang, Z.; Xia, N.; Ping, F.; Geng, H. Pollution characteristics of heavy metals in PM2.5 during four seasons in Taiyuan City. Acta Sci. Circumst. 2016, 36, 1566–1572. (In Chinese) [Google Scholar]
  53. Fang, G.C.; Chang, C.N.; Chu, C.C.; Wu, Y.S.; Fu, P.P.C.; Yang, I.L.; Chen, M.H. Characterization of particulate, metallic elements of TSP, PM2.5 and PM2.5–10 aerosols at a farm sampling site in Taiwan, Taichung. Sci. Total Environ. 2003, 308, 157–166. [Google Scholar] [CrossRef]
  54. Zhou, S.; Yuan, Q.; Li, W.; Lu, Y.; Zhang, Y.; Wang, W. Trace metals in atmospheric fine particles in one industrial urban city: Spatial variations, sources, and health implications. J. Environ. Sci. 2014, 26, 205–213. [Google Scholar] [CrossRef]
  55. Bao, Z.; Feng, Y.C.; Jiao, L.; Hong, S.M.; Liu, W.G. Characterization and source apportionment of PM2.5 and PM10 in Hangzhou. Environ. Monit. China 2010, 26, 44–48. [Google Scholar]
  56. Hagler, G.S.W.; Bergin, M.H.; Salmon, L.G.; Yu, J.Z.; Wan, E.C.H.; Zheng, M.; Zeng, L.M.; Kiang, C.S.; Zhang, Y.H.; Schauer, J.J. Local and regional anthropogenic influence on PM2.5 elements in Hong Kong. Atmos. Environ. 2007, 41, 5994–6004. [Google Scholar] [CrossRef]
  57. Querol, X.; Pey, J.; Minguillón, M.; Pérez, N.; Alastuey, A.; Viana, M. PM speciation and sources in Mexico during the MILAGRO-2006 Campaign. Atmos. Chem. Phys. 2008, 8, 111–128. [Google Scholar] [CrossRef]
  58. Thurston, G.D.; Spengler, J.D. A quantitative assessment of source contributions to inhalable particulate matter pollution in metropolitan Boston. Atmos. Environ. 1985, 19, 9–25. [Google Scholar] [CrossRef]
  59. Zhang, X.K. The Content of Trace Metals in Coals from Shanxi, Henan Province and Their Mode of Occurrences. Master’s Thesis, Henan Polytechnic University, Jiaozuo, China, 2010; p. 37. (In Chinese). [Google Scholar]
  60. Ren, D.Y.; Zhao, F.H.; Dai, S.F. Geochemistry of Trace Elements in Coal; Science Press: Beijing, China, 2006; p. 290. (In Chinese) [Google Scholar]
  61. Zhang, Y.P.; Wang, X.F.; Chen, H.; Yang, X.; Chen, J.M.; Allen, J.O. Source apportionment of lead-containing aerosol particles in Shanghai using single particle mass spectrometry. Chemosphere 2009, 74, 501–507. [Google Scholar] [CrossRef] [PubMed]
  62. Allen, A.G.; Nemitz, E.; Shi, J.P.; Harrison, R.M.; Greenwood, J.C. Size distribution of trace metals in atmospheric aerosol in the United Kingdom. Atmos. Environ. 2001, 35, 4581–4591. [Google Scholar] [CrossRef]
  63. Lee, B.K.; Hieu, N.T. Seasonal Variation and Sources of Heavy Metals in Atmospheric Aerosols in a Residential Area of Ulsan, Korea. Aerosol Air Qual. Res. 2011, 11, 679–688. [Google Scholar] [CrossRef]
  64. Mansha, M.; Ghauri, B.; Rahman, S.; Amman, A. Characterization and source apportionment of ambient air particulate matter (PM2.5) in Karachi. Sci. Total Environ. 2012, 425, 176–183. [Google Scholar] [CrossRef] [PubMed]
  65. Lee, B.K.; Jun, N.Y.; Lee, H.K. Comparison of Particular Matter Characteristics before, during and after Asian Dust Events in Incheon and Ulsan, Korea. Atmos. Environ. 2004, 38, 1535–1545. [Google Scholar] [CrossRef]
  66. Zhao, J.; Zhang, F.; Xu, Y.; Chen, J.; Yin, L.; Shang, X.; Xu, L. Chemical Characteristics of Particulate Matter during a Heavy Dust Episode in a Coastal City, Xiamen, 2010. Aerosol Air Qual. Res. 2011, 11, 299–308. [Google Scholar] [CrossRef]
  67. Chang, S.H.; Wang, K.S.; Chang, H.F.; Ni, W.W.; Wu, B.J.; Wong, R.H.; Lee, H.S. Comparison of Source Identification of Metals in Road-dust and Soil. Soil Sediment Contam. 2009, 18, 669–683. [Google Scholar] [CrossRef]
  68. Lim, J.M.; Lee, J.H.; Moon, J.H.; Chung, Y.S.; Kim, K.H. Airborne PM10 and metals from multifarious sources in an industrial complex area. Atmos. Res. 2010, 96, 53–64. [Google Scholar] [CrossRef]
  69. Manoli, E.; Voutsa, D.; Samara, C. Chemical Characterization and Source Identification/Apportionment of Fine and Coarse Air Particles in Thessaloniki, Greece. Atmos. Environ. 2002, 36, 949–961. [Google Scholar] [CrossRef]
  70. Samara, C.; Voutsa, D. Size Distribution of Airborne Particulate Matter and Associated Heavy Metals in the Roadside Environment. Chemosphere 2005, 59, 1197–1206. [Google Scholar] [CrossRef] [PubMed]
  71. Viana, M.; Kuhlbusch, T.A.J.; Querol, X.; Alastuey, A.; Harrison, R.M.; Hopke, P.K.; Winiwarter, W.; Vallius, M.; Szidat, S.; Prévôt, A.S.H. Source Apportionment of Particulate Matter in Europe: A Review of Methods and Results. J. Aerosol Sci. 2008, 39, 827–849. [Google Scholar] [CrossRef]
  72. Sonia, C.; de la Rosa, J.D.; de la Campa, A.M.S.; González-Castanedo, Y.; Fernández-Caliani, J.C.; Gonzalez, I.; Romero, A. Contribution of mine wastes to atmospheric metal deposition in the surrounding area of an abandoned heavily polluted mining district (Rio Tinto Mines, Spain). Sci. Total Environ. 2013, 449, 363–372. [Google Scholar]
  73. Liacos, J.W.; Kam, W.; Delfino, R.J.; Schauer, J.J.; Sioutas, C. Characterization of organic, metal and trace element PM2.5 species and derivation of freeway-based emission rates in Los Angeles, CA. Sci. Total Environ. 2012, 435–436, 159–166. [Google Scholar] [CrossRef] [PubMed]
Figure 1. Locations of the sampling sites and the main industries (ECV and TYC represent the sampling sites at Echi village and Taiyuan city, respectively; TYC-NC is a national controlling air sampling site near TYC; 1, 2, 3, and 4 are the First and Second Power Stations, Taiyuan Iron and Steel Factory, and Taiyuan Heavy Machinery Factory, respectively).
Atmosphere 09 00002 g001
Figure 2. The concentration variation of PM2.5 and wind speeds and directions during the sampling period.
Atmosphere 09 00002 g002
Figure 3. The 24-h backward air-mass trajectories in the peak haze stage (A) and in the normal stage (B).
Atmosphere 09 00002 g003
Figure 4. Variation of heavy metals in PM2.5 at ECV and TYC.
Atmosphere 09 00002 g004
Figure 5. The correlation between PM2.5 and the sum of metal mass measured at ECV and TYC.
Atmosphere 09 00002 g005
Table 1. Concentrations (ng m−3) of heavy metals (mean concentrations and standard deviations) in PM2.5 in different haze stages at ECV and TYC and other cities of China.
SitesCrMnNiCuZnAsCdPbRef.
TaiyuanNormal stageECV116.17 ± 50.87165.05 ± 52.7113.21 ± 1.09114.96 ± 75.72301.93 ± 29.401.64 ± 0.511.80 ± 0.65319.64 ± 58.56This study
TYC107.31 ± 26.06188.77 ± 18.1958.69 ± 11.0287.93 ± 18.61378.97 ± 33.066.21 ± 1.764.17 ± 1.51343.88 ± 28.79This study
Start-up stageECV157.04 ± 40.73215.31 ± 82.9950.61 ± 6.3493.66 ± 23.12466.82 ± 121.924.58 ± 1.256.89 ± 1.48435.19 ± 98.36This study
TYC181.11 ± 12.22213.47 ± 44.9171.78 ± 19.47124.31 ± 22.52438.74 ± 61.535.57 ± 1.519.34 ± 4.11415.22 ± 108.13This study
Peak stageECV223.01 ± 7.54248.67 ± 2.3468.53 ± 16.32219.14 ± 71.71789.96 ± 76.557.52 ± 0.625.98 ± 2.84813.91 ± 57.08This study
TYC231.52 ± 13.51272.95 ± 14.46216.59 ± 25.78357.98 ± 12.77884.71 ± 21.8212.15 ± 1.2111.10 ± 1.17896.68 ± 73.08This study
Weakening stageECV132.70 ± 58.11170.61 ± 17.7360.52 ± 16.08259.19 ± 48.56715.47 ± 45.815.34 ± 0.385.94 ± 2.13707.60 ± 2.96This study
TYC206.48 ± 25.82213.64 ± 13.8576.25 ± 11.86137.88 ± 8.28480.39 ± 61.806.46 ± 3.242.93 ± 0.73495.73 ± 129.86This study
All stagesECV156.15 ± 51.26203.41 ± 65.2845.85 ± 17.38143.21 ± 72.88517.27 ± 182.654.49 ± 1.925.33 ± 2.65511.37 ± 182.18This study
TYC175.28 ± 37.02218.47 ± 40.1396.22 ± 45.82160.72 ± 73.97512.62 ± 151.227.07 ± 2.737.60 ± 4.01497.72 ± 181.17This study
Taiyuan city90.4313.328.338.3//3.4489.1[51]
Taiyuan city185.05 ± 45.99/91.45 ± 15.87142.77 ± 9.87//11.58 ± 8.91472.17 ± 156.46[52]
Beijing city (Winter)307040200310100150[45]
Shanghai cityIndustrial district491343943775/6263[38]
(Winter)Commercial district762613235/164[38]
Taichung city33.5 ± 4819.1 ± 20.511.8 ± 29.911.5 ± 19.9177.8 ± 103.00/4.3 ± 8.5283.1 ± 252.9[53]
Jinan city1060 ± 301030 ± 20350 ± 20040 ± 40 160 ± 80[54]
Hangzhou city13726776651//288[55]
Hong Kong11045200///[56]
Nanjing city (Gulou, September)22.5 ± 7.848.3 ± 6.46.7 ± 3.765.7 ± 32.1230.2 ± 69.34.3 ± 2.31.3 ± 0.181.5 ± 12.0[42]
Guangzhou city (Urban center)51 ± 1139 ± 833 ± 7109 ± 23680 ± 14681 ± 1714 ± 3373 ± 80[46]
Foshan city (Winter)/200.6 ± 129.4/283.8 ± 174.72214 ± 143876.6 ± 49.142.6 ± 45.2675.7 ± 378.5[47]
Table 2. Principal component analysis (PCA) results of heavy metals in PM2.5 at ECV and TYC.
SpeciesECVTYC
PC1PC2PC1PC2PC3
Cr0.7940.357 0.827
Mn 0.893 0.815
Ni0.7110.5250.871 0.265
Cu0.8570.3010.329 0.794
Zn0.888 0.369 0.721
As0.6790.6060.6070.521
Cd 0.9530.8190.258
Pb0.917 0.905
Variance (%)68.3819.7560.6617.3213.41
Only factor loading values >0.2 are shown; Extraction Method: Principal Component Analysis; Rotation Method: Varimax with Kaiser Normalization.

